The Role of the Interactions at the Tungsten Disulphide Surface in the Stability and Enhanced Thermal Properties of Nanofluids with Application in Solar Thermal Energy

 , ,
, ,
Abstract
:
1. Introduction
2. Materials and Methods
2.1. Nanofluids Preparation
2.2. Characterization of Nanofluids
2.3. Computational Details
3. Results and Discussions
4. Conclusions
Author Contributions
Funding
Acknowledgments
Conflicts of Interest
Abbreviations
| Nomenclature | ||
| CP | Isobaric specific heat (J·(kg−1·K−1)) | |
| D | Thermal diffusivity (m2·s−1) | |
| Di | Inner diameter of the pipe (m) | |
| Eint | Interaction energy (eV) | |
| EPEG | Energy of PEG molecule (eV) | |
| EWS2 | Energy of the bare surface of WS2 (eV) | |
| EWS2+PEG | Energy interaction of the PEG with the (001) WS2 monolayer (eV) | |
| h | Heat transfer coefficient (W·(m−2·K−1)) | |
| k | Thermal conductivity (W·(m−1·K−1)) | |
| Nu | Nusselt number | |
| Pr | Prandtl number | |
| Re | Reynold number | |
| TCE | Thermal conductivity enhancement (%) | |
| Vav | Mean flow rate (m·s−1) | |
| μ | Dynamic viscosity (Pa s) | |
| ρ | Density (kg·m−3) | |
| λ | Wavelength (m) | |
| Subscripts | ||
| bf | Base fluid | |
| nf | Nanofluid | |
| Abbreviations | ||
| CSP | Concentrating solar power | |
| DFT | Density functional theory | |
| DLS | Dynamic light scattering | |
| ELF | Electron localization function | |
| HTF | Heat transfer fluid | |
| LFA | Laser flash analysis | |
| LPE | Liquid phase exfoliation | |
| PEG | Polyethylene glycol | |
| TEM | Transmission electron microscopy | |
| TMDC | Transition metal dichalcogenide | |
| TMDSC | Temperature modulated differential scanning calorimeter | |
| VASP | Vienna Ab Initio Simulation Package | |
References
- Hook, M.; Tang, X. Depletion of fossil fuels and anthropogenic climate change—A review. Energy Policy 2013, 52, 797–809. [Google Scholar] [CrossRef] [Green Version]
- Abas, N.; Kalair, A.; Khan, N. Review of fossil fuels and future energy technologies. Futures 2015, 69, 31–49. [Google Scholar] [CrossRef]
- Baharoon, D.A.; Rahman, H.A.; Omar, W.Z.W.; Fadhl, S.O. Historical development of concentrating solar power technologies to generate clean electricity efficiently—A review. Renew. Sustain. Energy Rev. 2015, 41, 996–1027. [Google Scholar] [CrossRef]
- Trieb, F.; Schillings, C.; O’Sullivan, M.; Pregger, T.; Hoyer-Klick, C. Global potential of concentrating solar power. In Proceedings of the SolarPaces Conference, Berlin, Germany, 15–18 September 2009; pp. 1–11. [Google Scholar]
- Arasu, A.V.; Sornakumar, T. Design, manufacture and testing of fiberglass reinforced parabola trough for parabolic trough solar collectors. Sol. Energy 2007, 81, 1273–1279. [Google Scholar] [CrossRef]
- Barlev, D.; Vidu, R.; Stroeve, P. Innovation in concentrated solar power. Sol. Energy Mater. Sol. Cells 2011, 95, 2703–2725. [Google Scholar] [CrossRef]
- Imenes, A.G.; Buie, D.; Mills, D.R.; Schramek, P.; Bosi, S.G. A new strategy for improved spectral performance in solar power plants. Sol. Energy 2006, 80, 1263–1269. [Google Scholar] [CrossRef]
- Liu, M.; Tay, N.H.S.; Bell, S.; Belusko, M.; Jacob, R.; Will, G.; Saman, W.; Bruno, F. Review on concentrating solar power plants and new developments in high temperature thermal energy storage technologies. Renew. Sustain. Energy Rev. 2016, 53, 1411–1432. [Google Scholar] [CrossRef]
- Price, H.; Lupfert, E.; Kearney, D.; Zarza, E.; Cohen, G.; Gee, R.; Mahoney, R. Advances in parabolic trough solar power technology. J. Sol. Energy Eng. 2002, 124, 109–125. [Google Scholar] [CrossRef]
- Aguilar, T.; Navas, J.; Sanchez-Coronilla, A.; Martin, E.I.; Gallardo, J.J.; Martinez-Merino, P.; Gomez-Villarejo, R.; Pinero, J.C.; Alcantara, R.; Fernandez-Lorenzo, C. Investigation of enhanced thermal properties in NiO-based nanofluids for concentrating solar power applications: A molecular dynamics and experimental analysis. Appl. Energy 2018, 211, 677–688. [Google Scholar] [CrossRef]
- Kasaeian, A.; Eshghi, A.T.; Sameti, M. A review on the applications of nanofluids in solar energy systems. Renew. Sustain. Energy Rev. 2015, 43, 584–598. [Google Scholar] [CrossRef]
- Choi, S.U.S.; Eastman, J.A. Enhancing thermal conductivity of fluids with nanoparticles. In ASME International Mechanical Engineering Congress & Exposition; ASME: San Francisco, CA, USA, 1995. [Google Scholar]
- Abbas, M.A.; Bai, Y.Q.; Rashidi, M.M.; Bhatti, M.M. Application of drug delivery in magnetohydrodynamics peristaltic blood flow of nanofluid in a non-uniform channel. J. Mech. Med. Biol. 2016, 16, 1650052. [Google Scholar] [CrossRef]
- Buongiorno, J.; Hu, L.W.; Kim, S.J.; Hannink, R.; Truong, B.; Forrest, E. Nanofluids for enhanced economics and safety of nuclear reactors: An evaluation of the potential features, issues, and research gaps. Nucl. Technol. 2008, 162, 80–91. [Google Scholar] [CrossRef]
- Choi, S.U.S. Nanofluids: A new field of scientific research and innovative applications. Heat Transf. Eng. 2008, 29, 429–431. [Google Scholar] [CrossRef]
- Devendiran, D.K.; Amirtham, V.A. A review on preparation, characterization, properties and applications of nanofluids. Renew. Sustain. Energy Rev. 2016, 60, 21–40. [Google Scholar] [CrossRef]
- Huminic, G.; Huminic, A. Application of nanofluids in heat exchangers: A review. Renew. Sustain. Energy Rev. 2012, 16, 5625–5638. [Google Scholar] [CrossRef]
- Ijam, A.; Saidur, R. Nanofluid as a coolant for electronic devices (cooling of electronic devices). Appl. Therm. Eng. 2012, 32, 76–82. [Google Scholar] [CrossRef]
- Tsai, C.Y.; Chien, H.T.; Ding, P.P.; Chan, B.; Luh, T.Y.; Chen, P.H. Effect of structural character of gold nanoparticles in nanofluid on heat pipe thermal performance. Mater. Lett. 2004, 58, 1461–1465. [Google Scholar] [CrossRef]
- Zhang, L.L.; Jiang, Y.H.; Ding, Y.L.; Povey, M.; York, D. Investigation into the antibacterial behaviour of suspensions of ZnO nanoparticles (ZnO nanofluids). J. Nanopart. Res. 2007, 9, 479–489. [Google Scholar] [CrossRef]
- Kameya, Y.; Hanamura, K. Enhancement of solar radiation absorption using nanoparticle suspension. Sol. Energy 2011, 85, 299–307. [Google Scholar] [CrossRef]
- Otanicar, T.P.; Phelan, P.E.; Prasher, R.S.; Rosengarten, G.; Taylor, R.A. Nanofluid-based direct absorption solar collector. J. Renew. Sustain. Energy 2010, 2, 033102. [Google Scholar] [CrossRef] [Green Version]
- Sokhansefat, T.; Kasaeian, A.B.; Kowsary, F. Heat transfer enhancement in parabolic trough collector tube using Al2O3/synthetic oil nanofluid. Renew. Sustain. Energy Rev. 2014, 33, 636–644. [Google Scholar] [CrossRef]
- Heris, S.Z.; Etemad, S.G.; Esfahany, A.N. Experimental investigation of oxide nanofluids laminar flow convective heat transfer. Int. Commun. Heat Mass Transf. 2006, 33, 529–535. [Google Scholar] [CrossRef]
- Rehan, M.A.; Ali, M.; Sheikh, N.A.; Khalil, M.S.; Chaudhary, G.Q.; Rashid, T.U.; Shehryar, M. Experimental performance analysis of low concentration ratio solar parabolic trough collectors with nanofluids in winter conditions. Renew. Energy 2018, 118, 742–751. [Google Scholar] [CrossRef]
- Mwesigye, A.; Meyer, J.P. Optimal thermal and thermodynamic performance of a solar parabolic trough receiver with different nanofluids and at different concentration ratios. Appl. Energy 2017, 193, 393–413. [Google Scholar] [CrossRef] [Green Version]
- Kasaeian, A.; Daneshazarian, R.; Rezaei, R.; Pourfayaz, F.; Kasaeian, G. Experimental investigation on the thermal behavior of nanofluid direct absorption in a trough collector. J. Clean. Prod. 2017, 158, 276–284. [Google Scholar] [CrossRef]
- Menbari, A.; Alemrajabi, A.A.; Rezaei, A. Heat transfer analysis and the effect of CuO/Water nanofluid on direct absorption concentrating solar collector. Appl. Therm. Eng. 2016, 104, 176–183. [Google Scholar] [CrossRef]
- Navas, J.; Martinez-Merino, P.; Sanchez-Coronilla, A.; Gallardo, J.J.; Alcantara, R.; Martin, E.I.; Pinero, J.C.; Leon, J.R.; Aguilar, T.; Toledo, J.H.; et al. MoS2 nanosheets vs. nanowires: Preparation and a theoretical study of highly stable and efficient nanofluids for concentrating solar power. J. Mater. Chem. A 2018, 6, 14919–14929. [Google Scholar] [CrossRef]
- Song, H.L.; Yu, X.F.; Chen, M.; Qiao, M.; Wang, T.J.; Zhang, J.; Liu, Y.; Liu, P.; Wang, X.L. Modification of WS2 nanosheets with controllable layers via oxygen ion irradiation. Appl. Surf. Sci. 2018, 439, 240–245. [Google Scholar] [CrossRef]
- Buonomo, B.; Colla, L.; Fedele, L.; Manca, O.; Marinelli, L. A comparison of nanofluid thermal conductivity measurements by flash and hot disk techniques. J. Phys. Conf. Ser. 2014, 547, 012046. [Google Scholar] [CrossRef]
- Awad, A.; Navarro, H.; Ding, Y.L.; Wen, D.S. Thermal-physical properties of nanoparticle-seeded nitrate molten salts. Renew. Energy 2018, 120, 275–288. [Google Scholar] [CrossRef] [Green Version]
- Shaikh, S.; Lafdi, K.; Ponnappan, R. Thermal conductivity improvement in carbon nanoparticle doped PAO oil: An experimental study. J. Appl. Phys. 2007, 101, 064302. [Google Scholar] [CrossRef] [Green Version]
- Kresse, G.; Furthmuller, J. Efficiency of ab-initio total energy calculations for metals and semiconductors using a plane-wave basis set. Comput. Mater. Sci. 1996, 6, 15–50. [Google Scholar] [CrossRef]
- Kresse, G.; Furthmuller, J. Efficient iterative schemes for ab initio total-energy calculations using a plane-wave basis set. Phys. Rev. B 1996, 54, 11169–11186. [Google Scholar] [CrossRef]
- Kresse, G.; Hafner, J. Ab initio molecular-dynamics for liquid-metals. Phys. Rev. B 1993, 47, 558–561. [Google Scholar] [CrossRef] [PubMed]
- Kresse, G.; Hafner, J. Ab-initio molecular-dynamics simulation of the liquid-metal amorphous-semiconductor transition in germanium. Phys. Rev. B 1994, 49, 14251–14269. [Google Scholar] [CrossRef] [PubMed]
- Blochl, P.E. Projector augmented-wave method. Phys. Rev. B 1994, 50, 17953–17979. [Google Scholar] [CrossRef] [PubMed] [Green Version]
- Kresse, G.; Joubert, D. From ultrasoft pseudopotentials to the projector augmented-wave method. Phys. Rev. B 1999, 59, 1758–1775. [Google Scholar] [CrossRef]
- Schutte, W.J.; Deboer, J.L.; Jellinek, F. Crystal-structures of tungsten disulfide and diselenide. J. Solid State Chem. 1987, 70, 207–209. [Google Scholar] [CrossRef]
- Terriberry, T.B.; Cox, D.F.; Bowman, D.A. A tool for the interactive 3D visualization of electronic structure in molecules and solids. Comput. Chem. 2002, 26, 313–319. [Google Scholar] [CrossRef]
- ChemCraft. Available online: www.chemcraftprog.com (accessed on 28 April 2019).
- Becke, A.D.; Edgecombe, K.E. A simple measure of electron localization in atomic and molecular-systems. J. Chem. Phys. 1990, 92, 5397–5403. [Google Scholar] [CrossRef]
- Savin, A.; Becke, A.D.; Flad, J.; Nesper, R.; Preuss, H.; Vonschnering, H.G. A new look at electron localization. Angew. Chem. Int. Ed. 1991, 30, 409–412. [Google Scholar] [CrossRef]
- Savin, A.; Jepsen, O.; Flad, J.; Andersen, O.K.; Preuss, H.; Vonschnering, H.G. Electron localization in solid-state structures of the elements—The diamond structure. Angew. Chem. Int. Ed. 1992, 31, 187–188. [Google Scholar] [CrossRef]
- Silvi, B.; Gatti, C. Direct space representation of the metallic bond. J. Phys. Chem. A 2000, 104, 947–953. [Google Scholar] [CrossRef]
- Silvi, B.; Savin, A. Classification of chemical-bonds based on topological analysis of electron localization functions. Nature 1994, 371, 683–686. [Google Scholar] [CrossRef]
- Choudhary, R.; Khurana, D.; Kumar, A.; Subudhi, S. Stability analysis of Al2O3/water nanofluids. J. Exp. Nanosci. 2017, 12, 140–151. [Google Scholar] [CrossRef] [Green Version]
- Gupta, M.; Singh, V.; Kumar, R.; Said, Z. A review on thermophysical properties of nanofluids and heat transfer applications. Renew. Sustain. Energy Rev. 2017, 74, 638–670. [Google Scholar] [CrossRef]
- Suganthi, K.S.; Rajan, K.S. Temperature induced changes in ZnO-water nanofluid: Zeta potential, size distribution and viscosity profiles. Int. J. Heat Mass Transf. 2012, 55, 7969–7980. [Google Scholar] [CrossRef]
- Chandrasekar, M.; Suresh, S.; Senthilkumar, T. Mechanisms proposed through experimental investigations on thermophysical properties and forced convective heat transfer characteristics of various nanofluids—A review. Renew. Sustain. Energy Rev. 2012, 16, 3917–3938. [Google Scholar] [CrossRef]
- Buschmann, M.H.; Azizian, R.; Kempe, T.; Julia, J.E.; Martinez-Cuenca, R.; Sunden, B.; Wu, Z.; Seppala, A.; Ala-Nissila, T. Correct interpretation of nanofluid convective heat transfer. Int. J. Therm. Sci. 2018, 129, 504–531. [Google Scholar] [CrossRef]
- Wen, D.S.; Lin, G.P.; Vafaei, S.; Zhang, K. Review of nanofluids for heat transfer applications. Particuology 2009, 7, 141–150. [Google Scholar] [CrossRef]
- Mousavi, N.S.S.; Kumar, S. Effective heat capacity of ferrofluids—Analytical approach. Int. J. Therm. Sci. 2014, 84, 267–274. [Google Scholar] [CrossRef]
- Vajjha, R.S.; Das, D.K. Specific Heat Measurement of Three Nanofluids and Development of New Correlations. J. Heat Transf. ASME 2009, 131, 071601. [Google Scholar] [CrossRef]
- Zhou, S.Q.; Ni, R. Measurement of the specific heat capacity of water-based Al2O3 nanofluid. Appl. Phys. Lett. 2008, 92, 093123. [Google Scholar] [CrossRef]
- De Castro, C.A.N.; Murshed, S.M.S.; Lourenco, M.J.V.; Santos, F.J.V.; Lopes, M.L.M.; Franca, J.M.P. Enhanced thermal conductivity and specific heat capacity of carbon nanotubes ionanofluids. Int. J. Therm. Sci. 2012, 62, 34–39. [Google Scholar] [CrossRef]
- Shin, D.; Banerjee, D. Enhancement of specific heat capacity of high-temperature silica-nanofluids synthesized in alkali chloride salt eutectics for solar thermal-energy storage applications. Int. J. Heat Mass Transf. 2011, 54, 1064–1070. [Google Scholar] [CrossRef]
- Li, L.; Zhang, Y.W.; Ma, H.B.; Yang, M. Molecular dynamics simulation of effect of liquid layering around the nanoparticle on the enhanced thermal conductivity of nanofluids. J. Nanopart. Res. 2010, 12, 811–821. [Google Scholar] [CrossRef]
- Oh, S.H.; Kauffmann, Y.; Scheu, C.; Kaplan, W.D.; Ruhle, M. Ordered liquid aluminum at the interface with sapphire. Science 2005, 310, 661–663. [Google Scholar] [CrossRef] [Green Version]
- Prasher, R.; Bhattacharya, P.; Phelan, P.E. Brownian-motion-based convective-conductive model for the effective thermal conductivity of nanofluids. J. Heat Transf. ASME 2006, 128, 588–595. [Google Scholar] [CrossRef]
- Xue, L.; Keblinski, P.; Phillpot, S.R.; Choi, S.U.S.; Eastman, J.A. Effect of liquid layering at the liquid-solid interface on thermal transport. Int. J. Heat Mass Transf. 2004, 47, 4277–4284. [Google Scholar] [CrossRef]
- Gomez-Villarejo, R.; Navas, J.; Martin, E.I.; Sanchez-Coronilla, A.; Aguilar, T.; Gallardo, J.J.; De los Santos, D.; Alcántara, R.; Fernández-Lorenzo, C.; Martín-CAlleja, J. Preparation of Au nanoparticles in a non-polar medium: Obtaining high-efficiency nanofluids for concentrating solar power. An experimental and theoretical perspective. J. Mater. Chem. A 2017, 5, 12483–12497. [Google Scholar] [CrossRef]
- Hentschke, R. On the specific heat capacity enhancement in nanofluids. Nanoscale Res. Lett. 2016, 11, 88. [Google Scholar] [CrossRef] [PubMed] [Green Version]
- Teruel, M.; Aguilar, T.; Martinez-Merino, P.; Carrillo-Berdugo, I.; Gallardo-Bernal, J.J.; Gomez-Villarejo, R.; Alcantara, R.; Fernandez-Lorenzo, C.; Navas, J. 2D MoSe2-based nanofluids prepared by liquid phase exfoliation for heat transfer applications in concentrating solar power. Sol. Energy Mater. Sol. C 2019, 200, 109972. [Google Scholar] [CrossRef]
- Hemmat Esfe, M.; Alirezaie, A.; Rejvani, M. An applicable study on the thermal conductivity of SWCNT-MgO hybrid nanofluid and price-performance analysis for energy management. Appl. Therm. Eng. 2017, 111, 1202–1210. [Google Scholar] [CrossRef]
- Hemmat Esfe, M.; Arani, A.A.A.; Firouzi, M. Empirical study and model development of thermal conductivity improvement and assessment of cost and sensitivity of EG-water based SWCNT-ZnO (30%:70%) hybrid nanofluid. J. Mol. Liq. 2017, 244, 252–261. [Google Scholar] [CrossRef]
- Liu, W.I.; Malekahmadi, O.; Bagherzadeh, S.A.; Ghashang, M.; Karimipour, A.; Hasani, S.; Tlili, I.; Goodarzi, M. A novel comprehensive experimental study concerned graphene oxide nanoparticles dispersed in water: Synthesise, characterisation, thermal conductivity measurement and present a new approach of RLSF neural network. Int. Commun. Heat Mass Transf. 2019, 109, 104333. [Google Scholar] [CrossRef]
- Martinez-Merino, P.; Midgley, S.D.; Martin, E.I.; Estelle, P.; Alcantara, R.; Sanchez-Coronilla, A.; Grau-Crespo, R.; Navas, J. Novel WS2-based nanofluids for concentrating solar power: Performance characterization and molecular-level insights. ACS Appl. Mater. Interfaces 2020, 12, 5793–5804. [Google Scholar] [CrossRef]
- Buongiorno, J. Convective transport in nanofluids. J. Heat Transf. ASME 2006, 128, 240–250. [Google Scholar] [CrossRef]
- Kakac, S.; Pramuanjaroenkij, A. Review of convective heat transfer enhancement with nanofluids. Int. J. Heat Mass Transf. 2009, 52, 3187–3196. [Google Scholar] [CrossRef]
- Xuan, Y.M.; Li, Q. Investigation on convective heat transfer and flow features of nanofluids. J. Heat Transf. ASME 2003, 125, 151–155. [Google Scholar] [CrossRef] [Green Version]


| Nanofluid | wt. % PEG | Sonication Time/h | Sonication Frequency/kHz |
|---|---|---|---|
| 1 | 0.20 | 8 | 80 |
| 2 | 0.20 | 4 | 80 |
| 3 | 0.75 | 4 | 80 |
| 4 | 0.75 | 4 | 130 |
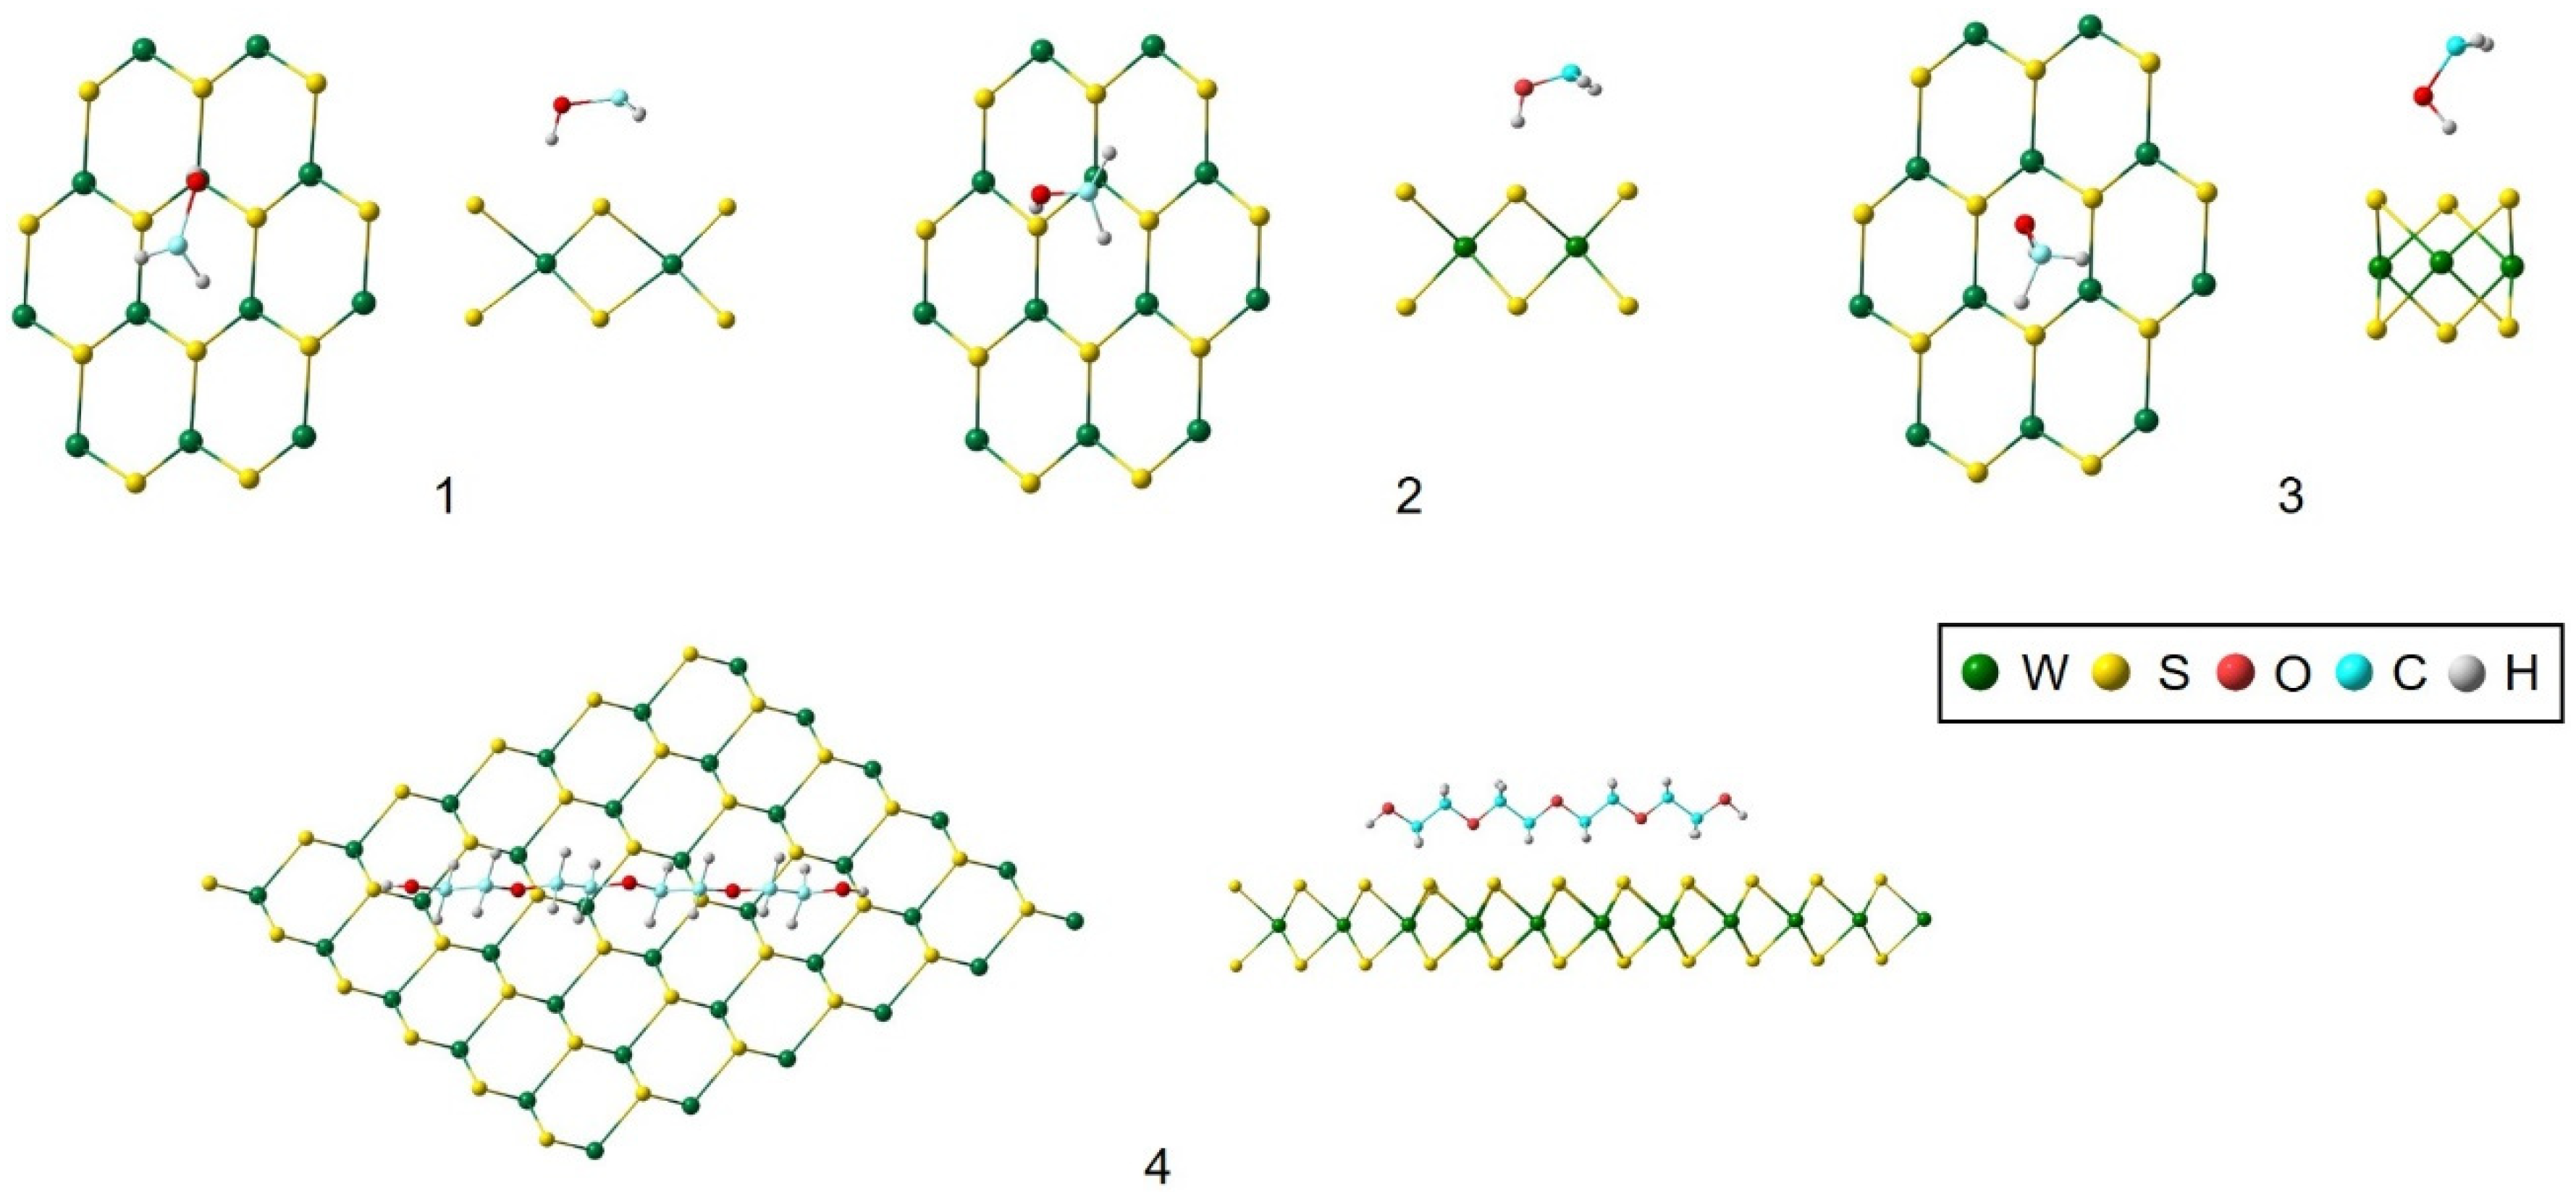
| Position | Figure 2 | Eint/eV |
|---|---|---|
| Over W | 1 | −0.233 |
| Over S | 2 | −0.242 |
| Over the gap | 3 | −0.103 |
| Parallel | 4 | 3.224 |
| Sample | Density/kg·m−3 | φ/vol. % | Viscosity/mPa·s |
|---|---|---|---|
| HTF | 1056.6 ± 0.5 | - | 3.70 ± 0.02 |
| HTF + 0.20 wt. % PEG | 1057.4 ± 0.4 | - | 3.71 ± 0.02 |
| HTF + 0.20 wt. % PEG | 1057.7 ± 0.6 | - | 3.71 ± 0.02 |
| 0.20 wt. % 8 h 80 kHz | 1072.1 ± 1.2 | 0.23 | 3.73 ± 0.02 |
| 0.20 wt. % 4 h 80 kHz | 1069.3 ± 0.7 | 0.18 | 3.77 ± 0.01 |
| 0.75 wt. % 4 h 80 kHz | 1062.8 ± 0.2 | 0.08 | 3.76 ± 0.02 |
| 0.75 wt. % 4 h 130 kHz | 1062.6 ± 0.2 | 0.07 | 3.74 ± 0.02 |
© 2020 by the authors. Licensee MDPI, Basel, Switzerland. This article is an open access article distributed under the terms and conditions of the Creative Commons Attribution (CC BY) license (http://creativecommons.org/licenses/by/4.0/).
Share and Cite
Martínez-Merino, P.; Sánchez-Coronilla, A.; Alcántara, R.; Martín, E.I.; Carrillo-Berdugo, I.; Gómez-Villarejo, R.; Navas, J. The Role of the Interactions at the Tungsten Disulphide Surface in the Stability and Enhanced Thermal Properties of Nanofluids with Application in Solar Thermal Energy. Nanomaterials 2020, 10, 970. https://doi.org/10.3390/nano10050970
Martínez-Merino P, Sánchez-Coronilla A, Alcántara R, Martín EI, Carrillo-Berdugo I, Gómez-Villarejo R, Navas J. The Role of the Interactions at the Tungsten Disulphide Surface in the Stability and Enhanced Thermal Properties of Nanofluids with Application in Solar Thermal Energy. Nanomaterials. 2020; 10(5):970. https://doi.org/10.3390/nano10050970
Chicago/Turabian StyleMartínez-Merino, Paloma, Antonio Sánchez-Coronilla, Rodrigo Alcántara, Elisa I. Martín, Iván Carrillo-Berdugo, Roberto Gómez-Villarejo, and Javier Navas. 2020. "The Role of the Interactions at the Tungsten Disulphide Surface in the Stability and Enhanced Thermal Properties of Nanofluids with Application in Solar Thermal Energy" Nanomaterials 10, no. 5: 970. https://doi.org/10.3390/nano10050970