A Super-Bagging Method for Volleyball Action Recognition Using Wearable Sensors

 , ,
, ,
Abstract
:1. Introduction
- Proposal of a novel ensemble method (i.e., the super-bagging method) and its demonstration for volleyball action modelling,
- Evaluation of the super-bagging method against undersampling (i.e, balanced learning), full sampling (i.e., imbalanced learning) and ensemble (i.e., tree bagger) methods for volleyball action modelling,
- Demonstration of the role of dominant and non-dominant hand for volleyball action modelling using super-bagging method,
- Evaluation of all four IMU sensors separately and in combination for volleyball action modelling using different learning methods (i.e., balanced learning, imbalanced learning and super-bagging methods).
2. Related Work
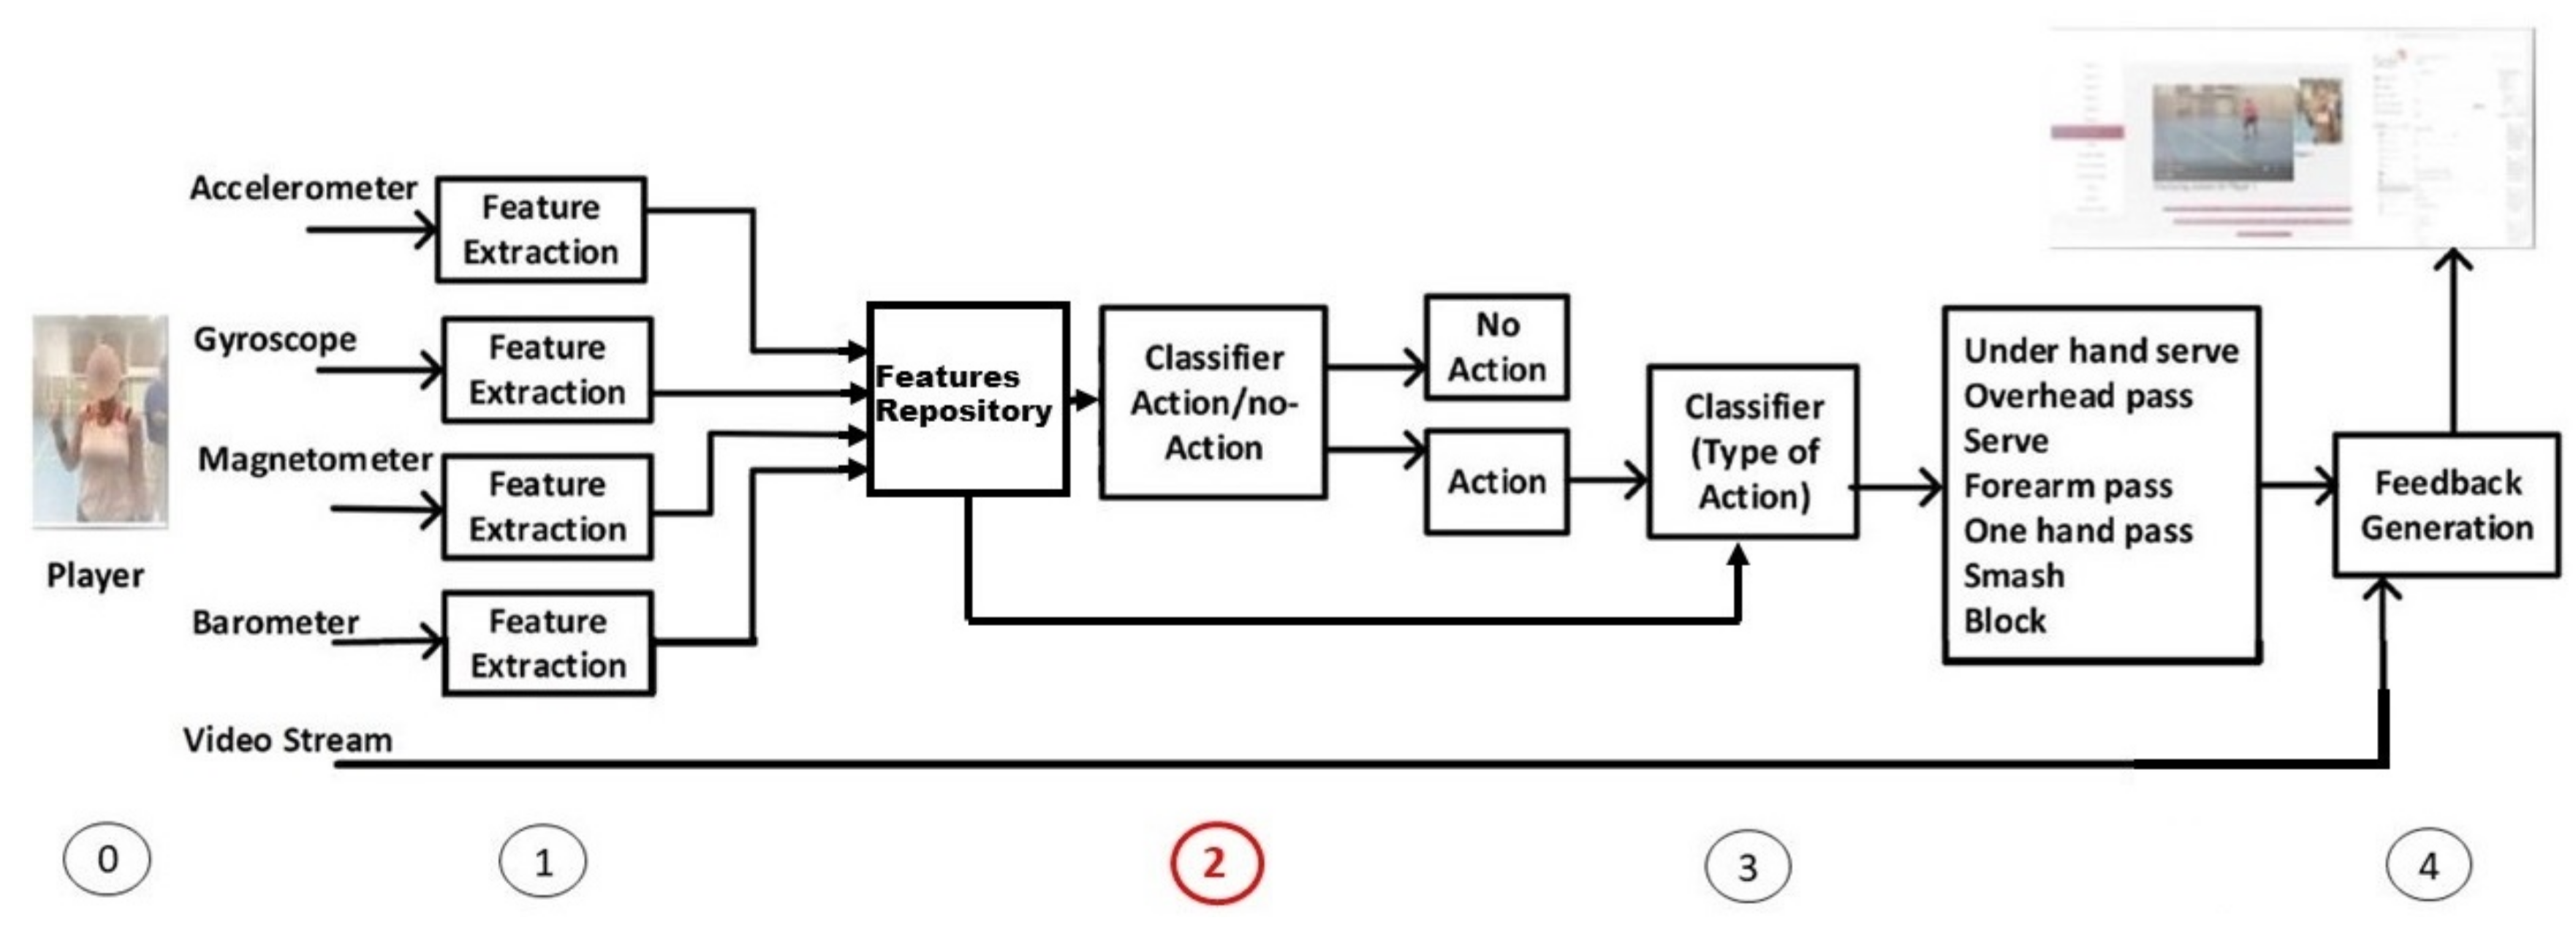
3. Our Approach
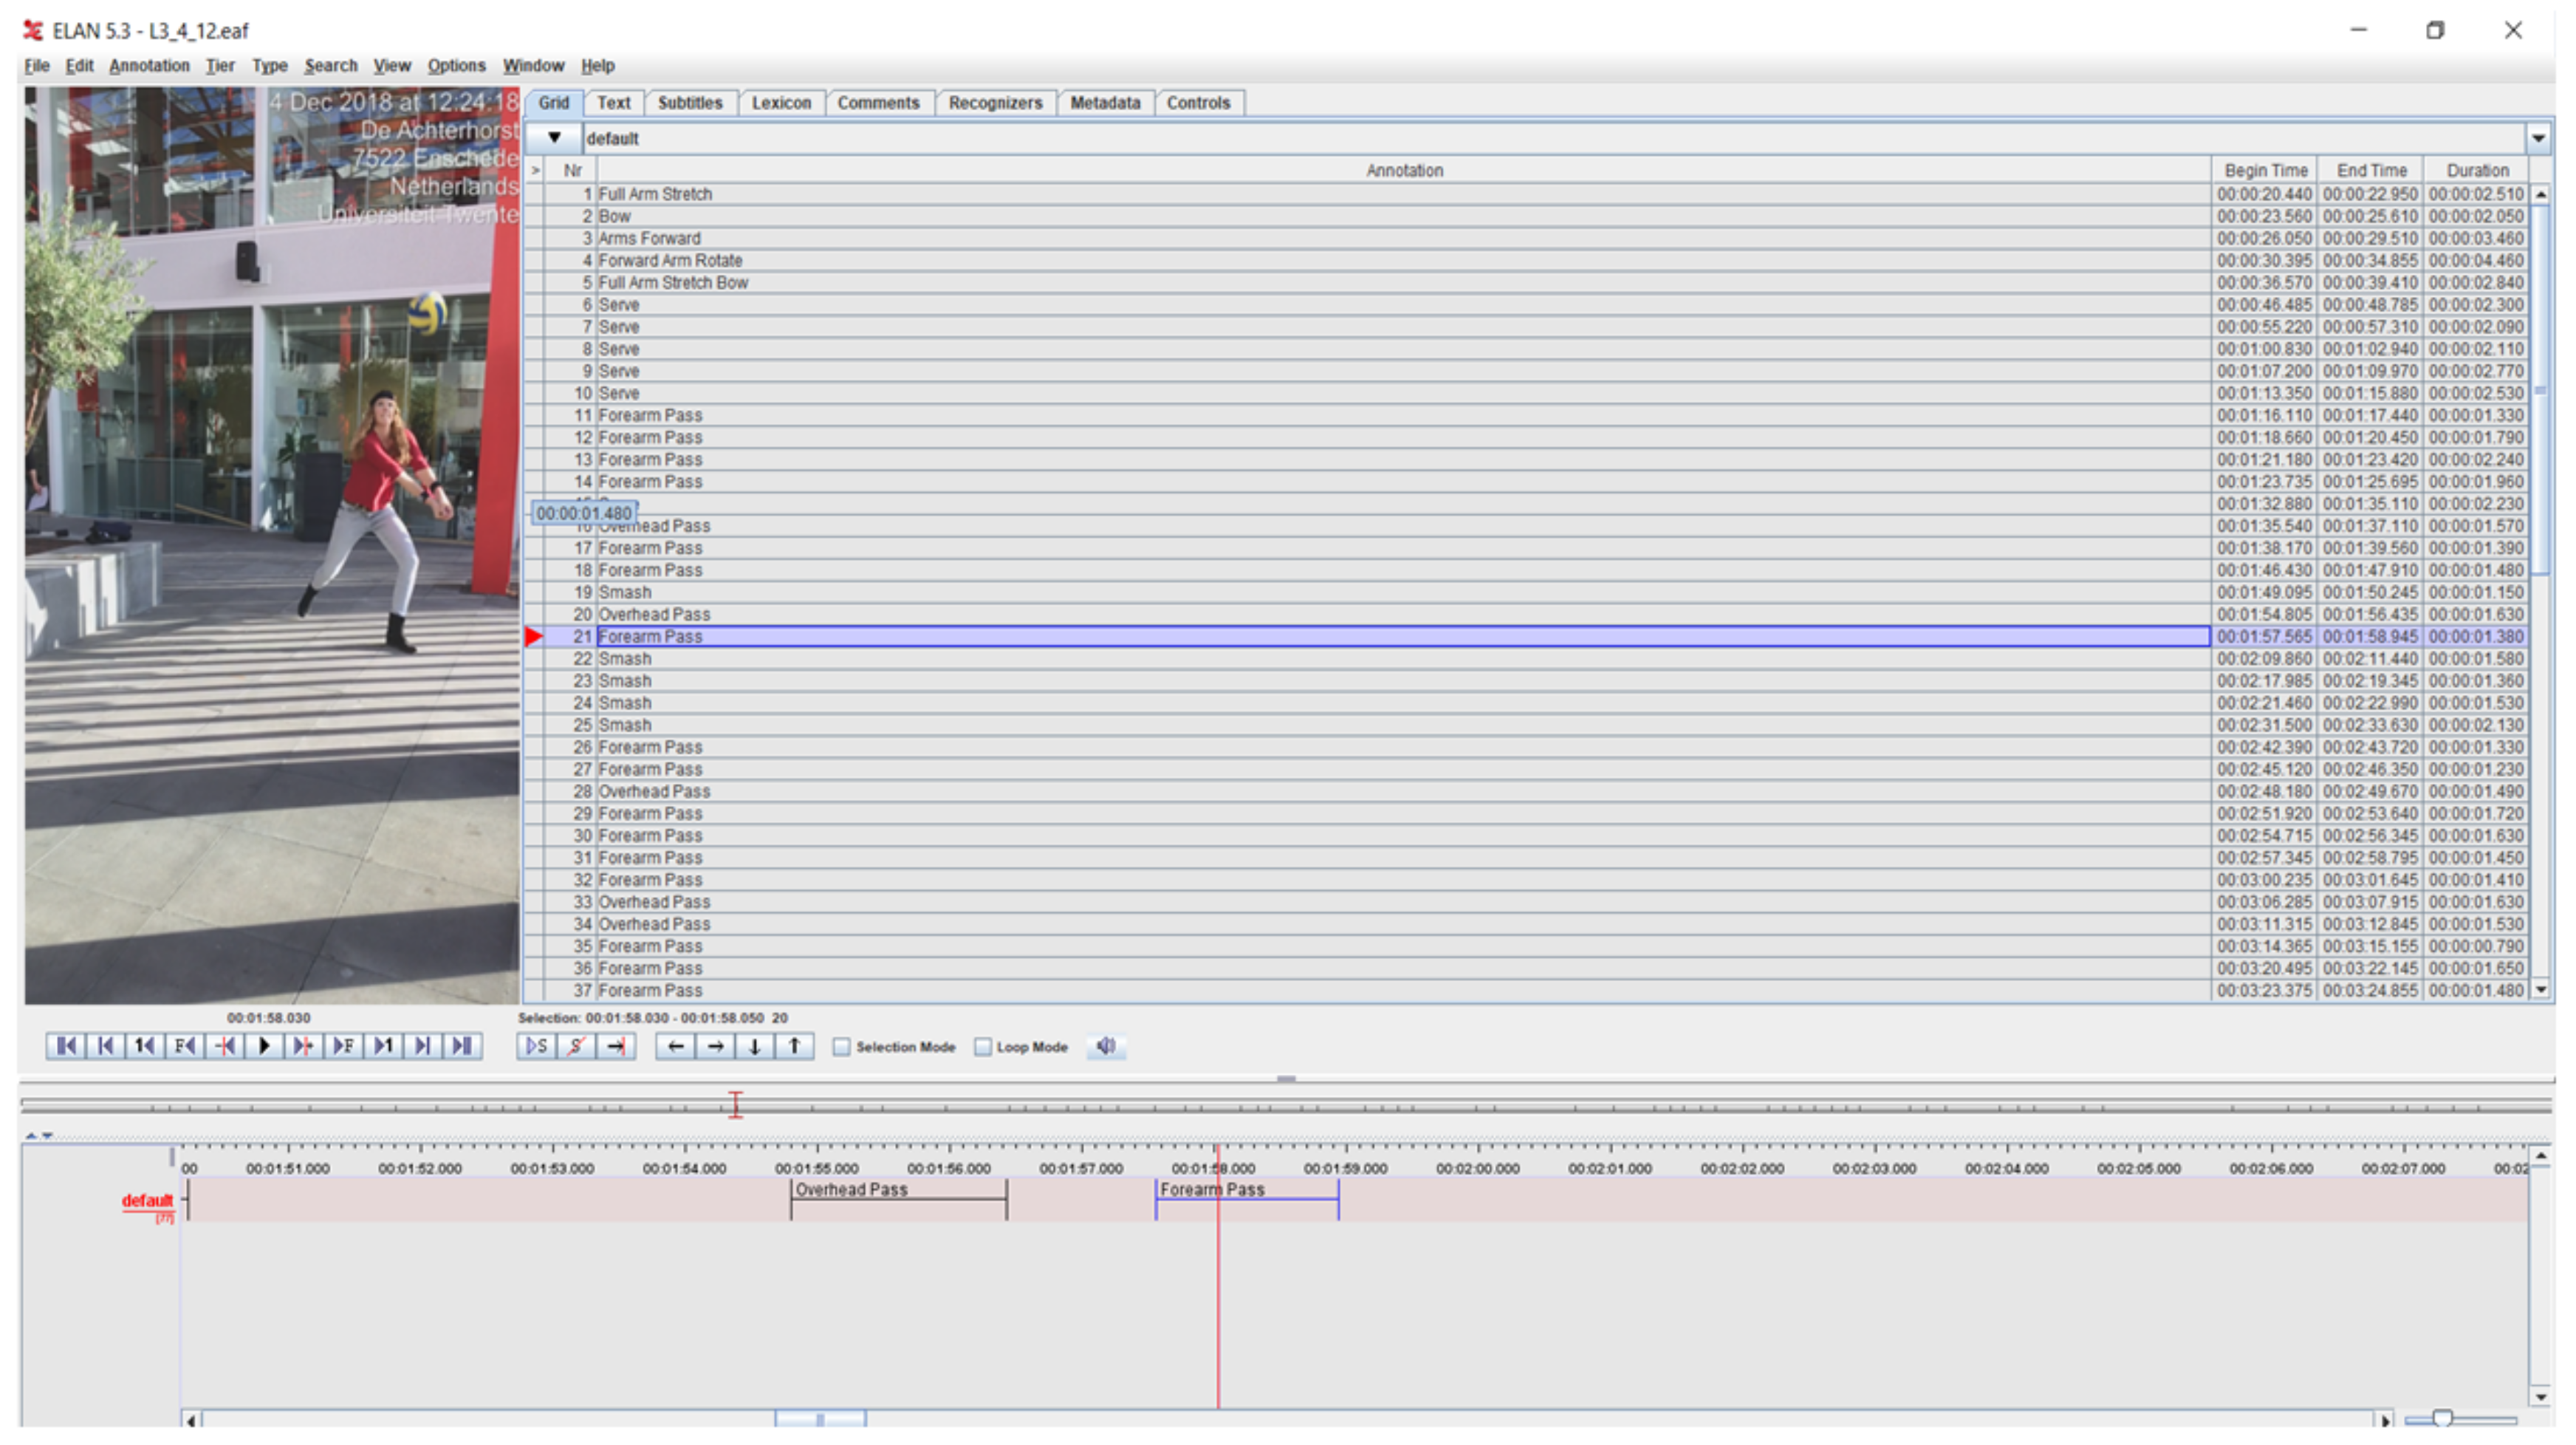
3.1. Data Annotation
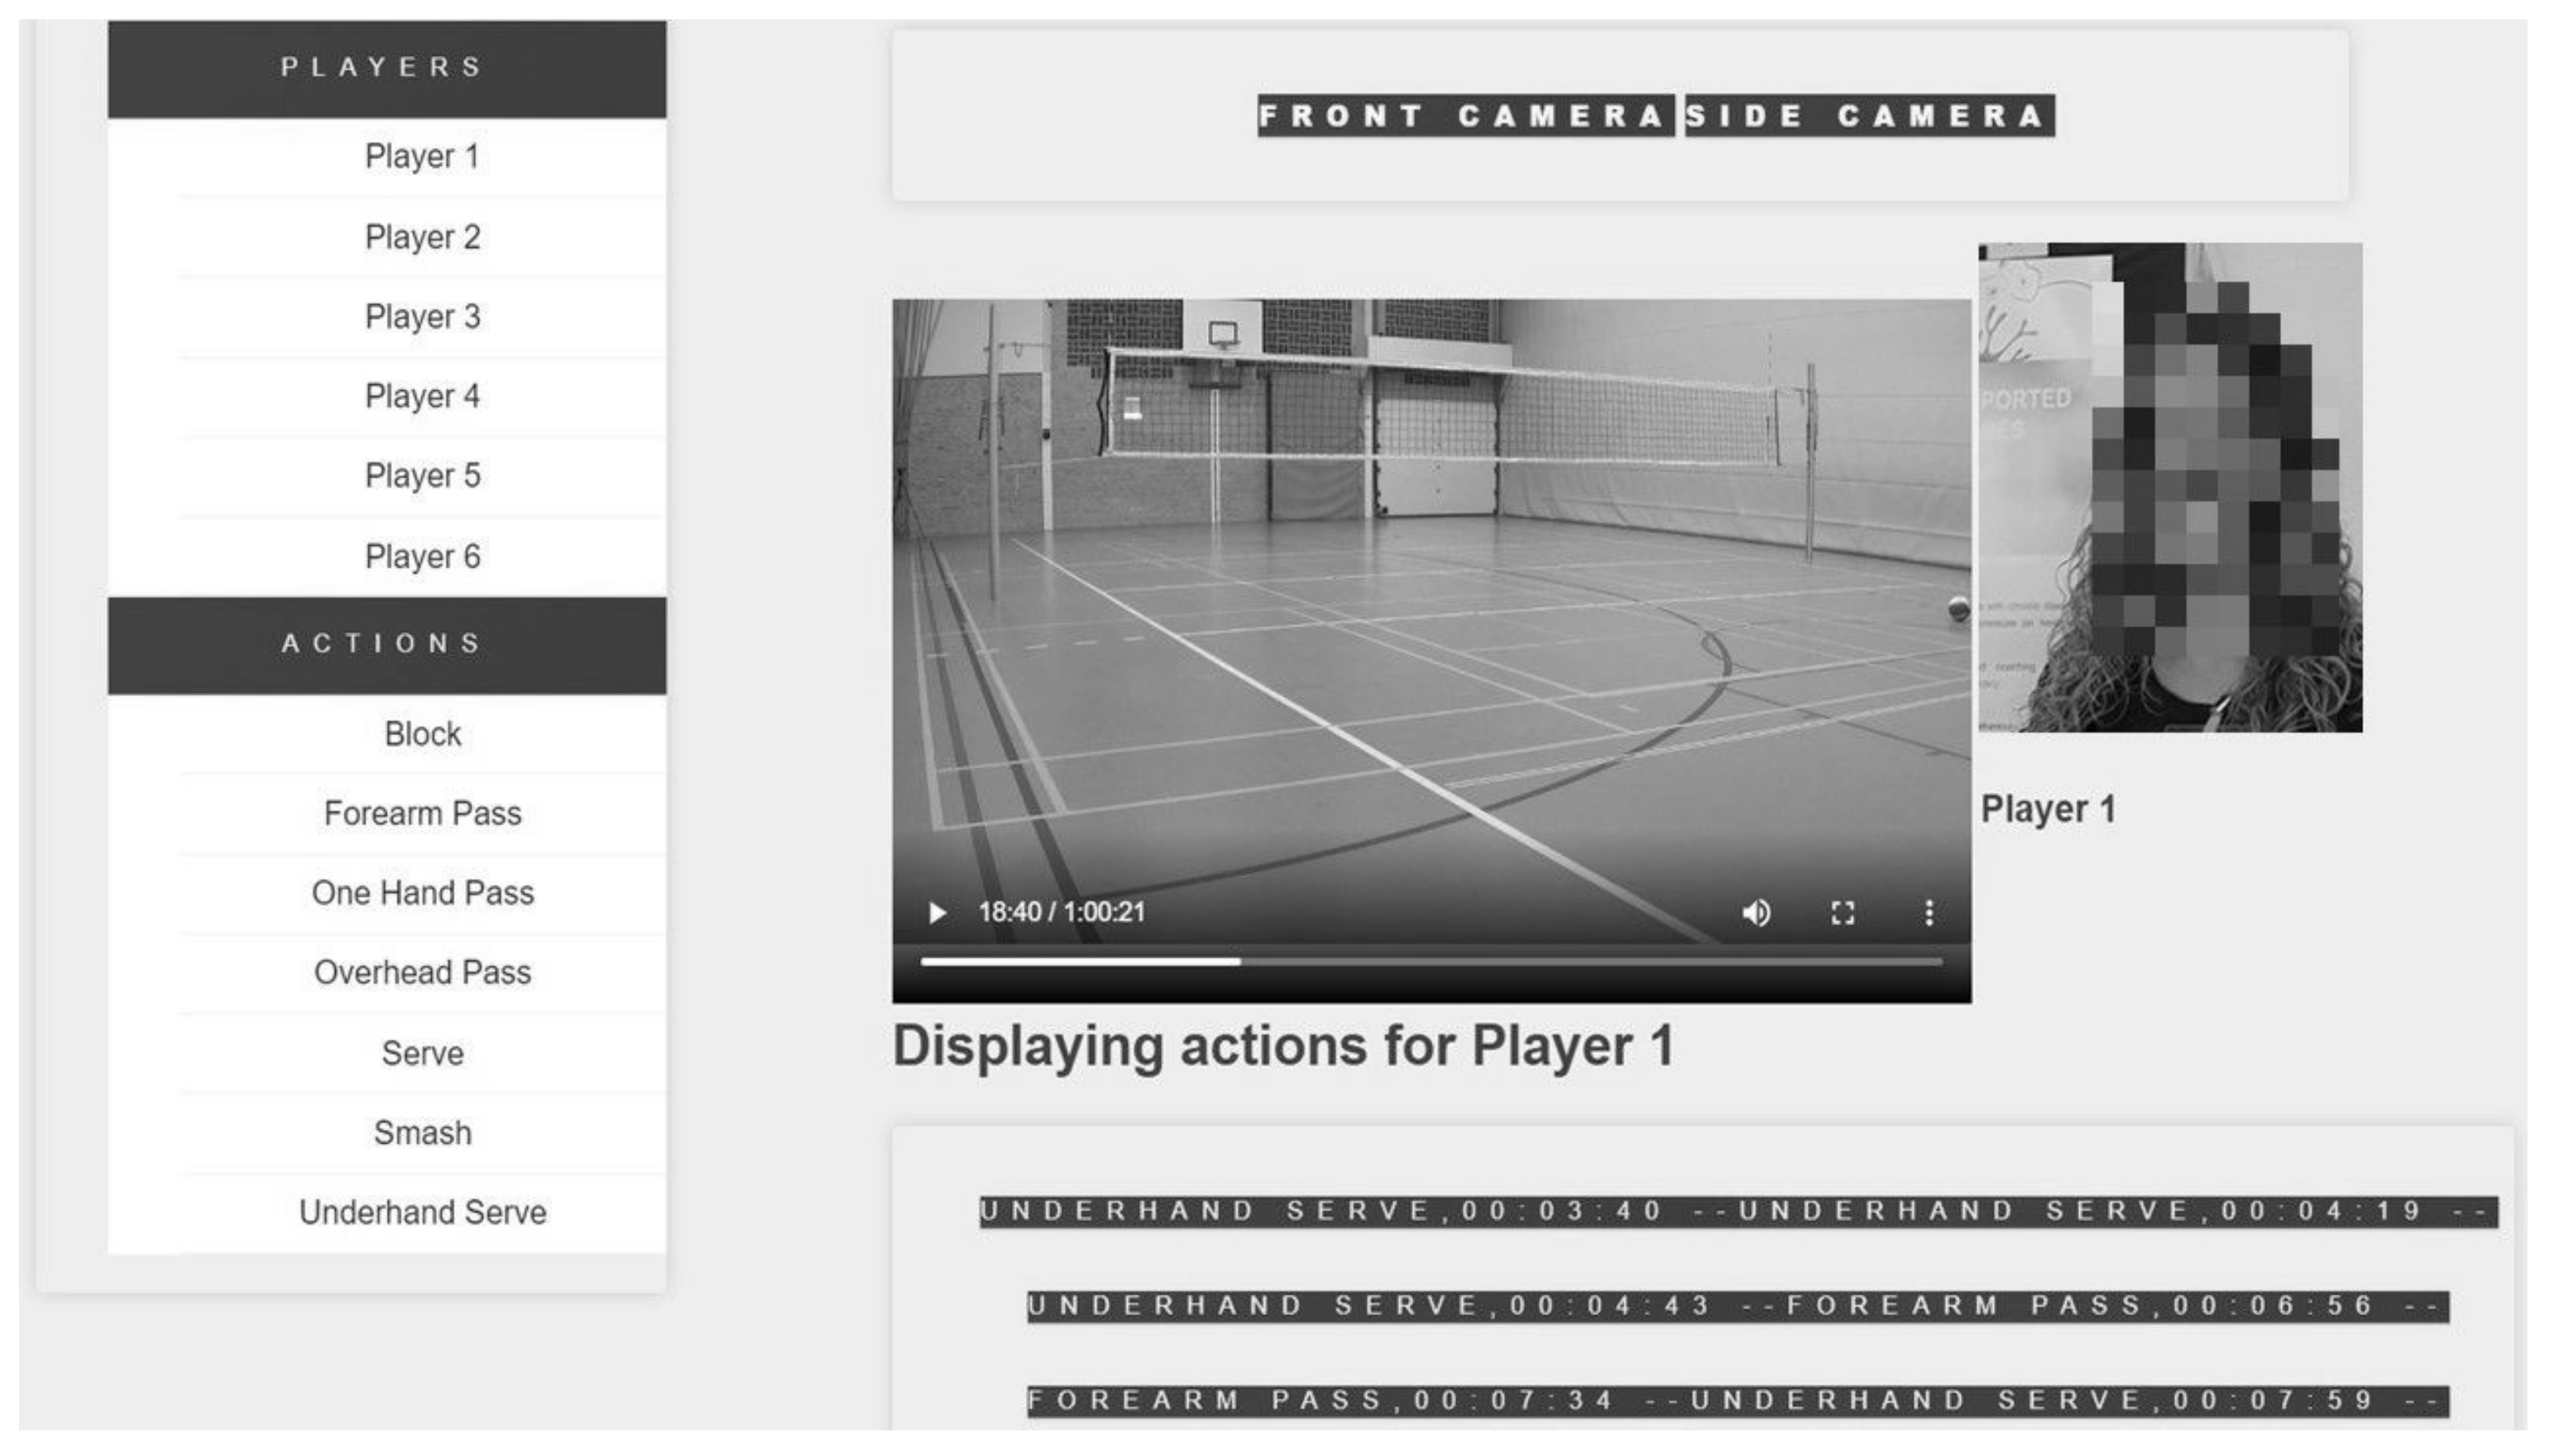
3.2. Auto-Tagging System Prototype
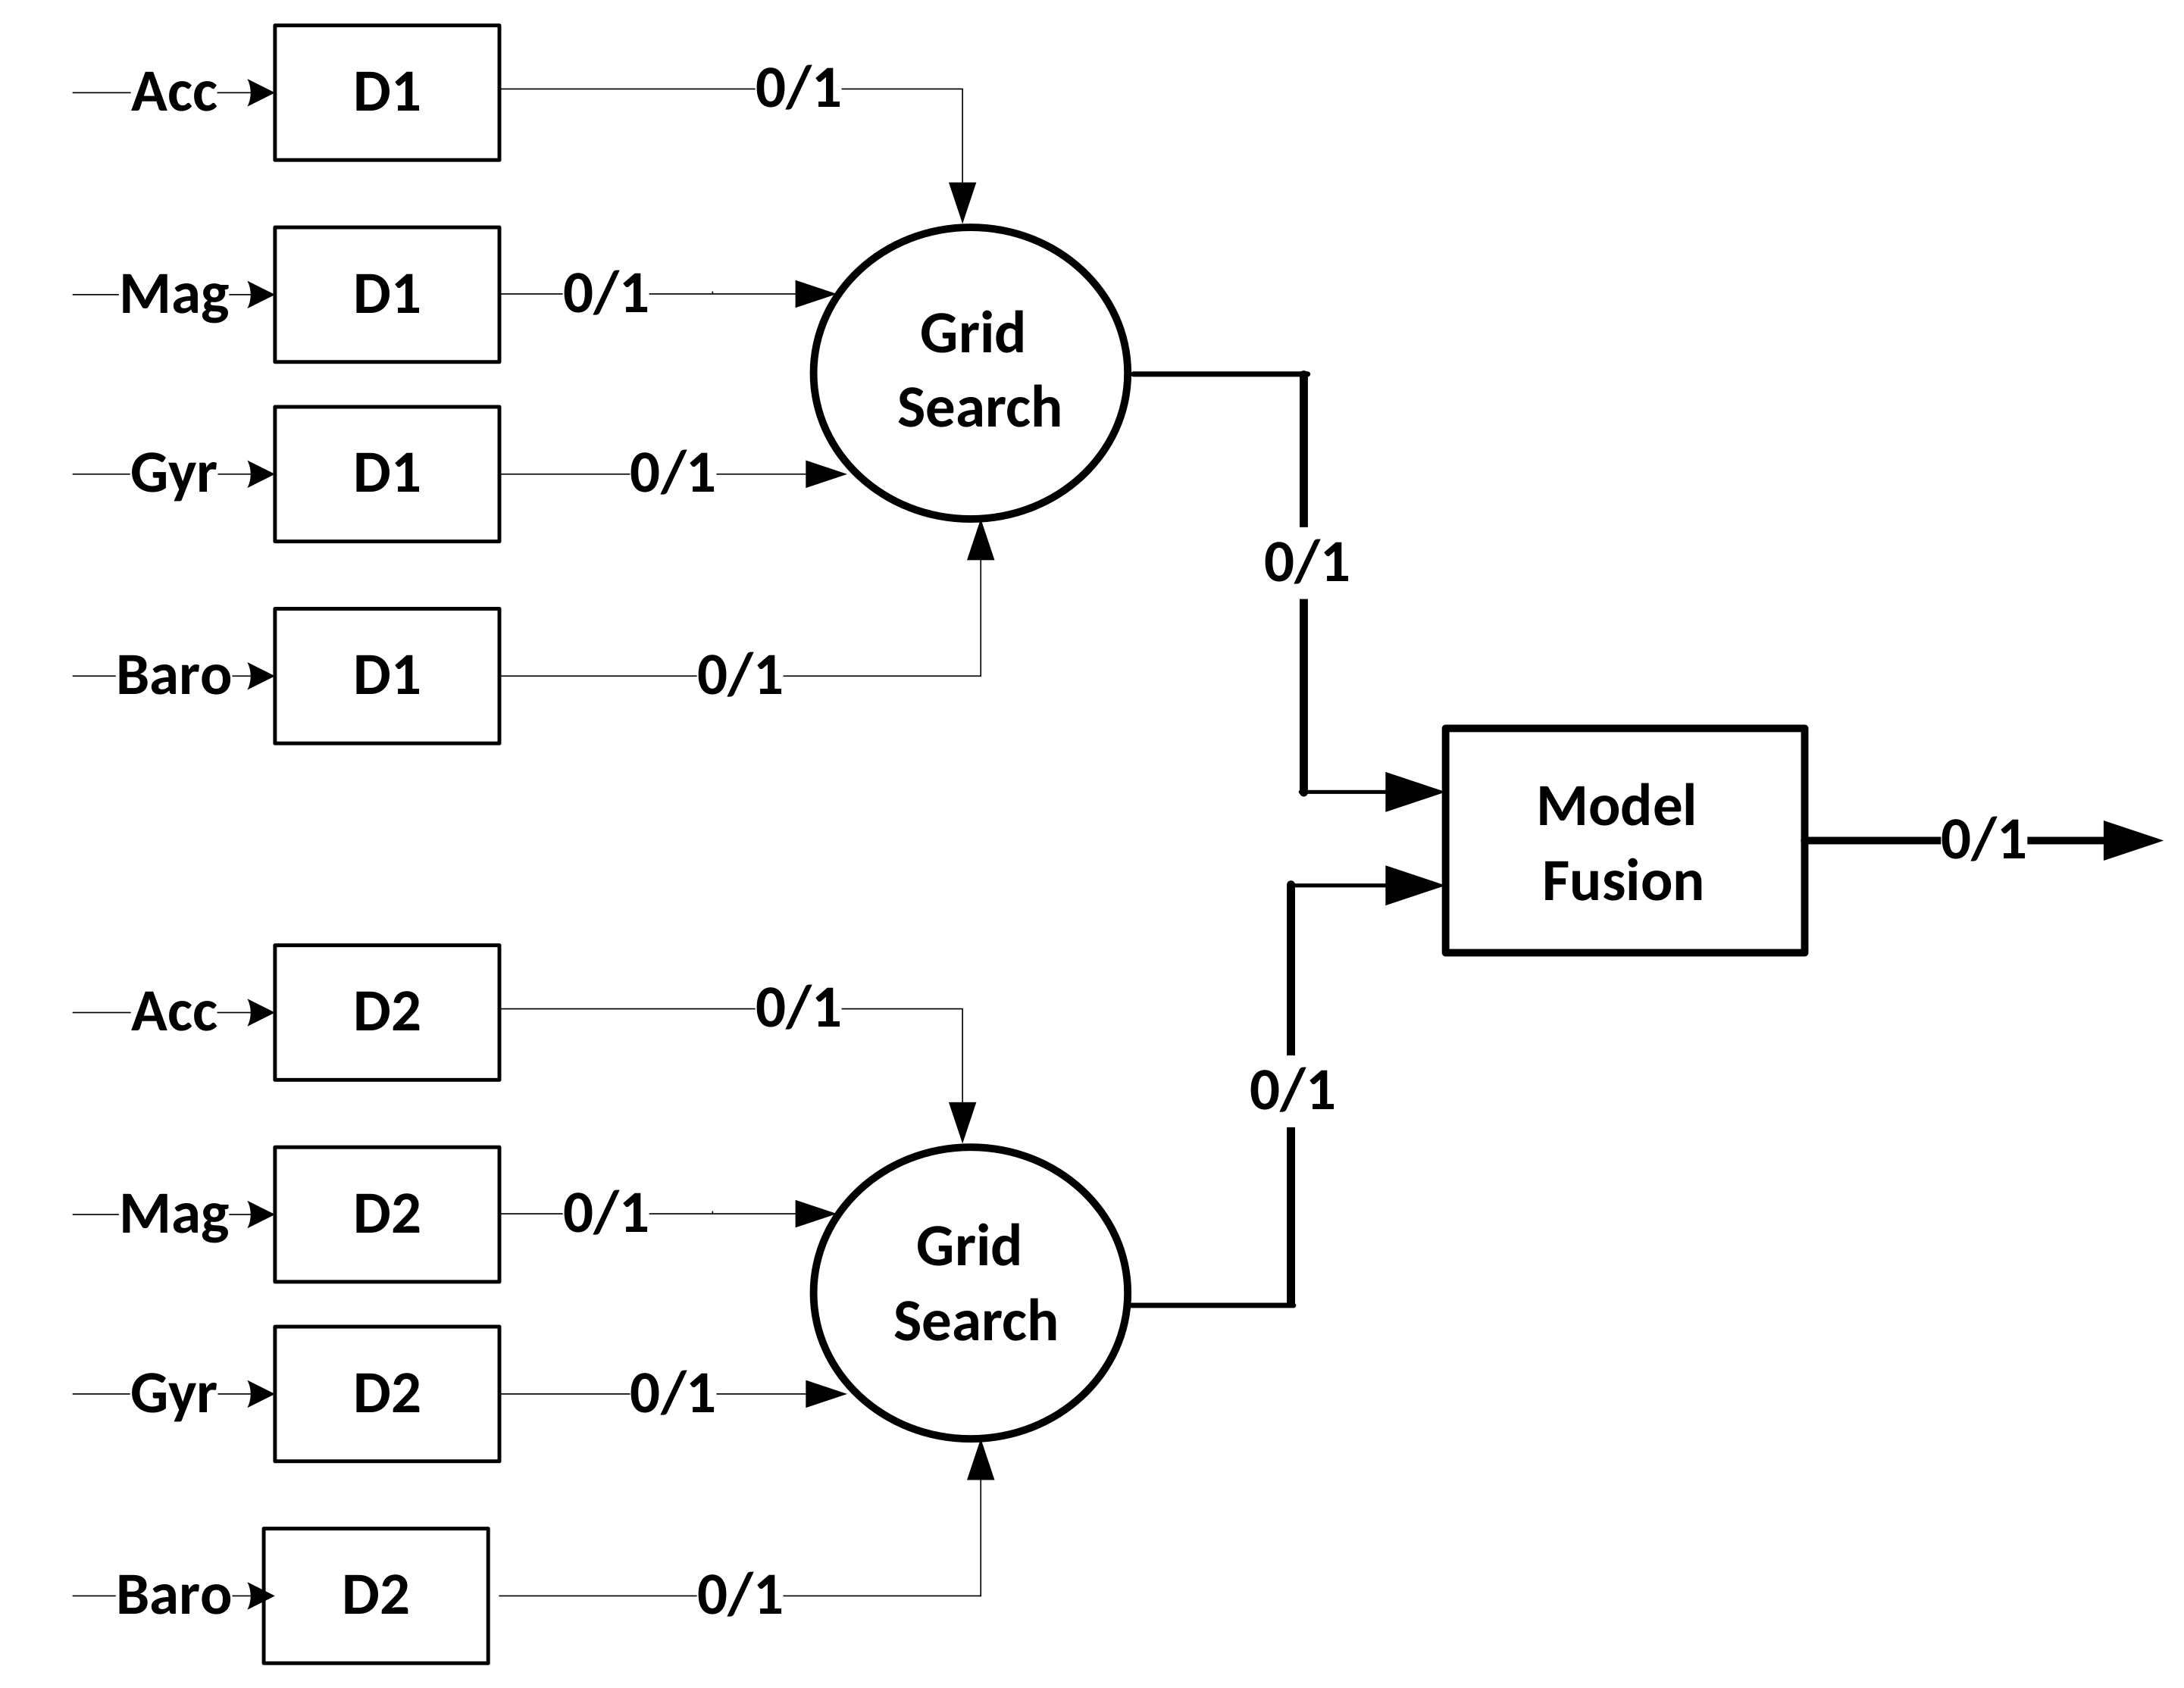
4. Super-Bagging Method
5. Experimentation
5.1. The Data Set
5.2. Feature Extraction
5.3. Classification Methods
5.4. Experiments
- Experiment 1 (): training is performed on the imbalanced data sets (i.e., ) in terms of action and non-actions and validation is performed on the imbalanced data set (i.e., ) in leave-one-subject out settings. The prior-probabilities of classifiers are set according to the classes distribution.
- Experiment 2 (): training is performed on the balanced data sets (i.e., ) in terms of actions and non-actions, where same number of non-actions events (selected randomly) and action events for each player are used. The validation is performed on the imbalanced data set (i.e., ) in leave-one-subject out settings. The prior-probabilities of classifiers are set to be equal for both classes as in this setting the distribution of classes is same.
- Experiment 3 (): training is performed using the super-bagging method and validation is performed on the imbalanced data set in leave-one-subject out settings.
6. Results and Discussions
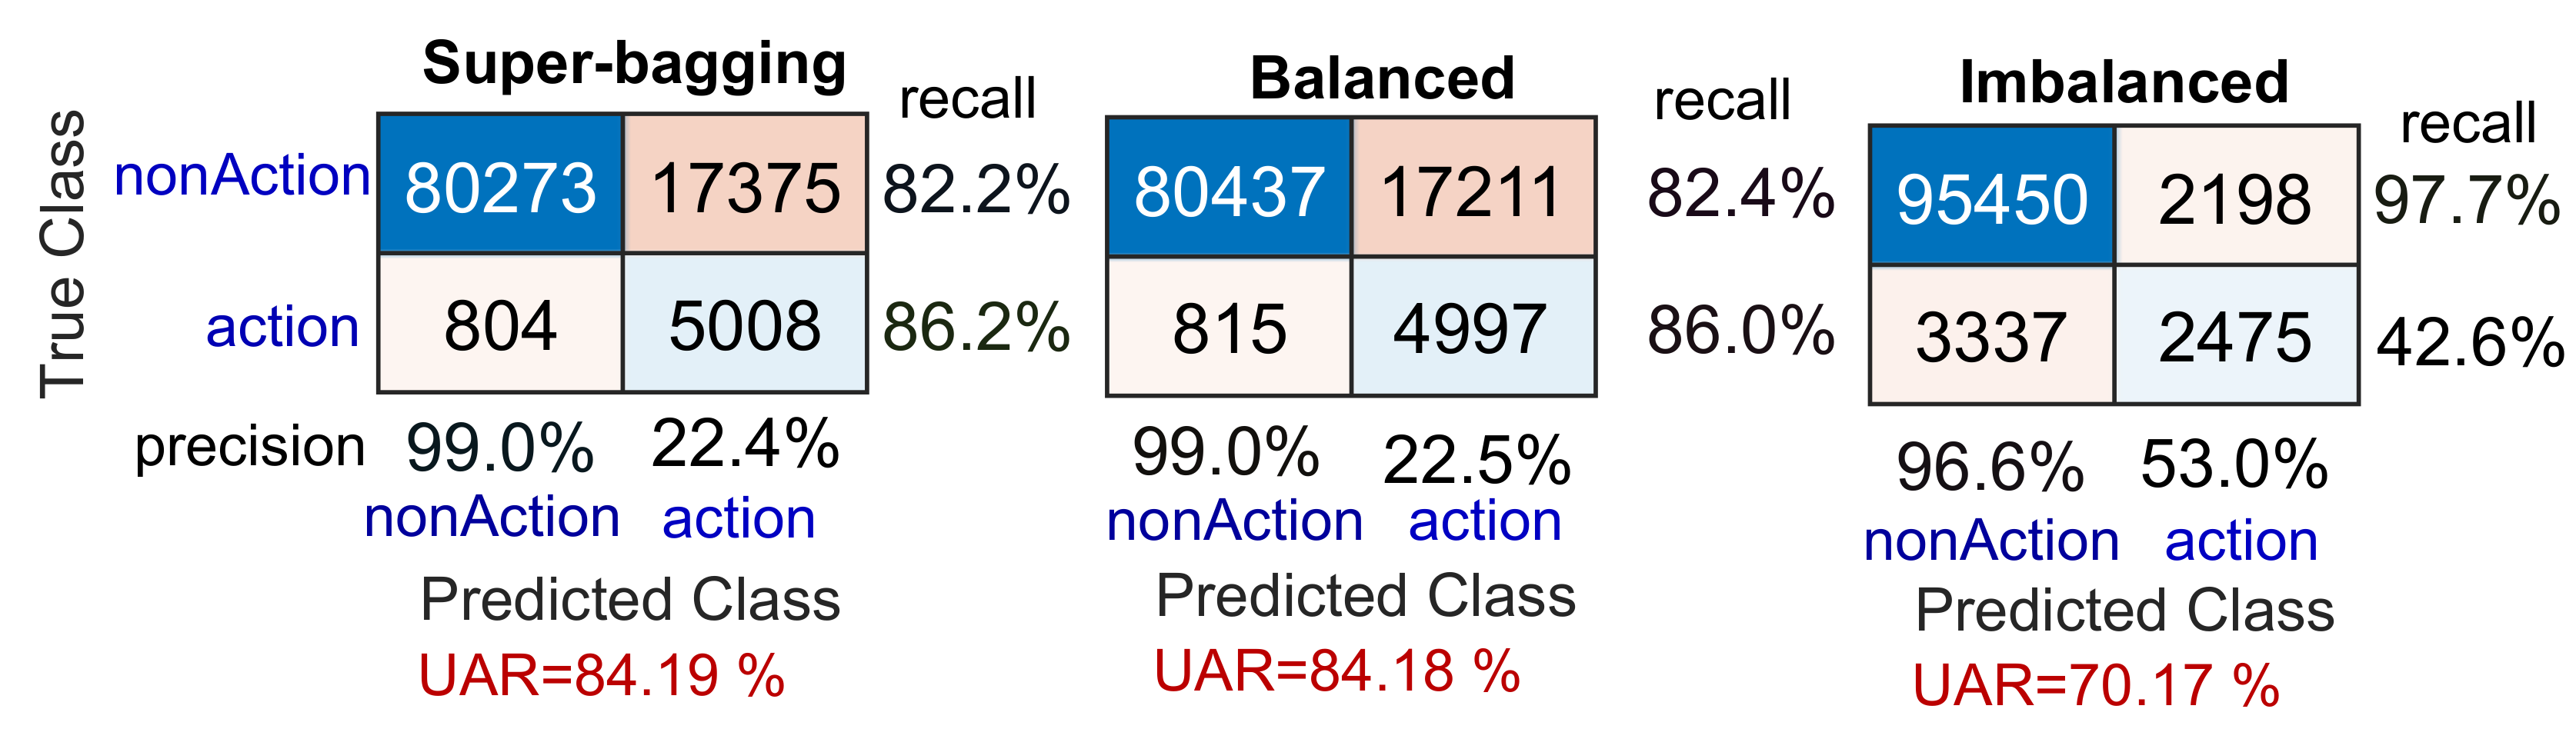
6.1. Experiment 1 (): Imbalanced Learning Method
6.2. Experiment 2 (): Balanced Learning Method
6.3. Experiment 3 (): Super-Bagging Method
6.4. Discussion
7. Conclusions
Author Contributions
Funding
Acknowledgments
Conflicts of Interest
References
- Thomas, G.; Gade, R.; Moeslund, T.B.; Carr, P.; Hilton, A. Computer vision for sports: Current applications and research topics. Comput. Vis. Image Underst. 2017, 159, 3–18. [Google Scholar] [CrossRef]
- Stensland, H.K.; Landsverk, Ȗ.; Griwodz, C.; Halvorsen, P.; Johansen, D.; Gaddam, V.R.; Tennøe, M.; Helgedagsrud, E.; Næss, M.; Stenhaug, M.; et al. Bagadus: An integrated real time system for soccer analytics. ACM Trans. Multimed. Comput. Commun. Appl. 2014, 10, 1–21. [Google Scholar] [CrossRef]
- Kajastila, R. Motion Games in Real Sports Environments. Interactions 2015, 22, 44–47. [Google Scholar] [CrossRef]
- Ludvigsen, M.; Fogtmann, M.H.; Grønbæk, K. TacTowers: An interactive training equipment for elite athletes. In Proceedings of the 8th ACM Conference on Designing Interactive Systems, Aarhus, Denmark, 16–20 August 2010; pp. 412–415. [Google Scholar] [CrossRef]
- Jensen, M.M.; Rasmussen, M.K.; Mueller, F.F.; Grønbæk, K. Keepin’ it Real. In Proceedings of the 33rd Annual ACM Conference on Human Factors in Computing Systems (CHI ’15), Seoul, Korea, 18–23 April 2015; pp. 2003–2012. [Google Scholar] [CrossRef] [Green Version]
- Koekoek, J.; van der Mars, H.; van der Kamp, J.; Walinga, W.; van Hilvoorde, I. Aligning Digital Video Technology with Game Pedagogy in Physical Education. J. Phys. Educ. Recreat. Dance 2018, 89, 12–22. [Google Scholar] [CrossRef] [Green Version]
- Matejka, J.; Grossman, T.; Fitzmaurice, G. Video Lens: Rapid Playback and Exploration of Large Video Collections and Associated Metadata. In Proceedings of the 27th Annual ACM Symposium on User Interface Software and Technology, Honolulu, HI, USA, 5–8 October 2014; pp. 541–550. [Google Scholar] [CrossRef]
- Vales-Alonso, J.; Chaves-Dieguez, D.; Lopez-Matencio, P.; Alcaraz, J.J.; Parrado-Garcia, F.J.; Gonzalez- Castano, F.J. SAETA: A Smart Coaching Assistant for Professional Volleyball Training. IEEE Trans. Syst. Man Cybern. Syst. 2015, 45, 1138–1150. [Google Scholar] [CrossRef]
- Bagautdinov, T.; Alahi, A.; Fleuret, F.; Fua, P.; Savarese, S. Social scene understanding: End-to-end multi-person action localization and collective activity recognition. In Proceedings of the 30th IEEE Conference on Computer Vision and Pattern Recognition (CVPR 2017), Honolulu, HI, USA, 21–26 July 2017; pp. 3425–3434. [Google Scholar] [CrossRef] [Green Version]
- Pei, W.; Wang, J.; Xu, X.; Wu, Z.; Du, X. An embedded 6-axis sensor based recognition for tennis stroke. In Proceedings of the 2017 IEEE International Conference on Consumer Electronics (ICCE 2017), Bengaluru, India, 8–11 January 2017; pp. 55–58. [Google Scholar] [CrossRef]
- Bellusci, G.; Dijkstra, F.; Slycke, P. Xsens MTw: Miniature Wireless Inertial Motion Tracker for Highly Accurate 3D Kinematic Applications; Xsens Technologies B.V.: Enschede, The Netherlands, 2018; pp. 1–9. [Google Scholar] [CrossRef]
- X-IO Technologies. NG-IMU. 2019. Available online: http://x-io.co.uk/ngimu/ (accessed on 24 June 2019).
- Wang, Y.; Zhao, Y.; Chan, R.H.; Li, W.J. Volleyball Skill Assessment Using a Single Wearable Micro Inertial Measurement Unit at Wrist. IEEE Access 2018, 6, 13758–13765. [Google Scholar] [CrossRef]
- Cancela, J.; Pastorino, M.; Tzallas, A.T.; Tsipouras, M.G.; Rigas, G.; Arredondo, M.T.; Fotiadis, D.I. Wearability assessment of a wearable system for Parkinson’s disease remote monitoring based on a body area network of sensors. Sensors 2014, 14, 17235–17255. [Google Scholar] [CrossRef] [PubMed] [Green Version]
- Ismail, S.I.; Osman, E.; Sulaiman, N.; Adnan, R. Comparison between Marker-less Kinect-based and Conventional 2D Motion Analysis System on Vertical Jump Kinematic Properties Measured from Sagittal View. In Proceedings of the 10th International Symposium on Computer Science in Sports (ISCSS); Springer: Cham, Switzerland, 2016; Volume 392, pp. 11–17. [Google Scholar] [CrossRef]
- von Marcard, T.; Rosenhahn, B.; Black, M.J.; Pons-Moll, G. Sparse Inertial Poser: Automatic 3D Human Pose Estimation from Sparse IMUs. Comput. Graph. Forum 2017, 36, 349–360. [Google Scholar] [CrossRef]
- Japkowicz, N.; Stephen, S. The class imbalance problem: A systematic study. Intell. Data Anal. 2002, 6, 429–449. [Google Scholar] [CrossRef]
- Chawla, N.V.; Bowyer, K.W.; Hall, L.O.; Kegelmeyer, W.P. SMOTE: synthetic minority over-sampling technique. J. Artif. Intell. Res. 2002, 16, 321–357. [Google Scholar] [CrossRef]
- García, V.; Sánchez, J.S.; Martín-Félez, R.; Mollineda, R.A. Surrounding neighborhood-based SMOTE for learning from imbalanced data sets. Prog. Artif. Intell. 2012, 1, 347–362. [Google Scholar] [CrossRef] [Green Version]
- He, H.; Bai, Y.; Garcia, E.A.; Li, S. ADASYN: Adaptive synthetic sampling approach for imbalanced learning. In Proceedings of the 2008 IEEE International Joint Conference on Neural Networks (IEEE World Congress on Computational Intelligence), Hong Kong, China, 1–6 June 2008; pp. 1322–1328. [Google Scholar]
- Zhou, L. Performance of corporate bankruptcy prediction models on imbalanced data set: The effect of sampling methods. Knowl. Based Syst. 2013, 41, 16–25. [Google Scholar] [CrossRef]
- Liu, W.; Chawla, S.; Cieslak, D.A.; Chawla, N.V. A Robust Decision Tree Algorithm for Imbalanced Data Sets; SIAM: Philadelphia, PA, USA, 2010; pp. 766–777. [Google Scholar]
- Lemaître, G.; Nogueira, F.; Aridas, C.K. Imbalanced-learn: A python toolbox to tackle the curse of imbalanced data sets in machine learning. J. Mach. Learn. Res. 2017, 18, 559–563. [Google Scholar]
- Wang, S.; Yao, X. Using class imbalance learning for software defect prediction. IEEE Trans. Reliab. 2013, 62, 434–443. [Google Scholar] [CrossRef] [Green Version]
- Breiman, L. Bagging predictors. Mach. Learn. 1996, 24, 123–140. [Google Scholar] [CrossRef] [Green Version]
- Freund, Y.; Schapire, R.E. Experiments with a new boosting algorithm. In Proceedings of the Thirteenth International Conference Machine Learning, Bari, Italy, 3–6 July 1996; Volume 96, pp. 148–156. [Google Scholar]
- Salim, F.; Haider, F.; Tasdemir, S.B.Y.; Naghashi, V.; Tengiz, I.; Cengiz, K.; Postma, D.; Delden, R.V.; Reidsma, D.; Luz, S.; et al. A Searching and Automatic Video Tagging Tool for Events of Interest During Volleyball Training Sessions. In 2019 International Conference on Multimodal Interaction; ACM: New York, NY, USA, 2019; ICMI ’19; pp. 501–503. [Google Scholar] [CrossRef] [Green Version]
- Salim, F.A.; Haider, F.; Tasdemir, S.; Naghashi, V.; Tengiz, I.; Cengiz, K.; Postma, D.B.W.; Delden, R.V.; Reidsma, D.; Luz, S.; et al. Volleyball Action Modelling for Behavior Analysis and Interactive Multi-modal Feedback. In Proceedings of the 15th International Summer Workshop on Multimodal Interfaces (eNTERFACE’19), Ankara, Turkey, 8 July–2 August 2019. [Google Scholar]
- Haider, F.; Salim, F.; Naghashi, V.; Tasdemir, S.B.Y.; Tengiz, I.; Cengiz, K.; Postma, D.; Delden, R.V.; Reidsma, D.; van Beijnum, B.J.; et al. Evaluation of Dominant and Non-Dominant Hand Movements For Volleyball Action Modelling. In Proceedings of the Adjunct of the 2019 International Conference on Multimodal Interaction, Suzhou, China, 14–18 October 2019; pp. 8:1–8:6. [Google Scholar] [CrossRef] [Green Version]
- Zivkovic, Z.; van der Heijden, F.; Petkovic, M.; Jonker, W. Image Segmentation and Feature Extraction for Recognizing Strokes in Tennis Game Videos. In Proceedings of the 7th Annual Conference of the Advanced School for Computing and Imaging, Heijen, The Netherlands, 30 May–1 June 2001; pp. 262–266. [Google Scholar]
- Liu, Y.; Nie, L.; Liu, L.; Rosenblum, D.S. From Action to Activity. Neurocomputing 2016, 181, 108–115. [Google Scholar] [CrossRef]
- Kautz, T.; Groh, B.H.; Hannink, J.; Jensen, U.; Strubberg, H.; Eskofier, B.M. Activity recognition in beach volleyball using a Deep Convolutional Neural Network. Data Min. Knowl. Discov. 2017, 31, 1678–1705. [Google Scholar] [CrossRef]
- Cuspinera, L.P.; Uetsuji, S.; Morales, F.; Roggen, D. Beach volleyball serve type recognition. In Proceedings of the 2016 ACM International Symposium on Wearable Computers, Heidelberg, Germany, 12–16 September 2016; pp. 44–45. [Google Scholar]
- Jarit, P. Dominant-hand to nondominant-hand grip-strength ratios of college baseball players. J. Hand Ther. 1991, 4, 123–126. [Google Scholar] [CrossRef]
- Schuldhaus, D.; Zwick, C.; Körger, H.; Dorschky, E.; Kirk, R.; Eskofier, B.M. Inertial Sensor-Based Approach for Shot/Pass Classification During a Soccer Match. In Proceedings of the KDD Workshop on Large-Scale Sports Analytics, Sydney, Australia, 10–13 August 2015; Volume 27, pp. 1–4. [Google Scholar]
- Wang, D.; Huang, Q.; Chen, X.; Ji, L. Location of three-dimensional movement for a human using a wearable multi-node instrument implemented by wireless body area networks. Comput. Commun. 2020, 153, 34–41. [Google Scholar] [CrossRef]
- Pirbhulal, S.; Wu, W.; Li, G.; Sangaiah, A.K. Medical Information Security for Wearable Body Sensor Networks in Smart Healthcare. IEEE Consum. Electron. Mag. 2019, 8, 37–41. [Google Scholar] [CrossRef]
- Sodhro, A.H.; Sangaiah, A.K.; Sodhro, G.H.; Lohano, S.; Pirbhulal, S. An energy-efficient algorithm for wearable electrocardiogram signal processing in ubiquitous healthcare applications. Sensors 2018, 18, 923. [Google Scholar] [CrossRef] [PubMed] [Green Version]
- Kos, M.; Ženko, J.; Vlaj, D.; Kramberger, I. Tennis Stroke Detection and Classification Using Miniature Wearable IMU Device. In Proceedings of the 2016 International Conference on Systems, Signals and Image Processing (IWSSIP), Bratislava, Slovakia, 23–25 May 2016; pp. 1–4. [Google Scholar] [CrossRef]
- Lausberg, H.; Sloetjes, H. Coding gestural behavior with the NEUROGES-ELAN system. Behav. Res. Methods 2009, 41, 841–849. [Google Scholar] [CrossRef] [PubMed]
- Velasco, R. Apache Solr: For Starters; CreateSpace Independent Publishing Platform: Scotts Valley, CA, USA, 2016. [Google Scholar]
- Postma, D.; van Delden, R.; Walinga, W.; Koekoek, J.; van Beijnum, B.J.; Salim, F.A.; van Hilvoorde, I.; Reidsma, D. Towards Smart Sports Exercises: FirstDesigns. In Proceedings of the Annual Symposium on Computer-Human Interaction in Play (CHI PLAY ’19), Barcelona, Spain, 22–25 October 2019. [Google Scholar] [CrossRef]
- Haider, F.; Salim, F.A.; Busra, S.; Tasdemir, Y.; Naghashi, V.; Cengiz, K.; Postma, D.B.W.; Delden, R.V.; Reidsma, D. Evaluation of Dominant and Non-Dominant Hand Movements For Volleyball Action Modelling. In Proceedings of the 21st ACM International Conference on Multimodal Interaction (ICMI 2019), Suzhou, China, 14–18 October 2019. [Google Scholar]


| ID | DH | Action(sec) | Non-Action(sec) | # Actions | Forearm Pass | One hand Pass | Overhead Pass | Serve | Smash | Underhand Serve | Block |
|---|---|---|---|---|---|---|---|---|---|---|---|
| R | 198 | 3055.25 | 120 | 40 | 3 | 16 | 0 | 29 | 28 | 4 | |
| L | 193.75 | 3061 | 125 | 36 | 2 | 14 | 32 | 15 | 0 | 6 | |
| R | 191 | 3030 | 116 | 50 | 3 | 3 | 34 | 25 | 0 | 1 | |
| R | 176.75 | 3054.5 | 124 | 46 | 2 | 19 | 21 | 28 | 4 | 4 | |
| R | 228.5 | 3009 | 150 | 30 | 1 | 70 | 0 | 12 | 30 | 7 | |
| R | 135.5 | 3080.25 | 106 | 39 | 4 | 13 | 0 | 14 | 34 | 2 | |
| R | 146.25 | 3077.5 | 105 | 34 | 4 | 16 | 34 | 17 | 0 | 0 | |
| R | 183.25 | 3044.5 | 144 | 42 | 1 | 58 | 33 | 4 | 1 | 5 | |
| total | – | 1453 | 24,412 | 990 | 317 | 20 | 209 | 154 | 144 | 97 | 49 |
| Sensor | TB | DT | KNN | NB | SVM | LDA | Avg. | ||||||
|---|---|---|---|---|---|---|---|---|---|---|---|---|---|
| UAR | Std | UAR | Std | UAR | Std | UAR | Std | UAR | Std | UAR | Std | UAR | |
| Acc. | 70.17 | 0.02 | 70.83 | 0.02 | 68.83 | 0.02 | 79.83 | 0.03 | 59.77 | 0.02 | 69.56 | 0.03 | 69.83 |
| Mag. | 60.67 | 0.03 | 63.10 | 0.02 | 57.12 | 0.02 | 74.16 | 0.03 | 50.00 | 0 | 67.71 | 0.03 | 62.13 |
| Gyr. | 61.55 | 0.03 | 64.07 | 0.03 | 60.78 | 0.02 | 74.58 | 0.03 | 53.35 | 0.02 | 64.86 | 0.03 | 63.20 |
| Baro. | 58.43 | 0.03 | 59.22 | 0.05 | 56.53 | 0.04 | 57.24 | 0.06 | 53.01 | 0.01 | 56.78 | 0.03 | 56.87 |
| Fusion | 70.37 | 0.07 | 70.75 | 0.10 | 68.77 | 0.08 | 80.30 | 0.02 | 60.14 | 0.02 | 74.53 | 0.03 | 70.81 |
| Sensor | TB | DT | KNN | NB | SVM | LDA | Avg. | ||||||
|---|---|---|---|---|---|---|---|---|---|---|---|---|---|
| UAR | Std | UAR | Std | UAR | Std | UAR | Std | UAR | Std | UAR | Std | UAR | |
| Acc. | 68.59 | 0.05 | 71.53 | 0.13 | 72.98 | 0.12 | 83.99 | 0.06 | 66.47 | 0.08 | 75.90 | 0.09 | 73.24 |
| Mag. | 58.41 | 0.02 | 76.61 | 0.11 | 67.67 | 0.09 | 80.83 | 0.11 | 66.75 | 0.09 | 75.74 | 0.10 | 71.00 |
| Gyr. | 60.37 | 0.03 | 61.42 | 0.05 | 58.85 | 0.03 | 75.71 | 0.07 | 50.00 | 0 | 64.70 | 0.04 | 61.84 |
| Baro. | 52.16 | 0.02 | 40.86 | 0.21 | 38.56 | 0.22 | 31.53 | 0.21 | 50.00 | 0 | 50.53 | 0.00 | 43.94 |
| Fusion | 71.64 | 0.06 | 71.85 | 0.24 | 66.93 | 0.25 | 79.58 | 0.08 | 73.59 | 0.10 | 82.93 | 0.09 | 74.42 |
| Sensor | TB | DT | KNN | NB | SVM | LDA | Avg. | ||||||
|---|---|---|---|---|---|---|---|---|---|---|---|---|---|
| UAR | Std | UAR | Std | UAR | Std | UAR | Std | UAR | Std | UAR | Std | UAR | |
| Acc. | 84.18 | 0.03 | 81.99 | 0.02 | 82.50 | 0.02 | 82.19 | 0.03 | 82.35 | 0.02 | 80.52 | 0.02 | 82.29 |
| Mag. | 81.71 | 0.02 | 77.47 | 0.02 | 74.86 | 0.02 | 79.25 | 0.04 | 79.50 | 0.03 | 79.08 | 0.03 | 78.65 |
| Gyr. | 77.91 | 0.05 | 73.72 | 0.03 | 75.48 | 0.04 | 75.94 | 0.04 | 74.17 | 0.04 | 72.78 | 0.03 | 75.00 |
| Baro. | 58.51 | 0.09 | 57.19 | 0.06 | 56.80 | 0.08 | 59.30 | 0.08 | 61.45 | 0.03 | 61.01 | 0.03 | 59.04 |
| Fusion | 83.10 | 0.03 | 79.46 | 0.03 | 80.69 | 0.03 | 80.83 | 0.04 | 81.57 | 0.03 | 80.32 | 0.02 | 81.00 |
| Sensor | TB | DT | KNN | NB | SVM | LDA | Avg. | ||||||
|---|---|---|---|---|---|---|---|---|---|---|---|---|---|
| UAR | Std | UAR | Std | UAR | Std | UAR | Std | UAR | Std | UAR | Std | UAR | |
| Acc. | 82.16 | 0.03 | 78.90 | 0.03 | 80.33 | 0.03 | 81.71 | 0.02 | 81.28 | 0.03 | 79.84 | 0.04 | 80.70 |
| Mag. | 77.59 | 0.04 | 74.80 | 0.03 | 69.59 | 0.04 | 75.31 | 0.04 | 76.69 | 0.04 | 75.90 | 0.05 | 74.98 |
| Gyr. | 76.79 | 0.03 | 72.84 | 0.02 | 73.42 | 0.03 | 74.74 | 0.04 | 75.35 | 0.03 | 75.10 | 0.04 | 74.71 |
| Baro. | 53.07 | 0.04 | 51.57 | 0.03 | 50.22 | 0.04 | 49.46 | 0.06 | 55.88 | 0.02 | 56.07 | 0.02 | 52.72 |
| Fusion | 79.59 | 0.03 | 76.70 | 0.03 | 76.18 | 0.03 | 78.25 | 0.03 | 79.60 | 0.04 | 79.24 | 0.04 | 78.26 |
| Sensor | TB | DT | KNN | NB | SVM | LDA | Avg. | ||||||
|---|---|---|---|---|---|---|---|---|---|---|---|---|---|
| UAR | Std | UAR | Std | UAR | Std | UAR | Std | UAR | Std | UAR | Std | UAR | |
| Acc. | 84.19 | 0.03 | 82.70 | 0.02 | 82.50 | 0.02 | 82.19 | 0.03 | 82.35 | 0.02 | 80.67 | 0.02 | 82.43 |
| Mag. | 81.67 | 0.02 | 77.97 | 0.02 | 74.86 | 0.02 | 79.18 | 0.04 | 79.50 | 0.03 | 79.08 | 0.05 | 78.71 |
| Gyr. | 77.91 | 0.05 | 74.34 | 0.03 | 75.48 | 0.04 | 75.95 | 0.04 | 74.17 | 0.04 | 72.80 | 0.03 | 75.11 |
| Baro. | 58.51 | 0.09 | 57.25 | 0.06 | 56.80 | 0.08 | 59.32 | 0.08 | 61.45 | 0.03 | 61.04 | 0.03 | 59.06 |
| Fusion | 82.87 | 0.03 | 80.22 | 0.03 | 80.59 | 0.03 | 81.24 | 0.03 | 81.58 | 0.03 | 80.66 | 0.02 | 81.19 |
| Sensor | TB | DT | KNN | NB | SVM | LDA | Avg. | ||||||
|---|---|---|---|---|---|---|---|---|---|---|---|---|---|
| UAR | Std | UAR | Std | UAR | Std | UAR | Std | UAR | Std | UAR | Std | UAR | |
| Acc. | 82.40 | 0.03 | 79.38 | 0.06 | 80.30 | 0.05 | 82.93 | 0.04 | 80.50 | 0.04 | 79.93 | 0.05 | 80.91 |
| Mag. | 77.59 | 0.04 | 78.95 | 0.04 | 71.36 | 0.06 | 77.89 | 0.06 | 77.21 | 0.04 | 77.82 | 0.05 | 76.80 |
| Gyr. | 76.79 | 0.03 | 72.05 | 0.03 | 73.15 | 0.03 | 72.37 | 0.04 | 75.35 | 0.03 | 74.63 | 0.04 | 74.06 |
| Baro. | 53.07 | 0.04 | 47.35 | 0.10 | 45.66 | 0.10 | 39.80 | 0.11 | 55.88 | 0.02 | 56.07 | 0.02 | 49.64 |
| Fusion | 80.11 | 0.03 | 80.12 | 0.08 | 77.65 | 0.08 | 80.87 | 0.06 | 80.13 | 0.04 | 81.58 | 0.05 | 80.08 |
| Sensor | Imbalanced | Balanced | Super-Bagging | |||
|---|---|---|---|---|---|---|
| DH | NDH | DH | NDH | DH | NDH | |
| Acc. | 69.83 | 73.24 | 82.29 | 80.70 | 82.43 | 80.91 |
| Mag. | 62.13 | 71.00 | 78.65 | 74.98 | 78.71 | 76.80 |
| Gyr. | 63.20 | 61.84 | 75.00 | 74.71 | 75.11 | 74.06 |
| Baro. | 56.87 | 43.94 | 59.04 | 52.72 | 59.06 | 49.64 |
| Fusion | 70.81 | 74.42 | 81.00 | 78.26 | 81.19 | 80.08 |
© 2020 by the authors. Licensee MDPI, Basel, Switzerland. This article is an open access article distributed under the terms and conditions of the Creative Commons Attribution (CC BY) license (http://creativecommons.org/licenses/by/4.0/).
Share and Cite
Haider, F.; Salim, F.A.; Postma, D.B.W.; van Delden, R.; Reidsma, D.; van Beijnum, B.-J.; Luz, S. A Super-Bagging Method for Volleyball Action Recognition Using Wearable Sensors. Multimodal Technol. Interact. 2020, 4, 33. https://doi.org/10.3390/mti4020033
Haider F, Salim FA, Postma DBW, van Delden R, Reidsma D, van Beijnum B-J, Luz S. A Super-Bagging Method for Volleyball Action Recognition Using Wearable Sensors. Multimodal Technologies and Interaction. 2020; 4(2):33. https://doi.org/10.3390/mti4020033
Chicago/Turabian StyleHaider, Fasih, Fahim A. Salim, Dees B.W. Postma, Robby van Delden, Dennis Reidsma, Bert-Jan van Beijnum, and Saturnino Luz. 2020. "A Super-Bagging Method for Volleyball Action Recognition Using Wearable Sensors" Multimodal Technologies and Interaction 4, no. 2: 33. https://doi.org/10.3390/mti4020033