
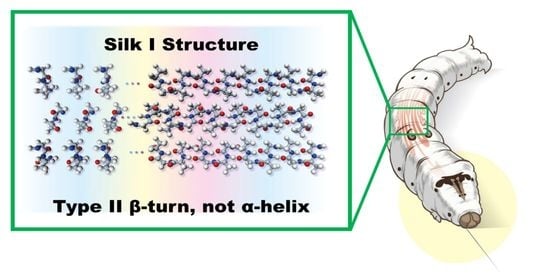
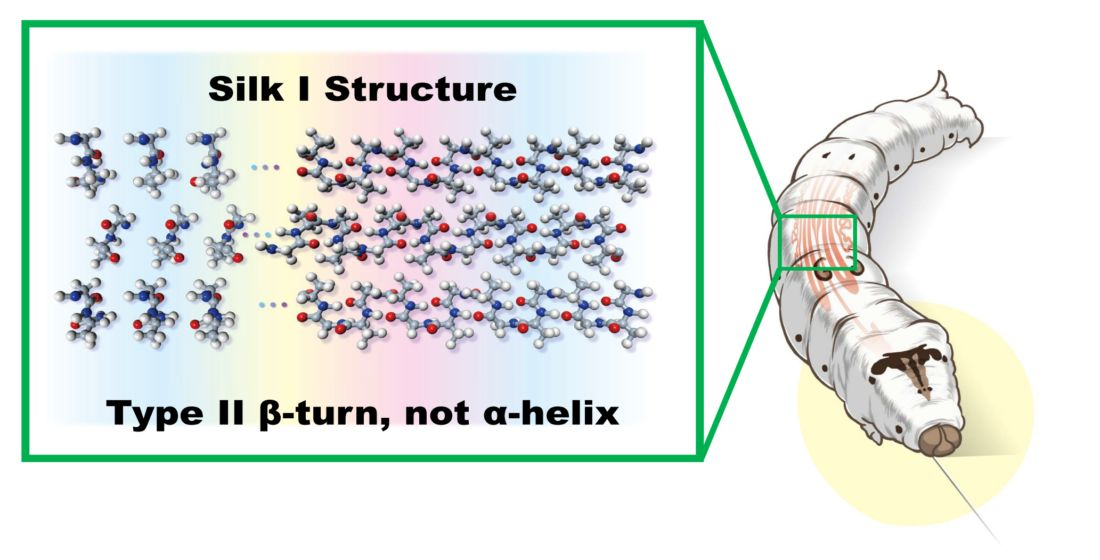
Structure of Silk I (Bombyx mori Silk Fibroin before Spinning) -Type II β-Turn, Not α-Helix-

Department of Biotechnology, Tokyo University of Agriculture and Technology, 2-24-16 Nakacho, Koganei, Tokyo 184-8588, Japan
Molecules 2021, 26(12), 3706; https://doi.org/10.3390/molecules26123706
Submission received: 26 May 2021
/
Revised: 11 June 2021
/
Accepted: 14 June 2021
/
Published: 17 June 2021
(This article belongs to the Special Issue Silk Fibroin Materials 2.0)
Abstract
:Recently, considerable attention has been paid to Bombyx mori silk fibroin by a range of scientists from polymer chemists to biomaterial researchers because it has excellent physical properties, such as strength, toughness, and biocompatibility. These appealing physical properties originate from the silk fibroin structure, and therefore, structural determinations of silk fibroin before (silk I) and after (silk II) spinning are a key to make wider applications of silk. There are discrepancies about the silk I structural model, i.e., one is type II β-turn structure determined using many solid-state and solution NMR spectroscopies together with selectively stable isotope-labeled model peptides, but another is α-helix or partially α-helix structure speculated using IR and Raman methods. In this review, firstly, the process that led to type II β-turn structure by the authors was introduced in detail. Then the problems in speculating silk I structure by IR and Raman methods were pointed out together with the problem in the assignment of the amide I band in the spectra. It has been emphasized that the conformational analyses of proteins and peptides from IR and Raman studies are not straightforward and should be very careful when the proteins contain β-turn structure using many experimental data by Vass et al. In conclusion, the author emphasized here that silk I structure should be type II β-turn, not α-helix.
1. Introduction
Bombyx mori (B. mori) silk fibroin continues to attract the attention of many researchers in textile technology, biochemistry, biology, polymer chemistry, biomaterials, and so on [1]. The application of silk fibroin to the biomaterial field is an especially active area because it has several excellent properties, such as high strength, high toughness, and excellent biocompatibility [2,3,4,5,6,7,8]. These excellent properties originate from the structure of silk fibroin, and therefore the structural analysis is key to the further development of silk in wider applications.
The silk fiber from B. mori cocoon is a twin fiber that consists of two kinds of proteins: Silk fibroin and silk sericin. The fibroin consists of a heavy (H) chain of 390 kDa and a light (L) chain of 26 kDa connected by a disulfide bond, as well as a glycoprotein (P25 (30 kDa)) [9,10,11,12], which is secreted into the posterior silk gland. The H-chain, L-chain, and P25 are thought to be assembled with the ratio of 6:6:1. The silk fibroin is then stored in the middle silk gland and coated by silk sericin. The proteins are spun out through the anterior silk gland and converted into silk fibers. To use them as biomaterial, the coated silk sericin is usually removed by degumming process [1,3,6,7,8].
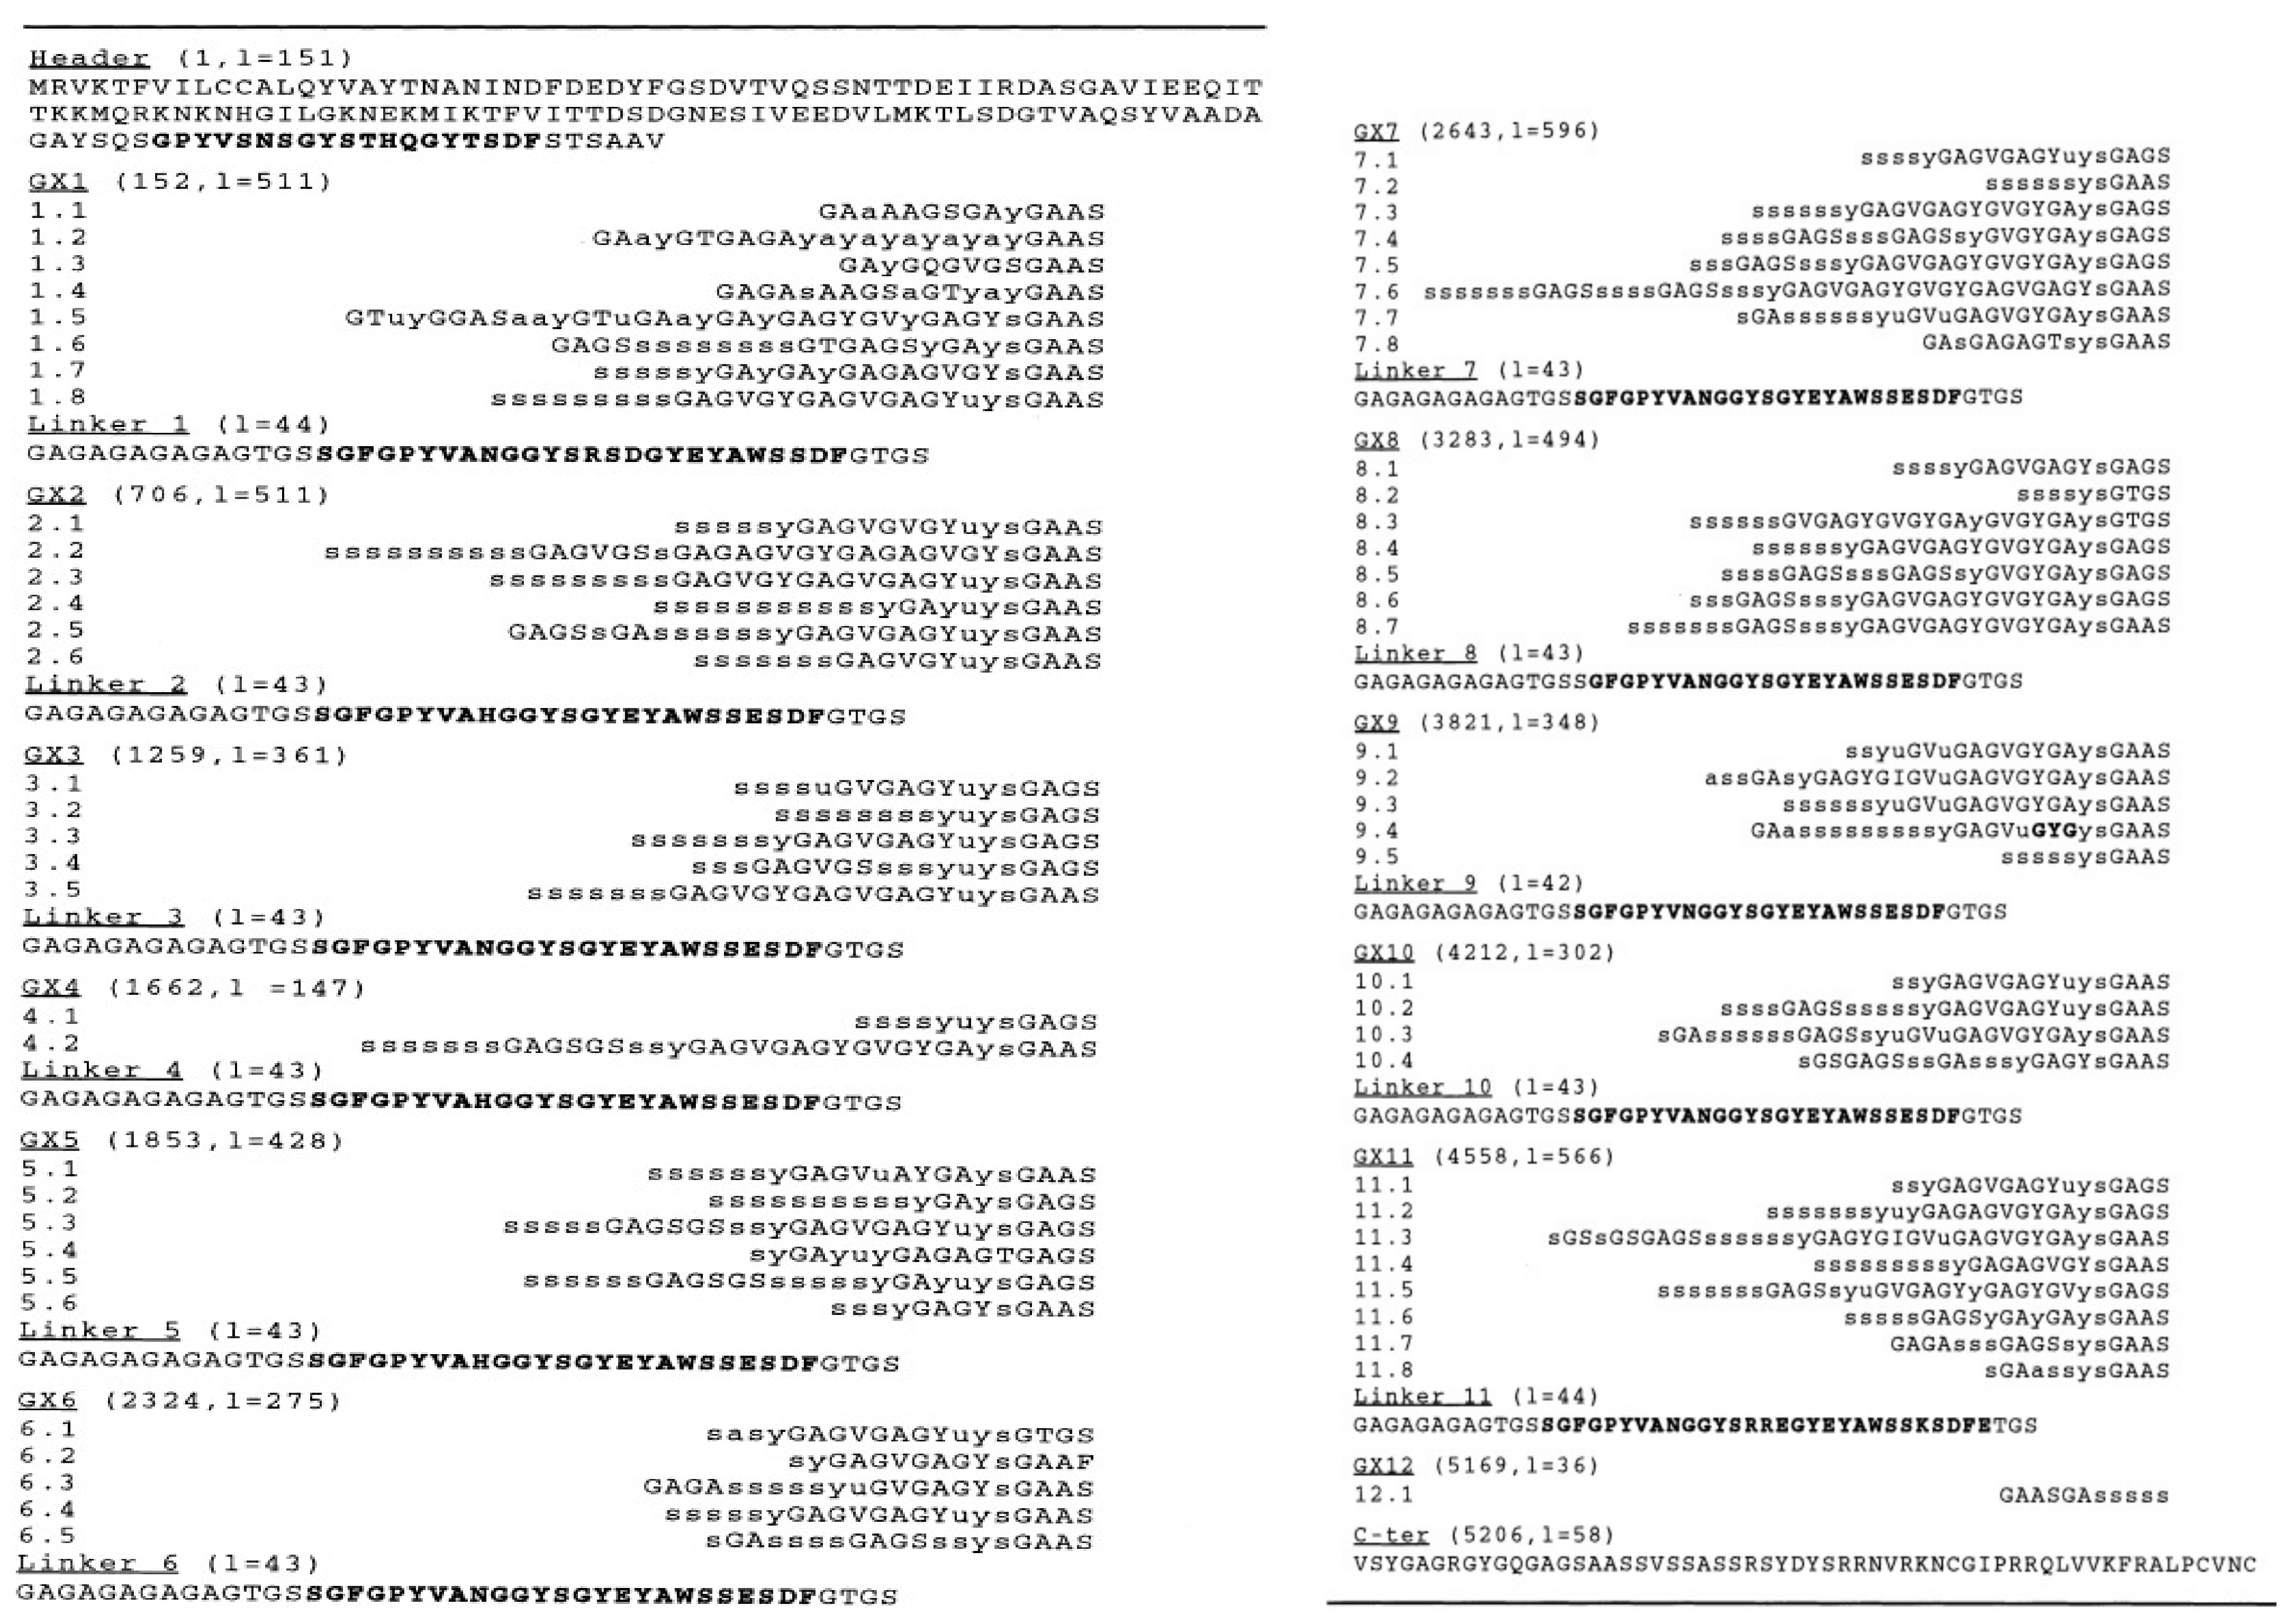
The H chain occupies most of the silk fibroin, and the amino acid composition is Gly (46%), Ala (30%), Ser (12%), Tyr (5.3%), Val (1.8%), etc., [13]. The primary structure of the H chain has been reported by Zhou et al. [13,14], as shown in Figure 1. The primary structure contains a large number of repeated sequences organized into 12 domains, each of which has related subdomains.
The amino acid sequence is roughly divided into four motifs: (i), (ii), (iii), and (iv) alternate along the chain [15]. Motif (i) consists of a highly repetitive AGSGAG sequence and constitutes the crystalline regions of the fiber. The total number of AGSGAG sequence repeats is 433 (2598 amino acid residues). Because the total number of amino acid residues in the H chain is 5263, almost half is the AGSGAG sequence [16]. Motif (ii) is a relatively less repetitive sequence that contains hydrophobic and/or aromatic residues GAGAGY, GAGAGV, and GAGAGVGY. Motif (iii) is very similar to the sequence of Motif (i) except for the presence of an AAS motif. Finally, Motif (iv) contains negatively charged, polar, bulky hydrophobic, and/or aromatic residues, e.g., TGSSGFGPYVANGGYSGYEYAWSSESDFGT [13,14], and makes up the amorphous regions of the silk fibroin H chain.
It is well known that there are two kinds of crystalline forms, silk I and silk II for B. mori silk fibroin [17]. The former is the structure before spinning, and the latter the structure after spinning in a solid-state. Marsh et al. [18] reported that silk II was antiparallel β-sheet structure based on the X-ray diffraction analysis of silk fiber. However, most recently, the authors proposed that silk II structure was a lamella structure using 13C selectively labeled model peptides and solid-state NMR method [16,19]. Namely, two kinds of Ala residues in β-sheet structure, plus one distorted β-turn formed by repetitive folding using β-turns every eighth amino acid in an antipolar arrangement. However, in this review, the author will concentrate on clarifying the structure of another structure, silk I.
The structure of silk I has been in controversy for a long time because X-ray diffraction or electron-diffraction data give only limited structural information [17,20,21,22]. More complicated situations are that the structure of silk fibroin before spinning was called as α-form at an early stage to distinguish it from β-form (silk II). Later, silk I was named instead of α-form because the name α-form may create confusion with the α-helix of Pauling and Corey [17]. However, even today, there are still many papers that the structure of silk I is α-helix or partially α-helix based on IR and Raman spectra [23,24,25,26,27,28,29,30,31,32,33,34,35,36,37]. Therefore, the author will firstly introduce the process that led to the silk I structure being type II β-turn using several many solid-state NMR and solution NMR methods together with selectively stable isotope-labeled model peptides in detail. Next, the author will emphasize the problem to conclude that the silk I structure is α-helix from IR analyses together with the assignment of the amide I band. This is based on the review by Vass et al. [38]. In conclusion, the author emphasized here that silk I structure should be type II β-turn, not α-helix.
2. Structure of Silk Stored in the Middle Silk Gland of B. mori Silkworm
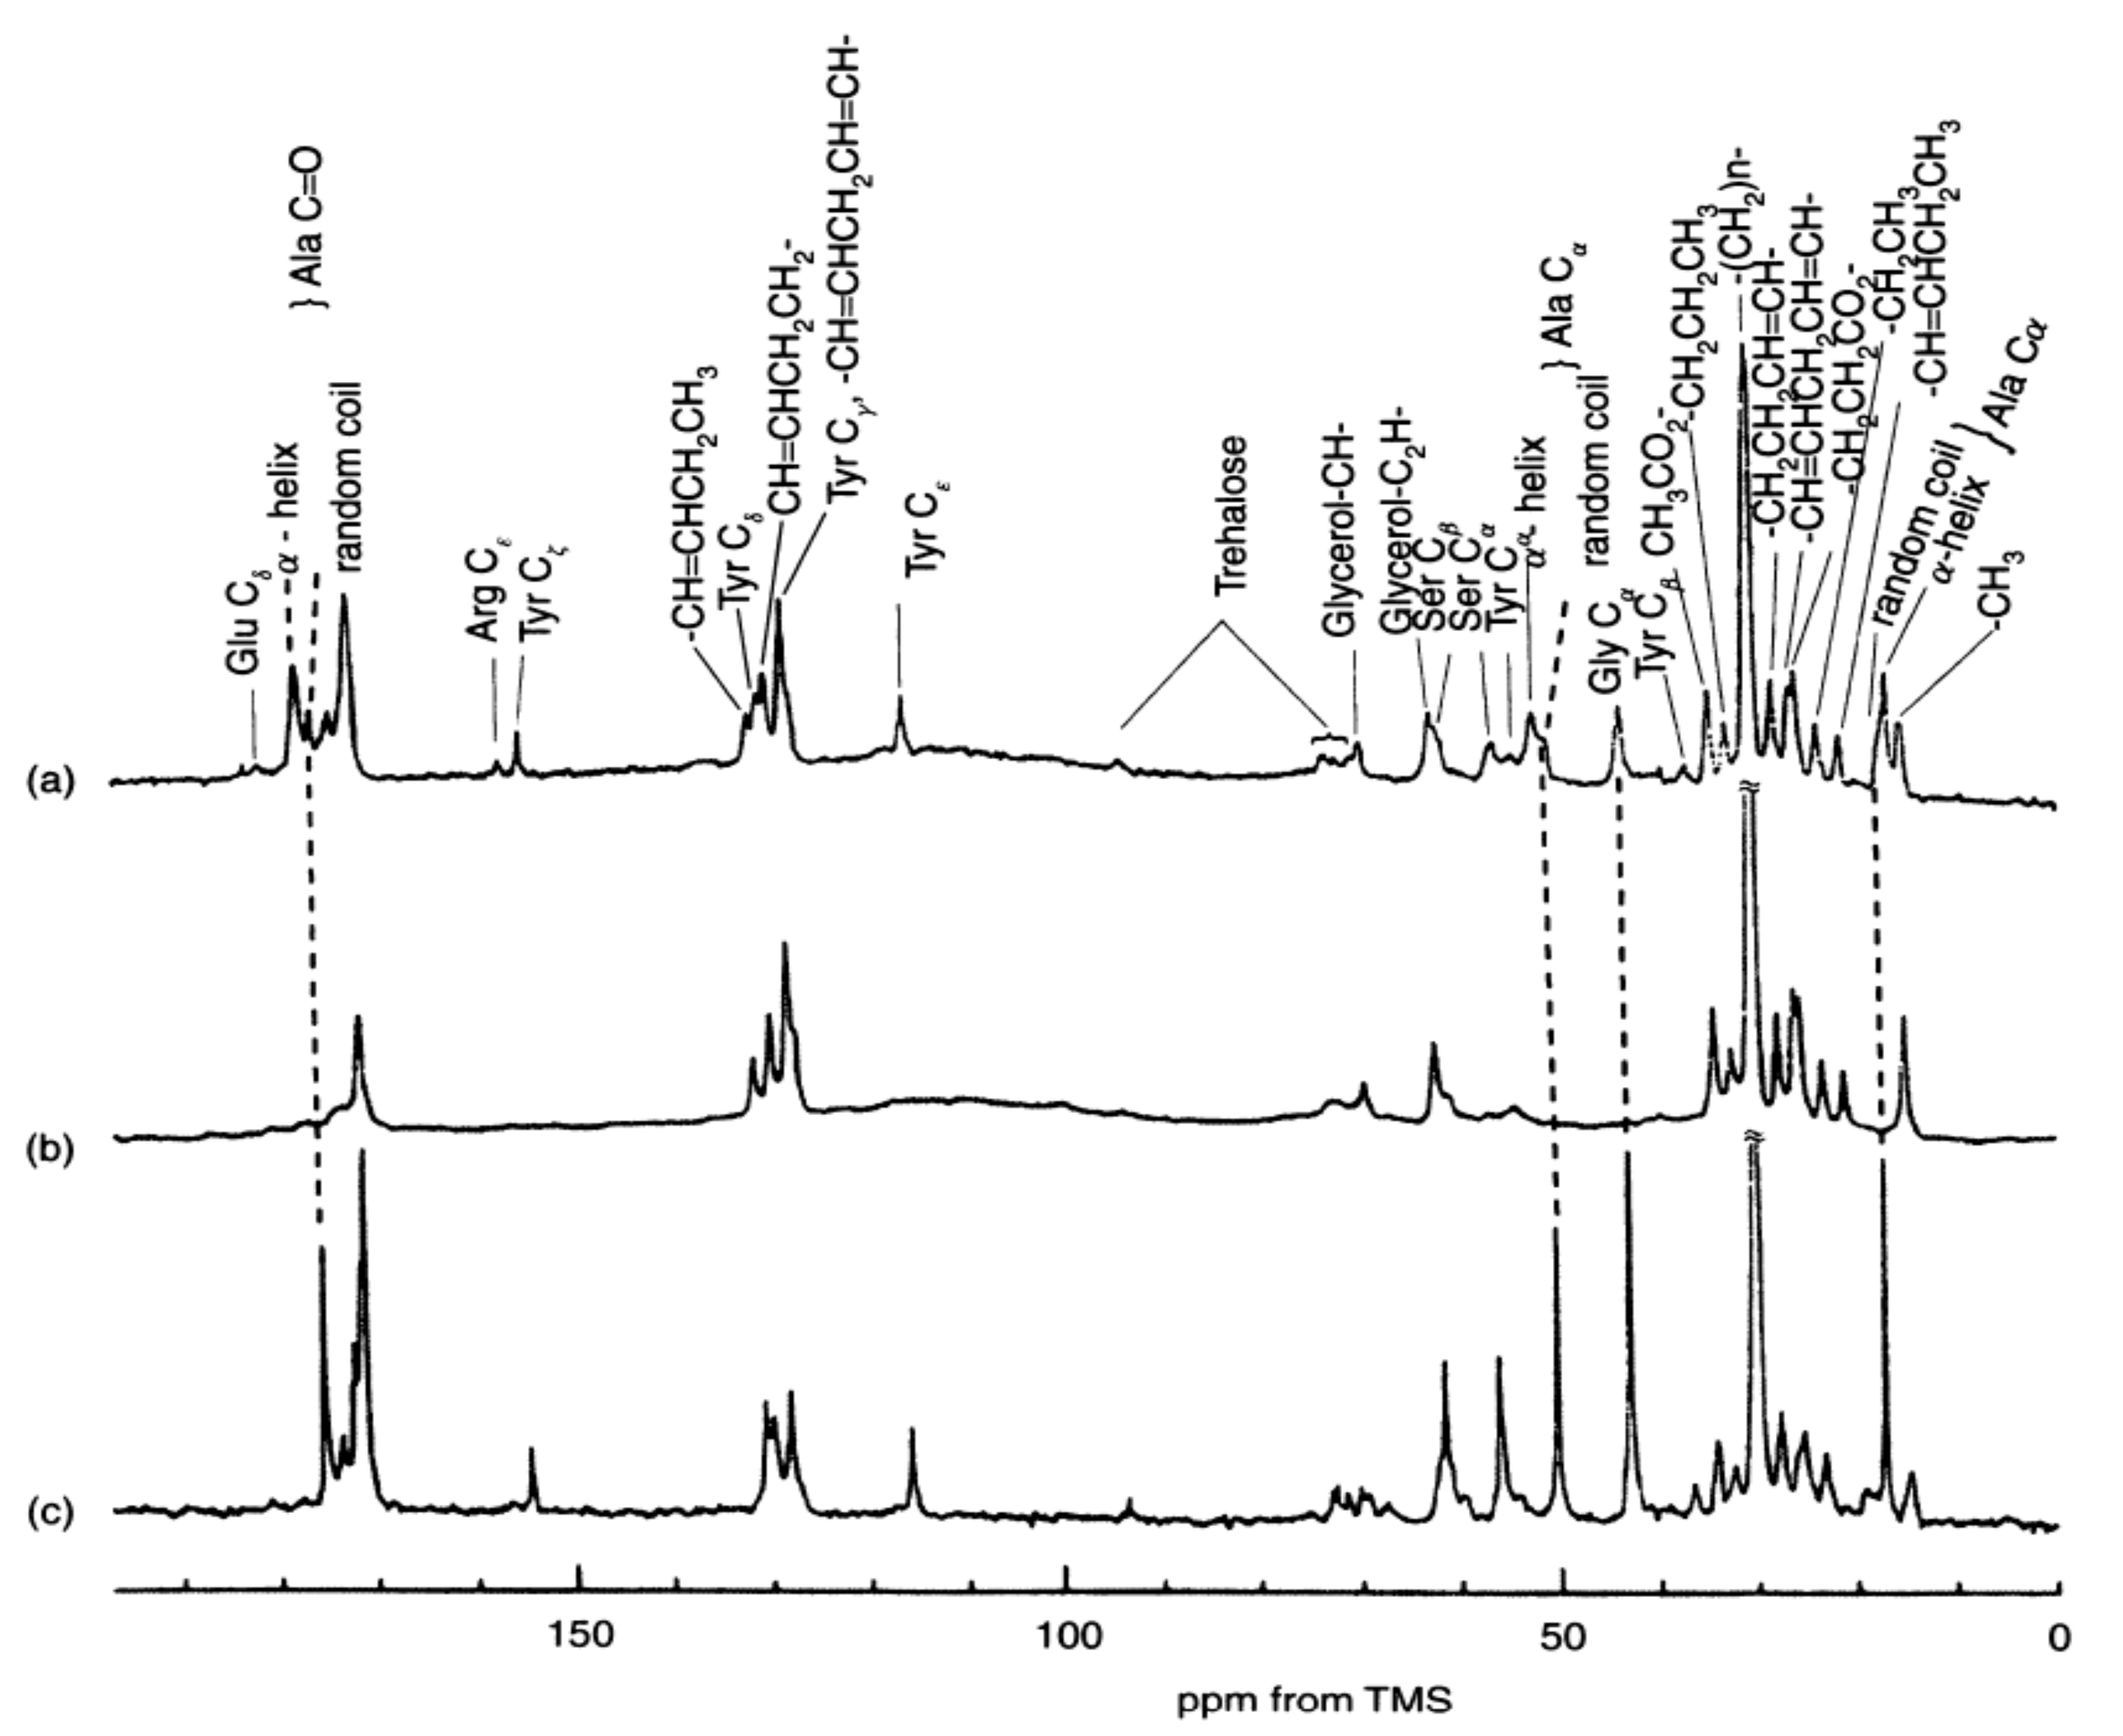
The authors first reported the 13C solution NMR spectra of liquid silks stored in the live silk moths, Samia cynthia ricini (S. c. ricini) and B. mori in 1983 together with the spectrum of pupa (Figure 2) [39,40]. The shapes of these 5th larval stage silk moths and pupa are suitable to put directly into the 13C NMR sample tube with 10 mm outer diameter. As shown in Figure 2, the 13C NMR peaks of the liquid silks could be obtained and easily assigned because these peaks should not be observed in the spectrum of pupa after making cocoons.
From comparing the spectra between two kinds of silkworms, it is important to emphasize that the conformation of liquid silk from B. mori is different from α-helix. There are mainly two kinds of Ala residues in the liquid silk of S. c. ricini stored in the middle silk glands, i.e., Ala residues in the polyalanine sequences (A)n (n = 12, 13) and the isolated Ala residue [41]. The polyalanine sequences take α-helical conformation, whereas the isolated Ala residues take random coil in the liquid silk [39,40,42,43,44,45,46,47]. Therefore, the chemical shifts of the Ala main peaks of S. c. ricini liquid silk are a good chemical shift reference for α-helix, and the small peaks are a good chemical shift reference for the random coil.
As shown in Figure 2c, the chemical shifts of the single sharp peaks from Ala Cα, Cβ, and C=O carbons of B. mori liquid silk are quite different from the corresponding α-helical Ala peaks of S. c. ricini liquid silk and close to the random coil peaks. (Figure 2a) Thus, the spectral comparison of Figure 2a,c provides clear evidence against the presence of α-helix in the liquid silk from B. mori silkworm. The X-ray diffraction data of liquid silk dried without using any external force also clearly deny the presence of α-helix [17,18,22,48,49,50,51].
However, the in vivo NMR study does not mean that all of the B. mori liquid silk stored in the middle silk glands have simply random coil structure because it is expected to be hard to prepare silk fibroin fiber with high strength by silkworm all from a random coil structure. Namely, some orderly structure silk I that is not α-helix is speculated to be present in the liquid silk.
3. Determination of Silk I Structure in a Solid-State
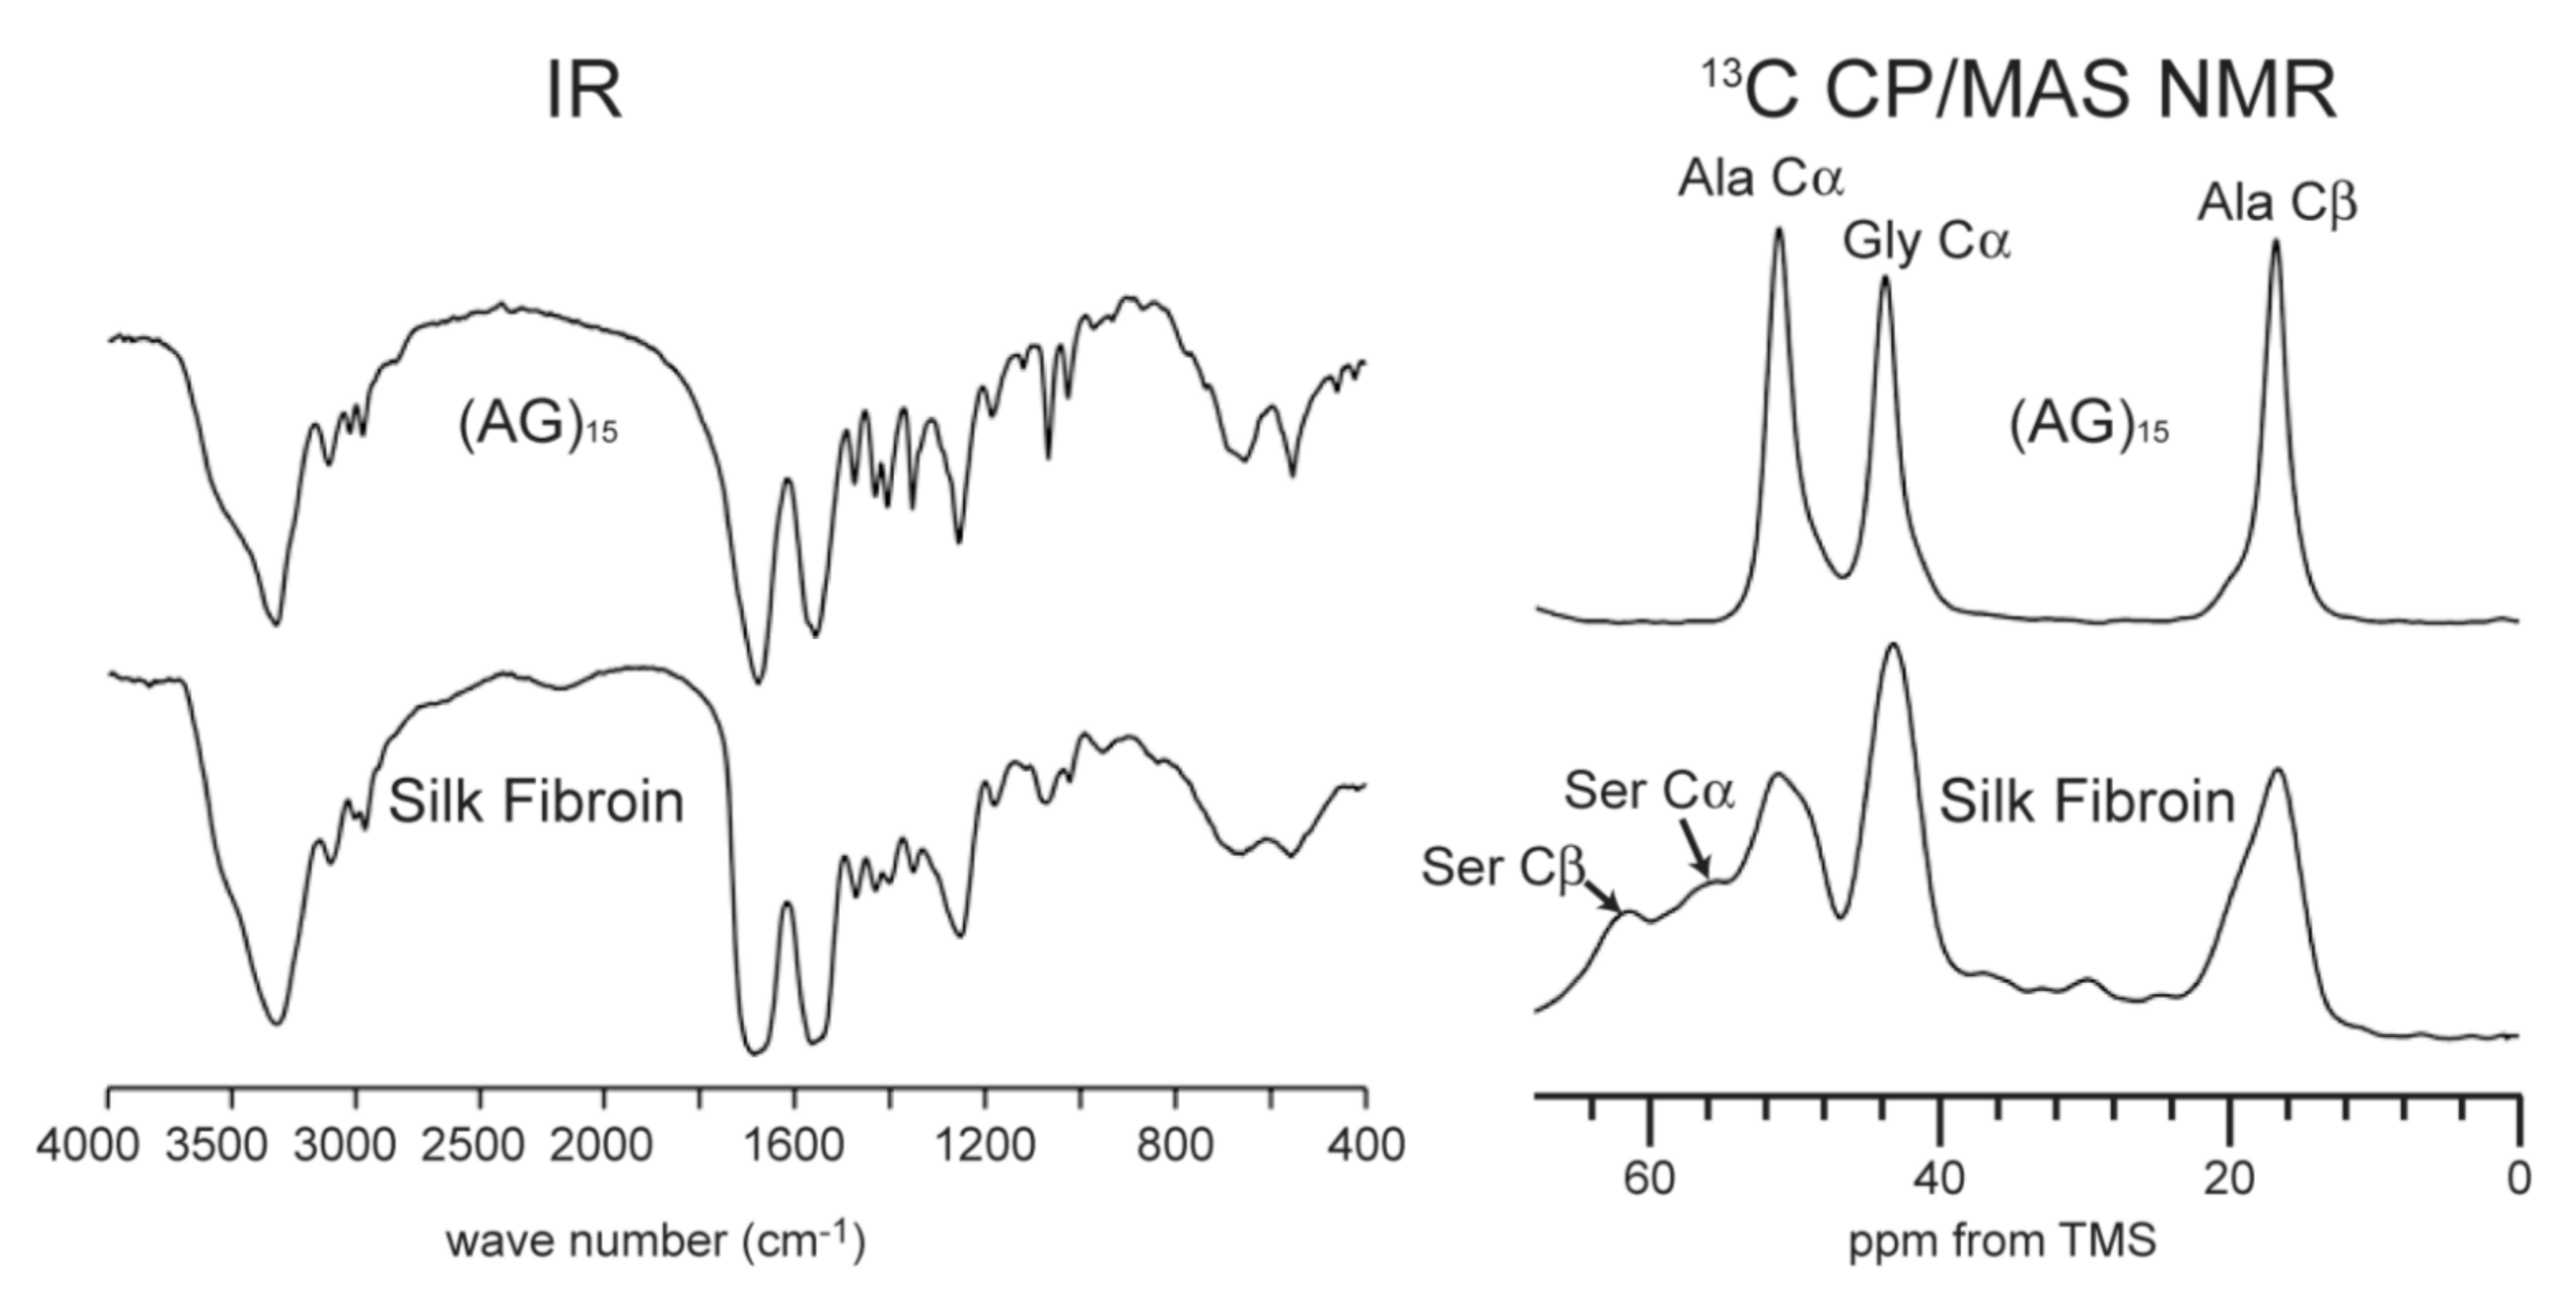
In order to determine the silk I structure, the authors used the peptide model (AG)15 because the number of Ala, Gly, and Ser residues in the repeated AGSGAG sequences (crystalline region) are almost half of the total amino acid residues of silk fibroin [13,14,16]. An alternating copolypeptide (AG)n has been used for the structural model of silk fibroin by X-ray diffraction analysis [17,20,48,49,50,51]. The (AG)15 after dialysis from 9M LiBr aqueous solution has been used as the model for silk I because the IR spectra and 13C chemical shifts of the main peaks from its Ala and Gly residues are the same as those from B. mori silk fibroin obtained by slowly drying the liquid silk taken out from silk gland at room temperature carefully, as shown in Figure 3 [21,22,52,53,54,55,56].
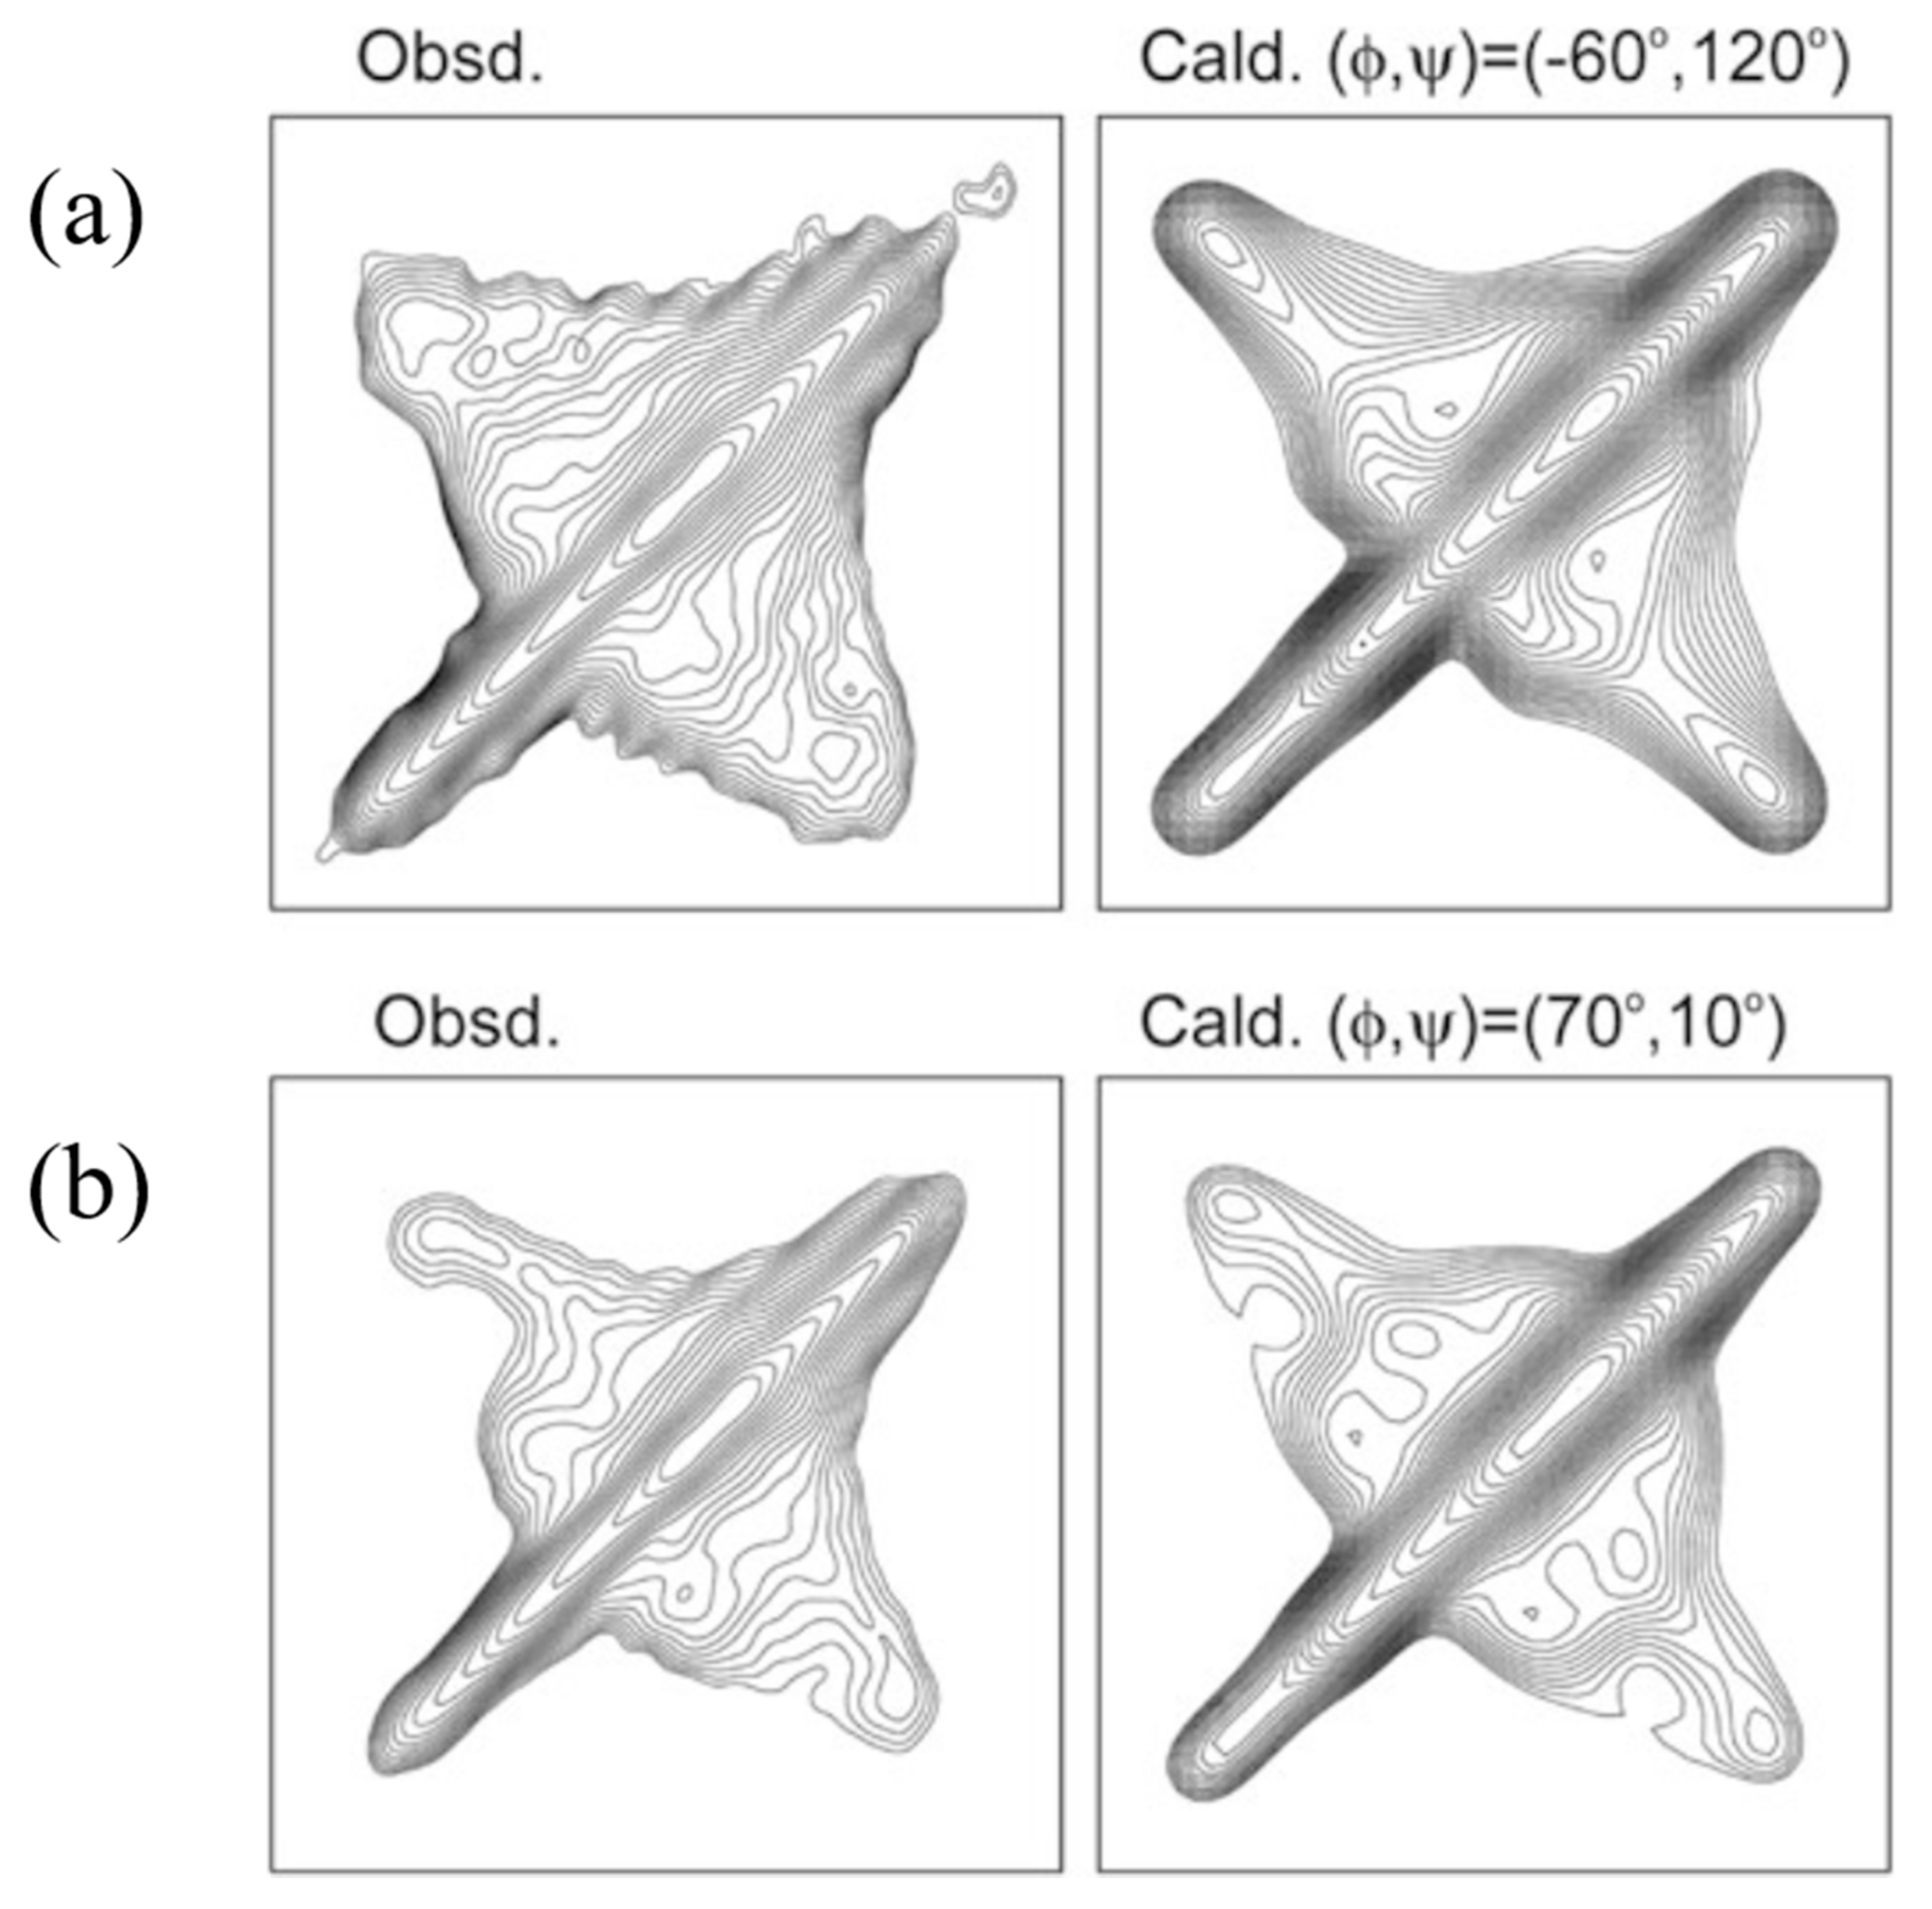
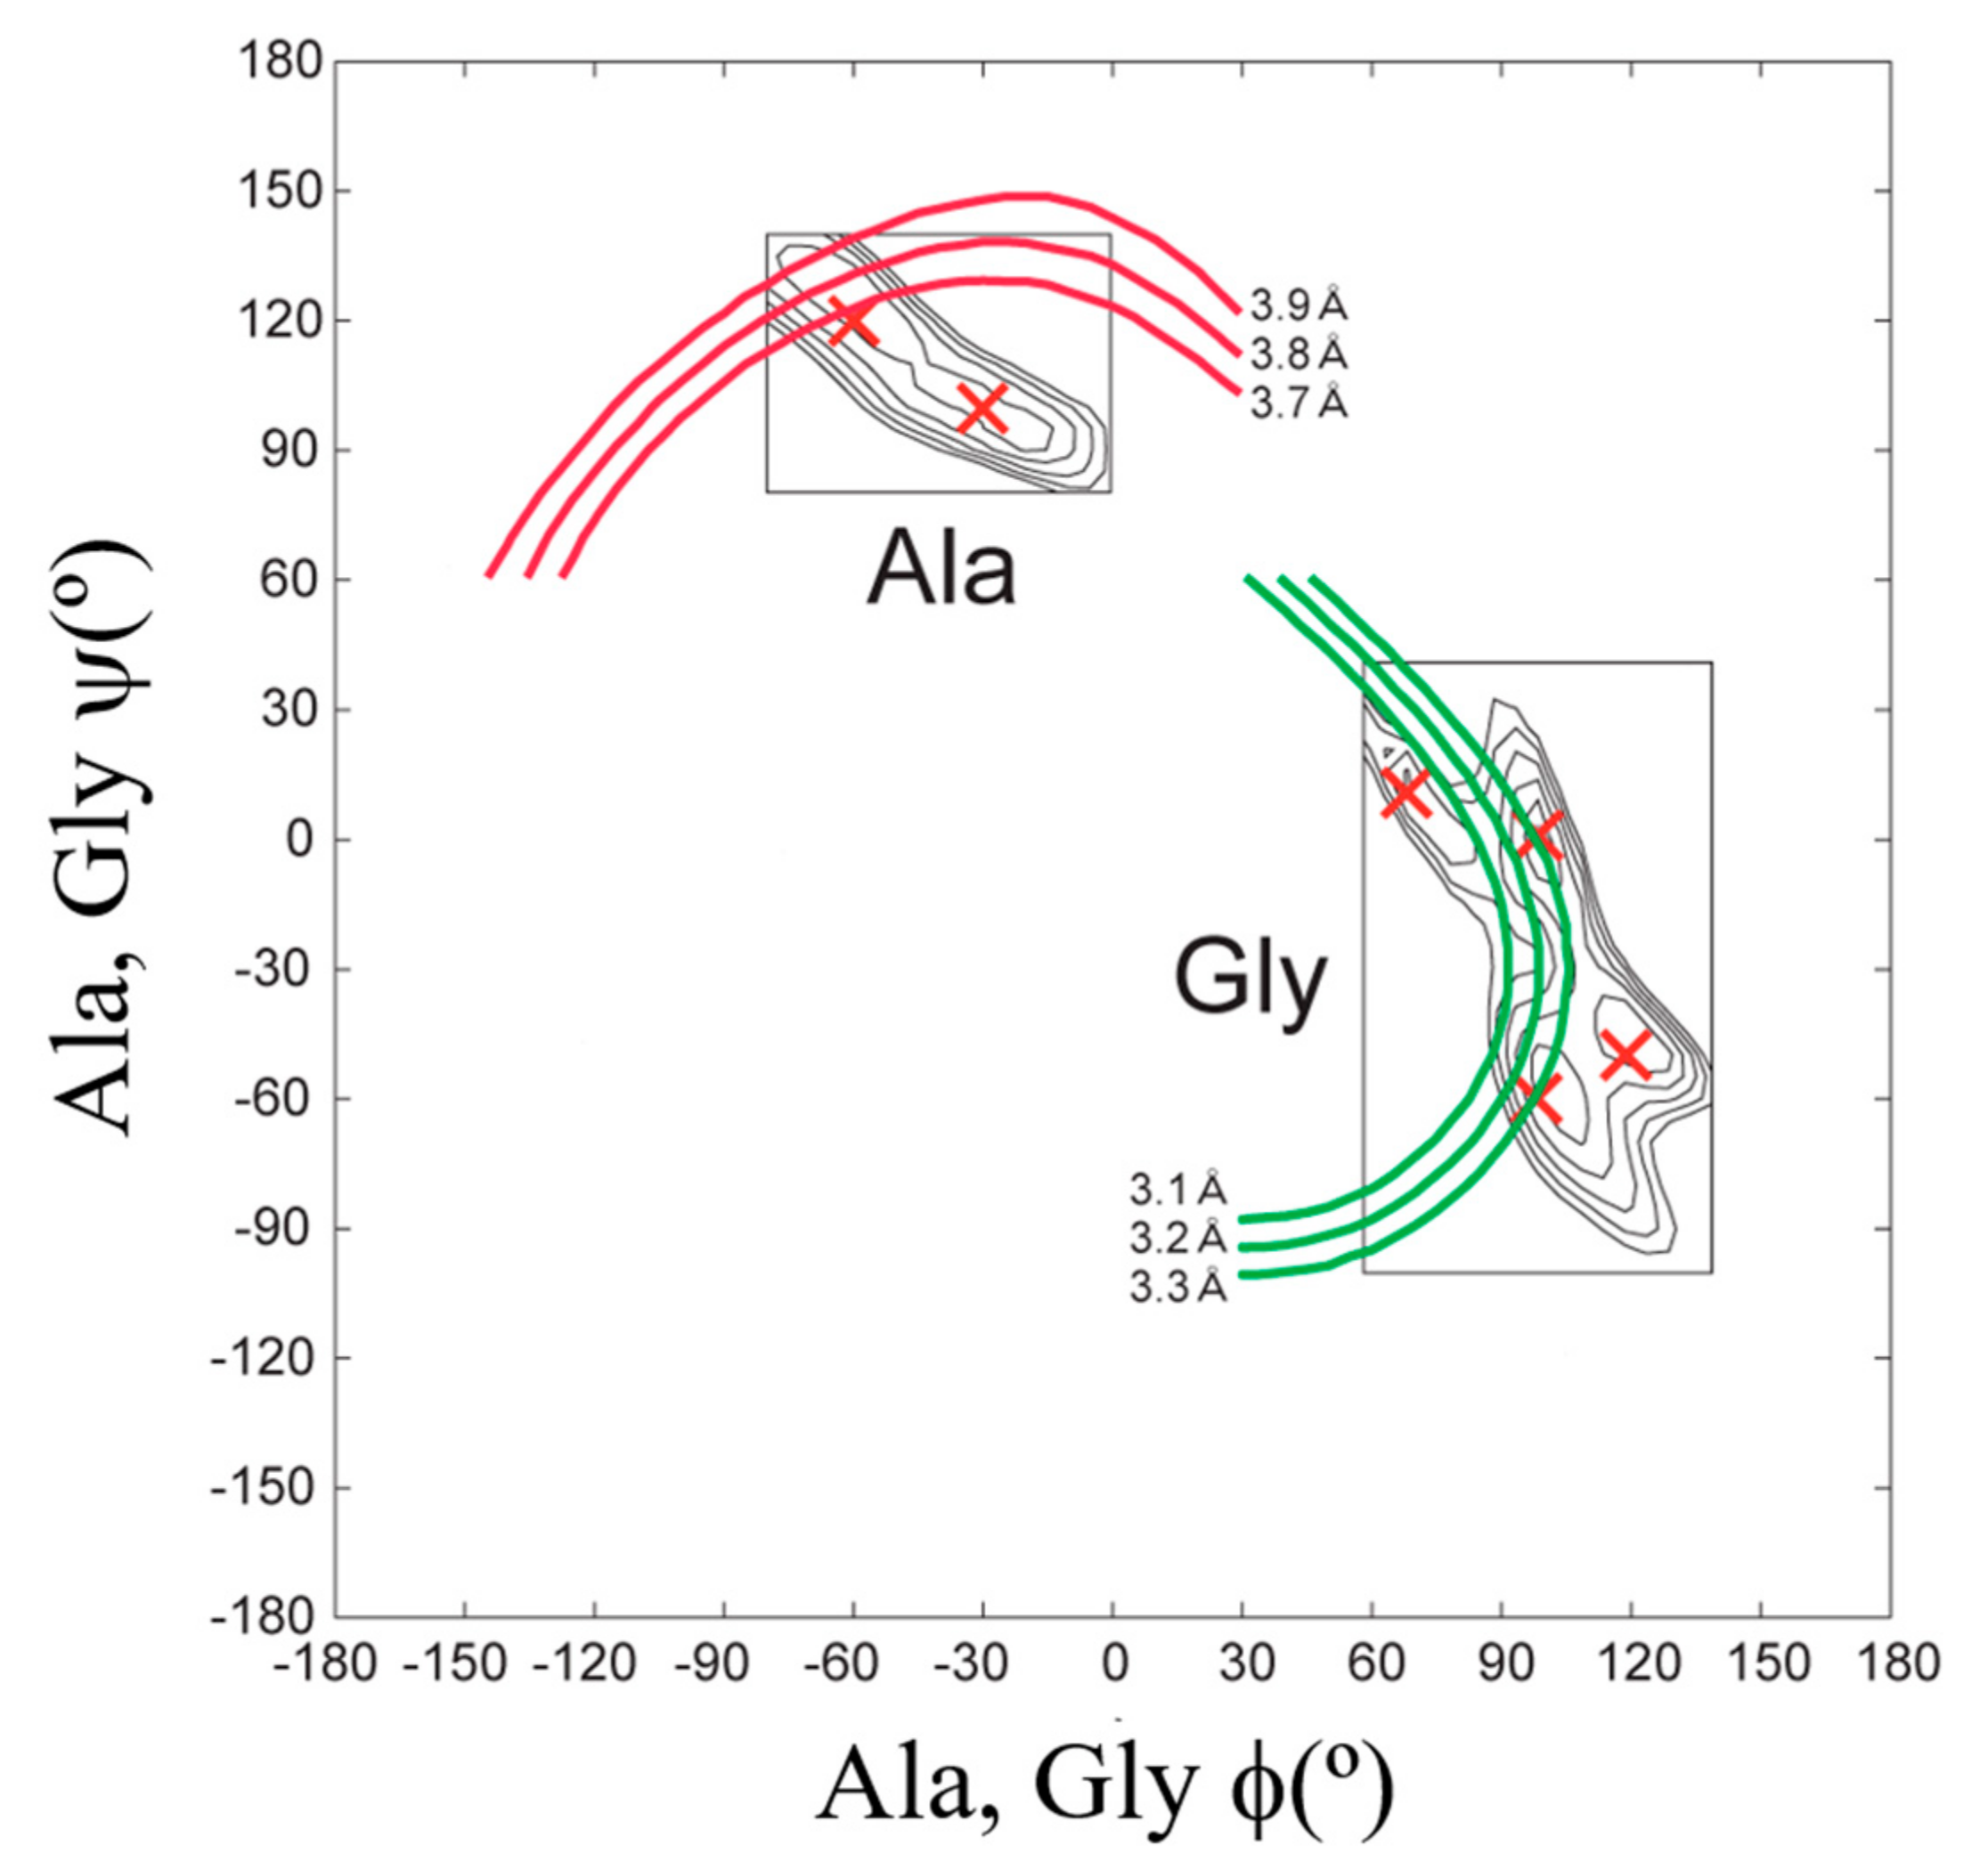
To determine the atomic coordinates of the silk I structure, the authors used 2D spin-diffusion solid-state NMR and rotational-echo double-resonance, REDOR NMR spectroscopies. The 2D spin-diffusion solid-state NMR is a powerful method to obtain the relative orientation of two chemical shift tensors of 13C labeled sites in the local molecular framework [57,58,59,60,61]. Here, this solid-state NMR technique was used to determine the torsion angles of both silk fibroin and (AG)15 with silk I form [21,22,62,63,64,65,66]. The 2D spin-diffusion NMR spectra of (AG)6A[1-13C]G14[1-13C]A15G(AG)7 and (AG)7[1-13C]A15[1-13C]G16(AG)7 were observed under off magic angle spinning [21,62], and showed together with the calculated spectra in Figure 4. The errors (RMSD) between the observed and calculated 2D spin-diffusion NMR spectra were mapped in Figure 5. There are two minima, (ϕ, ψ) = (−60°, 120°) and (−30°, 100°) for Ala15 residue, and four minima, (ϕ, ψ) = (70°, 10°), (100°, 0°), (120°, −50°) and (100°, −60°) for Gly16 residue (red X marks). For further determination of the torsion angles of silk I, the REDOR method was used [21,64,65,66,67,68,69,70,71,72].
REDOR is an excellent method to determine the interatomic distances from dipolar couplings iny solid. The atomic distance between the C=O carbon of Gly14 residue and NH nitrogen of Gly16 residue changes significantly by changing the torsion angles (ϕ, ψ) of Ala15 residue, and therefore, such atomic distance information can be used for a further structural constraint. The atomic distance between [1-13C]Gly14 and [15N]Gly16 in (AG)6A[1-13C]G14A15[15N]G16(AG)7 could be determined as 3.8 ± 0.1 Å. Thus, the contour lines of the atomic distances, including experimental errors, are shown, and the angles (ϕ, ψ) = (−60°,120°) are selected for the Ala15 residue in Figure 5.
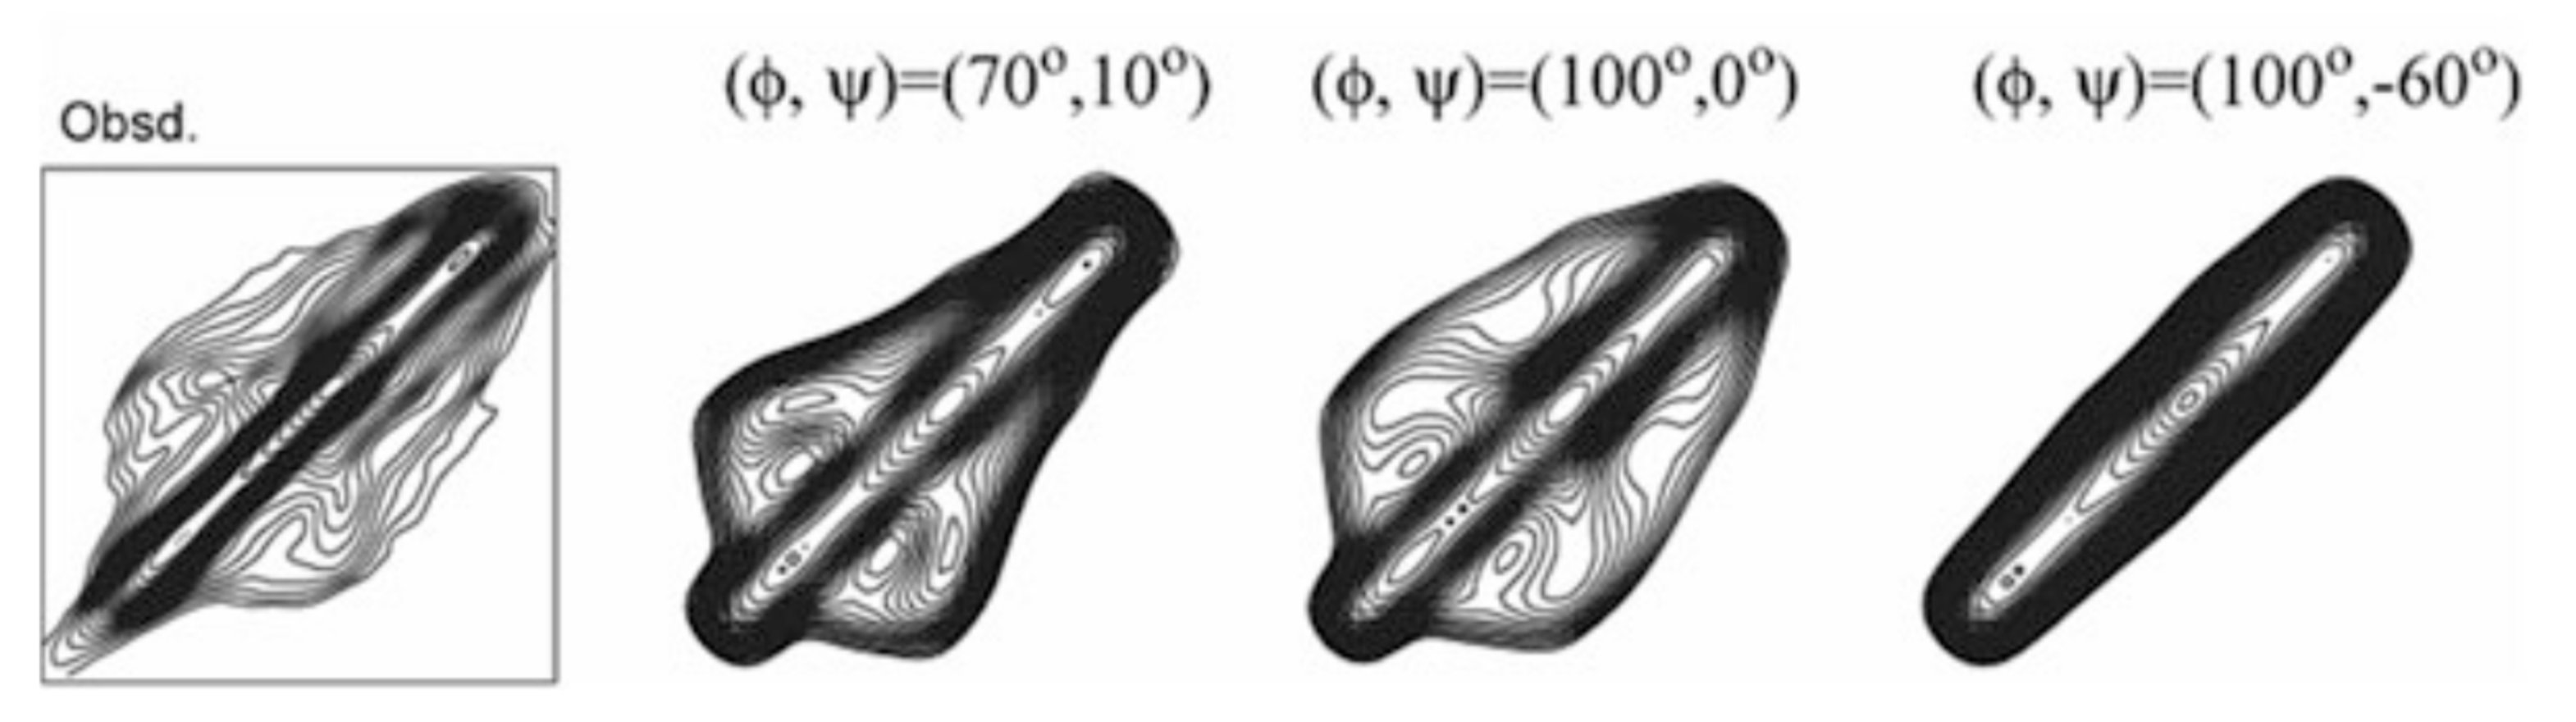
A good agreement between the observed and calculated 2D spin diffusion NMR spectra was obtained when the angles, (ϕ, ψ) = (−60°, 120°), as shown in Figure 4. Next, the atomic distance between [1-13C]Ala15 and [15N]Ala17 in (AG)7[1-13C]A15G16[15N]A17G(AG)6 was determined as 3.2 ± 0.1 Å from the REDOR experiment. By judging from the observed atomic distance constraint, the angle (ϕ, ψ) = (120°, −50°) was ruled out in Figure 5. Then the 2D spin-diffusion NMR spectrum of (AG)6A[1-13C]G14A15[1-13C]G16(AG)7 was used to select one from three possible torsion angles (φ, ψ) marked by X. The spectral pattern should depend on both torsion angles of Ala15 and Gly16 residues. However, the torsion angles of Ala15 residue were determined as (ϕ, ψ) = (−60°, 120°) mentioned above. Therefore, the spectral pattern depends on only the torsion angle of Gly16 residue. Three spectral patterns were calculated for the torsion angles, (ϕ, ψ) = (70°, 10°), (ϕ, ψ) = (100°, 0°) and (ϕ, ψ) = (100°, −60°), as shown in Figure 6. By comparing the observed and calculated spectra, the torsion angles (ϕ, ψ) = (100°, −60°) could be excluded. However, it is difficult to select the torsion angles (ϕ, ψ) = (70°, 10°) or (ϕ, ψ) = (100°, 0°) because both calculated patterns can reproduce the observed spectrum well. Therefore, X-ray diffraction data of the crystalline fraction of B. mori silk fibroin with silk I structure reported by Lotz et al. [17,73], and Okuyama et al. [48,74] were used to determine the torsion angles of Gly16 residue.
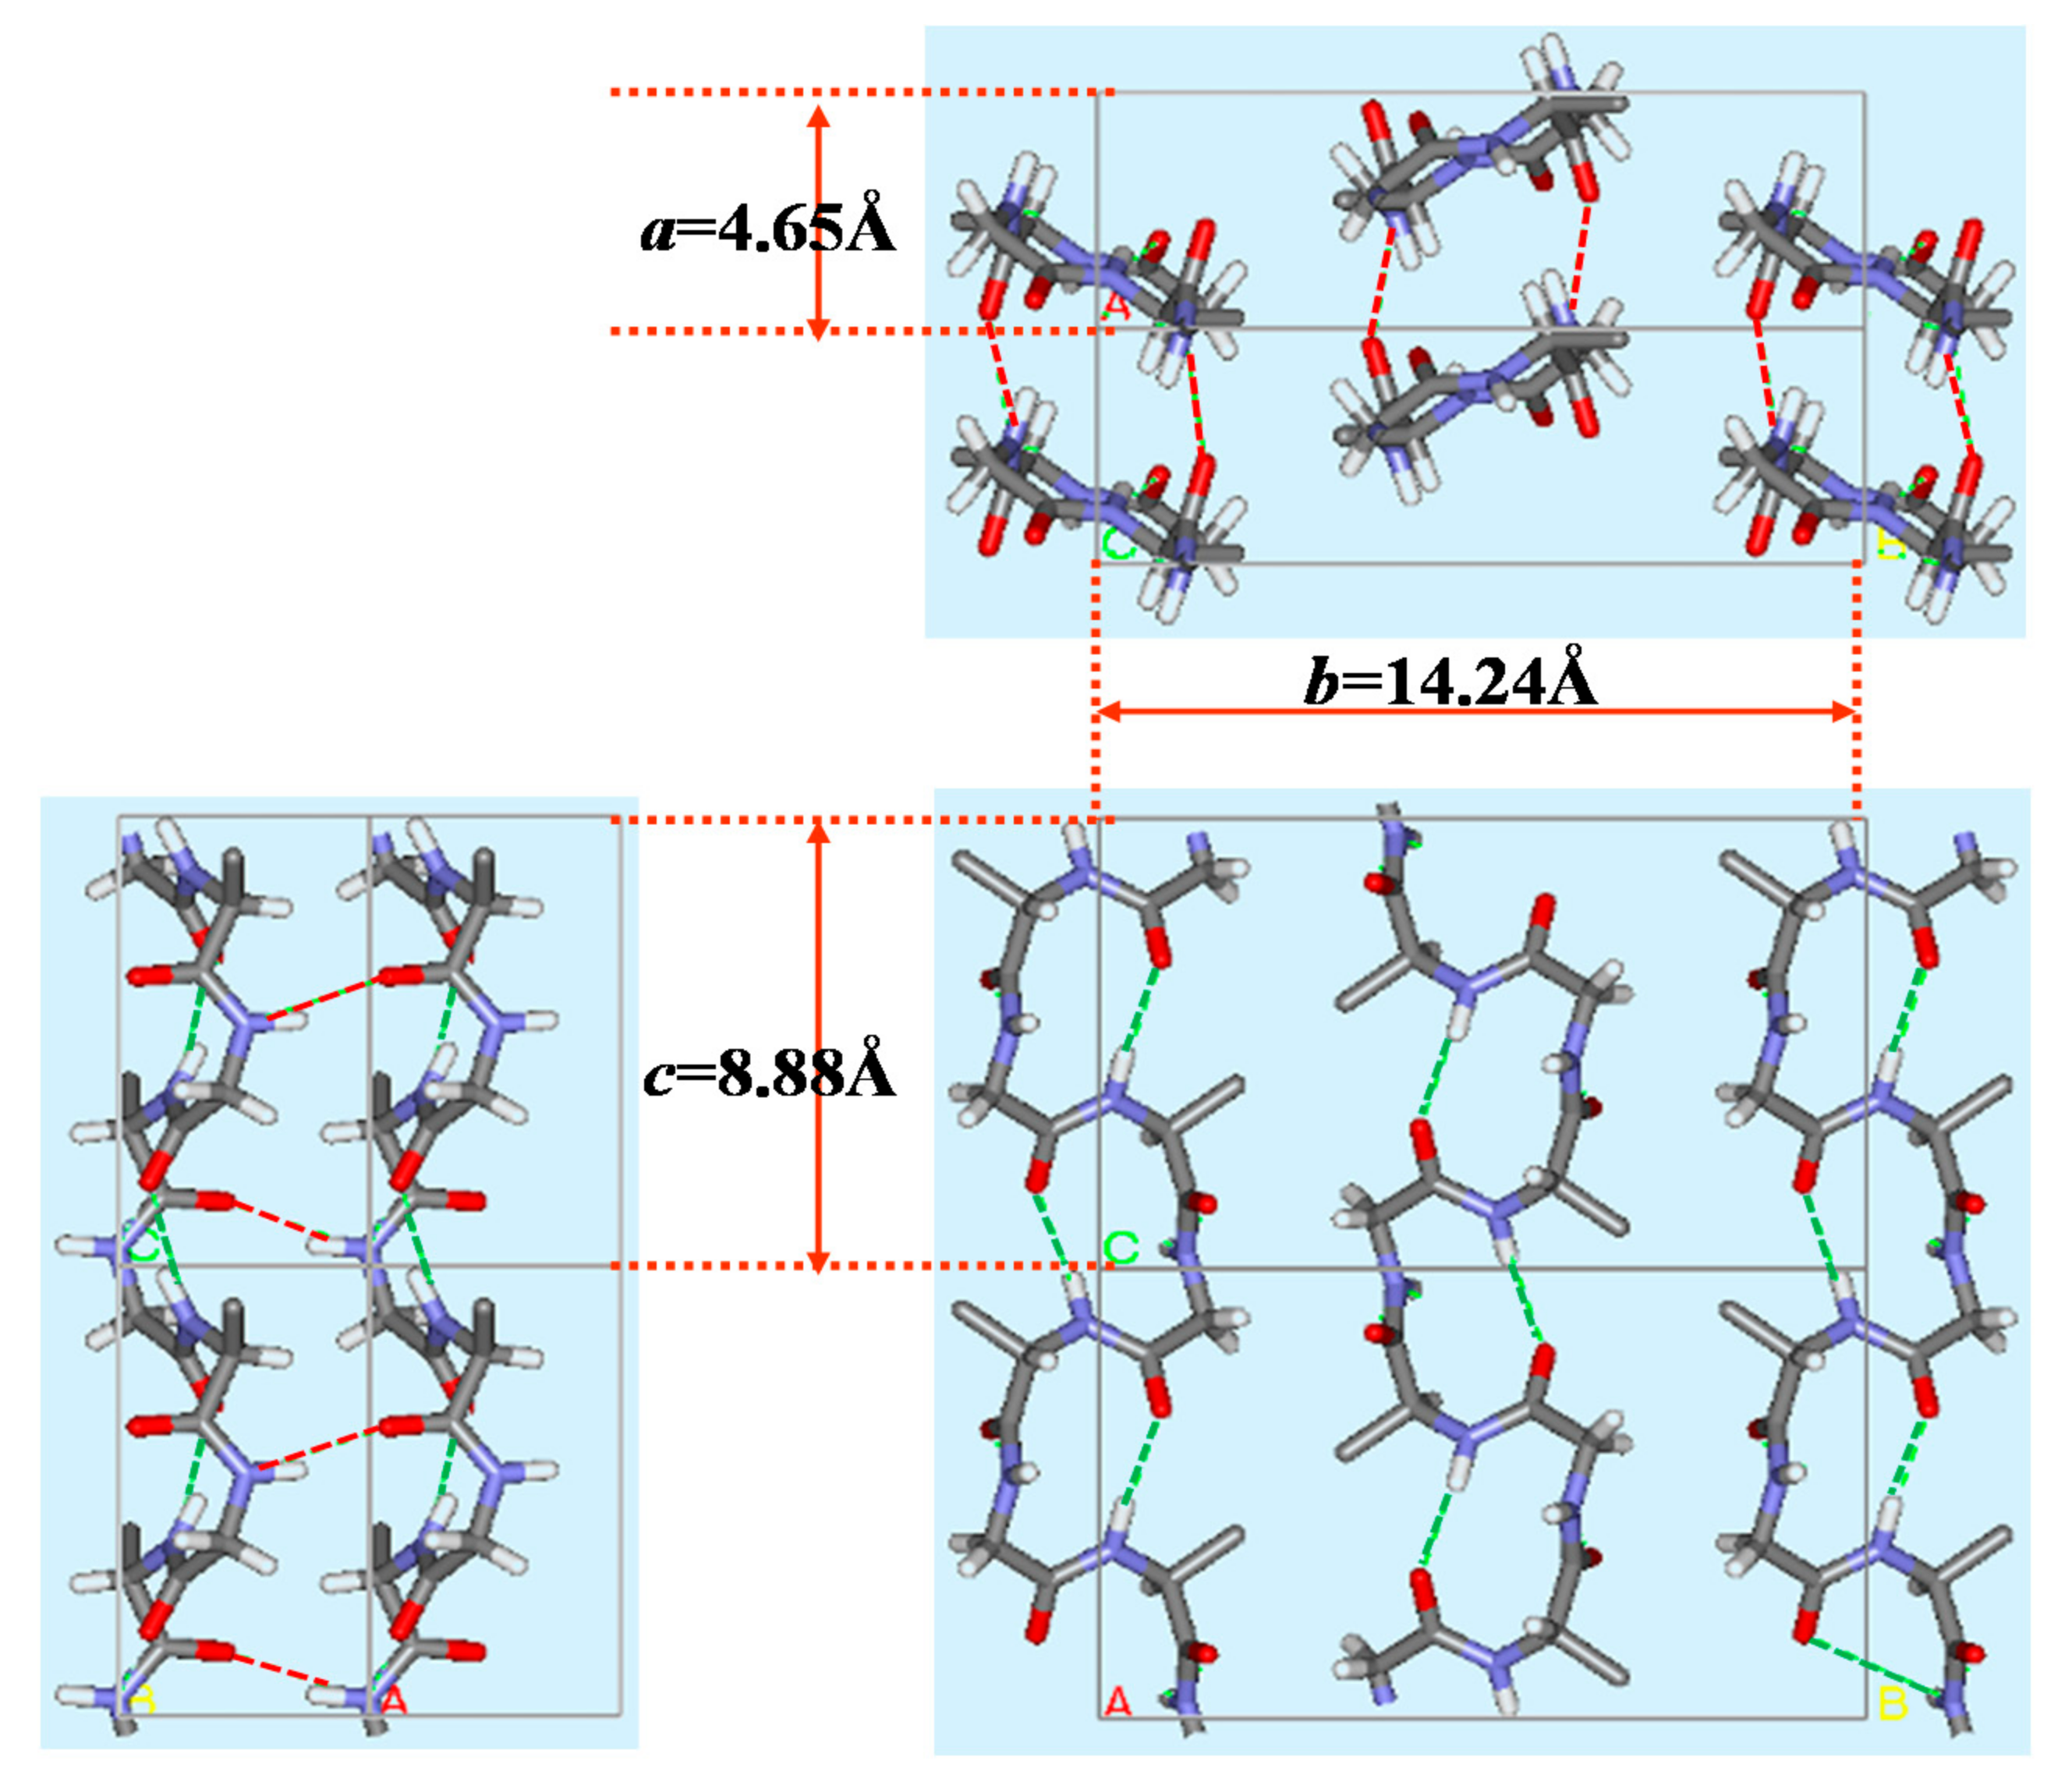
The X-ray diffraction data of silk I were reported as follows. The unit cell and the space group were orthorhombic and P212121, respectively. The lattice constants were a = 4.65 Å, b = 14.24 Å and c = 8.88 Å, α = β = γ = 90°. In a unit cell, four repeats of, Ala-Gly, and two 21-helix chains in an antiparallel manner are presented. Then the structure of silk I was calculated, including intermolecular chain arrangement [17,22,48,73,74,75]. The initial torsion angle for LALS (Linked-Atom Least-Squares) calculation [22,48,74] was (ϕ, ψ) = (−60°, 120°) for Ala residue, but two candidates, (ϕ, ψ) = (70°, 10°) and (ϕ, ψ) = (100°, 0°) for Gly residue as mentioned above. The calculated results are summarized in Table 1. Although the LALS calculations were performed for two cases, the same set of the torsion angles, (ϕ, ψ) = (−62°, 125°) for Ala residue and (ϕ, ψ) = (77°, 10°) for Gly residue was obtained. Namely, these torsion angles were obtained with R factor 10% independent of the initial sets of the torsion angles of Gly residues.
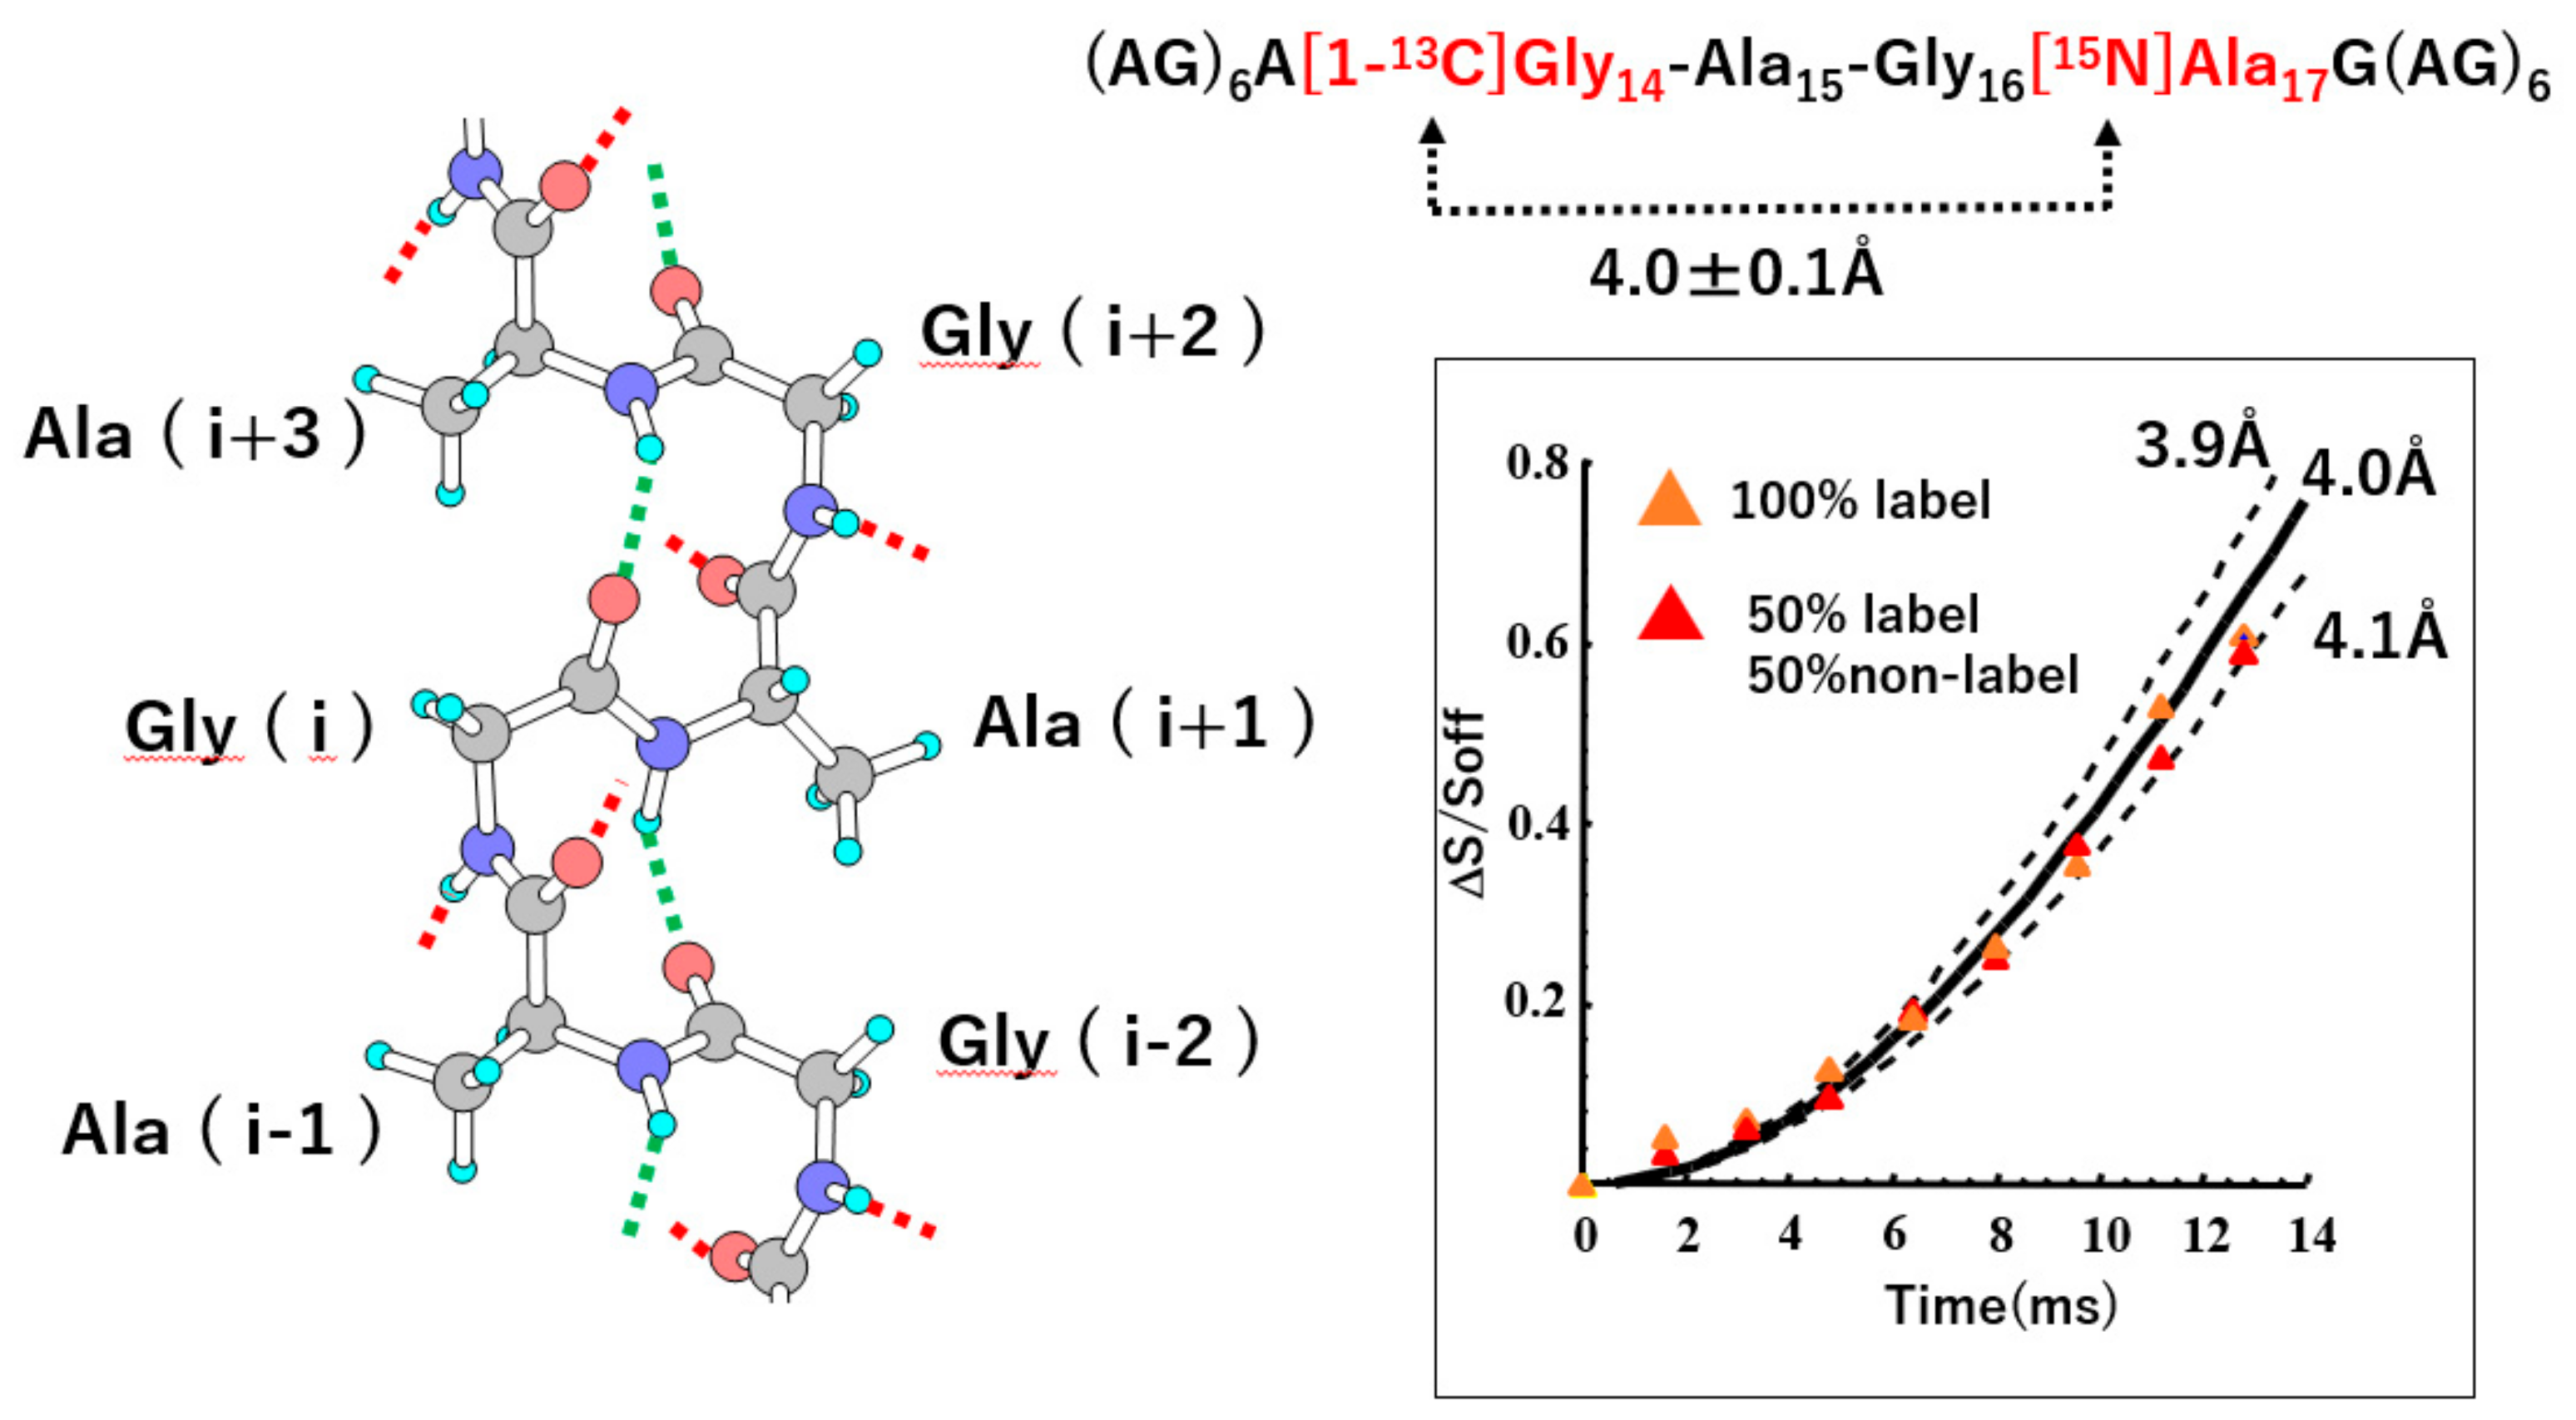
The final silk I structure of (AG)n with intra-(green) and inter-(red) hydrogen bonds is shown in Figure 7 [21,22,66]. The most definite evidence of type II β-turn structure is the presence of an intramolecular hydrogen bond formation (green) between the carbonyl oxygen atom of the (i)-th Gly residue and the amide hydrogen atom of the (i + 3)-th Ala residue in Figure 8.
Therefore, REDOR experiment was performed to determine the atomic distance between [1-13C]Gly14 and [15N]Ala17 nuclei in (AG)6A[1-13C]G14A15G16[15N]A17G(AG)6. The observed distance was 4.0 ± 0.1 Å, independent of the dilution of natural abundance (AG)15, as shown in Figure 8. The corresponding distance of these atoms was calculated to be 3.9 Å in the silk I model of Figure 7, which agrees with the observed distance, 4.0 ± 0.1 Å. This short distance supports the formation of an intramolecular hydrogen bond between these two groups and type II β-turn structure clearly.
The type II β-turn structure is characterized by the alternating sequence of X-Gly, where X is another amino acid residue [76]. Namely, if the (i)-th position in the β-turn type II structure shown in Figure 8 is occupied by the residues other than Gly residue, the conformation of the backbone chain will be energetically unfavorable, due to steric hindrance between the methyl group of the (i + 3)-th Ala and the side chain of the (i)-th residue. Thus, to form the type II β-turn structure, the primary structure of the crystalline regions in B. mori silk fibroin should be an alternative copolymer, X-Gly. This means a close relationship between the primary and secondary structures of silk fibroin before spinning. In addition, this type II β-turn structure is easy to form lamella structure (silk II) with distorted β-turn formed by repetitive folding using β-turns every eighth amino acid in an antipolar arrangement as reported previously by authors [16,19].
4. Silk I Structure Determined from Solution NMR
Solution NMR was used to determine the solution structure of B. mori silk fibroin before spinning. The liquid silk was obtained by removing it from the middle silk gland [39,40,63,75,76]. The uniformly 13C-labeled liquid silk was biosynthetically prepared by feeding U-13C D-glucose in addition to an artificial diet to silkworm larvae. Several 3D NMR spectra were observed to assign the NMR spectra and obtain the chemical shift data of backbone 13Cα, 13Cβ, 13CO, 1Hα, 1HN, and 15N nuclei.
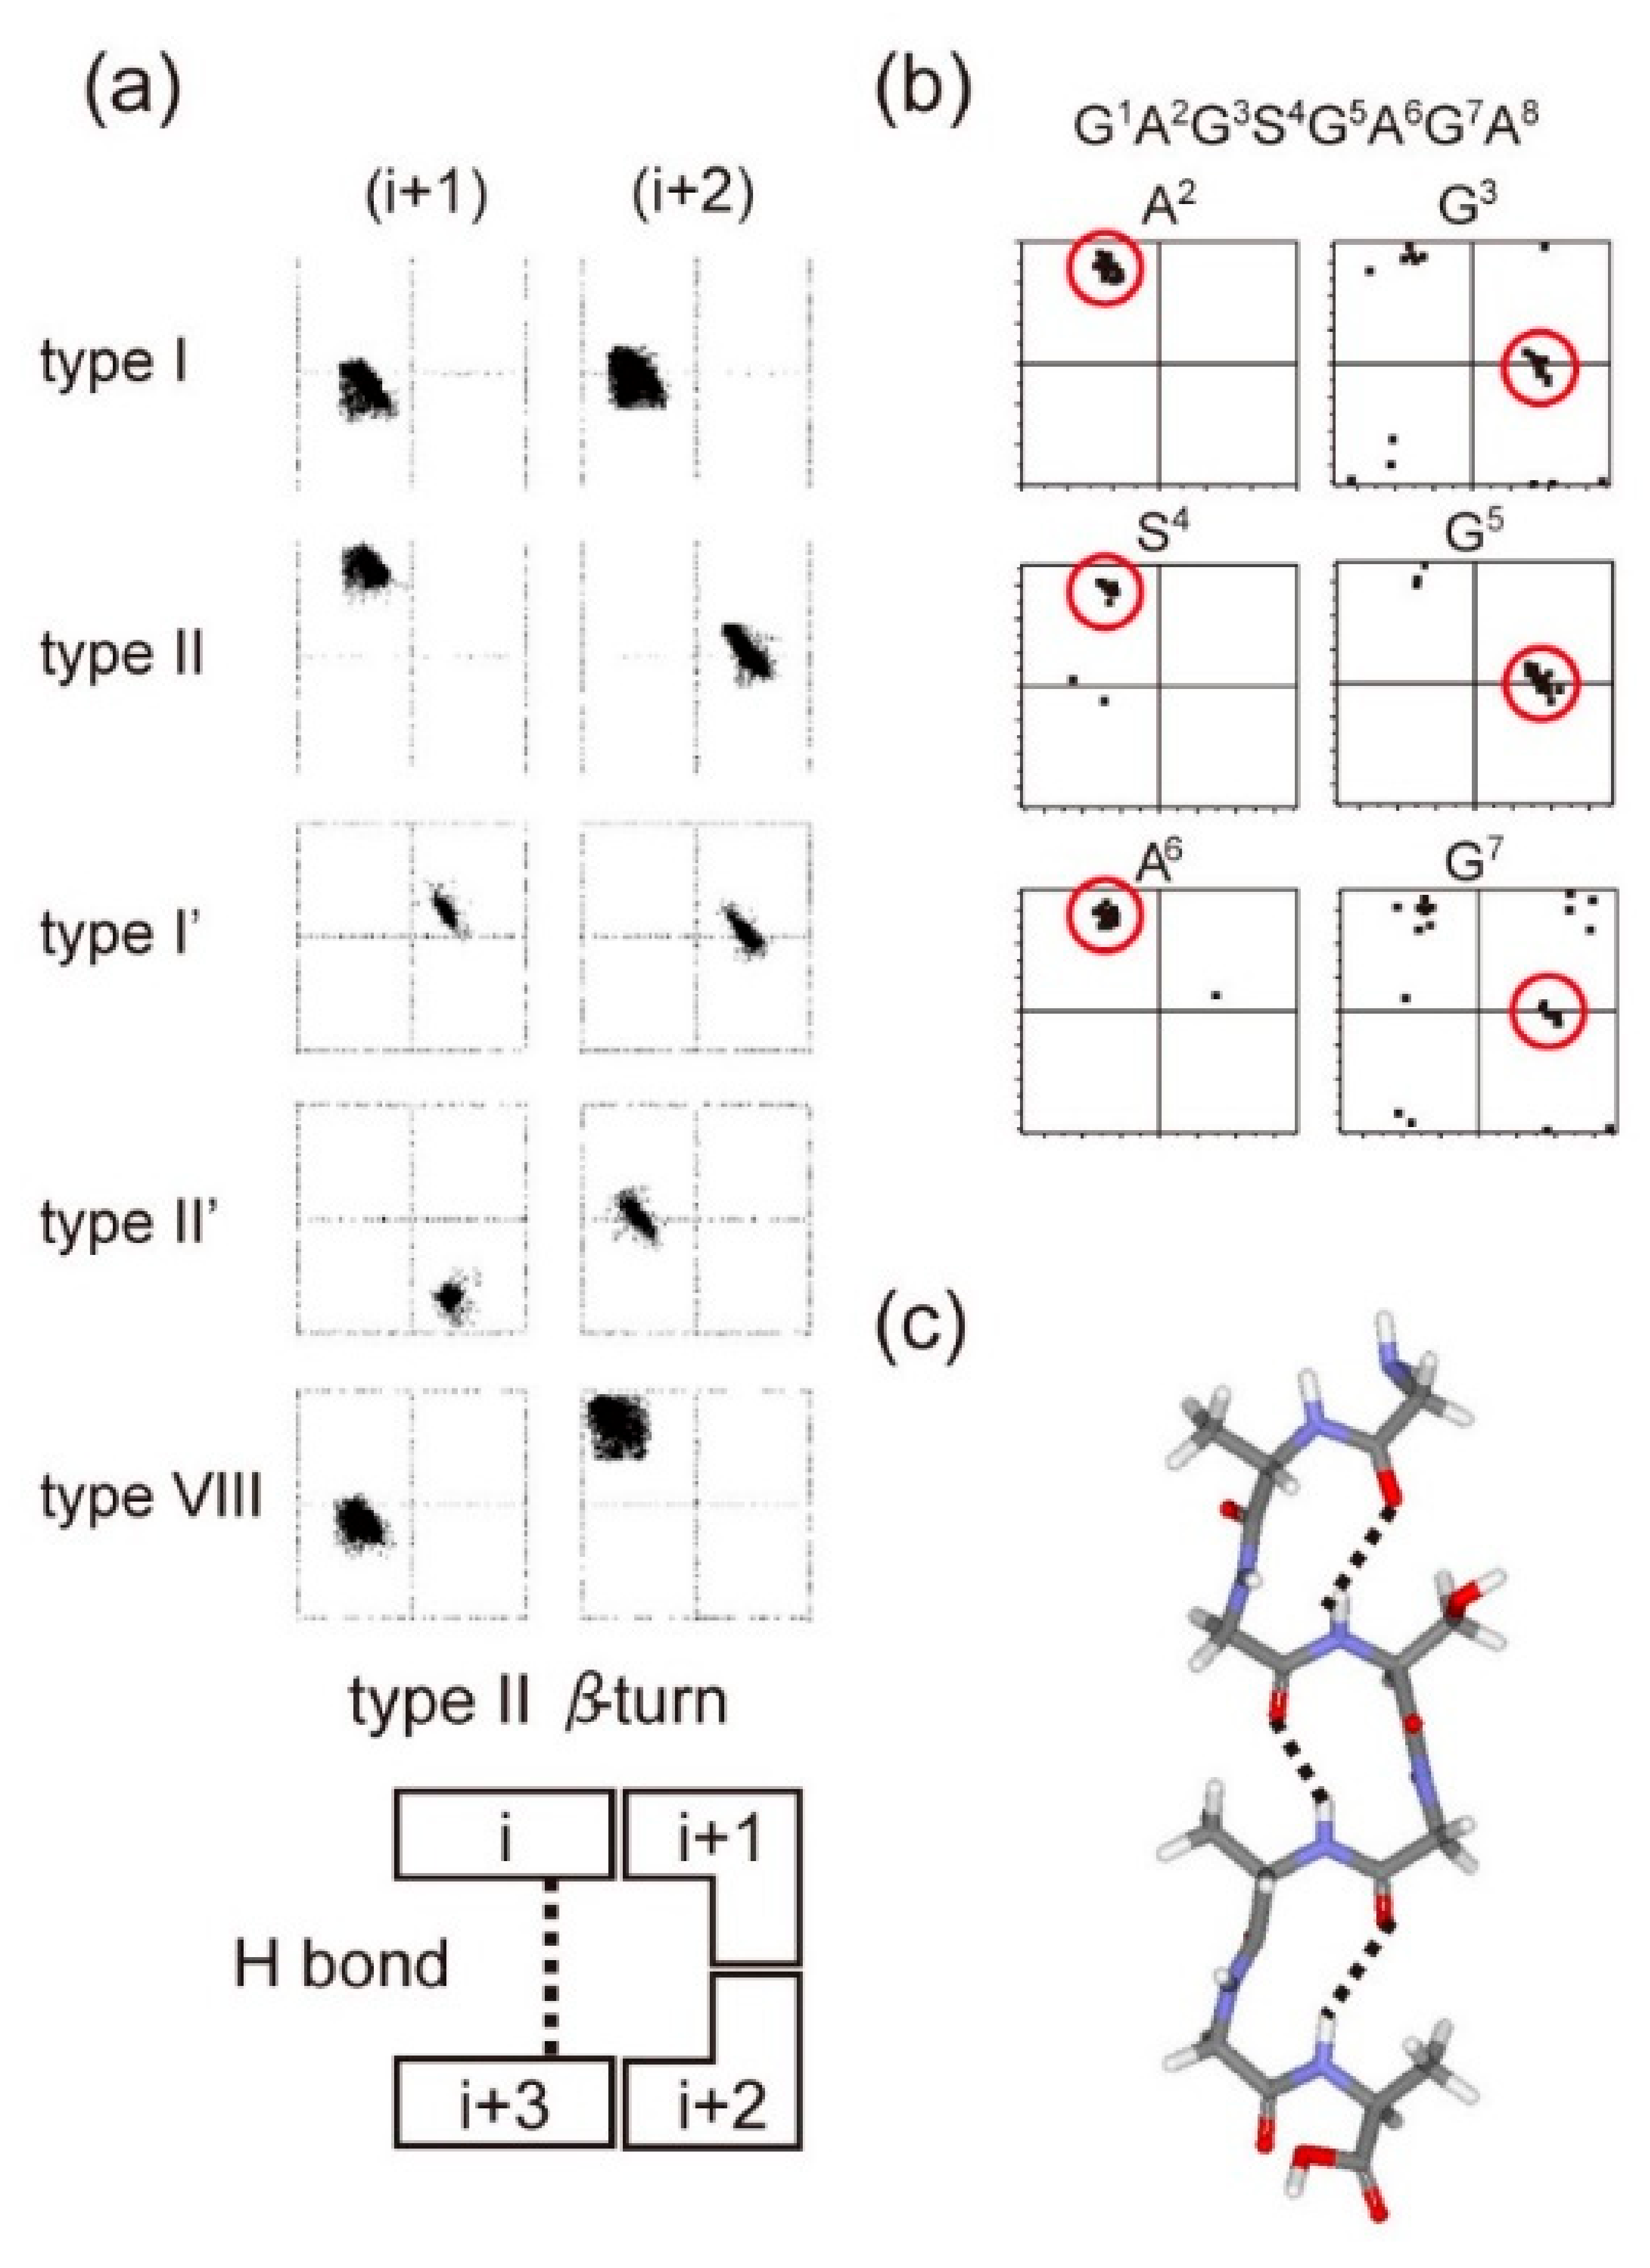
The torsion angle constraints for the main chain of silk fibroin were derived from the backbone chemical shifts using TALOS-N [77,78]. Moreover, to obtain spatial interproton distance information, the intensities of inter residue NOE cross-peaks were obtained. The combinations of torsion angle constraints determined from NMR data are consistent with only repeated type II β-turn structure among several types of β-turn structures for the tandem repeated sequences (GAGSGA)n of B. mori silk fibroin (Figure 9) [76]. This structure determined from solution NMR is essentially the same as silk I structure in a solid-state determined above (Figure 7).
The local structure of each residue is similar to that of random coil peptides [79,80,81,82], but is more ordered. Namely, the structural fluctuations of Gly, Ala, and Ser residues are relatively large in random coil form of silk fibroin in the diluted aqueous solution, but the fluctuations decrease, due to aggregation of the silk fibroin molecules with increasing the concentration [75]. This is consistent with an increased population of silk I [83]. In other words, the highly concentrated silk solution contained in the middle silk glands has residues in energetically favored conformations close to average random coil values [39,40], but forms a hydrogen-bonded network that keeps it in a repeated type II β-turn structure [21,22]. These data and insights became the starting point to understand the molecular mechanisms behind the flow behavior generating the high-performance silk fibers from viewpoints of rheology [83,84,85].
5. Verification of Silk I Structure (Type II β-Turn)
At first, verification of type II β-turn structure of silk I proposed here was performed from a comparison of previous silk I models. So far, silk I structure has been studied by the combination of X-ray diffraction studies and conformational energy calculations of silk I by Lotz and Keith [17,73], Okuyama et al. [48,74], and Fossey et al. [51] without using the simple IR data. In the Lotz and Keith model [17,73], the Ala residues are in a β-sheet structure and Gly residues in a left-handed or right-handed α-helical conformation, i.e., Ala (ϕ = −105° and ψ = 112°) and Gly (ϕ = 80° and ψ = 50°) or Ala (ϕ = −125° and ψ = 88°) and Gly (ϕ = −50° and ψ = −76°). The Fossey model has a right-handed and left-handed twisting of sheets, with approximately equal magnitudes of the twist, Ala (ϕ = −80° and ψ = 150°) and Gly (ϕ = −150° and ψ = 80°). The Okuyama model is Ala (ϕ = −110° and ψ = −2°) and Gly (ϕ = 73° and ψ = −102°). Therefore, the 2D spin diffusion NMR spectra were calculated with the torsion angles of each model and compared with the observed spectra shown in Figure 4. The agreement of the calculated spectral pattern with the observed spectrum was poor for all these models [22] (Data not shown), and only the type II β-turn model proposed by authors can reproduce the observed spectrum very well (Figure 4).
Next, the structure of silk I, including the intermolecular arrangement proposed in Figure 7, was examined from the determination of accurate 1H positions of the structure and the theoretical chemical shift calculation of the 1H, 13C, and 15N nuclei [86]. Namely, the coordinates of heteroatoms, such as C, N, and O atoms, of type II β-turn structure of silk I were determined, as shown in Figure 7. However, the coordinate of H atoms was uncertain. Because H atoms are located on the surface of the silk fibroin molecule, the coordinates of H atoms are sensitive to the intra- and intermolecular arrangement. Therefore, it is important to determine the position of the H atom, but 1H NMR spectra in a solid-state are generally very broad contrary to 1H solution NMR spectra [76] because of strong dipolar coupling. The authors have developed a 1 mm micro-coil MAS NMR probe-head with high speed spinning [87]. Therefore, this micro-coil MAS NMR probe-head with a high spinning rate of 70 kHz was tried to observe a well-resolved 1H NMR spectrum of (AG)15 using an ultrahigh field NMR spectrometer at 920 MHz.
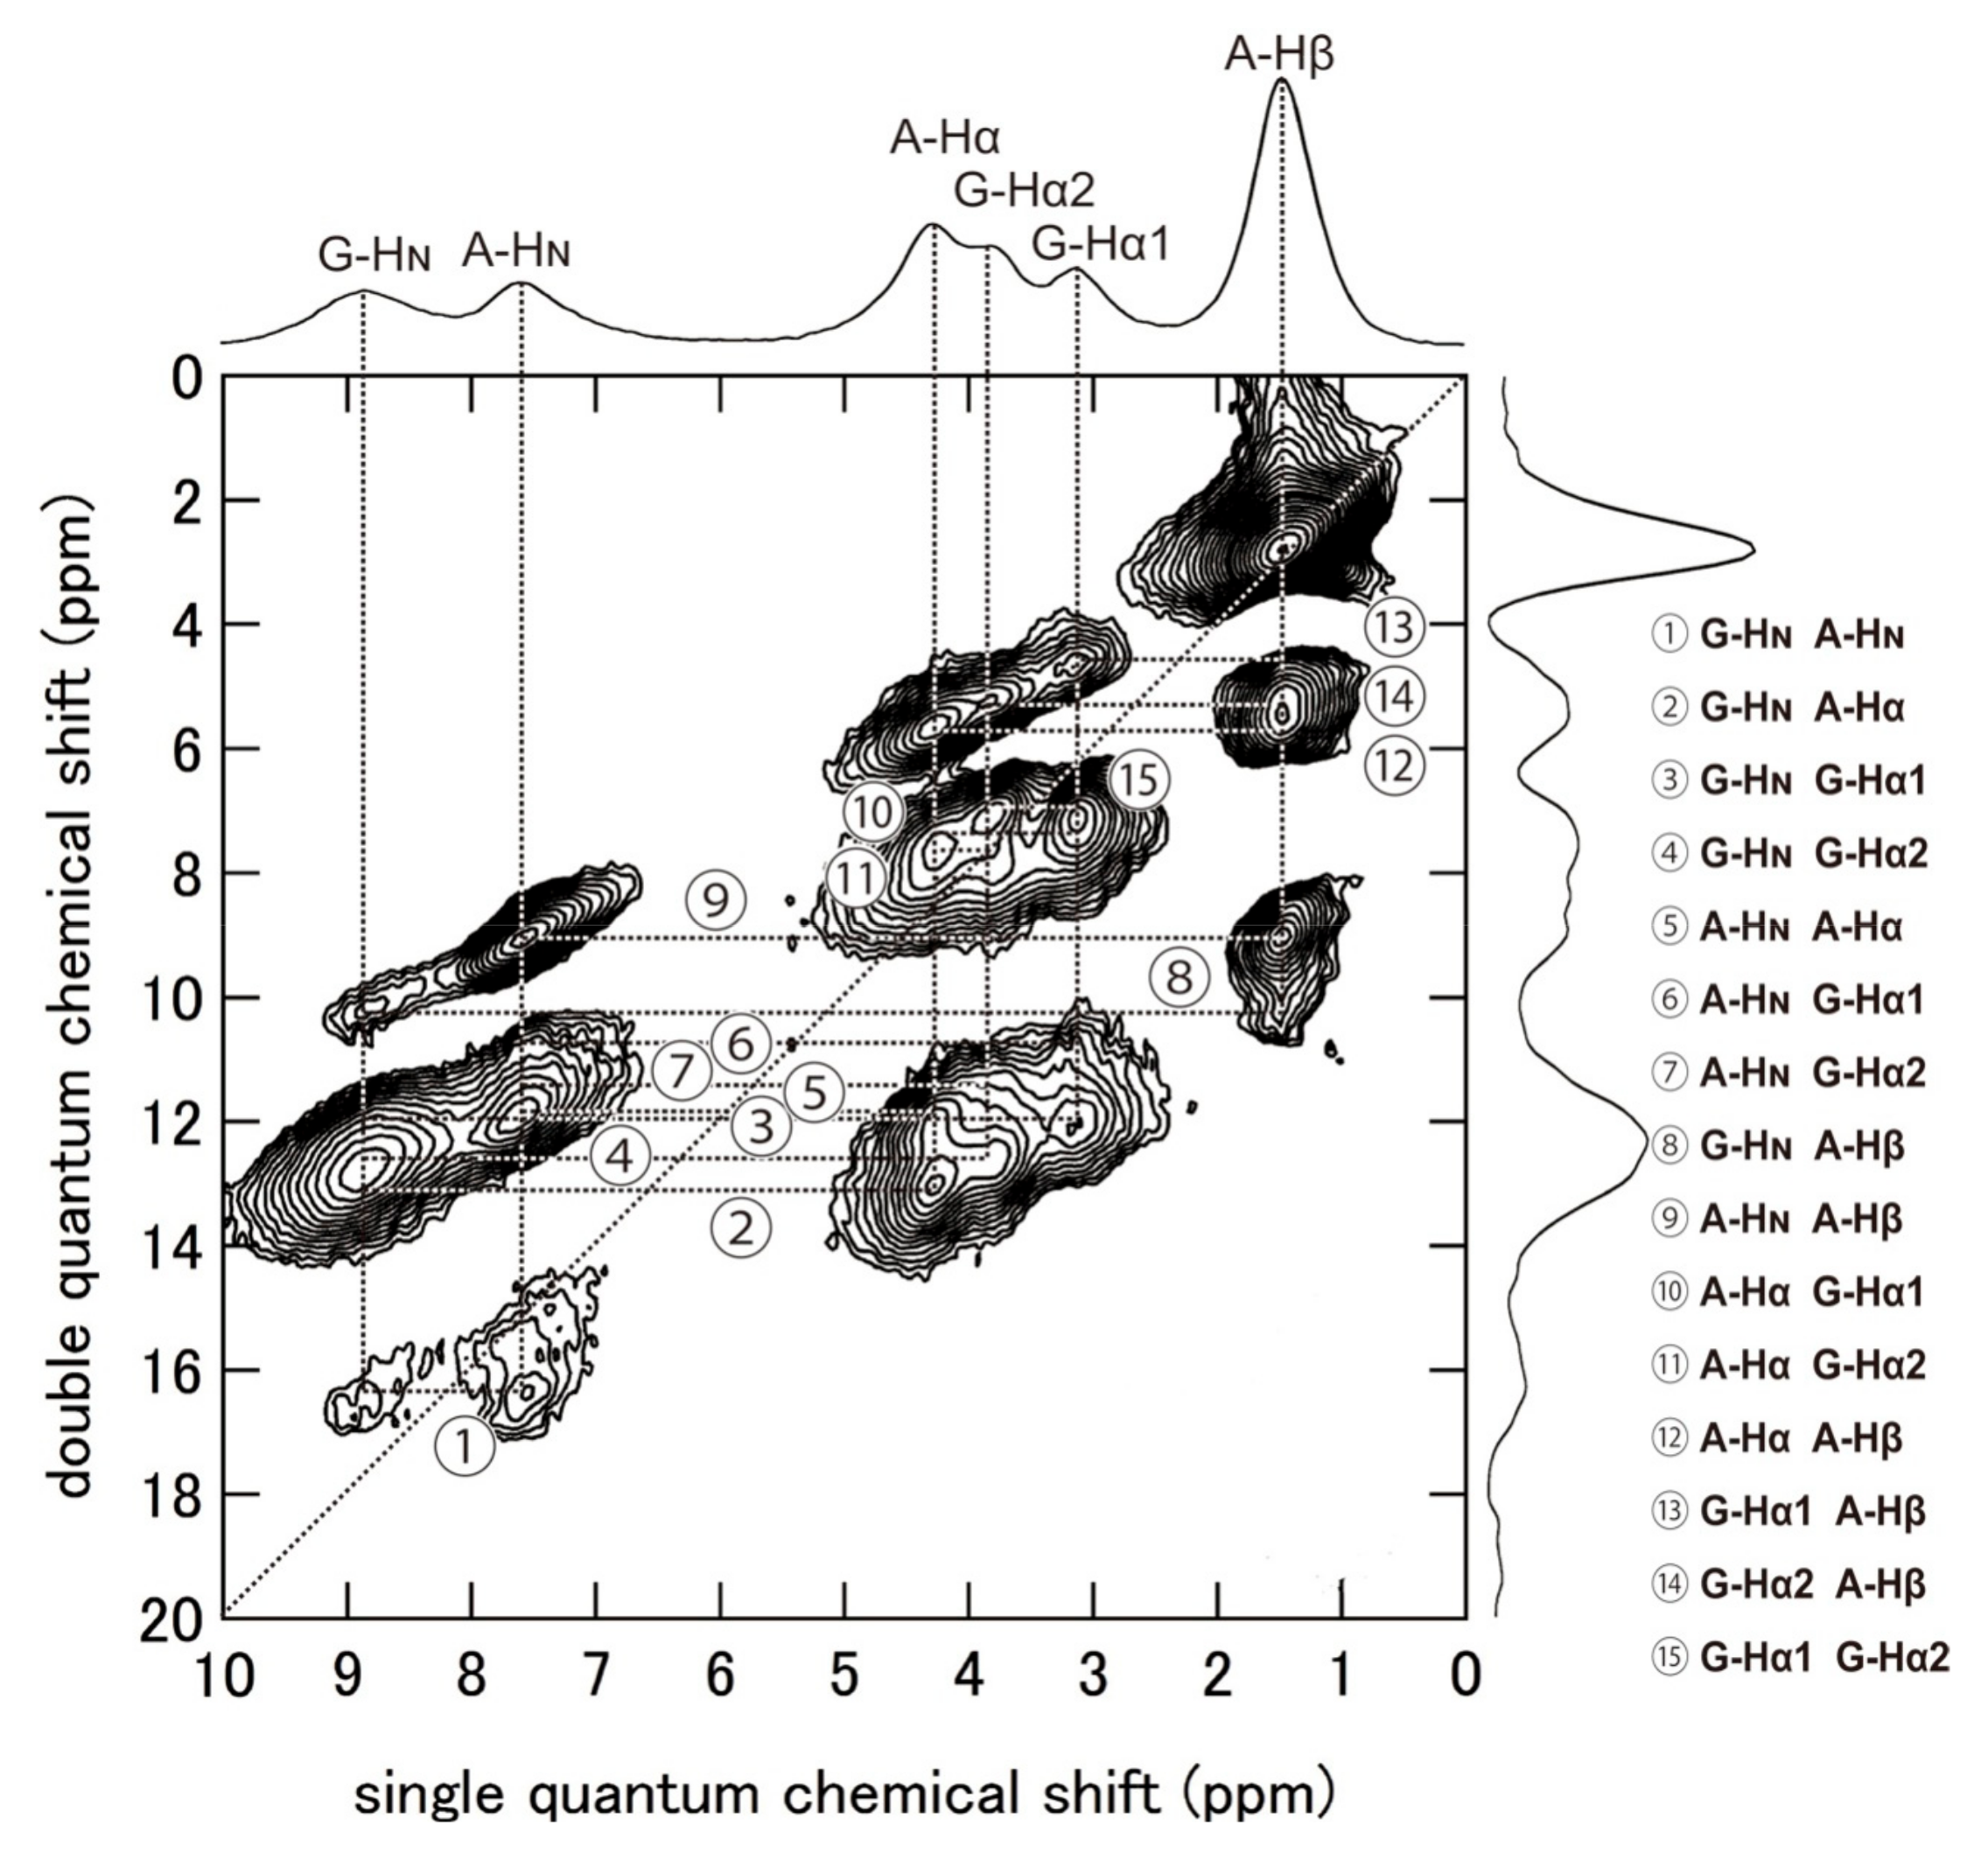
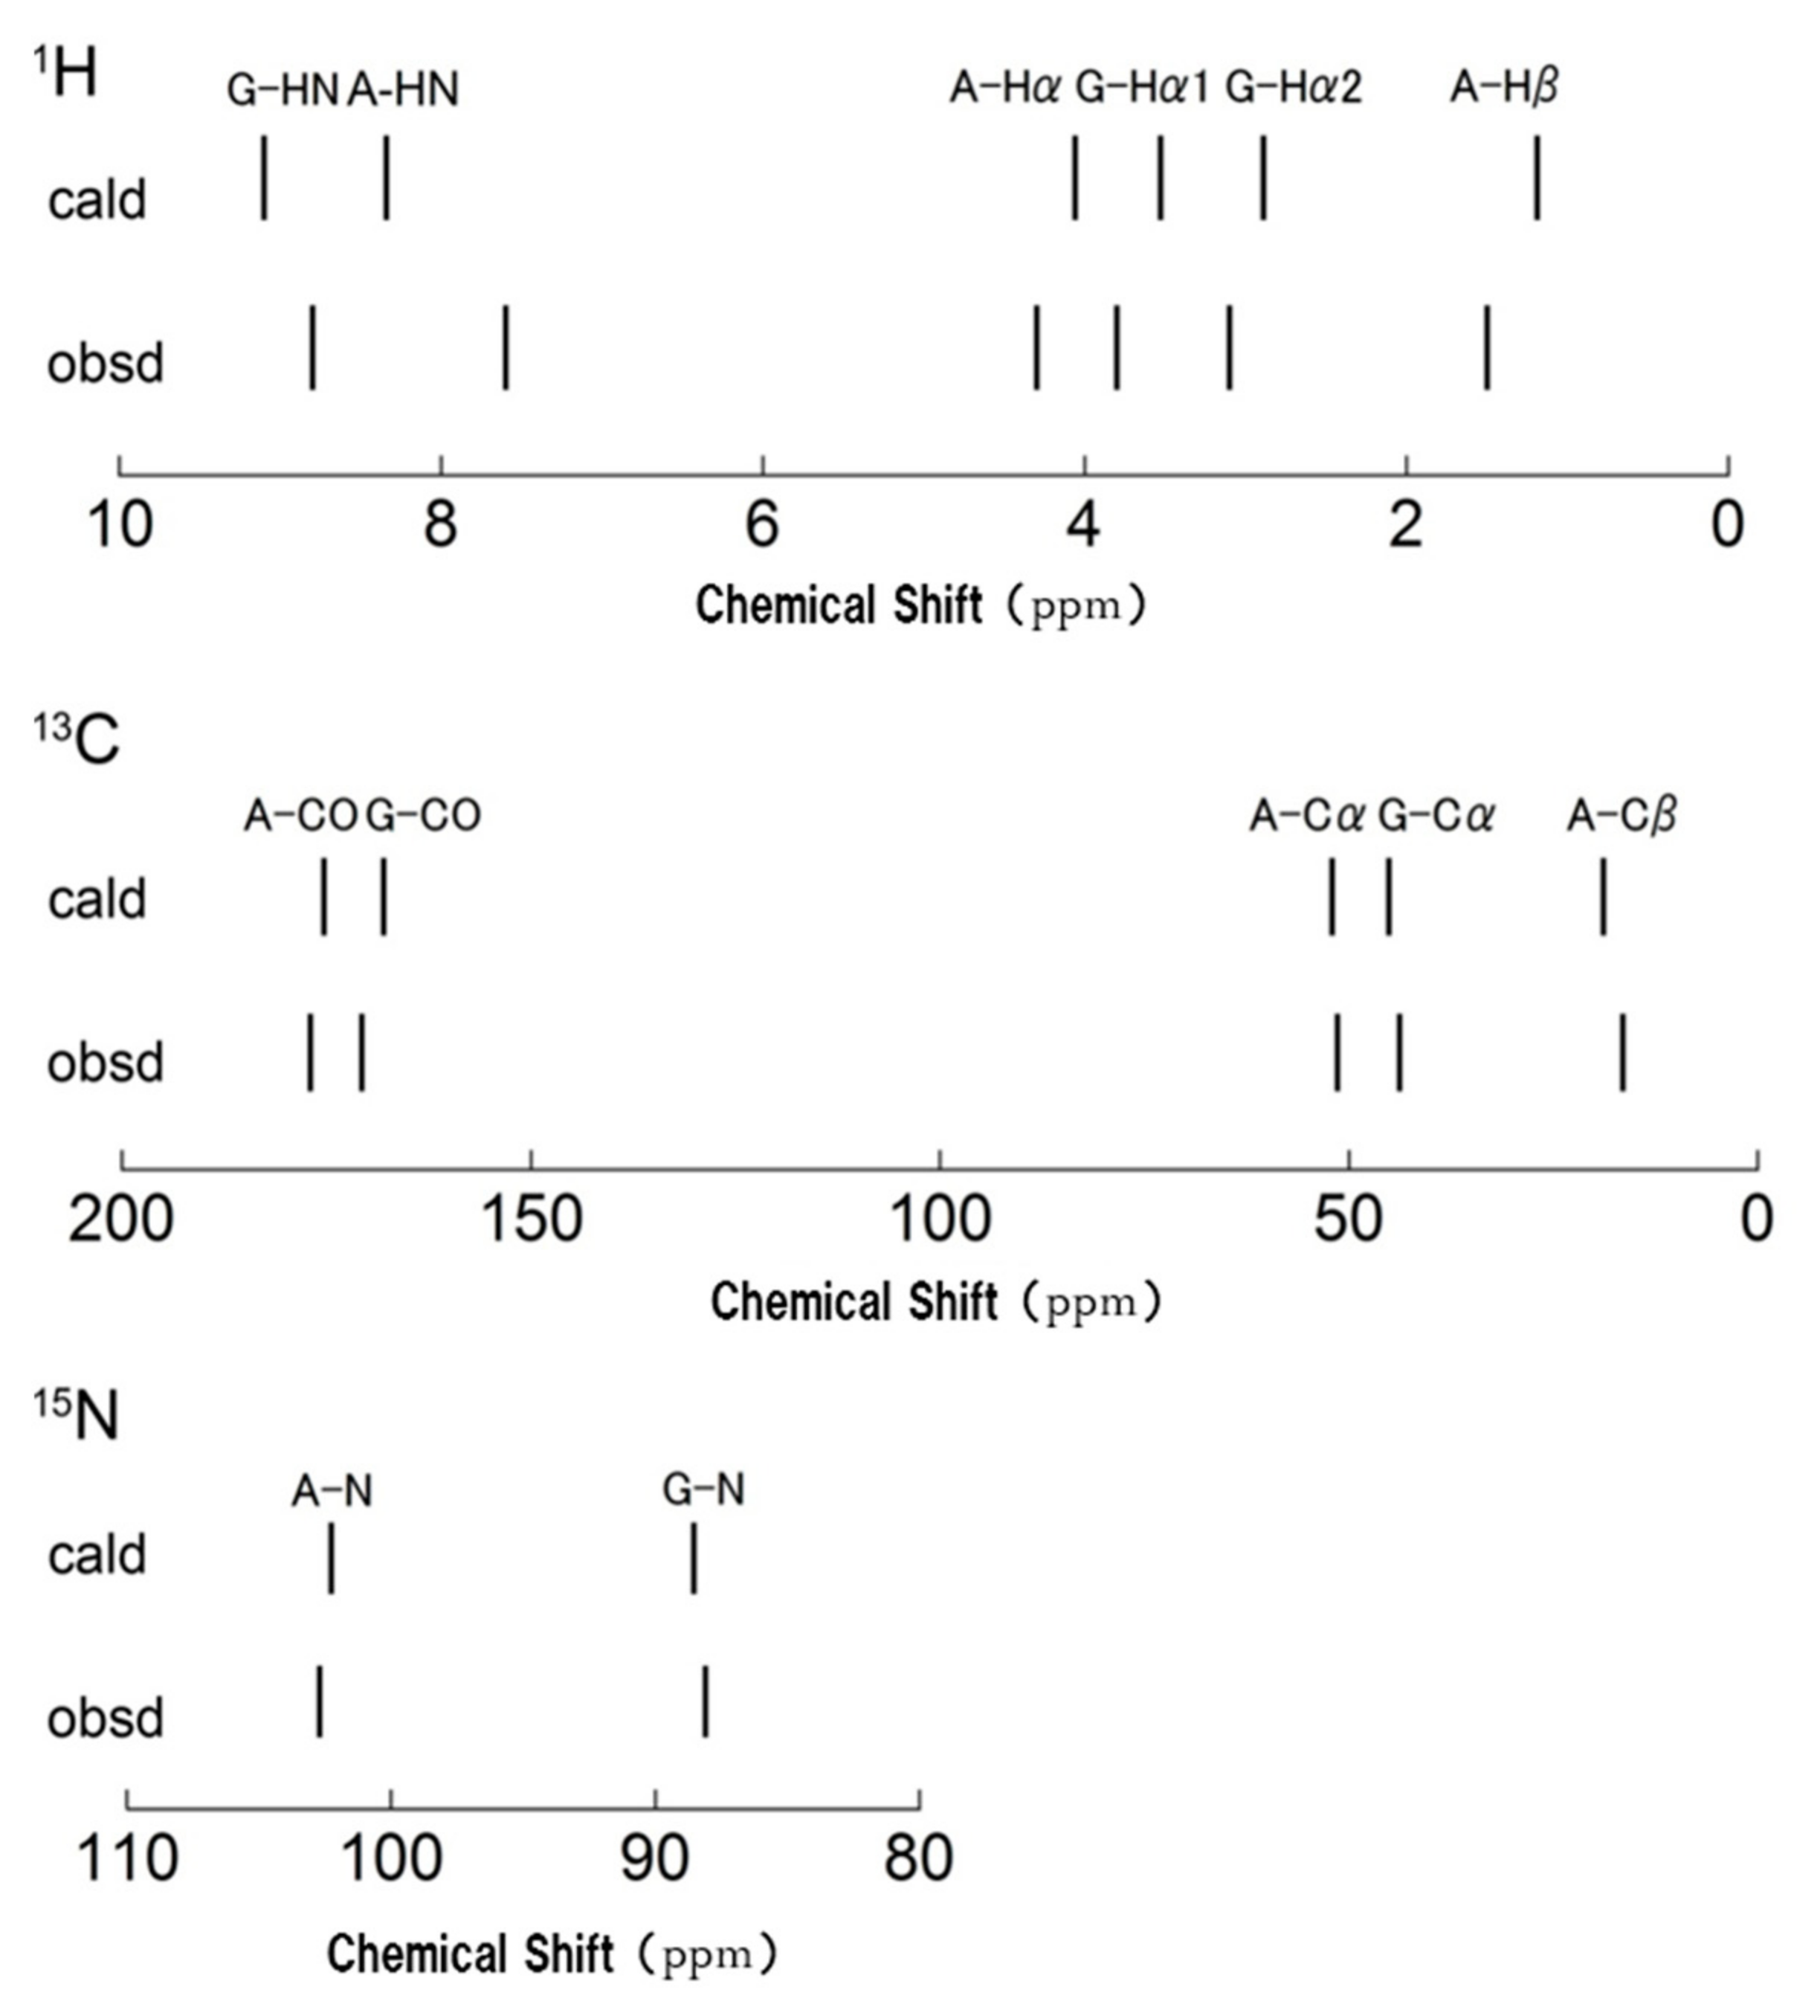
Figure 10 shows the 1H DQMAS (double quantum magic angle spinning) NMR spectrum of (AG)15 with silk I structure together with Double-Quantum (DQ) correlations to obtain information on the intra- and intermolecular 1H-1H distances in (AG)15 [86,88,89,90,91,92,93,94,95,96]. Thus, the 1H chemical shifts of (AG)15 with silk I structure could be obtained in a solid-state from Figure 10 with high accuracy. To calculate the coordinates of 1H atoms, the geometry optimization was applied only for protons under periodic boundary conditions after the atomic coordinates of the heteroatoms were fixed. All calculations were carried out by the NMR-CASTEP program. Then the 1H, 13C, and 15N chemical shift calculations were performed by GIPAW methods [97]. The observed of the 1H, 13C, and 15N chemical shifts of (AG)15 with silk I structure [66,81,86] were compared with those calculated by theoretical chemical shift calculation using all the coordinates of heteroatoms, such as C, N, and O atoms (Figure 7), and those of H atoms, determined here. The agreement between the calculated and observed chemical shifts of all 1H, 13C, and 15N nuclei of (AG)15 with silk I structure was excellent, as shown in Figure 11. For example, the correlation coefficient was 0.99745 for 1H and 0.99998 for 13C. Thus, the excellent agreement suggests strongly that the coordinates of H atoms of (AG)15 in the silk I form after CASTEP calculation could be determined with a high degree of accuracy, as well as the support of the coordinates of heteroatoms, such as C, N, and O atoms, in Figure 7.
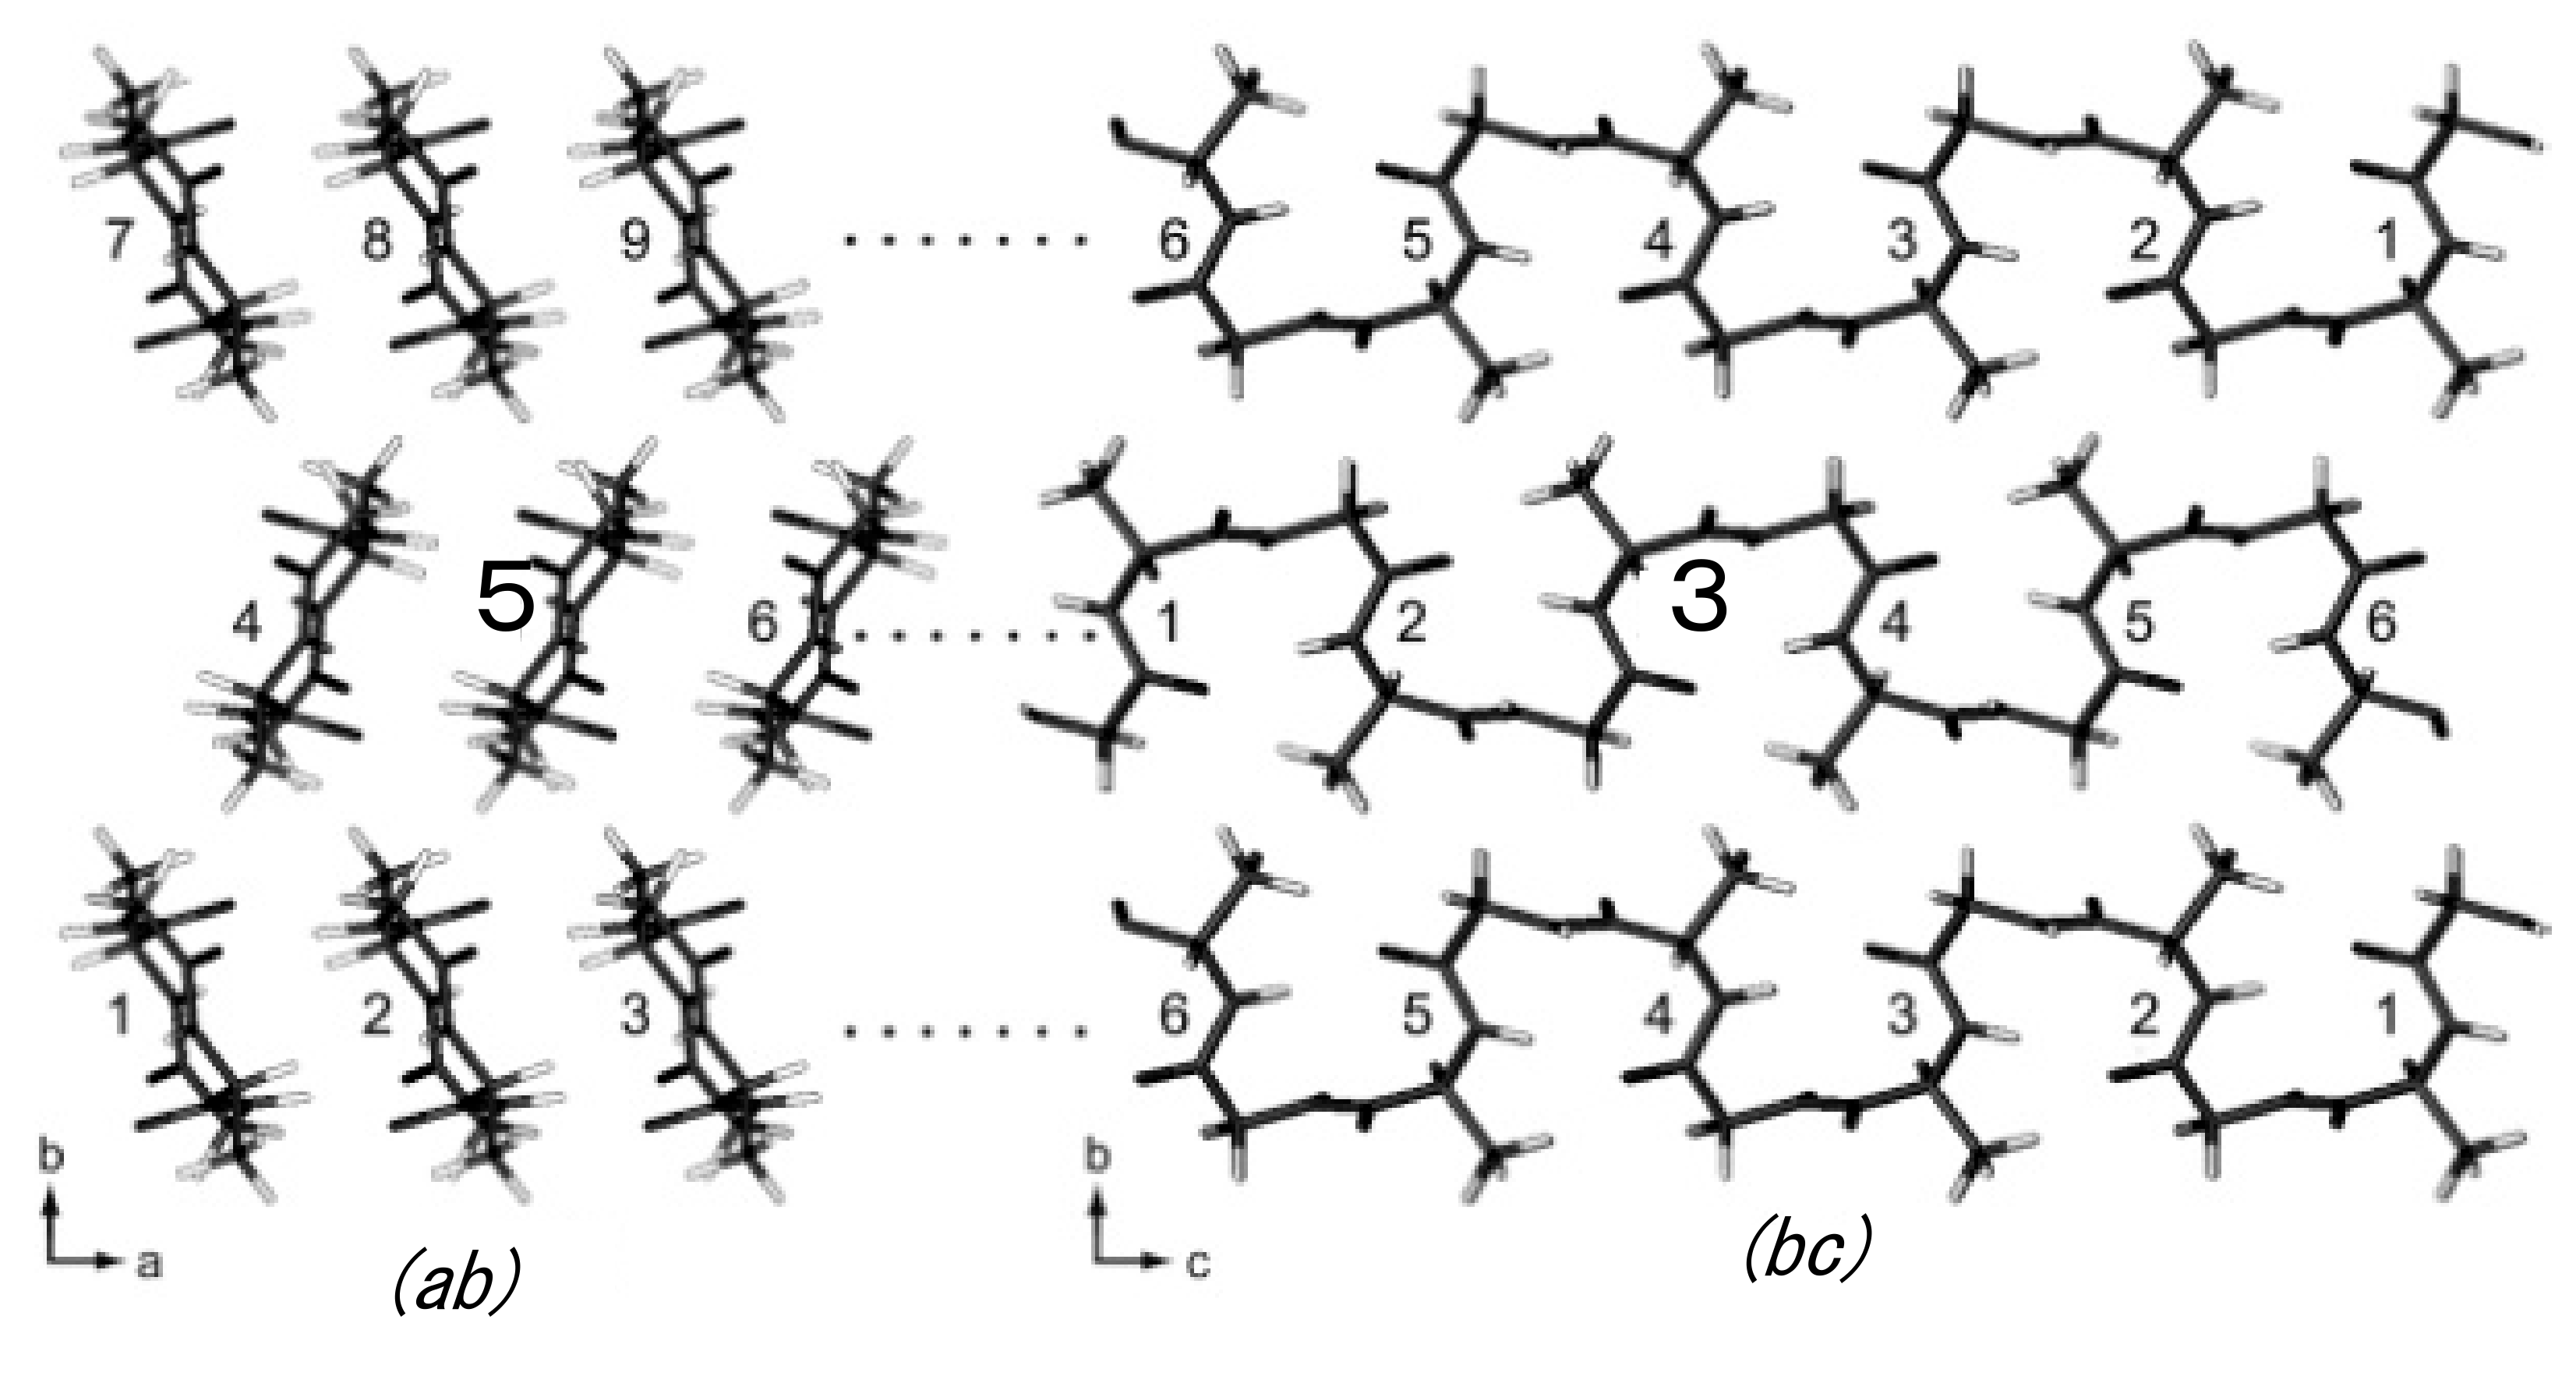
Next, the intra- and intermolecular 1H-1H distances less than 4 Å were calculated from the coordinates of 1H atoms of the packed poly(AG) chains determined here as listed in Table 2. Figure 12 shows the intra- and intermolecular chain arrangements of (AG)15 molecules with type II β-turn structure in calculating the 1H-1H distances for the DQ correlations ①–⑮ in Table 2. For example, in the column ①, DQ correlation (① G-HN A-HN) and intramolecular (2.83 (53)) means that the intramolecular 1H-1H distance between HN Gly and HN Ala residues is calculated to be 2.83 Å in the chain number 5 (bold) in the group (ac) and the number of Ala-Gly segment 3 (bold) in the group (bc).
Although the authors did not obtain the 1H DQ build-up curves for quantitative simulation, the relationship between the observed DQ correlation and relative proton-proton proximities from the coordinates of (AG)15 with silk I form could be obtained qualitatively. A detailed analysis of the DQ correlations showed that the relative DQ peak intensities are a reliable measure of the relative distances [95,96]. The 1H DQMAS spectrum indicates that all the 1H-1H distances predicted in Table 2 could be observed in Figure 10.
The geometry of the hydrogen bonding arrangements was then examined from the coordinates of 1H atoms of the silk I structure. The intramolecular hydrogen bonding distance was determined to be 2.01 Å between the NH of (i + 3)-th Ala residue and CO of (i)-th Gly residue. In addition, the intermolecular hydrogen bonding distance was determined to be 1.85 Å between the NH of (i + 2)-th Gly residue in one chain and CO of (i + 1)-th Ala residue in another chain. On the other hand, the angles between NH and CO bonds that contribute to the direct hydrogen bonding formation were determined as 123.2° and 168.1°, respectively. Especially, the angle, 123.2° is far from the preferred linearity for a hydrogen bond. Thus, it is easily speculated that the intermolecular hydrogen bonding is remarkably stronger than the intramolecular hydrogen bonding from the structural information about both the distance and angle of hydrogen bonding. The plane of the NH-CO peptide, and the intra- and intermolecular hydrogen bonding appear alternatively and is perpendicular to each other. Thus, it is possible to speculate that the intramolecular hydrogen bonding of the silk I structure is destroyed easily by external forces, such as stretching.
6. Problems in Speculating Silk I Structure from the IR Spectrum
IR is the most commonly used method to characterize the secondary structures of SF because it is installed in most research laboratories and can be measured easily [37]. In addition, the IR spectrum is possible to analyze using automated analysis carried out with commercial software (for example, Opus 6.5 software, Bruker Optics Corp., Billerica, MA, USA). Of course, it is important to use IR spectroscopy to characterize the structure of silk after the preparation of silk samples or modified silk samples with several forms for using them in many areas of use. However, the conformational analyses of proteins and peptides from IR and Raman studies are not straightforward and should be very careful when the proteins contain β-turn structure, as pointed out by Vass et al. [38]. Namely, they collected many IR experimental data about the amide I band of small and midsize peptides, cyclic peptide, and proteins with β-turn structures. Here, the amide I band carbonyl stretching coupled with in-plane NH bending and CN stretching modes) is the most intense band in the IR spectrum of silk and has been used most frequently in the conformational analysis of silk fibroin, including silk I [23,24,25,26,27,28,29,30,31,32,33,34,35,36,37]. The conclusion by Vass et al. is as follows. In the case of proteins without β-turns, IR is a reliable method for assessing secondary structures, especially with a relatively high β-sheet content. However, the prediction of β-turn content in proteins from IR spectra is not straightforward. The assignment of the 1690–1660 cm−1 band to β-turn in the case of proteins is still valid, provided that the contribution of β-sheet and 310-helix structures are taken into account. Fortunately, the intensity of the 1690–1670 cm−1 component band associated with β-sheet content is week, and the content of 310-helix in proteins is usually negligible. Therefore, an intense band in the 1690–1660 cm−1 region is highly diagnostic of turn structures. Although a string band may indicate β-turn structures, it does not always lead to accurate secondary structure estimates. Recent results on proteins indicate that β-turns also absorb in the 1645–1635 cm−1 region. Whether the presence of both the 1690–1660 and 1645–1635 cm−1 bands are required for the identification of β-turns in proteins remains to be investigated further.
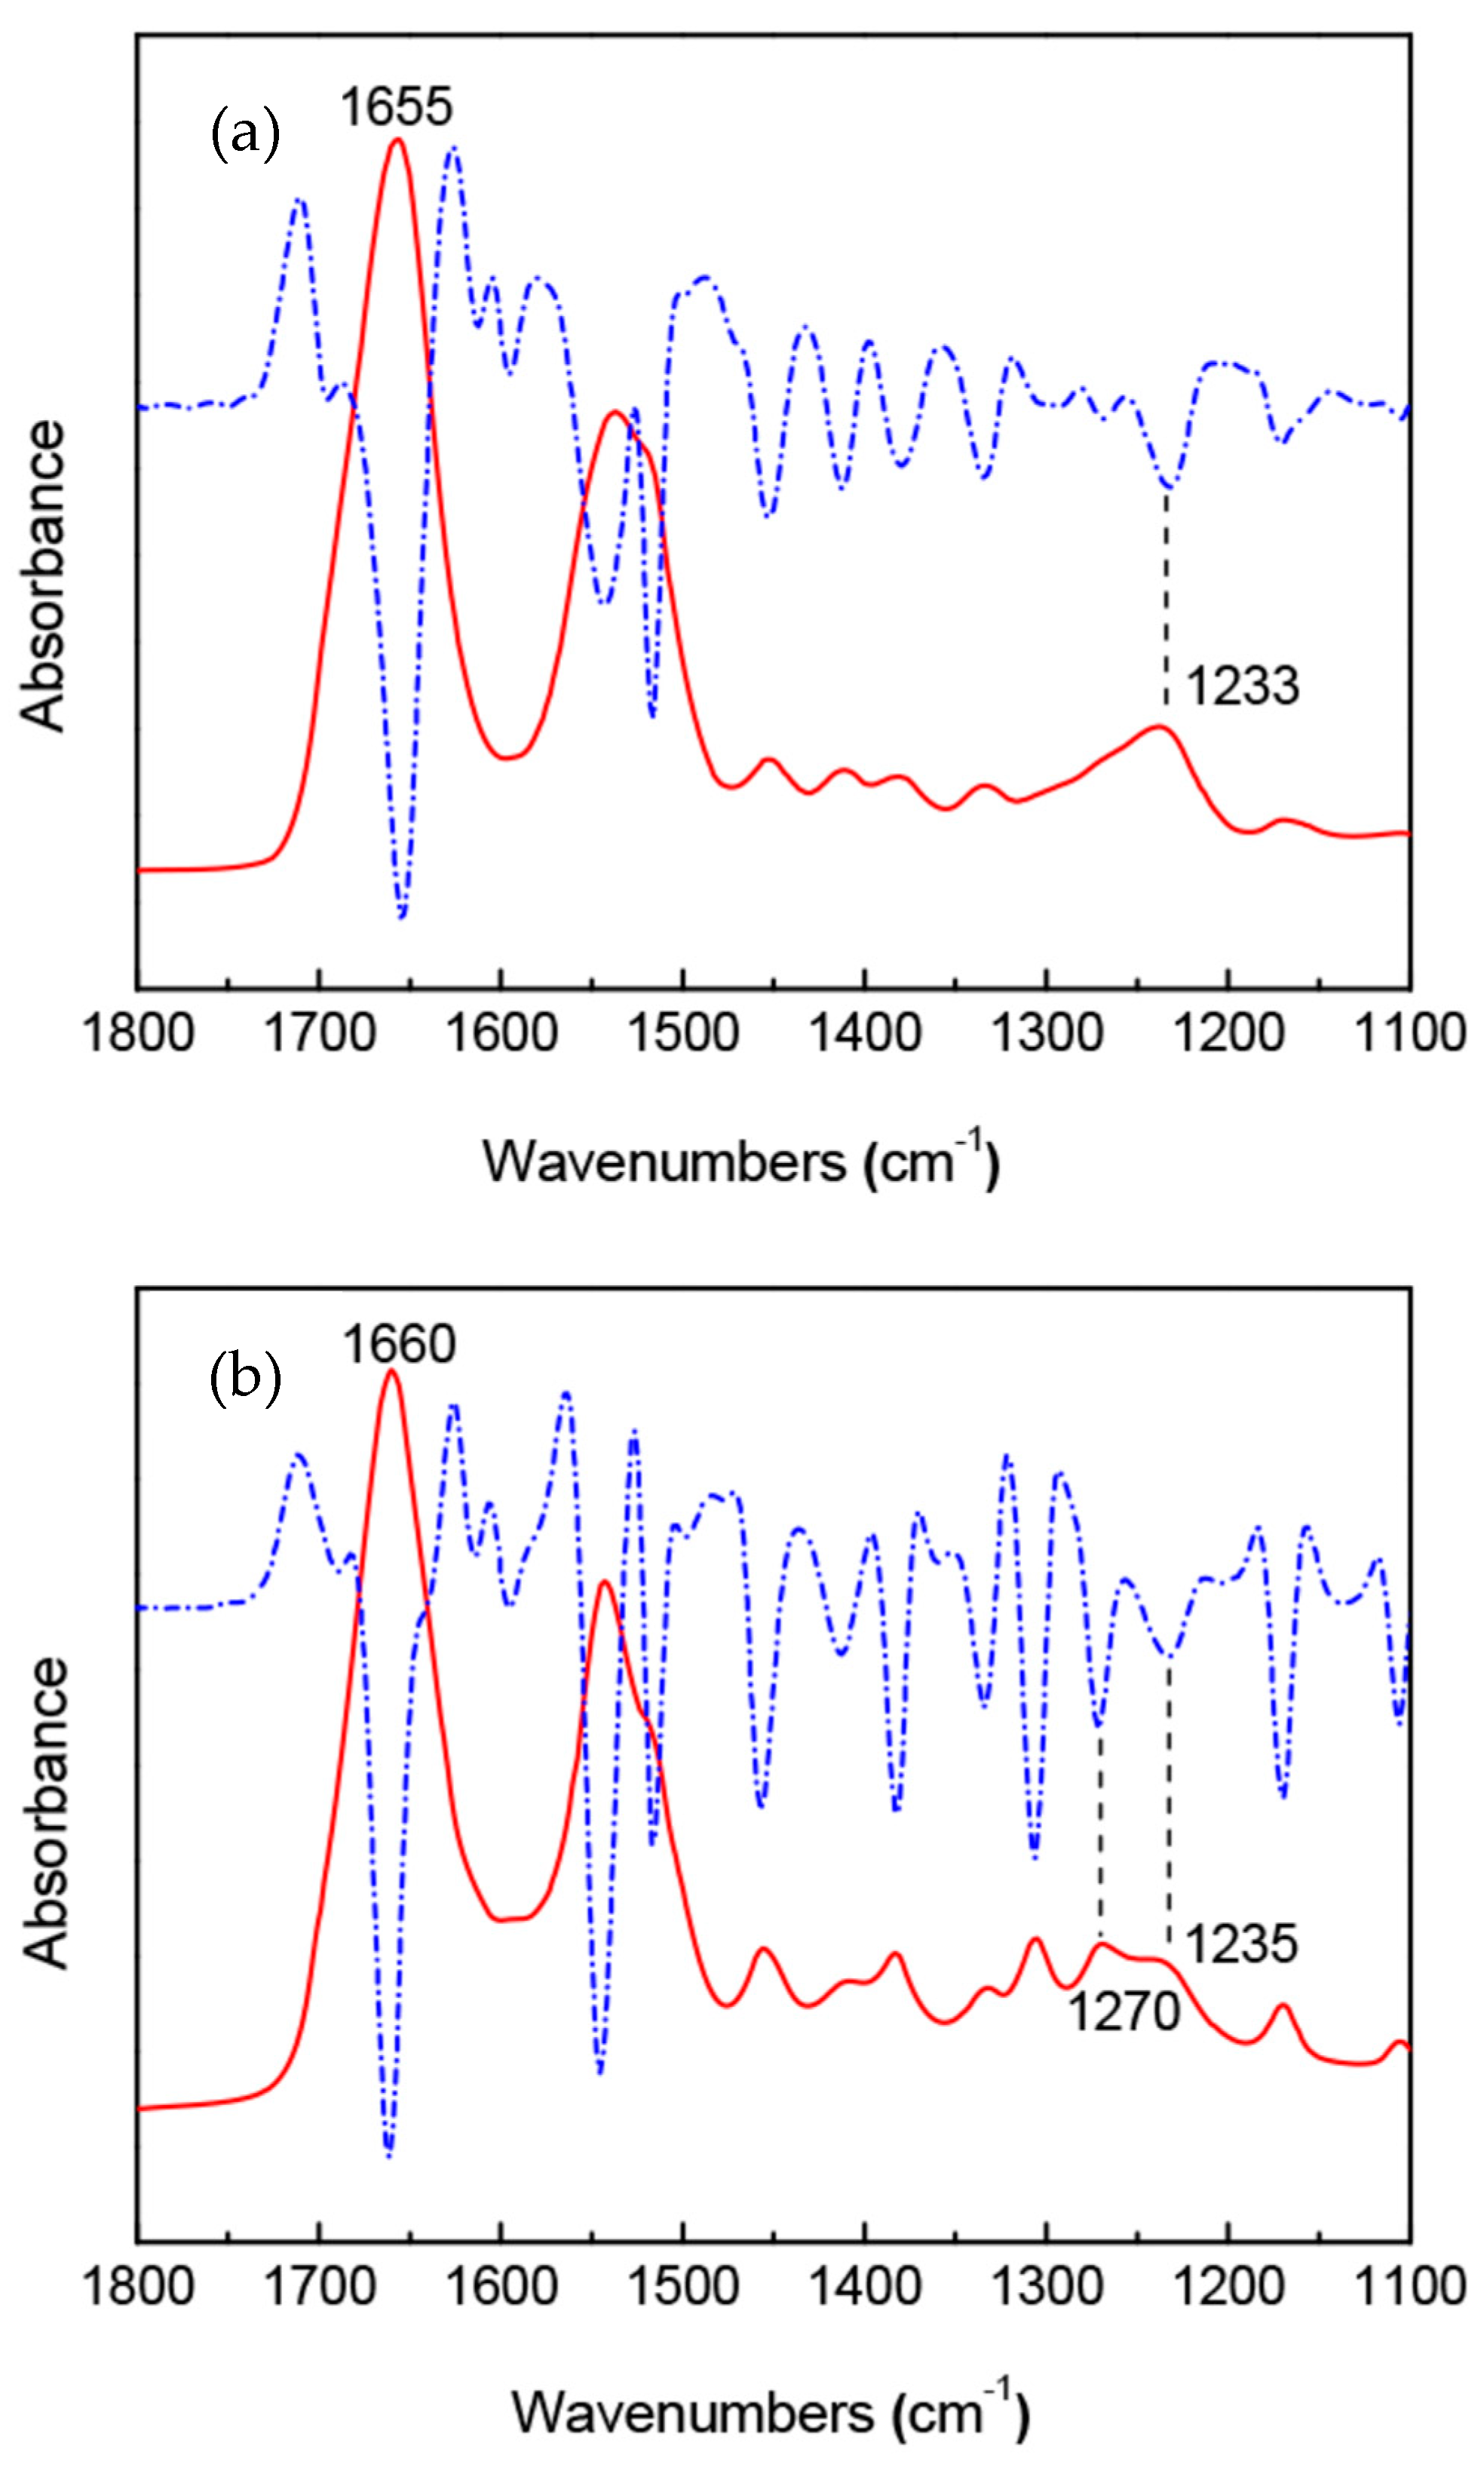
Figure 13 shows the IR spectra of B. mori silk fibroin membrane as cast (silk I form) and A. pernyi silk fibroin membrane as a cast [36,37]. Here, the IR spectrum of Figure 12 (a) is essentially the same as that of Figure 3 (silk I structure). The primary structure of A. pernyi silk fibroin is very close to that of S. c. ricini silk fibroin [41,98]. Namely, the Ala residues present in polyalanine sequences or as the isolated ones in A. pernyi silk fibroin like S. c. ricini silk fibroin and the polyalanine sequences take α-helical conformation, whereas the isolated Ala residues take random coil in the liquid silk [99]. Thus, the assignment of the amide I band 1660 cm−1 of A. pernyi silk fibroin membrane as cast to α-helix in the IR spectrum is valid. On the other hand, the β-turn peak was assigned to 1690 to 1700 cm−1 in their paper because a small peak from1690 to 1700 cm−1 was assigned to β-turn conformation of the hairpin-folded antiparallel β-sheet structure [36]. However, the assignment of this band is not conclusively β-turn structure as is mentioned in the review of Vass et al. [38]. The amide I was 1655 cm−1 for B. mori liquid silk with silk I structure and was very close to the amide I band 1660 cm−1 for α-helix of Antheraea pernyi (A. pernyi) liquid silk, as shown in Figure 13. Therefore, many researchers concluded that silk I structure is α-helix or partially α-helix [23,24,25,26,27,28,29,30,31,32,33,34,35]. However, as described above, the silk I is type II β-turn structure, and the amide I 1655 cm−1 should be assigned to type II β-turn in the structural analysis of silk fibroin using the IR method. There are no sequences to be able to form α-helix in the primary structure of B. mori silk fibroin, as shown in Figure 1.
So far, many papers, including this one, assigned the silk I structures using IR and Raman spectroscopies by carefully considering type II β-turn model [52,53,100,101,102,103,104,105,106,107,108]. For example, Monti et al. [52,104] assigned the strong amide I, II, II, and V bands fell at 1654, 1540, 1240, and 660 cm−1 to type II β-turn structure in the IR spectrum of (AG)15 with silk I form. The IR method is very convenient for the structural analysis of silk fibroin and should use it more frequently qualitatively rather than quantitatively [37]. However, in these IR analyses, the experimental assignment of the amide I band to the β-turn structure has been done carefully by comparing the structure of peptides and proteins determined by another method, such as X-ray diffraction with the IR spectrum [38]. There are many papers to speculate silk I structure to be α−helix which are cited from previous papers repeatedly [23,24,25,26,27,28,29,30,31,32,33,34,35,36,37]. Although it is important to discuss the structure-property relationship of silk fibroin, the exact assignment of the IR band is clearly necessary to avoid serious mistakes. The silk I sample of (AG)n took 100% type II β-turn structure, and therefore, all of the IR bands observed in Figure 3 are related to the type II β-turn structure.
7. Conclusions and Future Aspects
In this review, the author showed that Bombyx mori silk fibroin structure before spinning (silk I) is type II β-turn, not α-helix or partially α-helix structure using several many solid-state NMR and solution NMR methods together with selectively stable isotope-labeled model peptides. On the other hand, many researchers have been reported that the structure of silk I is α-helix or partially α-helix using IR methods. The author emphasized that the conformational analyses of proteins and peptides from IR studies are not straightforward and should be very careful when the proteins contain β-turn structure, as pointed out by Vass et al. [38] using many experimental data. For example, Raman optical activity (ROA) and vibrational circular dichroism (VCD) can discriminate α-helix from other structures. Moreover, in the future, theoretical calculation of the IR bands for (AG)n with type II β-turn structure will give a clear conclusion about the IR band assignment, especially for amide I.
Funding
This research was funded by a JSPS KAKENHI, Grant-in-Aid for Scientific Research (C), Grant Number JP19K05609.
Institutional Review Board Statement
Not applicable.
Informed Consent Statement
Not applicable.
Conflicts of Interest
There is no conflict of interest associated with the author of this paper.
References
- Asakura, T.; Miller, T. Biotechnology of Silk. In Biologically-Inspired Systems; Asakura, T., Miller, T., Eds.; Springer: Dordrecht, The Netherlands, 2014; Volume 5, ISBN 978-94-007-7118-5. [Google Scholar]
- Shao, Z.; Vollrath, F. Materials: Surprising strength of silkworm silk. Nature 2002, 418, 741. [Google Scholar] [CrossRef]
- Vepari, C.; Kaplan, D.L. Silk as a biomaterial. Prog. Polym. Sci. 2007, 32, 991–1007. [Google Scholar] [CrossRef]
- Koh, L.-D.; Cheng, Y.; Teng, C.-P.; Khin, Y.-W.; Loh, X.-J.; Tee, S.-Y.; Low, M.; Ye, E.; Yu, H.-D.; Zhang, Y.-W.; et al. Structures, mechanical properties and applications of silk fibroin materials. Prog. Polym. Sci. 2015, 46, 86–110. [Google Scholar] [CrossRef]
- Pereira, R.F.P.; Silva, M.M.; de Zea Bermudez, V. Bombyx mori Silk Fibers: An Outstanding Family of Materials. Macromol. Mater. Eng. 2015, 300, 1171–1198. [Google Scholar] [CrossRef]
- Thurber, A.E.; Omenetto, F.G.; Kaplan, D.L. In vivo bioresponses to silk proteins. Biomaterials 2015, 71, 145–157. [Google Scholar] [CrossRef] [PubMed] [Green Version]
- Holland, C.; Numata, K.; Rnjak-Kovacina, J.; Seib, F.P. The Biomedical Use of Silk: Past, Present, Future. Adv. Healthc. Mater. 2018, 8, 1800465. [Google Scholar] [CrossRef] [Green Version]
- Tamara, A.B.; DeSimone, E.; Scheibel, T. Biomedical Applications of Recombinant Silk-Based Materials. Adv. Mater. 2018, 30, 1704636. [Google Scholar] [CrossRef]
- Takei, F.; Kikuchi, Y.; Kikuchi, A.; Mizuno, S.; Shimura, K. Further evidence for importance of the subunit combination of silk fibroin in its efficient secretion from the posterior silk gland cells. J. Cell Biol. 1987, 105, 175–180. [Google Scholar] [CrossRef] [Green Version]
- Tanaka, K.; Mori, K.; Mizuno, S. Immunological identification of the major disulfide-linked light component of silk fibroin. J. Biochem. 1993, 114, 1–4. [Google Scholar] [CrossRef] [PubMed]
- Tanaka, K.; Kajiyama, N.; Ishikura, K.; Waga, S.; Kikuchi, A.; Ohtomo, K.; Takagi, T.; Mizuno, S. Determination of the site of disulfide linkage between heavy and light chains of silk fibroin produced by Bombyx mori. Biochim. Biophys. Acta Protein Struct. Mol. Enzymol. 1999, 1432, 92–103. [Google Scholar] [CrossRef]
- Inoue, S.; Tanaka, K.; Arisaka, F.; Kimura, S.; Ohtomo, K.; Mizuno, S. Silk Fibroin of Bombyx mori is Secreted, Assembling a High Molecular Mass Elementary Unit Consisting of H-chain, L-chain, and P25, with a 6:6:1 Molar Ratio. J. Biol. Chem. 2000, 275, 40517–40528. [Google Scholar] [CrossRef] [Green Version]
- Zhou, C.-Z.; Confalonieri, F.; Medina, N.; Zivanovic, Y.; Esnault, C.; Yang, T.; Jacquet, M.; Janin, J.; Duguet, M.; Perasso, R.; et al. Fine organization of Bombyx mori fibroin heavy chain gene. Nucleic Acids Res. 2000, 28, 2413–2419. [Google Scholar] [CrossRef] [Green Version]
- Zhou, C.-Z.; Confalonieri, F.; Jacquet, M.; Perasso, R.; Li, Z.-G.; Janin, J. Silk fibroin: Structural implications of a remarkable amino acid sequence. Proteins 2001, 44, 119–122. [Google Scholar] [CrossRef] [PubMed]
- Asakura, T.; Ohgo, K.; Ishida, T.; Taddei, P.; Monti, P.; Kishore, R. Possible Implications of Serine and Tyrosine Residues and Intermolecular Interactions on the Appearance of Silk I Structure of Bombyx mori Silk Fibroin-Derived Synthetic Peptides: High-Resolution 13C Cross-Polarization/Magic-Angle Spinni. Biomacromolecules 2005, 6, 468–474. [Google Scholar] [CrossRef]
- Asakura, T.; Ogawa, T.; Naito, A.; Williamson, M.P. Chain-folded lamellar structure and dynamics of the crystalline fraction of Bombyx mori silk fibroin and of (Ala-Gly-Ser-Gly-Ala-Gly)n model peptides. Int. J. Biol. Macromol. 2020, 164, 3974–3983. [Google Scholar] [CrossRef] [PubMed]
- Lotz, B.; Cesari, F.C. The chemical structure and the crystalline structures of Bombyx mori silk fibroin. Biochimie 1979, 61, 205–214. [Google Scholar] [CrossRef]
- Marsh, R.E.; Corey, R.B.; Pauling, L. An investigation of the structure of silk fibroin. Biochim. Biophys. Acta 1955, 16, 1–34. [Google Scholar] [CrossRef]
- Asakura, T.; Aoki, A.; Komatsu, K.; Ito, C.; Suzuki, I.; Naito, A.; Kaji, H. Lamellar Structure in Alanine–Glycine Copolypeptides Studied by Solid-State NMR Spectroscopy: A Model for the Crystalline Domain of Bombyx mori Silk Fibroin in Silk II Form. Biomacromolecules 2020, 21, 3102–3111. [Google Scholar] [CrossRef]
- Fraser, B.; MacRae, T.P. Conformations of Fibrous Proteins and Related Synthetic Polypeptides; Academic Press: New York, NY, USA, 1973. [Google Scholar]
- Asakura, T.; Ashida, J.; Yamane, T.; Kameda, T.; Nakazawa, Y.; Ohgo, K.; Komatsu, K. A repeated β-turn structure in Poly(Ala-Gly) as a model for silk I of Bombyx mori silk fibroin studied with two-dimensional spin-diffusion NMR under off magic angle spinning and rotational echo double resonance. J. Mol. Biol. 2001, 306, 291–305. [Google Scholar] [CrossRef]
- Asakura, T.; Ohgo, K.; Komatsu, K.; Kanenari, M.; Okuyama, K. Refinement of Repeated β-turn Structure for Silk I Conformation of Bombyx mori Silk Fibroin Using 13C Solid-State NMR and X-ray Diffraction Methods. Macromolecules 2005, 38, 7397–7403. [Google Scholar] [CrossRef]
- Hu, X.; Kaplan, D.; Cebe, P. Dynamic Protein−Water Relationships during β-Sheet Formation. Macromolecules 2008, 41, 3939–3948. [Google Scholar] [CrossRef]
- Hu, X.; Shmelev, K.; Sun, L.; Gil, E.-S.; Park, S.-H.; Cebe, P.; Kaplan, D.L. Regulation of Silk Material Structure by Temperature-controlled Water Vapor Annealing. Biomacromolecules 2011, 12, 1686–1696. [Google Scholar] [CrossRef] [Green Version]
- Lu, Q.; Huang, Y.; Li, M.; Zuo, B.; Lu, S.; Wang, J.; Zhu, H.; Kaplan, D.L. Silk fibroin electrogelation mechanisms. Acta Biomater. 2011, 7, 2394–2400. [Google Scholar] [CrossRef] [PubMed] [Green Version]
- Percot, A.; Colomban, P.; Paris, C.; Dinh, H.M.; Wojcieszak, M.; Mauchamp, B. Water dependent structural changes of silk from Bombyx mori gland to fibre as evidenced by Raman and IR spectroscopies. Vib. Spectrosc. 2014, 73, 79–89. [Google Scholar] [CrossRef]
- Dubey, P.; Murab, S.; Karmakar, S.; Chowdhury, P.K.; Ghosh, S. Modulation of Self-Assembly Process of Fibroin: An Insight for Regulating the Conformation of Silk Biomaterials. Biomacromolecules 2015, 16, 3936–3944. [Google Scholar] [CrossRef]
- Wu, X.; Wu, X.; Shao, M.; Yang, B. Structural changes of Bombyx mori fibroin from silk gland to fiber as evidenced by Terahertz spectroscopy and other methods. Int. J. Biol. Macromol. 2017, 102, 1202–1210. [Google Scholar] [CrossRef] [PubMed]
- Kaewprasit, K.; Kobayashi, T.; Damrongsakkul, S. Thai silk fibroin gelation process enhancing by monohydric and polyhydric alcohols. Int. J. Biol. Macromol. 2018, 118, 1726–1735. [Google Scholar] [CrossRef] [PubMed]
- Li, X.; Zhang, J.; Feng, Y.; Yan, S.; Zhang, Q.; You, R. Tuning the structure and performance of silk biomaterials by combining mulberry and non-mulberry silk fibroin. Polym. Degrad. Stab. 2018, 147, 57–63. [Google Scholar] [CrossRef]
- Badillo-Sanchez, D.; Chelazzi, D.; Giorgi, R.; Cincinelli, A.; Baglioni, P. Characterization of the secondary structure of degummed Bombyx mori silk in modern and historical samples. Polym. Degrad. Stab. 2018, 157, 53–62. [Google Scholar] [CrossRef]
- Xue, Y.; Wang, F.; Torculas, M.; Lofland, S.; Hu, X. Formic Acid Regenerated Mori, Tussah, Eri, Thai, and Muga Silk Materials: Mechanism of Self-Assembly. ACS Biomater. Sci. Eng. 2019, 5, 6361–6373. [Google Scholar] [CrossRef]
- Li, X.; Wang, L.; Li, L.; Luo, Z.; Yan, S.; Zhang, Q.; You, R. Water-stable silk fibroin nerve conduits with tunable degradation prepared by a mild freezing-induced assembly. Polym. Degrad. Stab. 2019, 164, 61–68. [Google Scholar] [CrossRef]
- Yang, Y.; Greco, G.; Maniglio, D.; Mazzolai, B.; Migliaresi, C.; Pugno, N.; Motta, A. Spider (Linothele megatheloides) and silkworm (Bombyx mori) silks: Comparative physical and biological evaluation. Mater. Sci. Eng. C 2020, 107, 110197. [Google Scholar] [CrossRef] [PubMed]
- Park, Y.; Jung, Y.; Li, T.-D.; Lao, J.; Tu, R.S.; Chen, X. β-Sheet Nanocrystals Dictate Water Responsiveness of Bombyx Mori Silk. Macromol. Rapid Commun. 2020, 41, 1900612. [Google Scholar] [CrossRef]
- Ling, S.; Qi, Z.; Knight, D.P.; Shao, Z.; Chen, X. Synchrotron FTIR Microspectroscopy of Single Natural Silk Fibers. Biomacromolecules 2011, 12, 3344–3349. [Google Scholar] [CrossRef]
- Zhong, J.; Liu, Y.; Ren, J.; Tang, Y.; Qi, Z.; Zhou, X.; Chen, X.; Shao, Z.; Chen, M.; Kaplan, D.L.; et al. Understanding Secondary Structures of Silk Materials via Micro- and Nano-Infrared Spectroscopies. ACS Biomater. Sci. Eng. 2019, 5, 3161–3183. [Google Scholar] [CrossRef] [PubMed]
- Vass, E.; Hollósi, M.; Besson, F.; Buchet, R. Vibrational Spectroscopic Detection of Beta- and Gamma-Turns in Synthetic and Natural Peptides and Proteins. Chem. Rev. 2003, 103, 1917–1954. [Google Scholar] [CrossRef]
- Asakura, T.; Suzuki, H.; Watanabe, Y. Conformational characterization of silk fibroin in intact Bombyx mori and Pilosamia cynthia ricini silkworms by 13C NMR spectroscopy. Macromolecules 1983, 16, 1024–1026. [Google Scholar] [CrossRef]
- Asakura, T. Nuclear Magnetic Resonance studies on the Biosynthesis of the Silk Fibroins in Silkworms. JOEL News 1987, 23A, 2–6. [Google Scholar]
- Sezutsu, H.; Yukuhiro, K. The complete nucleotide sequence of the Eri-silkworm(Samia cynthia ricini) fibroin gene. J. Insect Biotechnol. Sericol. 2014, 83, 59–70. [Google Scholar] [CrossRef]
- Asakura, T.; Murakami, T. NMR of silk fibroin. 4. Temperature- and urea-induced helix-coil transitions of the -(Ala)n- sequence in Philosamia cynthia ricini silk fibroin protein monitored by 13C NMR spectroscopy. Macromolecules 1985, 18, 2614–2619. [Google Scholar] [CrossRef]
- Asakura, T.; Kashiba, H.; Yoshimizu, H. NMR of silk fibroin. 8. 13C NMR analysis of the conformation and the conformational transition of Philosamia cynthia ricini silk fibroin protein on the basis of Bixon-Scheraga-Lifson theory. Macromolecules 1988, 21, 644–648. [Google Scholar] [CrossRef]
- Asakura, T.; Yoshimizu, H.; Yoshizawa, F. NMR of Silk Fibroin. 9. Sequence and Conformation Analyses of the Silk Fibroins from Bombyx mori and Philosamia cynthia ricini by 15N NMR Spectroscopy. Macromolecules 1988, 21, 2038–2041. [Google Scholar] [CrossRef]
- Nakazawa, Y.; Asakura, T. Heterogeneous exchange behavior of Samia cynthia ricini silk fibroin during helix-coil transition studied with 13C NMR. FEBS Lett. 2002, 529, 188–192. [Google Scholar] [CrossRef] [Green Version]
- Nakazawa, Y.; Asakura, T. Structure Determination of a Peptide Model of the Repeated Helical Domain in Samia cynthia ricini Silk Fibroin before Spinning by a Combination of Advanced Solid-State NMR Methods. J. Am. Chem. Soc. 2003, 125, 7230–7237. [Google Scholar] [CrossRef]
- Suzuki, Y.; Kawanishi, S.; Yamazaki, T.; Aoki, A.; Saito, H.; Asakura, T. Structural Determination of the Tandem Repeat Motif in Samia cynthia ricini Liquid Silk by Solution NMR. Macromolecules 2015, 48, 6574–6579. [Google Scholar] [CrossRef]
- Okuyama, K.; Takanashi, K.; Nakajima, Y.; Hasegawa, Y.; Hirabayashi, K.; Nishi, N. Analysis of Silk I structure by X-ray and electron diffraction methods. J. Sericultural Sci. Jpn. 1988, 57, 23–30. [Google Scholar] [CrossRef]
- Anderson, J.P. Morphology and crystal structure of a recombinant silk-like molecule, SLP4. Biopolymers 1998, 45, 307–321. [Google Scholar] [CrossRef]
- Asakura, T.; Yamane, T.; Nakazawa, Y.; Kameda, T.; Ando, K. Structure of Bombyx mori silk fibroin before spinning in solid state studied with wide angle X-ray scattering and 13C cross-polarization/magic angle spinning NMR. Biopolymers 2001, 58, 521–525. [Google Scholar] [CrossRef]
- Fossey, S.A.; Némethy, G.; Gibson, K.D.; Scheraga, H.A. Conformational energy studies of β-sheets of model silk fibroin peptides. I. Sheets of poly(Ala-Gly) chains. Biopolymers 1991, 31, 1529–1541. [Google Scholar] [CrossRef] [PubMed]
- Monti, P.; Taddei, P.; Freddi, G.; Ohgo, K.; Asakura, T. Vibrational 13C-cross-polarization/magic angle spinning NMR spectroscopic and thermal characterization of poly(alanine-glycine) as model for silk I Bombyx mori fibroin. Biopolymers 2003, 72, 329–338. [Google Scholar] [CrossRef]
- Taddei, P.; Asakura, T.; Yao, J.; Monti, P. Raman study of poly(alanine-glycine)-based peptides containing tyrosine, valine, and serine as model for the semicrystalline domains of Bombyx mori silk fibroin. Biopolymers 2004, 75, 314–324. [Google Scholar] [CrossRef]
- Saito, H.; Tabeta, R.; Asakura, T.; Iwanaga, Y.; Shoji, A.; Ozaki, T.; Ando, I.; Saitô, H.; Tabeta, R.; Asakura, T.; et al. High-resolution 13C NMR study of silk fibroin in the solid state by the cross-polarization-magic angle spinning method. Conformational characterization of silk I and silk II type forms of Bombyx mori fibroin by the conformation-dependent. Macromolecules 1984, 17, 1405–1412. [Google Scholar] [CrossRef]
- Asakura, T.; Kuzuhara, A.; Tabeta, R.; Saito, H. Conformational characterization of Bombyx mori silk fibroin in the solid state by high-frequency 13C cross polarization-magic angle spinning NMR, X-ray diffraction, and infrared spectroscopy. Macromolecules 1985, 18, 1841–1845. [Google Scholar] [CrossRef]
- Ishida, M.; Asakura, T.; Yokoi, M.; Saito, H. Solvent- and mechanical-treatment-induced conformational transition of silk fibroins studied by high-resolution solid-state 13C NMR spectroscopy. Macromolecules 1990, 23, 88–94. [Google Scholar] [CrossRef]
- Robyr, P.; Meier, B.H.; Ernst, R.R. Radio-frequency-driven nuclear spin diffusion in solids. Chem. Phys. Lett. 1989, 162, 417–423. [Google Scholar] [CrossRef]
- Robyr, P.; Tomaselli, M.; Straka, J.; Grob-Pisano, C.; Suter, U.W.; Meier, B.H.; Ernst, R.R. RF-driven and proton-driven NMR polarization transfer for investigating local order. Mol. Phys. 1995, 84, 995–1020. [Google Scholar] [CrossRef]
- Kümmerlen, J.; van Beek, J.D.; Vollrath, F.; Meier, B.H. Local Structure in Spider Dragline Silk Investigated by Two-Dimensional Spin-Diffusion Nuclear Magnetic Resonance. Macromolecules 1996, 29, 2920–2928. [Google Scholar] [CrossRef] [Green Version]
- Levitt, M.H.; Raleigh, D.P.; Creuzet, F.; Griffin, R.G. Theory and simulations of homonuclear spin pair systems in rotating solids. J. Chem. Phys. 1990, 92, 6347–6364. [Google Scholar] [CrossRef]
- Meier, B.H.; van Beek, J.D.; Beaulieu, L.; Schäfer, H.; Demura, M.; Asakura, T. Solid-state NMR determination of the secondary structure of Samia cynthia ricini silk. Nature 2000, 405, 1077–1079. [Google Scholar] [CrossRef]
- Ashida, J.; Ohgo, K.; Asakura, T. Determination of the Torsion Angles of Alanine and Glycine Residues of Bombyx Mori Silk Fibroin and the Model Peptides in the Silk I and Silk II Forms Using 2D Spin Diffusion Solid-State NMR under Off Magic Angle Spinning. J. Phys. Chem. B 2002, 106, 9434–9439. [Google Scholar] [CrossRef]
- Asakura, T.; Ashida, J.; Yamane, T. Structure of Bombyx mori Silk Fibroin before Spinning in Silkworm. In NMR Spectroscopy of Polymers in Solution and in the Solid State; American Chemical Society: Washington, DC, USA, 2003; pp. 71–82. ISBN 9780841238084. [Google Scholar]
- Asakura, T.; Suzuki, Y.; Nakazawa, Y.; Yazawa, K.; Holland, G.P.; Yarger, J.L. Silk structure studied with nuclear magnetic resonance. Prog. Nucl. Magn. Reson. Spectrosc. 2013, 69, 23–68. [Google Scholar] [CrossRef] [PubMed]
- Asakura, T.; Suzuki, Y.; Nakazawa, Y.; Holland, G.P.; Yarger, J.L. Elucidating silk structure using solid-state NMR. Soft Matter 2013, 9, 11440–11450. [Google Scholar] [CrossRef]
- Asakura, T.; Okushita, K.; Williamson, M.P. Analysis of the structure of Bombyx mori silk fibroin by NMR. Macromolecules 2015, 48, 2345–2357. [Google Scholar] [CrossRef]
- Gullion, T.; Schaefer, J. Detection of Weak Heteronuclear Dipolar Coupling by Rotational-Echo Double-Resonance Nuclear Magnetic Resonance. In Advances in Magnetic and Optical Resonance; Warren, W.S., Ed.; Academic Press: Cambridge, MA, USA, 1989; Volume 13, pp. 57–83. [Google Scholar]
- Gullion, T.; Baker, D.B.; Conradi, M.S. New, compensated Carr-Purcell sequences. J. Magn. Reson. 1990, 89, 479–484. [Google Scholar] [CrossRef]
- Gullion, T.; Schaefer, J. Elimination of resonance offset effects in rotational-echo, double-resonance NMR. J. Magn. Reson. 1991, 92, 439–442. [Google Scholar] [CrossRef]
- Asakura, T.; Aoki, A.; Demura, M.; Joers, J.M.; Rosanske, R.C.; Gullion, T.; James, M.J.; Richard, C.R.; Terry, G. Structure of Bombyx mori Silk Fibroin Studied by REDOR NMR Spectroscopy. Polym. J. 1994, 26, 1405–1408. [Google Scholar] [CrossRef] [Green Version]
- Terry, G.; Raghuvansh, K.; Asakura, T.; Gullion, T.; Kishore, R.; Asakura, T. Determining dihedral angles and local structure in silk peptide by 13C 2H REDOR. J. Am. Chem. Soc. 2003, 125, 7510–7511. [Google Scholar] [CrossRef]
- Gullion, T.; Yamauchi, K.; Okonogi, M.; Asakura, T.; Terry, G.; Yamauchi, K.; Okonogi, M.; Asakura, T. 13C-17O REAPDOR NMR as a tool for determining secondary structure in polyamides. Macromolecules 2007, 40, 1363–1365. [Google Scholar] [CrossRef]
- Lotz, B.; Keith, H.D. Crystal structure of poly(l-Ala-Gly)II. J. Mol. Biol. 1971, 61, 201–215. [Google Scholar] [CrossRef]
- Okuyama, K.; Somashekar, R.; Noguchi, K.; Ichimura, S. Refined molecular and crystal structure of silk I based on Ala–Gly and (Ala–Gly)2—Ser–Gly peptide sequence. Biopolymers 2001, 59, 310–319. [Google Scholar] [CrossRef]
- Asakura, T. NMR of Silk Fibroin, 6. Structure of Bombyx mori silk fibroin in aqueous solution. Makromol. Chem. Rapid Commun. 1986, 7, 755–759. [Google Scholar] [CrossRef]
- Suzuki, Y.Y.; Yamazaki, T.; Aoki, A.; Shindo, H.; Asakura, T. NMR Study of the Structures of Repeated Sequences, GAGXGA (X = S, Y, V), in Bombyx mori Liquid Silk. Biomacromolecules 2014, 15, 104–112. [Google Scholar] [CrossRef]
- Shen, Y.; Bax, A. Protein backbone and sidechain torsion angles predicted from NMR chemical shifts using artificial neural networks. J. Biomol. NMR 2013, 56, 227–241. [Google Scholar] [CrossRef] [Green Version]
- Shen, Y.; Bax, A. Identification of helix capping and β-turn motifs from NMR chemical shifts. J. Biomol. NMR 2012, 52, 211–232. [Google Scholar] [CrossRef]
- Asakura, T.; Watanabe, Y.; Uchida, A.; Minagawa, H. NMR of silk fibroin. 2. 13C NMR study of the chain dynamics and solution structure of Bombyx mori silk fibroin. Macromolecules 1984, 17, 1075–1081. [Google Scholar] [CrossRef]
- Asakura, T.; Watanabe, Y.; Itoh, T. NMR of Silk Fibroin. 3. Assignment of Carbonyl Carbon Resonances and Their Dependence on Sequence and Conformation in Bombyx mori Silk Fibroin Using Selective Isotopic Labeling. Macromolecules 1984, 17, 2421–2426. [Google Scholar] [CrossRef]
- Asakura, T.; Demura, M.; Date, T.; Miyashita, N.; Ogawa, K.; Williamson, M.P. NMR study of silk I structure of Bombyx mori silk fibroin with 15N- and 13C-NMR chemical shift contour plots. Biopolymers 1997, 41, 193–203. [Google Scholar] [CrossRef]
- Yamane, T.; Umemura, K.; Asakura, T. The structural characteristics of Bombyx mori silk fibroin before spinning as studied with molecular dynamics simulation. Macromolecules 2002, 35, 8831–8838. [Google Scholar] [CrossRef]
- Laity, P.R.; Holland, C. The Rheology behind Stress-Induced Solidification in Native Silk Feedstocks. Int. J. Mol. Sci. 2016, 17, 1812. [Google Scholar] [CrossRef] [Green Version]
- Schaefer, C.; Laity, P.R.; Holland, C.; McLeish, T.C.B. Silk Protein Solution: A Natural Example of Sticky Reptation. Macromolecules 2020, 53, 2669–2676. [Google Scholar] [CrossRef] [Green Version]
- Schaefer, C.; Laity, P.R.; Holland, C.; McLeish, T.C.B. Stretching of Bombyx mori Silk Protein in Flow. Molecules 2021, 26, 1663. [Google Scholar] [CrossRef]
- Asakura, T.; Suzuki, Y.; Yazawa, K.; Aoki, A.; Nishiyama, Y.; Nishimura, K.; Suzuki, F.; Kaji, H. Determination of Accurate 1H Positions of (Ala-Gly)n as a Sequential Peptide Model of Bombyx mori Silk Fibroin before Spinning (Silk I). Macromolecules 2013, 46, 8046–8050. [Google Scholar] [CrossRef]
- Yamauchi, K.; Yamasaki, S.; Takahashi, R.; Asakura, T. Microscopic structural analysis of fractured silk fibers from Bombyx mori and Samia cynthia ricini using 13C CP/MAS NMR with a 1 mm microcoil MAS NMR probehead. Solid State Nucl. Magn. Reson. 2010, 38, 27–30. [Google Scholar] [CrossRef]
- Yates, J.R.; Pickard, C.J.; Mauri, F. Calculation of NMR chemical shifts for extended systems using ultrasoft pseudopotentials. Phys. Rev. B 2007, 76, 024401. [Google Scholar] [CrossRef]
- Brown, S.P. Probing proton–proton proximities in the solid state. Prog. Nucl. Magn. Reson. Spectrosc. 2007, 50, 199–251. [Google Scholar] [CrossRef]
- Brinkmann, A.; Litvinov, V.M.; Kentgens, A.P.M. Environmentally friendly flame retardants. A detailed solid-state NMR study of melamine orthophosphate. Magn. Reson. Chem. 2007, 45, S231–S246. [Google Scholar] [CrossRef]
- Bradley, J.P.; Tripon, C.; Filip, C.; Brown, S.P. Determining relative proton-proton proximities from the build-up of two-dimensional correlation peaks in 1H double-quantum MAS NMR: Insight from multi-spin density-matrix simulations. Phys. Chem. Chem. Phys. 2009, 11, 6941–6952. [Google Scholar] [CrossRef]
- Harris, R.K.; Hodgkinson, P.; Zorin, V.; Dumez, J.-N.; Elena-Herrmann, B.; Emsley, L.; Salager, E.; Stein, R.S. Computation and NMR crystallography of terbutaline sulfate. Magn. Reson. Chem. 2010, 48, S103–S112. [Google Scholar] [CrossRef]
- Webber, A.L.; Elena, B.; Griffin, J.M.; Yates, J.R.; Pham, T.N.; Mauri, F.; Pickard, C.J.; Gil, A.M.; Stein, R.; Lesage, A.; et al. Complete 1H resonance assignment of β-maltose from 1H–1H DQ-SQ CRAMPS and 1H (DQ-DUMBO)–13CSQ refocused INEPT 2D solid-state NMR spectra and first principles GIPAW calculations. Phys. Chem. Chem. Phys. 2010, 12, 6970–6983. [Google Scholar] [CrossRef] [PubMed]
- Brown, S.P. Applications of high-resolution 1H solid-state NMR. Solid State Nucl. Magn. Reson. 2012, 41, 1–27. [Google Scholar] [CrossRef]
- Yazawa, K.; Suzuki, F.; Nishiyama, Y.; Ohata, T.; Aoki, A.; Nishimura, K.; Kaji, H.; Shimizu, T.; Asakura, T. Determination of accurate 1H positions of an alanine tripeptide with anti-parallel and parallel β-sheet structures by high resolution 1H solid state NMR and GIPAW chemical shift calculation. Chem. Commun. 2012, 48, 11199–11201. [Google Scholar] [CrossRef]
- Asakura, T.; Yazawa, K.; Horiguchi, K.; Suzuki, F.; Nishiyama, Y.; Nishimura, K.; Kaji, H. Difference in the structures of alanine tri- and tetra-peptides with antiparallel β-sheet assessed by X-ray diffraction, solid-state NMR and chemical shift calculations by GIPAW. Biopolymers 2014, 101, 13–20. [Google Scholar] [CrossRef]
- Pickard, C.J.; Mauri, F. All-electron magnetic response with pseudopotentials: NMR chemical shifts. Phys. Rev. B 2001, 63, 245101. [Google Scholar] [CrossRef] [Green Version]
- Sezutsu, H.; Yukuhiro, K. Dynamic Rearrangement Within the Antheraea pernyi Silk Fibroin Gene Is Associated with Four Types of Repetitive Units. J. Mol. Evol. 2000, 51, 329–338. [Google Scholar] [CrossRef] [PubMed]
- Nakazawa, Y.; Asakura, T. High-Resolution 13C CP/MAS NMR Study on Structure and Structural Transition of Antheraea pernyi Silk Fibroin Containing Poly(L-alanine) and Gly-Rich Regions. Macromolecules 2002, 35, 2393–2400. [Google Scholar] [CrossRef]
- Lu, Q.; Hu, X.; Wang, X.; Kluge, J.A.; Lu, S.; Cebe, P.; Kaplan, D.L. Water-insoluble silk films with silk I structure. Acta Biomater. 2010, 6, 1380–1387. [Google Scholar] [CrossRef] [PubMed] [Green Version]
- Monti, P.; Taddei, P.; Freddi, G.; Asakura, T.; Tsukada, M. Raman spectroscopic characterization of Bombyx mori silk fibroin: Raman spectrum of Silk I. J. Raman Spectrosc. 2001, 32, 103–107. [Google Scholar] [CrossRef]
- Rousseau, M.-E.; Lefèvre, T.; Beaulieu, L.; Asakura, T.; Pézolet, M. Study of protein conformation and orientation in silkworm and spider silk fibers using Raman microspectroscopy. Biomacromolecules 2004, 5, 2247–2257. [Google Scholar] [CrossRef]
- Chen, X.; Shao, Z.; Marinkovic, N.S.; Miller, L.M.; Zhou, P.; Chance, M.R. Conformation transition kinetics of regenerated Bombyx mori silk fibroin membrane monitored by time-resolved FTIR spectroscopy. Biophys. Chem. 2001, 89, 25–34. [Google Scholar] [CrossRef]
- Taddei, P.; Monti, P. Vibrational infrared conformational studies of model peptides representing the semicrystalline domains of Bombyx mori silk fibroin. Biopolymers 2005, 78, 249–258. [Google Scholar] [CrossRef]
- Ming, J.; Pan, F.; Zuo, B. Influence factors analysis on the formation of silk I structure. Int. J. Biol. Macromol. 2015, 75, 398–401. [Google Scholar] [CrossRef] [PubMed]
- Bai, S.; Han, H.; Huang, X.; Xu, W.; Kaplan, D.L.; Zhu, H.; Lu, Q. Silk scaffolds with tunable mechanical capability for cell differentiation. Acta Biomater. 2015, 20, 22–31. [Google Scholar] [CrossRef] [PubMed] [Green Version]
- Hua, J.; You, H.; Li, X.; You, R.; Ma, L. Cu(II) ion loading in silk fibroin scaffolds with silk I structure. Int. J. Biol. Macromol. 2020, 158, 275–281. [Google Scholar] [CrossRef] [PubMed]
- Carissimi, G.; Baronio, C.M.; Montalbán, M.G.; Víllora, G.; Barth, A. On the Secondary Structure of Silk Fibroin Nanoparticles Obtained Using Ionic Liquids: An Infrared Spectroscopy Study. Polymers 2020, 12, 1294. [Google Scholar] [CrossRef]
Figure 1.
The primary structure of B. mori silk fibroin (H chain) was reported by Zhou et al. [13,14]. The 5263-amino acid residue chain is broken into domains and subdomains. The sequence number of the first residue and the length l of each domain are given in parentheses. The 25-residue motif in boldface characters is repeated between the header and the linkers. A one-residue (or three-residue) insertion in subdomain GX9.4 is also in boldface characters. Lower case letters s, y, a, and u represent frequently observed hexapeptides. Hexapeptides code and a number of copies; s, GAGAGS 433; y, GAGAGY 120; a, GAGAGA 27; u, GAGYGA 39. Reprinted with permission from ref. 14. Copyright 2001 John Wiley and Sons.

Figure 2.
13C solution NMR spectra of (a) the middle silk gland portion of living Samia cynthia ricini mature larva, (b) the abdomen of living S. c. ricini pupa and (c) the middle silk gland portion of living Bombyx mori mature larva together with the assignment [39,40]. Reprinted with permission from ref. 39. Modified from ref. 39.

Figure 3.
IR and 13C CP/MAS NMR (0–70 ppm) spectra of (AG)15 and B. mori silk fibroin with silk I structures [22]. Reprinted with permission from ref. 22.
Figure 3.
IR and 13C CP/MAS NMR (0–70 ppm) spectra of (AG)15 and B. mori silk fibroin with silk I structures [22]. Reprinted with permission from ref. 22.

Figure 4.
Observed 2D spin-diffusion NMR spectra of (a) (AG)6A[1-13C]G14[1-13C]A15G(AG)7 and (b) (AG)7[1-13C]A15[1-13C]G16(AG)7 with silk I structures for determination of the torsion angles (ϕ, ψ) of Ala15 and Gly16 residues, respectively. The calculated spectra are assuming the torsion angles of Ala15 (ϕ, ψ) = (−60°, 120°) and Gly16 (ϕ, ψ) = (70°, 10°) were also shown for comparison [22]. Reprinted with permission from ref. 22.

Figure 5.
Determination of the torsion angles, (ϕ, ψ) for Ala15 and Gly16 residues in (AG)15 with silk I structure from both 2D spin-diffusion NMR and REDOR experiments. The candidates of the torsion angles (red X marks) were determined from the observed 2D spin-diffusion NMR spectra in Figure 4. The atomic distances between 13C and 15N nuclei were determined to be 3.8 ± 0.1 Å for [1-13C]G14A15[15N]G16 and 3.2 ± 0.1 Å for [1-13C]A15G16[15N]A17, respectively from the observed REDOR data [22]. Reprinted with permission from ref. 22. Modified from ref. 22.

Figure 6.
2D spin-diffusion NMR spectrum of (AG)6A[1-13C]G14A15[1-13C]G16(AG)7. The torsion angles of Ala15 residue were set as (ϕ, ψ) = (−60°, 120°), and therefore, the spectral pattern depends on the torsion angles, (ϕ, ψ) of Gly16. The calculated spectra for three torsion angles, (ϕ, ψ) = (70°, 10°), (100°, 0°) and (100°, −60°) selected from Figure 5 are shown [22]. Reprinted with permission from ref. 22.

Figure 7.
Packing structure of poly(AG) chains with type II β−turn structure as a model for silk I. Dotted lines denote intra-(green) and inter-(red) molecular hydrogen bonds. The unit lattice values, a, b and c were obtained from X-ray diffraction data [21,22]. Reprinted with permission from ref. 22. Modified from ref. 22.

Figure 8.
(Left) Picture of an isolated (AG)n chain with type II β-turn structure. (Right) Observed plots of ΔS/S0 (= 1 − S/S0) values against the corresponding NcTr values forREDOR experiments of (AG)6A[1-13C]G14AG[15N]A17G(AG)6 to determine the distance between the [1-13C]Gly14 and [15N]Ala17 nuclei. Continuous and dotted lines show the theoretical dephasing curves corresponding to the designated distances. By comparing the REDOR data and the theoretical dephasing curve, the 13C-15N interatomic distance was determined to be 4.0 ± 0.1 Å. Reprinted with permission from ref. 21. Modified from ref. 21. Copyright 2001 Elsevier.

Figure 9.
The relationship between the torsion angles (ϕ, ψ) of the (i + 1) and (i + 2)-th residues in Figure 8 and several types of β-turn structures. (a) The (ϕ, ψ) maps for typical type I, type II, type I′, type II′, and type VIII β-turns and an illustration of the type II β-turn conformation. (b) The 25 best matches for torsion angles (ϕ, ψ) of each residue of the GAGSGAGA motif obtained from the observed 13C solution NMR chemical shifts of B. mori liquid silk using the TALOS-N program [77,78]. (c) The structural model constructed using the averaged (ϕ, ψ) angles in the red circles in (b) for each motif. Hydrogen bonds are assumed to exist between the CO of the (i)-th and the NH of the (i+3)-th residues for the GAGSGAGA motif [76]. Reprinted with permission from ref. 76.

Figure 10.
2D 1H (920 MHz) DQMAS NMR spectrum and the skyline projection of (AG)15 with silk I structure together with assignments. The DQ correlations ①–⑮ are shown on the right-side [86]. Reprinted with permission from ref. 86. Modified from ref. 86.
Figure 10.
2D 1H (920 MHz) DQMAS NMR spectrum and the skyline projection of (AG)15 with silk I structure together with assignments. The DQ correlations ①–⑮ are shown on the right-side [86]. Reprinted with permission from ref. 86. Modified from ref. 86.

Figure 11.
The stick spectra for the 1H, 13C, and 15N chemical shifts were calculated for (AG)15 with silk I structure together with the observed chemical shifts [86]. The reference chemical shift was shown to be the mean of the calculated and observed chemical shifts for all peaks. The values were 30.51 ppm, 171.31 ppm, and 197.22 ppm for 1H, 13C, and 15N nuclei, respectively. Reprinted with permission from ref. 86.

Figure 12.
Intra- and intermolecular chain arrangements of (AG)15 molecules with type II β-turn structure (Figure 7) in calculating the 1H-1H distances for the DQ correlations ①–⑮ in Table 2 using coordinates of the 1H atoms. For example, in the column ①, G-HN A-HN 2.83 (5 3) in Table 2 means that the 1H-1H distance is calculated to be 2.83 Å between HN Gly and HN Ala residues in the chain number 5 (bold) in the group (ab) and the number of AG segment 3 (bold) in the group (bc). In addition, G-HN A-HN 3.43 (4 3) in Table 2 means that the 1H-1H distance is calculated to be 3.43 Å between HN Gly and HN Ala residues in the chain number 4 in the group (ab) and the number of AG segment 3 in the group (bc). Reprinted with permission from ref. 86. Modified from ref. 86.

Figure 13.
FTIR (solid line) and second derivative (dashed line) spectra of (a) B. mori silk fibroin membrane as cast with silk I structure and (b) A. pernyi silk fibroin membrane as cast [36,37]. Reprinted with permission from ref. 36.


Table 1.
Observed (Iobs) and calculated (Icald) structure amplitudes for type II β-turn as the model of silk I [22,48,74]. Reprinted with permission from ref. 22. Modified from ref. 22.
| Data No. | (hkl) | Iobs | Icald | Data No. | (hkl) | Iobs | Icald | Data No. | (hkl) | Iobs | Icald |
|---|---|---|---|---|---|---|---|---|---|---|---|
| 1 | (011) | 75 | 89 | 11 | (122) | 76 | 75 | 17 | (043) | 121 | 100 |
| (020) | (201) | ||||||||||
| 12 | (013) | 49 | 20 | (211) | |||||||
| 2 | (021) | 42 | 45 | (140) | (004) | ||||||
| (220) | |||||||||||
| 3 | (002) | 151 | 164 | 13 | (042) | 115 | 108 | (133) | |||
| (110) | (023) | (014) | |||||||||
| (051) | |||||||||||
| 4 | (012) | 93 | 81 | (141) | 18 | (221) | 68 | 83 | |||
| (031) | (132) | (152) | |||||||||
| (101) | (160) | ||||||||||
| 14 | (033) | 58 | 46 | ||||||||
| 5 | (111) | 32 | 79 | (103) | 19 | (230) | 70 | 47 | |||
| (120) | (113) | (062) | |||||||||
| (024) | |||||||||||
| 6 | (022) | 37 | 42 | 15 | (150) | 142 | 144 | ||||
| (052) | 20 | (161) | 106 | 116 | |||||||
| 7 | (121) | 156 | 128 | (142) | (231) | ||||||
| (040) | (060) | (202) | |||||||||
| (151) | (212) | ||||||||||
| 8 | (130) | 42 | 35 | (123) | (053) | ||||||
| (041) | (200) | (043) | |||||||||
| 9 | (032) | 43 | 49 | 16 | (210) | 63 | 36 | 21 | (034) | 74 | 63 |
| (102) | (061) | (104) | |||||||||
| (071) | |||||||||||
| 10 | (112) | 123 | 129 | ||||||||
| (131) |
Table 2.
The intra- and intermolecular 1H-1H distances (in Å) of (AG)15 molecules with type II β-turn structure calculated using the coordinates of 1H atoms obtained from the CASTEP calculation.
Table 2.
The intra- and intermolecular 1H-1H distances (in Å) of (AG)15 molecules with type II β-turn structure calculated using the coordinates of 1H atoms obtained from the CASTEP calculation.
| DQ Correlation | Intra-Molecular | Inter-Molecular | ||||
|---|---|---|---|---|---|---|
| ① | G-Hɴ | A-Hɴ | 2.83 | (5 3) | 3.43 | (4 3) |
| ② | G-Hɴ | A-Hα | 2.12 | (5 2) | 3.46 | (4 3) |
| ③ | G-Hɴ | G-Hα1 | 2.30 | (5 3) | ||
| ④ | G-Hɴ | G-Hα2 | 2.88 | (5 3) | 2.76, 3.42 | (2 5),(4 3) |
| ⑤ | A-Hɴ | A-Hα | 2.86, 3.52 | (5 3),(5 2) | 2.96 | (4 3) |
| ⑥ | A-Hɴ | G-Hα1 | 3.28, 3.99 | (5 3),(5 2) | ||
| ⑦ | A-Hɴ | G-Hα2 | 3.47 | (5 3) | ||
| ⑧ | G-Hɴ | A-Hβ | 3.89 | (5 2) | ||
| ⑨ | A-Hɴ | A-Hβ | 2.87 | (5 3) | ||
| ⑩ | A-Hα | G-Hα1 | 3.23 | (6 3) | ||
| ⑪ | A-Hα | G-Hα2 | 3.66 | (9 4) | ||
| ⑫ | A-Hα | A-Hβ | 2.70 | (5 3) | ||
| ⑬ | G-Hα1 | A-Hβ | 3.65 | (5 4) | 3.56 | (2 4) |
| ⑭ | G-Hα2 | A-Hβ | 3.60 | (3 4) | ||
| ⑮ | G-Hα1 | G-Hα2 | 1.77 | (5 3) | ||
The number of the DQ correlations ①–⑮ is the same as those in Figure 10. Reprinted with permission from ref. 86. Modified from ref. 86.
Publisher’s Note: MDPI stays neutral with regard to jurisdictional claims in published maps and institutional affiliations. |
© 2021 by the author. Licensee MDPI, Basel, Switzerland. This article is an open access article distributed under the terms and conditions of the Creative Commons Attribution (CC BY) license (https://creativecommons.org/licenses/by/4.0/).
Share and Cite
MDPI and ACS Style
Asakura, T. Structure of Silk I (Bombyx mori Silk Fibroin before Spinning) -Type II β-Turn, Not α-Helix-. Molecules 2021, 26, 3706. https://doi.org/10.3390/molecules26123706
AMA Style
Asakura T. Structure of Silk I (Bombyx mori Silk Fibroin before Spinning) -Type II β-Turn, Not α-Helix-. Molecules. 2021; 26(12):3706. https://doi.org/10.3390/molecules26123706
Chicago/Turabian StyleAsakura, Tetsuo. 2021. "Structure of Silk I (Bombyx mori Silk Fibroin before Spinning) -Type II β-Turn, Not α-Helix-" Molecules 26, no. 12: 3706. https://doi.org/10.3390/molecules26123706