Article

Micro-Raman Study of Thermal Transformations of Sulfide and Oxysalt Minerals Based on the Heat Induced by Laser

1
Key Laboratory of Marine Geology and Environment & Center of Deep Sea Research, Institute of Oceanology, Chinese Academy of Sciences, Qingdao 266071, China
2
Laboratory for Marine Geology, Qingdao National Laboratory for Marine Science and Technology, Qingdao 266061, China
3
University of Chinese Academy of Sciences, Beijing 101408, China
4
Center for Ocean Mega-Science, Chinese Academy of Sciences, Qingdao 266071, China
*
Author to whom correspondence should be addressed.
Minerals 2019, 9(12), 751; https://doi.org/10.3390/min9120751
Submission received: 8 November 2019 / Revised: 28 November 2019 / Accepted: 29 November 2019 / Published: 3 December 2019

Abstract

:
The minerals in the hydrothermal and cold seep system form at different temperatures and show responses to the laser power to varying degrees. Here, we focus on the heat-induced by laser to study thermal transformations of the chalcopyrite, covellite, pyrite, barite, and aragonite based on Raman spectroscopy. Chalcopyrite mainly transforms into hematite, and covellite mainly transforms into chalcocite with the increase of laser power. Interestingly, comparing with the previous study, the pyrite can transform to the marcasite firstly, and form hematite finally. We also find that high-temperature opaque chalcopyrite is more likely to occur thermal transformations due to the smaller absolute energy difference (|ΔE1|) based on the frontier orbital theory. In contrast, the oxysalt minerals won’t transform into new components under high laser power. However, the structure of the barite has been destroyed by the high laser power, while the more transparent aragonite is not affected by the high laser power due to the laser penetrates through the transparent aragonite crystal and causes little heat absorption. Finally, we established the minimum laser power densities for thermal transformations of these minerals formed under different environments. The above study provides a simple way to study the thermal transformations of minerals by the local heat-induced by laser and also enlightens us to identify the minerals phases precisely.

Graphical Abstract

1. Introduction

The hydrothermal and cold seep system is one of typical extreme environments in the deep-sea. The shocking discoveries of deep-sea hydrothermal in the 1970s have been crucial for the formation of ore resources, the supply of exotic deep-sea ecosystems, and even for the origin of life [1,2]. Sulfides are typical mineral resources, provide important evidence of hydrothermal activity, and reflect different physicochemical environments [3,4,5]. Furthermore, hydrothermal chimneys are mainly composed of sulfides that form at different temperatures and reflect differences in the hydrothermal fluids [6]. In addition to high-temperature hydrothermal systems, the low-temperature cold seep systems are significant for exploring gas hydrates. The study of authigenic carbonates is a key to understand the seepage activity [7,8]. The carbonate minerals in the cold seep system indicate different fluid compositions, such as SO42− concentration, alkalinity et al. [9,10]. The minerals from hydrothermal and cold seep system form at different temperatures reflect different physicochemical environments. The study of the formation and transformations process of sulfide and oxysalt mineral is conducive for identifying theses minerals, indicating the fluid activities and assessing the ore resources precisely.
As an optical technique, Raman spectroscopy is nondestructive, convenient, does not require special or complex sample preparation, and has been used in various fields and environments [11,12,13,14]. Raman spectroscopy has been used to identify minerals efficiently [15,16,17,18]. The Raman point-count method was used to identify the main mineral phase in rocks [19]. Changes in band positions may result from slight compositional differences under the same peak fitting routine [20,21]. The technique can also provide structural information on the minerals, especially for the polymorphism minerals that two or more minerals have the same chemical composition but different crystal structures. The full width at half maximum (FWHM) of Raman peaks reflects the degree of crystallinity, and a wider FWHM represents a lower degree of crystallinity [11,21,22]. The lowering in crystallinity can disrupt the regularity of the crystal structure by ion substitution in the crystalline lattice. The Raman spectroscopy has also been used to monitor the changes of minerals, such as structure, component, by controlling various complex devices of temperature and pressure [23,24]. In addition, the lasers can induce heat in the local area under high laser power [25,26]. Such laser heat can have great effects on the samples themselves as well as the wavenumbers and peak width [27,28]. Whether the heat caused by high laser energy affects the transformation process of hydrothermal sulfides and carbonate minerals is worthy of studying. Furthermore, there is also a lack of systematic research comparing the thermal transformations of minerals formed at different temperatures in the hydrothermal and cold seep system.
Here, we focus on the thermal transformations of typical sulfides and oxysalt minerals formed at different temperatures based on the heat-induced by laser. The study mainly discusses the thermal transformation process of minerals and also enlightens us to pay attention to the detailed thermal alteration of minerals under high laser powers. In addition, we can deepen the cognition of optical characteristics of minerals via the responses of different minerals to laser energy.

2. Samples and Methods

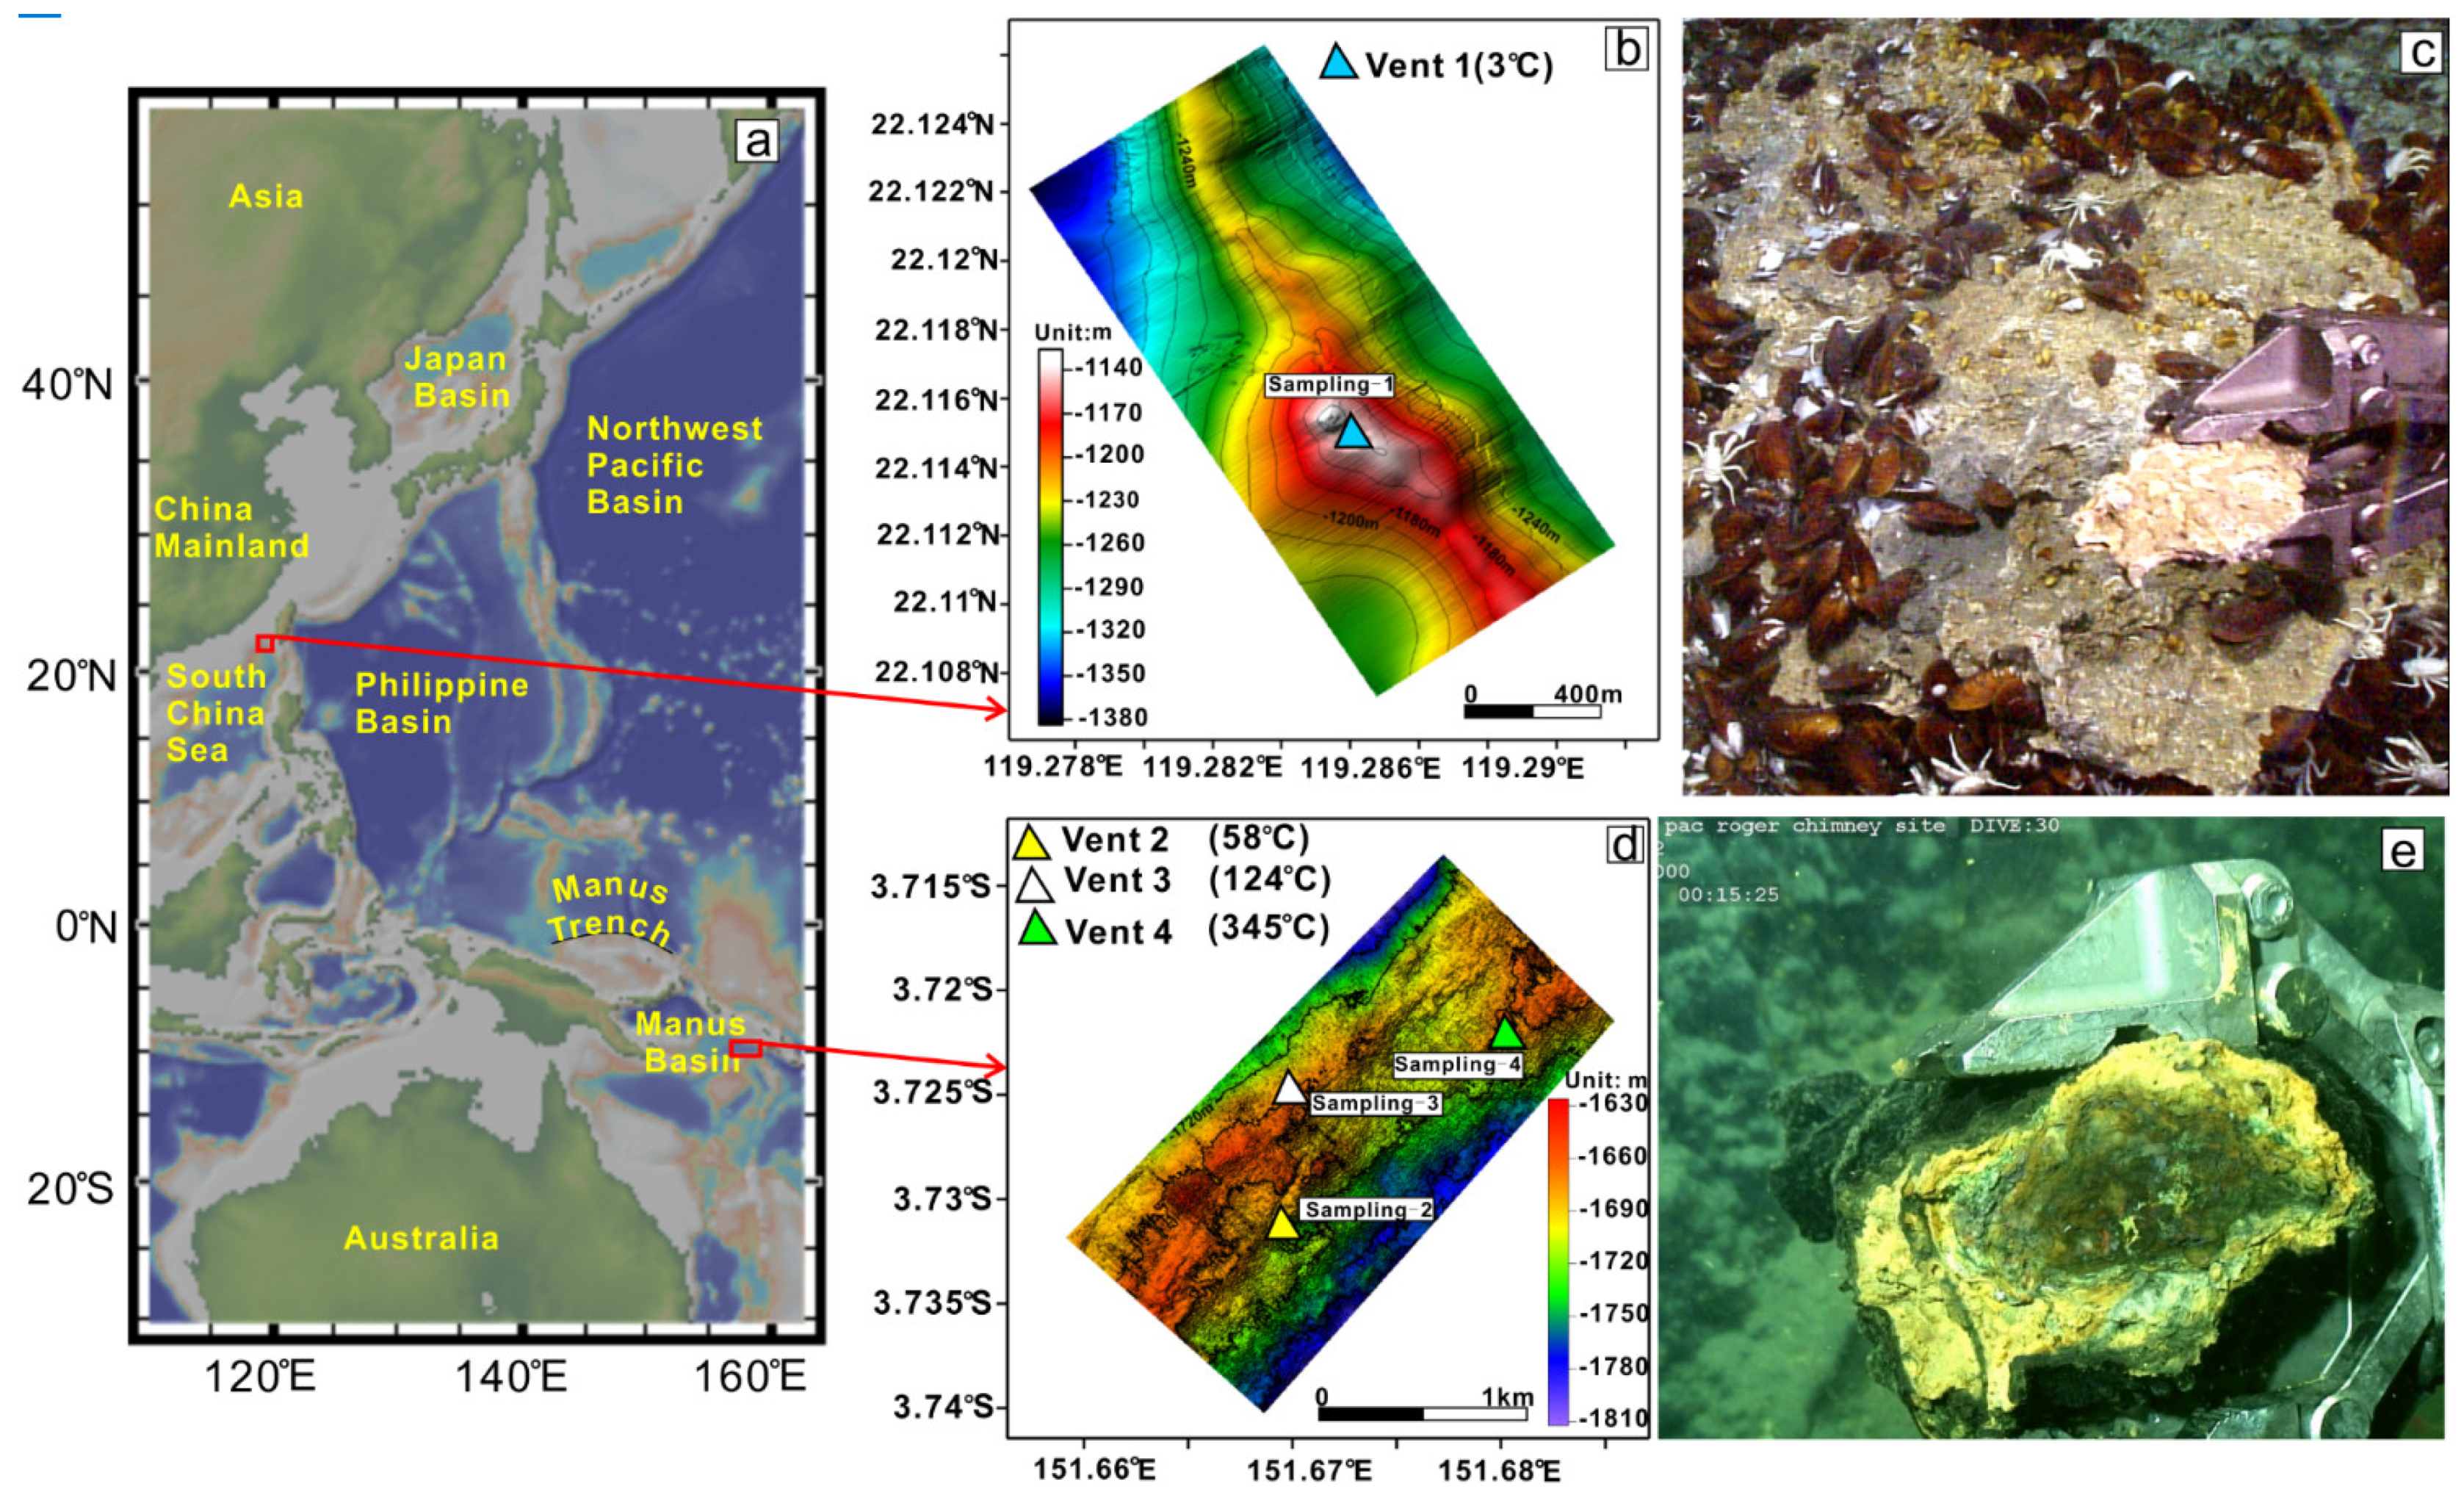
2.1. Samples Characteristics
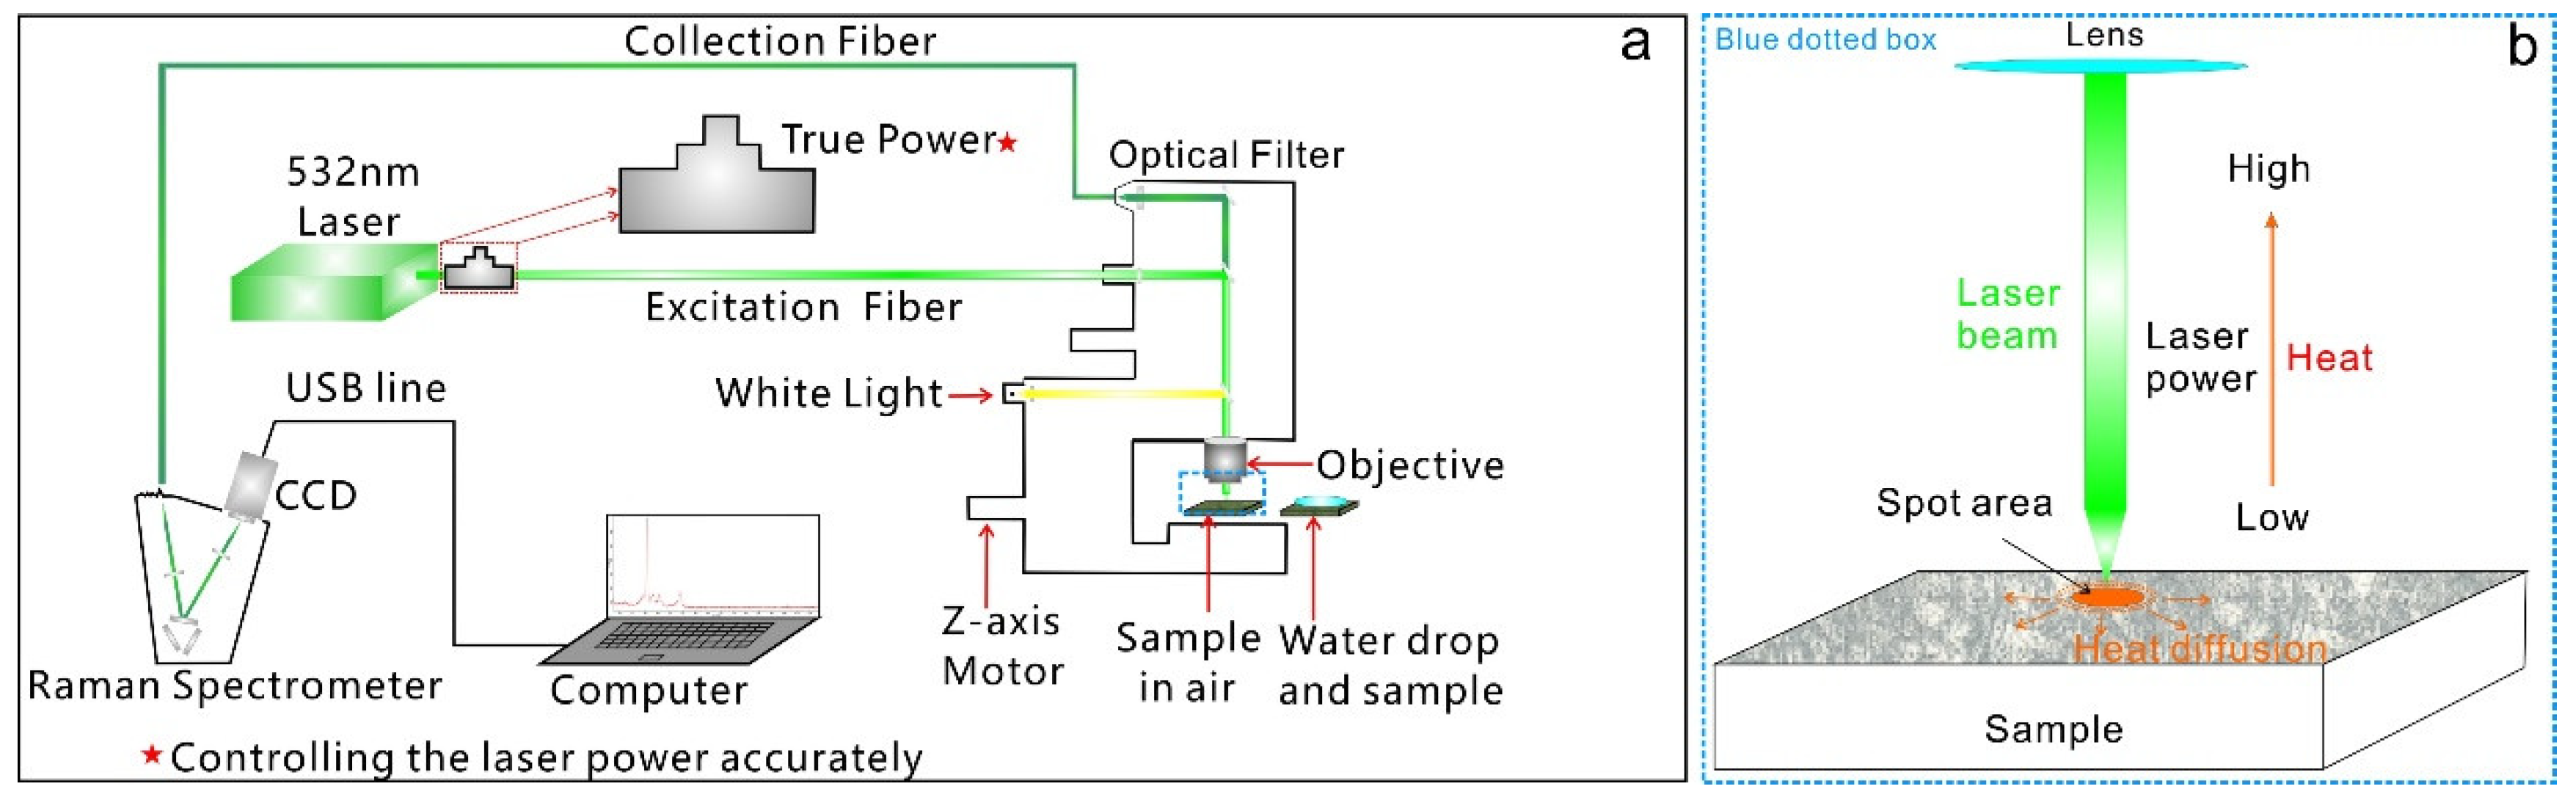
During the RV Kexue cruise in 2015, we collected valuable hydrothermal sulfides at hydrothermal vents with different temperatures in the PACMANUS (Papua New Guinea–Australia–Canada Manus) hydrothermal fields, Manus Basin, Papua New Guinea, with a water depth of 1680 m. Authigenic carbonate rocks were collected in the Formosa cold seep area, Southwest Taiwan Basin, South China Sea, with a water depth of 1123 m (Figure 1).
Hydrothermal minerals form at different temperatures, sulfides, are also called volcanogenic massive sulfide (VMS) and show various characteristics. The hydrothermal minerals that represent different fluid environments in this study are chalcopyrite (CuFeS2), pyrite (FeS2), covellite (CuS), and barite (BaSO4). The typical cold seep carbonate mineral in this study is aragonite (CaCO3). The three sulfide minerals and two oxysalt minerals are widely distributed in the hydrothermal and cold seep systems, respectively, and represent typical fluid environments. The formation and transformations processes of minerals are significant for studying the evolution of fluids (Table 1).

2.2. Methods

All Raman measurements were performed by using a confocal Raman microscope (WITec alpha300 R system, WITec Company, Ulm, Germany) at the Institute of Oceanology, Chinese Academy of Sciences. The laser excitation wavelength was 532 nm. Two gratings were applied in the spectrometer: 600 g/mm with a spectral resolution of 3 cm−1, and 1800 g/mm with a spectral resolution of 1 cm−1. A ZEISS EC Epiplan (Carl ZEISS, Jena, Germany) 50×/0.75 was used with a focus spot size of 1.5 µm. The true power function of the WITec system (WITec alpha300 R system, WITec Company, Ulm, Germany), which can control the output laser power exactly, was critical to this study (Figure 2). The laser power will decrease during the transmitting process in the fiber. The true power on the sample takes up 90% of the set laser power. The calculated laser powers were applied in this study. To obtain a more precise reference laser power, we collected Raman spectra at 0.50 mW intervals from 1.47 mW to 40.20 mW.
Raman spectra of samples are collected directly. However, samples are usually rough. To obtain higher-quality Raman spectra, we cut and polished some samples to yield smooth surfaces. We collected the Raman spectra of samples at the same position, and increased the laser power at 30 min intervals after finishing one measurement under one laser power, time conducive for reducing the cumulative heat on the sample. In addition, we also chose 10 other sample positions to obtain the minimum laser power for thermal transformations. For comparison with Raman measurements in air, we also added water drops to the samples to explore the effects of water on the samples under different laser powers.
Raman spectra of the samples were collected by using Control FIVE software (Control Five 5.0, WITec Company, Ulm, Germany) over a range of 0–4000 cm−1. Each spectrum was collected using five accumulations and an integration time of 10 s, which caused a high signal-to-noise ratio (SNR). The software can also take large-area scans of samples, and the spatial resolution of the system is up to 0.4 µm. The data processing software Project Five 5.0 (Control Five 5.0, WITec Company, Ulm, Germany) and GRAMS Suit® 9.3 (Thermo Fisher Scientific, Inc., Waltham, MA, USA) were used for baseline calibration and peak fitting. Gaussian peak fitting was used to obtain the peak position, FWHM, and peak area.

3. Results and Discussion

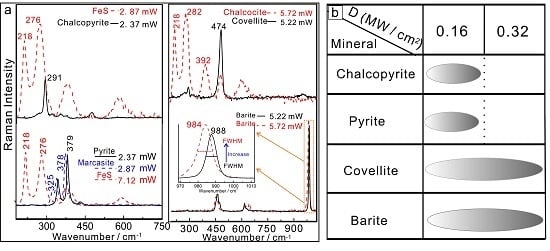
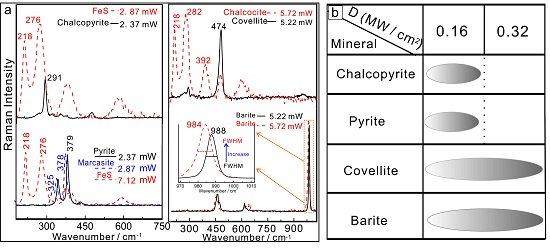
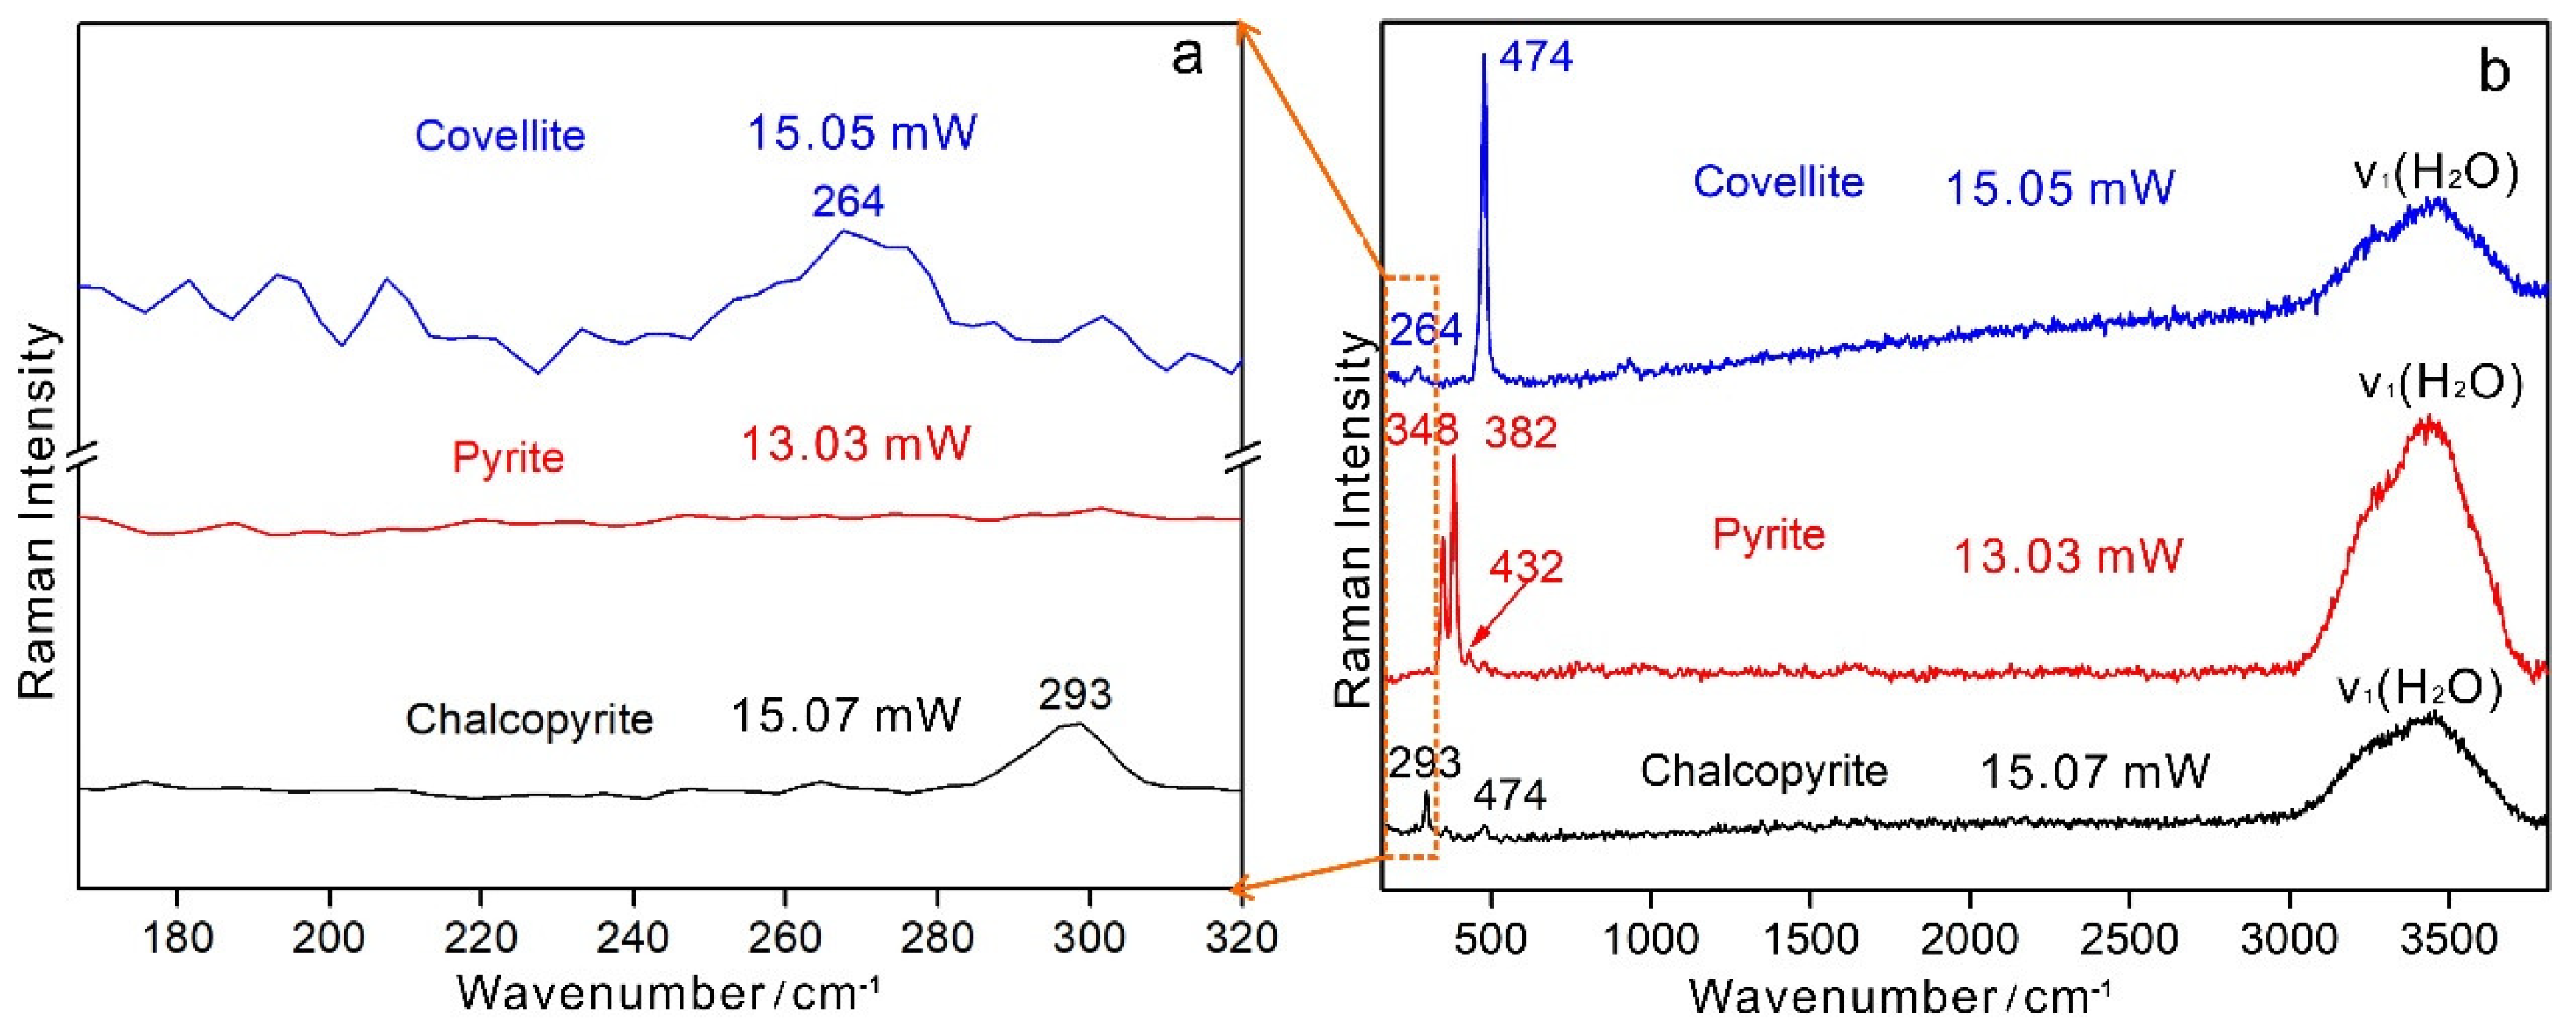
3.1. Thermal Transformations on the Sulfide Minerals

All of the Raman spectra of samples in air and water were collected under the same conditions. The samples are mainly composed of sulfide and oxysalt minerals. The effects of laser power on samples formed at different temperatures show obvious differences, especially in sulfide minerals from the hydrothermal system. New Raman peaks appear in the Raman spectra of sulfide minerals with increasing laser power (Figure 3). Here, we discuss the thermal transformations of sulfide minerals. The sulfide minerals in this study are mainly chalcopyrite, pyrite, and covellite.

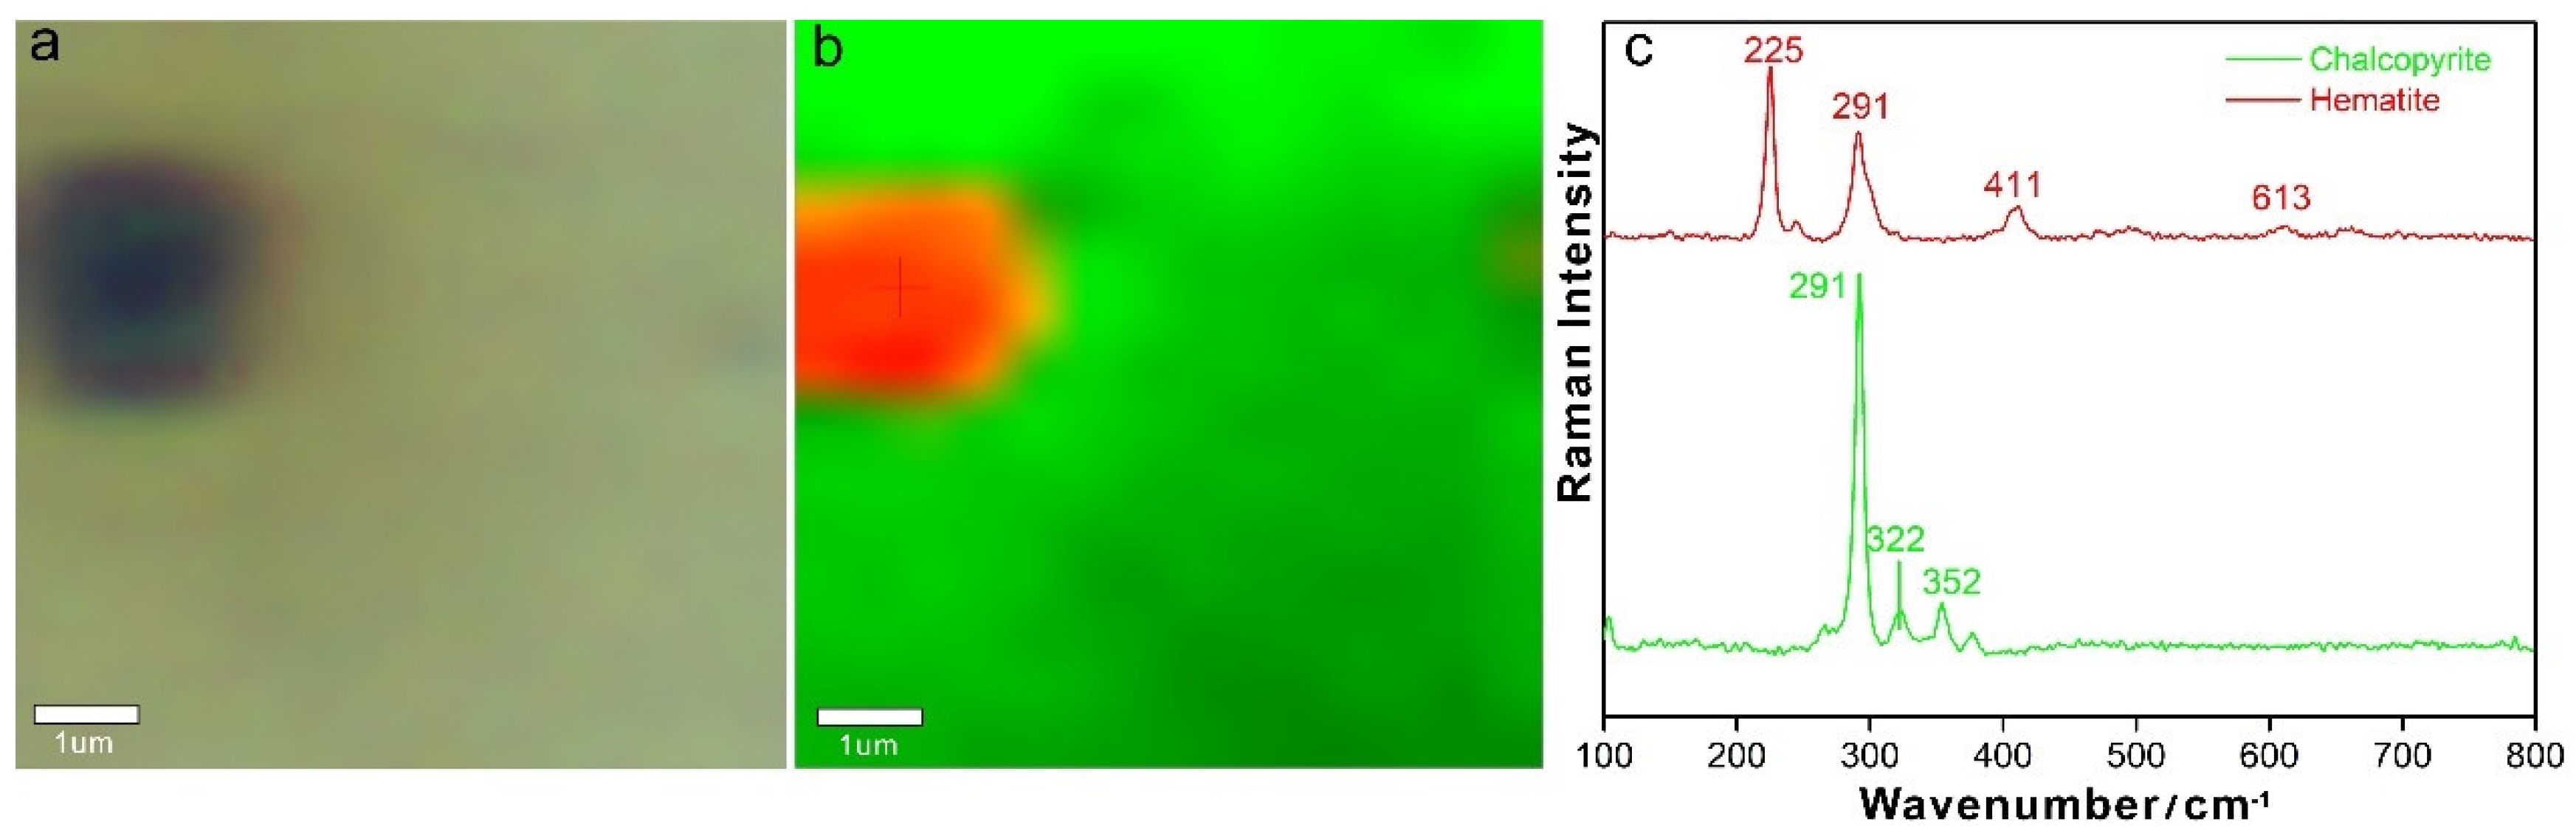
3.1.1. Thermal Transformations of High-Temperature Chalcopyrite

Chalcopyrite (CuFeS2) shows a tetragonal crystal structure [34]. The main band of chalcopyrite at 290 cm−1 is assigned to the A1 symmetric vibration mode, the bands 321 cm−1 and 351 cm−1 belong to B2/E modes, which is consistent with chalcopyrite reference data in the RRUFF database (An integrated study of the chemistry, crystallography, Raman and infrared spectroscopy of minerals. http://rruff.info/) [35] as well as the report [20]. In this study, we collected the Raman spectra of chalcopyrite with 10 s integration time firstly. The Raman spectra at 10 s showed low SNRs (signal-to-noise ratios) due to the high noise. To increase the SNR, the integration time was increased to 50 s. With increasing laser power at one position, the Raman measurements in air show obvious changes starting at 2.87 mW, and micro-observations of the samples show obvious alterations (Figure S1), the Raman spectra also showed new peaks at 216 cm−1 and 278 cm−1 (Figure S2a). Chalcopyrite is not as stable as pyrite under local heating, and the bonding within the crystal structure is weak [26]. The two new Raman peaks at 216 cm−1 and 278 cm−1 suggest the occurrence of a new component (Figure 3a), which is consistent with the reported Raman peaks of FeS at 215 cm−1 and 278 cm−1 [36]. The results indicate chalcopyrite has been oxidized into FeS firstly at 2.87 mW.
The Fermi level is a hypothetical energy level of an electron and is related to the electronic band structure in determining electronic properties. Usually, it refers to the highest electron energy levels at absolute zero temperature for a metal. An electronic system in thermal equilibrium has a uniform Fermi level, where electrons transfer from the higher Fermi level to the lower Fermi level [37,38]. Important physicochemical reactions always occur near the Fermi level because the electrons near the Fermi level are active [39,40]. Chalcopyrite, which has similar characters as metal, may undergo some physicochemical reactions. Furthermore, the density of states (DOS) is an important concept in the research of solid physics, which refers to the number of states per interval of energy at each energy level available to be occupied; the DOS near the Fermi level of chalcopyrite is composed of Fe 3d and S 4p orbits. The energy of the d electron orbit is higher than that of the p electron orbit. Fe is more active than Cu and reacts with O2 in the air to form new minerals, such as hematite (Fe2O3) and magnetite (Fe3O4). The Raman maps of the alteration area indicate the existence of hematite (Figure 4). The focused laser radiation of the WITec system can result in a local high-temperature environment at the sample. Therefore, the chalcopyrite transforms into hematite under high laser power finally.
We also chose 10 additional points to measure the laser alteration of chalcopyrite with a 50 s integration time. The chosen chalcopyrite samples were all altered by the heat-induced by the laser power. The minimum transformations laser powers focus on 2.87 mW (Figure S3a). The results show that the chalcopyrite suffers from thermal transformations with elevated laser powers. The integration time is also a key factor for thermal degradation. Long integration times at high laser power irradiation can damage samples to a certain extent. To increase the SNR, the integration time in this study was 50 s. We found that there were common alterations in the chalcopyrite samples (Figure S3a). Considering the thermal transformations under long integration time, we changed the integration time to 10 s to observe any changes. The micro-observations do not reveal alteration phenomena. The Raman spectra of chalcopyrite with a 10 s integration time barely show any new peaks, which suggests chalcopyrite doesn’t change under the low integration time (Figure S3a). The maximum size of chalcopyrite analyzed in this study is 20 µm. The heat induced by the laser at the small grain size because such small particles cannot transfer heat sufficiently. Furthermore, the spot size on the sample in this study is 1.5 µm. The smaller spot size in this study also causes a high laser power density on the sample, which makes alterations possible. It is more likely that chalcopyrite with a smaller spot size suffers from thermal transformations under long integration time.

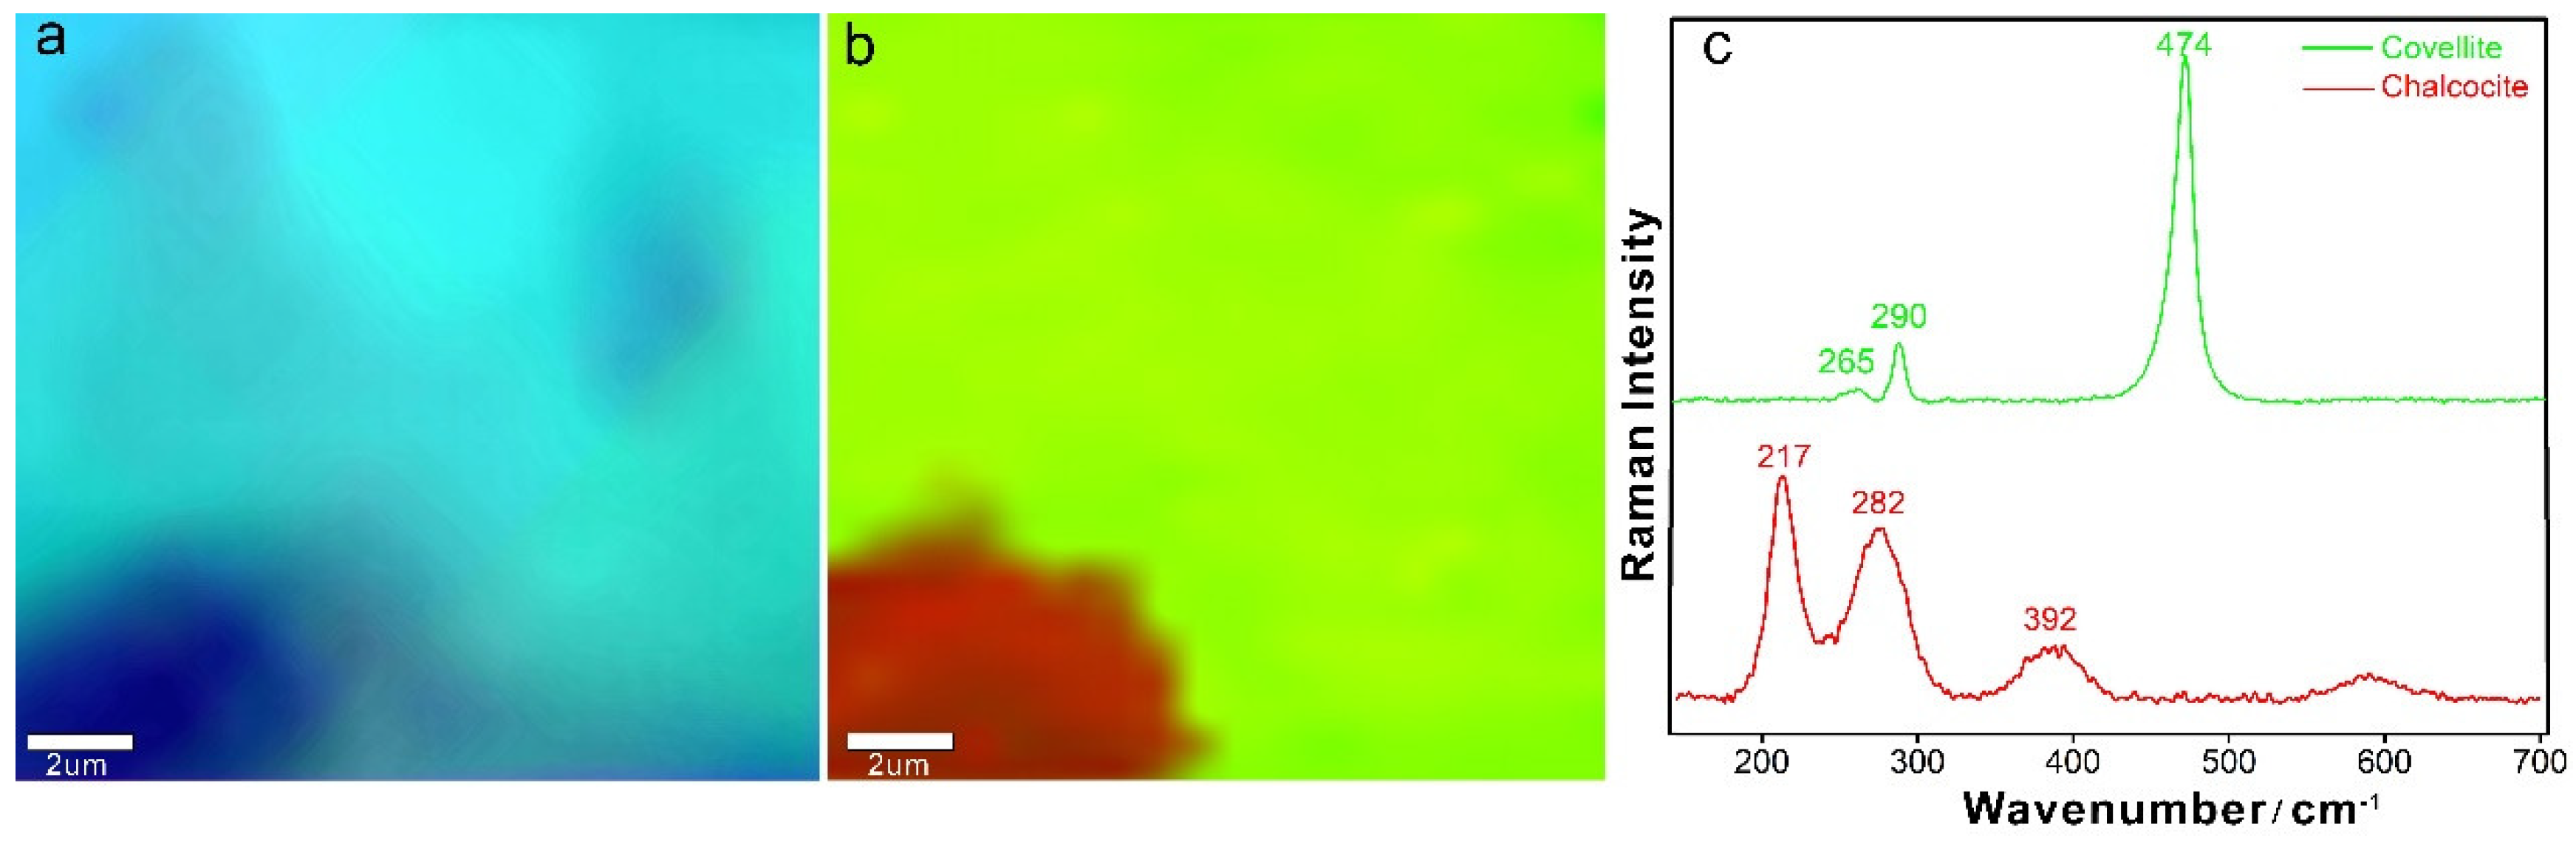
3.1.2. Thermal Transformations of Moderate- to Low-Temperature Covellite

Covellite (CuS) belongs to the group of layered sulfides. The main Raman band at 473 cm−1 and a minor band at 267 cm−1 correspond to the vibrational mode of Cu–S band (Figure 3b) [20,34], which is also consistent with the covellite reference data in the RRUFF database [35]. In this study, there are transformations of covellite (Figure S1c) and new peaks with the increase of laser power in one position (Figure S2b). The new peaks at 217 cm−1, 282 cm−1, and 392 cm−1 that become more obvious at 5.72 mW (Figure 3b), which suggests the occurrence of new compositions. The above phenomena suggest that covellite also suffers from thermal transformations at elevated laser powers. The heat induced by high laser powers oxidizes covellite in the air to a great extent. One of the products in the thermal oxidation of covellite is chalcocite [41]. The new peaks at 217 cm−1, 282 cm−1, and 392 cm−1 are consistent with the Raman spectra of chalcocite (Cu2S) reported in the RRUFF database (RRUFF ID: R050067.2). The Raman mapping of the alteration area shows obvious differences in covellite and chalcocite (Figure 5). The thermal oxidation of covellite is a continuous process with increasing heat. We also chose 10 other points to collect the Raman spectra of covellite with 50 s integration time. The covellite at 5.22 mW does not show any change, which is in contrast to the alteration at 5.72 mW (Figure S3b). Therefore, the minimum thermal transformations laser power is focused on 5.72 mW. We also changed the integration time to 10 s, and the covellite sample hardly alter at 5.72 mW, which also suggests that a long integration time is a key factor for inducing alteration.

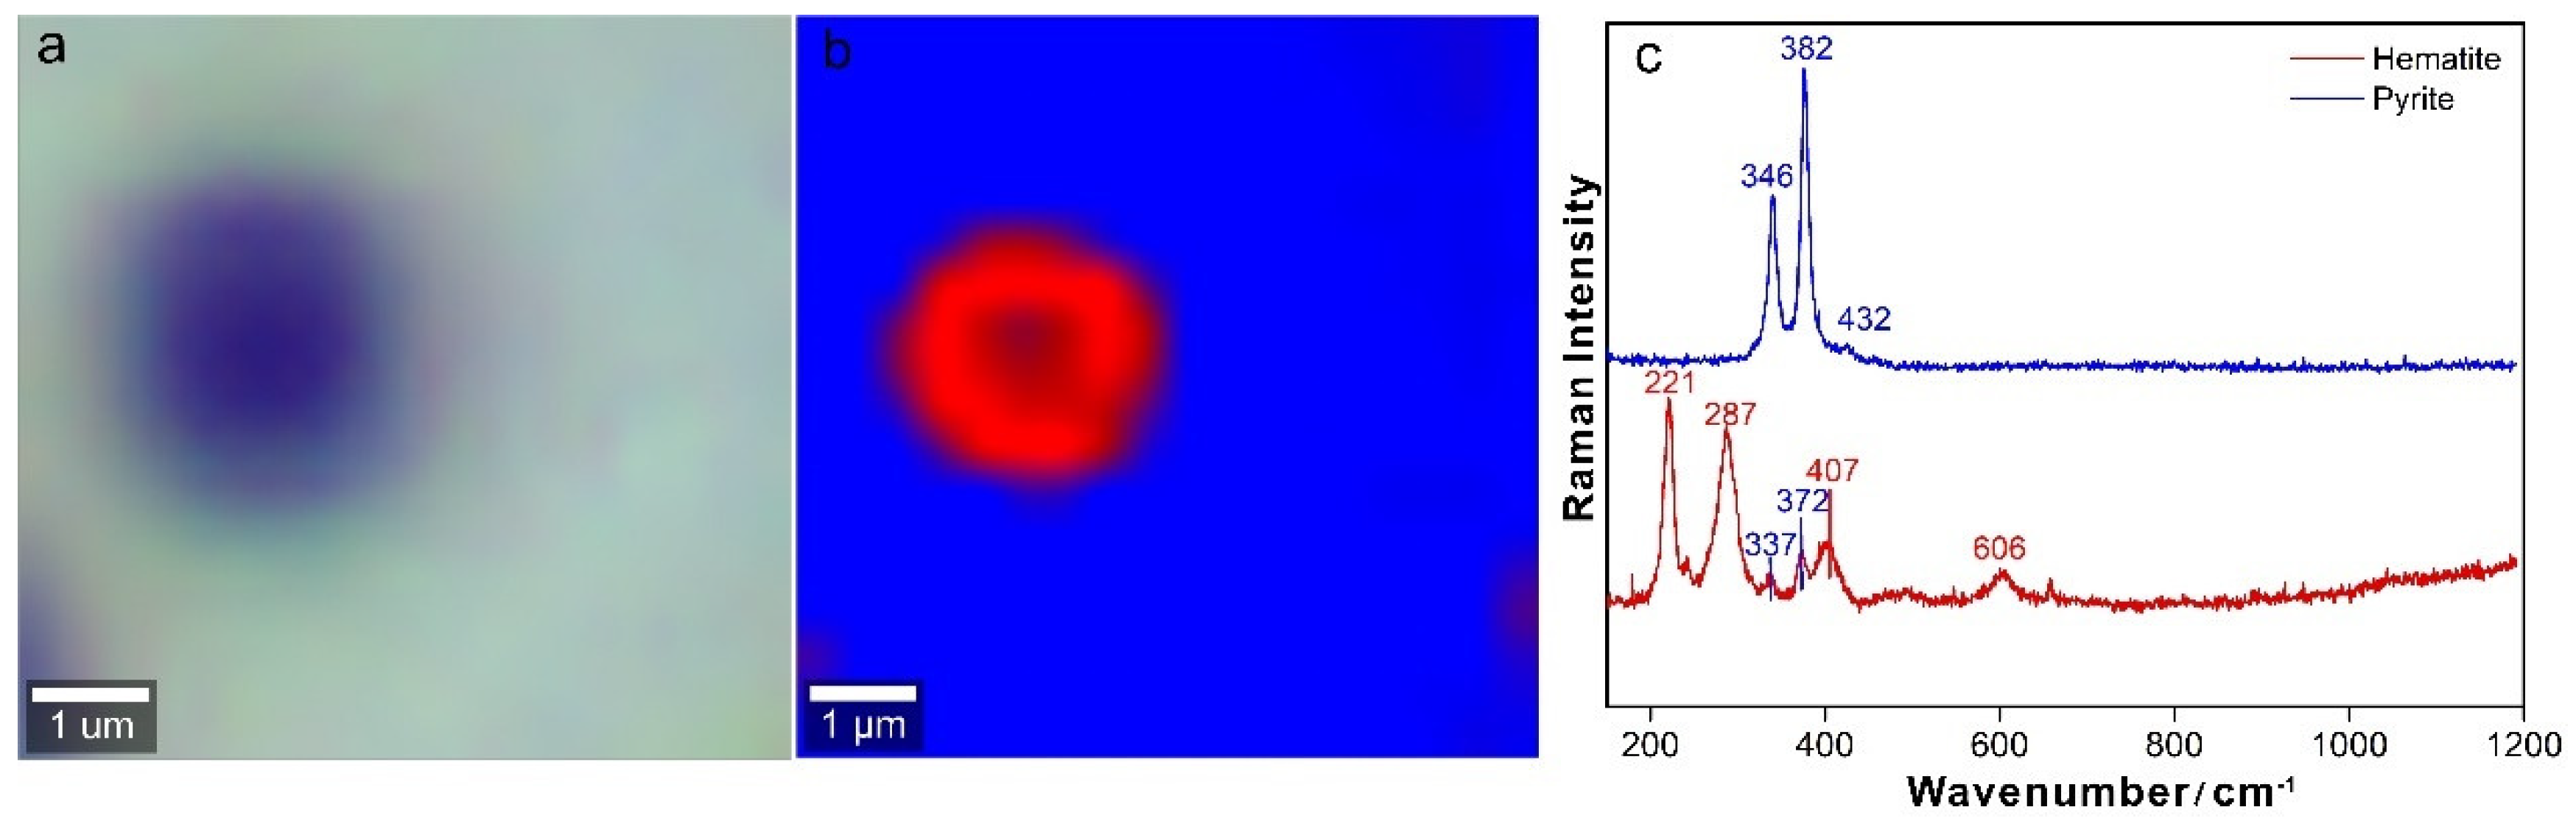
3.1.3. Thermal Transformations of Moderate- to Low-Temperature Pyrite

Pyrite (FeS2) has a cubic symmetric structure. The two dominant Raman peaks of pyrite at 346 cm−1 and 382 cm−1 correspond to the Ag and Eg vibrational modes, respectively [20] (Figure 3c). In addition, the minor band at 432 cm−1 belongs to the Tg vibrational mode [20], which is consistent with the pyrite reference data in the RRUFF database. The pyrite becomes altered gradually at the microimages (Figure S1b) and Raman spectra (Figure S2c) with increasing laser power at the same position.
Interestingly, there are changes in the peak shapes of pyrite from 2.87 mW. The peaks become asymmetric, and a minor peak occurs at the shoulder (Figure 3c). After fitting the peaks based on the Gaussian function in the GRAMS Suit® 9.3, the peaks at 325 cm−1 and 382 cm−1 at 2.87 mW show the occurrence of marcasite due to the enhanced laser power (Figure 3d). In addition, clear Raman peaks at 215 cm−1 and 278 cm−1 appear (Figure 3c), which suggests that other compositions start appearing at 7.12 mW. Raman spectra of pyrite at other positions and samples were also collected, and the peaks at 325 cm−1 and 382 cm−1 still occur after Gaussian fitting.
Previous research has implicated the chain reaction of pyrite [42]. In this study, the occurrence of marcasite suggests a more detailed process occurs during the oxidization of pyrite in air. During thermal oxidization in air, pyrite may transform into marcasite firstly, and then the marcasite continues to be oxidized to FeS. Marcasite (FeS2) has the same chemical formula as pyrite; however, the orthorhombic structure of marcasite makes it distinct from pyrite in terms of its physical and crystal characteristics. Research has also shown that marcasite is more likely to be oxidized in the air [43]. FeS peaks begin to occur at 7.12 mW, while the peaks of pyrite disappear gradually at elevated laser powers. When the laser power is 10.14 mW, the Raman peaks at 221 cm−1, 287 cm−1, 407cm−1, and 606cm−1 indicate the existence of hematite (Figure 6).
The results of Raman mapping in the alteration area show the existence of hematite (Figure 7). Thus, pyrite will ultimately be oxidized to hematite, which is consistent with the previously reported results [42]. To obtain the minimum thermal transformations laser power, we also collected Raman spectra of pyrite at other sample positions, which shows that pyrite is not altered at 2.37 mW but is altered at 2.87 mW (Figure S3c). Therefore, the minimum transformations laser power of pyrite is also 2.87 mW. The Raman spectra of pyrite under these laser powers change and coexist with marcasite at 2.87 mW. We changed the integration time to 10 s; the pyrite sample remains unaltered with a minimum alteration laser power of 2.87 mW (Figure S3c). The smaller spot size also causes higher laser power densities on the thermal transformations of pyrite in this study.

3.1.4. Possible Explanations for the Thermal Transformations of Sulfide Minerals

The above results show that laser-induced heat can cause the thermal transformations of hydrothermal sulfide minerals. Metal sulfides formed in hydrothermal environments are more likely to react with O2 in air. The heat-induced by high laser powers can lead to the thermal oxidization of these metal sulfides due to long integration time and small spot size. Chalcopyrite formed at high temperatures is more likely to suffer from thermal oxidization in air.
Based on frontier orbital theory [44], the highest occupied molecular orbital (HOMO) and the lowest unoccupied molecular orbital (LUMO) are collectively referred to as the frontier orbital. The electrons in the front-line orbitals, such as the valence electrons in atomic orbitals, are the most reactive electrons in the chemical reactions. Molecular characteristics are dependent on frontier orbitals, and the HOMO and LUMO are the keys to determine the chemical reaction of a system. During a reaction, the electrons in the HOMO of molecule A and molecule B flow to each other’s unoccupied LUMO, causing the formation and breaking of chemical bonds and chemical reactions. Electrons flow easily only if the HOMO of molecule A (or B) is close to the LUMO of molecule B (or A), and the reaction is more likely to occur. The extent of interaction between the HOMO and LUMO is related to the absolute energy difference (|ΔE1|). A smaller |ΔE1| is conducive to reactions among molecules [45,46,47]. In this study, the altered metal sulfides all react with O2 in the air under high laser powers. Therefore, the frontier molecular orbitals of sulfides and oxygen are the keys to the oxidation reaction. |ΔE1| in this study is defined as
| Δ E 1 | c h a l c o p y r i t e = | E c h a l c o p y r i t e H O M O E o x y g e n L U M O |
| Δ E 1 | p y r i t e = | E p y r i t e H O M O E o x y g e n L U M O |
  | Δ E 1 | c o v e l l i t e = | E c o v e l l i t e H O M O E o x y g e n L U M O |
A small |ΔE1| suggests intense and possible interactions [48]. The values of the HOMO and LUMO energies of chalcopyrite, pyrite, covellite, and oxygen, as well as the absolute energy differences (|ΔE1|), are shown in Table 2.
E1|chalcopyrite < |ΔE1|covellite < |ΔE1|pyrite, suggesting a stronger interaction between chalcopyrite and oxygen. Therefore, the order of difficulty of the thermal oxidation of sulfides from easiest to most difficult is chalcopyrite, covellite and pyrite. In this paper, the lowest laser powers for the system resulting in thermal oxidization in chalcopyrite, covellite, and pyrite are 2.87 mW, 5.72 mW, and 7.12 mW, respectively, which is consistent with frontier orbital theory. Furthermore, the theory and results suggest that chalcopyrite formed at high temperatures is more likely to suffer from thermal oxidization in air.
The above three types of sulfide minerals suffer from thermal oxidation under high laser powers in air. However, micro-observations show that chalcopyrite (Figure S4a), pyrite (Figure S4b), and covellite (Figure S4c) do not undergo alterations at elevated laser powers after adding water drops. Furthermore, the Raman spectra do not show new peaks under higher laser powers (Figure 8), which suggests that there are no changes in the sulfide minerals at elevated laser powers. Water can protect these sulfide minerals from alterations because it can help dissipate heat induced by laser energy due to the high specific heat capacity of water.

3.2. Thermal Transformations Study of the Oxysalt Mineral

Oxysalt minerals are important components in hydrothermal and cold seep systems. Compared with the thermal transformations of sulfide minerals, it remains unclear whether oxysalt minerals are altered by high laser powers. In this study, we chose barite and aragonite as the target samples.

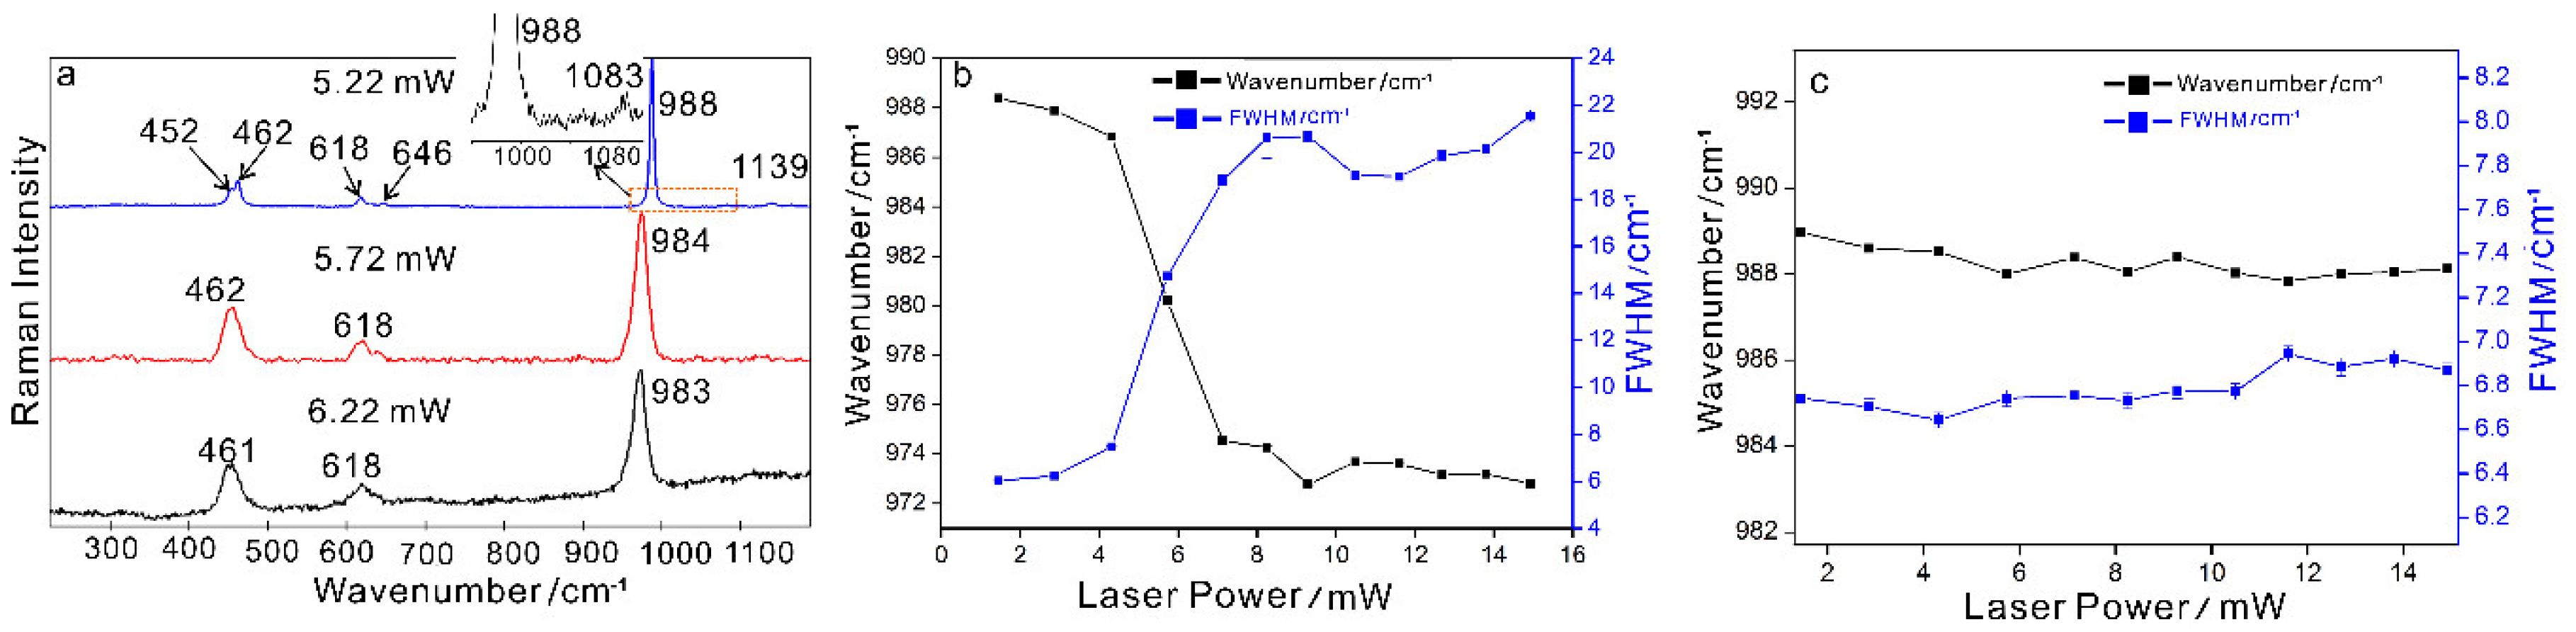
3.2.1. Thermal Transformations of the Low-Temperature Sulfate Mineral Barite

As a component of the hydrothermal chimney, barite (BaSO4) has an orthorhombic structure. We observed 7 Raman peaks of SO42−. The main peak at 988 cm−1 belongs to the symmetric stretching vibration ν1. The Raman peaks at 452 cm−1 and 462 cm−1 belong to the symmetric bending vibration ν2 [20,50]. The reference Raman peaks can be seen in the RRUFF database entry for barite [35]. In addition, the Raman peaks at 1083 cm−1 and 1139 cm−1 are attributed to the antisymmetric bending vibration ν3 (Figure 9a). The Raman peaks at 618 cm−1 and 646 cm−1 belong to the antisymmetric bending vibration ν4. Firstly, we collected Raman spectra of barite in the same position with increasing laser power (Figure S1d). Barite suffers from alterations at elevated laser powers. The Raman peaks at 452 cm−1 and 646 cm−1, representing symmetric bending vibrations and antisymmetric bending vibrations, respectively, begin to disappear at 5.72 mW (Figure S5a). Although the micro-image does not show obvious alterations in air; the Raman spectra show changes in the wavenumber and FWHM of the main peak of barite. The Raman spectra collected from 10 points show similarities, the Raman spectra at 5.22 mW are similar; however, the main peak wavenumber begins to decrease at 5.72 mW (Figure S6a). Therefore, the minimum thermal transformations laser power focuses on 5.72 mW. The ν1 (SO42−) band peak shifts to a lower wavenumber due to the changes in the vibration of the S–O band, and the larger FWHM of the ν1 (SO42-) band suggests the irregularity of the crystal structure, which may be due to disordered ion-ion interactions [51] (Figure 9b). The decrease in crystallinity induces substitution in the crystalline lattice of ions and disrupts the regularity of barite to a certain extent.
We added water drops on the barite sample. In contrast, barite in water shows high stability (Figure S4d) and does not suffer from thermal transformations (Figure S5b). Furthermore, the wavenumber and FWHM of the main Raman peak of barite in water do not change relative to barite in the air with increasing laser power (Figure 9c). However, adding water drops is not suitable for all mineral systems. Some minerals can react with water and produce new components. The new components may damage the samples and devices under heating conditions. Therefore, it is necessary to consider the formation environments and physicochemical properties of minerals before taking micro-Raman analyses and adding water drops on the samples.

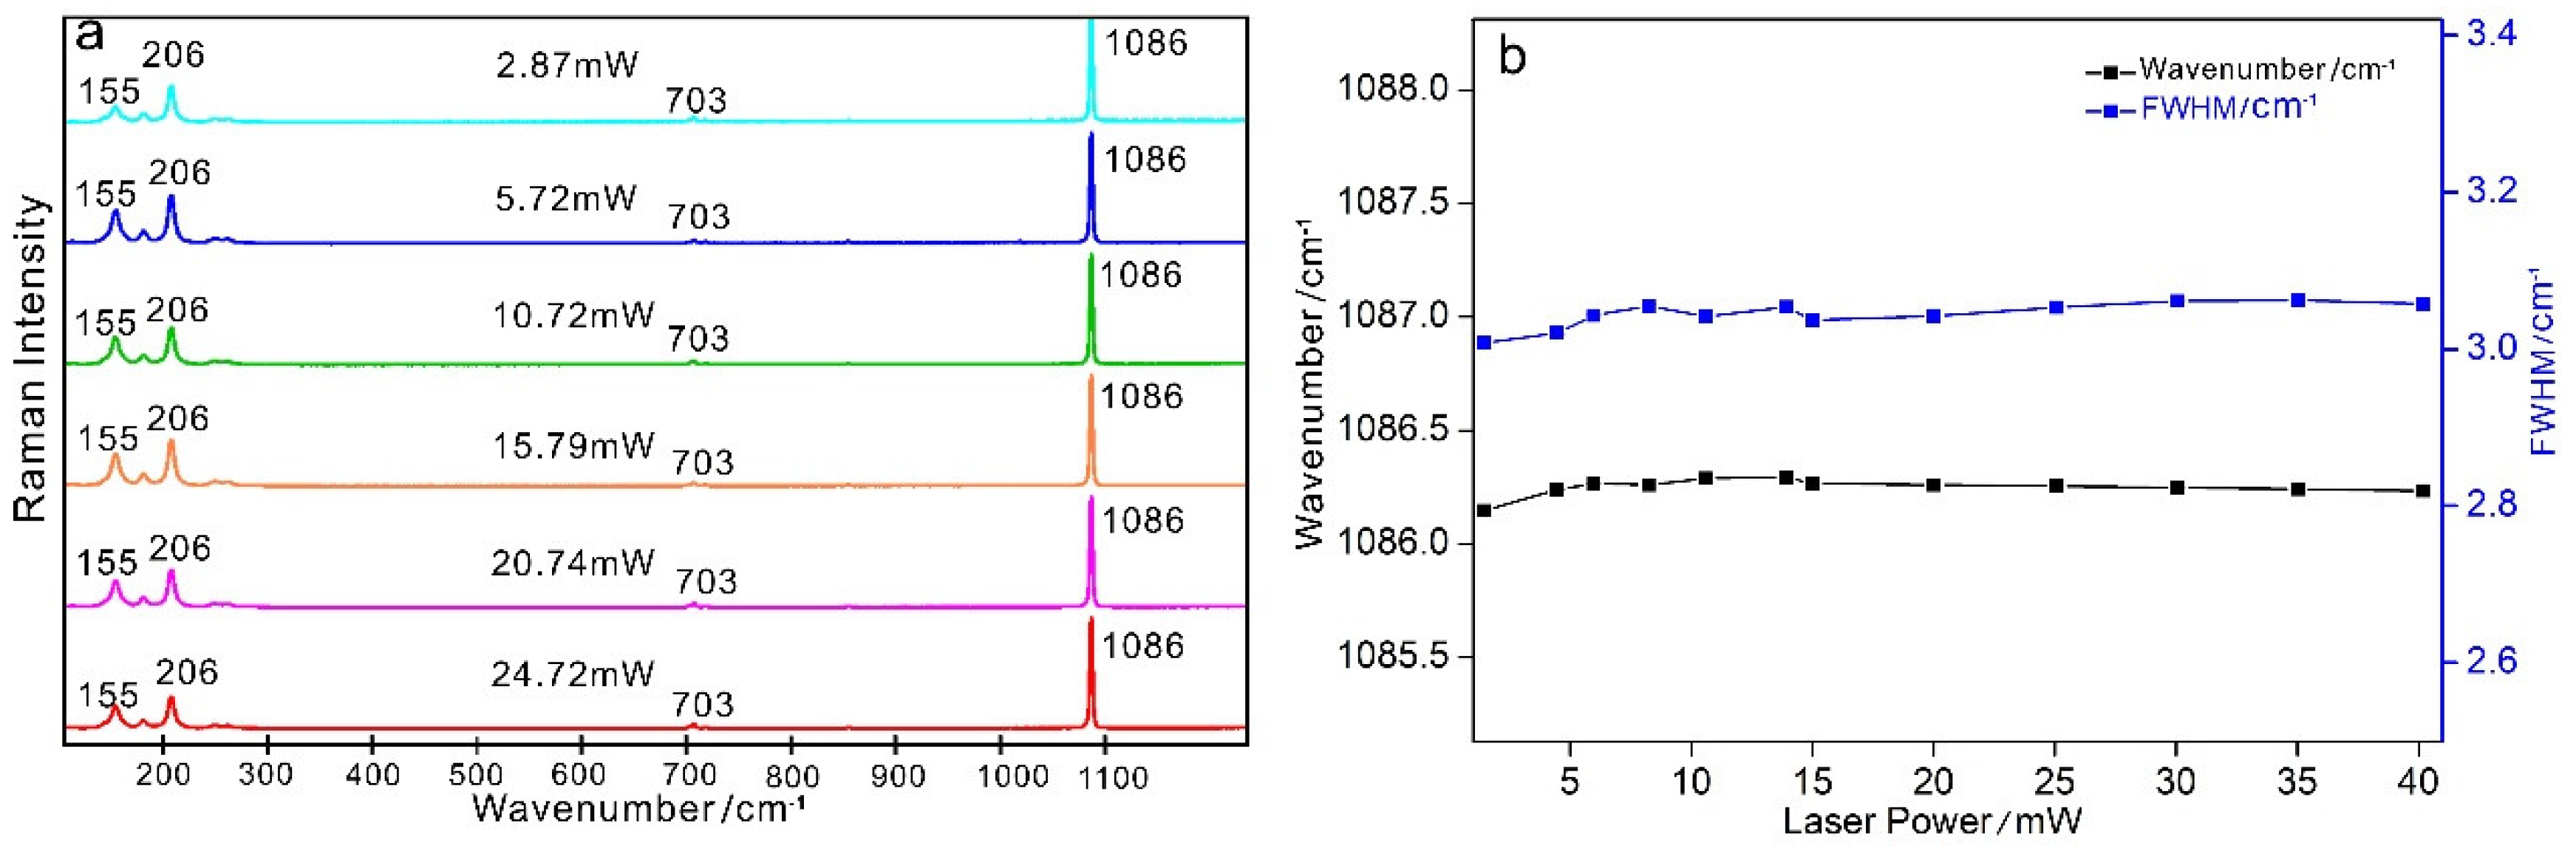
3.2.2. No Thermal Transformations of the Low-Temperature Carbonate Mineral Aragonite

The low-temperature oxysalt mineral aragonite (CaCO3) has an orthorhombic crystal structure. The main Raman peak at 1086 cm−1 is due to the symmetric stretching vibration ν1 of carbonate (CO32−). The Raman peaks at 155 cm−1 and 206 cm−1 are lattice modes, while the Raman peak at 703 cm−1 is attributed to the in-plane bending vibration ν4 of carbonate (CO32−) [20,52,53] (Figure 10a). The reference Raman peaks can also be seen in the RRUFF database entry for aragonite [35]. The Raman spectra of aragonite at the same point with different laser powers show no differences (Figure S5c). We also collected Raman spectra of aragonite at 10 point positions, and the micro-images and Raman spectra do not show any changes (Figure S6b), which suggests the aragonite is not affected by higher laser powers. Aragonite also has high stability at elevated laser powers, and the Raman spectra do not show any thermal transformations (Figure S6b), changes in the wavenumbers of peaks, or FWHM (Figure 10b). Noting that aragonite distributes widely in different geological environments. Therefore, there are differences at the grain size, inclusion-bearing, chemically impure et al., Here, the aragonite in the authigenic carbonate is from deep-sea cold-seep system, our results show the aragonite is not affected by the high laser power. However, variations in aragonite composition or grain size may show different responses to the laser beam to varying degrees. More comparisons of aragonites from different areas will be taken in the future.
The absorption of laser-induced heat by minerals is related to the transparency of these minerals. Regardless of grain size, translucent mineral crystals are more likely to suffer from scattering effects caused by anisotropy within the crystal [20]. Opaque sulfide minerals lower the laser penetration depth and absorb more laser heat, causing higher laser power density. Therefore, the opaque sulfide minerals in this study are more susceptible to occur thermal oxidation induced by high laser energy in the air. Compared with sulfide minerals, barite and aragonite are oxysalt minerals, and the transparency of these minerals is higher. Although the less transparent barite won’t be oxidized, the disorder of barite structure will increase with the increase of heat-induced laser. Aragonite is a more transparent mineral than a barite. The laser penetrates through the transparent aragonite crystal and causes little heat absorption. Furthermore, in addition to the effects of pressure, the aragonite-calcite transition temperature at room pressure is 480 °C [54], and the heat induced by the laser on the mineral cannot cause alterations or changes. Therefore, the laser power of the system in this study does not affect aragonite.

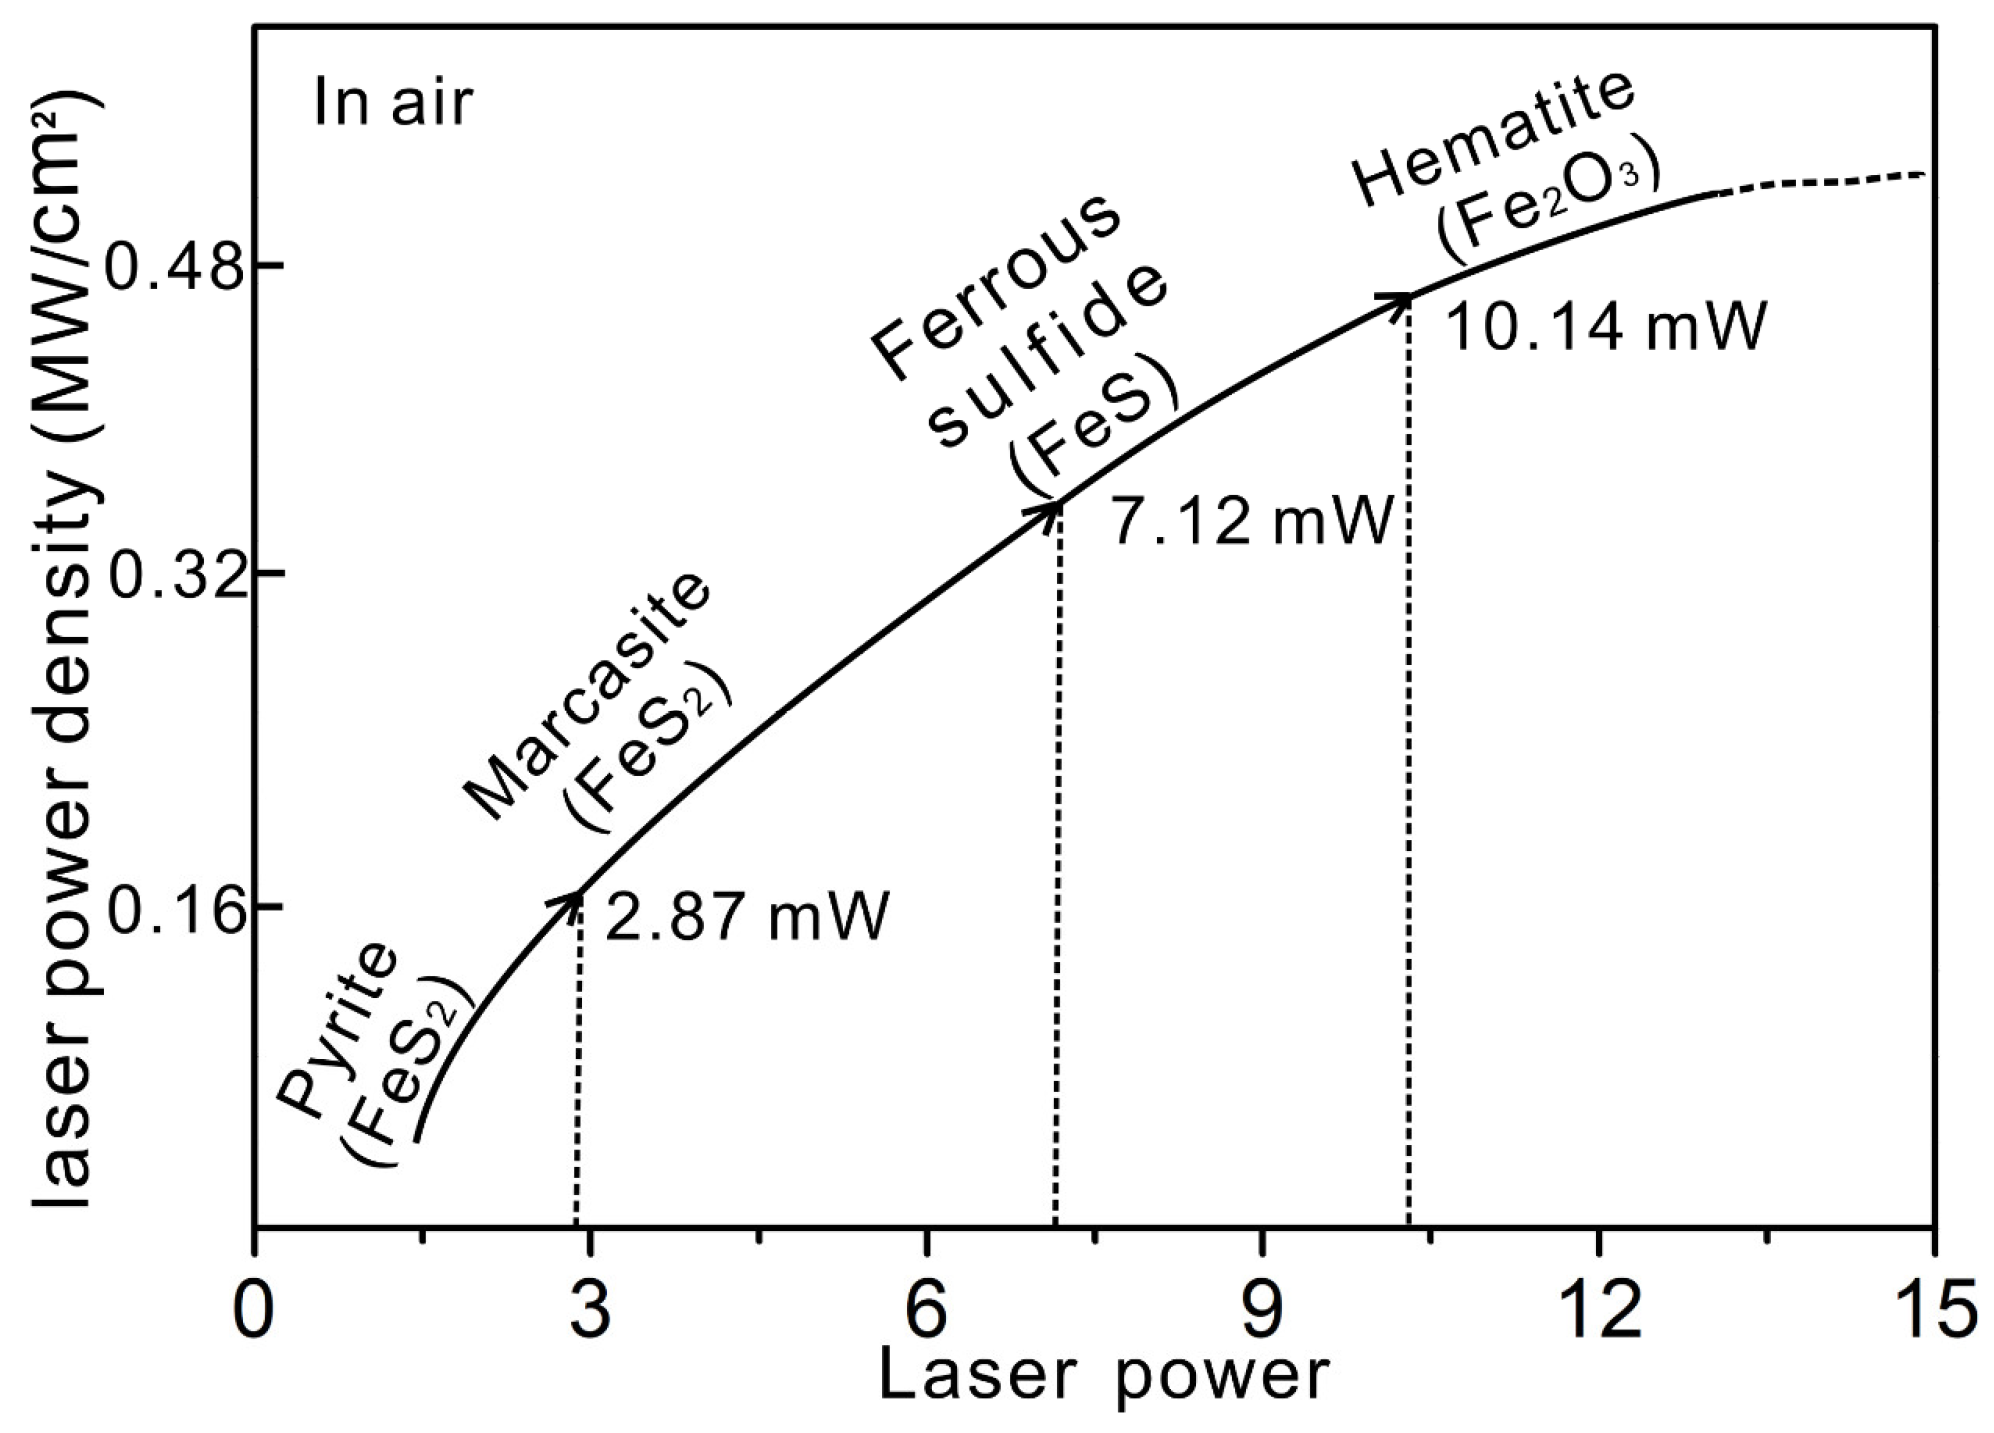
3.3. Minimum Laser Power Densities for Thermal Transformations of Minerals

The above results show that the minimum transformation laser powers for chalcopyrite, pyrite, covellite, and barite are 2.87 mW, 2.87 mW, 5.72 mW, and 5.72 mW, respectively. The power density (D) is defined as the laser power per unit area:
D = 4 P π   d 2
where D is the power density (MW/cm2), P is the laser power (MW), and d is the spot diameter (cm).
In this study, the focus spot diameter is 0.00015 cm, with the 50×/0.75 objective. Therefore, the power densities of the chalcopyrite, pyrite, covellite and barite are 0.16 MW/cm2, 0.16 MW/cm2, 0.32 MW/cm2, and 0.32 MW/cm2, respectively. Our results regarding laser thermal transformations of hydrothermal sulfide and sulfate minerals help establish minimum laser power densities for other minerals from hydrothermal and cold seep systems (Figure 11). The color gradient corresponds to the change associated with the laser power, and a darker color represents a higher laser power density. The darkest color represents the minimum thermal transformations laser power density. In contrast, the laser power does not affect aragonite, and the light color for aragonite indicates that no alterations occur. Although we realized the observation of thermal transformations of these minerals by the high laser power, when to identify the hydrothermal minerals and cold seep minerals in air precisely, we also need to pay attention to the alterations induced by high laser powers. Adding water drops is a good way to prevent sulfides from becoming altered at high laser powers. The above establishment of laser power densities is not only conducive for studying the thermal transformations of minerals but provides safe laser powers for the precise identification and analyses of hydrothermal minerals and cold seep minerals in a lab.

4. Conclusions

In this study, we focus on the thermal transformations of the minerals from hydrothermal and cold seep system by controlling the heat-induced by laser power. Compared with moderate- to low-temperature pyrite and covellite, high-temperature chalcopyrite is more likely to suffer from alterations based on the frontier orbital theory, and chalcopyrite is oxidized thermally in the air and forms hematite under high laser powers. Here, we find that pyrite is initially transformed into marcasite, then marcasite continues to be transformed into FeS in the next stage due to marcasite is less stable than pyrite, and finally forms hematite. Covellite is oxidized into chalcocite under high laser power. As an oxysalt mineral, although translucent barite does not react with O2 in air and produce new compositions, the laser-induced heat affects the peak position of sulfate, and the larger FWHM of sulfate shows that the structure of barite is damaged to a certain great extent. More transparent aragonite does not suffer from any alterations with increasing laser power. It is more likely that the laser penetrates through the transparent mineral, resulting in little heat absorption induced by the laser. We establish minimum laser power densities for the thermal transformations minerals from hydrothermal and cold seep systems. The works not only provide a simple way to study the thermal transformations of minerals but enlighten us to identify the mineral precisely by controlling the laser power.

Supplementary Materials

The following are available online at https://www.mdpi.com/2075-163X/9/12/751/s1, Figure S1: The micro observations of samples at the same position with the increase of laser power in air, Figure S2: The Raman spectra of metal sulfide minerals at the same position with different laser powers, Figure S3: The Raman spectra of metal sulfide minerals at different sample positions with different laser powers and integration times, Figure S4: The micro observations of samples at the same position with different laser powers in water, Figure S5: The Raman spectra of oxysalt minerals at the same sample position with different laser powers, Figure S6: The Raman spectra of oxysalt minerals at different sample positions with different laser powers and integration times.

Author Contributions

Writing–Original Draft Preparation, S.X.; Writing–Review & Editing, S.X. and X.Z.; Conceptualization, S.X. and X.Z.; Methodology, S.X. and X.Z.; Software, Z.D. and Z.L. (Zhengwei Liang); Formal Analysis, L.L.; Validation, X.Z. and Z.L. (Zhendong Luan); Investigation, X.Z., Z.L. (Zhendong Luan) and C.L.; Supervision, J.Y.; Project Administration, Z.L. (Zhendong Luan); Funding Acquisition, X.Z.

Funding

This work was funded by the National Natural Science Foundation of China (No. 41822604, 41576104), the Strategic Priority Research Program, CAS (No. XDA22050102, XDA19060402), the National Key R&D Program of China (No. 2016YFC0302103), the Key Research Program of Frontier Sciences, CAS (No. QYZDB-SSW-DQC004), the NSFC-Shandong Joint Fund for Marine Science Research Centers (No. U1606401).

Conflicts of Interest

The authors declare no conflict of interest.

References

  1. Weiss, R.F.; Lonsdale, P.; Lupton, J.E.; Bainbridge, A.E.; Craig, H. Hydrothermal plumes in the Galapagos Rift. Nature 1977, 267, 600–603. [Google Scholar] [CrossRef]
  2. Rona, P.A.; Lowell, R.P. Hydrothermal Systems at Oceanic Spreading Centers. Geology 1978, 6, 299–300. [Google Scholar] [CrossRef]
  3. Jannasch, H.W.; Mottl, M.J. Geomicrobiology of deep-sea hydrothermal vents. Science 1985, 229, 717–725. [Google Scholar] [CrossRef] [PubMed]
  4. Lilley, M.D.; Butterfield, D.A.; Olson, E.J.; Lupton, J.E.; Macko, S.A.; Mcduff, R.E. Anomalous CH4 and NH4+ concentrations at an unsedimented mid-ocean-ridge hydrothermal system. Nature 1993, 364, 45–47. [Google Scholar] [CrossRef]
  5. Marsh, A.G.; Mullineaux, L.S.; Young, C.M.; Manahan, D.T. Larval dispersal potential of the tubeworm Riftia pachyptila at deep-sea hydrothermal vents. Nature 2001, 411, 77–80. [Google Scholar] [CrossRef] [PubMed]
  6. Haymon, R.M. Growth history of hydrothermal black smoker chimneys. Nature 1983, 301, 695–698. [Google Scholar] [CrossRef]
  7. Luff, R.; Wallmann, K. Fluid flow, methane fluxes, carbonate precipitation and biogeochemical turnover in gas hydrate-bearing sediments at Hydrate Ridge, Cascadia Margin: Numerical modeling and mass balances. Geochim. Cosmochim. Acta 2003, 67, 3403–3421. [Google Scholar] [CrossRef]
  8. Feng, D.; Peng, Y.; Bao, H.; Peckmann, J.; Roberts, H.H.; Chen, D. A carbonate-based proxy for sulfate-driven anaerobic oxidation of methane. Geology 2016, 44, 999–1002. [Google Scholar] [CrossRef] [Green Version]
  9. Feng, D.; Chen, D. Authigenic carbonates from an active cold seep of the northern South China Sea: New insights into fluid sources and past seepage activity. Deep Sea Res. Part II Top. Stud. Oceanogr. 2015, 122, 74–83. [Google Scholar] [CrossRef]
  10. Burton, E.A. Controls on marine carbonate cement mineralogy: Review and reassessment. Chem. Geol. 1993, 105, 163–179. [Google Scholar] [CrossRef]
  11. Karan, K.; Yao, X.; Xu, C.; Wang, Y. Chemical profile of the dentin substrate in non-carious cervical lesions. Dent. Mater. 2009, 25, 1205–1212. [Google Scholar] [CrossRef] [PubMed] [Green Version]
  12. Zhang, X.; Walz, P.M.; Kirkwood, W.J.; Hester, K.C.; Ussler, W.; Peltzer, E.T.; Brewer, P.G. Development and deployment of a deep-sea Raman probe for measurement of pore water geochemistry. Deep Sea Res. Part I Oceanogr. Res. Pap. 2010, 57, 297–306. [Google Scholar] [CrossRef]
  13. Chou, I.M.; Wang, A. Application of laser Raman micro-analyses to Earth and planetary materials. J. Asian Earth Sci. 2017, 145, 309–333. [Google Scholar] [CrossRef]
  14. Zhang, X.; Du, Z.; Luan, Z.; Wang, X.; Xi, S.; Wang, B.; Li, L.; Lian, C.; Yan, J. In situ Raman Raman Detection of Gas Hydrates Exposed on the Seafloor of the South China Sea. Geochem. Geophys. Geosyst. 2017, 18, 3700–3713. [Google Scholar] [CrossRef]
  15. Griffith, W.P. Raman Spectroscopy of Minerals. Nature 1969, 224, 264–266. [Google Scholar] [CrossRef]
  16. Bersani, D.; Andò, S.; Vignola, P.; Moltifiori, G.; Marino, I.G.; Lottici, P.P.; Diella, V. Micro-Raman spectroscopy as a routine tool for garnet analysis. Spectrochim. Acta Part A Mol. Biomol. Spectrosc. 2009, 73, 484–491. [Google Scholar] [CrossRef]
  17. Croce, A.; Arrais, A.; Rinaudo, C. Raman Micro-Spectroscopy Identifies Carbonaceous Particles Lying on the Surface of Crocidolite, Amosite, and Chrysotile Fibers. Minerals 2018, 8, 249. [Google Scholar] [CrossRef] [Green Version]
  18. Yao, X.; Hou, H.; Liang, H.; Chen, K.; Chen, X. Raman Spectroscopy Study of Phosphorites Combined with PCA-HCA and OPLS-DA Models. Minerals 2019, 9, 578. [Google Scholar] [CrossRef] [Green Version]
  19. Wang, A.; Kuebler, K.; Jolliff, B.; Haskin, L.A. Mineralogy of a Martian meteorite as determined by Raman spectroscopy. J. Raman Spectrosc. 2010, 35, 504–514. [Google Scholar] [CrossRef]
  20. White, S.N. Laser Raman spectroscopy as a technique for identification of seafloor hydrothermal and cold seep minerals. Chem. Geol. 2009, 259, 240–252. [Google Scholar] [CrossRef]
  21. Xi, S.; Zhang, X.; Du, Z.; Li, L.; Wang, B.; Luan, Z.; Lian, C.; Yan, J. Laser Raman detection of authigenic carbonates from cold seeps at the Formosa Ridge and east of the Pear River Mouth Basin in the South China Sea. J. Asian Earth Sci. 2018, 168, 207–224. [Google Scholar] [CrossRef]
  22. Freeman, J.J.; Wopenka, B.; Silva, M.J.; Pasteris, J.D. Raman Spectroscopic Detection of Changes in Bioapatite in Mouse Femora as a Function of Age and In Vitro Fluoride Treatment. Calcif. Tissue Int. 2001, 68, 156–162. [Google Scholar] [CrossRef] [PubMed]
  23. Xueyin, Y.; Chao, G.; Jing, G. An in situ study of the phase transitions among CaCO3 high-pressure polymorphs. Mineral. Mag. 2019, 83, 191–197. [Google Scholar]
  24. Ono, S.; Kikegawa, T.; Higo, Y. In situ observation of a phase transition in Fe2SiO4 at high pressure and high temperature. Phys. Chem. Miner. 2013, 40, 811–816. [Google Scholar] [CrossRef]
  25. Bauer, M.; Davydovskaya, P.; Janko, M.; Kaliwoda, M.; Petersen, N.; Gilder, S.; Stark, R.W. Raman spectroscopy of laser-induced oxidation of titanomagnetites. J. Raman Spectrosc. 2011, 42, 1413–1418. [Google Scholar] [CrossRef]
  26. Weber, I.; Böttger, U.; Pavlov, S.G.; Hübers, H.W.; Hiesinger, H.; Jessberger, E.K. Laser alteration on iron sulfides under various environmental conditions. J. Raman Spectrosc. 2017, 48, 1509–1517. [Google Scholar] [CrossRef]
  27. Ignatieva, N.; Zakharkina, O.; Leroy, G.; Sobol, E.; Vorobieva, N.; Mordon, S. Molecular processes and structural alterations in laser reshaping of cartilage. Laser Phys. Lett. 2010, 4, 749–753. [Google Scholar] [CrossRef]
  28. Foucher, F.; Lopez-Reyes, G.; Bost, N.; Rull-Perez, F.; Rüßmann, P.; Westall, F. Effect of grain size distribution on Raman analyses and the consequences for in situ planetary missions. J. Raman Spectrosc. 2013, 44, 916–925. [Google Scholar] [CrossRef] [Green Version]
  29. Graham, U.M.; Ohmoto, H. Experimental study of formation mechanisms of hydrothermal pyrite. Geochim. Cosmochim. Acta 1994, 58, 2187–2202. [Google Scholar] [CrossRef]
  30. Kawasumi, S.; Chiba, H.; Kawasumi, S. Redox state of seafloor hydrothermal fluids and its effect on sulfide mineralization. Chem. Geol. 2017, 451, 25–37. [Google Scholar] [CrossRef]
  31. Janecky, D.R.; Seyfried, W.E., Jr. Formation of massive sulfide deposits on oceanic ridge crests: Incremental reaction models for mixing between hydrothermal solutions and seawater. Geochim. Cosmochim. Acta 1984, 48, 2723–2738. [Google Scholar] [CrossRef]
  32. Qin, A.M.; Fang, Y.P.; Ou, H.D.; Liu, H.Q.; Su, C.Y. Formation of Various Morphologies of Covellite Copper Sulfide Submicron Crystals by a Hydrothermal Method without Surfactant. Cryst. Growth Des. 2005, 5, 855–860. [Google Scholar] [CrossRef]
  33. Loyd, S.J.; Sample, J.; Tripati, R.E.; Defliese, W.F.; Brooks, K.; Hovland, M.; Torres, M.; Marlow, J.; Hancock, L.G.; Martin, R. Methane seep carbonates yield clumped isotope signatures out of equilibrium with formation temperatures. Nat. Commun. 2016, 7, 12274. [Google Scholar] [CrossRef] [PubMed] [Green Version]
  34. Mernagh, T.P.; Trudu, A.G. A laser Raman microprobe study of some geologically important sulphide minerals. Chem. Geol. 1993, 103, 113–127. [Google Scholar] [CrossRef]
  35. Downs, R.T. Program and Astracts of The 19th General Meeting of the International Mineralogical Association; IMA: Kobe, Japan, 2006; pp. O03–O13. [Google Scholar]
  36. Mao, B.; Dong, Q.; Exstrom, C.L.; Huang, J. Surface thermal stability of iron pyrite nanocrystals: Role of capping ligands. Thin Solid Film 2014, 562, 361–366. [Google Scholar] [CrossRef]
  37. Reiss, H. The Fermi level and the redox potential. J. Phys. Chem. 1985, 89, 3783–3791. [Google Scholar] [CrossRef]
  38. Wood, A.; Giersig, M.; Mulvaney, P. Fermi Level Equilibration in Quantum Dot−Metal Nanojunctions. J. Phys. Chem. B 2001, 105, 8810–8815. [Google Scholar] [CrossRef]
  39. Ghatak, K.P.; Mondal, M. Theoretical study of the effective electron mass in ternary chalcopyrite semiconductors in the presence of crossed electric and magnetic fields. Z. Phys. B Condens. Matter 1988, 69, 471–479. [Google Scholar] [CrossRef]
  40. Cao, R.; Miyano, K.; Kendelewicz, T.; Lindau, I.; Spicer, W.E. Low-temperature alkali metal/III–V interfaces: A study of metallization and Fermi level movement. J. Vac. Sci. Technol. B Microelectron. Process. Phenom. 1989, 7, 919–924. [Google Scholar] [CrossRef]
  41. Dunn, J.G.; Muzenda, C. Thermal oxidation of covellite (CuS). Thermochim. Acta 2001, 369, 117–123. [Google Scholar] [CrossRef]
  42. Mitchell, R.E. Mechanisms of Pyrite Oxidation to Non-Slagging Species; Final Report; US Department of Energy: Washington, DC, USA, 2002.
  43. Chen, J.H.; Zhong, J.L.; Li, Y.Q.; Chen, Y.; Guo, J. Electronic structures and floatability of pyrite, marcasite and pyrrhotite. Chin. J. Nonferrous Met. 2011, 21, 1719–1727. [Google Scholar]
  44. Krishnamurti, D. The Raman spectra of crystalline sulphates of Ni and Mn. Proc. Indian Acad. Sci. Sect. A 1958, 48, 355–363. [Google Scholar] [CrossRef]
  45. Houk, K.N. Frontier molecular orbital theory of cycloaddition reactions. Acc. Chem. Res. 1975, 8, 361–369. [Google Scholar] [CrossRef]
  46. Burdon, J.; Parsons, I.W. A recent attempt to apply frontier orbital theory to nucleophilic aromatic substitution. J. Am. Chem. Soc. 1994, 22, 1724–1734. [Google Scholar] [CrossRef]
  47. Dannenberg, J.J. Using Perturbation and Frontier Molecular Orbital Theory to Predict Diastereofacial Selectivity. Chem. Rev. 1999, 99, 1225–1242. [Google Scholar] [CrossRef]
  48. Li, Y.Q.; Chen, J.H.; Chen, Y.; Guo, J. Density functional theory study of influence of impurity on electronic properties and reactivity of pyrite. Trans. Nonferrous Met. Soc. China 2011, 21, 1887–1895. [Google Scholar] [CrossRef]
  49. Chen, J.H.; Wang, J.M.; Long, X.H.; Guo, J. First-principle theory on electronic structure of copper sulfides. J. Cent. South Univ. 2011, 42, 3612–3617. [Google Scholar]
  50. Matsumoto, Y.; Harada, H.; Yui, K.; Uchida, H.; Itatani, K.; Koda, S. Raman spectroscopic study of aqueous alkali sulfate solutions at high temperature and pressure to yield precipitation. J. Supercrit. Fluids 2009, 49, 303–309. [Google Scholar] [CrossRef]
  51. Hapanowicz, R.P.; Condratesr, R.A. High-Temperature Raman Spectral Investigation of Sodium Sulfate. Spectrosc. Lett. 1996, 29, 133–141. [Google Scholar] [CrossRef]
  52. Bischoff, W.D.; Sharma, S.K.; Mackenzie, F.T. Carbonate ion disorder in synthetic and biogenic magnesian calcites: A Raman spectral study. Plast. Reconstr. Surg. 1985, 112, 489–494. [Google Scholar]
  53. Mackenzie, F.T.; Urmos, J.; Sharma, S.K. Characterization of some biogenic carbonates with Raman spectroscopy. Am. Mineral. 1991, 76, 641–646. [Google Scholar]
  54. Gruver, R.M. Differential Thermal-Analysis Studies of Ceramic Materials: II, Transition of Aragonite to Calcite. J. Am. Ceram. Soc. 2010, 33, 171–174. [Google Scholar] [CrossRef]
Figure 1. Areas in the deep-sea vent fluid environment. (a) Regional location map of the research area constructed with the GeoMap App (www.geomapapp.org). (b) Topographic map of the low-temperature cold seep area at the Formosa Ridge in the South China Sea; (c) Sampling authigenic carbonate at the Formosa Ridge via the ROV (remote operated vehicle) Faxian; (d) Topographic map of hydrothermal vents with different temperatures in the PACMANUS (Papua New Guinea–Australia–Canada Manus) hydrothermal area, Manus Basin, Papua New Guinea; (e) Collecting a hydrothermal chimney in PACMANUS hydrothermal area via the ROV (Remote Operated Vehicle) Faxian.
Minerals 09 00751 g001
Figure 2. A schematic diagram of the WITec system. (a) The diagram shows the optical components and the light path. The true power of the system is used to exactly control the laser power. The focus point on the surface of the sample is controlled by the Z-axis motor, which makes the Raman signal strong. Samples in air and water were all subjected to Raman measurements under different laser powers (blue dotted box). (b) The enlarged view at the blue dotted box. The high laser power causes local heat at the spot area.
Minerals 09 00751 g002
Figure 3. Raman spectra of sulfide minerals at different laser powers in the air. (a) Raman spectra of chalcopyrite in air at different laser powers, new Raman peaks at 216 cm−1, and 278 cm−1 begin to occur at 2.87 mW. (b) Raman spectra of covellite in the air at different laser powers; the new Raman peaks occur at 218 cm−1 and 282 cm−1 for 5.72 mW and 392 cm−1 for 6.27 mW. (c) Raman spectra of pyrite in the air at different laser powers. A new Raman peak occurs at 325 cm−1 for 2.87 mW in stage I; the new Raman peaks occur at 215 cm−1 and 278 cm−1 for 7.12 mW in stage II. (d) Gaussian fitting of the Raman spectra of the pyrite sample (black) at 2.87 mW. The blue spectrum represents pyrite, while the red spectrum shows the existence of marcasite.
Minerals 09 00751 g003
Figure 4. Raman analyses of thermal transformations of the chalcopyrite. (a) Photograph of the alteration area (black area). (b) Raman map showing the obvious component differences in the area. (c) Average Raman spectra of the components in the area. The green area represents chalcopyrite, and the red area represents hematite produced by the transformations of chalcopyrite.
Minerals 09 00751 g004
Figure 5. Raman analyses of the thermal transformations of covellite. (a) Photograph of the alteration area (dark area). (b) Raman map showing obvious component differences in the alteration area. (c) Average Raman spectra of the components in the area. The green area represents covellite, and the red area represents chalcocite that produced by the thermal transformations of covellite.
Minerals 09 00751 g005
Figure 6. The thermal transformations chain of pyrite at elevated laser power in the air. The pyrite transforms to marcasite, ferrous sulfide, and hematite, gradually.
Minerals 09 00751 g006
Figure 7. Raman analyses of the thermal transformations of pyrite. (a) Photograph of the alteration area (dark area). (b) Raman map showing the obvious component differences in the alteration area. (c) Average Raman spectra of the components in the area. The blue area represents pyrite, and the red area represents hematite produced by the transformations of pyrite.
Minerals 09 00751 g007
Figure 8. Raman spectra of chalcopyrite, pyrite, and covellite in water under high laser power. (a) Raman spectra of three sulfide minerals in the range of 160–320 cm−1; (b) Raman spectra of three sulfide minerals in water at 160–3800 cm−1, the wavenumber at 3000–3800 cm−11(H2O)) shows the existence of water.
Minerals 09 00751 g008
Figure 9. The characteristics of Raman spectra of barite at different laser powers in the air and water. (a) Raman spectra of barite near 5.72 mW in the air. The spectra indicate the disappearance of two weak Raman peaks at 452 cm−1 and 646 cm−1 for a laser power at 5.72 mW. (b) The wavenumber and FWHM of the main band of barite in air. (c) The wavenumber and FWHM of the main band of barite in water.
Minerals 09 00751 g009
Figure 10. Raman characterization of aragonite in the air. (a) Raman spectra of aragonite at different laser powers. (b) Wavenumber of the main band and FWHM (full width at half maximum) of aragonite in the air at different laser powers.
Minerals 09 00751 g010
Figure 11. (a) The thermal transformations of the chalcopyrite, pyrite, covellite, barite at different laser powers. (b) Minimum transformation laser power densities for Raman measurements of typical minerals from hydrothermal and cold seep systems. Darker colors indicate a greater likelihood that a certain laser power or higher will cause thermal transformations of the mineral.
Minerals 09 00751 g011
Table 1. Information on minerals formed at different temperatures.
Sample IDMineralTypeLocationFormation Temperature
YCChalcopyriteVMSSampling-4High temperature
(>300 °C) [29,30,31]
DZ3PyriteVMSSampling-3Moderate1ow temperature
(100–200 °C) [29,30,31]
YCCovelliteVMSSampling-3Moderate–low temperature
(120–180 °C) [32]
Ro30BariteSulfate mineralSampling-2Low temperature
(<100 °C) [31]
CS1AragoniteCarbonate mineralSampling-1Low temperature
(<52 °C) [33]
Table 2. HOMO and LUMO energies of chalcopyrite [49], pyrite [48], covellite [49], and oxygen.
MineralEHOMO/eVELUMO/eVE1|
Chalcopyrite−5.622−4.8831.022
Pyrite−6.477−5.7321.837
Covellite−3.096−1.8871.504
Oxygen−6.900−4.610-
“-” means no data. “EHOMO” means the energy of highest occupied molecular orbital, “ELUMO” means the energy of lowest unoccupied molecular orbital, “ΔE1” means absolute energy differences.

