Application of the CSAMT Method to Pb–Zn Mineral Deposits: A Case Study in Jianshui, China
by
 , and
, and
Zhenwei Guo
1,2,3 ,
,
Longyun Hu
1,2,3,
Chunming Liu
1,2,3,
Chuanghua Cao
4,
Jianxin Liu
1,2,3 and
Rong Liu
1,2,3,* 1
School of Geosciences and Info-Physics, Central South University, Changsha 410083, China
2
Hunan Key Laboratory of Nonferrous Resources and Geological Hazard Exploration, Changsha 410083, China
3
Key Laboratory of Metallogenic Prediction of Nonferrous Metals and Geological Environment Monitoring (Central South University) Ministry of Education, Changsha 410083, China
4
Geology Survey Institute of Hunan Province, Changsha 410116, China
*
Author to whom correspondence should be addressed.
Minerals 2019, 9(12), 726; https://doi.org/10.3390/min9120726
Submission received: 4 October 2019
/
Revised: 20 November 2019
/
Accepted: 21 November 2019
/
Published: 25 November 2019
(This article belongs to the Special Issue Novel Methods and Applications for Mineral Exploration)
Abstract
:The electromagnetic (EM) method is commonly used in mineral exploration due to the method’s sensitivity to conductive targets. Controlled source audio-frequency magnetotellurics (CSAMT) is developed from magnetotelluric (MT) method with an artificial EM source to improve the signal amplitude. It has been used for mineral exploration for many years. In this study, we performed a case study of the CSAMT application for the Eagles-Nest lead–zinc (Pb–Zn) ore deposits in Jianshui, China. The Eagles-Nest deposit is located in southwest in China in forest-covered complex terrain, making it difficult to acquire the geophysical data. Based on the previous dual-frequency induced polarization (IP) results, we designed four profiles for the CSAMT data acquisition. After data processing and inversion, we mapped the subsurface resistivity distribution. From the CSAMT results, we inferred the location of the ore body, which was verified by the drilling wells. The Pb–Zn ore body was found at a depth between 373.70 m to 407.35 m in the well.
1. Introduction
The Eagles-Nest lead–zinc (Pb–Zn) ore deposit is located in Jianshui, in Southwest China, in an area which is 90% covered by forests. The northeast is relatively flat; however, the western and southern mountains are cut by narrow and deep valleys. The elevation of the area ranges between 1271 m and 2503 m. It is difficult to carry out the ground geophysical surveys in this area because of the forest and steep mountains. During previous research 50 years ago, geologists investigated three profiles. Unfortunately, the reports of that investigation were lost.
During the 1950s, the magnetotelluric method (MT) was introduced for electromagnetic (EM) exploration by Cagniard [1]. In order to acquire strong signal, the controlled-source audio-frequency magnetotellurics (CSAMT) method was proposed by Goldstein [2]. Both the MT and CSAMT methods are applied in frequency domain to detect mineral deposits.
In mineral exploration, CSAMT method is one of the most important tools. Although electrical resistivity tomography (ERT) can describe the subsurface resistivity distribution, CSAMT can describe the subsurface resistivity distribution clearly. Some successful case studies have been conducted in geothermal [3,4], mineral deposits exploration [5] and groundwater [6]. Normally, the mineral deposits are shallower than geothermal sources. Chen et al. [7] successfully detected the Longtoushan Ag–Pb–Zn deposit using CSAMT in inner Mongolia, China. This method has also been applied with the iron and polymetallic (Pb–Zn–Cu) deposits in the Longmen region by Hu et al. [8]. The CSAMT method was also applied to explain geological structures, which were distinguished by the difference between Tamusu rock and surrounding rock [9].
Induced polarization, another geophysical method, is commonly used to delineate potential target zones and estimate the deposit projected on the surface. Schlumberger introduced the induced polarization (IP) method for geophysical surveys in the 1920s [10]. The IP method has high sensitivity to mineral deposits. Moreover, it was used to test the detectability on the sensitivity in geothermal systems [11,12], thus, combining the IP and CSAMT method is usually applied for the mineral exploration, for instance, in the case of massive chalcopyrite exploration [13].
Dual-frequency IP method is a kind of frequency domain IP method that utilizes information from two frequencies [14]. Bao and He (He Jishan) introduced the dual-frequency and multi-parameter IP method, which could find the anomaly of Percent Frequency Effect (PFE) and phase, and also provided the property information of the IP anomaly resource [14]. In this paper, we combine dual-frequency IP and CSAMT method to explore the Pb–Zn deposit. We used the dual-frequency IP method to estimate the location of the deposit, then we inverted and analyzed the CSAMT data to determine the depth of the orebody. The final result was analyzed and interpreted.
2. Geological Setting in Jianshui Area
The Eagles-Nest region lies in the south-western part of the Gejiu-Shiping faulted fold. At the southwest part of Honghe deep fault, it is connected with the Ailaoshan metamorphic block, and at the northeast part it is connected with Mile-Shizong fault.
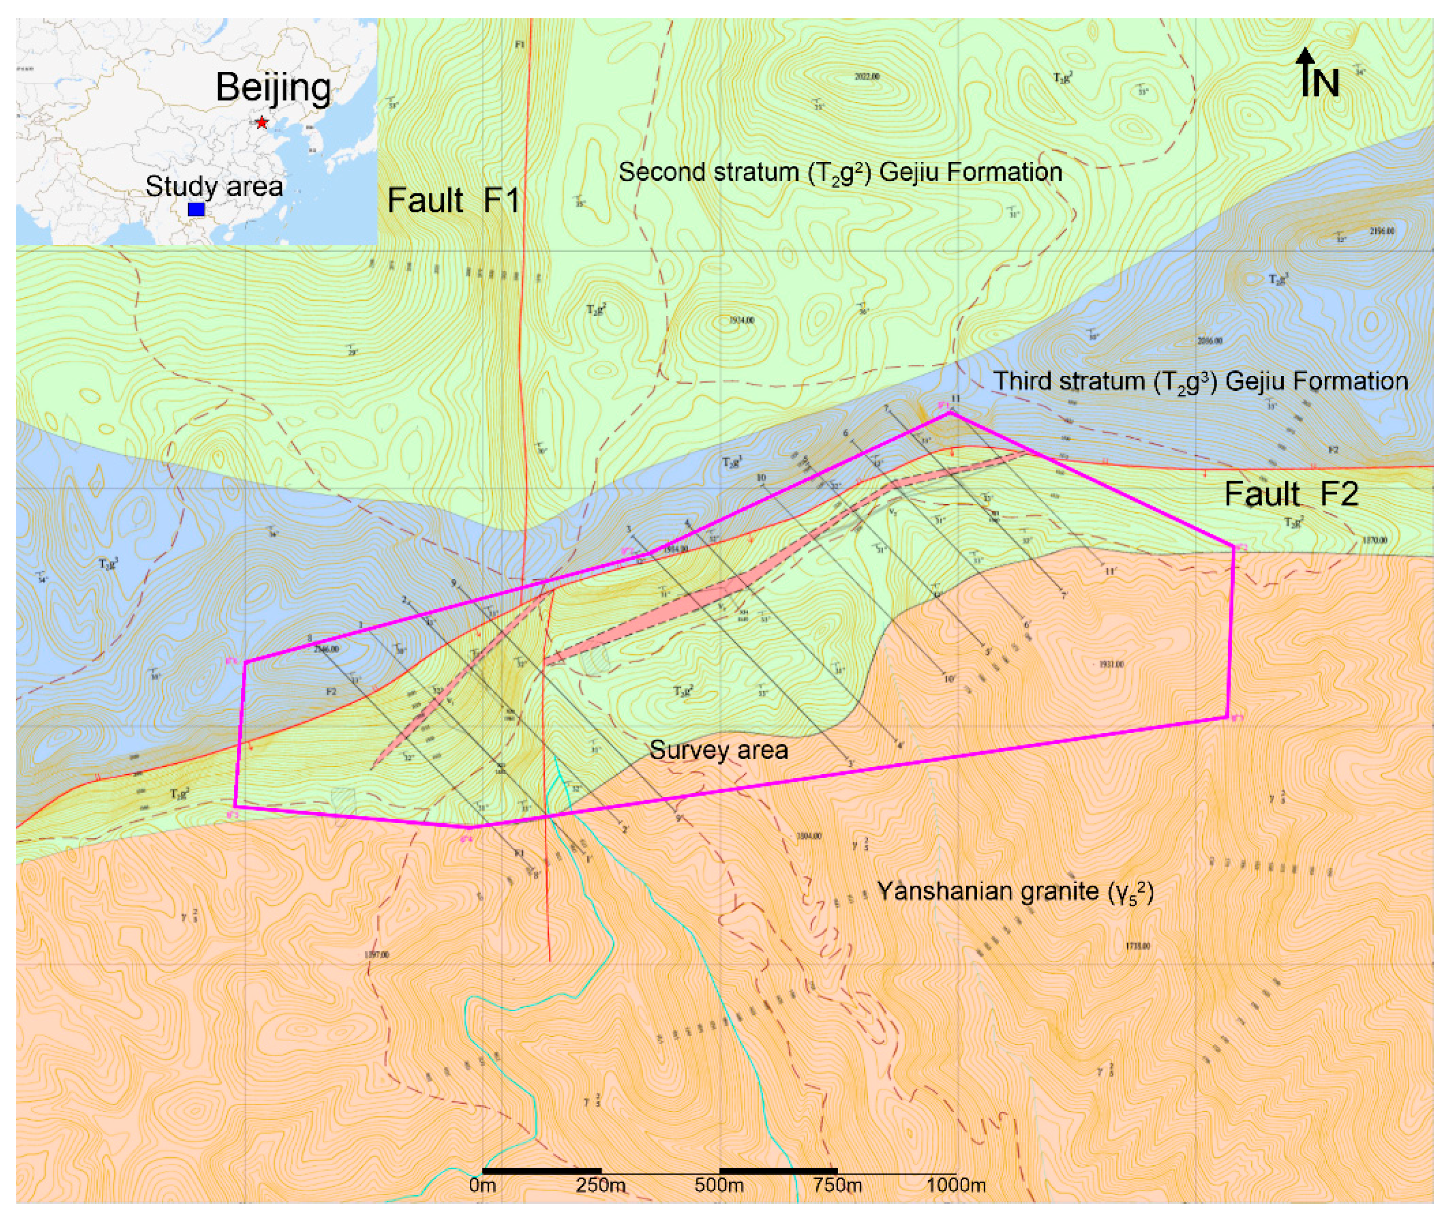
The main exposed carbonate rocks belong to the Triassic Gejiu Formation in survey area (Figure 1). The third stratum (T2g3) of Gejiu Formation is located in the center of the survey area. The upper part lithology is thick layered dolomite of Triassic Gejiu Formation; the middle part is medium-thick layered fine-grained marble; the lower part is medium-thick layered dolomite sandwiched with thin layered limestone. This stratum goes through the whole area from the north to east with a strike of 130°, and dips 25° to 40°. The area is about 1.5 km2. From south to north, the layers become thinner with an average thickness of 252.42 m.
The second stratum (T2g2) of Gejiu Formation is distributed in the northwestern part of the survey area. The lithology is light yellow-gray and medium-thick layered argillaceous limestone-bearing mudstone. The former is often metamorphosed into light yellow fine-grained marble. The latter is developed horizontally with a small amount of sea lily stem fragments. It stretches in a northeast direction with a strike of 160–170°, and dips 25° to 30°. The lithology of this section varies from carbonate to clastic rock with marble from south to north. The rock layer is generally metamorphosed where the rock is in direct contact with the granite body.
The Yanshanian granite (γ52) is exposed as the main magnetic rock in the survey area, which is distributed in the south-central part of this area with east–west direction. It is plaque-like black cloud monzonitic granite with a semi-automorphic granular structure. The phenocrysts in granite are mainly single crystals of light flesh red potassium feldspar. The mineral composition includes biotite, quartz, plagioclase, and potassium feldspar. The granite body is rock-based and the carbonate rocks in contact with it are all marbled.
Tectonic movement has occurred many times; layers were cut by faults in south–north direction. The two main faults in the survey area are the south–north fault (F1) in early phase and east–west fault (F2) in late phase. Fault F1 is located in the central of the area with around 2031 m length and 5–10 width. Irregular and angular structured breccias are found in the fault zone. Along the fault zone, there are structural fracture zones within the second stratum (T2g2), the third stratum (T2g3) of the Gejiu Formation, and the Yanshanian granite (γ52). The second fault (F2) went through the survey area in an east–west direction with 3154 m length and 5–20 m width. The F2 is a reverse fault with a strike of 160–170° and a north–east inclination. The small folds in survey area are well developed, and the axial direction is consistent with the direction of the large tectonic line in northeast direction.
3. Overview of the CSAMT Method
The CSAMT method is a commonly-used, surface-based geophysical method which provides resistivity information of the subsurface. A horizontal dipole is used to transmit the EM signal. Signals from near-zone and transition-zone always result in distortions of Cagniard resistivity. Therefore, electrical and magnetic fields are measured on the ground with a distance at the far-zone, where the useful signal can be measured.
The three components of electrical (Equations (1)–(3)) and magnetic (Equations (4)–(6)) fields could be computed by the following equations:
where E is electrical field; H is magnetic field; I is current; AB is the length of the transmitter source; is resistivity; is magnetic permeability in air; is angular frequency; ( is the coordinate of the observation point. The Cagniard resistivity [1] can be calculated by using the ratio of the orthogonal horizontal components Ex/Hy from the equations above.
Finally, the impedance phase is given by
4. Geophysical Survey
4.1. IP Interpretation and CSAMT Data Acquisition Design
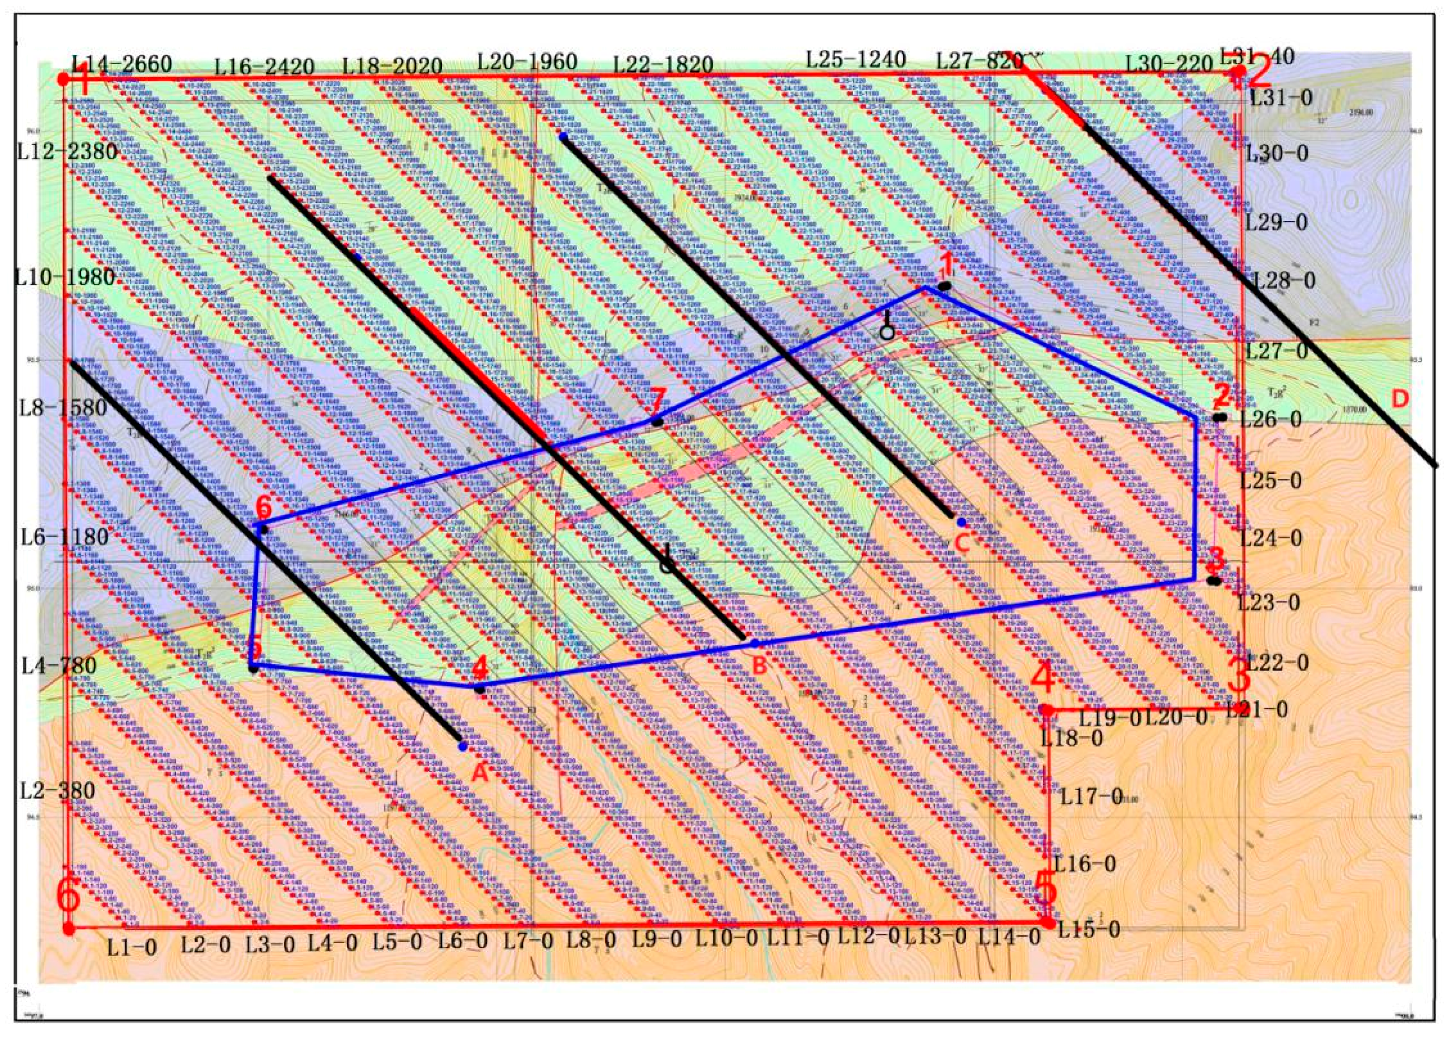
In 2015, we did a dual-frequency induced polarization (IP) investigation on the survey area (Figure 2). Based on the results of that study we set up the CSAMT data acquisition design. In Figure 2, the area with red line bounded is the dual-frequency IP investigation region. The grid of dual-frequency IP data is 100 m × 20 m, all line spacing and station spacing are 100 m and 20 m respectively, with red dots marking measurement points. A total of 31 profiles of dual-frequency IP survey described a distribution of IP and resistivity anomalies.
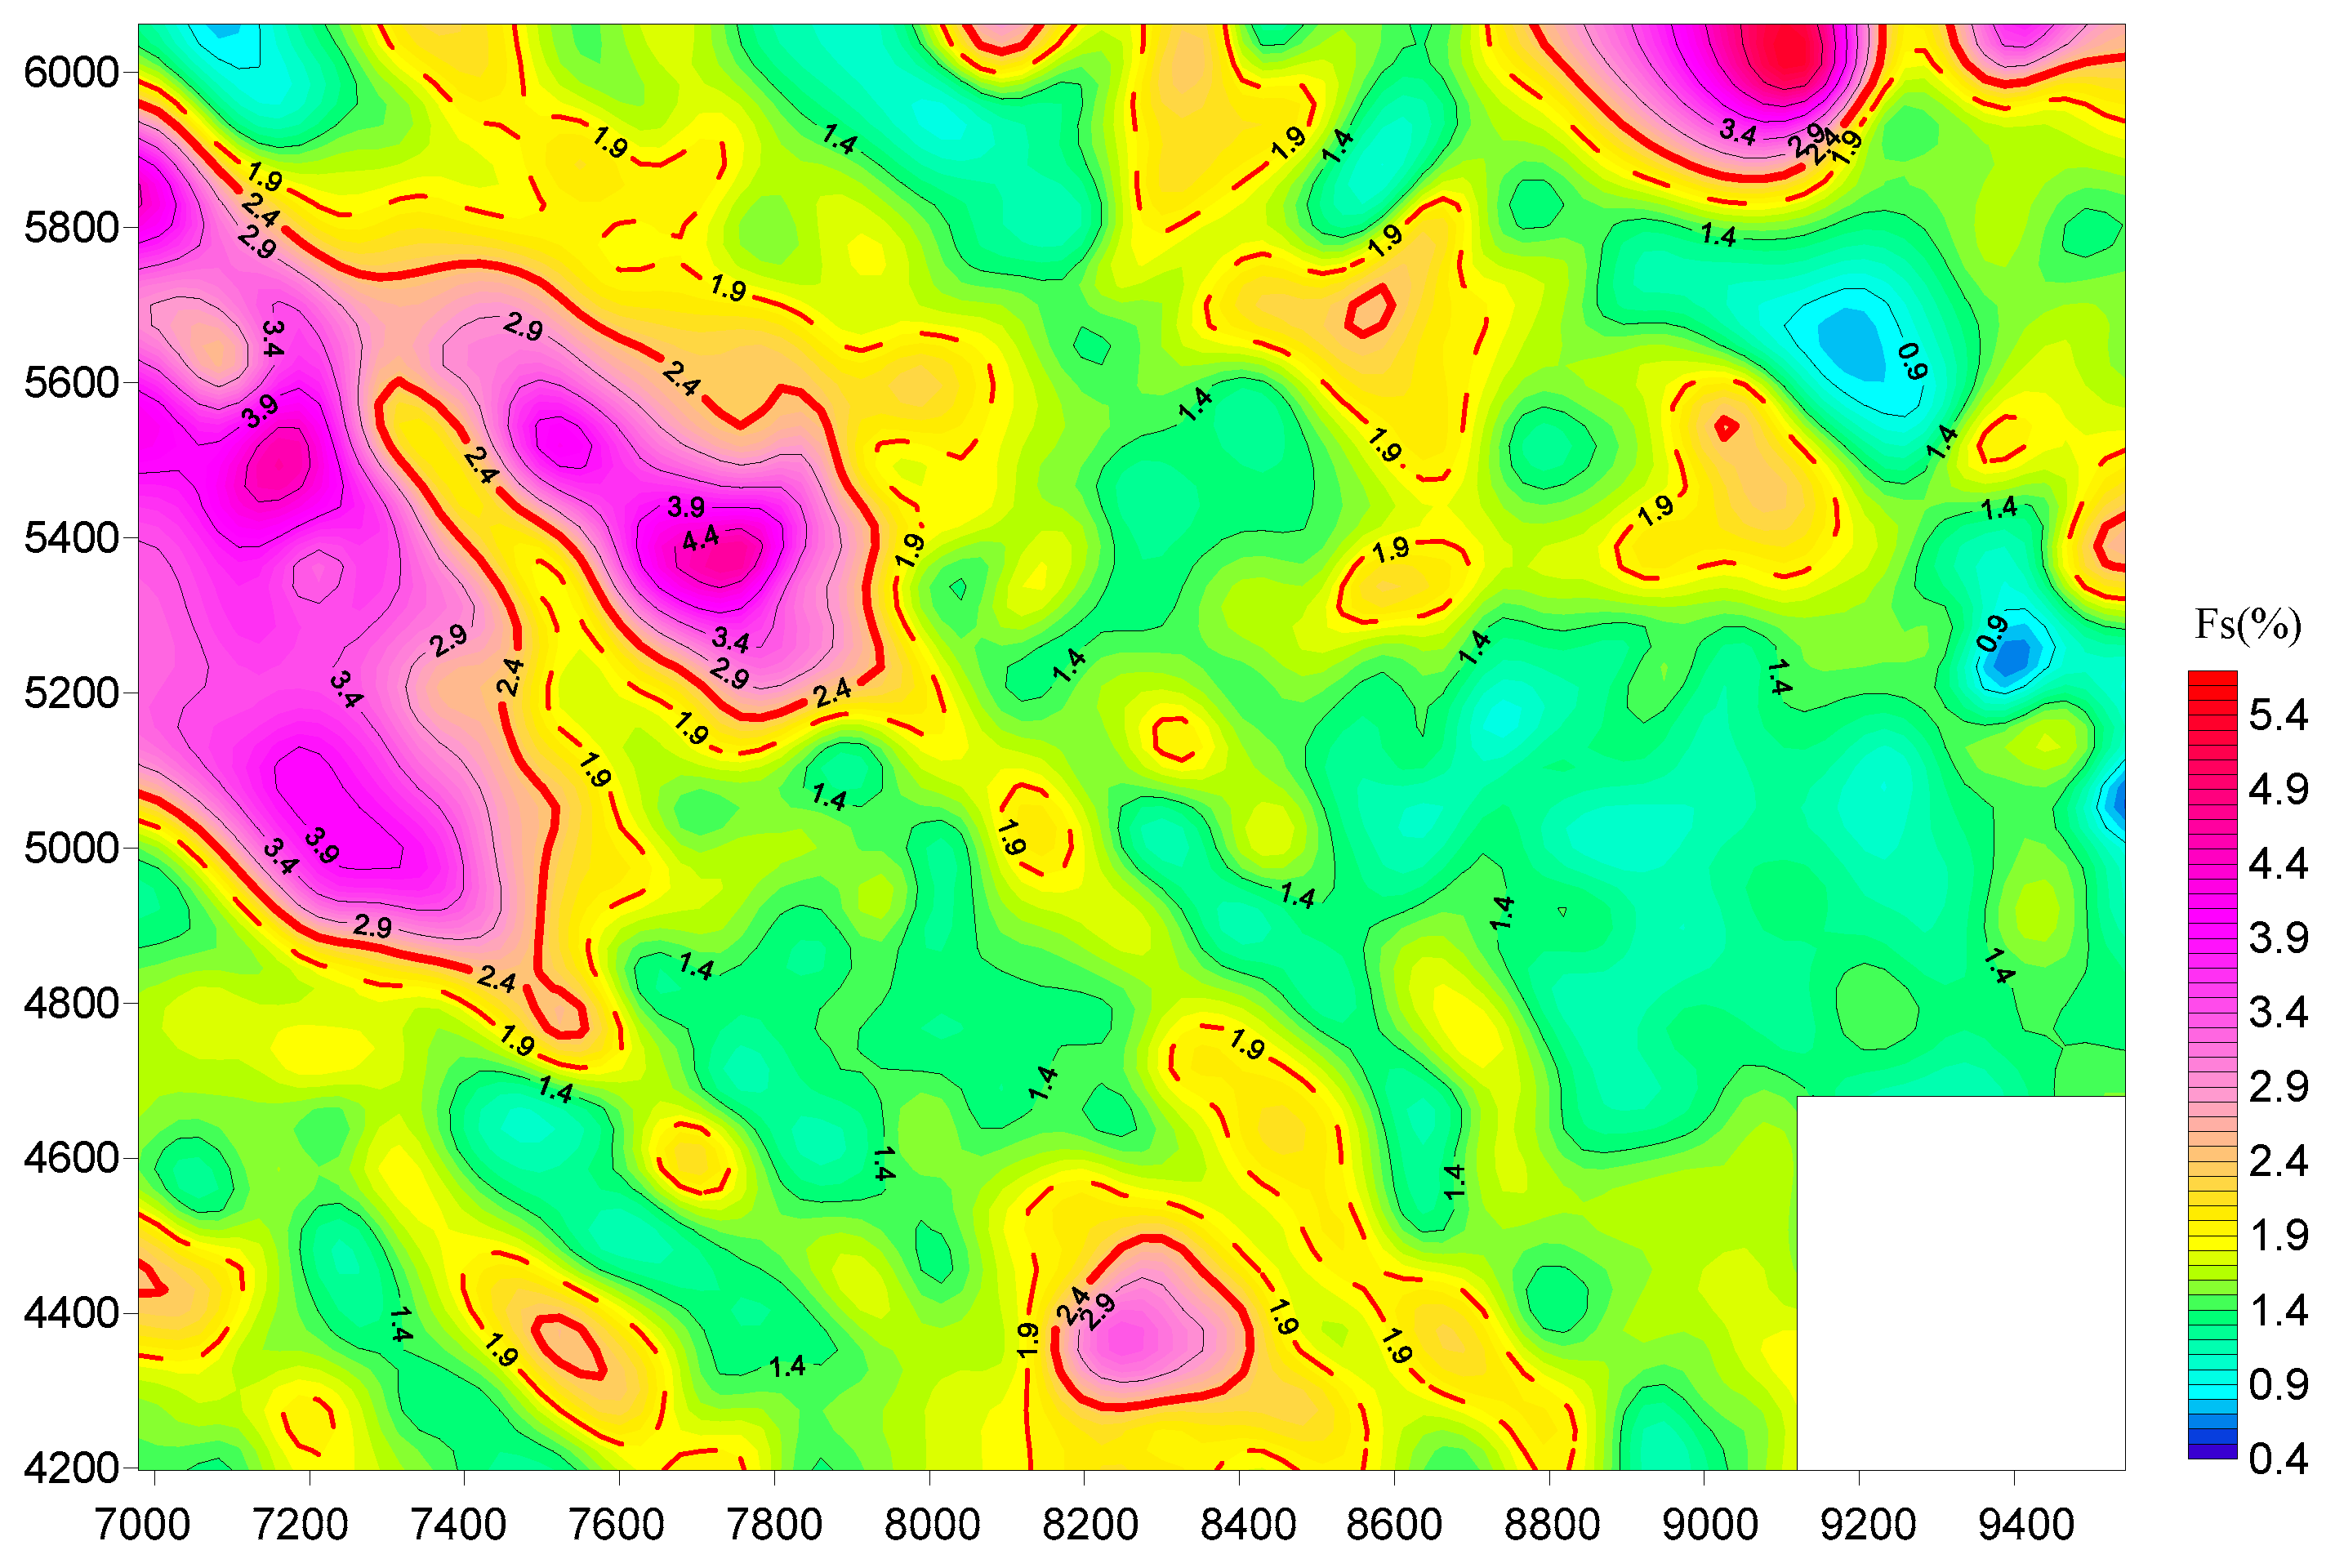
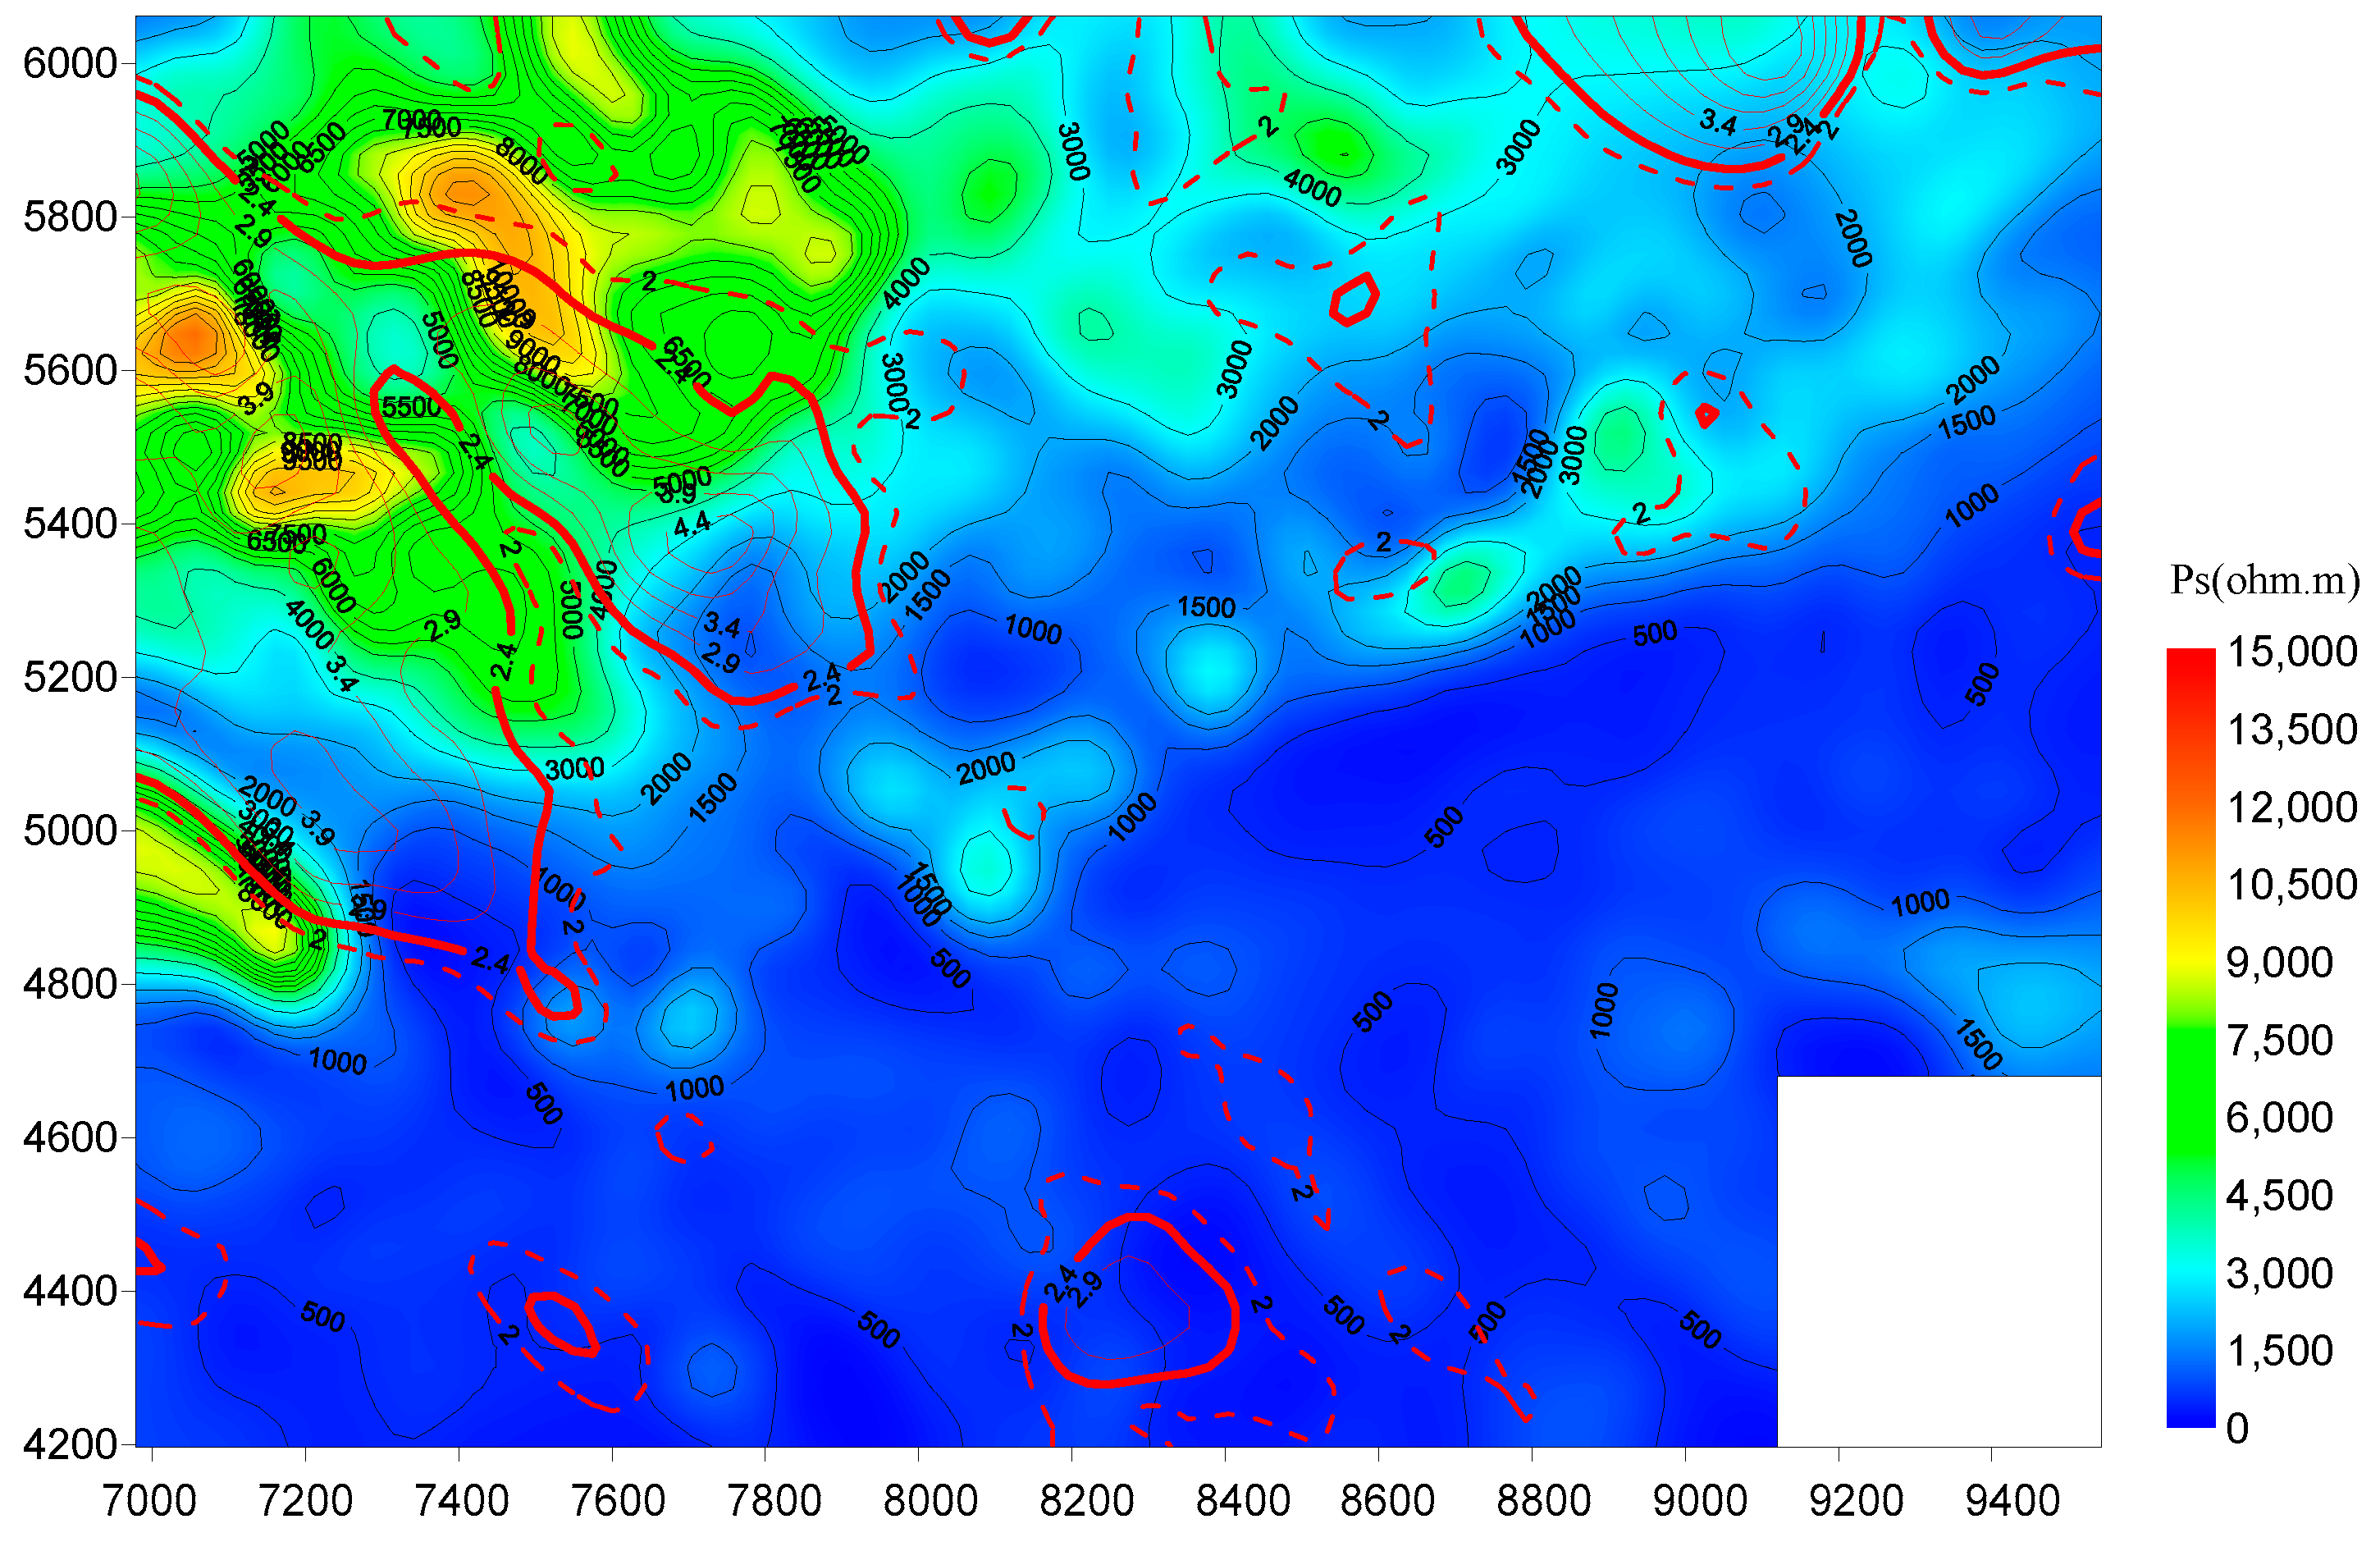
Figure 3 and Figure 4 show the IP and resistivity anomalies, respectively. The amplitude of an IP (Fs, %) anomaly was defined with the value larger than 2.4. Table 1 shows the resistivity and polarizability of characteristic rocks from this mining area. From the Table 1, the amplitude frequency background formation was around 2.0. Based on the physical difference between the rocks and ores, it was easy to infer the IP anomaly zones due to the Pb–Zn ore body or mineralization. Compared to the unmineralized rock formations, the Pb–Zn mineralization might reflect a low resistivity anomaly in the background. In order to interpret clearly, we drew the resistivity contour map (Figure 4) with the amplitude frequency anomaly. Integrated the amplitude frequency and resistivity map, the interesting area was selected for the CSAMT measurement to detect the deep target. We studied the subsurface resistivity distribution by using CSAMT method. The profiles were designed to span all of interesting area in a time-saving way as Figure 2 shows.
4.2. Data Acquisition, Processing and Inversion
In order to describe the subsurface resistivity distribution, four CSAMT data acquisition profiles were designed with 1200 m length and 20 m station distance. Before the CSAMT survey, we tested the offset with 8 km and 12 km. Based on the results of the test, the offset was chosen as 11 km, and the horizontal current dipole length was 1200 m. The current was 9 A at low frequency. The CSAMT profiles A–D location are shown as black lines in Figure 2.
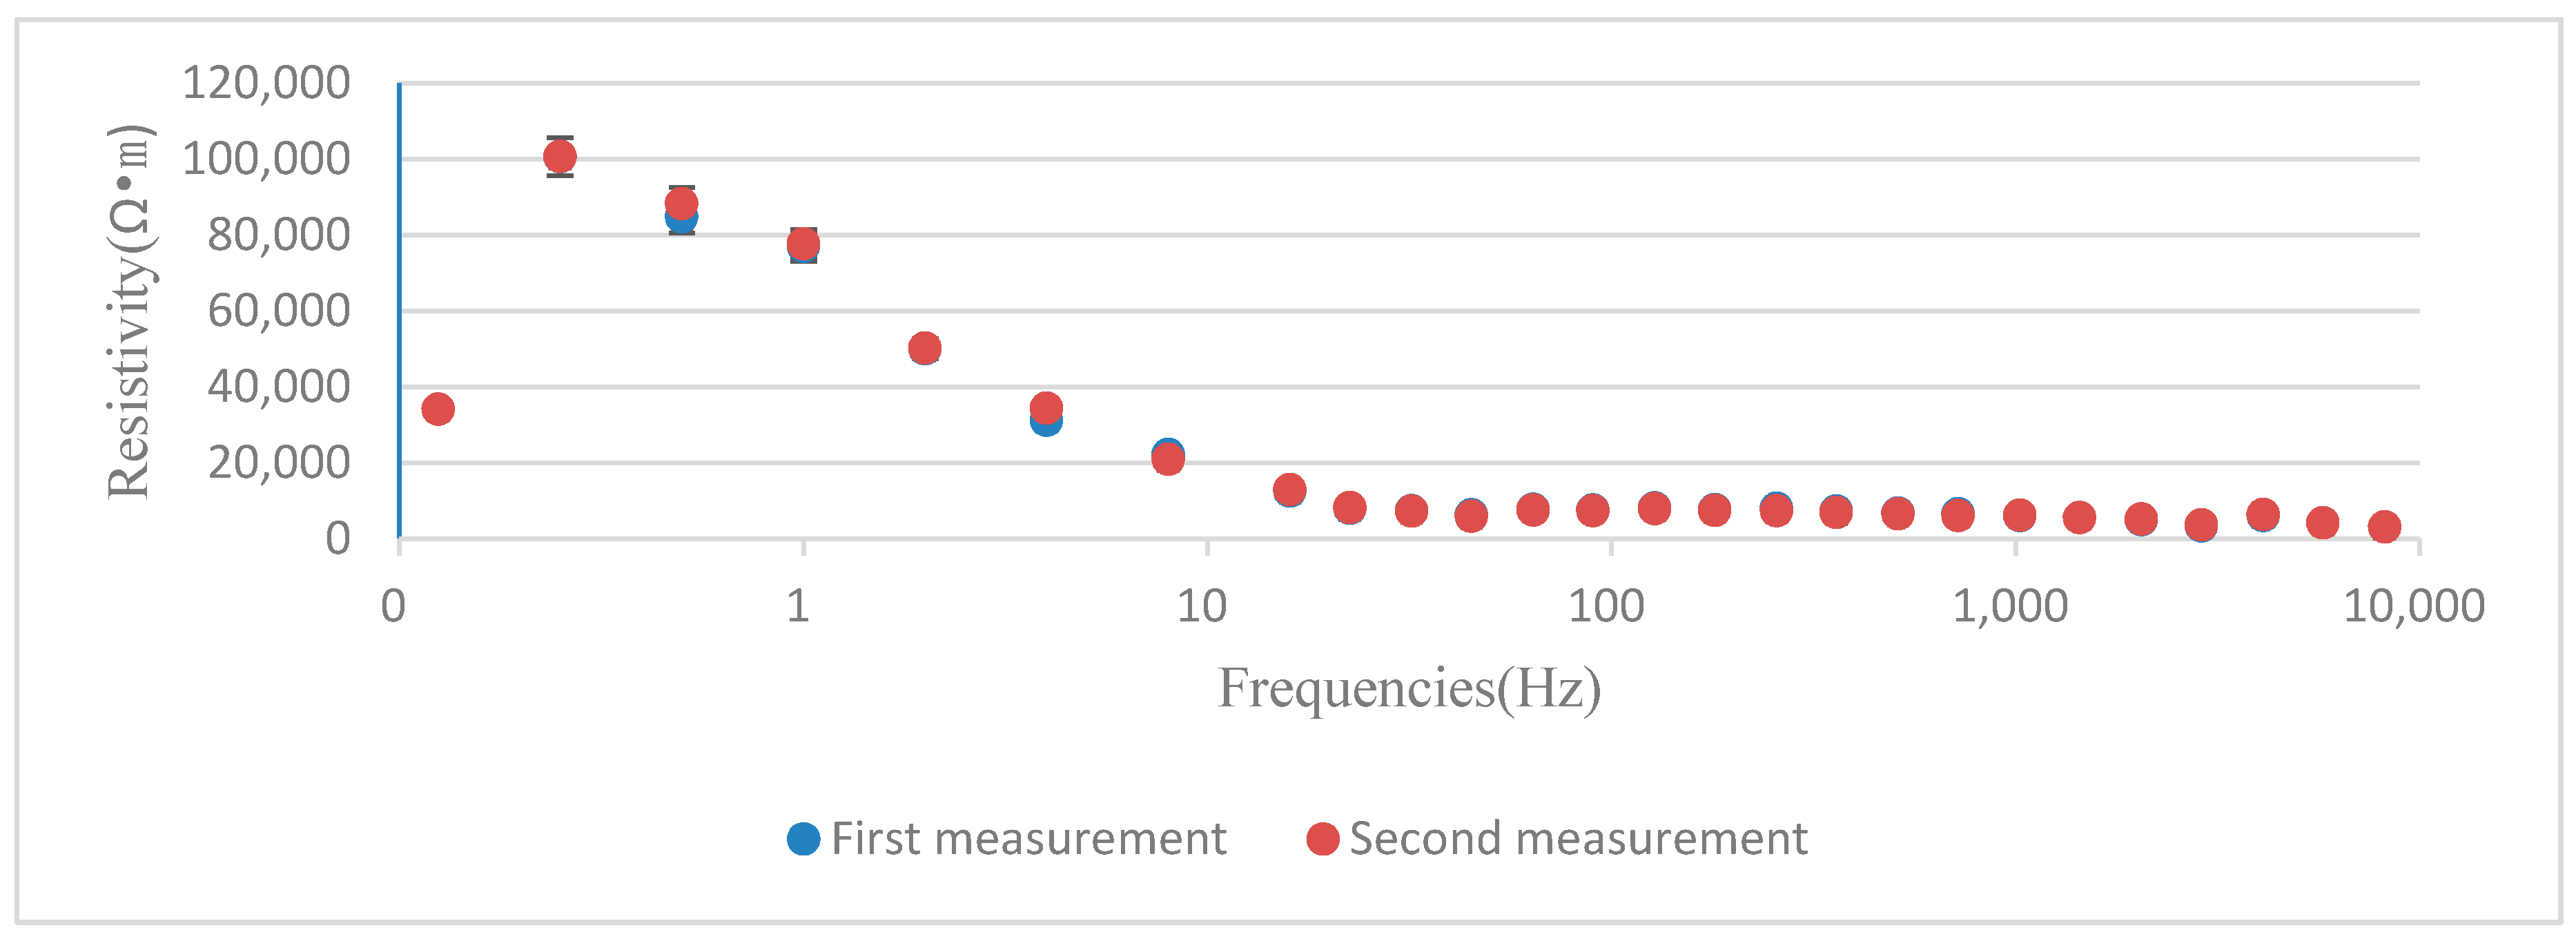
The quality evaluation of this CSAMT measurement was determined by calculating the mean square error (MSE) (<±5%) of Cagniard resistivity in two surveys at the same station. Data consistency was checked by comparing Cagniard resistivity data in two surveys at 1700 station 20 line as shown in Figure 5. Based on the same conditions, the relative error of the data collected twice was 2.76%. The low-frequency data reflected a slight error, which was the allowable range of normal error, and did not affect the subsequent inversion processing. The CSAMT data collection in this area was reliable, which provided guarantee for data processing and data interpretation.
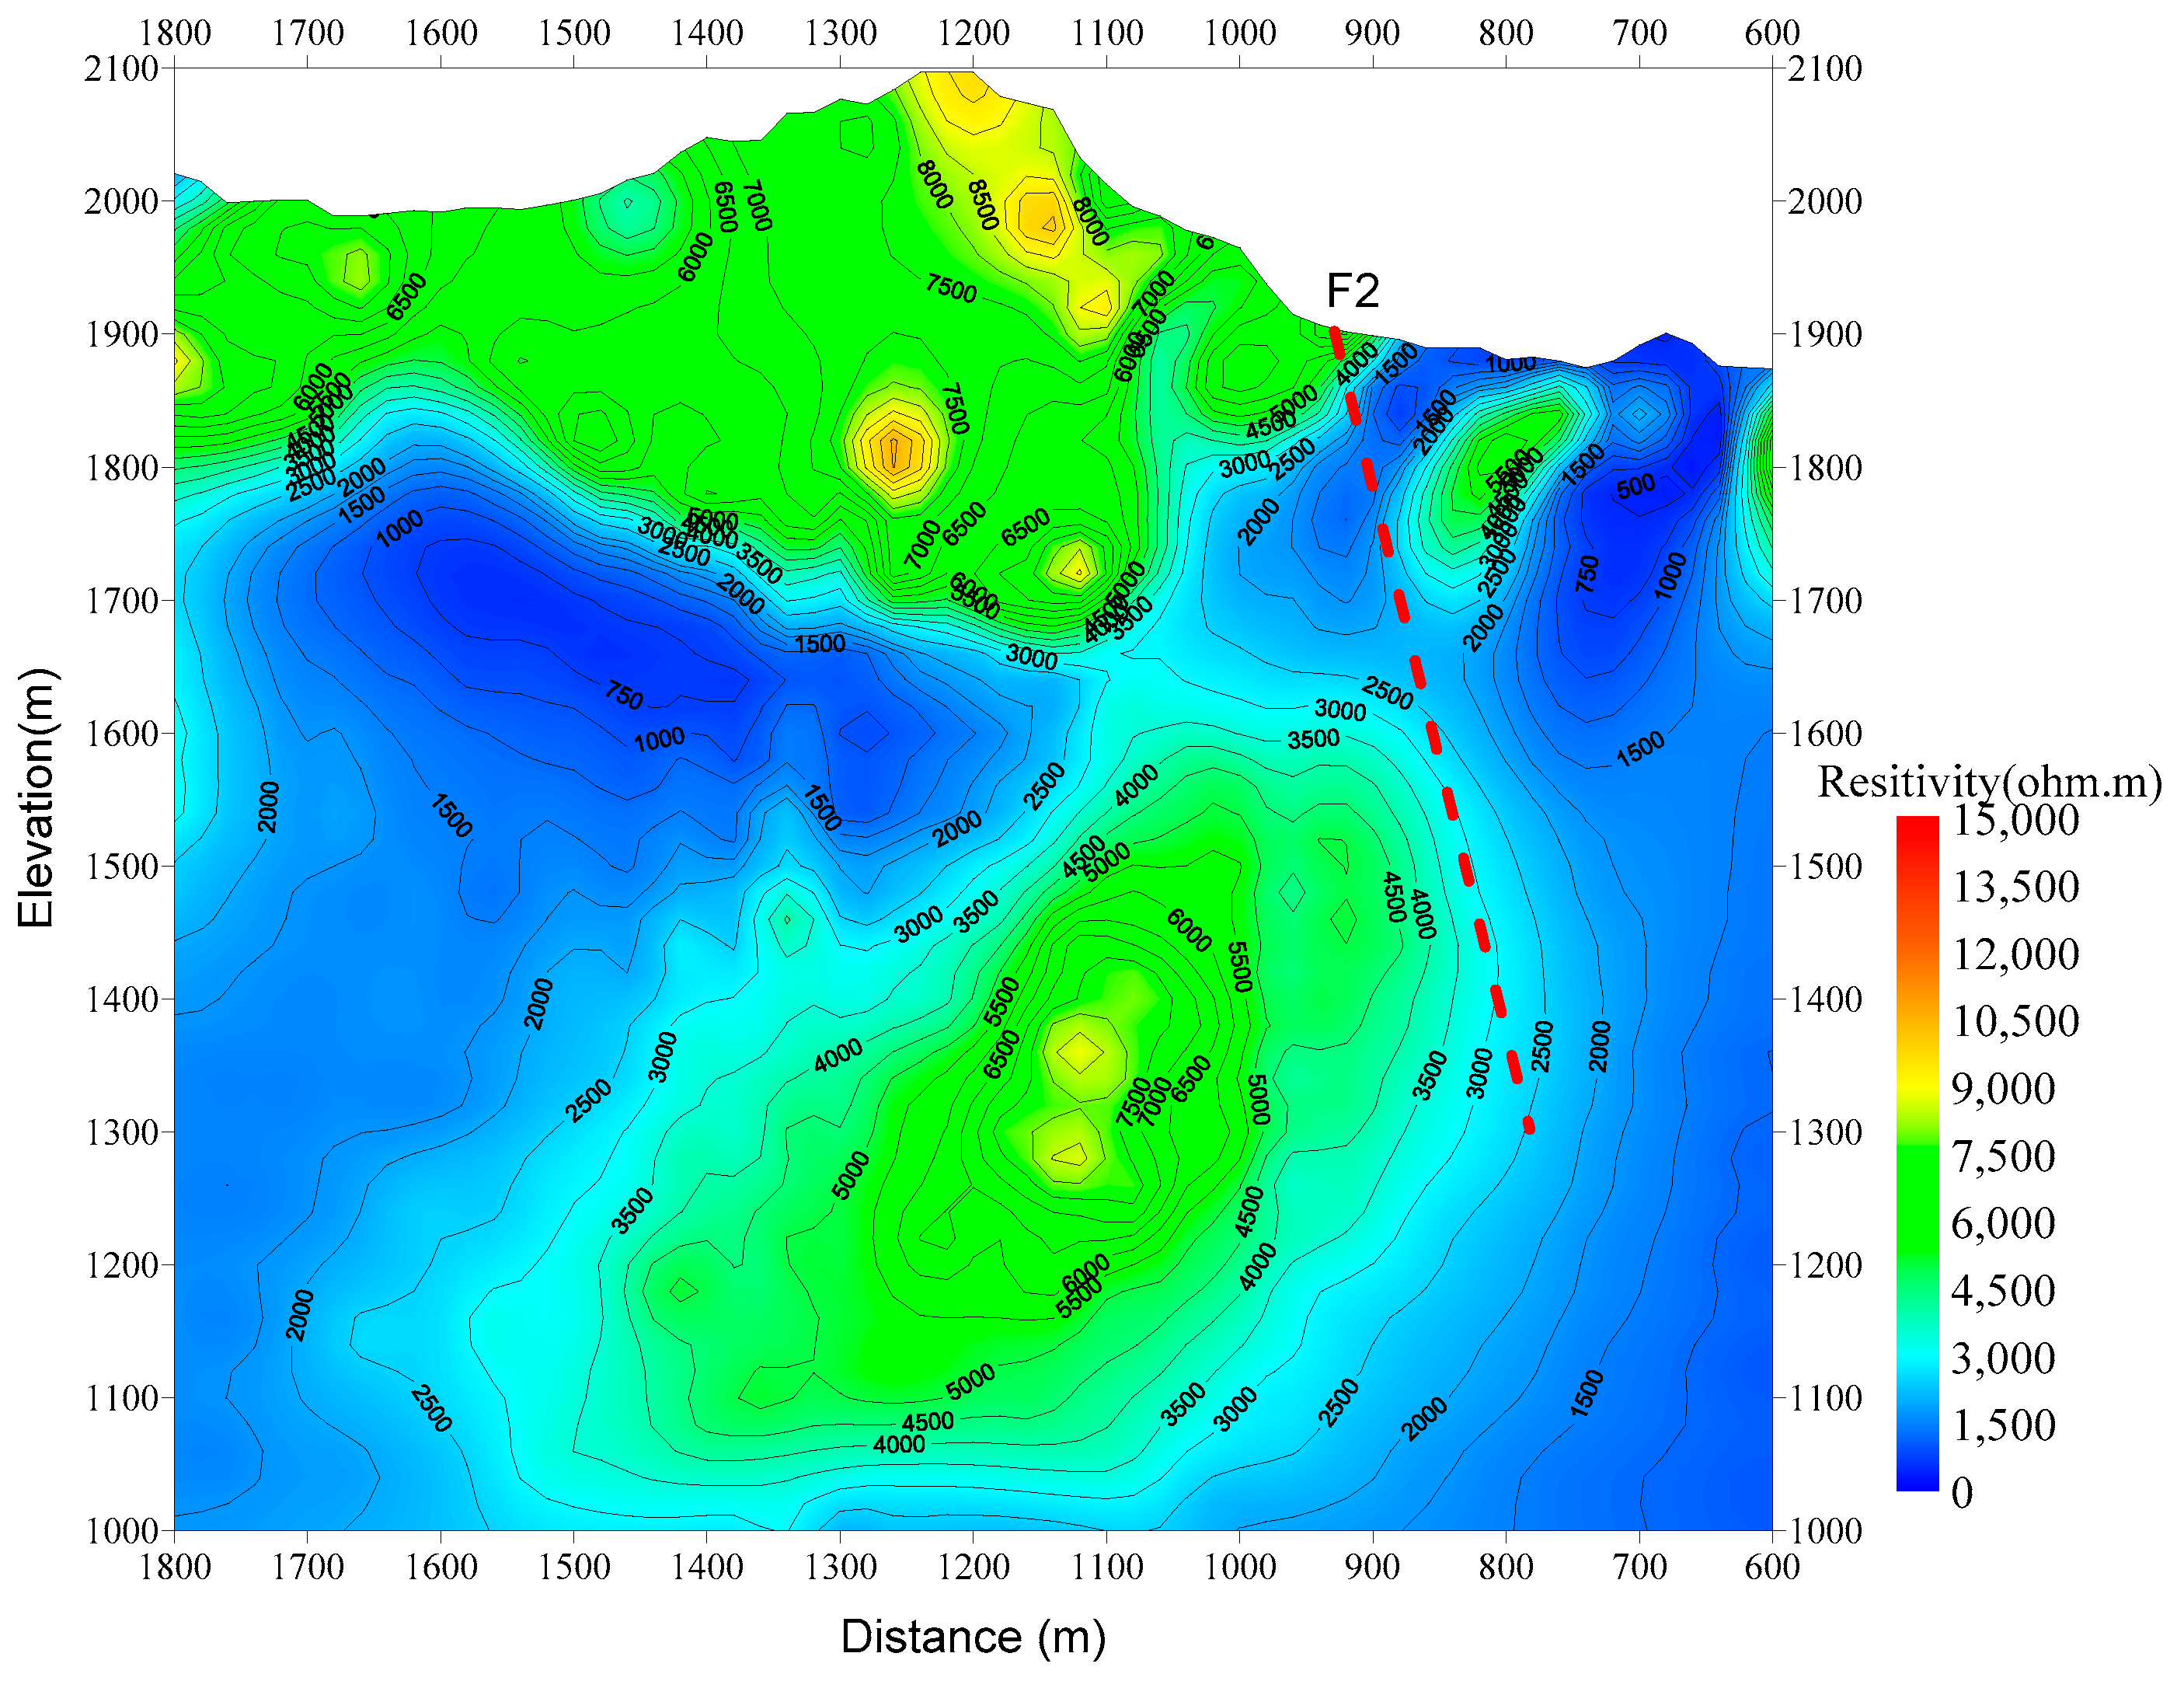
Occam’s inversion was introduced to find a smooth model to satisfy the geophysical data by Constable et al. [15]. It is a simple way to map the subsurface resistivity structure. The CSAMT data inversion results are shown in Figure 6, Figure 7, Figure 8 and Figure 9. From Table 1, we know that the weathered granite has a low resistivity. By contrast, the limestone and dolomites are a bit higher than granite in resistivity. In Figure 6, the resistivity of the stations on the right side of 1000 station describe the third stratum (T2g3) of the Gejiu Formation. The low-resistivity anomaly at the depth of 400–500 m between the station of 1200 and 1700 is inferred to be due to the mineral deposits.
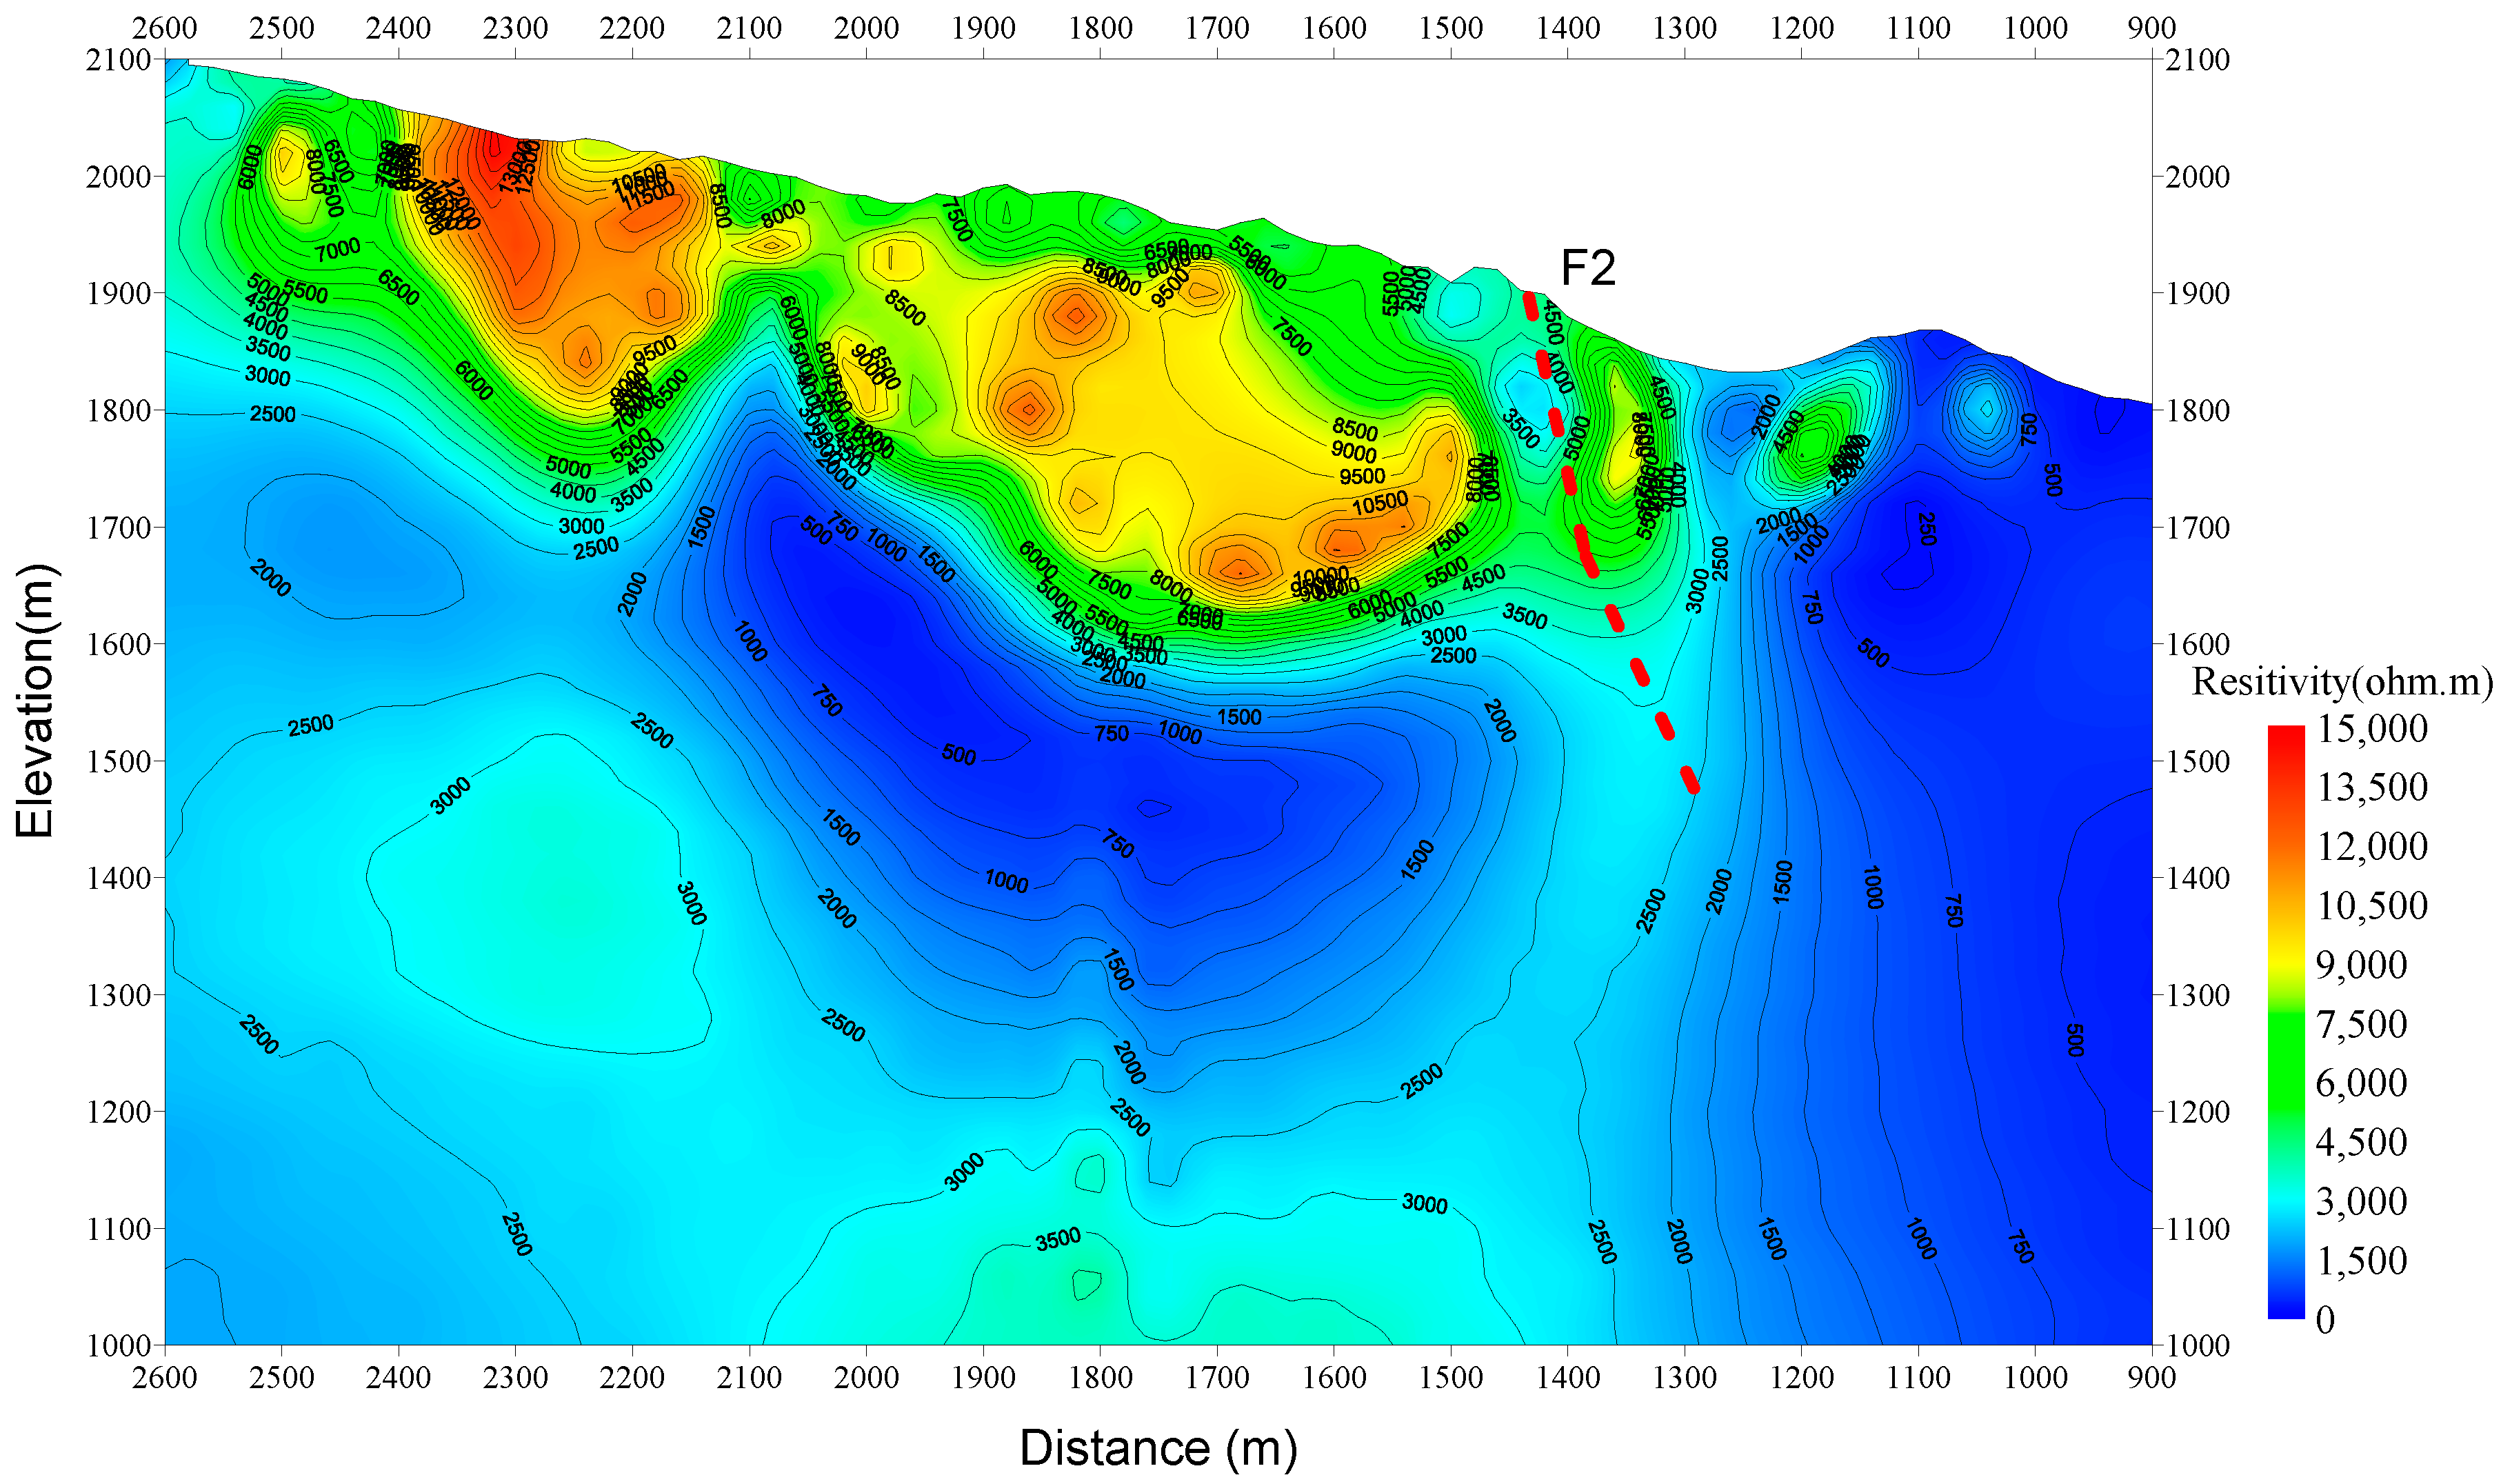
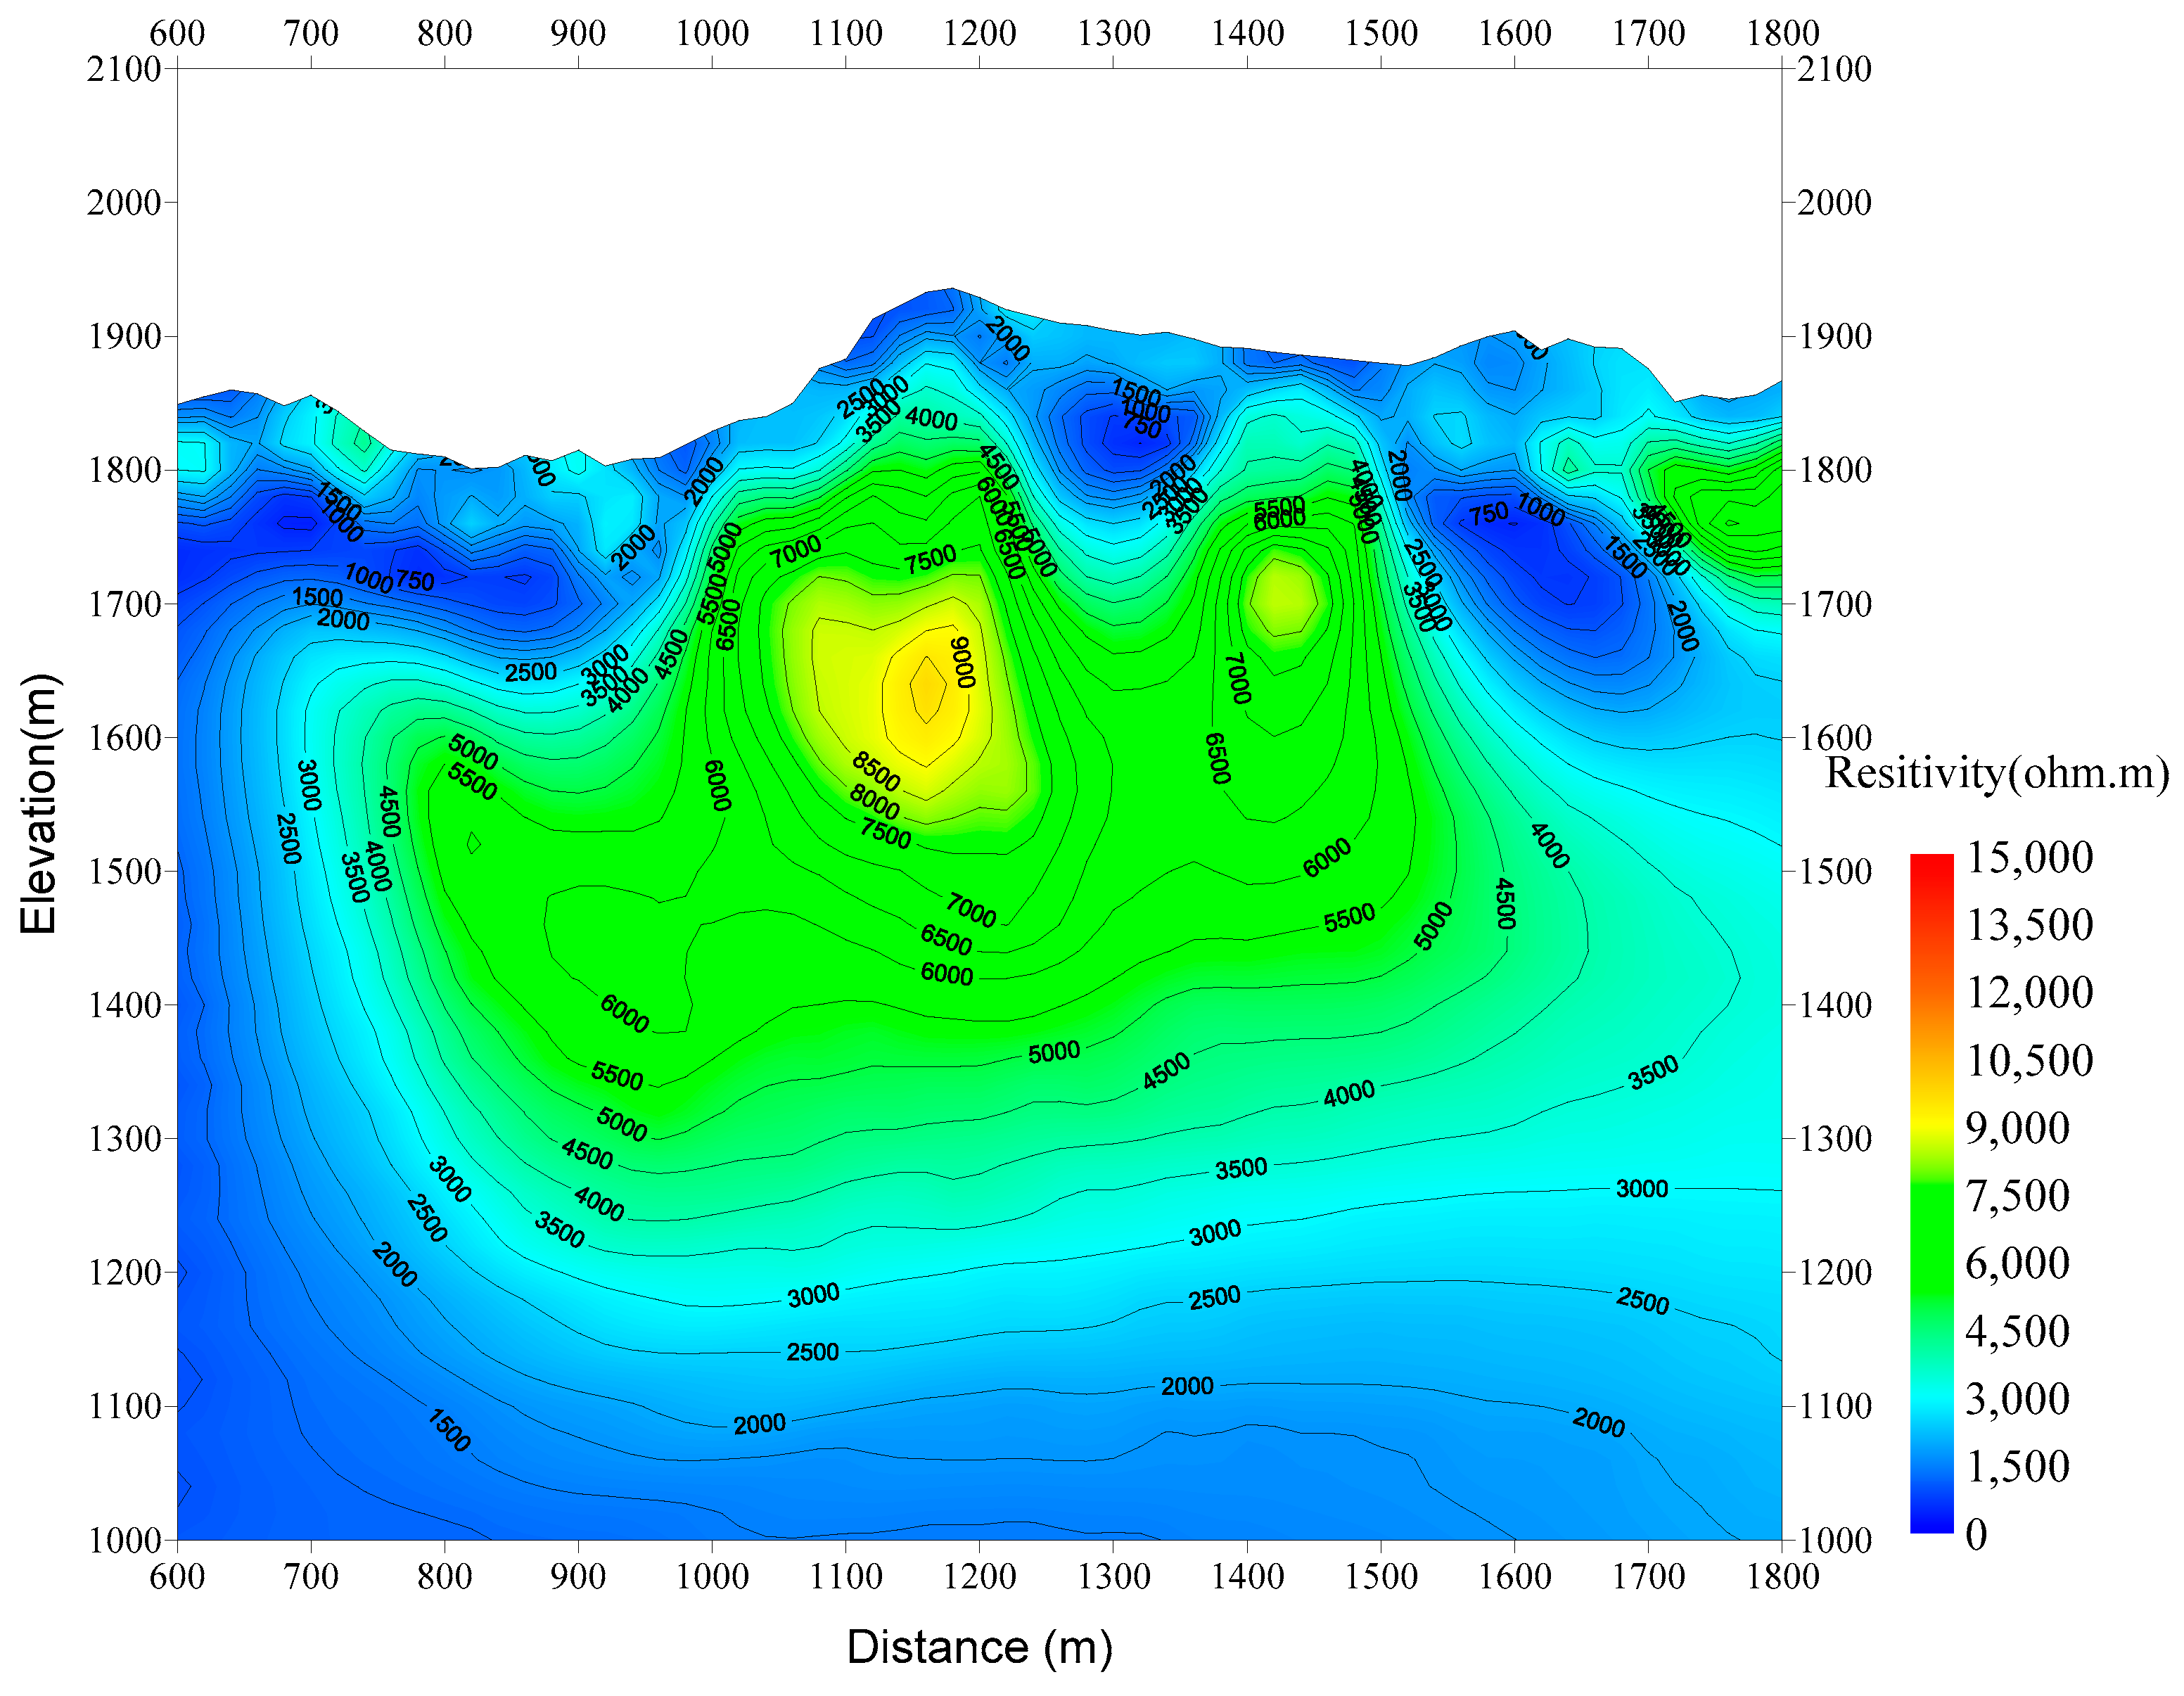
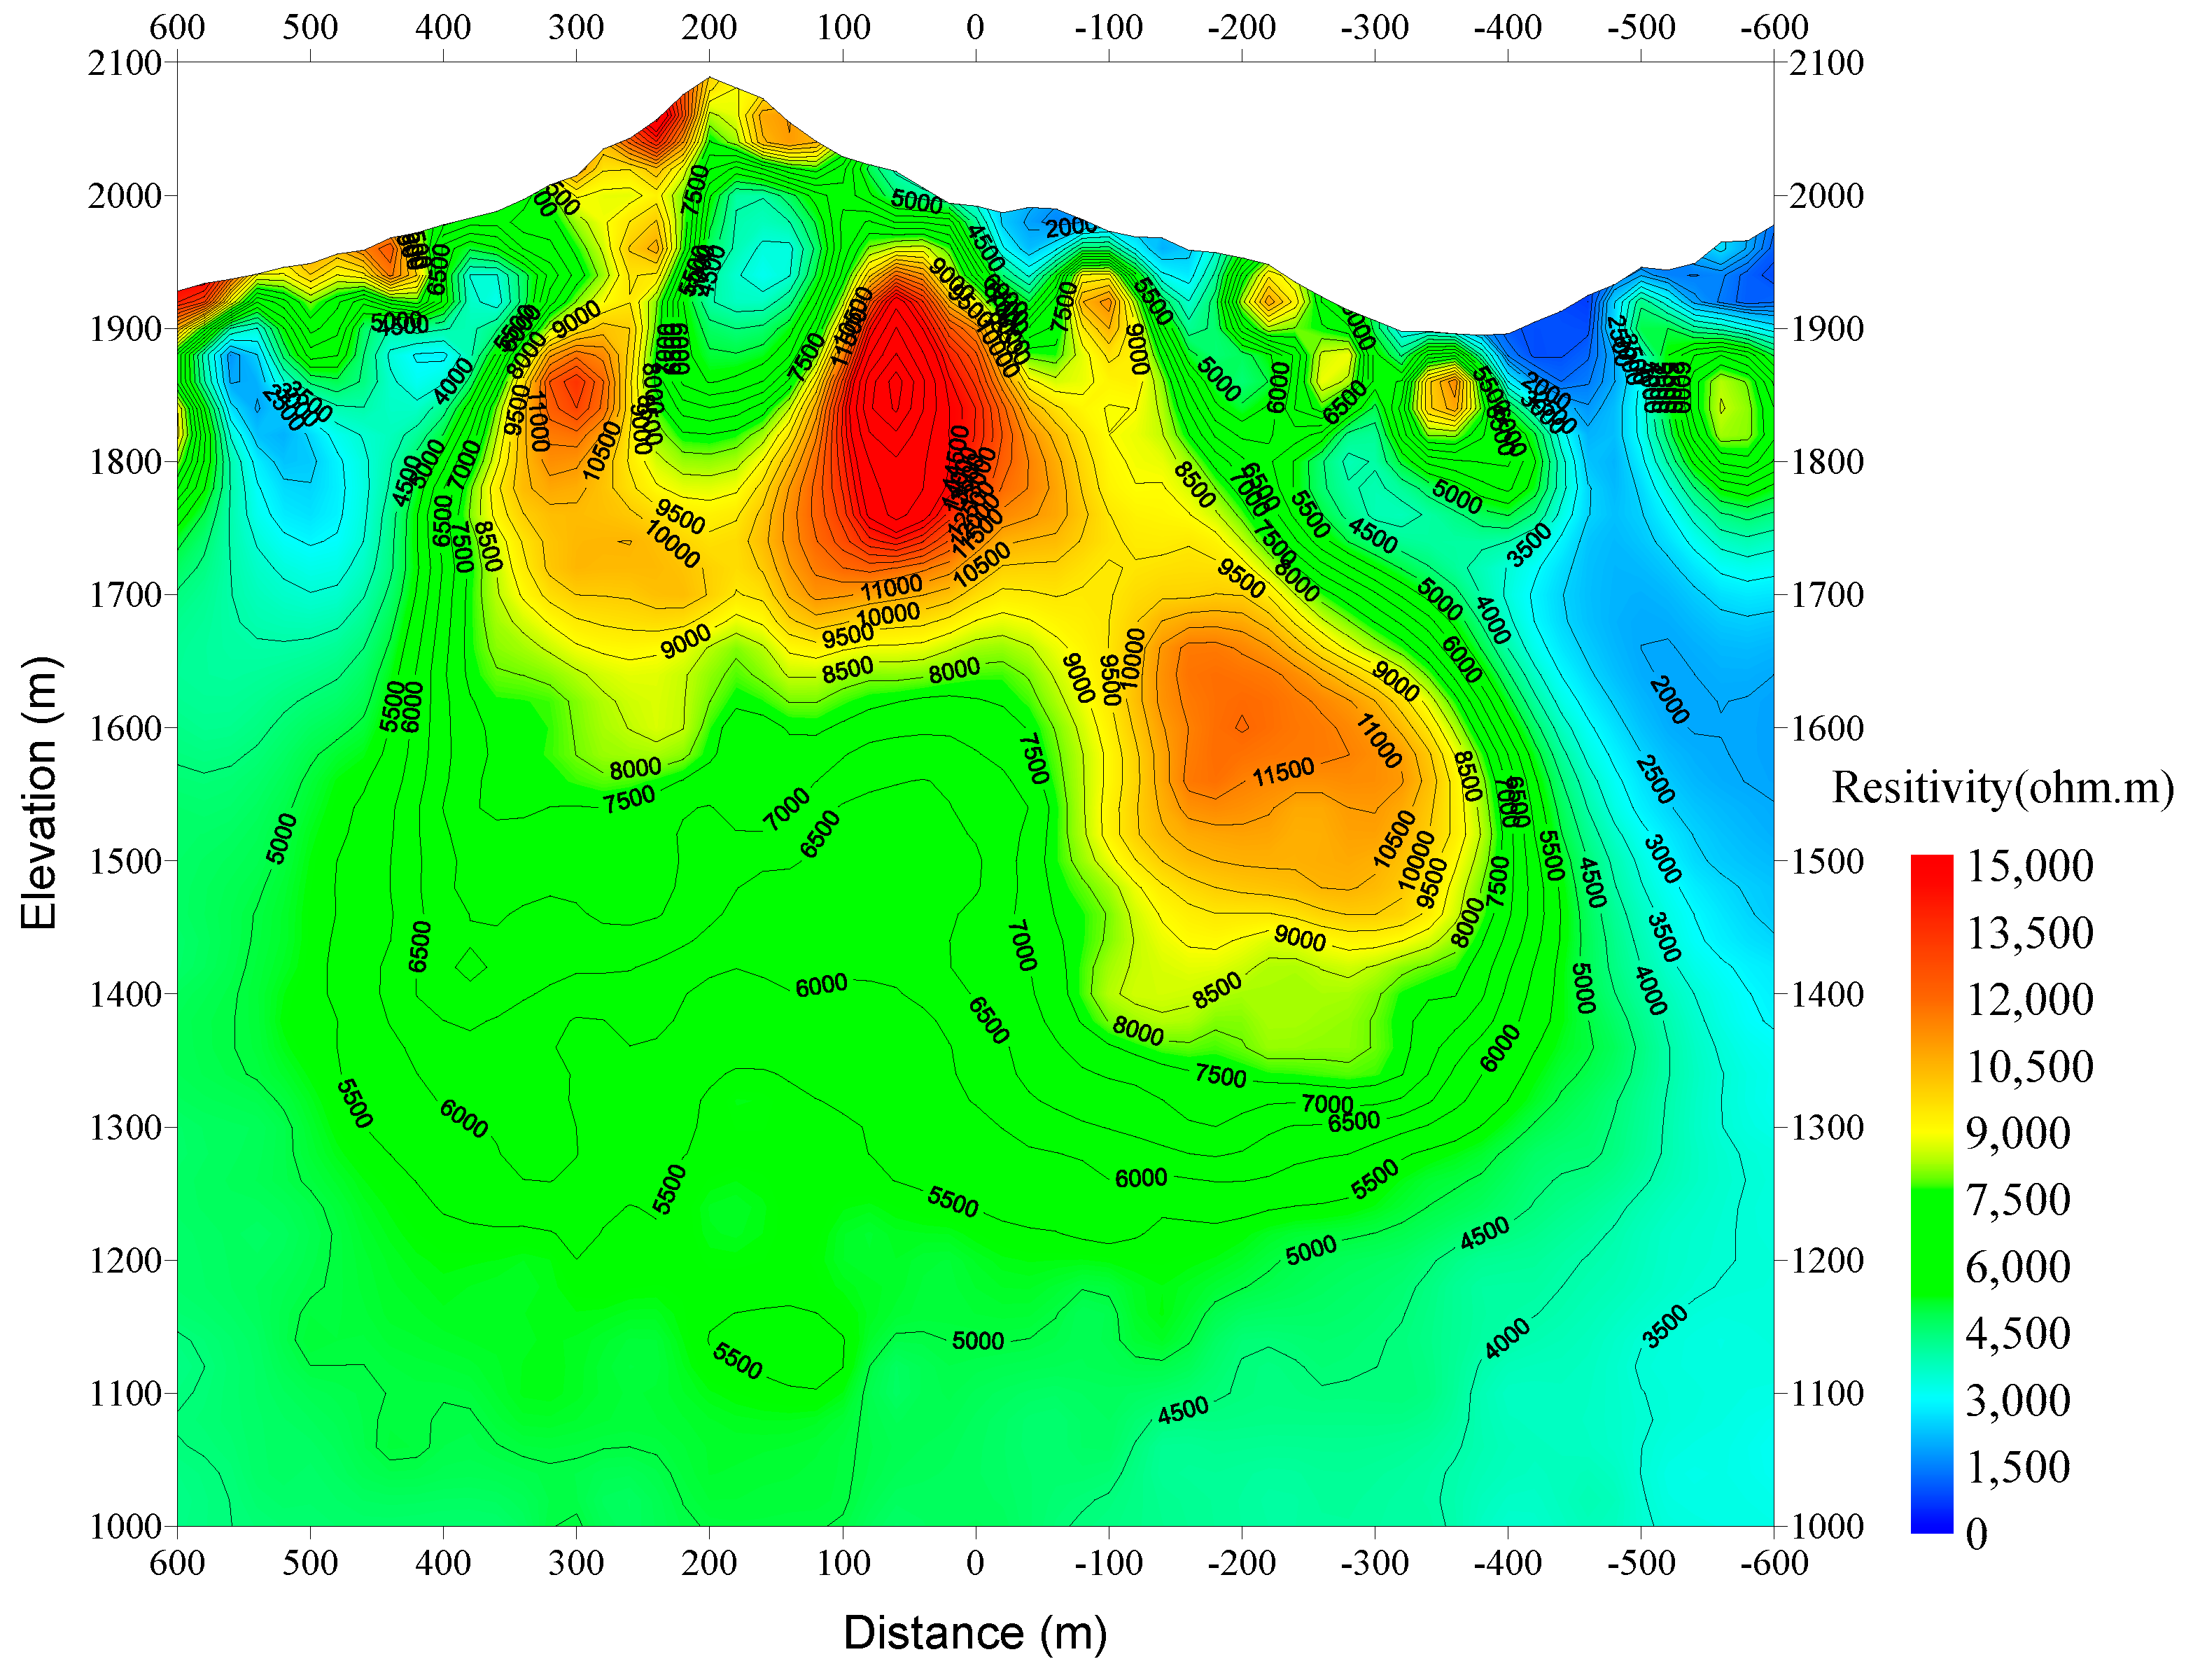
In Figure 7, the fault F2 is still Triassic. The fault zone is expressed at the surface between stations 1400 m and 1500 m along profile A. It extends to around 300 m below the surface, and the interface between the shallow layer and the granite argillaceous limestone overlaps. There is a low resistivity anomaly band between the stations 1600 and 2000 at a depth of 600 m. The high resistivity anomalies in Figure 7 and Figure 8 are due to the dolomites in this area.
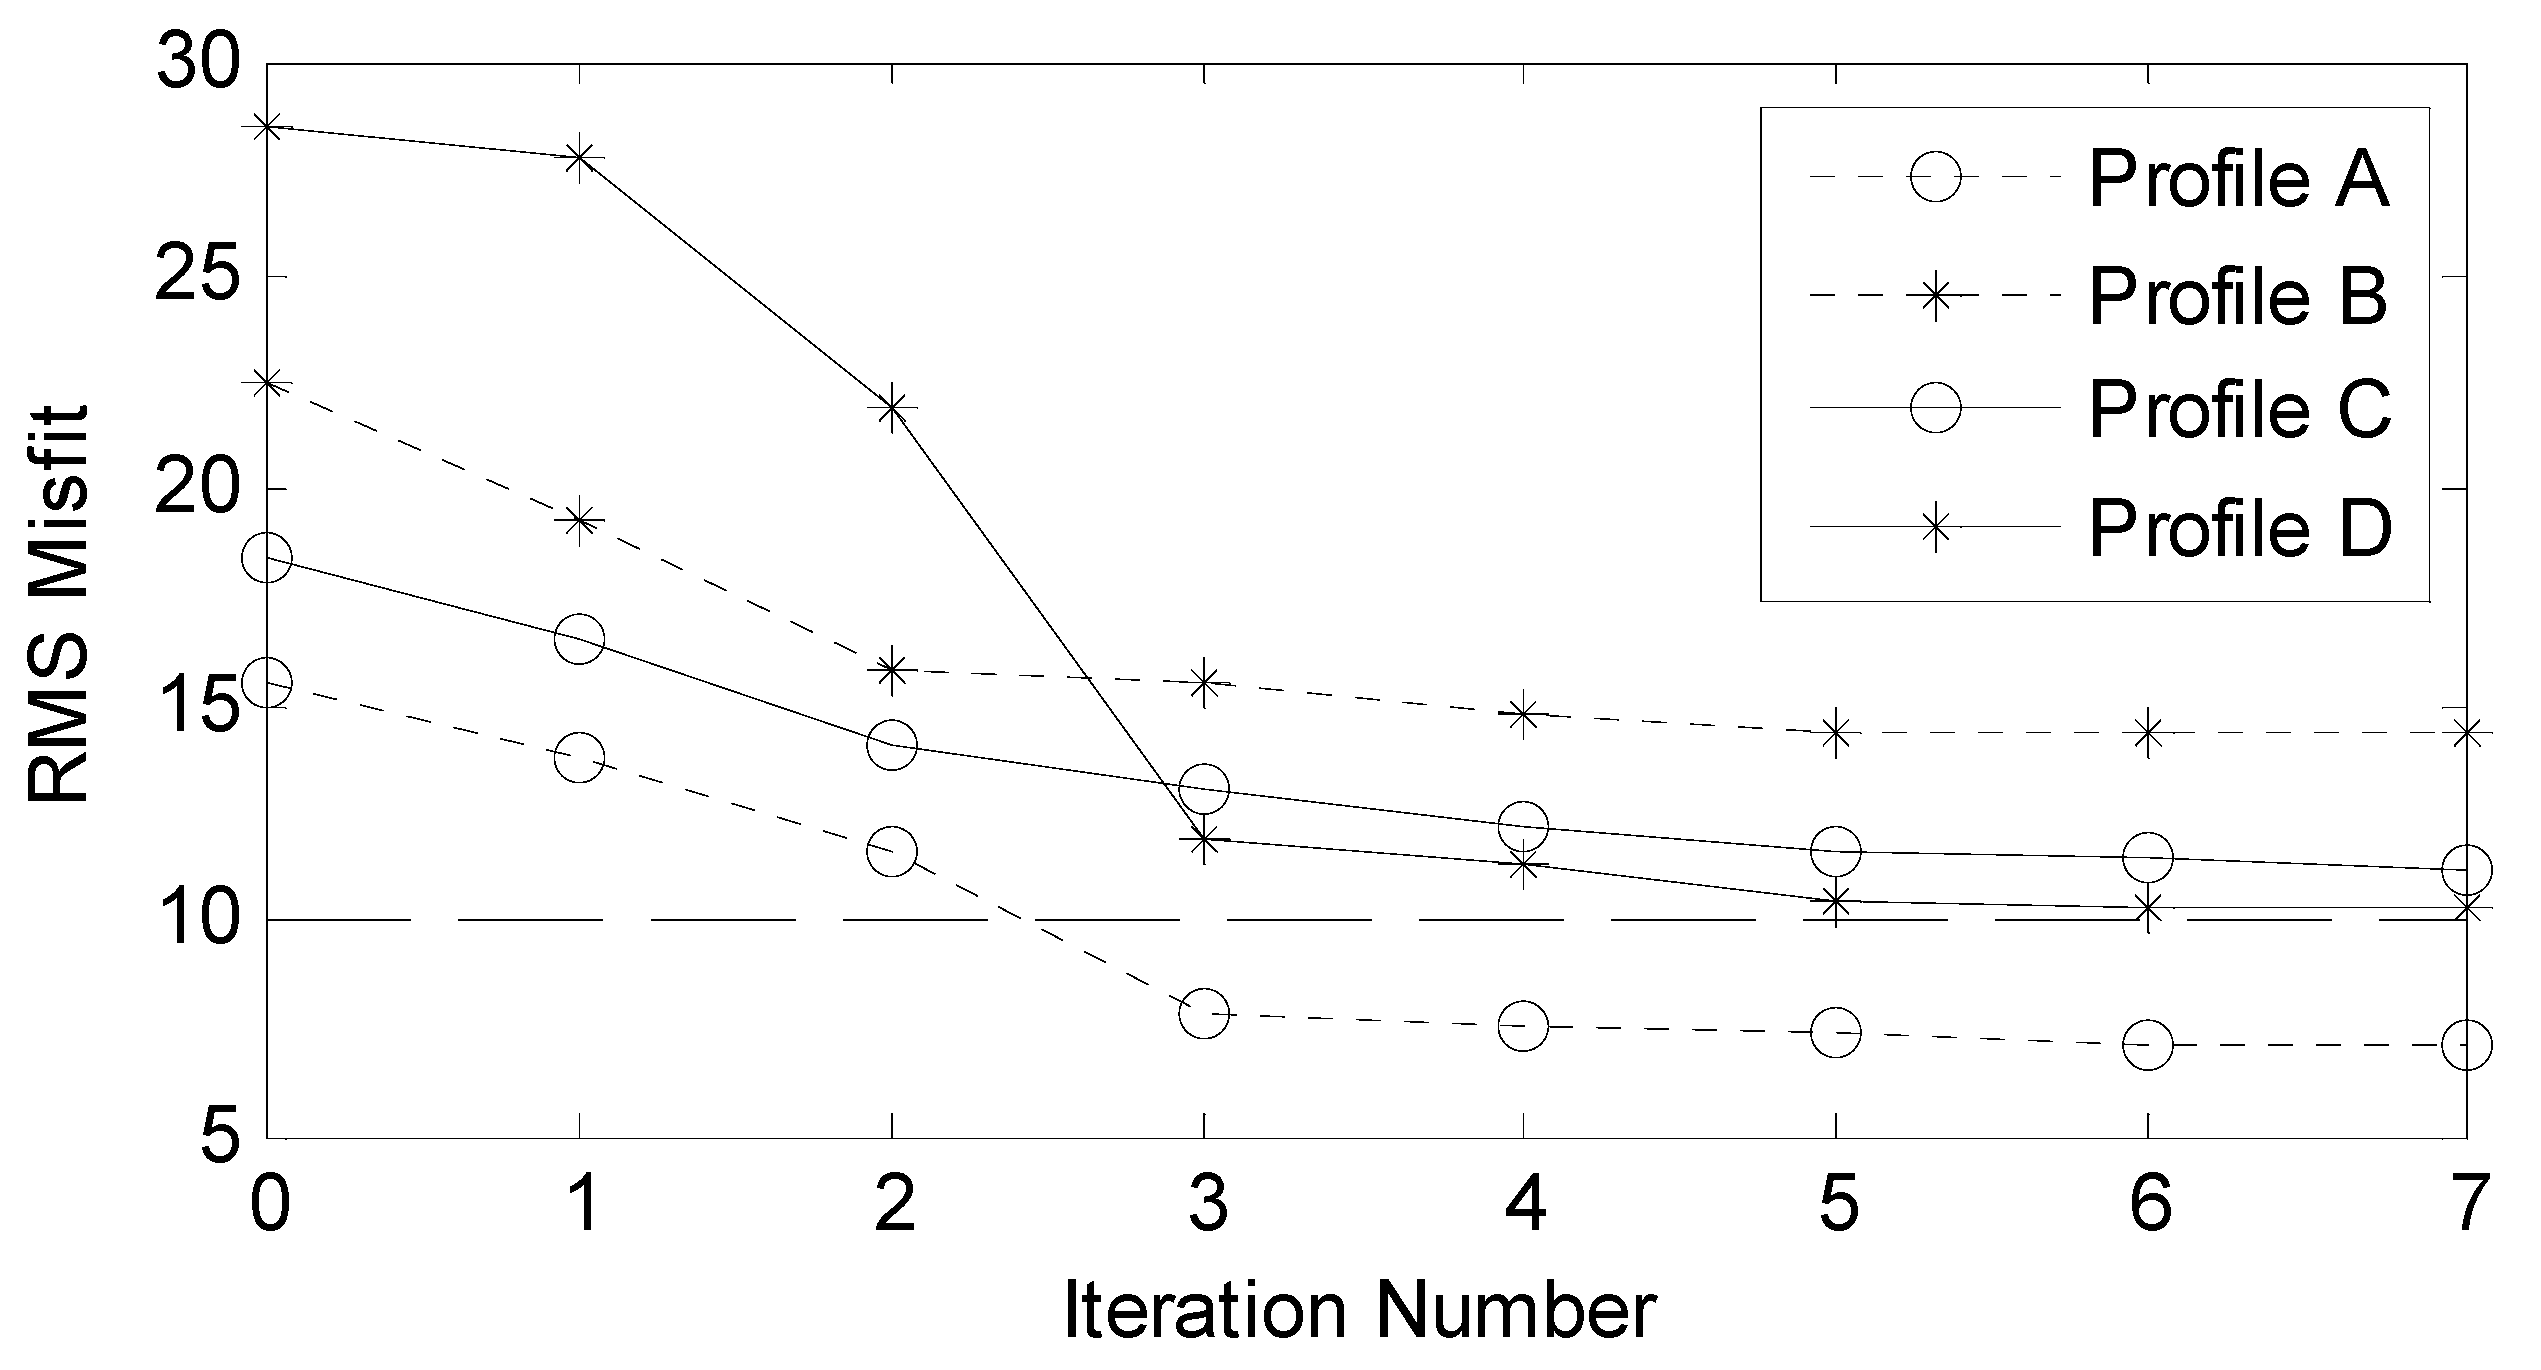
The RMS misfit of the inversion is shown in Figure 10. All RMS inversion residual reduce fast before the third iteration. After that, four curves of the profiles decrease small. When the percent of residual change is smaller than 1%, the inversion is stopped.
4.3. CSAMT Results and Interpretation
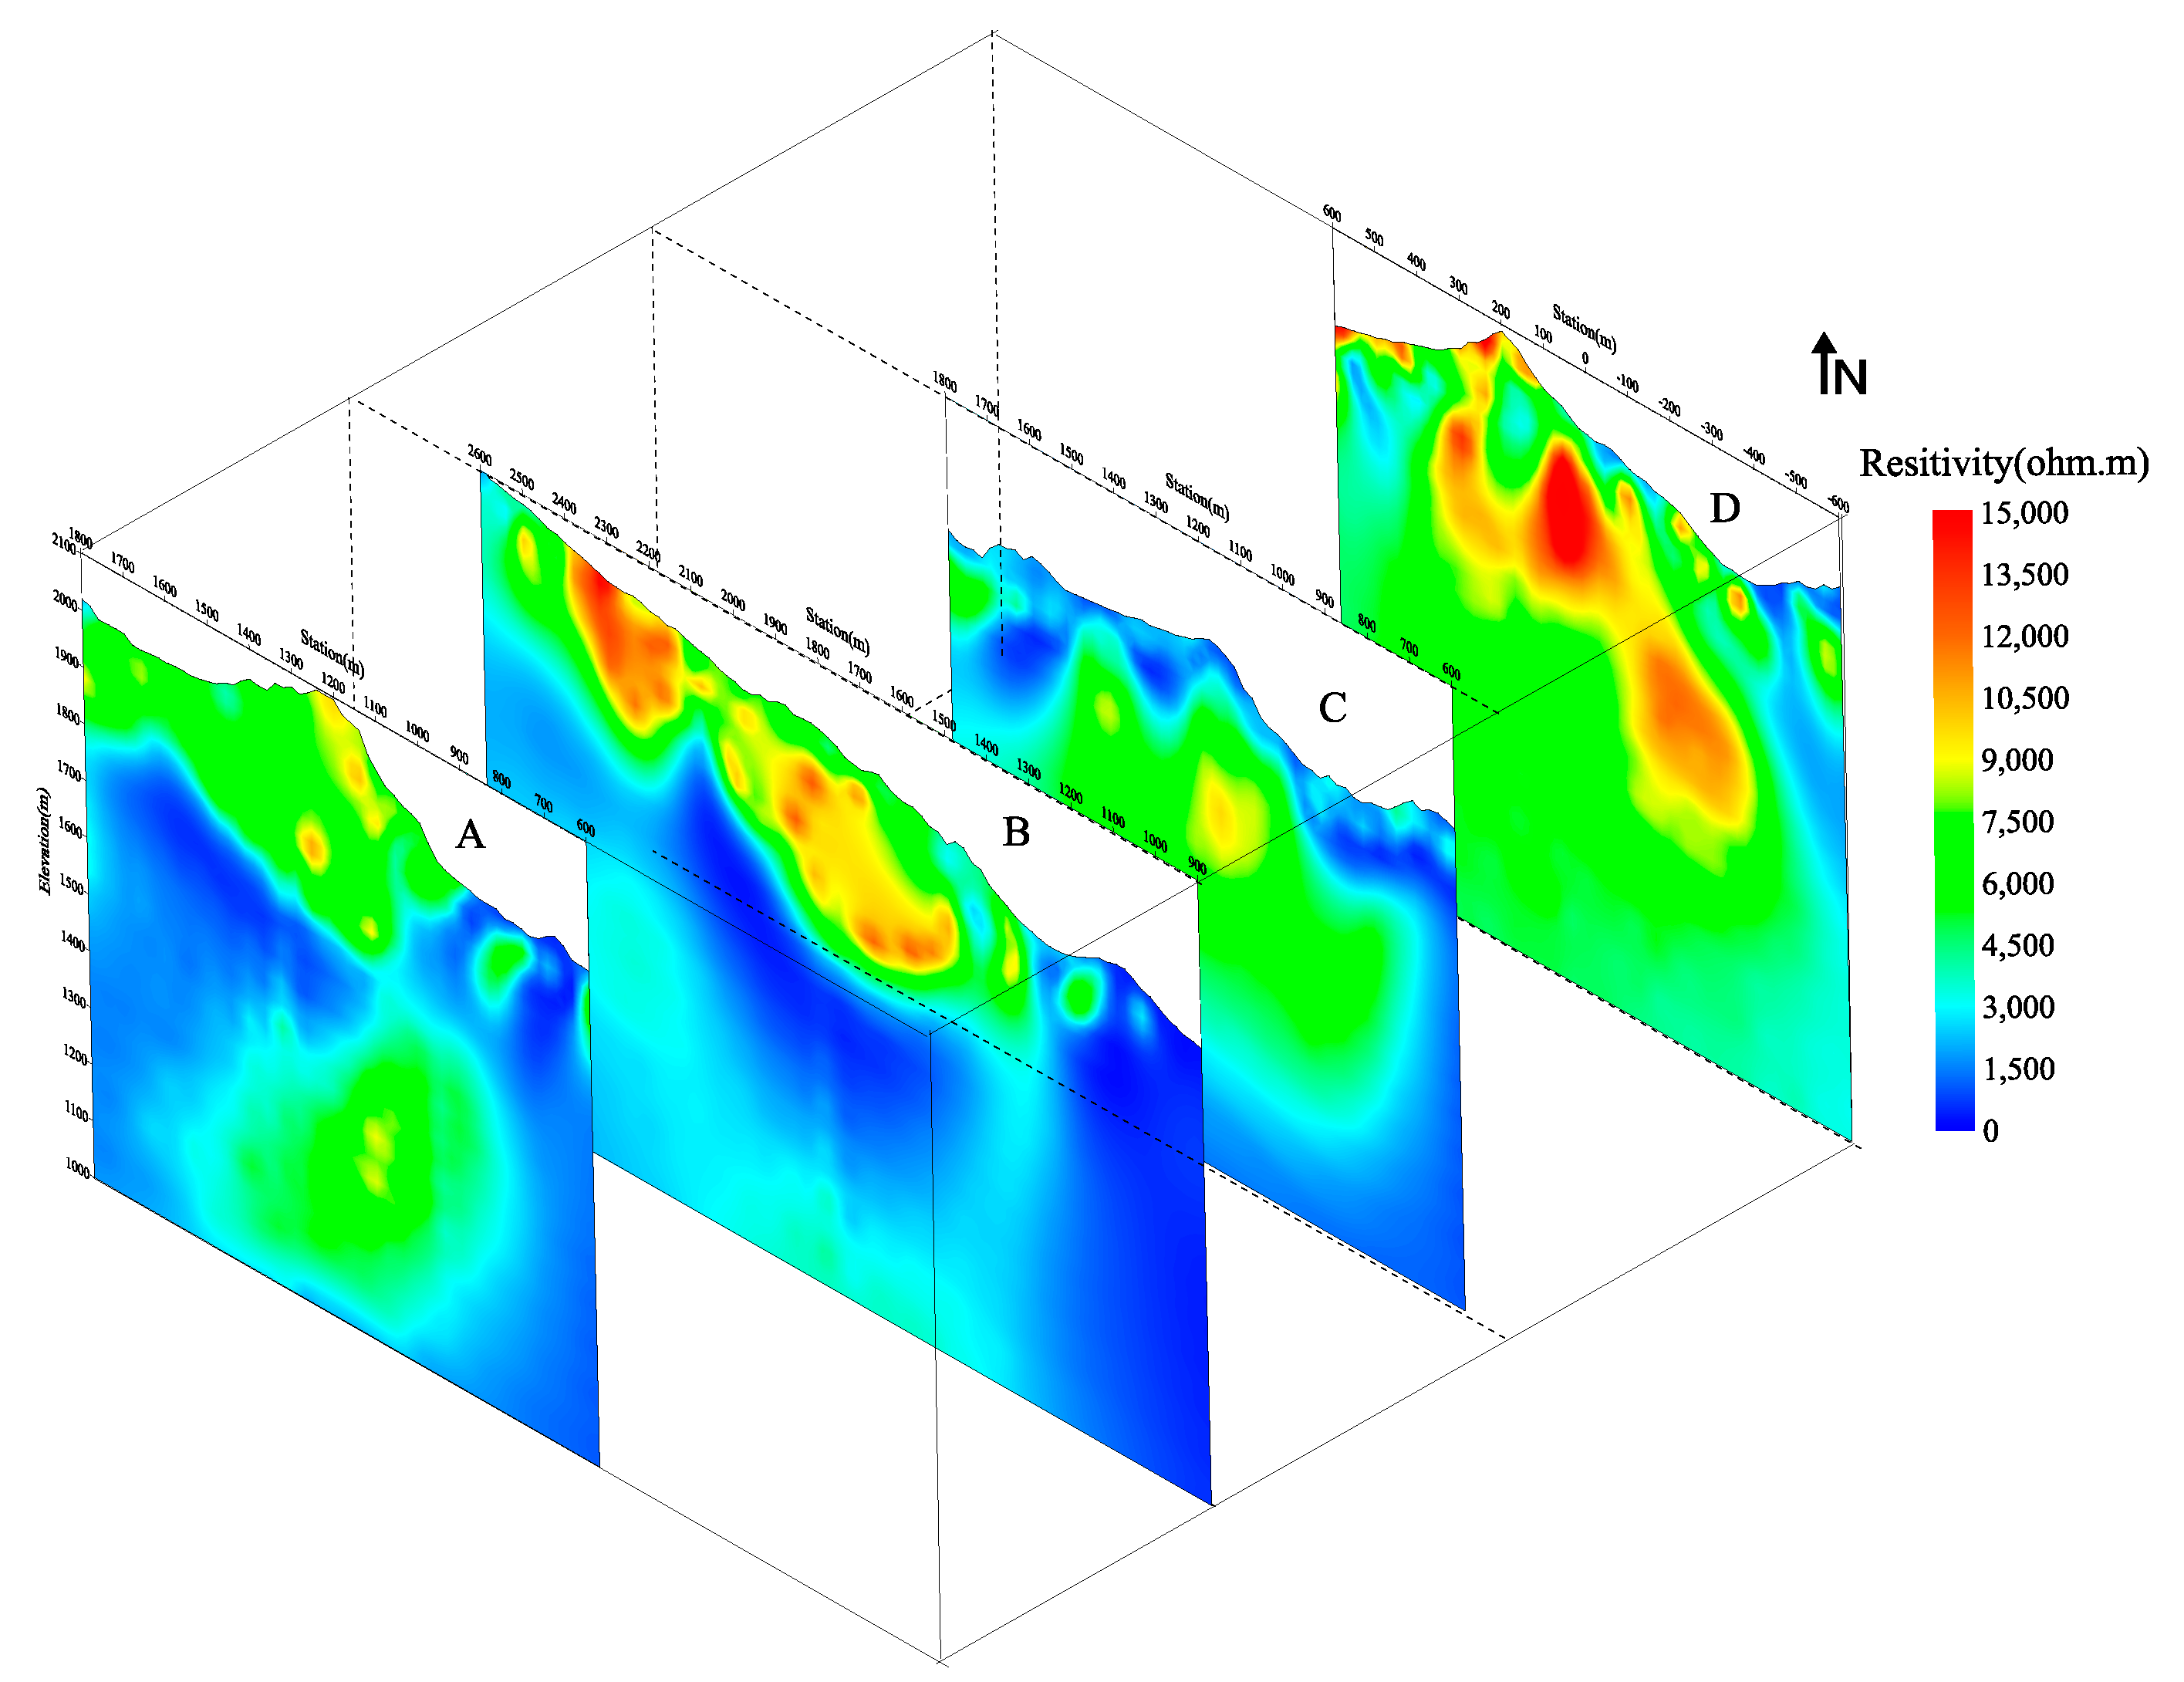
In order to describe the resistivity distribution in three-dimensions, we imaged the resistivity slices as shown in Figure 11. As is illustrated in Figure 11, the low-resistivity anomaly shown in profile A continued to profile B and disappeared in profile C. Moreover, this anomaly is related to the IP anomaly shown in Figure 3. The high amplitude of induced polarization anomaly has the same location as the low-resistivity anomaly. Based on this information, we inferred that the anomaly was due to the mineral deposits.
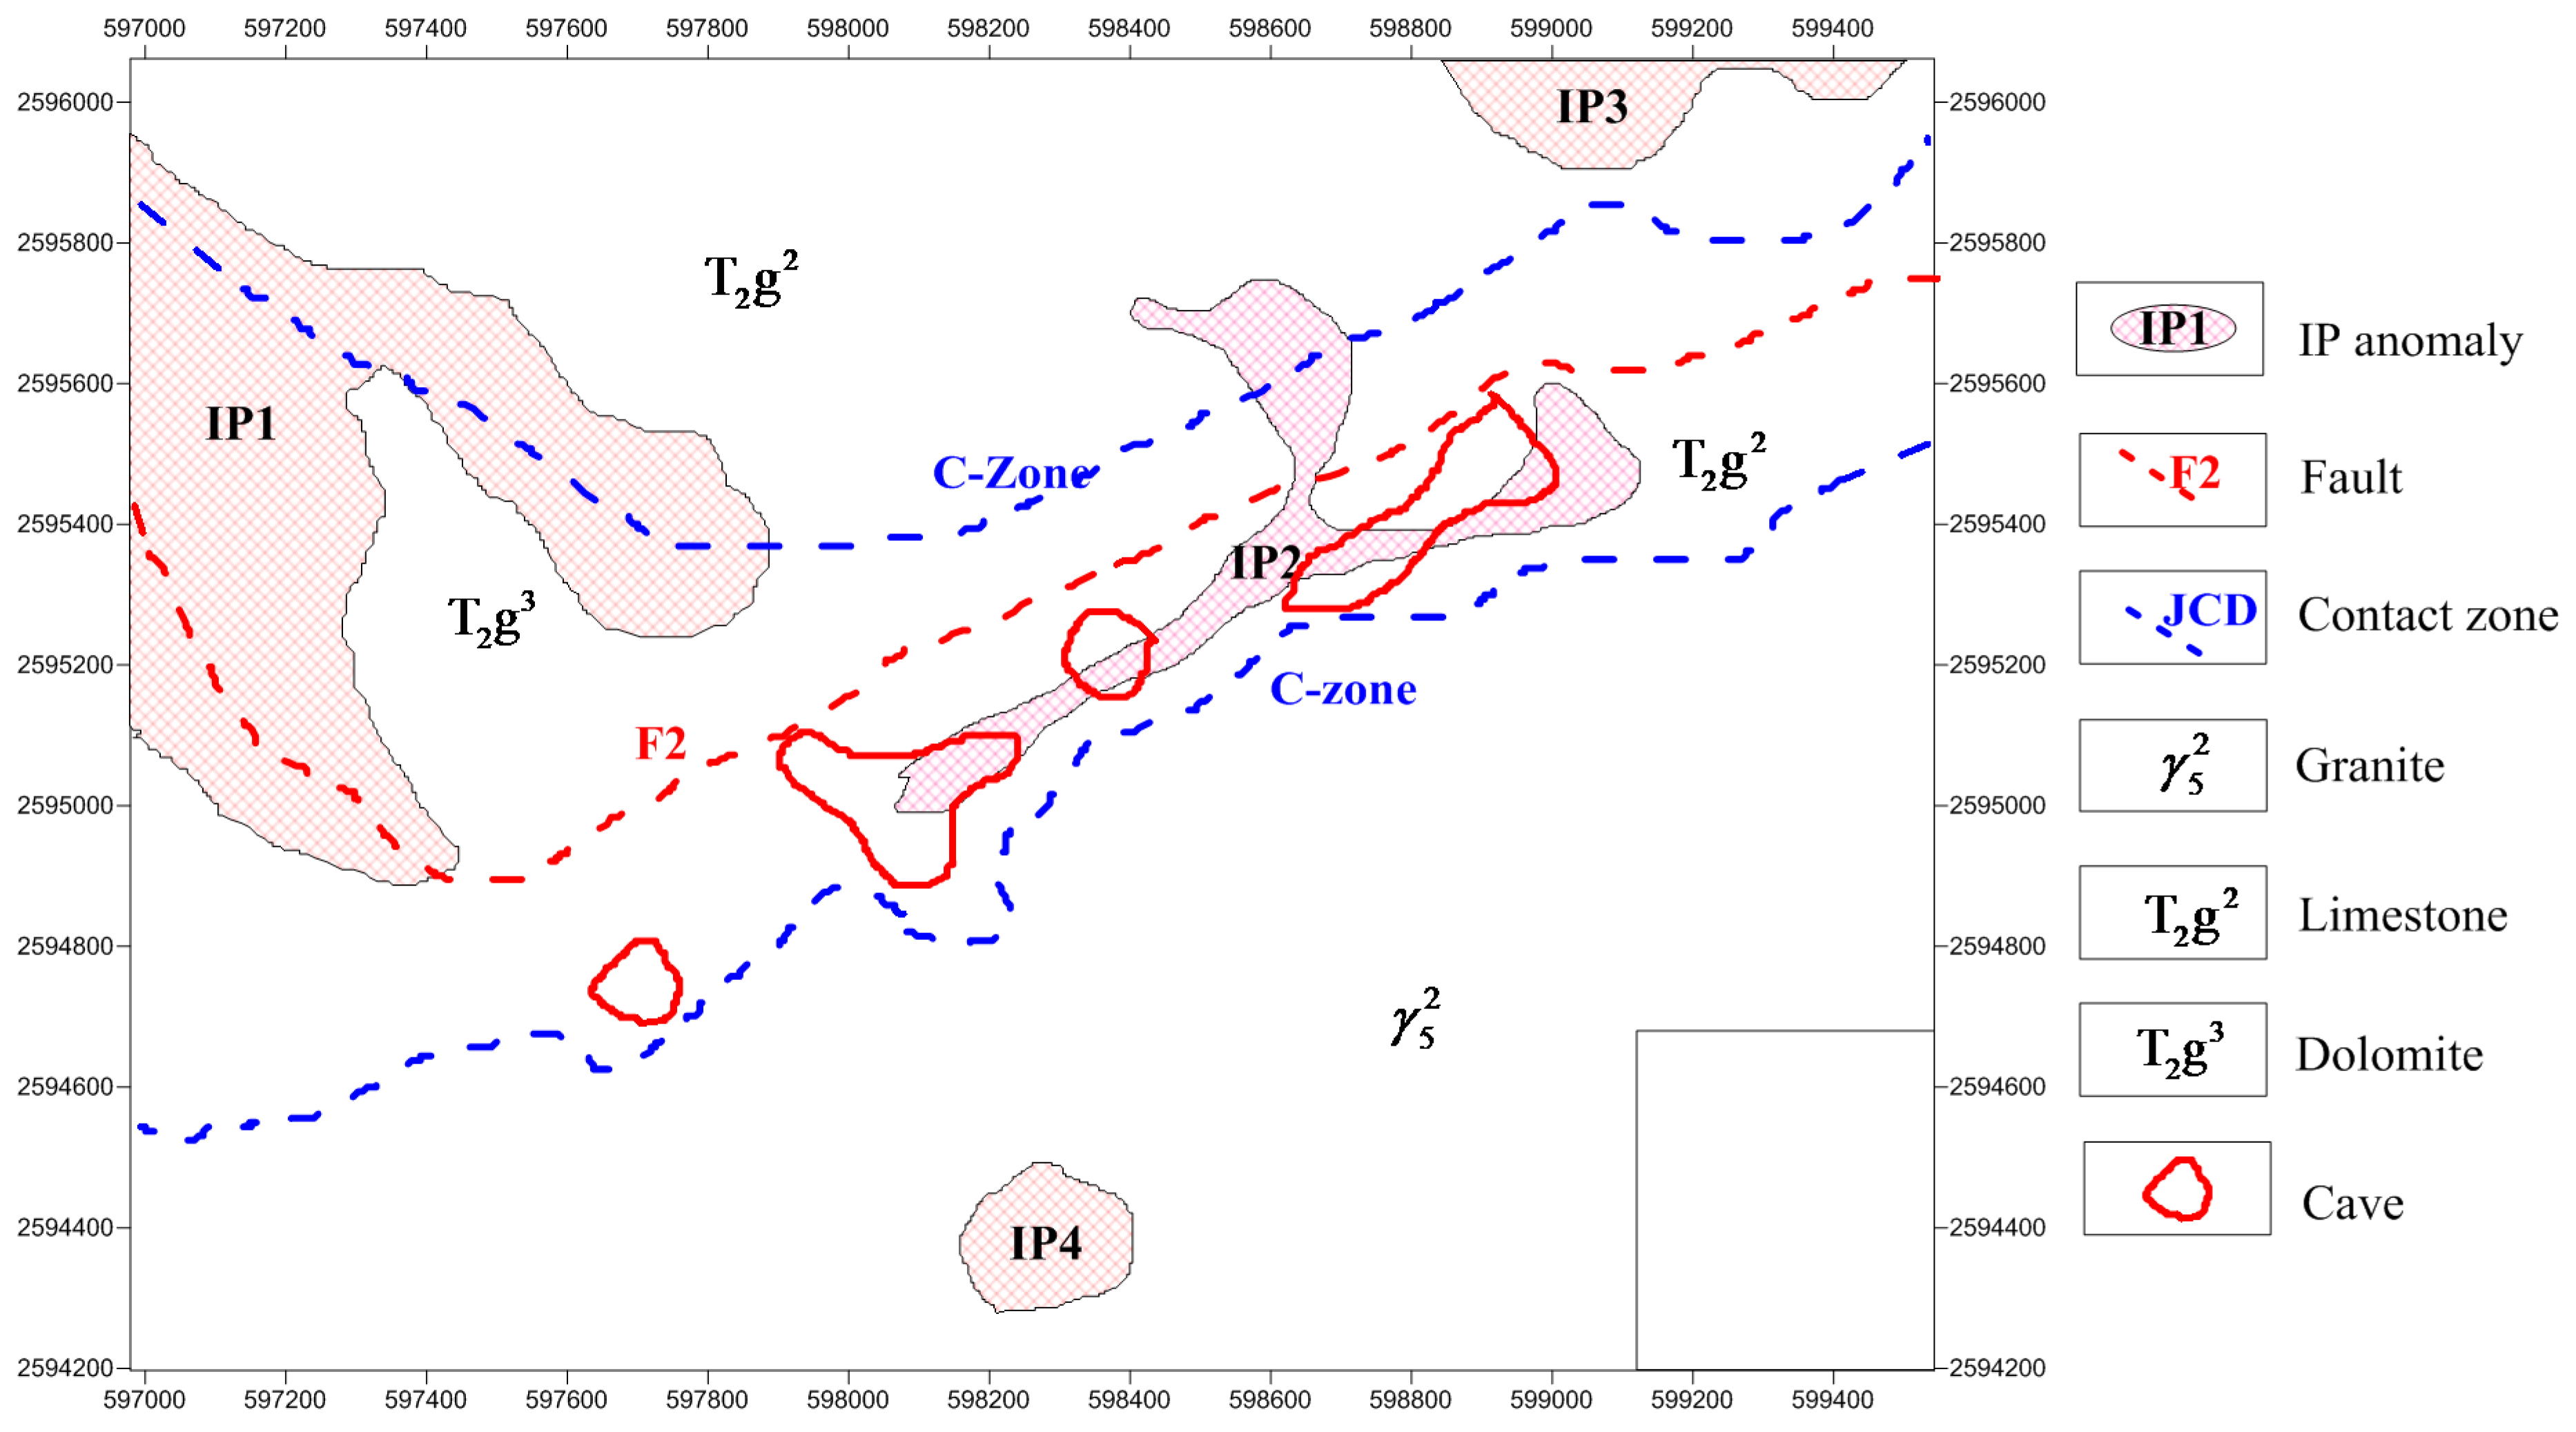
By combining the amplitude and resistivity characteristics of the survey area (Figure 3 and Figure 4) with the given rock properties of Table 1, we defined four IP anomaly areas marked as IP1, IP2, IP3 and IP4 (Figure 12). The interface between the granite and the second stratum (T2g2) is deep and steep. The ore-preserving structure is caused by the fault F2 in small scale. The larger deposit is located in the north-western part of the mining area (IP1), which is produced at the contact zone between the granite and the argillaceous limestone.
The IP1 anomaly zone is the largest anomaly in this region, and the area is around 0.6 km2. IP2 zone is located at the center of the survey area. The anomaly zone looks like a “Y”, and the mineralized rocks were visible in some caves in the area. In earlier exploration, the orebody deposits were discovered at three different locations. IP surveying in this study confirmed that all three orebodies belong to the same anomaly IP2 zone. Another strong anomaly IP3 is located north of the area. We infer this target is shallow buried at the anomaly IP3 zone. Anomaly IP4 circle zone is located south of the area with a strong amplitude of induced polarization.
In this study area, the IP value of granite and dolomites are less than 2%, so we consider them as background. The limestone has a higher amplitude than granite, but it is not as high as the Pb–Zn deposits. Anomaly IP4 zone has a value less than 3%, similar to the limestone. However, the IP1, IP2 and IP3 describe strong anomaly like effects of the Pb–Zn deposits.
5. Discussion and Conclusions
In this paper, IP and CSAMT methods were used to test their combined effectiveness for use in exploration of Pb–Zn deposits in the Eagles-Nest region. The IP method provides high sensitivity to the metal deposits [14]. So it is necessary to discover the IP anomaly from a geophysical map scanning. However, the CSAMT method has the deep resolution advantages compared to the ERT or TEM method [9]. Combining the advantages of IP high sensitivity and CSAMT high resolution, the study performs well.
The conclusions of geophysical investigations in Jianshui, Southwest of China are the following:
Based on results of IP and CSAMT surveys (in Figure 11 and Figure 12), we can infer the Pb–Zn deposits correlated with the anomaly of high induced polarization and low resistivity, which are shown in the geophysical properties in Table 1. The applied methods (CSAMT and IP) are effective for Pb–Zn deposits investigation in this area. The predicted deposits zones are generally consistent with the IP anomaly zones. The IP method allows easy selection of the interesting zones for the orebody targets. The inversion results from CSAMT method can predict the depth of the orebody targets.
In summary, this case study shows a successful geophysical survey to detect Eagles-Nest Pb–Zn deposits in the Jianshui area. Based on this experimental study, these methods may be an effective exploration strategy and geophysical model to detect similar potential deposits in the surrounding areas.
Author Contributions
Conceptualization, Z.G. and L.H.; methodology, C.C. and C.L.; software, C.C.; validation, C.L., R.L. and J.L.; formal analysis, Z.G.; investigation, Z.G.; resources, C.C.; data curation, R.L.; writing—original draft preparation, Z.G. and L.H.; writing—review and editing, J.L.; visualization, R.L.; supervision, J.L.; project administration, J.L.; funding acquisition, C.C.
Funding
This research is supported by the Natural Science Foundation of China (NSFC) [41804073; 41674080]. The research also funded by Open Research Fund Program of Key Laboratory of Metallogenic Prediction of Nonferrous Metals and Geological Environment Monitoring (Central South University), Ministry of Education [Grant: 2019YSJS10]. Furthermore, the research got the Grant from the Open Foundation of Key Laboratory of Submarine Geosciences, SOA [KLSG1905].
Acknowledgments
We thank the Geology Survey Institute of Hunan province for allowing us to publish the results. We appreciate the jobs by the colleagues on the data acquisition.
Conflicts of Interest
The authors declare no conflict of interest.
References
- Cagniard, L. Basic theory of the magnetotelluric method of geophysical prospecting. Geophysics 1953, 18, 605–635. [Google Scholar] [CrossRef]
- Goldstein, M.A. Magnetotelluric Experiments Employing an Artificial Dipole Source. Ph.D. Thesis, University of Toronto, Toronto, ON, Canada, 1971; pp. 56–69. [Google Scholar]
- Sandberg, S.K.; Hohmann, G.W. Controlled-source audiomagnetotellurics in geothermal exploration. Geophysics 1982, 47, 100–116. [Google Scholar] [CrossRef]
- Mustopa, E.J. 2D Interpretation of Controlled Source Audio Magnetotelluric (CSAMT) data integrated with borehole data in Kamojang geothermal field west Java, Indonesia. J. Phys. Conf. Ser. 2019, 1127, 012021. [Google Scholar]
- Wannamaker, P. Tensor CSAMT survey over the Sulphur Springs thermal area, Valles Calder, New Mexico, USA, Part 1: Implications for structure of the western Caldera. Geophysics 1997, 62, 451–465. [Google Scholar] [CrossRef]
- Fu, C.; Di, Q.; An, Z. Application of the CSAMT method to groundwater exploration in a metropolitan environment. Geophysics 2013, 78, B201–B209. [Google Scholar] [CrossRef]
- Chen, W.; Liu, H.; Liu, J.; Sun, X.; Zeng, Q. Integrated geophysical exploration for the Longtoushan Ag-Pb-Zn deposit in the southeast of the Da Xing’an Ling mountains, Inner Mongolia, northern China. Explor. Geophys. 2010, 41, 279–288. [Google Scholar] [CrossRef]
- Hu, X.; Peng, R.; Wu, G.; Wang, W.; Huo, G.; Han, B. Mineral Exploration using CSAMT data: Application to Longmen region metallogenic belt, Guangdong Province, China. Geophysics 2013, 78, B111–B119. [Google Scholar] [CrossRef]
- An, Z.; Di, Q. Investigation of geological structures with a view to HLRW disposal, as revealed through 3D inversion of aeromagnetic and gravity data and the results of CSAMT exploration. J. Appl. Geophys. 2016, 135, 204–211. [Google Scholar] [CrossRef]
- Schlumberger, C. Study of Underground Electrical Prospecting; University of California Libraries LLC.: Sacramento, CA, USA, 2017; p. 99. [Google Scholar]
- Revil, A.; Murugesu, M.; Prasad, M.; Le Breton, M. Alteration of volcanic rocks: A new non-intrusive indicator based on induced polarization measurements. J. Volcanol. Geotherm. Res. 2017, 341, 351–362. [Google Scholar] [CrossRef]
- Ghorbani, A.; Revil, A.; Coperey, A.; Ahmed, A.S.; Roque, S.; Heap, M.J.; Grandis, H.; Viveiros, F. Viveiros Complex conductivity of volcanic rocks and the geophysical mapping of alteration in volcanoes. J. Volcanol. Geotherm. Res. 2018, 357, 106–127. [Google Scholar] [CrossRef]
- Basokur, A.T.; Rasmussen, T.M.; Kaya, C.; Altun, Y.; Aktas, K. Comparison of induced polarization and controlled-source audio-magnetotellurics methods for massive chalcopyrite exploration in a volcanic area. Geophysics 1997, 62, 1087–1096. [Google Scholar] [CrossRef]
- Bao, G.; He, J. Dual-frequency and multi-parameter IP instrument and its application research. J. Cent. South Univ. Technol. 1996, 3, 12–16. [Google Scholar] [CrossRef]
- Constable, S.C.; Parker, R.L.; Constable, C.G. Occam’s inversion—A practical algorithm for generating smooth models from electromagnetic sounding data. Geophysics 1987, 52, 289–300. [Google Scholar] [CrossRef]
Figure 1.
Simplified geological map of Eagles-Nest region. Fault F1 in N–S direction was interrupted by fault F2 in NE–SW direction. The study area is located in the pink area.
Figure 1.
Simplified geological map of Eagles-Nest region. Fault F1 in N–S direction was interrupted by fault F2 in NE–SW direction. The study area is located in the pink area.

Figure 2.
Geophysical survey history and controlled-source audio-frequency magnetotellurics (CSAMT) survey design. Outer red solid lines (1–6) delineate the survey area, induced polarization (IP) profiles are symbolized as 31 red dotted lines (L1–L31) near which point numbers are identified, 4 black lines (A–D) are CSAMT profiles and blue area in the center means mining available range.

Figure 3.
Amplitude of induced polarization (Fs) contour map.

Figure 4.
Resistivity (Ps) contour map with amplitude frequency anomaly. The range enclosed by red lines (dotted and solid) corresponds to interesting area in Fs analysis.
Figure 4.
Resistivity (Ps) contour map with amplitude frequency anomaly. The range enclosed by red lines (dotted and solid) corresponds to interesting area in Fs analysis.

Figure 5.
Quality evaluation of CSAMT data. Black and red line illustrate twice measurements.

Figure 6.
CSAMT data inversion result of A profile, where distance equals to station number. The red dash line is fault F2.
Figure 6.
CSAMT data inversion result of A profile, where distance equals to station number. The red dash line is fault F2.

Figure 7.
CSAMT data inversion result of B profile, where distance equals station number. The red dash line is fault F2.
Figure 7.
CSAMT data inversion result of B profile, where distance equals station number. The red dash line is fault F2.

Figure 8.
CSAMT data inversion result of C profile, where distance equals station number.

Figure 9.
CSAMT data inversion result of D profile, where distance equals station number.

Figure 10.
The RMS misfit of CSAMT data inversion.

Figure 11.
Resistivity profiles of CSAMT data inversion.

Figure 12.
The interpretation map of the study area.

Figure 13.
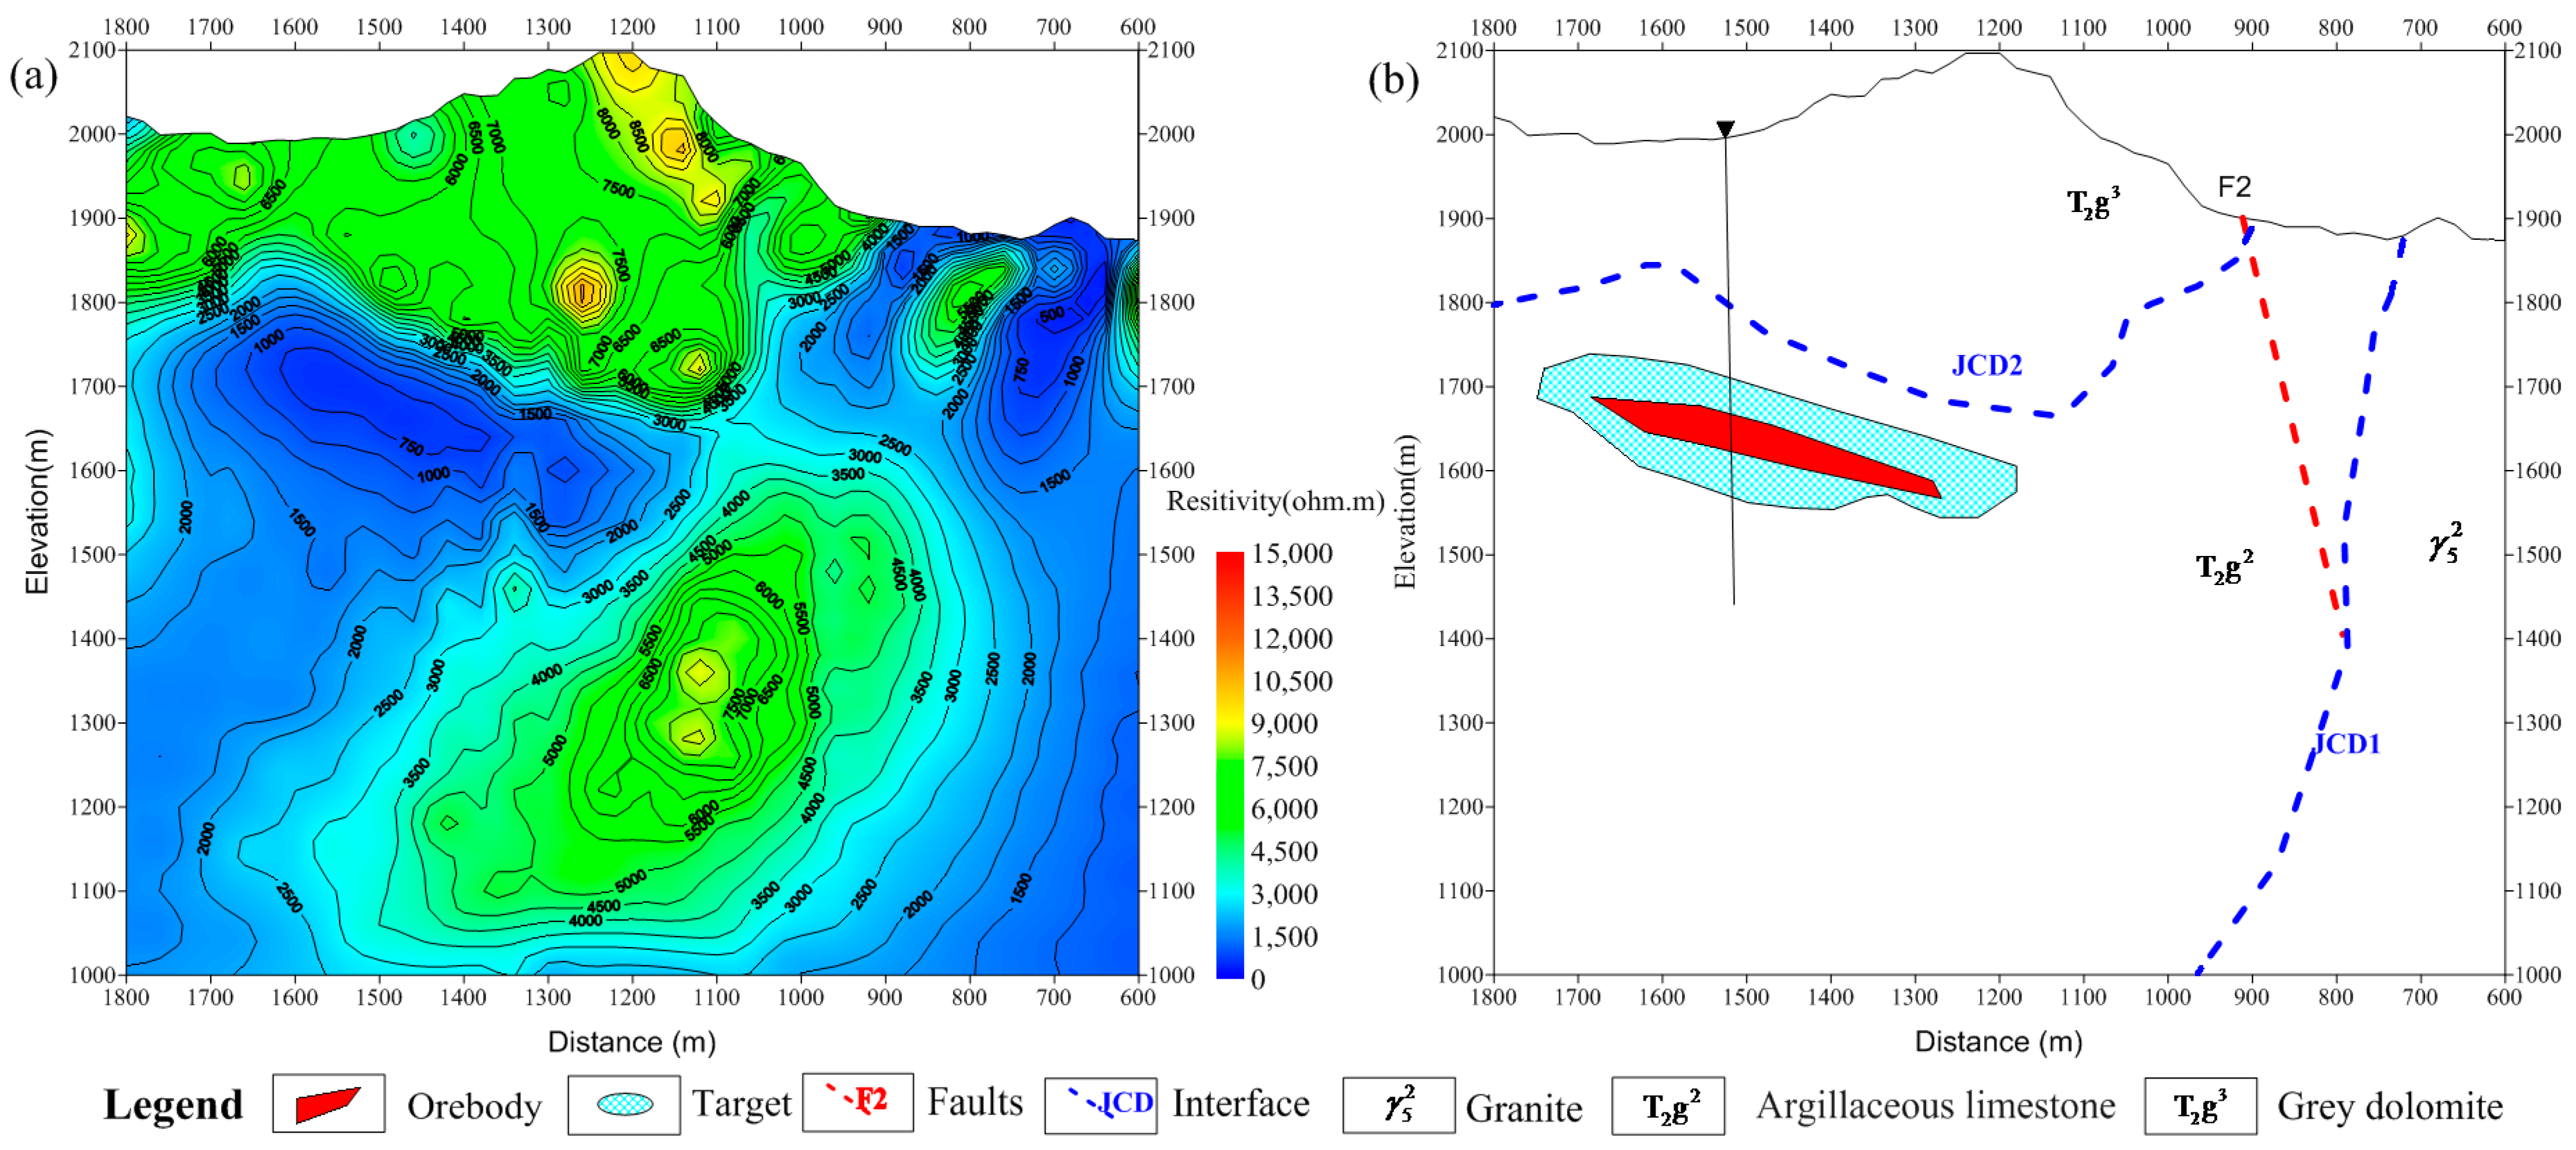
CSAMT data inversion result (a) and interpretation (b) of A profile, where distance equals to station number.
Figure 13.
CSAMT data inversion result (a) and interpretation (b) of A profile, where distance equals to station number.


Table 1.
Geophysical properties of Eagles-Nest deposit.
| Rocks | Fs Range (%) | Fs Average | Resistivity Range (Ωm) | Resistivity Average |
|---|---|---|---|---|
| Pb–Zn | 1.6–6.4 | 4.23 | 121.5–336.2 | 257.68 |
| Limestone | 1.6–2.7 | 2.08 | 325.7–336.5 | 676.5 |
| Dolomites | 1.09–1.38 | 1.26 | 547.4–978.5 | 734.98 |
| Granite | 1.1–1.7 | 1.27 | 294.5–597.4 | 430.46 |
© 2019 by the authors. Licensee MDPI, Basel, Switzerland. This article is an open access article distributed under the terms and conditions of the Creative Commons Attribution (CC BY) license (http://creativecommons.org/licenses/by/4.0/).
Share and Cite
MDPI and ACS Style
Guo, Z.; Hu, L.; Liu, C.; Cao, C.; Liu, J.; Liu, R. Application of the CSAMT Method to Pb–Zn Mineral Deposits: A Case Study in Jianshui, China. Minerals 2019, 9, 726. https://doi.org/10.3390/min9120726
AMA Style
Guo Z, Hu L, Liu C, Cao C, Liu J, Liu R. Application of the CSAMT Method to Pb–Zn Mineral Deposits: A Case Study in Jianshui, China. Minerals. 2019; 9(12):726. https://doi.org/10.3390/min9120726
Chicago/Turabian StyleGuo, Zhenwei, Longyun Hu, Chunming Liu, Chuanghua Cao, Jianxin Liu, and Rong Liu. 2019. "Application of the CSAMT Method to Pb–Zn Mineral Deposits: A Case Study in Jianshui, China" Minerals 9, no. 12: 726. https://doi.org/10.3390/min9120726
Note that from the first issue of 2016, this journal uses article numbers instead of page numbers. See further details here.