
Calculated Elasticity of Al-Bearing Phase D


1
Department of Earth and Environmental Systems, The University of the South, Sewanee, TN 37375, USA
2
Department of the Geophysical Sciences, University of Chicago, Chicago, IL 60637, USA
3
Geodynamics Research Center, Ehime University, Matsuyama 790-8577, Japan
*
Author to whom correspondence should be addressed.
Minerals 2022, 12(8), 922; https://doi.org/10.3390/min12080922
Submission received: 25 May 2022
/
Revised: 19 July 2022
/
Accepted: 20 July 2022
/
Published: 22 July 2022
(This article belongs to the Special Issue First Principles Simulations of Minerals)
Abstract
:Using first-principles calculations, this study evaluates the structure, equation of state, and elasticity of three compositions of phase D up to 75 GPa: (1) the magnesium endmember [MgSi2O4(OH)2], (2) the aluminum endmember [Al2SiO4(OH)2], and (3) phase D with 50% Al-substitution [AlMg0.5Si1.5O4(OH)2]. We find that the Mg-endmember undergoes hydrogen-bond symmetrization and that this symmetrization is linked to a 22% increase in the bulk modulus of phase D, in agreement with previous studies. Al2SiO4(OH)2 also undergoes hydrogen-bond symmetrization, but the concomitant increase in bulk modulus is only 13%—a significant departure from the 22% increase of the Mg-endmember. Additionally, Al-endmember phase D is denser (2%–6%), less compressible (6%–25%), and has faster compressional (6%–12%) and shear velocities (12%–15%) relative to its Mg-endmember counterpart. Finally, we investigated the properties of phase D with 50% Al-substitution [AlMg0.5Si1.5O4(OH)2], and found that the hydrogen-bond symmetrization, equation of state parameters, and elastic constants of this tie-line composition cannot be accurately modeled by interpolating the properties of the Mg- and Al-endmembers.
1. Introduction
Mineral physics experiments and first-principles calculations have identified several mechanisms for water storage inside the Earth, including nominally anhydrous and hydrous phases, but few of these phases are stable at the extreme pressure and temperature conditions of the Earth’s lower mantle. As serpentine-bearing lithospheric plates subduct, serpentine exposed to the increasing pressures and temperatures of the geotherm decomposes into a series of dense hydrous magnesium silicates (DHMSs) [1]. These DHMSs contain wt.% quantities of water (OH–) and are important carriers of water in subduction zones [2,3,4,5,6]. Of the known DHMSs, phase D, (Mg,Al)(Si,Al)2O4(OH)2, has the second highest pressure stability, rendering phase D capable of transporting water through the transition zone and into the lower mantle [7,8,9,10,11].
Recent studies indicate that aluminum substitution into DHMSs increases the thermodynamic stability of these phases [7,12,13,14,15,16,17,18], and that Al-bearing DHMSs may host more water than their magnesium endmember counterparts [18,19]. Additionally, Al-bearing phase D is a likely precursor to the solid solution formed by phase H [MgAlO2(OH)2] and -(Al,Fe)OOH—a solid solution with P-T stability that extends to the core-mantle boundary [13,14,20,21]. Owing to the important role that Al-bearing phase D may play in the storage and cycling of hydrogen in the Earth’s lower mantle, this study evaluates the influence of Al-substitution on the structure, equation of state, and elasticity of phase D using first-principles density functional theory (DFT) calculations.
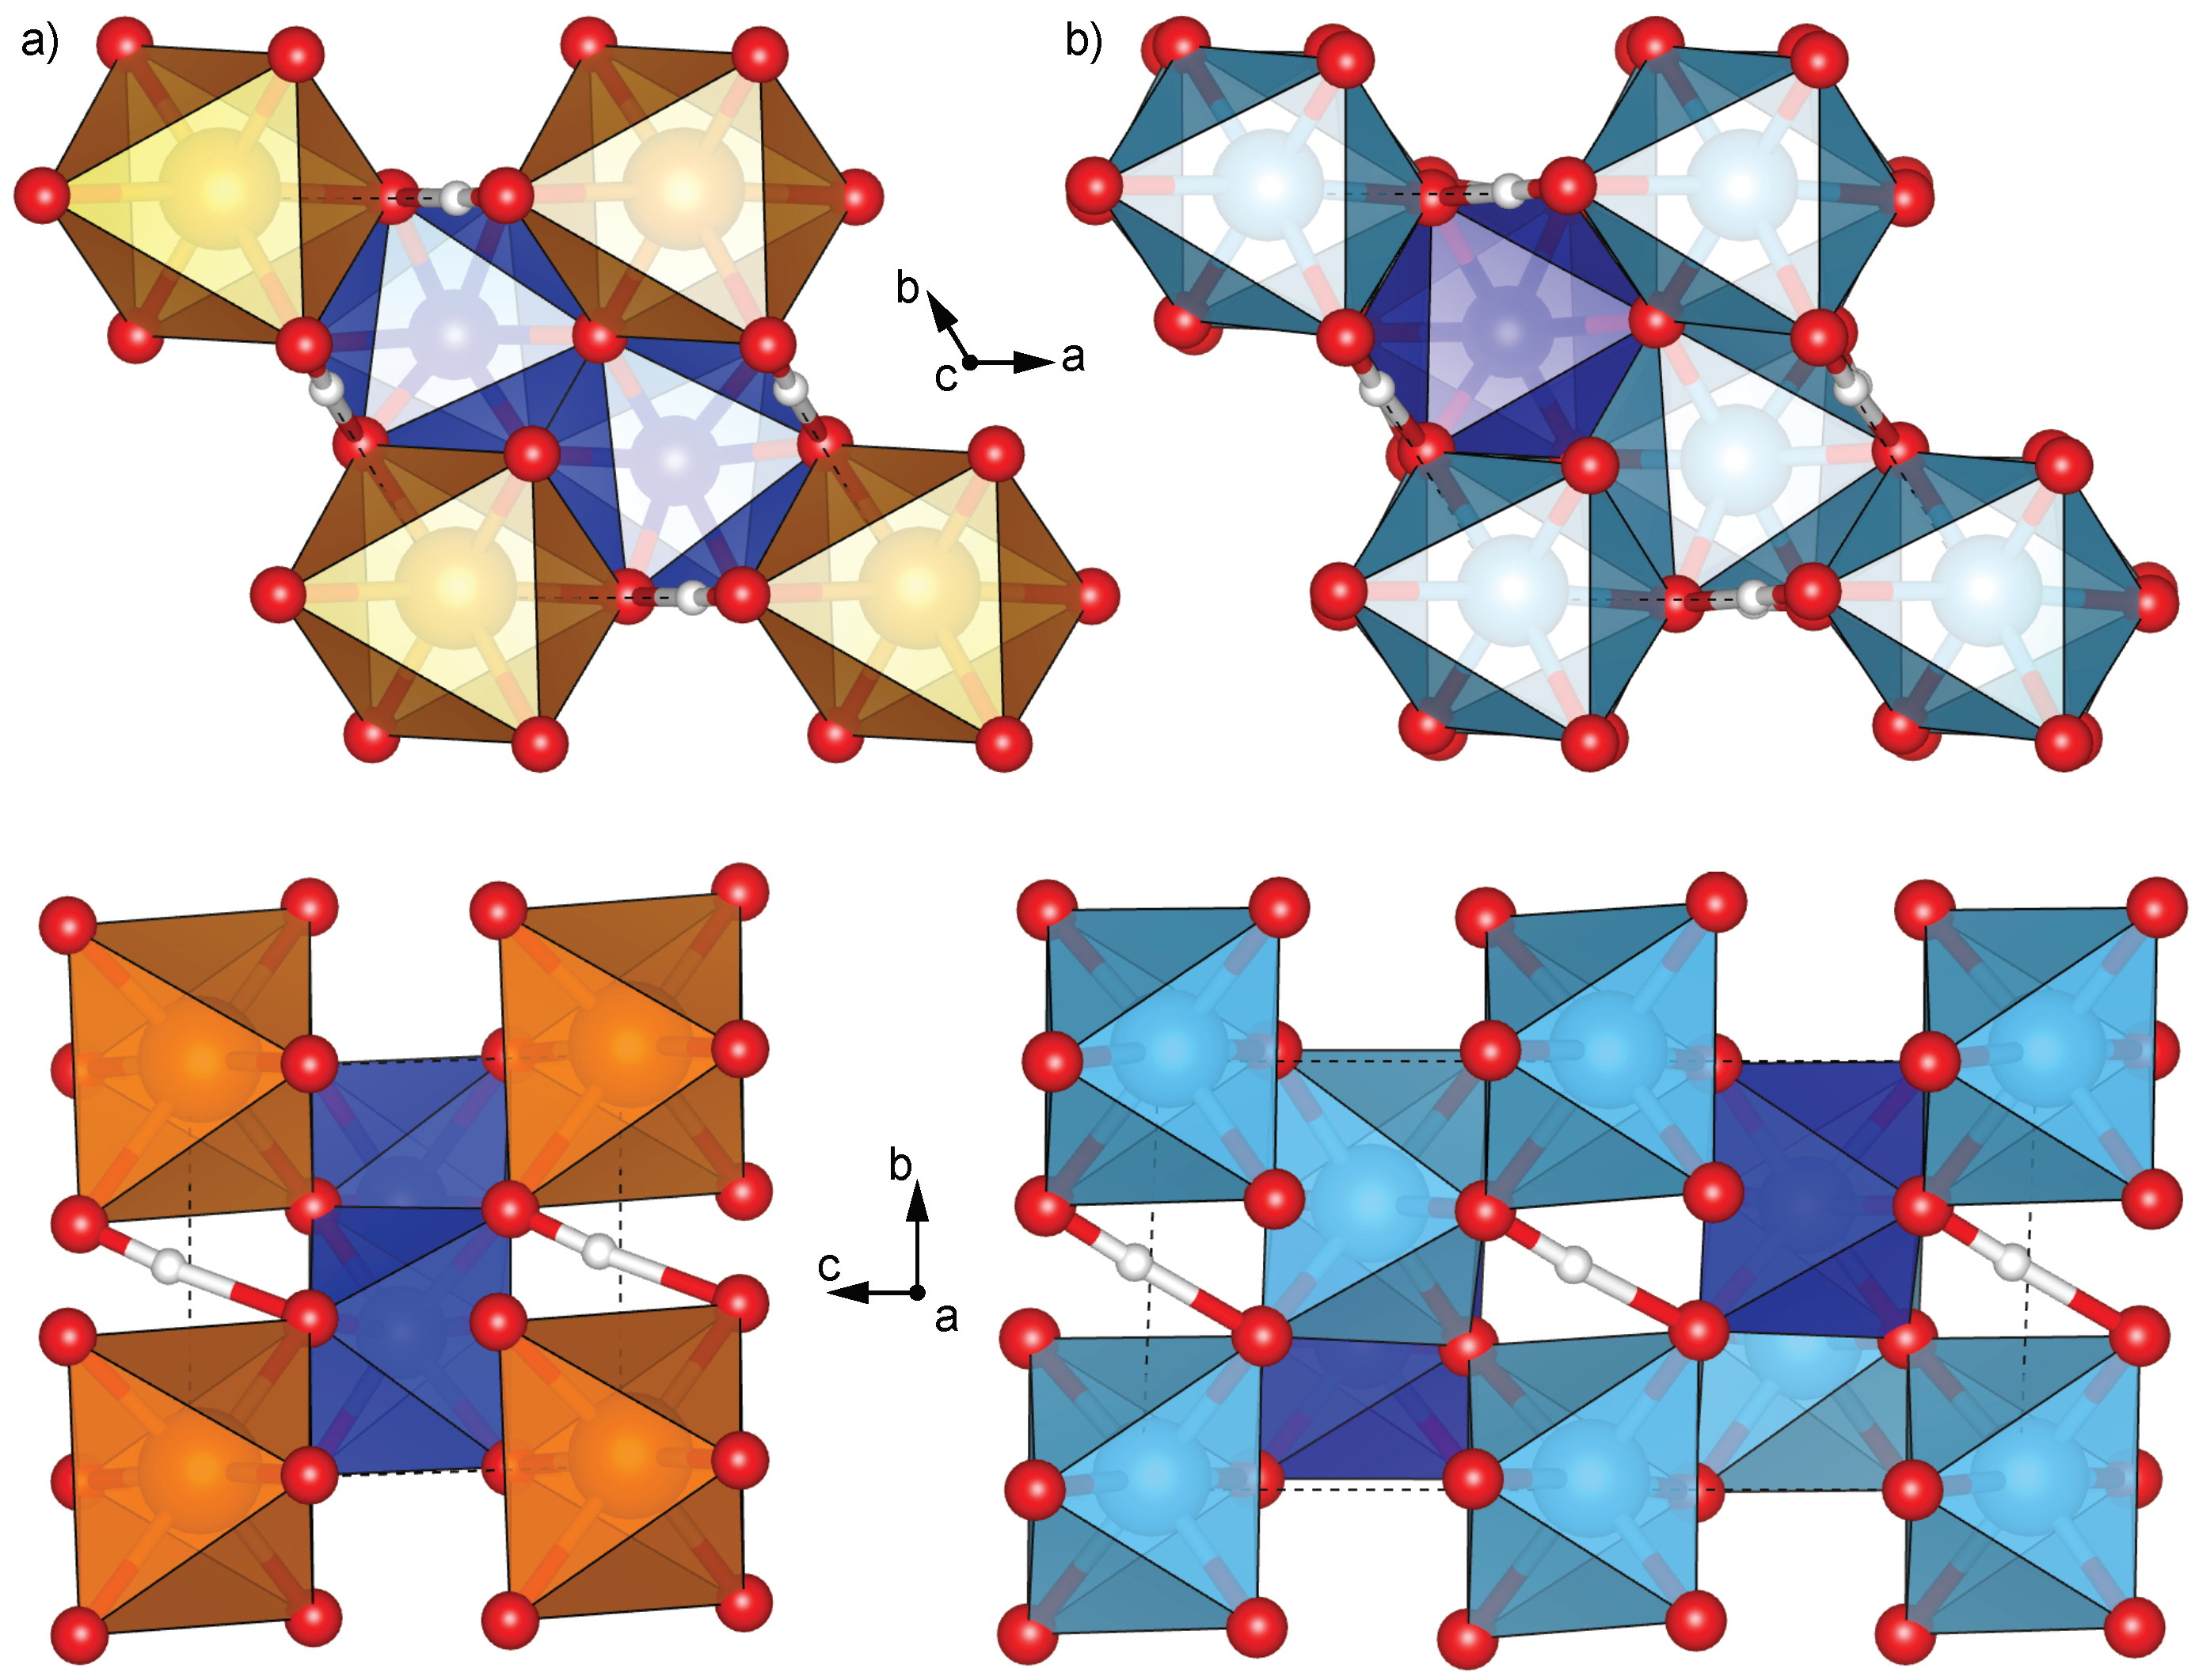
Magnesium endmember phase D [MgSi2O4(OH)2] has trigonal symmetry and is in the space group [22]. The crystal structure is based on a hexagonal closest packed array of O atoms, with non-hydrogen cations occupying two different octahedrally coordinated sites. In Mg-endmember phase D, the SiO6 and MgO6 octahedra occur in two separate layers stacked along c-axis, leading these sites to be referred to as the S-site and M-site, respectively (Figure 1a). In Al-bearing phase D, the aluminum occupies both the S- and M-sites [18] (Figure 1b). Aluminum substitutes into phase D via a Tschermak Si4+ + Mg2+ ⟷ 2Al3+ substitution, and experiments report a range of compositions, including the near Al-endmember composition referred to as ‘super-aluminous’ phase D [19]. Based on single crystal X-ray diffraction structure refinement, this near Al-endmember phase D is also in the space group, with a high degree of Si/Al disordering and decreased octahedral distortion relative to the Mg-endmember [19]. Within the S-site layer, octahedra are edge-sharing with 1/3 of the sites vacant, producing brucite-like layers, whereas in the M-site layer the octahedra do not share edges, thereby creating space for hydroxyl bonds.
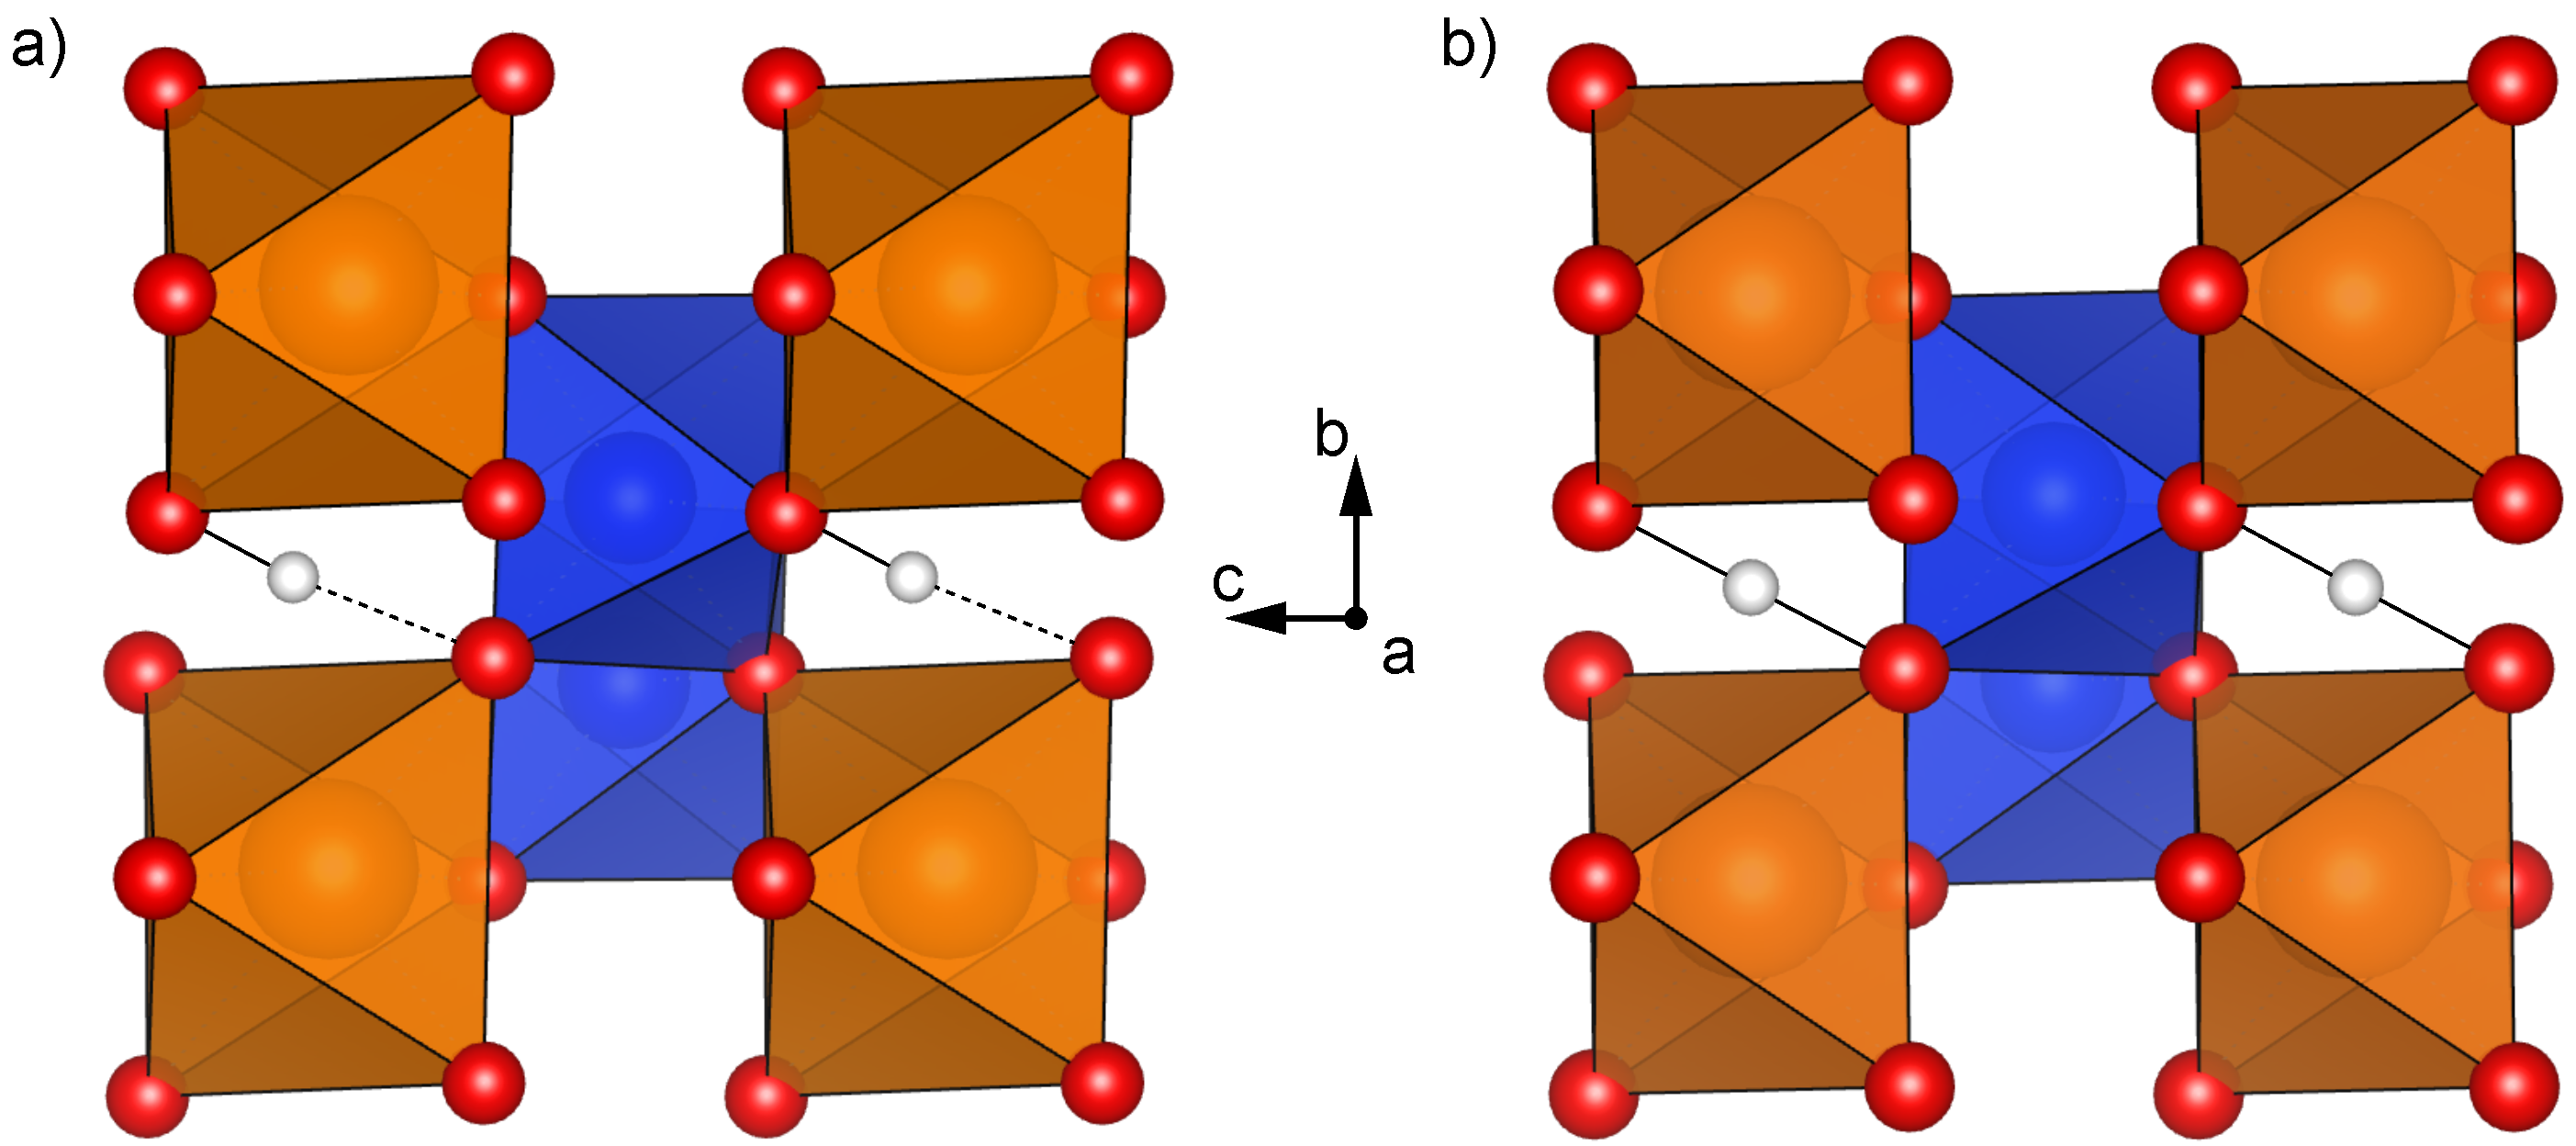
Mg-endmember phase D undergoes pressure-induced hydrogen bond symmetrization at approximately 40 GPa, which was predicted by first-principles calculations [24] and confirmed by high-pressure X-ray diffraction experiments [25]. Hydrogen-bond symmetrization is the phenomenon in which the hydroxyl bonds (O–H) in a material evolve with increased pressure such that they become equal in length to the hydrogen bonds (OH) (Figure 2). Hydrogen-bond symmetrization in MgSi2O4(OH)2 profoundly impacts its compressibility, increasing the bulk modulus by up to 20% [24,25,26]. However, as hydrogen bond symmetrization has yet to be reported in Al-bearing phase D, it is important to probe the influence of Al-substitution on this phenomenon. Using first-principles calculations, this study evaluates three compositions of phase D: (1) the magnesium endmember [MgSi2O4(OH)2], (2) the aluminum endmember [Al2SiO4(OH)2], and phase D with 50% Al-substitution [AlMg0.5Si1.5O4(OH)2], to evaluate the influence of Al-substitution on the structure, equation of state, and elasticity of phase D.
2. Methods
Density functional theory (DFT) based calculations were used to evaluate the structure and elasticity of three compositions of phase D [MgSi2O4(OH)2, AlMg0.5Si1.5O4(OH)2, Al2SiO4(OH)2] as a function of pressure from 0 to 75 GPa in 5 GPa pressure increments. Although previous studies have calculated the structure and elasticity of Mg-endmember phase D [26,27], these calculations were repeated to enable direct comparison between all three phase D compositions using the same pseudopotentials for all calculations. The aluminum endmember composition values reported herein are based on evaluations using a 2-unit supercell to introduce a degree of disordering (Figure 1b). An ordered structure of the Al-endmember composition was also evaluated (1 unit cell), but exhibited elevated enthalpy relative to the disordered structure across the entire pressure range of this study and is therefore less stable relative to its disordered counterpart. Two different supercells (8-unit cells) of AlMg0.5Si1.5O4(OH)2 were evaluated to assess the influence of cation disordering on phase stability and material properties. These two AlMg0.5Si1.5O4(OH)2 supercells are referred to hereafter as ‘88-1’ and ‘88-2’. Using two supercells enables us to probe the interplay of composition and structure on the elasticity of AlMg0.5Si1.5O4(OH)2 and helped us to better assess the reliability of modeling the properties of intermediate compositions by interpolating those of the Mg- and Al-endmembers. A full exploration of all solid solution compositions and possible atomic configurations is beyond the scope of this study. Atomic positions of the fully optimized structures of MgSi2O4(OH)2, Al2SiO4(OH)2, and both supercells of AlMg0.5Si1.5O4(OH)2 at 0 GPa can be found in Table A1, Table A2, Table A3 and Table A4.
First-principles simulations were performed using Quantum ESPRESSO [28], in which we applied the generalized gradient approximation (GGA) to the exchange-correlation functional [29], as it more accurately describes hydrogen bonding compared to the local density approximation [30,31]. As the present study did not include temperature and quantum zero-point vibration effects, we did not employ the empirical dispersion correction of Grimme et al., 2010 [32]; however, the influence of such corrections on the van der Waals interactions and hydrogen bonding of phase D should be evaluated in the future. The effective interaction of core electrons was approximated using previously evaluated norm-conserving pseudopotentials [33] and electronic wave functions were expanded in plane-waves with an energy cutoff of 80 Ry. The irreducible Brillouin zone was sampled by Monkhorst-Pack meshes of 5 × 5 × 4, 5 × 5 × 2, and 3 × 3 × 2 for the Mg-endmember, Al-endmember, and tie-line compositions, respectively [34]. The effects of larger energy cut-offs and k-point sampling were found to be negligible. Elastic constants were determined by applying strains of 0.005–0.01 to the optimized (0 K) structures, maintaining linear stress-strain relations [35].
3. Results
3.1. Structure and Hydrogen Bond Symmetrization
Optimized structures of the Mg- and Al-endmember compositions, as well as both structures of the tie-line composition (50% Al-substitution), were evaluated to determine the influence of Al-substitution on the structure and hydrogen-bonding of phase D. The resultant structures of both endmember and intermediate compositions are consistent with the previously described trigonal phase D structure (Figure 1), with minor triclinic distortion (<2%) consistent with previous calculations [26]. Across the pressure range examined, the Al-endmember structures exhibit the highest degree of distortion (0.8%–1.8%) while the structures of the tie-line composition (88-2) exhibit the lowest degree of distortion (0.2%–0.4%). Structural parameters including lattice parameters, hydroxyl and hydrogen bond lengths, and O—HO bond angles as a function of pressure from 0 to 75 GPa are reported in Table A5, Table A6 and Table A7, respectively. In agreement with previous experimental and theoretical studies [25,27,36,37], we find that in Mg-endmember phase D the c-axis is more compressible than the a-axis at low pressures (<40 GPa) but at pressures above 40 GPa the c/a ratio becomes nearly pressure independent as shown in Figure 3. This disparity in axial compression is also observed in the Al-endmember and tie-line compositions, but the degree of this disparity, i.e., the magnitude of the negative slope of the c/a ratio as a function of pressure, is significantly reduced and limited to pressures below 30 GPa in these Al-bearing compositions (Figure 3).
Similar to previous studies [14,24,25], we find that Mg-endmember phase D undergoes pressure-induced hydrogen bond symmetrization at 45 GPa. In other words, at and above pressures of 45 GPa the hydroxyl bond length (rO–H) is equal to the hydrogen bond length (rOH) (Table A6). We find that Al-endmember phase D also undergoes a pressure-induced hydrogen bond symmetrization, albeit at the slightly lower pressure of 40 GPa. Conversely, neither configuration of AlMg0.5Si1.5O4(OH)2 underwent complete pressure-induced hydrogen bond symmetrization in the pressure range of this study (0–75 GPa), as the more complex cation disordering introduced additional non-degenerate hydrogen sites. The pressure dependence of these sites vary, likely due to differences in nearest-neighbors and next-nearest neighbor cation occupancy [38]. Tables containing information regarding the hydrogen (rOH) and hydroxyl (rO—H) bond lengths, as well as the O—HO bond angles for all three compositions are reported in Table A6 and Table A7, respectively. Our results deviate from the VASP ab initio calculations of Panero and Caracas (2020) [14], who reported that only roughly a quarter of hydrogen bonds in Al-endmember phase D symmetrize at pressure and that symmetrization in intermediate compositions is incremental and does not involve all bonds.
Although there is agreement in the literature concerning the existence and magnitude of a pressure-dependent evolution of the c/a ratio in Mg-endmember phase D, as well as its eventual stabilization at high pressures, no consensus exists regarding the cause. Furthermore, the pressure at which the c/a ratio is reported to stabilize varies widely, with reported stabilization pressures of 14 GPa [39], 20 GPa [40], 25 GPa [36], 35 GPa [41], 40 GPa [24] and 48 GPa [25]. In experimental studies, these differences may be attributed to differences in sample compositions including non-stoichiometric Mg/Si ratios, variable water contents, and Al- and Fe-substitution, as well as the wide range of pressure transmitting media used including ZrO2, MgO, and Ne.
The larger question is whether the pressure evolution of the lattice parameters and eventual pressure independence of the c/a ratio is directly tied to hydrogen bond symmetrization [25], hydrogen bond disordering that occurs as a precursor to symmetrization as observed in -AlOOH [42], or the result of the layered structure of phase D [43]. Hydrogen bond symmetrization has been linked to shifts in axial compression both pre- and post-symmetrization in other phases [44,45,46,47], and has been described as the primary driver of the aforementioned pressure-dependent evolution of c/a ratios in phase D [24]. In this study, all three compositions of phase D have c-axes which are more compressible than the a-axes at low pressure, yet hydrogen bond symmetrization only occurs in the Al- and Mg-endmembers, and occurs at pressures slightly higher that the pressure at which the c/a ratio stabilizes. Therefore, it is likely that the observed low-pressure anisotropy is tied to the layered nature of phase D, with differences in the Al- and Mg-endmembers tied to the relative stiffness of the AlO6, MgO6, and SiO6 units. However, c/a ratio stabilization is seemingly a prerequisite for hydrogen bond symmetrization, such that the two phenomenon can appear coincident. Furthermore, in intermediate compositions of Al-bearing phase D, hydrogen bond symmetrization is not expected, but the pressure-dependence of the c/a ratio will likely reflect the compressibilities and configurations of the constituent cation polyhedra.
3.2. Equation of State
Optimized (0 K) structures of the endmember and tie-line compositions were used to evaluate the volume-pressure (V-P) relationship of these phases, by fitting them to third-order Birch-Murnaghan equations of state (EOSs) [48]:
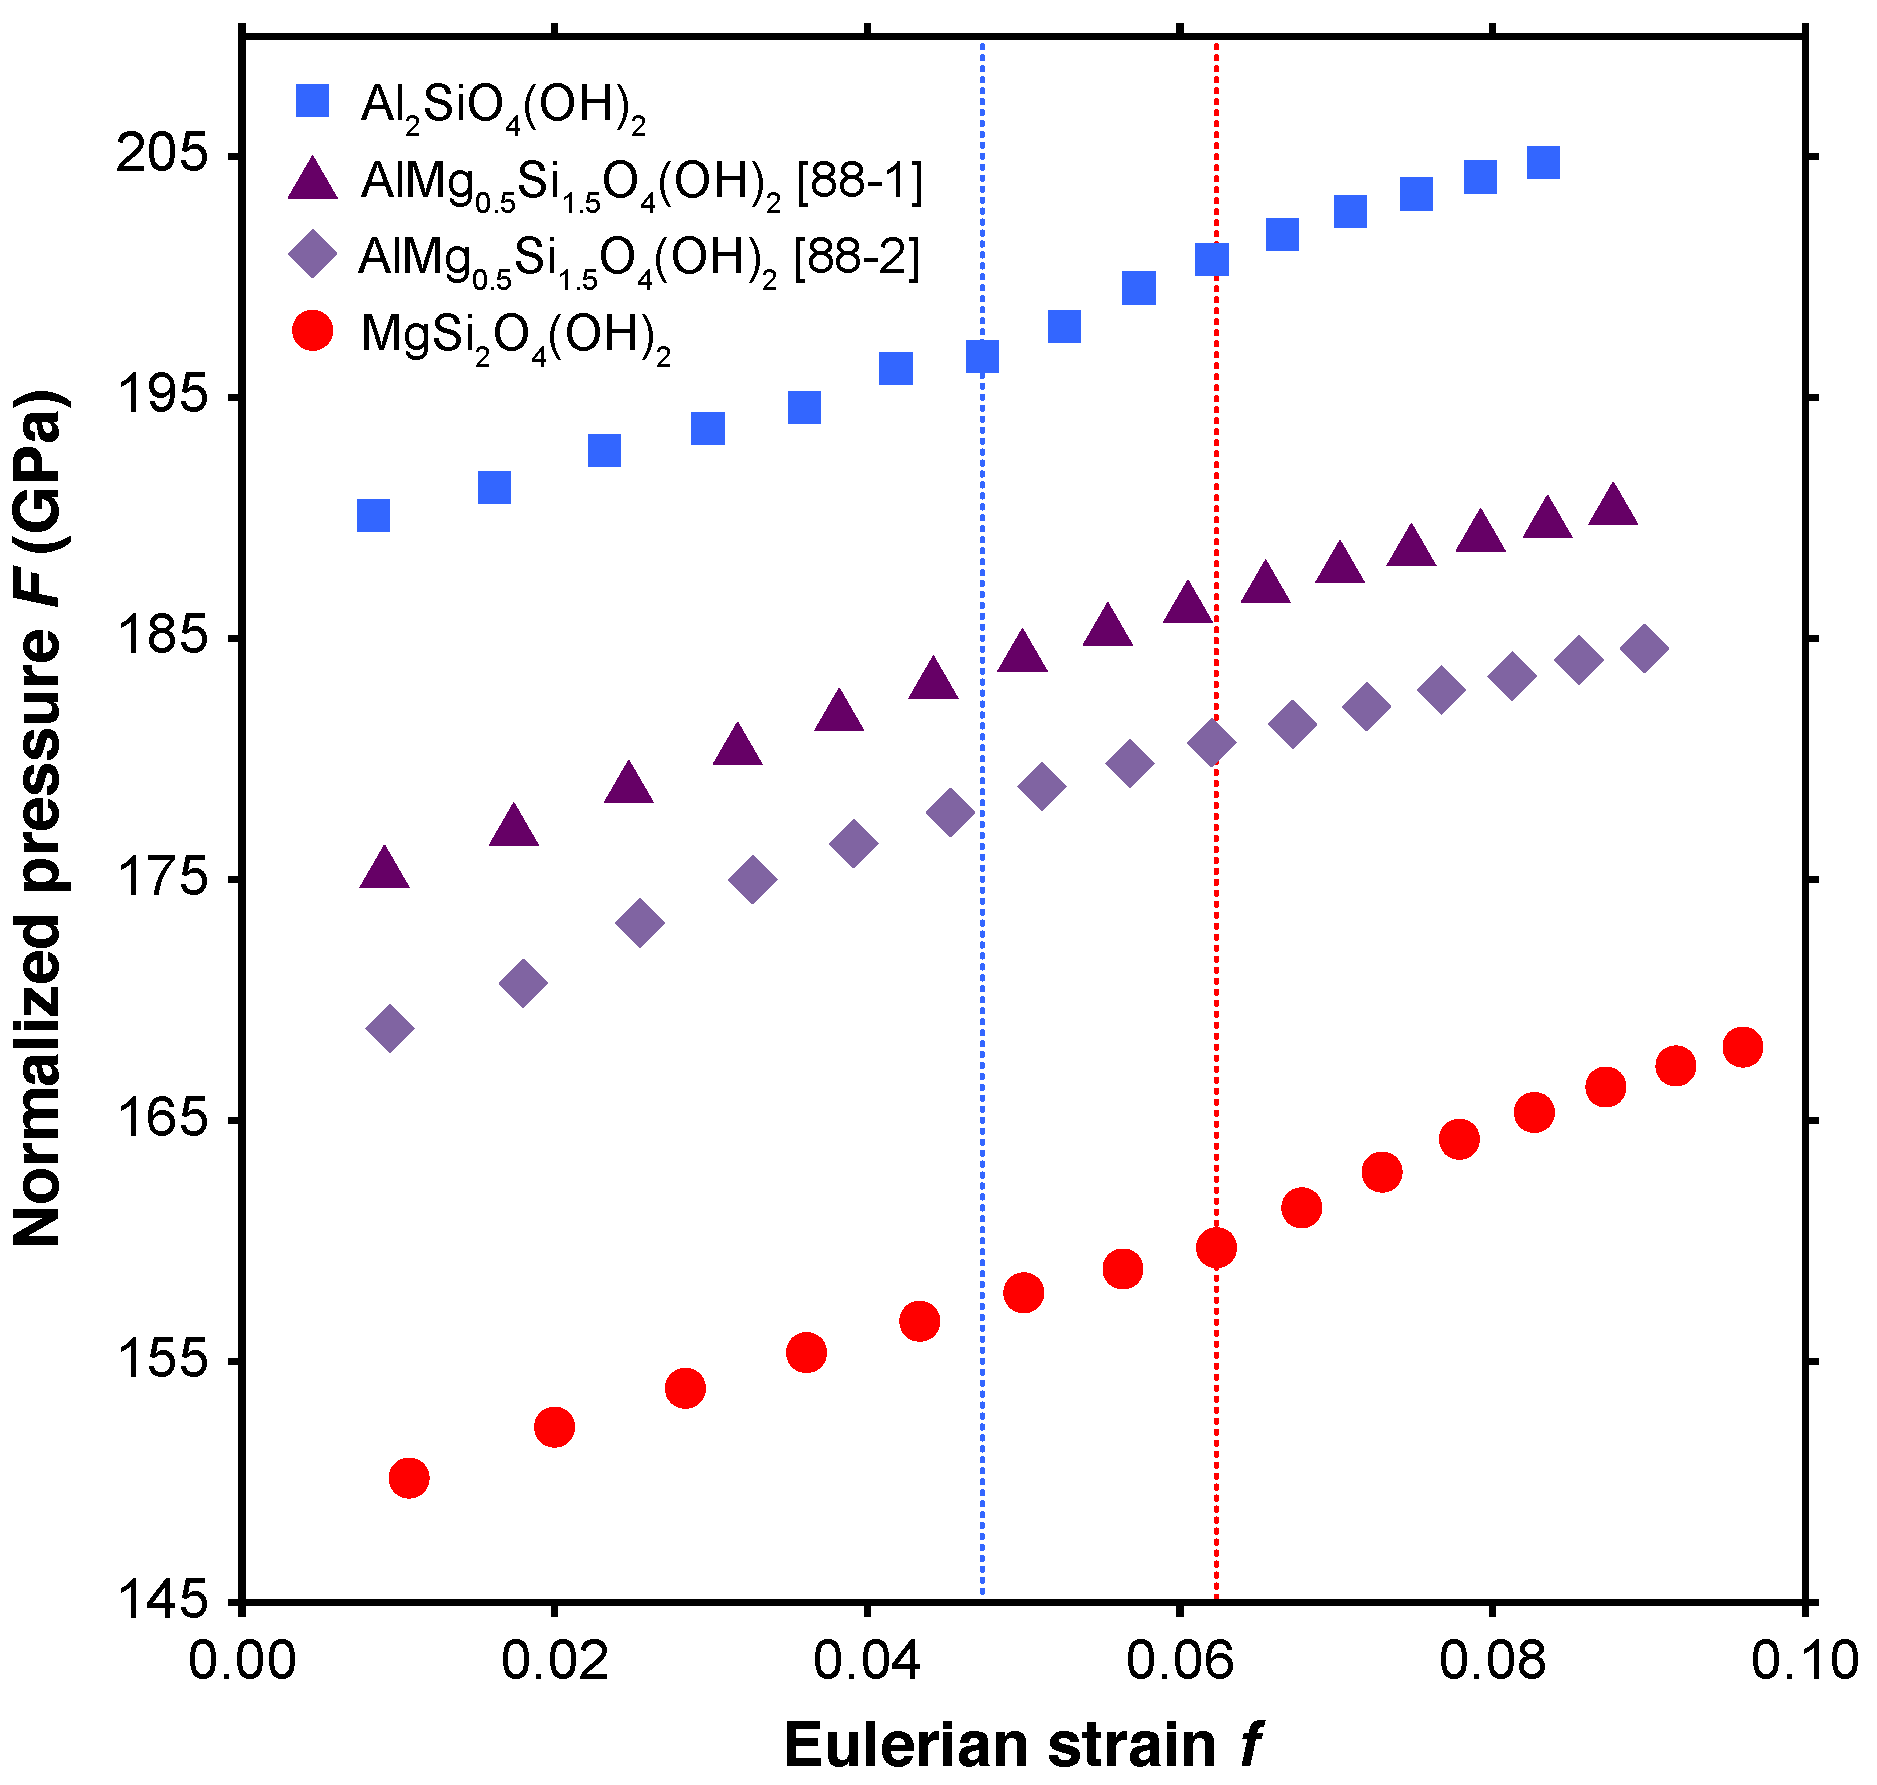
in which is the bulk modulus at ambient pressure, is the first pressure derivative of the bulk modulus, and is the reference volume and was treated as a free parameter. The Birch-Murnaghan equation of state parameters (, , ) resulting from these fits are shown in Table 1. As evidenced by the positive slopes in Figure 4 which shows Eulerian strain (f) versus normalized pressure (FE), the third-order Birch-Murnaghan equation of state better describes the compressive behavior of all examined compositions of phase D in this study. However, parameters fit to second-order equations of state (i.e., = 4) are included in Table 1 to enable direct comparison with literature values. Hydrogen bond symmetrization of Mg-endmember phase D has been previously reported to produce a significant decrease in the compressibility of the hydrogen-symmetric structure (HC) compared to that of the hydrogen off-center (HOC) structure [24]. Consistent with this phenomenon, our FE-f plot reveals discontinuities in the compressibility of the Al- and Mg-endmembers at 35 and 40 GPa, respectively. With this in mind, HOC and HC structures of the Mg- and Al-endmember were fit separately, deriving distinct sets of equation of state parameters (Table 1, Figure 5). Phase D with 50% Al-substitution did not undergo pressure induced hydrogen bond symmetrization and the FE-f plot revealed no discontinuities in either the 88-1 or 88-2 configuration. Therefore, optimized structures of AlMg0.5Si1.5O4(OH)2 spanning the entire pressure range (0–75 GPa) were fit to single equations of state for each configuration.
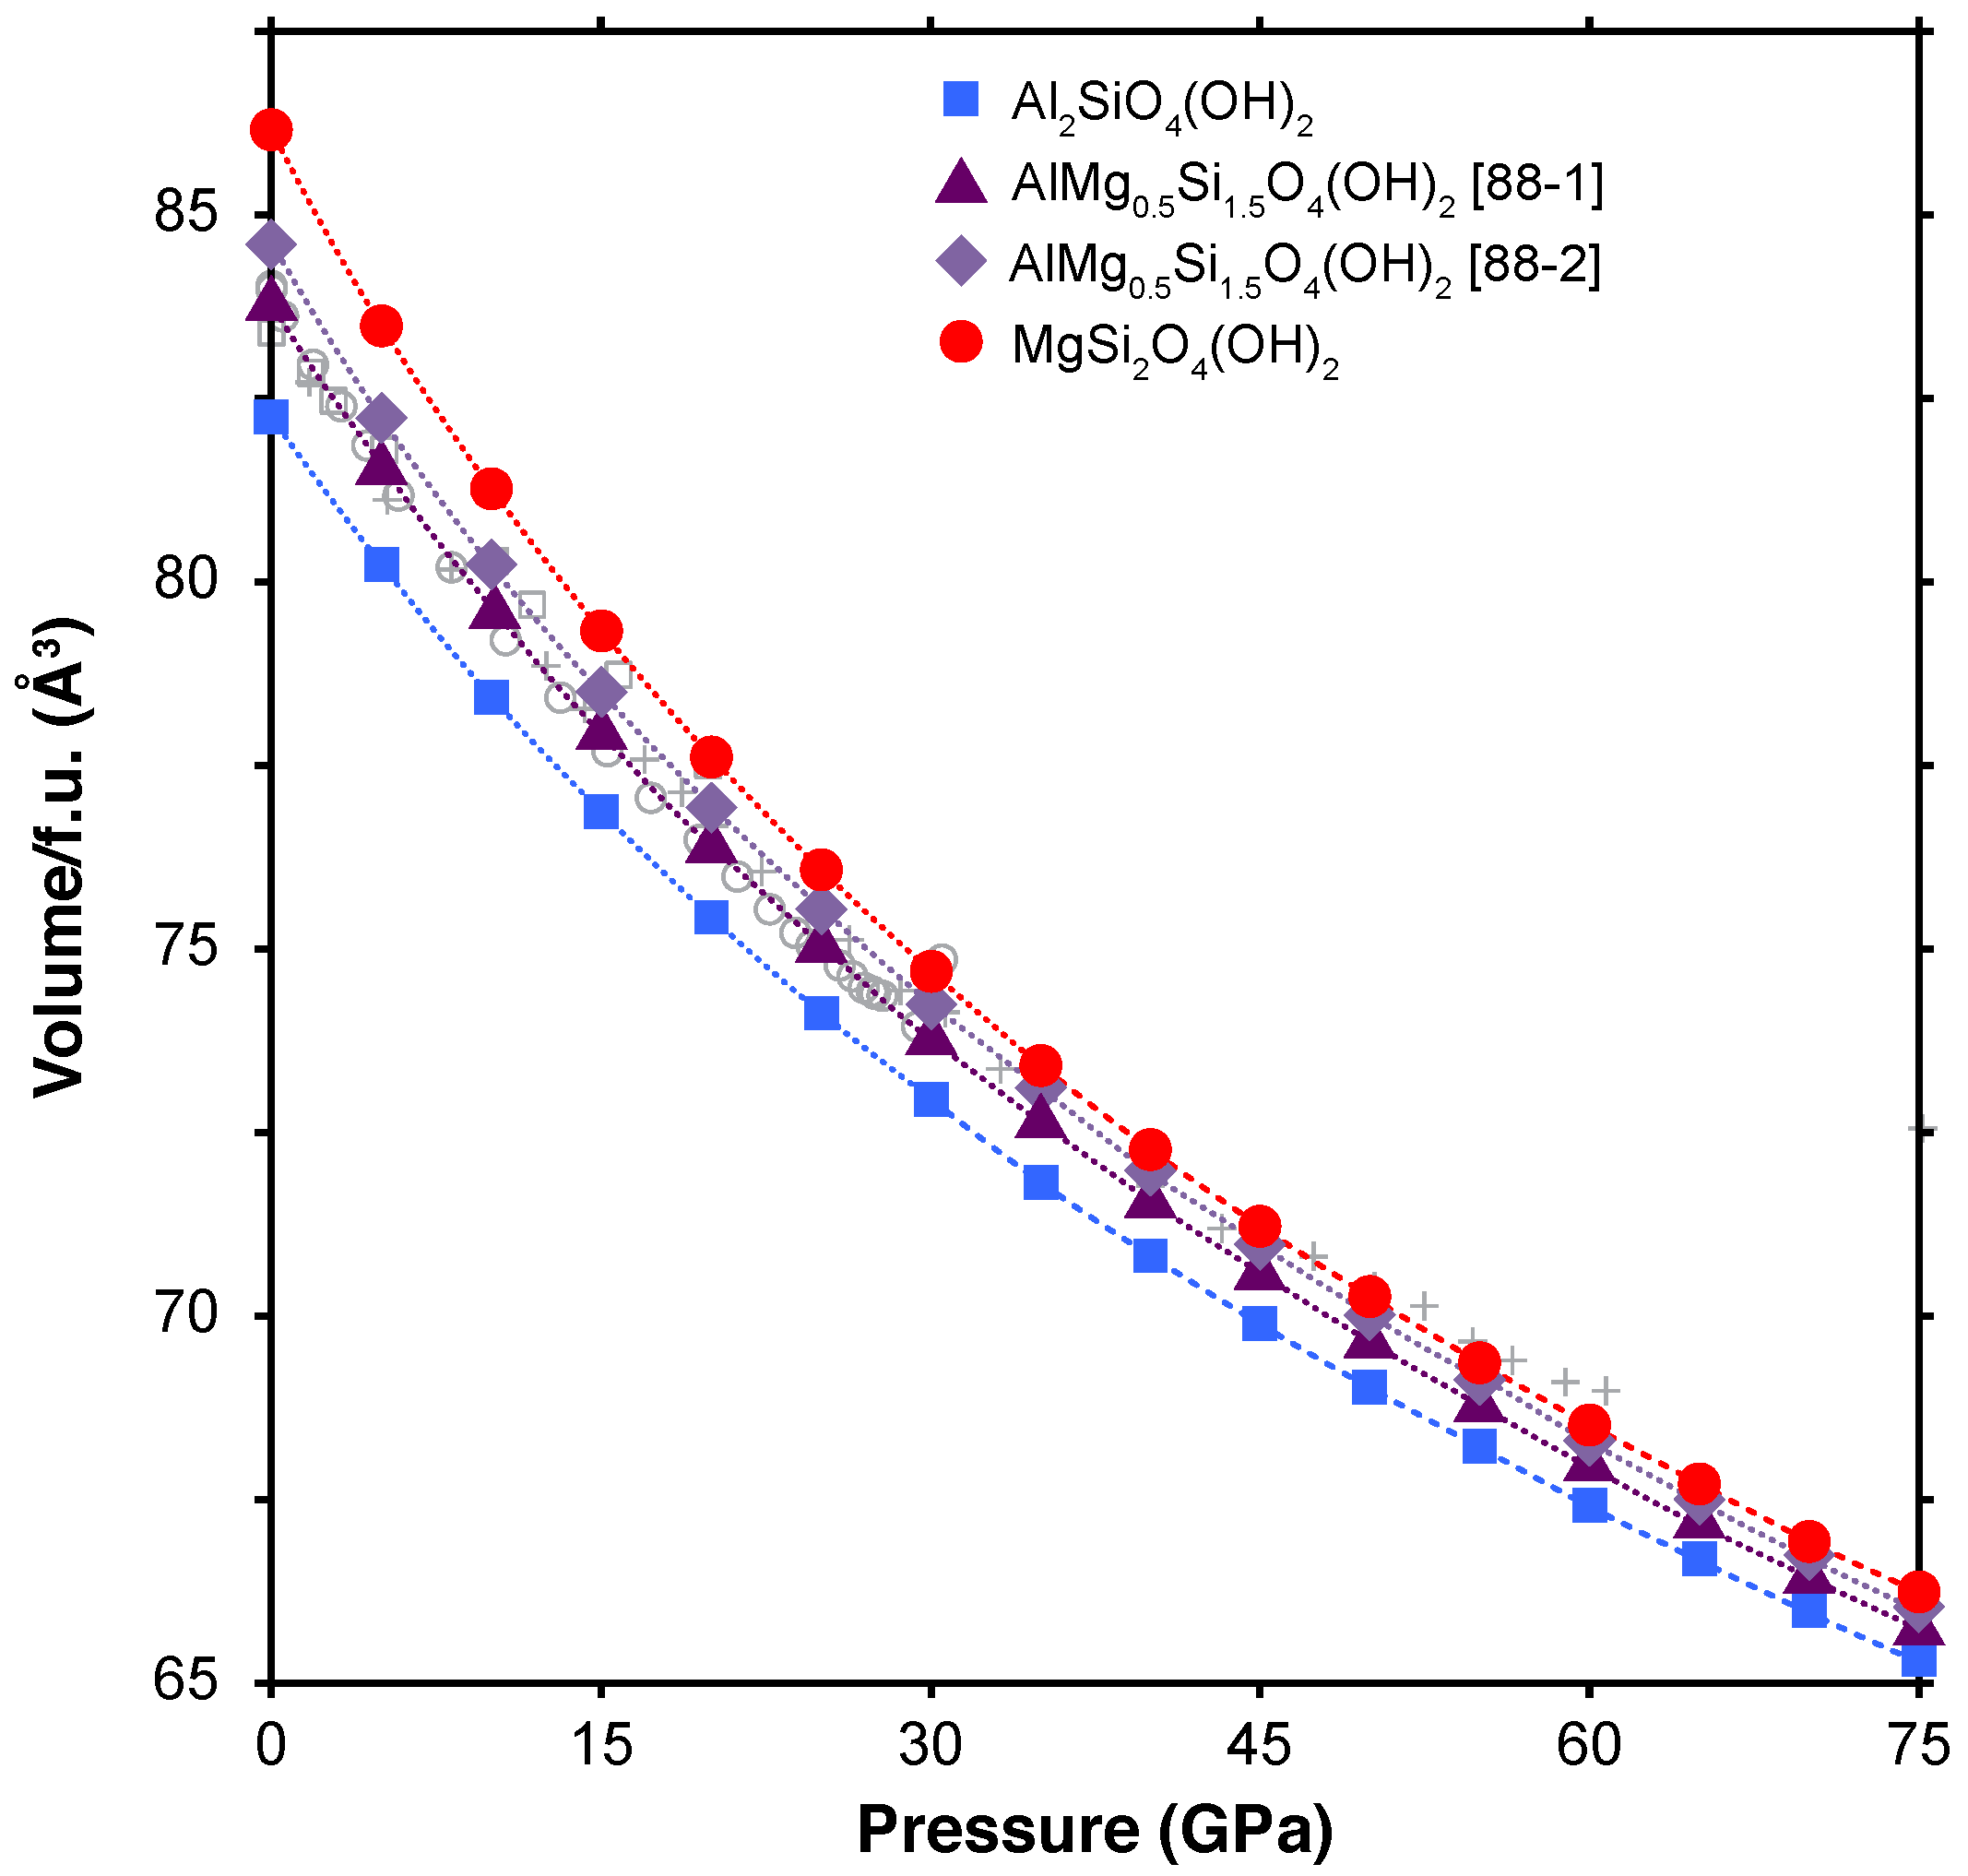
Direct comparison to experimentally derived equation of state parameters can be difficult, as even in the case of Mg-endmember phase D a range of compositions have been reported [25,37,40,41,43]. Yet despite this compositional variability, our equation of state parameters are in good agreement with previously published values (Table 1). No experimental equations of state for Al-endmember phase D (Al2SiO4(OH)2) or AlMg0.5Si1.5O4(OH)2 are available. However, our equation of state parameters indicate that Al-endmember phase D is slightly less compressible than the Mg-endmember and that the compressibility of AlMg0.5Si1.5O4(OH)2 is approximately intermediate to the Mg- and Al-endmember compositions (Figure 5). As expected, pressure induced hydrogen bond symmetrization resulted in an increase in the zero-pressure bulk modulus () for both endmember compositions, accompanied by a modest reduction in (). Due to the intrinsic trade-off in these parameters, the increase in bulk modulus coincident with hydrogen bond symmetrization was determined using a fixed value of 4. In the case of MgSi2O4(OH)2, the increase in bulk modulus corresponding to hydrogen bond symmetrization is 22%, in good agreement with previous calculations [24,26] and experiments [25], while for Al2SiO4(OH)2 the increase is just 13%.
3.3. Elastic Constants
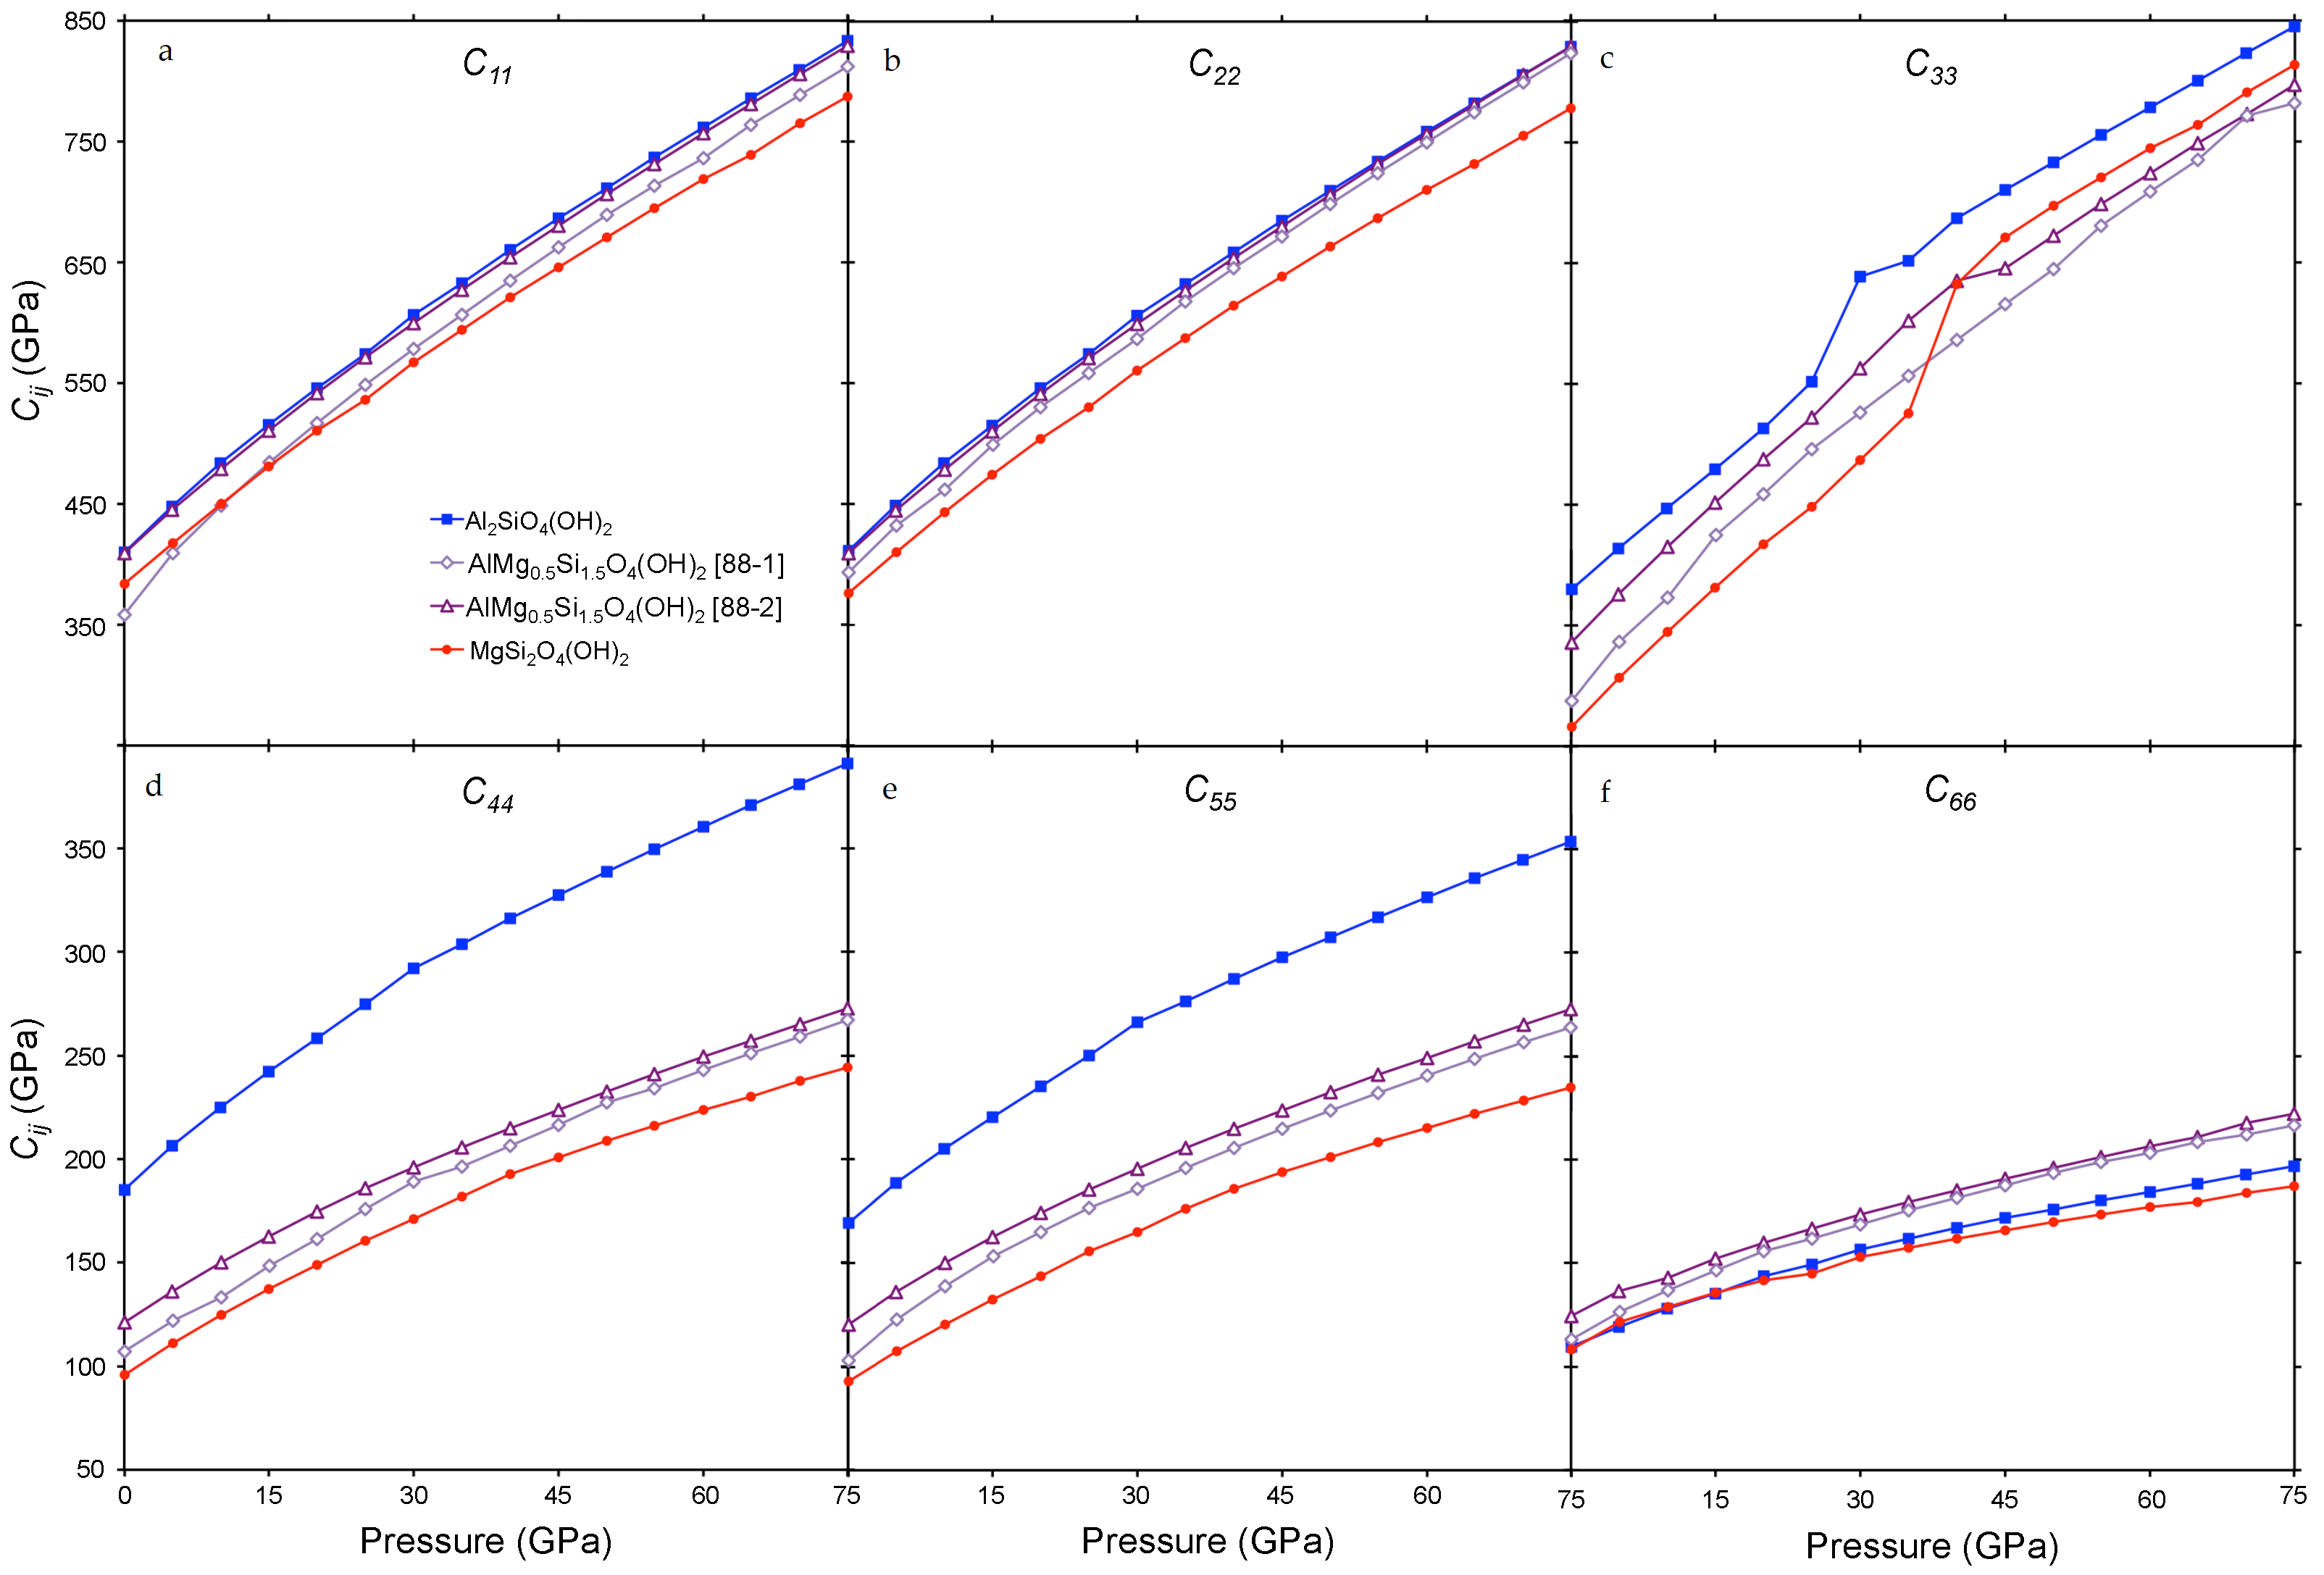
The full elastic tensors of the MgSi2O4(OH)2, AlMg0.5Si1.5O4(OH)2, and Al2SiO4(OH)2 structures were calculated at 5 GPa intervals across the 0 to 75 GPa pressure range. Although phase D is trigonal, we calculated the 21 independent elastic constants needed to describe the slight triclinic distortion in our optimized structures. The major single crystal elastic constants (C11, C22, C33, C44, C55, C66) are plotted in Figure 6, and the full elastic tensors are included in tabulated form in Table A8, Table A9, Table A10, Table A11, Table A12, Table A13, Table A14 and Table A15.
The Mg-endmember constants from this study are in close agreement with the previously published calculated elastic constants of [27,50], which themselves have been extensively compared to experimental results. In the case of the C11, C44, and C55 constants, both the 88-1 and 88-2 structures of the intermediate composition are bounded by the constants of the endmember compositions, with the Al-endmember C44 and C55 significantly higher than those of the Mg-endmember. The C22 constant largely follows the same pattern, with elevated values for Al2SiO4(OH)2 compared to MgSi2O4(OH)2, but the the 88-1 structure of AlMg0.5Si1.5O4(OH)2 is virtually indistinguishable from the Al-endmember. At low pressures, the C33 of the intermediate composition is also bracketed by the endmember compositions, but coincident with the onset of hydrogen bond symmetrization the C33 of both endmembers undergo discontinuous behavior, increasing abruptly before again smoothly increasing with pressure. The O—HO bonds within phase D are most closely aligned to the c-axis (Figure 1), therefore it is intuitive that the C33 elastic constant which indicates stiffness along the c-axis is the most dramatically impacted by hydrogen bond symmetrization. As neither structure of AlMg0.5Si1.5O4(OH)2 undergoes pressure induced hydrogen bond symmetrization, the C33 of AlMg0.5Si1.5O4(OH)2 lacks this discontinuity, increasing steadily but remaining lower than either endmember at pressures exceeding 40 GPa. Lastly, the C66 of the tie-line composition of both structures is slightly elevated compared to both endmember compositions. This is likely due to the fact that the triclinic distortion evident in the endmembers structures is absent in the AlMg0.5Si1.5O4(OH)2 super-cells, therefore the C66 constant accommodates some of the strain otherwise accommodated by these lesser components (Table A8, Table A9, Table A10, Table A11, Table A12, Table A13, Table A14 and Table A15).
3.4. Moduli and Velocities
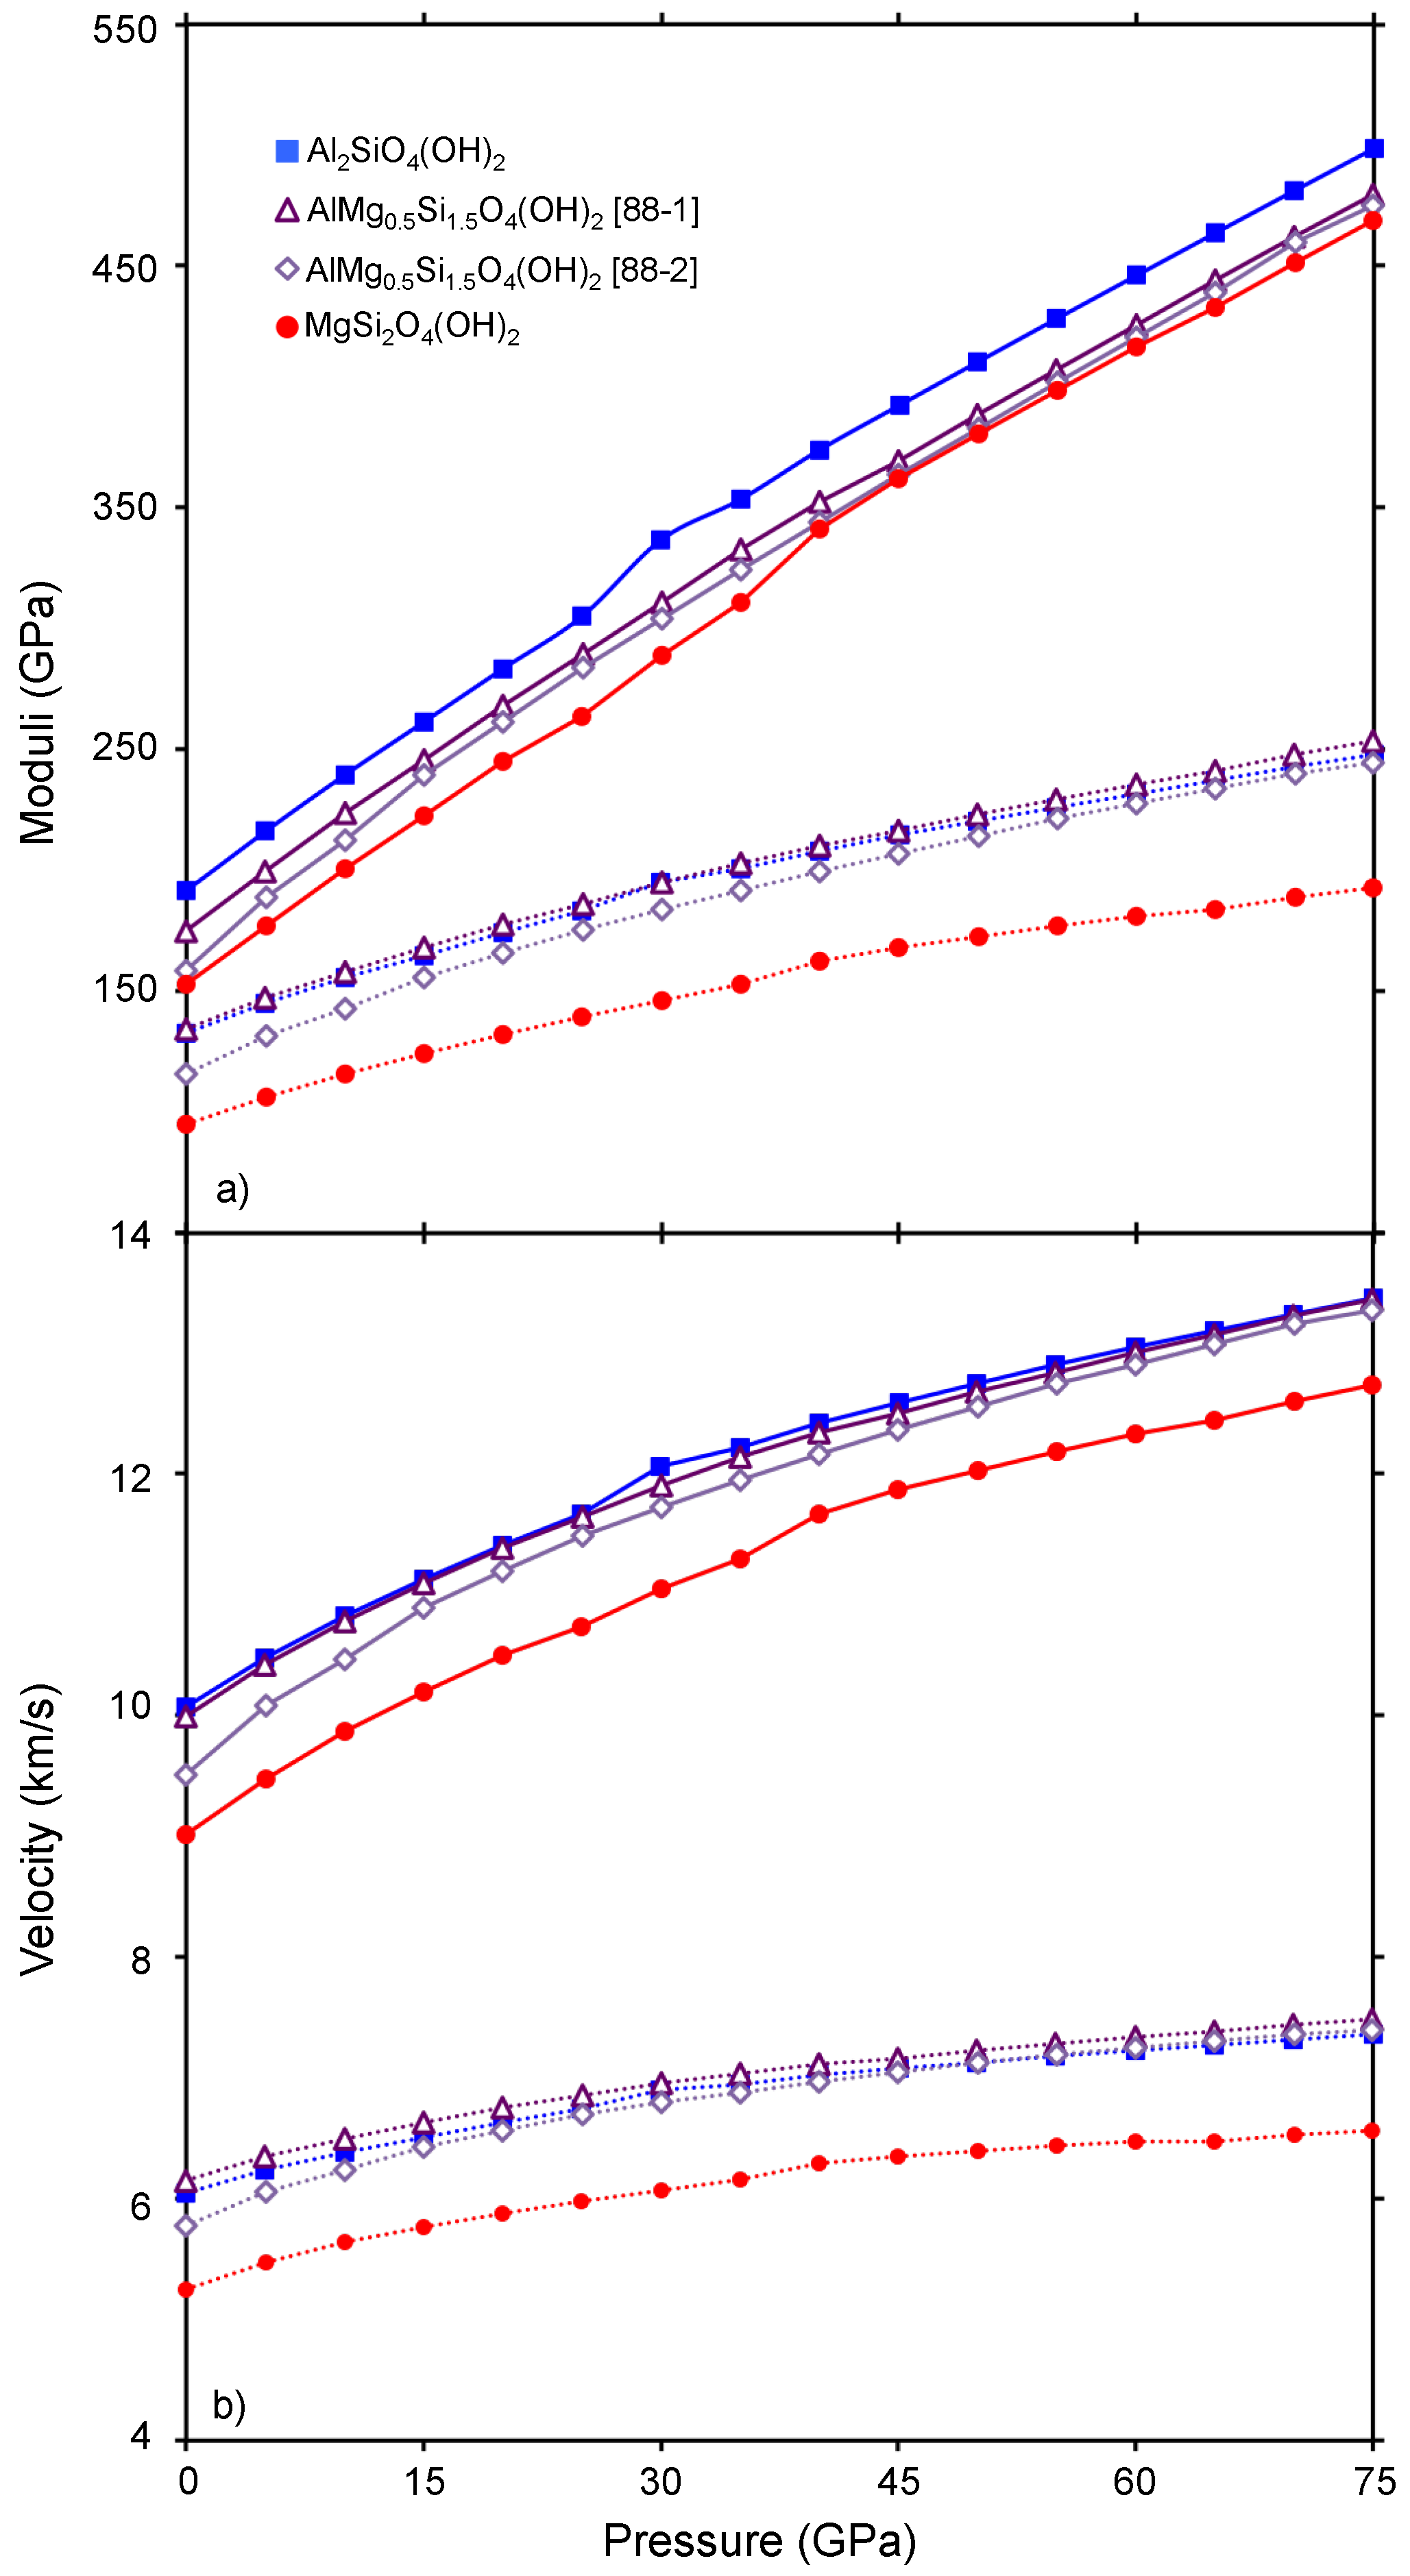
Bulk and shear moduli of the Mg-endmember, Al-endmember, and two structures of the tie-line composition were calculated from the single crystal elastic constants using the Voigt-Reuss-Hill averaging scheme as shown in Figure 7a and Table 2 [51]. The pressure dependence of the bulk modulus of both Al- and Mg-endmembers exhibit discontinuities, reflecting the decrease in compressibility which accompanies pressure-induced hydrogen bond symmetrization in these phases, particularly along the c-axis. A more subtle inflection is also visible in the shear modulus of the Mg-endmember although no analogous discontinuity occurs within the Al-endmember. Notably, the AlMg0.5Si1.5O4(OH)2 in both the 88-1 and 88-2 structures has a bulk modulus approximately intermediate to the Mg- and Al-endmembers prior to the onset of hydrogen bond symmetrization at low pressures, but above 45 GPa these tie-line compositions have a bulk modulus nearly indistinguishable from that of the Mg-endmember. Additionally, the shear modulus of the intermediate composition is nearly indistinguishable from that of the Al-endmember in the case of both structures evaluated across the entire pressure range investigated.
As phase D exhibits anisotropic compression, evident in the low-pressure evolution of the c/a ratio as well as hydrogen bond symmetrization, determining the influence of cation substitution on compressibility is a complex issue. Furthermore, Al-bearing compositions of phase D have physical properties that cannot be predicted by linear interpolation between the Mg- and Al-endmembers. While the low pressure anisotropy in phase D is likely dictated by differential strain accommodation due to varying cation occupancies in the layered structure, Al-substitution also suppresses hydrogen bond symmetrization, indirectly influencing the elastic behavior. Parsing these distinct but overlapping effects experimentally will likely be daunting, particularly when exploring even more complex compositions (e.g., Fe-substitution combined with Al-substitution). Therefore, first-principles calculations provide a theoretical framework and detailed structural information which complement and elucidate more compositionally complex experimental studies.
4. Discussion
Previous work has probed the influence of phase D on the velocity structure of hydrous subducting slabs, of which phase D may be a significant component [27,52,53]. These studies have focused on determining to what extent phase D, which exhibits relatively high degree of shear wave anisotropy (AVS), contributes to observations of shear wave splitting (SH > SV) in stagnant slabs. Although Mainprice and coauthors [52] evaluated the influence of compositional variation on these properties and determined the influence of cation substitution was negligible, the extent of solid solution in that study was extremely limited [Al0.03Fe0.11Mg1.0Si1.5O4(OH)2]. Furthermore, the interpretation of the influence of either Al- or Fe-substitution on the properties of phase D in that study is complicated by the inclusion of both in a single, compositionally complex sample.
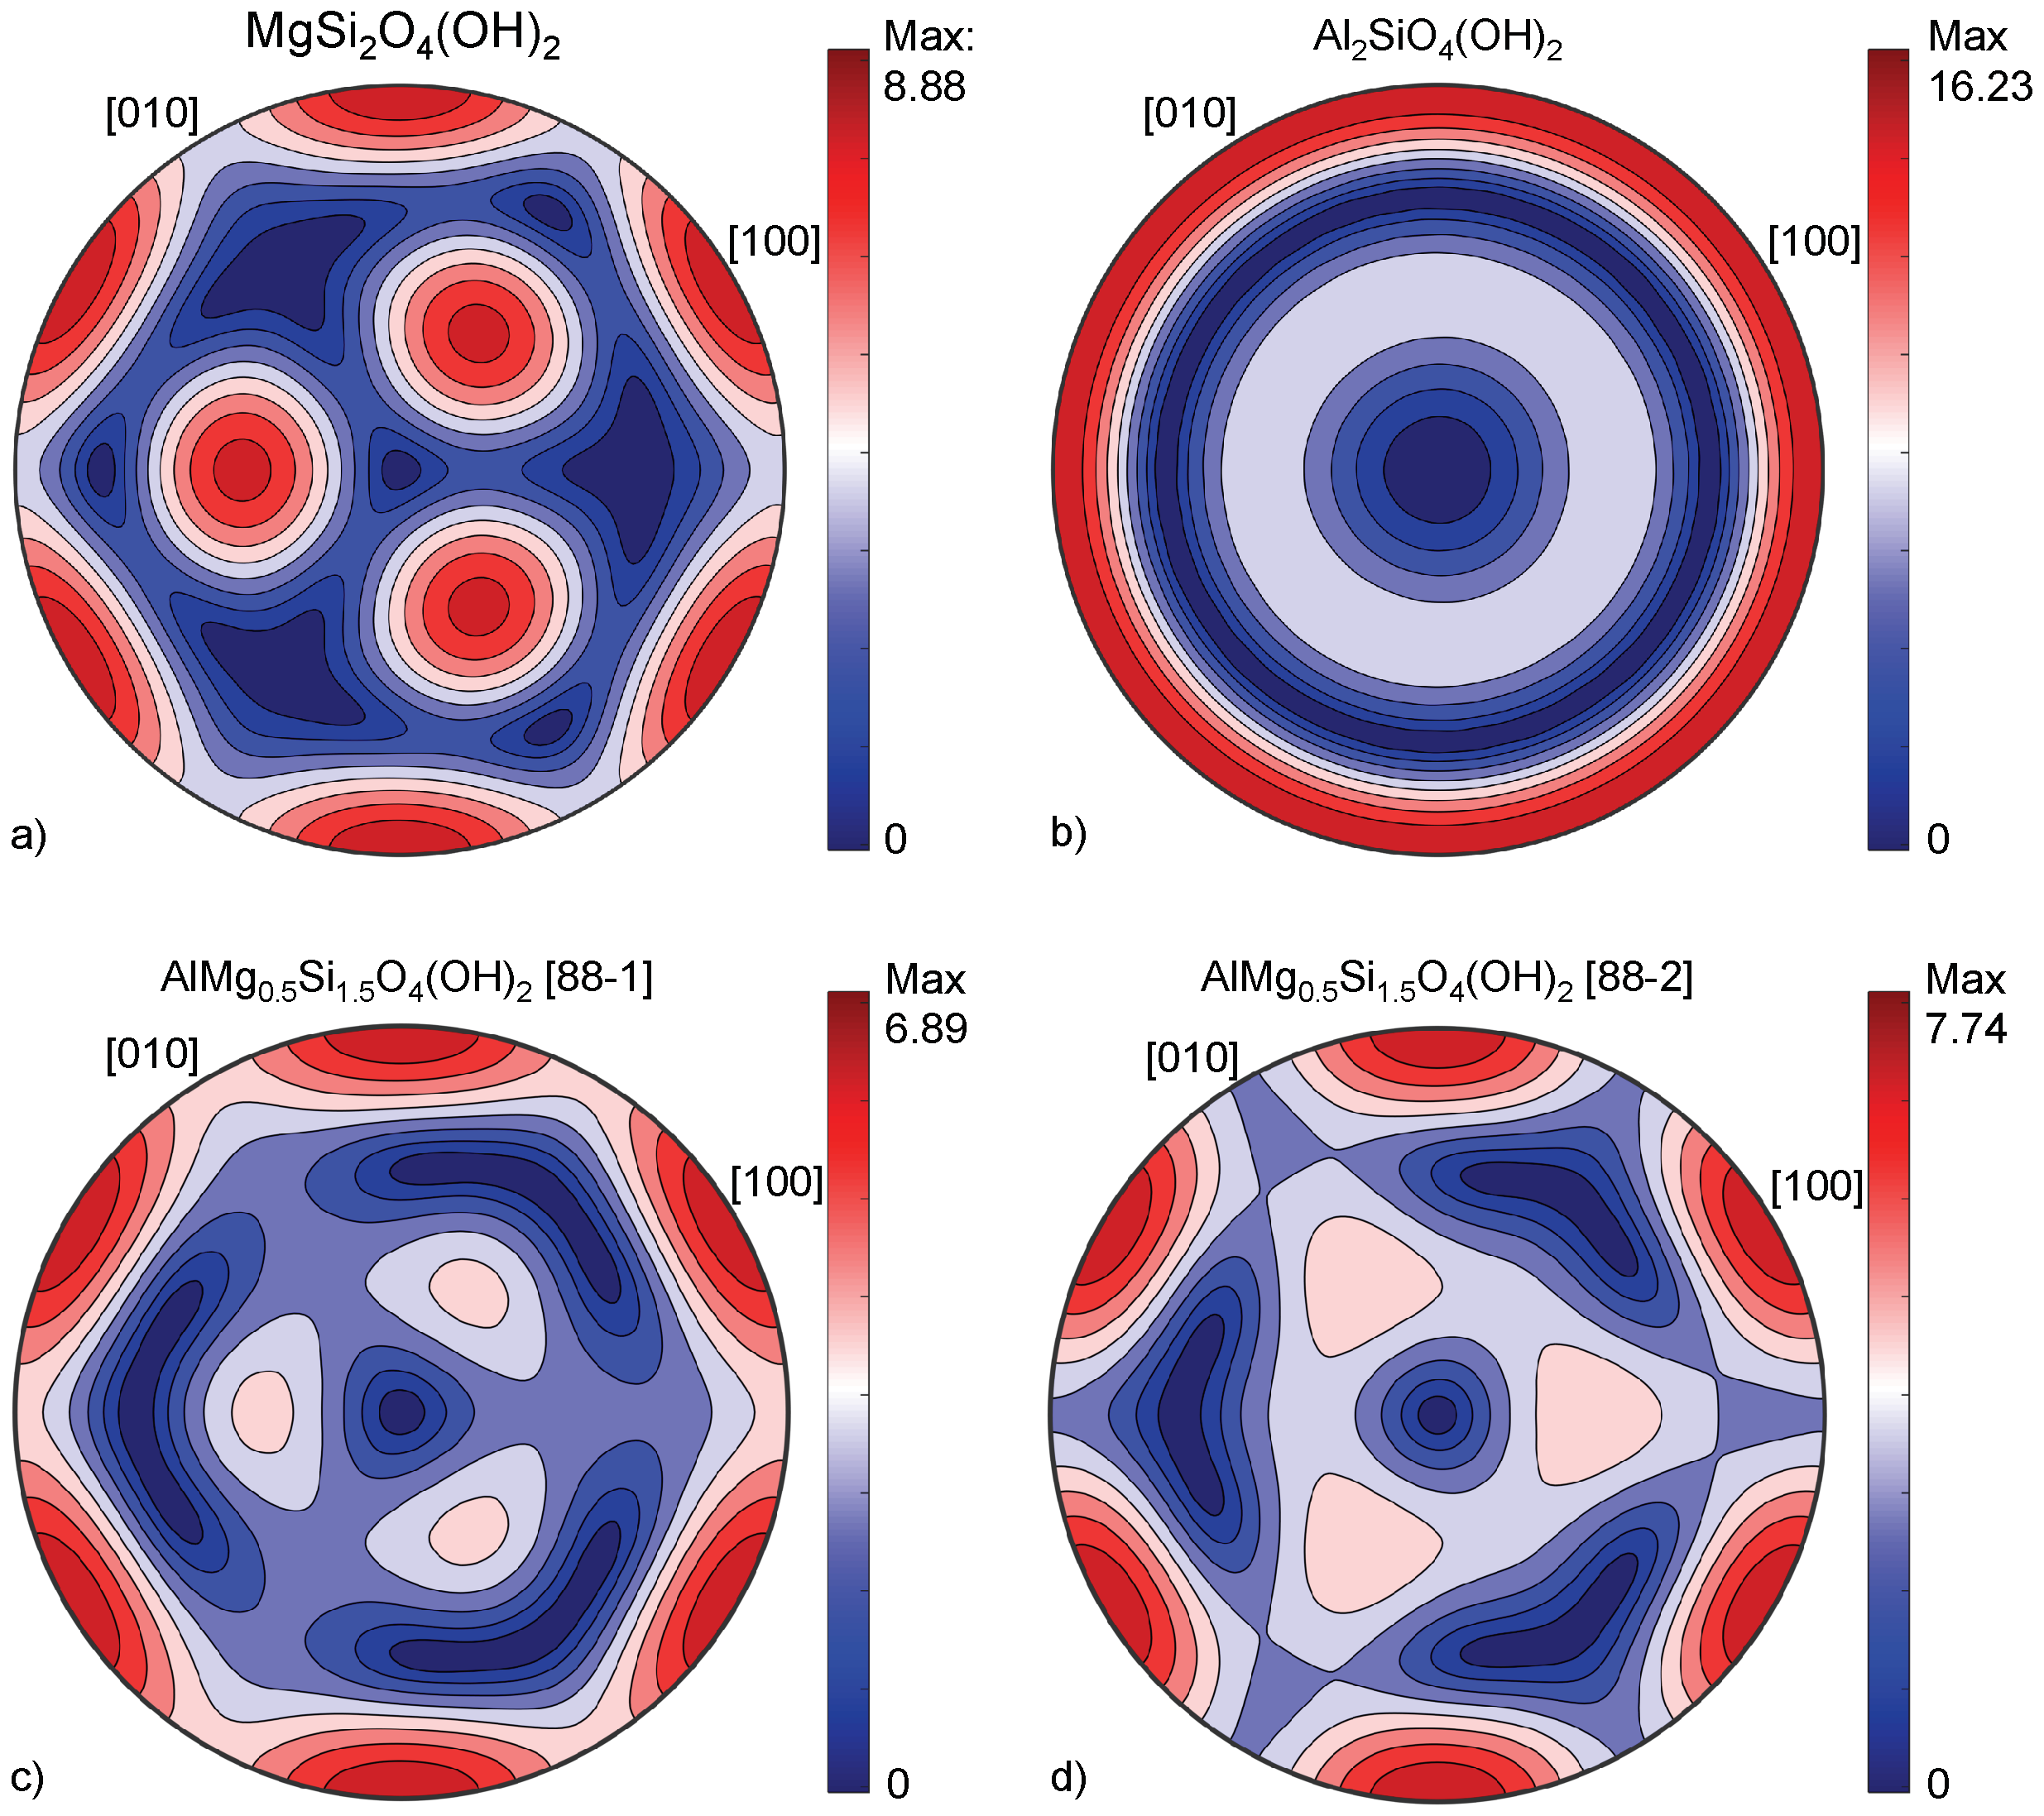
We evaluated the influence of Al-substitution on the seismic anisotropy of phase D using the Christoffel equation [54], reducing our triclinic elastic constants to the appropriate trigonal symmetry with a weighted mean to enable direct comparison to literature values. The maximum shear wave polarization anisotropy (AVS) of Mg-endmember, Al-endmember, and the tie-line composition of phase D as a function of pressure are reported in Table A16. At 0 GPa, we find the maximum AVS of MgSi2O4(OH)2 is quite high (AVS = 21.86), in good agreement with previously reported values by [27] (AVS = 19.92) and [52] (AVS = 17.69). However, we find a strong, negative pressure dependence of the shear wave polarization anisotropy in MgSi2O4(OH)2, such that by the pressure of the lower mantle the magnitude is of the AVS is halved (Figure 8a). Conversely, at 0 GPa the maximum shear wave polarization anisotropy of Al-endmember phase D (AVS = 10.65) is significantly lower than that of the Mg-endmember (Table A16), but due to its strong positive pressure dependence is nearly double that of the Mg-endmember at lower mantle pressures (Figure 8b). Additionally, in Al-endmember phase D the maximum shear anisotropy exists not only along the a-axis, as in the Mg-endmember, but also along the b-axis.
Based on our observation that the elastic properties of AlMg0.5Si1.5O4(OH)2 could not be accurately determined by interpolating the properties of the Mg- and Al-endmembers compositions, we evaluated the maximum shear wave polarization anisotropy of the tie-line composition of phase D as a function of pressure (Table A16). At 0 GPa, the maximum AVS of both structures (88-1 and 88-2) of the tie-line compositions are intermediate to that of the Al- and Mg-endmembers (13.48 and 14.87, respectively) (Figure 8c,d). However, like the Mg-endmember, the AVS of both the 88-1 and 88-2 structures exhibits a negative pressure-dependence at pressures up to ∼50 GPa. Ultimately, both structures of AlMg0.5Si1.5O4(OH)2 exhibit less shear wave polarization anisotropy than either the Al- or Mg-endmember to pressures up to 70 GPa (Figure 8c,d). As non-endmember, Al-bearing phase D has less shear wave anisotropy than either endmember, studies that estimate regional volume % of phase D based on matching shear-wave splitting observations based on the properties of MgSi2O4(OH)2 or AlMg0.5Si1.5O4(OH)2 likely underestimated the amount of phase D needed to mimic observations.
5. Conclusions
By evaluating three compositions of phase D [MgSi2O4(OH)2, AlMg0.5Si1.5O4(OH)2, Al2SiO4(OH)2] using density functional theory based calculations, we were able to probe the extent to which Al-substitution influences the physical properties of this phase. Al-endmember phase D is denser (2%–6%), less compressible (6%–25%), and has faster compressional (6%–12%) and shear velocities (12%–15%) relative to its Mg-endmember counterpart. In the complex mineralogy of a subducting slab, solid solutions of phase D are expected (Al-bearing, or even Fe-bearing) and these are the geophysical properties one would hope to incorporate into regional models. Unfortunately, based on our calculations, the properties of Al-bearing phase D cannot be determined via a simple volumetric mixing model. In evaluating the properties of two structures of phase D with 50% Al-substitution we see that these tie-line compositions exhibit properties radically different than what would be obtained by linearly interpolating between the endmembers. Furthermore, comparison of these two AlMg0.5Si1.5O4(OH)2 structures reveals that not only which cations substitute into phase D, but where they substitute, can also dictate macroscale bahavior. Solid solution seemingly inhibits pressure-induced hydrogen bond symmetrization, which in turn significantly influences compressibility at the pressures of the uppermost lower mantle. Not only are the elastic tensors of the tie-line composition far from intermediate to the endmembers, but at sufficiently high pressures (>45 GPa) the shear wave velocities of the AlMg0.5Si1.5O4(OH)2 are higher than those of either MgSi2O4(OH)2 or Al2SiO4(OH)2. Lastly, AlMg0.5Si1.5O4(OH)2 has a lower maximum shear wave polarization anisotropy than either the Mg- or Al-endmember compositions, and studies which constrain the the quantity of phase D in the deep Earth by matching seismic structures to the properties of either endmember may be misleading.
Author Contributions
Conceptualization and validation, E.C.T., A.J.C. and J.T.; methodology, investigation, formal analysis and data curation, E.C.T. and J.T.; software and resources J.T.; writing, visualization, funding acquisition and project administration, E.C.T.; supervision, A.J.C. and J.T. All authors have read and agreed to the published version of the manuscript.
Funding
This work was supported by a National Science Foundation Postdoctoral Fellowship under grant EAR-1725673 and EAPSI Program grant SP-1612833, jointly funded through the U.S. National Science Foundation and the Japan Society for the Promotion of Science (JSPS) for E.C.T. This study was supported in part by NSF grant EAR-1651017 for A.J.C. This study was also partly supported by JSPS KAKENHI grants JP26400516, JP26287137, JP20K04043, and JP20K04126 for J.T.
Institutional Review Board Statement
Not applicable.
Informed Consent Statement
Not applicable.
Data Availability Statement
The data presented in this study are available in the supplemental documents.
Acknowledgments
The authors thank our anonymous reviewers who provided valuable feedback that helped to improve this manuscript.
Conflicts of Interest
The authors declare no conflict of interest. The funders had no role in the design of the study; in the collection, analyses, or interpretation of data; in the writing of the manuscript, or in the decision to publish the results.
Appendix A

Table A1.
Atomic positions in MgSi2O4(OH)2 at 0 GPa. Atomic positions (X, Y, Z) are in units of fractional unit cells.
Table A1.
Atomic positions in MgSi2O4(OH)2 at 0 GPa. Atomic positions (X, Y, Z) are in units of fractional unit cells.
| Atom | X | Y | Z |
|---|---|---|---|
| Mg | 0.028620 | 0.023768 | 0.975729 |
| Si | 0.347702 | 0.658947 | 0.508795 |
| Si | 0.663789 | 0.342861 | 0.508793 |
| O | 0.638624 | 0.007447 | 0.255687 |
| O | 0.012286 | 0.633783 | 0.255686 |
| O | 0.364646 | 0.359806 | 0.283017 |
| O | 0.389340 | 0.003503 | 0.722073 |
| O | 0.008345 | 0.384497 | 0.722074 |
| O | 0.661872 | 0.657030 | 0.713433 |
| H | 0.528067 | 0.000198 | 0.049481 |
| H | 0.005037 | 0.523219 | 0.049482 |
Table A2.
Atomic positions in Al2SiO4(OH)2 at 0 GPa. Positions (X, Y, Z) are in units of fractional supercell, which has been doubled along the c-axis (i.e., the Z direction).
Table A2.
Atomic positions in Al2SiO4(OH)2 at 0 GPa. Positions (X, Y, Z) are in units of fractional supercell, which has been doubled along the c-axis (i.e., the Z direction).
| Atom | X | Y | Z |
|---|---|---|---|
| Al | 0.026542 | 0.025246 | 0.488610 |
| Al | 0.348302 | 0.664052 | 0.252579 |
| Si | 0.664396 | 0.344483 | 0.255085 |
| O | 0.662522 | 0.020607 | 0.122531 |
| O | −0.000753 | 0.646637 | 0.121026 |
| O | 0.352439 | 0.330242 | 0.134030 |
| O | −0.005662 | 0.021132 | 0.372155 |
| O | 0.008345 | 0.353860 | 0.369841 |
| O | 0.694481 | 0.674300 | 0.361957 |
| H | 0.530647 | 0.006447 | 0.018271 |
| H | 0.000892 | 0.520245 | 0.018077 |
| Al | 0.029669 | 0.022128 | 0.988607 |
| Si | 0.348912 | 0.660008 | 0.755084 |
| Al | 0.668490 | 0.343930 | 0.752574 |
| O | 0.651055 | −0.005148 | 0.621028 |
| O | 0.025027 | 0.658129 | 0.622522 |
| O | 0.334662 | 0.348048 | 0.634028 |
| O | 0.358290 | −0.010052 | 0.869836 |
| O | 0.025561 | 0.690086 | 0.872153 |
| O | 0.678729 | 0.674300 | 0.861956 |
| H | 0.524663 | −0.003512 | 0.518074 |
| H | 0.010857 | 0.526234 | 0.518265 |
Table A3.
Atomic positions in the 88-1 structure of AlMg0.5Si1.5O4(OH)2 at 0 GPa. Atomic positions (X, Y, Z) are in units of fractional supercell, which has been doubled along the a-, b-, and c-axis.
Table A3.
Atomic positions in the 88-1 structure of AlMg0.5Si1.5O4(OH)2 at 0 GPa. Atomic positions (X, Y, Z) are in units of fractional supercell, which has been doubled along the a-, b-, and c-axis.
| X | Y | Z | X | Y | Z | ||
|---|---|---|---|---|---|---|---|
| Al | 0.0167 | 0.0078 | 0.5008 | Mg | 0.0021 | 0.5114 | 0.5128 |
| Si | 0.1753 | 0.3360 | 0.2484 | Si | 0.1641 | 0.8453 | 0.2500 |
| Si | 0.3311 | 0.1742 | 0.2539 | Al | 0.3409 | 0.6822 | 0.2493 |
| O | 0.3191 | 0.0093 | 0.1412 | O | 0.3274 | 0.5031 | 0.1190 |
| O | 0.0195 | 0.3355 | 0.1528 | O | 0.0001 | 0.8297 | 0.1260 |
| O | 0.1734 | 0.1782 | 0.1416 | O | 0.1851 | 0.6989 | 0.1355 |
| O | 0.1773 | 0.0090 | 0.3675 | O | 0.1933 | 0.5014 | 0.3744 |
| O | 0.0140 | 0.1844 | 0.3879 | O | 0.0017 | 0.6957 | 0.3652 |
| O | 0.3344 | 0.3380 | 0.3570 | O | 0.3151 | 0.8294 | 0.3817 |
| H | 0.2487 | 0.0138 | −0.0099 | H | 0.2643 | 0.4990 | 0.0127 |
| H | −0.2304 | 0.2602 | −0.0144 | H | 0.0024 | 0.7499 | −0.0212 |
| Al | 0.0089 | 0.0155 | 1.0008 | Mg | 0.0126 | 0.5009 | 1.0128 |
| Si | 0.1754 | 0.3299 | 0.7539 | Al | 0.1834 | 0.8397 | 0.7493 |
| Si | 0.3372 | 0.1741 | 0.7484 | Si | 0.3465 | 0.6629 | 0.7500 |
| O | 0.3367 | 0.0183 | 0.6528 | O | 0.3309 | 0.4989 | 0.6260 |
| O | 0.0105 | 0.3179 | 0.6412 | O | 0.0043 | 0.8262 | 0.6190 |
| O | 0.1793 | 0.1722 | 0.6416 | O | 0.1969 | 0.5005 | 0.8652 |
| O | 0.1856 | 0.0128 | 0.8879 | O | 0.0026 | 0.6921 | 0.8744 |
| O | 0.0102 | 0.1761 | 0.8675 | O | 0.3306 | 0.8139 | 0.8817 |
| O | 0.3392 | 0.3332 | 0.8570 | O | 0.2001 | 0.6839 | 0.6355 |
| H | 0.2614 | 0.7684 | 0.4856 | H | 0.2511 | 0.5012 | 0.4788 |
| H | 0.0150 | 0.2475 | 0.4901 | H | 0.0001 | 0.7631 | 0.5127 |
| Mg | 0.5021 | 0.0114 | 0.5128 | Al | 0.5167 | 0.5078 | 0.5008 |
| Si | 0.6641 | 0.3453 | 0.2500 | Si | 0.6753 | 0.8360 | 0.2484 |
| Al | 0.8409 | 0.1822 | 0.2493 | Si | 0.8311 | 0.6742 | 0.2539 |
| O | 0.8274 | 0.0031 | 0.1190 | O | 0.8191 | 0.5093 | 0.1412 |
| O | 0.5001 | 0.3297 | 0.1260 | O | 0.5195 | 0.8355 | 0.1528 |
| O | 0.6851 | 0.1989 | 0.1355 | O | 0.6734 | 0.6782 | 0.1416 |
| O | 0.6933 | 0.0014 | 0.3744 | O | 0.6773 | 0.5090 | 0.3675 |
| O | 0.5017 | 0.1957 | 0.3652 | O | 0.5140 | 0.6844 | 0.3879 |
| O | 0.8151 | 0.3294 | 0.3817 | O | 0.8344 | 0.8380 | 0.3570 |
| H | 0.7643 | −0.0010 | 0.0127 | H | 0.7487 | 0.5138 | −0.0099 |
| H | 0.5024 | 0.2499 | −0.0212 | H | 0.2696 | 0.7602 | −0.0144 |
| Mg | 0.5126 | 0.0009 | 1.0128 | Al | 0.5089 | 0.5155 | 1.0008 |
| Al | 0.6834 | 0.3397 | 0.7493 | Si | 0.6754 | 0.8299 | 0.7539 |
| Si | 0.8465 | 0.1629 | 0.7500 | Si | 0.8372 | 0.6741 | 0.7484 |
| O | 0.8309 | −0.0011 | 0.6260 | O | 0.8367 | 0.5183 | 0.6528 |
| O | 0.5043 | 0.3262 | 0.6190 | O | 0.5105 | 0.8179 | 0.6412 |
| O | 0.7001 | 0.1839 | 0.6355 | O | 0.6856 | 0.5128 | 0.8879 |
| O | 0.6969 | 0.0005 | 0.8652 | O | 0.5102 | 0.6761 | 0.8675 |
| O | 0.5026 | 0.1921 | 0.8744 | O | 0.8392 | 0.8332 | 0.8570 |
| O | 0.8306 | 0.3139 | 0.8817 | O | 0.6793 | 0.6722 | 0.6416 |
| H | 0.7511 | 1.0012 | 0.4788 | H | 0.7614 | 0.2684 | 0.4856 |
| H | 0.5001 | 0.2631 | 0.5127 | H | 0.5150 | 0.7475 | 0.4901 |
Table A4.
Atomic positions in the 88-2 structure of AlMg0.5Si1.5O4(OH)2 at 0 GPa. Atomic positions (X, Y, Z) are in units of fractional supercell, which has been doubled along the a-, b-, and c-axis.
Table A4.
Atomic positions in the 88-2 structure of AlMg0.5Si1.5O4(OH)2 at 0 GPa. Atomic positions (X, Y, Z) are in units of fractional supercell, which has been doubled along the a-, b-, and c-axis.
| X | Y | Z | X | Y | Z | ||
|---|---|---|---|---|---|---|---|
| Al | 0.0124 | 0.0007 | 0.5029 | Al | 0.0038 | 0.5037 | 0.5214 |
| Al | 0.1733 | 0.3366 | 0.2481 | Si | 0.1746 | 0.8521 | 0.2563 |
| Si | 0.3218 | 0.1724 | 0.2534 | Al | 0.3477 | 0.6795 | 0.2543 |
| O | 0.3223 | 0.0076 | 0.1463 | O | 0.3251 | 0.5104 | 0.1281 |
| O | 0.0077 | 0.3377 | 0.1511 | O | 0.0043 | 0.8163 | 0.1347 |
| O | 0.1839 | 0.1779 | 0.1402 | O | 0.1857 | 0.6981 | 0.1395 |
| O | 0.1780 | 0.0050 | 0.3699 | O | 0.1806 | 0.5113 | 0.3899 |
| O | 0.0065 | 0.1744 | 0.3896 | O | 0.0115 | 0.6871 | 0.3780 |
| O | 0.3468 | 0.3358 | 0.3663 | O | 0.3254 | 0.8380 | 0.3888 |
| H | 0.2521 | 0.0124 | −0.0239 | H | 0.2664 | 0.5043 | 0.0277 |
| H | −0.2578 | 0.2492 | 0.0367 | H | 0.0035 | 0.7629 | 0.0280 |
| Mg | 0.0090 | 0.0247 | 0.9932 | Mg | 0.0065 | 0.4886 | 0.9983 |
| Si | 0.1802 | 0.3350 | 0.7512 | Si | 0.1778 | 0.8361 | 0.7506 |
| Si | 0.3457 | 0.1800 | 0.7450 | Si | 0.3463 | 0.6705 | 0.7534 |
| O | 0.3364 | 0.0058 | 0.6432 | O | 0.3293 | 0.5024 | 0.6262 |
| O | 0.0030 | 0.3289 | 0.6287 | O | 0.0150 | 0.8291 | 0.6282 |
| O | 0.1816 | 0.1713 | 0.6366 | O | 0.1977 | 0.5061 | 0.8593 |
| O | 0.1981 | 0.0076 | 0.8720 | O | 0.0097 | 0.6971 | 0.8647 |
| O | 0.0113 | 0.1951 | 0.8541 | O | 0.3178 | 0.8148 | 0.8662 |
| O | 0.3326 | 0.3278 | 0.8530 | O | 0.1819 | 0.6817 | 0.6305 |
| H | 0.2603 | 0.7709 | 0.4846 | H | 0.2465 | 0.5080 | 0.4853 |
| H | 0.0093 | 0.2408 | 0.4864 | H | 0.0094 | 0.7484 | 0.4797 |
| Al | 0.5038 | 0.0037 | 0.5214 | Al | 0.5124 | 0.5007 | 0.5029 |
| Si | 0.6746 | 0.3521 | 0.2563 | Al | 0.6733 | 0.8366 | 0.2481 |
| Al | 0.8477 | 0.1795 | 0.2543 | Si | 0.8218 | 0.6724 | 0.2534 |
| O | 0.8251 | 0.0104 | 0.1281 | O | 0.8223 | 0.5076 | 0.1463 |
| O | 0.5043 | 0.3163 | 0.1347 | O | 0.5077 | 0.8377 | 0.1511 |
| O | 0.6857 | 0.1981 | 0.1395 | O | 0.6839 | 0.6779 | 0.1402 |
| O | 0.6806 | 0.0113 | 0.3899 | O | 0.6780 | 0.5050 | 0.3699 |
| O | 0.5115 | 0.1871 | 0.3780 | O | 0.5065 | 0.6744 | 0.3896 |
| O | 0.8254 | 0.3380 | 0.3888 | O | 0.8468 | 0.8358 | 0.3663 |
| H | 0.7664 | 0.0043 | 0.0277 | H | 0.7521 | 0.5124 | −0.0239 |
| H | 0.5035 | 0.2629 | 0.0280 | H | 0.2422 | 0.7492 | 0.0367 |
| Mg | 0.5065 | −0.0114 | 0.9983 | Mg | 0.5090 | 0.5247 | 0.9932 |
| Si | 0.6778 | 0.3361 | 0.7506 | Si | 0.6802 | 0.8350 | 0.7512 |
| Si | 0.8463 | 0.1705 | 0.7534 | Si | 0.8457 | 0.6800 | 0.7450 |
| O | 0.8293 | 0.0024 | 0.6262 | O | 0.8364 | 0.5058 | 0.6432 |
| O | 0.5150 | 0.3291 | 0.6282 | O | 0.5030 | 0.8289 | 0.6287 |
| O | 0.6819 | 0.1817 | 0.6305 | O | 0.6981 | 0.5076 | 0.8720 |
| O | 0.6977 | 0.0061 | 0.8593 | O | 0.5113 | 0.6951 | 0.8541 |
| O | 0.5097 | 0.1971 | 0.8647 | O | 0.8326 | 0.8278 | 0.8530 |
| O | 0.8178 | 0.3148 | 0.8662 | O | 0.6816 | 0.6713 | 0.6366 |
| H | 0.7465 | 1.0080 | 0.4853 | H | 0.5093 | 0.7408 | 0.4864 |
| H | 0.5094 | 0.2484 | 0.4797 | H | 0.7603 | 0.2709 | 0.4846 |
Table A5.
Average lattice parameters c and a of Mg-endmember phase D (Mg-phD), Al-endmember phase D (Al-phD), and tie-line composition in the 88-1 and 88-2 structures as a function of pressure from 0 to 75 GPa.
Table A5.
Average lattice parameters c and a of Mg-endmember phase D (Mg-phD), Al-endmember phase D (Al-phD), and tie-line composition in the 88-1 and 88-2 structures as a function of pressure from 0 to 75 GPa.
| P (GPa) | Mg-phD | 88-1 | 88-2 | Al-phD | ||||
|---|---|---|---|---|---|---|---|---|
| c | a | c | a | c | a | c | a | |
| 0 | 4.368 | 4.787 | 4.262 | 4.776 | 4.293 | 4.784 | 4.196 | 4.785 |
| 5 | 4.303 | 4.750 | 4.217 | 4.738 | 4.242 | 4.744 | 4.155 | 4.749 |
| 10 | 4.249 | 4.717 | 4.177 | 4.703 | 4.200 | 4.709 | 4.119 | 4.715 |
| 15 | 4.203 | 4.686 | 4.143 | 4.672 | 4.163 | 4.677 | 4.086 | 4.686 |
| 20 | 4.162 | 4.658 | 4.112 | 4.644 | 4.130 | 4.648 | 4.057 | 4.658 |
| 25 | 4.127 | 4.633 | 4.085 | 4.617 | 4.103 | 4.620 | 4.033 | 4.633 |
| 30 | 4.094 | 4.609 | 4.060 | 4.593 | 4.077 | 4.596 | 4.003 | 4.608 |
| 35 | 4.065 | 4.586 | 4.038 | 4.570 | 4.053 | 4.572 | 3.986 | 4.585 |
| 40 | 4.038 | 4.565 | 4.017 | 4.548 | 4.031 | 4.551 | 3.967 | 4.564 |
| 45 | 4.017 | 4.544 | 3.998 | 4.528 | 4.010 | 4.530 | 3.950 | 4.543 |
| 50 | 3.998 | 4.524 | 3.980 | 4.508 | 3.991 | 4.510 | 3.934 | 4.524 |
| 55 | 3.981 | 4.505 | 3.963 | 4.490 | 3.973 | 4.491 | 3.919 | 4.506 |
| 60 | 3.964 | 4.487 | 3.946 | 4.472 | 3.956 | 4.473 | 3.905 | 4.488 |
| 65 | 3.948 | 4.470 | 3.931 | 4.455 | 3.940 | 4.456 | 3.891 | 4.471 |
| 70 | 3.933 | 4.454 | 3.916 | 4.439 | 3.924 | 4.440 | 3.878 | 4.455 |
| 75 | 3.918 | 4.438 | 3.903 | 4.423 | 3.910 | 4.424 | 3.865 | 4.439 |
Table A6.
Difference between the hydroxyl bond length (rO—H) and the hydrogen bond length (rOH) in Mg-endmember phase D (Mg-phD), Al-endmember phase D (Al-phD), and tie-line composition in the 88-1 and 88-2 structures as a function of pressure from 0 to 75 GPa.
Table A6.
Difference between the hydroxyl bond length (rO—H) and the hydrogen bond length (rOH) in Mg-endmember phase D (Mg-phD), Al-endmember phase D (Al-phD), and tie-line composition in the 88-1 and 88-2 structures as a function of pressure from 0 to 75 GPa.
| P (GPa) | Mg-phD | Al-phD | 88-1 | 88-2 | |||||||
|---|---|---|---|---|---|---|---|---|---|---|---|
| 0 | 0.542 | 0.406 | 0.409 | 0.424 | 0.407 | 0.426 | 0.338 | 0.501 | 0.598 | 0.593 | 0.579 |
| 5 | 0.475 | 0.357 | 0.365 | 0.395 | 0.368 | 0.373 | 0.292 | 0.445 | 0.533 | 0.527 | 0.538 |
| 10 | 0.416 | 0.310 | 0.323 | 0.369 | 0.334 | 0.324 | 0.251 | 0.400 | 0.476 | 0.475 | 0.507 |
| 15 | 0.363 | 0.263 | 0.283 | 0.348 | 0.305 | 0.280 | 0.219 | 0.364 | 0.422 | 0.431 | 0.482 |
| 20 | 0.313 | 0.215 | 0.241 | 0.330 | 0.278 | 0.237 | 0.193 | 0.334 | 0.371 | 0.396 | 0.461 |
| 25 | 0.263 | 0.184 | 0.211 | 0.314 | 0.254 | 0.198 | 0.174 | 0.315 | 0.333 | 0.370 | 0.453 |
| 30 | 0.210 | 0.124 | 0.162 | 0.300 | 0.231 | 0.163 | 0.159 | 0.292 | 0.300 | 0.342 | 0.437 |
| 35 | 0.151 | 0.038 | 0.095 | 0.287 | 0.211 | 0.134 | 0.147 | 0.274 | 0.271 | 0.319 | 0.423 |
| 40 | 0.063 | 0.000 | 0.001 | 0.276 | 0.193 | 0.111 | 0.136 | 0.256 | 0.240 | 0.296 | 0.410 |
| 45 | 0.002 | 0.000 | 0.000 | 0.266 | 0.177 | 0.094 | 0.127 | 0.242 | 0.213 | 0.278 | 0.399 |
| 50 | 0.001 | 0.000 | 0.000 | 0.257 | 0.164 | 0.082 | 0.119 | 0.228 | 0.185 | 0.260 | 0.388 |
| 55 | 0.000 | 0.000 | 0.000 | 0.249 | 0.152 | 0.073 | 0.111 | 0.217 | 0.161 | 0.245 | 0.379 |
| 60 | 0.000 | 0.000 | 0.000 | 0.242 | 0.141 | 0.066 | 0.104 | 0.207 | 0.138 | 0.232 | 0.370 |
| 65 | 0.000 | 0.000 | 0.000 | 0.235 | 0.132 | 0.061 | 0.098 | 0.198 | 0.120 | 0.220 | 0.363 |
| 70 | 0.000 | 0.000 | 0.000 | 0.228 | 0.124 | 0.056 | 0.093 | 0.190 | 0.104 | 0.209 | 0.355 |
| 75 | 0.000 | 0.000 | 0.000 | 0.223 | 0.117 | 0.053 | 0.088 | 0.183 | 0.093 | 0.200 | 0.349 |
Table A7.
Bond angle of O—HO as a function of pressure in Mg-endmember phase D (Mg-phD), Al-endmember phase D (Al-phD), and tie-line composition in the 88-1 and 88-2 structures as a function of pressure from 0 to 75 GPa.
Table A7.
Bond angle of O—HO as a function of pressure in Mg-endmember phase D (Mg-phD), Al-endmember phase D (Al-phD), and tie-line composition in the 88-1 and 88-2 structures as a function of pressure from 0 to 75 GPa.
| P (GPa) | Mg-phD | Al-phD | 88-1 | 88-2 | |||||||
|---|---|---|---|---|---|---|---|---|---|---|---|
| 0 | 175.0 | 175.7 | 177.8 | 179.3 | 173.5 | 174.8 | 174.1 | 175.6 | 175.0 | 174.6 | 172.3 |
| 5 | 176.0 | 176.5 | 178.2 | 179.4 | 174.1 | 175.5 | 174.5 | 176.0 | 175.8 | 174.9 | 172.8 |
| 10 | 176.8 | 177.2 | 178.5 | 179.4 | 174.6 | 176.1 | 174.7 | 176.3 | 176.3 | 175.0 | 173.2 |
| 15 | 177.5 | 177.7 | 178.8 | 179.3 | 174.9 | 176.6 | 174.9 | 176.6 | 176.7 | 175.0 | 173.5 |
| 20 | 178.0 | 178.3 | 179.0 | 179.2 | 175.2 | 177.0 | 175.0 | 176.7 | 176.9 | 174.2 | 173.7 |
| 25 | 178.5 | 178.9 | 179.7 | 179.1 | 175.4 | 177.3 | 175.0 | 177.0 | 174.8 | 174.2 | 174.7 |
| 30 | 178.9 | 179.2 | 179.7 | 179.1 | 175.6 | 177.6 | 175.0 | 177.1 | 174.9 | 174.2 | 174.7 |
| 35 | 179.3 | 179.8 | 179.8 | 179.0 | 175.8 | 177.7 | 175.0 | 177.2 | 175.0 | 174.2 | 174.6 |
| 40 | 179.7 | 180.0 | 180.0 | 178.9 | 175.9 | 177.8 | 175.0 | 177.2 | 175.1 | 174.2 | 174.6 |
| 45 | 180.0 | 180.0 | 180.0 | 178.9 | 176.0 | 177.9 | 175.0 | 177.2 | 175.2 | 174.1 | 174.5 |
| 50 | 180.0 | 180.0 | 180.0 | 178.8 | 176.0 | 177.9 | 175.0 | 177.2 | 175.2 | 174.0 | 174.5 |
| 55 | 180.0 | 180.0 | 180.0 | 178.8 | 176.1 | 177.9 | 174.9 | 177.2 | 175.2 | 173.9 | 174.4 |
| 60 | 180.0 | 180.0 | 180.0 | 178.8 | 176.1 | 177.8 | 174.9 | 177.2 | 175.3 | 173.8 | 174.3 |
| 65 | 180.0 | 180.0 | 180.0 | 178.8 | 176.1 | 177.8 | 174.8 | 177.1 | 175.2 | 173.7 | 174.2 |
| 70 | 180.0 | 180.0 | 180.0 | 178.7 | 176.2 | 177.8 | 174.8 | 177.1 | 175.2 | 173.6 | 174.1 |
| 75 | 180.0 | 180.0 | 180.0 | 178.7 | 176.2 | 177.7 | 174.8 | 177.1 | 175.2 | 173.4 | 174.0 |
Table A8.
Elastic constants of Mg-endmember phase D as a function of pressure, in units of GPa, Part 1 of 2.
Table A8.
Elastic constants of Mg-endmember phase D as a function of pressure, in units of GPa, Part 1 of 2.
| P (GPa) | C11 | C22 | C33 | C44 | C55 | C66 | C12 | C13 | C14 | C15 | C16 |
|---|---|---|---|---|---|---|---|---|---|---|---|
| 0.01 | 384 | 376 | 265 | 96 | 93 | 108 | 114 | 48 | 3 | −2 | 71 |
| 5.01 | 418 | 411 | 307 | 111 | 108 | 122 | 129 | 64 | 5 | −4 | 79 |
| 10.01 | 450 | 444 | 344 | 125 | 120 | 129 | 143 | 81 | 5 | −7 | 83 |
| 15.01 | 481 | 475 | 381 | 137 | 132 | 136 | 158 | 97 | 6 | −9 | 87 |
| 19.99 | 511 | 504 | 417 | 149 | 144 | 142 | 173 | 113 | 7 | −11 | 91 |
| 25.00 | 536 | 531 | 448 | 161 | 156 | 145 | 187 | 127 | 8 | −11 | 94 |
| 30.00 | 567 | 561 | 486 | 171 | 165 | 153 | 203 | 151 | 9 | −14 | 98 |
| 35.00 | 594 | 588 | 525 | 182 | 176 | 157 | 218 | 168 | 9 | −16 | 101 |
| 40.01 | 621 | 615 | 632 | 193 | 186 | 162 | 233 | 184 | 10 | −17 | 104 |
| 44.98 | 646 | 639 | 671 | 201 | 194 | 166 | 247 | 201 | 11 | −19 | 107 |
| 50.00 | 671 | 664 | 697 | 209 | 201 | 170 | 261 | 217 | 12 | −21 | 109 |
| 54.98 | 695 | 687 | 720 | 216 | 208 | 174 | 275 | 232 | 12 | −22 | 112 |
| 60.00 | 719 | 710 | 744 | 224 | 215 | 177 | 289 | 248 | 13 | −24 | 114 |
| 64.97 | 739 | 732 | 763 | 230 | 222 | 179 | 303 | 263 | 13 | −26 | 117 |
| 70.01 | 765 | 756 | 791 | 238 | 229 | 184 | 317 | 278 | 14 | −27 | 119 |
| 74.97 | 787 | 778 | 813 | 244 | 235 | 187 | 331 | 293 | 14 | −29 | 121 |
Table A9.
Elastic constants of Mg-endmember phase D as a function of pressure, in units of GPa, Part 2 of 2.
Table A9.
Elastic constants of Mg-endmember phase D as a function of pressure, in units of GPa, Part 2 of 2.
| P (GPa) | C23 | C24 | C25 | C26 | C34 | C35 | C36 | C45 | C46 | C56 |
|---|---|---|---|---|---|---|---|---|---|---|
| 0.01 | 50 | 10 | 11 | −71 | 27 | 21 | 5 | −25 | 21 | 15 |
| 5.01 | 67 | 8 | 14 | −77 | 27 | 22 | 6 | −30 | 25 | 16 |
| 10.01 | 84 | 7 | 16 | −81 | 27 | 22 | 8 | −33 | 27 | 17 |
| 15.01 | 101 | 6 | 17 | −85 | 28 | 22 | 9 | −37 | 29 | 17 |
| 19.99 | 119 | 6 | 19 | −90 | 28 | 23 | 10 | −40 | 31 | 18 |
| 25.00 | 132 | 6 | 21 | −93 | 28 | 23 | 10 | −43 | 32 | 19 |
| 30.00 | 155 | 4 | 23 | −97 | 29 | 23 | 10 | −46 | 34 | 19 |
| 35.00 | 173 | 4 | 24 | −100 | 29 | 23 | 11 | −49 | 36 | 19 |
| 40.01 | 192 | 3 | 26 | −104 | 30 | 25 | 14 | −51 | 38 | 20 |
| 44.98 | 209 | 3 | 27 | −106 | 31 | 25 | 14 | −54 | 40 | 21 |
| 50.00 | 224 | 2 | 29 | −109 | 31 | 25 | 14 | −56 | 42 | 22 |
| 54.98 | 240 | 1 | 31 | −112 | 31 | 25 | 15 | −58 | 43 | 23 |
| 60.00 | 255 | 0 | 32 | −114 | 31 | 25 | 15 | −60 | 45 | 23 |
| 64.97 | 270 | 0 | 35 | −115 | 33 | 27 | 15 | −61 | 48 | 25 |
| 70.01 | 286 | −1 | 35 | −119 | 31 | 26 | 15 | −63 | 48 | 25 |
| 74.97 | 301 | −2 | 37 | −121 | 32 | 26 | 16 | −65 | 50 | 26 |
Table A10.
Elastic constants of Al-endmember phase D as a function of pressure, in units of GPa, Part 1 of 2.
Table A10.
Elastic constants of Al-endmember phase D as a function of pressure, in units of GPa, Part 1 of 2.
| P (GPa) | C11 | C22 | C33 | C44 | C55 | C66 | C12 | C13 | C14 | C15 | C16 |
|---|---|---|---|---|---|---|---|---|---|---|---|
| 0.01 | 410 | 411 | 379 | 185 | 169 | 110 | 118 | 83 | 1 | 30 | 75 |
| 5.00 | 448 | 449 | 414 | 206 | 189 | 119 | 130 | 102 | 1 | 26 | 82 |
| 10.01 | 484 | 484 | 447 | 225 | 205 | 128 | 143 | 121 | 0 | 25 | 88 |
| 15.01 | 515 | 516 | 479 | 242 | 221 | 135 | 156 | 139 | 0 | 25 | 93 |
| 20.00 | 546 | 546 | 513 | 259 | 235 | 144 | 170 | 157 | 0 | 26 | 98 |
| 24.99 | 574 | 575 | 551 | 275 | 250 | 149 | 182 | 173 | 0 | 26 | 102 |
| 29.99 | 606 | 606 | 638 | 292 | 266 | 157 | 197 | 200 | 0 | 28 | 107 |
| 35.00 | 633 | 632 | 651 | 304 | 276 | 162 | 210 | 214 | 0 | 27 | 111 |
| 40.00 | 660 | 659 | 686 | 316 | 287 | 167 | 223 | 232 | 0 | 28 | 114 |
| 45.03 | 686 | 685 | 710 | 328 | 298 | 172 | 236 | 248 | 0 | 28 | 118 |
| 49.98 | 712 | 710 | 733 | 339 | 307 | 176 | 249 | 263 | −1 | 28 | 121 |
| 54.96 | 737 | 734 | 755 | 350 | 317 | 180 | 262 | 278 | −1 | 29 | 124 |
| 60.01 | 761 | 759 | 778 | 360 | 327 | 184 | 275 | 294 | −1 | 29 | 126 |
| 64.99 | 786 | 783 | 801 | 371 | 336 | 189 | 288 | 309 | −2 | 29 | 129 |
| 69.98 | 809 | 806 | 823 | 381 | 345 | 193 | 301 | 324 | −2 | 29 | 132 |
| 74.99 | 833 | 829 | 845 | 391 | 354 | 197 | 314 | 339 | −2 | 29 | 134 |
Table A11.
Elastic constants of Al-endmember phase D as a function of pressure, in units of GPa, Part 2 of 2.
Table A11.
Elastic constants of Al-endmember phase D as a function of pressure, in units of GPa, Part 2 of 2.
| P (GPa) | C23 | C24 | C25 | C26 | C34 | C35 | C36 | C45 | C46 | C56 |
|---|---|---|---|---|---|---|---|---|---|---|
| 0.01 | 86 | 32 | −4 | −76 | 47 | 39 | 5 | −48 | 5 | 10 |
| 5.00 | 106 | 30 | −2 | −82 | 46 | 38 | 6 | −54 | 7 | 12 |
| 10.01 | 125 | 30 | −2 | −88 | 45 | 38 | 8 | −59 | 9 | 12 |
| 15.01 | 143 | 30 | −2 | −93 | 46 | 38 | 9 | −63 | 9 | 13 |
| 20.00 | 162 | 30 | −2 | −98 | 46 | 38 | 9 | −68 | 9 | 13 |
| 24.99 | 180 | 30 | −3 | −102 | 44 | 37 | 11 | −72 | 9 | 13 |
| 29.99 | 206 | 32 | −3 | −107 | 49 | 41 | 11 | −76 | 9 | 13 |
| 35.00 | 221 | 32 | −3 | −110 | 48 | 40 | 11 | −79 | 9 | 13 |
| 40.00 | 238 | 33 | −3 | −114 | 50 | 41 | 12 | −83 | 9 | 13 |
| 45.03 | 254 | 33 | −4 | −117 | 50 | 42 | 12 | −86 | 9 | 13 |
| 49.98 | 270 | 33 | −4 | −120 | 50 | 42 | 13 | −88 | 9 | 13 |
| 54.96 | 285 | 33 | −4 | −123 | 51 | 42 | 13 | −91 | 9 | 13 |
| 60.01 | 301 | 33 | −4 | −126 | 51 | 42 | 13 | −94 | 10 | 14 |
| 64.99 | 316 | 33 | −5 | −129 | 51 | 43 | 14 | −97 | 10 | 14 |
| 69.98 | 332 | 33 | −5 | −132 | 51 | 43 | 14 | −99 | 10 | 14 |
| 74.99 | 347 | 34 | −5 | −134 | 52 | 43 | 14 | −102 | 10 | 14 |
Table A12.
Elastic constants of phase D with 50% Al-substitution, in which the aluminum atoms were distributed randomly across eight unit cells, also known as configuration 88-1. Elastic constants are presented as as a function of pressure, in units of GPa. Part 1 of 2.
Table A12.
Elastic constants of phase D with 50% Al-substitution, in which the aluminum atoms were distributed randomly across eight unit cells, also known as configuration 88-1. Elastic constants are presented as as a function of pressure, in units of GPa. Part 1 of 2.
| P (GPa) | C11 | C22 | C33 | C44 | C55 | C66 | C12 | C13 | C14 | C15 | C16 |
|---|---|---|---|---|---|---|---|---|---|---|---|
| 0.01 | 409 | 409 | 335 | 121 | 120 | 125 | 94 | 62 | 2 | −1 | −1 |
| 4.98 | 445 | 445 | 376 | 136 | 136 | 136 | 107 | 81 | 4 | −2 | 0 |
| 10.03 | 479 | 479 | 415 | 150 | 150 | 143 | 121 | 101 | 5 | −4 | −1 |
| 14.97 | 511 | 511 | 451 | 163 | 163 | 152 | 134 | 119 | 6 | −4 | 0 |
| 20.00 | 542 | 541 | 487 | 175 | 174 | 160 | 148 | 138 | 8 | −5 | 0 |
| 25.02 | 571 | 571 | 522 | 186 | 186 | 167 | 161 | 156 | 8 | −6 | 0 |
| 30.00 | 600 | 600 | 563 | 196 | 196 | 173 | 174 | 172 | 10 | −7 | 0 |
| 34.98 | 627 | 627 | 602 | 206 | 206 | 179 | 188 | 191 | 11 | −8 | 0 |
| 40.00 | 654 | 654 | 634 | 215 | 215 | 185 | 201 | 207 | 12 | −9 | 0 |
| 44.98 | 680 | 680 | 645 | 224 | 224 | 191 | 214 | 223 | 12 | −10 | 0 |
| 50.00 | 707 | 706 | 672 | 233 | 233 | 196 | 228 | 240 | 13 | −10 | 0 |
| 54.97 | 732 | 732 | 698 | 241 | 241 | 201 | 241 | 256 | 14 | −11 | 0 |
| 60.01 | 757 | 757 | 724 | 249 | 249 | 206 | 254 | 272 | 15 | −12 | 0 |
| 64.97 | 781 | 781 | 749 | 257 | 257 | 211 | 267 | 287 | 16 | −13 | 0 |
| 70.00 | 806 | 806 | 773 | 265 | 265 | 218 | 281 | 303 | 17 | −13 | 0 |
| 74.97 | 829 | 829 | 797 | 273 | 273 | 222 | 294 | 319 | 17 | −14 | 0 |
Table A13.
Elastic constants of phase D with 50% Al-substitution, in which the aluminum atoms were distributed randomly across eight unit cells, also known as configuration 88-1. Elastic constants are presented as as a function of pressure, in units of GPa. Part 2 of 2.
Table A13.
Elastic constants of phase D with 50% Al-substitution, in which the aluminum atoms were distributed randomly across eight unit cells, also known as configuration 88-1. Elastic constants are presented as as a function of pressure, in units of GPa. Part 2 of 2.
| P (GPa) | C23 | C24 | C25 | C26 | C34 | C35 | C36 | C45 | C46 | C56 |
|---|---|---|---|---|---|---|---|---|---|---|
| 0.01 | 62 | −2 | 2 | -1 | 1 | 3 | 1 | 0 | 5 | 4 |
| 4.98 | 81 | −2 | 4 | 0 | 4 | 4 | 0 | 0 | 2 | 6 |
| 10.03 | 101 | −4 | 5 | 0 | 4 | 4 | 0 | 0 | 8 | 8 |
| 14.97 | 119 | −4 | 6 | 0 | 5 | 5 | 0 | 0 | 9 | 9 |
| 20.00 | 138 | −5 | 7 | 0 | 6 | 6 | 0 | 0 | 10 | 10 |
| 25.02 | 156 | −6 | 9 | 0 | 5 | 6 | −1 | 0 | 11 | 11 |
| 30.00 | 172 | −7 | 10 | 0 | 6 | 6 | 0 | 0 | 12 | 12 |
| 34.98 | 191 | −8 | 11 | 0 | 6 | 6 | 0 | 0 | 13 | 13 |
| 40.00 | 207 | −9 | 12 | 0 | 6 | 6 | 0 | 0 | 13 | 13 |
| 44.98 | 223 | −10 | 12 | 0 | 7 | 7 | 0 | 0 | 14 | 14 |
| 50.00 | 240 | −10 | 13 | 0 | 7 | 7 | 0 | 0 | 15 | 15 |
| 54.97 | 256 | −11 | 14 | 0 | 8 | 8 | 0 | 0 | 14 | 16 |
| 60.01 | 272 | −12 | 15 | 0 | 8 | 8 | 0 | 0 | 16 | 16 |
| 64.97 | 287 | −13 | 16 | 0 | 8 | 8 | 0 | 0 | 17 | 17 |
| 70.00 | 303 | −13 | 17 | 0 | 8 | 8 | 0 | 0 | 17 | 17 |
| 74.97 | 319 | −14 | 17 | 0 | 9 | 9 | 0 | 0 | 18 | 18 |
Table A14.
Elastic constants of phase D with 50% Al-substitution, in which the eight unit cells were individually end member composition, also known as configuration 88-2. Elastic constants are presented as as a function of pressure, in units of GPa. Part 1 of 2.
Table A14.
Elastic constants of phase D with 50% Al-substitution, in which the eight unit cells were individually end member composition, also known as configuration 88-2. Elastic constants are presented as as a function of pressure, in units of GPa. Part 1 of 2.
| P (GPa) | C11 | C22 | C33 | C44 | C55 | C66 | C12 | C13 | C14 | C15 | C16 |
|---|---|---|---|---|---|---|---|---|---|---|---|
| 0.01 | 358 | 394 | 286 | 107 | 103 | 113 | 107 | 50 | 4 | −6 | 0 |
| 5.02 | 409 | 433 | 336 | 122 | 123 | 126 | 117 | 79 | 5 | −8 | 0 |
| 10.02 | 449 | 462 | 373 | 133 | 139 | 137 | 131 | 96 | 5 | −11 | 0 |
| 15.04 | 485 | 499 | 424 | 148 | 153 | 146 | 143 | 119 | 7 | −12 | 0 |
| 20.02 | 517 | 531 | 458 | 161 | 165 | 156 | 156 | 137 | 8 | −11 | 0 |
| 25.03 | 548 | 559 | 495 | 176 | 177 | 162 | 168 | 157 | 10 | −12 | 0 |
| 30.00 | 578 | 587 | 526 | 189 | 186 | 169 | 180 | 174 | 11 | −12 | 0 |
| 34.98 | 607 | 618 | 556 | 196 | 196 | 175 | 193 | 191 | 12 | −12 | 0 |
| 40.00 | 635 | 646 | 586 | 206 | 206 | 182 | 206 | 208 | 13 | −12 | 0 |
| 44.98 | 662 | 672 | 615 | 216 | 215 | 188 | 218 | 224 | 13 | −13 | 0 |
| 50.01 | 689 | 699 | 645 | 227 | 224 | 193 | 231 | 241 | 14 | −13 | 0 |
| 54.98 | 713 | 725 | 681 | 234 | 232 | 199 | 244 | 255 | 16 | −14 | 0 |
| 60.01 | 736 | 750 | 709 | 243 | 241 | 203 | 256 | 270 | 16 | −14 | 0 |
| 64.98 | 764 | 775 | 735 | 251 | 249 | 208 | 270 | 287 | 17 | −15 | 0 |
| 70.01 | 788 | 800 | 771 | 259 | 257 | 212 | 282 | 305 | 18 | −15 | 0 |
| 74.97 | 812 | 823 | 782 | 267 | 264 | 217 | 295 | 319 | 18 | −16 | 0 |
Table A15.
Elastic constants of phase D with 50% Al-substitution, in which the eight unit cells were individually end member composition, also known as configuration 88-2. Elastic constants are presented as as a function of pressure, in units of GPa. Part 2 of 2.
Table A15.
Elastic constants of phase D with 50% Al-substitution, in which the eight unit cells were individually end member composition, also known as configuration 88-2. Elastic constants are presented as as a function of pressure, in units of GPa. Part 2 of 2.
| P (GPa) | C23 | C24 | C25 | C26 | C34 | C35 | C36 | C45 | C46 | C56 |
|---|---|---|---|---|---|---|---|---|---|---|
| 0.01 | 67 | 4 | 7 | −1 | 16 | 1 | 5 | 0 | 6 | 9 |
| 5.02 | 85 | 1 | 8 | −1 | 13 | 6 | 3 | 0 | 8 | 11 |
| 10.02 | 103 | 2 | 9 | 0 | 12 | 2 | 3 | 1 | 9 | 12 |
| 15.04 | 122 | −1 | 11 | 0 | 13 | 3 | 3 | 0 | 11 | 13 |
| 20.02 | 139 | −2 | 12 | 0 | 13 | 5 | 3 | 0 | 12 | 12 |
| 25.03 | 156 | −6 | 12 | 0 | 7 | 7 | 2 | 0 | 14 | 14 |
| 30.00 | 172 | −6 | 13 | −1 | 8 | 7 | 2 | −1 | 15 | 15 |
| 34.98 | 189 | −6 | 13 | 0 | 10 | 7 | 2 | 0 | 15 | 15 |
| 40.00 | 205 | −6 | 14 | 0 | 10 | 7 | 2 | 0 | 16 | 16 |
| 44.98 | 221 | −9 | 15 | 0 | 8 | 7 | 2 | 0 | 17 | 17 |
| 50.00 | 238 | −9 | 15 | 0 | 9 | 7 | 3 | 0 | 17 | 17 |
| 54.97 | 253 | −8 | 16 | 0 | 11 | 7 | 3 | 0 | 18 | 18 |
| 60.01 | 269 | −9 | 16 | 0 | 11 | 7 | 3 | 0 | 19 | 18 |
| 64.97 | 284 | −10 | 17 | 0 | 12 | 7 | 3 | 0 | 19 | 19 |
| 70.00 | 303 | −10 | 18 | 0 | 10 | 7 | 3 | 0 | 20 | 20 |
| 74.97 | 317 | −11 | 18 | 0 | 12 | 7 | 3 | 0 | 21 | 21 |
Table A16.
Maximum shear wave polarization anisotropy (AVS) of Mg-endmember phase D [MgSi2O4(OH)2], Al-endmember phase D [Al2SiO4(OH)2], and phase D with 50% Al-substitution [AlMg0.5Si1.5O4(OH)2].
Table A16.
Maximum shear wave polarization anisotropy (AVS) of Mg-endmember phase D [MgSi2O4(OH)2], Al-endmember phase D [Al2SiO4(OH)2], and phase D with 50% Al-substitution [AlMg0.5Si1.5O4(OH)2].
| P (GPa) | Mg-PhD | Al-PhD | 88-1 | 88-2 |
|---|---|---|---|---|
| 0 | 21.86 | 10.65 | 13.48 | 14.87 |
| 5 | 15.79 | 10.16 | 11.43 | 13.27 |
| 10 | 12.96 | 9.70 | 9.72 | 11.30 |
| 15 | 11.62 | 11.49 | 8.74 | 10.4 |
| 20 | 10.32 | 13.02 | 8.01 | 9.43 |
| 25 | 9.37 | 14.59 | 7.26 | 8.51 |
| 30 | 8.88 | 16.23 | 6.89 | 7.74 |
| 35 | 6.56 | 17.08 | 6.59 | 7.77 |
| 40 | 9.95 | 17.74 | 6.38 | 7.44 |
| 45 | 9.08 | 18.04 | 6.27 | 7.15 |
| 50 | 9.36 | 18.36 | 6.25 | 6.71 |
| 55 | 8.03 | 18.84 | 6.31 | 7.04 |
| 60 | 8.04 | 19.14 | 6.83 | 6.98 |
| 65 | 7.91 | 19.36 | 7.32 | 7.37 |
| 70 | 6.92 | 19.84 | 7.68 | 7.57 |
| 75 | 6.24 | 20.12 | 8.11 | 8.5 |
References
- Ohtani, E.; Litasov, K.; Hosoya, T.; Kubo, T.; Kondo, T. Water transport into the deep mantle and formation of a hydrous transition zone. Phys. Earth Planet. Inter. 2004, 143–144, 255–269. [Google Scholar] [CrossRef]
- Xu, C.; Inoue, T. Melting of Al-rich phase D up to the uppermost lower mantle and transportation of H2O to the deep Earth. Geochem. Geophys. Geosyst. 2019, 20, 4382–4389. [Google Scholar] [CrossRef]
- Kanzaki, M. Stability of hydrous magnesium silicates in the mantle transition zone. Phys. Earth Planet. Sci. 1991, 66, 307–312. [Google Scholar] [CrossRef]
- Ohtani, E.; Toma, M.; Litasov, K.; Kubo, T.; Suzuki, A. Stability of dense hydrous magnesium silicates and water storage capacity in the transition zone and lower mantle. Phys. Earth Planet. Inter. 2001, 124, 105–117. [Google Scholar] [CrossRef]
- Poli, S.; Schmidt, M. Petrology of subducted slabs. Annu. Rev. Earth Planet. Sci. 2002, 30, 207–235. [Google Scholar] [CrossRef]
- Iwamori, H. Phase relations of peridotites under H2O saturated conditions and ability of subducting plates for transportation of H2O. Earth Planet. Sci. Lett. 2004, 227, 57–71. [Google Scholar] [CrossRef]
- Ghosh, S.; Schmidt, M. Melting of phase D in the lower mantle and implications for recycling and storage of H2O in the deep mantle. Geochim. Cosmochim. Acta 2014, 145, 72–88. [Google Scholar] [CrossRef]
- Liu, X.; Matsukage, K.; Nishihara, Y.; Suzuki, T.; Takahashi, E. Stability of the hydrous phases of Al-rich phase D and Al-rich phase H in deep subducted oceanic crust. Am. Mineral. 2019, 104, 64–72. [Google Scholar] [CrossRef]
- Shieh, S.; Mao, H.K.; Hemley, R.; Ming, L. Decomposition of phase D in the lower mantle and the fate of dense hydrous silicates in subducting slabs. Earth Planet. Sci. Lett. 1998, 159, 13–23. [Google Scholar] [CrossRef]
- Litasov, K.; Ohtani, E. Effect of water on the phase relations in Earth’s mantle and deep water cycle. In Advances in High-Pressure Mineralogy; Geological Society of America: Boulder, CO, USA, 2007. [Google Scholar] [CrossRef]
- Nishi, M.; Irifune, T.; Tsuchiya, J.; Tange, Y.; Higo, Y. Stability of hydrous silicate at high pressures and water transport to the deep lower mantle. Nat. Geosci. 2014, 7, 224–227. [Google Scholar] [CrossRef]
- Liu, G.; Liu, L.; Yang, L.; Yi, L.; Li, Y.; Liu, H.; Gao, Y.; Zhuang, C.; Li, S. Crystal structure and elasticity of Al-bearing phase H under high pressure. AIP D 2018, 8, 055219. [Google Scholar] [CrossRef]
- Sano, A.; Ohtani, E.; Kondo, T.; Hirao, N.; Sakai, T.; Sata, N.; Ohishi, Y.; Kikegawa, T. Aluminous hydrous mineral δ-AlOOH as a carrier of hydrogen into the core-mantle boundary. Geophys. Res. Lett. 2008, 35, L03303. [Google Scholar] [CrossRef]
- Panero, W.; Caracas, R. Stability and solid solutions of hydrous alumino-silicates in the Earth’s mantle. Minerals 2020, 10, 330. [Google Scholar] [CrossRef]
- Ohtani, E.; Amaike, Y.; Kamada, S.; Sakamaki, T.; Hirao, N. Stability of hydrous phase H MgSiO4H2 under lower mantle conditions. Geophys. Res. Lett. 2014, 41, 8283–8287. [Google Scholar] [CrossRef]
- Pamato, M.; Myhill, R.; Boffa Ballaran, T.; Frost, D.; Heidelbach, F.; Miyajima, N. Lower-mantle water reservoir implied by the extreme stability of a hydrous aluminosilicate. Nat. Geosci. 2015, 8, 75–79. [Google Scholar] [CrossRef]
- Xu, C.; Inoue, T.; Kakizawa, S.; Noda, M.; Gao, J. Effect of Al on the stability of dense hydrous magnesium silicate phases to the uppermost lower mantle: Implications for water transportation into the deep mantle. Phys. Chem. Miner. 2021, 48, 31. [Google Scholar] [CrossRef]
- Nakatsuka, A.; Yoshiasa, A.; Ohkawa, M.; Ito, E. Aluminous hydrous magnesium silicate as a lower-mantle hydrogen reservoir: A role as an agent for material transport. Sci. Rep. 2022, 12, 3594. [Google Scholar] [CrossRef]
- Boffa Ballaran, T.; Frost, D.; Miyajima, N.; Heidelbach, F. The structure of a super-aluminous version of the dense hydrous-magnesium silicate phase D. Am. Mineral. 2003, 95, 1113–1116. [Google Scholar] [CrossRef]
- Ohtani, E. The role of water in Earth’s mantle. Natl. Sci. Rev. 2020, 7, 224–232. [Google Scholar] [CrossRef]
- Ohira, I.; Ohtani, E.; Sakai, T.; Miyahara, M.; Hirao, N.; Ohishi, Y.; Nishijima, M. Stability of a hydrous δ-phase, AlOOH-MgSiO2(OH)2, and a mechanism for water transport into the base of the lower mantle. Earth Planet. Sci. Lett. 2014, 401, 12–17. [Google Scholar] [CrossRef]
- Yang, H.; Prewitt, C.; Frost, D. Crystal structure of the dense hydrous magnesium silicate, phase D. Am. Min. 1997, 82, 651–654. [Google Scholar] [CrossRef]
- Momma, K.; Izumi, F. VESTA: A three-dimensional visualization system for electronic and structural analysis. J. Appl. Crystallogr. 2008, 41, 653–658. [Google Scholar] [CrossRef]
- Tsuchiya, J.; Tsuchiya, T.; Tsuneyuki, S. First-principles study of hydrogen bond symmetrization of phase D under high pressure. Am. Mineral. 2005, 90, 44–49. [Google Scholar] [CrossRef]
- Hushur, A.; Manghnani, M.; Smyth, J.; Williams, Q.; Hellebrand, E.; Lonappan, D.; Ye, Y.; Dera, P.; Frost, D. Hydrogen bond symmetrization and equation of state of phase D. J. Geophys. Res. Solid Earth 2011, 116, B06203. [Google Scholar] [CrossRef]
- Tsuchiya, J.; Tsuchiya, T. Elastic properties of phase D (MgSi2O6H2) under pressure: Ab initio investigation. Phys. Earth Planet. Inter. 2008, 170, 215–220. [Google Scholar] [CrossRef]
- Mainprice, D.; Le Page, Y.; Rodgers, J.; Jouanna, P. Predicted elastic properties of the hydrous D phase at mantle pressures: Implications for the anisotropy of subducted slabs near 670 km discontinuity and in the lower mantle. Earth Planet. Sci. Lett. 2007, 259, 283–296. [Google Scholar] [CrossRef]
- Giannozzi, P.; Baroni, S.; Bonini, N.; Calandra, M.; Car, R.; Cavazzoni, C.; Ceresoli, D.; Chiarotti, G.; Cococcioni, M.; Dabo, I.; et al. Quantum ESPRESSO: A modular and open-source software project for quantum simulations of materials. J. Phys. Condens. Matter 2009, 21, 395502. [Google Scholar] [CrossRef]
- Perdew, J.P.; Burke, K.; Ernzerhof, M. Generalized gradient approximation made simple. Phys. Rev. Lett. 1996, 77, 3865–3868. [Google Scholar] [CrossRef]
- Hamann, D. H2O hydrogen bonding in density-functional theory. Phys. Rev. B 1997, 55, R10157. [Google Scholar] [CrossRef]
- Umemoto, K.; Wentzcovitch, R. Theoretical study of the isostructural transformation in ice VIII. Phys. Rev. B 1991, 43, 1993–2006. [Google Scholar] [CrossRef]
- Grimme, S.; Antony, J.; Ehrlich, S.; Krief, H. A consistent and accurate ab initio parametrization of density functional dispersion correction (DFT-D) for the 94 elements H-Pu. J. Chem. Phys. 2010, 132, 154104. [Google Scholar] [CrossRef] [PubMed]
- Troullier, N.; Martins, J. Efficient pseudopotentials for planewave calculations. Phys. Rev. B 1991, 43, 1993–2006. [Google Scholar] [CrossRef] [PubMed]
- Monkhorst, H.; Pack, J. Special points for Brillouin-zone integrations. Phys. Rev. B 1976, 13, 5188–5192. [Google Scholar] [CrossRef]
- Karki, B.B.; Stixrude, L.; Wentzcovitch, R.M. High-pressure elastic properties of major materials of Earth’s mantle from first principles. Rev. Geophys. 2001, 39, 507–534. [Google Scholar] [CrossRef]
- Litasov, K.; Ohtani, E.; Suzuki, A.; Funakoshi, K. The compressibility of Fe- and Al-bearing phase D to 30 GPa. Phys. Chem. Miner. 2007, 34, 159–167. [Google Scholar] [CrossRef]
- Frost, D.; Fei, Y. Stability of phase D at high pressure and high temperature. J. Geophys. Res. 1998, 103, 7463–7474. [Google Scholar] [CrossRef]
- Thompson, E.; Campbell, A.; Zhenxian, L. In-situ infrared spectroscopic studies of hydroxyl in amphiboles at high pressure. Am. Mineral. 2016, 101, 706–712. [Google Scholar] [CrossRef]
- Litasov, K.; Ohtani, E.; Nishihara, Y.; Suzuki, A.; Funakoshi, K. Thermal equation of state of Al- and Fe-bearing phase D. J. Geophys. Res. 2008, 113, B08205. [Google Scholar] [CrossRef]
- Frost, D.; Fei, Y. Static compression of the hydrous magnesium silicate phase D to 30 GPa at room temperature. Phys. Chem. Miner. 1999, 26, 415–418. [Google Scholar] [CrossRef]
- Shinmei, T.; Irifune, T.; Tsuchiya, J.; Funakoshi, K.I. Phase transition and compression behavior of phase D up to 46 GPa using multi-anvil apparatus with sintered diamond anvils. High Press. Res. 2008, 28, 13–23. [Google Scholar] [CrossRef]
- Sano-Furukawa, A.; Hattori, T.; Komatsu, K.; Nagai, T.; Molaison, J.; dos Santos, A.; Tulk, C. Direct observation of symmetrization of hydrogen bond in δ-AlOOH and δ-AlOOD under mantle conditions using neutron diffraction. Sci. Rep. 2018, 8, 15520. [Google Scholar] [CrossRef] [PubMed]
- Rosa, A.; Mezouar, M.; Garbarino, G.; Bouvier, P.; Ghosh, S.; Rohrbach, A.; Sanchez-Valle, C. Single-crystal equation of state of phase D to lower mantle pressures and the effect of hydration on the buoyancy of deep subducted slabs. J. Geophys. Res. Solid Earth 2013, 118, 6124–6133. [Google Scholar] [CrossRef]
- Sano-Furukawa, A.; Kagi, H.; Nagai, T.; Nakano, S.; Fukura, S.; Ushijim, D.; Iizuka, E.; Yagi, T. Change in compressibility of δ-AlOOD and δ-AlOOH at high pressure: A study of isotope effect and hydrogen-bond symmetrization. Am. Mineral. 2009, 94, 1255–1261. [Google Scholar] [CrossRef]
- Sano-Furukawa, A.; Yagi, T.; Okada, T.; Gotou, H.; Kilegawa, T. Compression behaviors of distorted rutile-type hydrous phases, MOOH (M = Ga, In, Cr) and CrOOD. Phys. Chem. Miner. 2012, 39, 375–383. [Google Scholar] [CrossRef]
- Kuribayashi, T.; Sano-Furukawa, A.; Nagase, T. Observation of pressure-induced phase transition of δ-AlOOH by using single-crystal synchrotron X-ray diffraction method. Phys. Chem. Miner. 2014, 41, 303–312. [Google Scholar] [CrossRef]
- Thompson, E.; Davis, A.; Brauser, N.; Liu, Z.; Prakapenka, V.; Campbell, A. Transitions in ϵ-FeOOH at high pressure and ambient temperature. Am. Min. 2020, 105, 1769–1777. [Google Scholar] [CrossRef]
- Birch, F. Finite elastic strain of cubic crystals. Phys. Rev. 1947, 71, 809. [Google Scholar] [CrossRef]
- Xu, C.; Gréaux, S.; Inoue, T.; Noda, M.; Sun, W.; Kuwahara, H.; Higo, Y. Sound velocities of Al-Bearing Phase D up to 22 GPa and 1300 K. Geophys. Res. Lett. 2020, 47, e2020GL088877. [Google Scholar] [CrossRef]
- Tsuchiya, J.; Tsuchiya, T.; Wentzcovitch, R. Vibrational properties of δ-AlOOH under pressure. Am. Mineral. 2008, 93, 477–482. [Google Scholar] [CrossRef]
- Hill, R. The elastic behavior of a crystalline aggregate. Proc. Phys. Soc. A 1952, 65, 349–354. [Google Scholar] [CrossRef]
- Rosa, A.; Sanchez-Valle, C.; Ghosh, S. Elasticity of phase D and implications for the degree of hydration of deep subducted slabs. Geophys. Res. Lett. 2012, 39, L06304. [Google Scholar] [CrossRef]
- Rosa, A.; Sanchez-Vale, C.; Nisr, C.; Evans, S.; Debord, R.; Merkel, S. Shear wave anisotropy in textured phase D and constraints on deep water recycling in subduction zones. Earth Planet. Sci. Lett. 2013, 377–378, 13–22. [Google Scholar] [CrossRef]
- Mainprice, D.; Hielscher, R.; Schaeben, H. Calculating Anisotropic Physical Properties from Texture Data Using MTEX Open Source Package; Geological Society: London, UK, 2011; Volume 360, pp. 175–192. [Google Scholar]
Figure 1.
Crystal structures of phase D at 0 GPa including: (a) Mg-endmember [MgSi2O4(OH)2] (one formula unit) and (b) disordered Al-endmember [Al2SiO4(OH)2] (two formula units). Images were generated in VESTA [23]. Aluminum atoms are aqua, magnesium atoms are orange, silicon atoms are dark blue, oxygen are red, and hydrogen are white spheres.

Figure 2.
Comparison of hydrogen bonding in Mg-endmember phase D before and after pressure induced hydrogen bond symmetrization. (a) shows the hydrogen off-center (HOC) structure at 0 GPa with asymmetrical O–HH bonding, where the dashed black lines indicate the longer but more compressible hydrogen bridge bonds (OH) and the solid black lines indicate the shorter but stiffer hydroxyl bonds (O–H). (b) at 70 GPa, the hydrogen are now centered (i.e., symmetric) with respect to the two neighboring oxygens. Images were generated in VESTA [23].

Figure 3.
The c/a ratio of Mg-endmember phase D (red circles), Al-endmember phase D (blue squares), and the tie-line composition in the 88-1 (purple triangles) and 88-2 structures (lavender diamonds). Grey symbols (open squares, crosses, open triangles, and open circles) show literature values from [25,27,36,37], respectively.

Figure 4.
Eulerian strain (f) versus normalized pressure (FE) of MgSi2O4(OH)2 (red circles), Al2SiO4(OH)2 (blue squares), and AlMg0.5Si1.5O4(OH)2 in the 88-1 structure (purple triangles) and 88-2 structure (lavender diamonds). In this plot, the intercept is , the slope reflects the deviation of the first derivative () from a value of 4, and curvature reflects the behavior of . This f–FE plot uses the values obtained from fitting a third-order Birch-Murnaghan equation of state, as indicated in lines 1, 7, 13, and 15 of Table 1. The blue and red dotted lines indicate discontinuities due to hydrogen bond symmetrization in the Al- and Mg-endmembers, respectively.

Figure 5.
Formula unit (f.u.) volumes of the optimized structures of MgSi2O4(OH)2 (red circles), Al2SiO4(OH)2 phase D (blue squares), AlMg0.5Si1.5O4(OH)2 in the 88-1 structure (purple triangles), and AlMg0.5Si1.5O4(OH)2 in the 88-2 structure (lavender diamonds). Dotted lines indicate equation of states (EOSs) fit to pre-hydrogen bond symmetrization structures (lines 3, 9, 13, and 15 of Table 1). Dashed lines are EOSs fit to post-hydrogen bond symmetrization structures (lines 5 and 11 of Table 1). Grey symbols (open squares, crosses, and open circles) show literature values from [25,36,37], respectively.

Figure 6.
The (a) C11, (b) C22, (c) C33, (d) C44, (e) C55, and (f) C66 elastic constants of MgSi2O4(OH)2 (red circles), AlMg0.5Si1.5O4(OH)2 (blue squares), AlMg0.5Si1.5O4(OH)2 in the 88-1 structure (dark purple triangles), and AlMg0.5Si1.5O4(OH)2 in the 88-2 structure (lavender diamonds).
Figure 6.
The (a) C11, (b) C22, (c) C33, (d) C44, (e) C55, and (f) C66 elastic constants of MgSi2O4(OH)2 (red circles), AlMg0.5Si1.5O4(OH)2 (blue squares), AlMg0.5Si1.5O4(OH)2 in the 88-1 structure (dark purple triangles), and AlMg0.5Si1.5O4(OH)2 in the 88-2 structure (lavender diamonds).

Figure 7.
(a) The moduli of phase D including bulk modulus (solid line) and shear modulus (dotted line), and (b) sound velocities of phase D including compressional velocity (solid line), and shear velocity (dotted line) of Mg-endmember phase D (red circles), Al-endmember phase D (blue squares), tie-line composition in the 88-1 structure (purple triangles) and the 88-2 structure (lavender diamonds).

Figure 8.
Lambert equal-area upper-hemisphere projection of the shear wave polarization (AVS) of phase D at 30 GPa, including (a) MgSi2O4(OH)2, (b) AlMg0.5Si1.5O4(OH)2, (c) AlMg0.5Si1.5O4(OH)2 in the 88-1 structure, and (d) AlMg0.5Si1.5O4(OH)2 in the 88-2 structure. Images were generated using the MTEX Open Source Package [54].

Table 1.
Equations of state parameters for phase D of varying compositions. The pressure range of each study is noted, and where the authors fit hydrogen off-center (HOC) and hydrogen-centered (HC) structures independently the structure is indicated in brackets. The structure of the tie-line compositions from this study are in brackets. Values in parentheses are uncertainties on the last digit as reported by the original authors.
| Study | Composition | Pressure (GPa) | V0 (Å3) | K0 (GPa) | K0′ |
|---|---|---|---|---|---|
| This study | MgSi2O4(OH)2 | 0–75 | 86.20 (4) | 145 (1) | 5.08 (4) |
| This study | MgSi2O4(OH)2 | 0–75 | 85.5 (2) | 173 (2) | 4 (fixed) |
| This study | MgSi2O4(OH)2 | 0–35 [HOC] | 86.14 (1) | 149.0 (3) | 4.79 (2) |
| This study | MgSi2O4(OH)2 | 0–35 [HOC] | 85.99 (4) | 160 (1) | 4 (fixed) |
| This study | MgSi2O4(OH)2 | 40–75 [HC] | 84.54 (9) | 182 (2) | 4.26 (5) |
| This study | MgSi2O4(OH)2 | 40–75 [HC] | 84.05 (3) | 194.6 (5) | 4 (fixed) |
| This study | Al2SiO4(OH)2 | 0–75 | 82.26 (2) | 186.9 (9) | 4.77 (3) |
| This study | Al2SiO4(OH)2 | 0–75 | 81.88 (9) | 209 (2) | 4 (fixed) |
| This study | Al2SiO4(OH)2 | 0–30 [HOC] | 82.25 (1) | 188.0 (9) | 4.67 (7) |
| This study | Al2SiO4(OH)2 | 0–30 [HOC] | 82.19 (4) | 197 (1) | 4 (fixed) |
| This study | Al2SiO4(OH)2 | 35–75 [HC] | 81.47 (9) | 212.4(3) | 4.21 (7) |
| This study | Al2SiO4(OH)2 | 35–75 [HC] | 81.20 (2) | 222.5 (5) | 4 (fixed) |
| This study | AlMg0.5Si1.5O4(OH)2 [88-1] | 0–75 | 83.81 (2) | 177.2 (8) | 4.61 (3) |
| This study | AlMg0.5Si1.5O4(OH)2 [88-1] | 0–75 | 83.47 (8) | 195 (1) | 4 (fixed) |
| This study | AlMg0.5Si1.5O4(OH)2 [88-2] | 0–75 | 84.50 (2) | 172.3 (8) | 4.57 (3) |
| This study | AlMg0.5Si1.5O4(OH)2 [88-2] | 0–75 | 84.16 (8) | 189 (1) | 4 (fixed) |
| [37] | Mg1.11Si1.89O6(H)2.22 | 0 to 19.8 | 85.46 (4) | 200 (7) | 4 (fixed) |
| [40] | Mg1.11Si1.6O6(H)3.4 | 0 to 30 | 85.66 (4) | 166 (3) | 4.1 (3) |
| [24] | MgSi2O6(H)2 | 0 to 40 [HOC] | 86.41 | 147.29 | 5.252 |
| [24] | MgSi2O6(H)2 | 40 to 65 [HC] | 84.93 | 185.80 | 4.209 |
| [36] | Mg0.89Fe0.14Al0.25Si1.56O6(H)2.93 | 0 to 30.5 | 86.10 (5) | 136.5 (33) | 6.32 (30) |
| [39] | Mg0.99Fe0.12Al0.09Si1.75O6(H)2.51 | 0 to 20.6 | 85.32 (2) | 141.5 (30) | 6.2 (4) |
| [41] | Mg1.02Si1.73O6(H)3.03 | 0 to 44 | 85.43 (4) | 130 (1) | 8.0 (2) |
| [25] | Mg1.0Si1.7O6(H)3.0 | 0 to 55.8 | 85.1 (2) | 167.9 (86) | 4.3 (5) |
| [25] | Mg1.0Si1.7O6(H)3.0 | 0 to 30 [HOC] | 85.1 (2) | 173 (2) | 4 (fixed) |
| [25] | Mg1.0Si1.7O6(H)3.0 | 40 to 55.8 [HC] | 85.1 (2) | 212 (15) | 4 (fixed) |
| [43] | Mg1.1Si1.8O6(H)2.5 | 0 to 65 | 85.80 (5) | 151.4 (12) | 4.89 (8) |
| [49] | Mg0.90Al0.64Si1.29O6(H)3.10 | 0 to 20.5 | 86.71 (fixed) | 143 (5) | 5.8 (7) |
Table 2.
Bulk () and shear () moduli of Mg-endmember phase D [MgSi2O4(OH)2], Al-endmember [Al2SiO4(OH)2], and tie-line composition in the 88-1 and 88-2 structures as a function of pressure from 0 to 75 GPa.
Table 2.
Bulk () and shear () moduli of Mg-endmember phase D [MgSi2O4(OH)2], Al-endmember [Al2SiO4(OH)2], and tie-line composition in the 88-1 and 88-2 structures as a function of pressure from 0 to 75 GPa.
| P (GPa) | Bulk Modulus (GPa) | Shear Modulus (GPa) | ||||||
|---|---|---|---|---|---|---|---|---|
| Mg-PhD | Al-PhD | 88-1 | 88-2 | Mg-PhD | Al-PhD | 88-1 | 88-2 | |
| 0 | 152.9 | 191.5 | 175.1 | 161.9 | 94.8 | 132.7 | 134.4 | 117.3 |
| 5 | 177.3 | 216.2 | 199.6 | 191.2 | 106.3 | 145.0 | 147.1 | 132.7 |
| 10 | 200.6 | 239.5 | 223.5 | 214.3 | 115.9 | 155.5 | 157.8 | 144.2 |
| 15 | 222.9 | 261.5 | 245.9 | 240.7 | 124.4 | 165.0 | 167.9 | 156.8 |
| 20 | 244.9 | 283.5 | 268.0 | 262.4 | 132.1 | 174.5 | 177.4 | 167.0 |
| 25 | 263.4 | 305.2 | 289.6 | 284.4 | 139.2 | 183.4 | 186.2 | 176.6 |
| 30 | 289.2 | 336.7 | 310.9 | 304.6 | 146.3 | 195.0 | 194.9 | 185.2 |
| 35 | 311.1 | 353.5 | 332.6 | 324.8 | 153.1 | 200.8 | 202.9 | 192.8 |
| 40 | 341.4 | 374.0 | 352.7 | 344.6 | 162.6 | 208.1 | 210.4 | 200.6 |
| 45 | 361.9 | 392.4 | 369.6 | 363.9 | 168.0 | 214.5 | 216.2 | 208.2 |
| 50 | 380.5 | 410.3 | 388.6 | 383.3 | 172.8 | 220.2 | 222.9 | 215.7 |
| 55 | 398.3 | 428.1 | 407.2 | 402.3 | 177.0 | 226.0 | 229.3 | 222.7 |
| 60 | 416.3 | 446.1 | 425.8 | 420.4 | 181.2 | 231.7 | 235.5 | 229.1 |
| 65 | 433.0 | 463.6 | 443.8 | 439.3 | 183.6 | 237.2 | 241.4 | 235.5 |
| 70 | 451.5 | 481.1 | 461.9 | 459.8 | 188.9 | 242.6 | 247.7 | 241.7 |
| 75 | 468.7 | 498.5 | 479.6 | 475.4 | 192.6 | 248.0 | 253.4 | 246.7 |
Publisher’s Note: MDPI stays neutral with regard to jurisdictional claims in published maps and institutional affiliations. |
© 2022 by the authors. Licensee MDPI, Basel, Switzerland. This article is an open access article distributed under the terms and conditions of the Creative Commons Attribution (CC BY) license (https://creativecommons.org/licenses/by/4.0/).
Share and Cite
MDPI and ACS Style
Thompson, E.C.; Campbell, A.J.; Tsuchiya, J. Calculated Elasticity of Al-Bearing Phase D. Minerals 2022, 12, 922. https://doi.org/10.3390/min12080922
AMA Style
Thompson EC, Campbell AJ, Tsuchiya J. Calculated Elasticity of Al-Bearing Phase D. Minerals. 2022; 12(8):922. https://doi.org/10.3390/min12080922
Chicago/Turabian StyleThompson, Elizabeth C., Andrew J. Campbell, and Jun Tsuchiya. 2022. "Calculated Elasticity of Al-Bearing Phase D" Minerals 12, no. 8: 922. https://doi.org/10.3390/min12080922
Note that from the first issue of 2016, this journal uses article numbers instead of page numbers. See further details here.