
Induced Polarization as a Tool to Assess Alteration in Geothermal Systems: A Review

1
Université Grenoble Alpes, Université Savoie Mont-Blanc, CNRS, UMR CNRS 5204, EDYTEM, 73370 Le Bourget du Lac, France
2
Earthquake Research Institute, The University of Tokyo, Tokyo 113-0032, Japan
*
Author to whom correspondence should be addressed.
Minerals 2021, 11(9), 962; https://doi.org/10.3390/min11090962
Submission received: 23 July 2021
/
Revised: 18 August 2021
/
Accepted: 29 August 2021
/
Published: 2 September 2021
(This article belongs to the Special Issue The Mineral Alteration Patterns under High- to Low-Temperature in Geothermal Fields)
Abstract
:The mineral alteration patterns in high- to low-temperature geothermal fields affect the induced polarization (electrical conductivity and chargeability) properties of volcanic rocks. Indeed, these properties are sensitive to the cation exchange capacity and the porosity of the rock, which are both dependent on the alteration path, temperature, and depth of burial. Therefore induced polarization tomography appears as a powerful non-intrusive geophysical method to investigate alteration patterns in geothermal fields. Among clay minerals, the production of smectite through prograde reactions occurs progressively in volcanic rocks up to 220 °C. The presence of smectite dominates the induced polarization response of the volcanic rocks because of its very large cation exchange capacity. It follows that induced polarization can be used as a non-intrusive temperature proxy up to 220 °C for both active and inactive geothermal fields, recording the highest temperatures reached in the past. The influence of magnetite and pyrite, two semi-conductors, also has a strong influence regarding the induced polarization properties of volcanic rocks. Various field examples are discussed to show how induced polarization can be used to image volcanic conduits and smectite-rich clay caps in volcanic areas for both stratovolcanoes and shield volcanoes.
1. Introduction
Alteration of rocks in geothermal systems associated with volcanoes is associated with the change of primary minerals to secondary minerals (especially involving the production of aluminosilicates like clays and zeolites, e.g., [1]). These transformations affect the texture of the porous materials, especially their porosity and cation exchange capacity [2,3,4,5,6]. Porosity itself is the result of both the change of the initial (depositional) porosity modified by compaction (through changes in the effective stress) and temperature. Various alteration processes occurring in geothermal fields can drastically modify porosity, especially in the presence of intensive ground water flow [7]. In turn, alteration affects the hydraulic and mechanical properties of the formations. A very well-known example is the alteration of peridotites at oceanic ridges by the circulation of sea water and the process of serpentinization. This process affects the porosity and mechanical strength of these rocks along the serpentinization path [8] and favors the production of magnetite [9]. Alteration paths exert a strong control regarding the associated hydrogeological and hydromechanical properties and mechanical behavior of geothermal systems and volcanoes [10,11,12,13]. It is well established that alteration controls the stability of volcanic edifices [14,15,16,17], eruptive activity (see [18,19]), and the exploration and production of geothermal resources [20,21,22,23].
Induced polarization is a geophysical technique first developed by Conrad Schlumberger in 1920 in the context of ore exploration [24]. Nowadays, both electrical conductivity and normalized chargeability can be independently imaged in field conditions at various scales (e.g., [25,26,27]), extending electrical conductivity tomography used in the last decade to image volcanic areas and geothermal systems [28,29,30,31,32]. Electrical conductivity represents the ability of rocks to conduct an electrical current under a prescribed electrical field. Normalized chargeability describes the ability of a porous material to store reversibly electrical charges under a slowing varying electrical field (i.e., characterized by a frequency smaller than 10 kHz). This low-frequency polarization mechanism is not related to dielectric polarization mechanisms. Dielectric mechanisms are observable at higher frequencies and associated with the displacement current in Ampère’s law. Induced polarization is due to polarization mechanisms associated with the electrical double layer around the clay particles and possibly zeolites (e.g., [33]). In Ampère’s law, they are associated with the dependence of the current density with the electrochemical potential gradients of the charge carriers [34,35].
At a given pore water salinity and temperature, electrical conductivity and induced polarization are controlled by the connected porosity and the cation exchange capacity of the porous materials [36,37,38]. The connected porosity is a geometric property characterizing the relative fractions of (connected) voids in a rock. The cation exchange capacity is a chemical property characterizing the amount of exchangeable electrical charges on the surface of the minerals per unit mass of grains. Any change in these two parameters may affect the two associated electrical properties, which can be in turn imaged with galvanometric and electromagnetic geophysical techniques. Since alteration influences both electrical conductivity and normalized chargeability, it can be non-intrusively observed and quantified through the induced polarization technique [5,39,40]. In the case where the production of smectite is controlled by prograde reactions, induced polarization can be used as a non-intrusive geothermometer up to 220 °C in both active and inactive (i.e., fossilized) geothermal areas [41,42]. In inactive geothermal systems, the temperature that would be determined by this approach would be the highest temperature experienced by the rocks during their history. There are few exceptions to this rule associated with the production of smectite as a retrograde alteration product of chlorite (e.g., [43]).
In this paper, we review recent findings related to the use of induced polarization in geothermal fields and the connection between the geoelectrical parameters to alteration via the cation exchange capacity and porosity (Section 2). In Section 3, we summarize the fundamental petrophysical relationships that can be used for this purpose. In Section 4, we provide field illustrations regarding the use of electrical conductivity and normalized chargeability tomography to volcanic areas and geothermal fields.
2. Alteration and Texture Changes
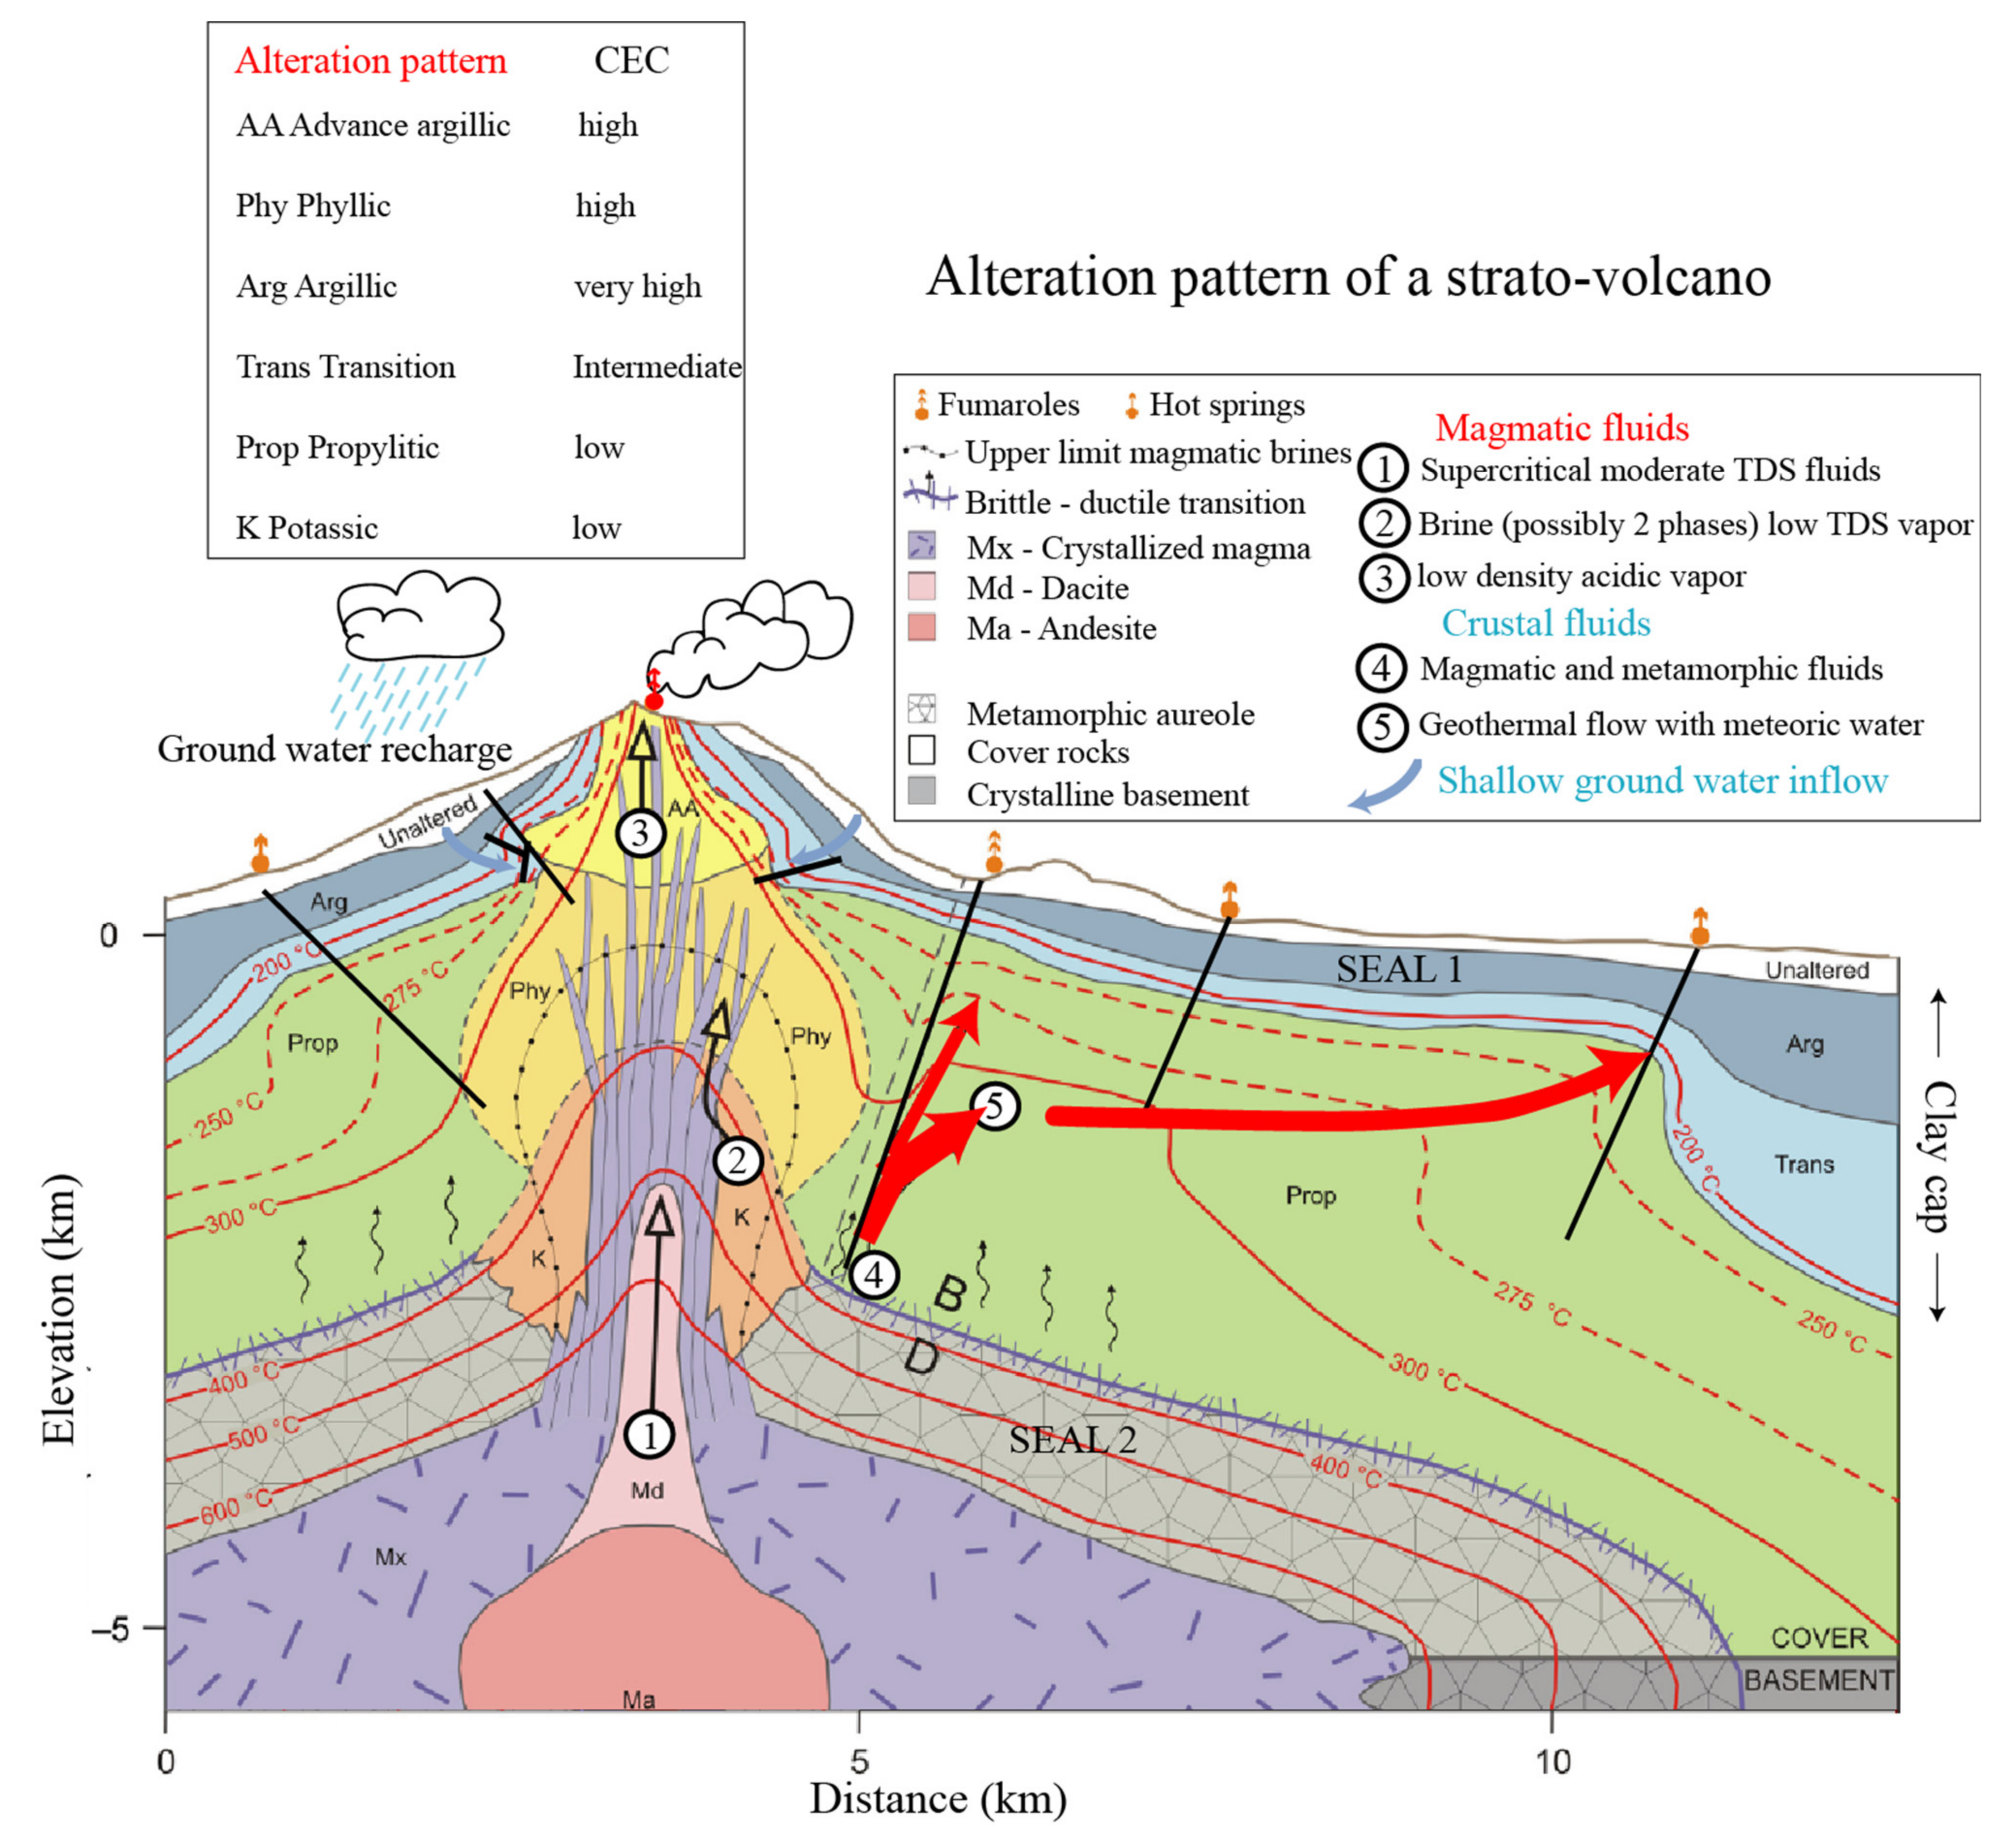
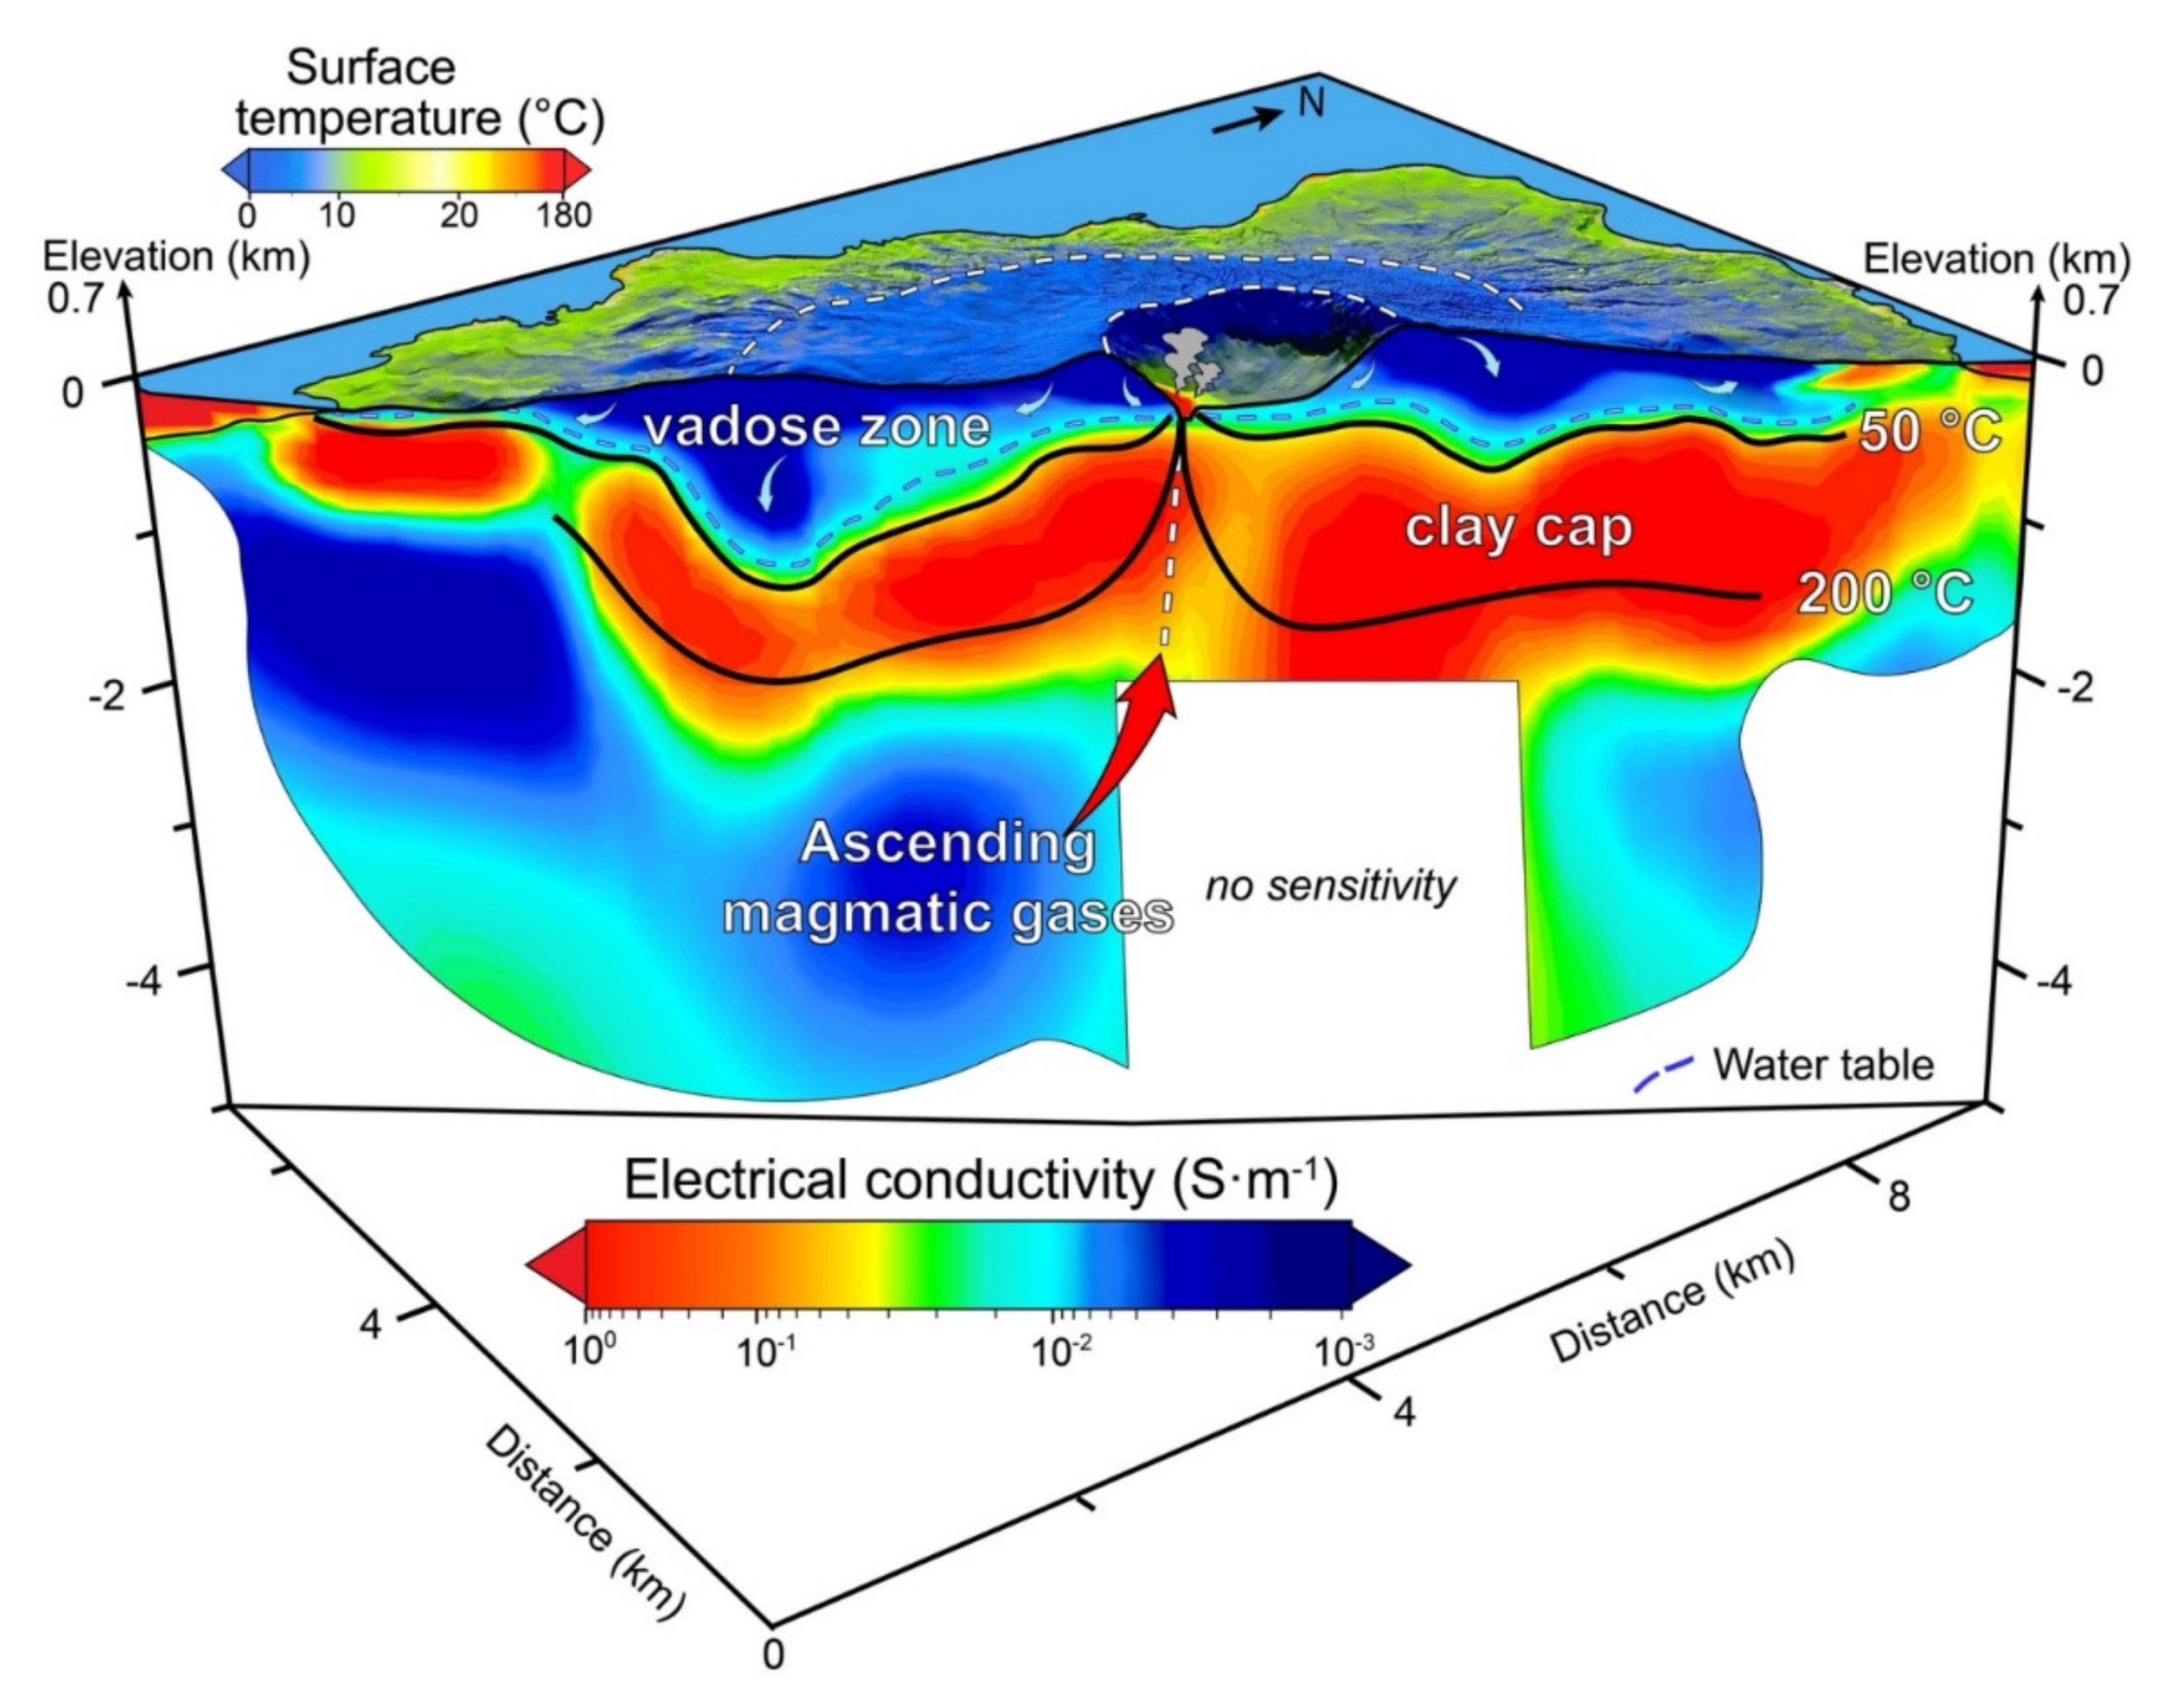
Changes in the confining pressure and temperature field of rocks can affect their porosity and mineral composition [44]. This is especially true in volcanic areas due to strong geothermal gradients, produced by thermal conduction and fluid circulation around magmatic bodies and magmatic vents (see Figure 1, e.g., [45]). The present study is focused on providing a simple picture on how alteration affects the cation exchange capacity (CEC) of rocks in some cases. The CEC (expressed in C kg−1) represents the number of exchangeable sites on the surface of the minerals per mass of minerals. It can be easily measured using titration techniques, for instance, from powders obtained by crushing rock samples (see [38,39,40,46,47]). The CEC measurement techniques are simple and can be performed in any rock physics laboratory.
Figure 1.
Sketch of the cross-section of a strato-volcano. Adapted from Stimac et al. [48] and Richards [49]. Induced polarization can be used to decipher the alteration pattern in such an environment, which has implication regarding the mechanical stability of volcanic edifices and phreatic and phreatomagmatic eruptions. SEAL1 corresponds to the smectite-rich clay cap. The shallow water table is located above this layer. SEAL2 corresponds to the permeability barrier associated with the brittle-ductile transition zone around the magmatic body. CEC stands for Cation Exchange Capacity.

Induced polarization survey can be performed over a geothermal field even at a depth of several kilometers [27]. The interpretation of induced polarization surveys requires, however, the development of physics-based petrophysical relationships, which are discussed below in Section 3. Alteration implies changes in two properties of interest with the depth of burial, temperature, and ground water flow: the (connected) porosity ϕ and the cation exchange capacity (CEC). The porosity (dimensionless) represents the relative volume of (interconnected) voids, which can be saturated by hydrothermal fluids (brines and gases). The gas phase can be formed of air (vadose zone), and, in active systems, commonly contains appreciable amounts of steam, CO2, SO2, H2S, and other gases. In turn, porosity and CEC affect the geoelectrical properties measured through an induced polarization survey.
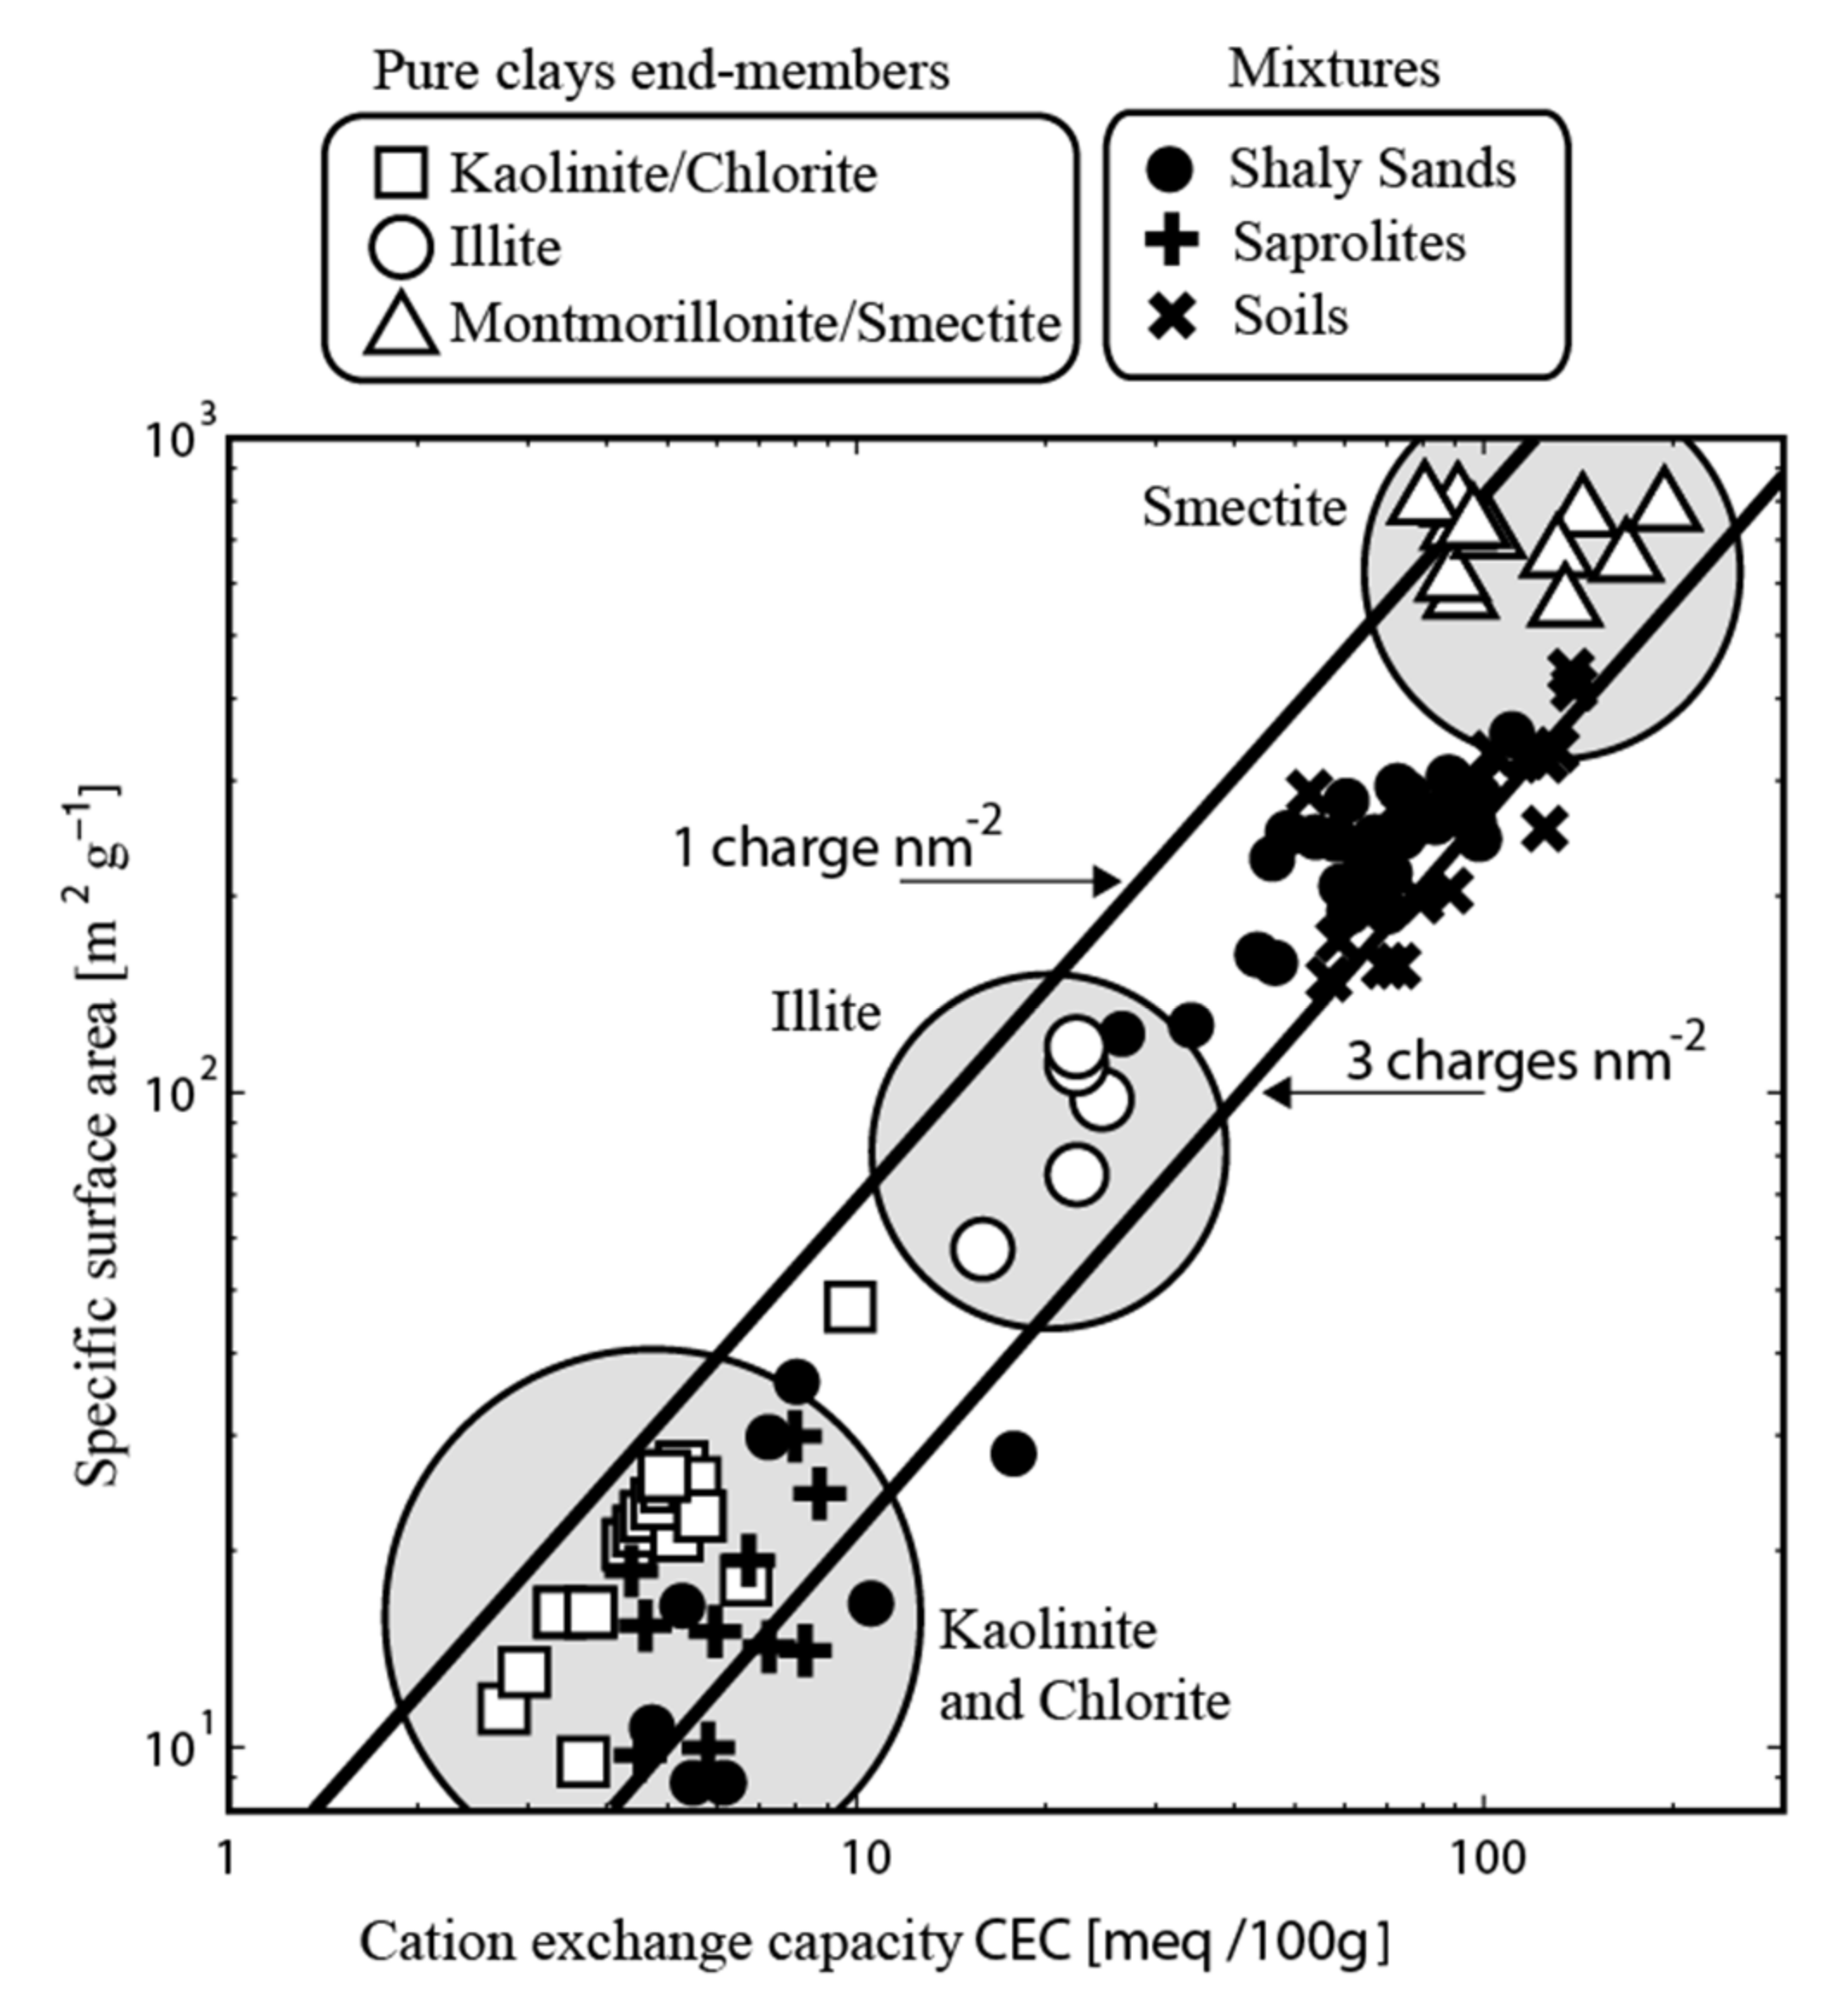
The flow of ground water is also playing a key role in the alteration pattern of the geothermal field. Ground water flow is controlled by permeability, head distribution, and the possibility of free convection when the Rayleigh number exceeds a critical value. In geothermal systems, local dissolution/precipitation processes of minerals at the scale of a representative elementary volume of a rock do not yield strong porosity changes because all (non-metallic) minerals have more or less the same mass density. On the contrary, the long-range transport of dissolved compounds by hydrothermal fluids yields large-scale decrease or increase of the porosity (and CEC) through intense leaching and precipitation processes. The formation of secondary minerals such as clays and zeolites has a strong effect on the cation exchange capacity of the rock [22]. Figure 2 shows the CEC and specific surface area (surface area of mineral per their mass) for different clay minerals and porous media. In particular, smectite-type mineral assemblages generally have very high CEC values (>70 meq/100 g, Figure 2, e.g., [22]). Therefore, the formation of smectite in geothermal fields plays a major contribution on the total cation exchange capacity of rocks. Since the formation of smectite is a temperature-controlled process [50,51,52], then the CEC of rocks in geothermal fields may be temperature controlled as well. As a side note, the CEC can also be related to the Ishikawa rock alteration index (RAI) used to model the alteration of volcanic rocks by circulating hydrothermal fluids using reactive transport numerical models (e.g., [53,54,55,56]).
Figure 2.
Specific surface area versus cation exchange capacity (expressed in meq g−1 with 1 meq g−1 = 96,320 C kg−1) for the main clay minerals. The ratio between the CEC and the specific surface area corresponds to the charge density at the surface of the minerals. The two lines correspond to a surface charge density of 1 to 3 elementary charges per unit surface area. Smectite has the highest CEC of all clay minerals and its production through alteration in geothermal system can control the CEC of the mineral assemblage. The soil data are from Chittoori and Puppala [57]. Data for the clay end-members are from Patchett [58], Lipsicas [59], Zundel and Siffert [60], Lockhart [61], Sinitsyn et al. [62], Avena and De Pauli [63], Shainberg et al. [64], Su et al. [65], and Ma and Eggleton [66]. The saprolite data are from Revil [67].

3. Induced Polarization
Induced polarization is a geoelectrical technique that can be used to image two properties of interest, the electrical conductivity σ and the normalized chargeability Mn of rocks [26,68,69]. It can be carried out over geothermal fields at different scales to complement an electrical conductivity survey (see [21,29,70]). Such survey can be performed to image the subsurface to depths of several kilometers [27] and can account for rough topographies [71].We discuss below how this method can be used to alteration of volcanic edifices and geothermal systems (Figure 3).
3.1. Electrical Conductivity
At first approximation, the conductivity of (volcanic) rocks is the sum of two contributions (e.g., [34]). (1) A contribution associated with conduction in the bulk pore space partially filled with a brine of conductivity (in S m−1). In the following, we note the partial saturation of the pore space with this brine ( = 1 for a fully saturated pore space). (2) A contribution called surface (or interface) conductivity (S m−1) related to conduction along the charged surface of the mineral grains characterized by their cation exchange capacity (CEC). The CEC is expressed in C kg−1 (in the international system of units, or sometimes expressed in Mol kg−1). The conversion between the various units used to quantify the CEC is the following: 1 meq g−1 = 1 mol kg−1 = 96320 C kg−1. The conductivity of a volcanic rock can be written as (e.g., [34,39,40])
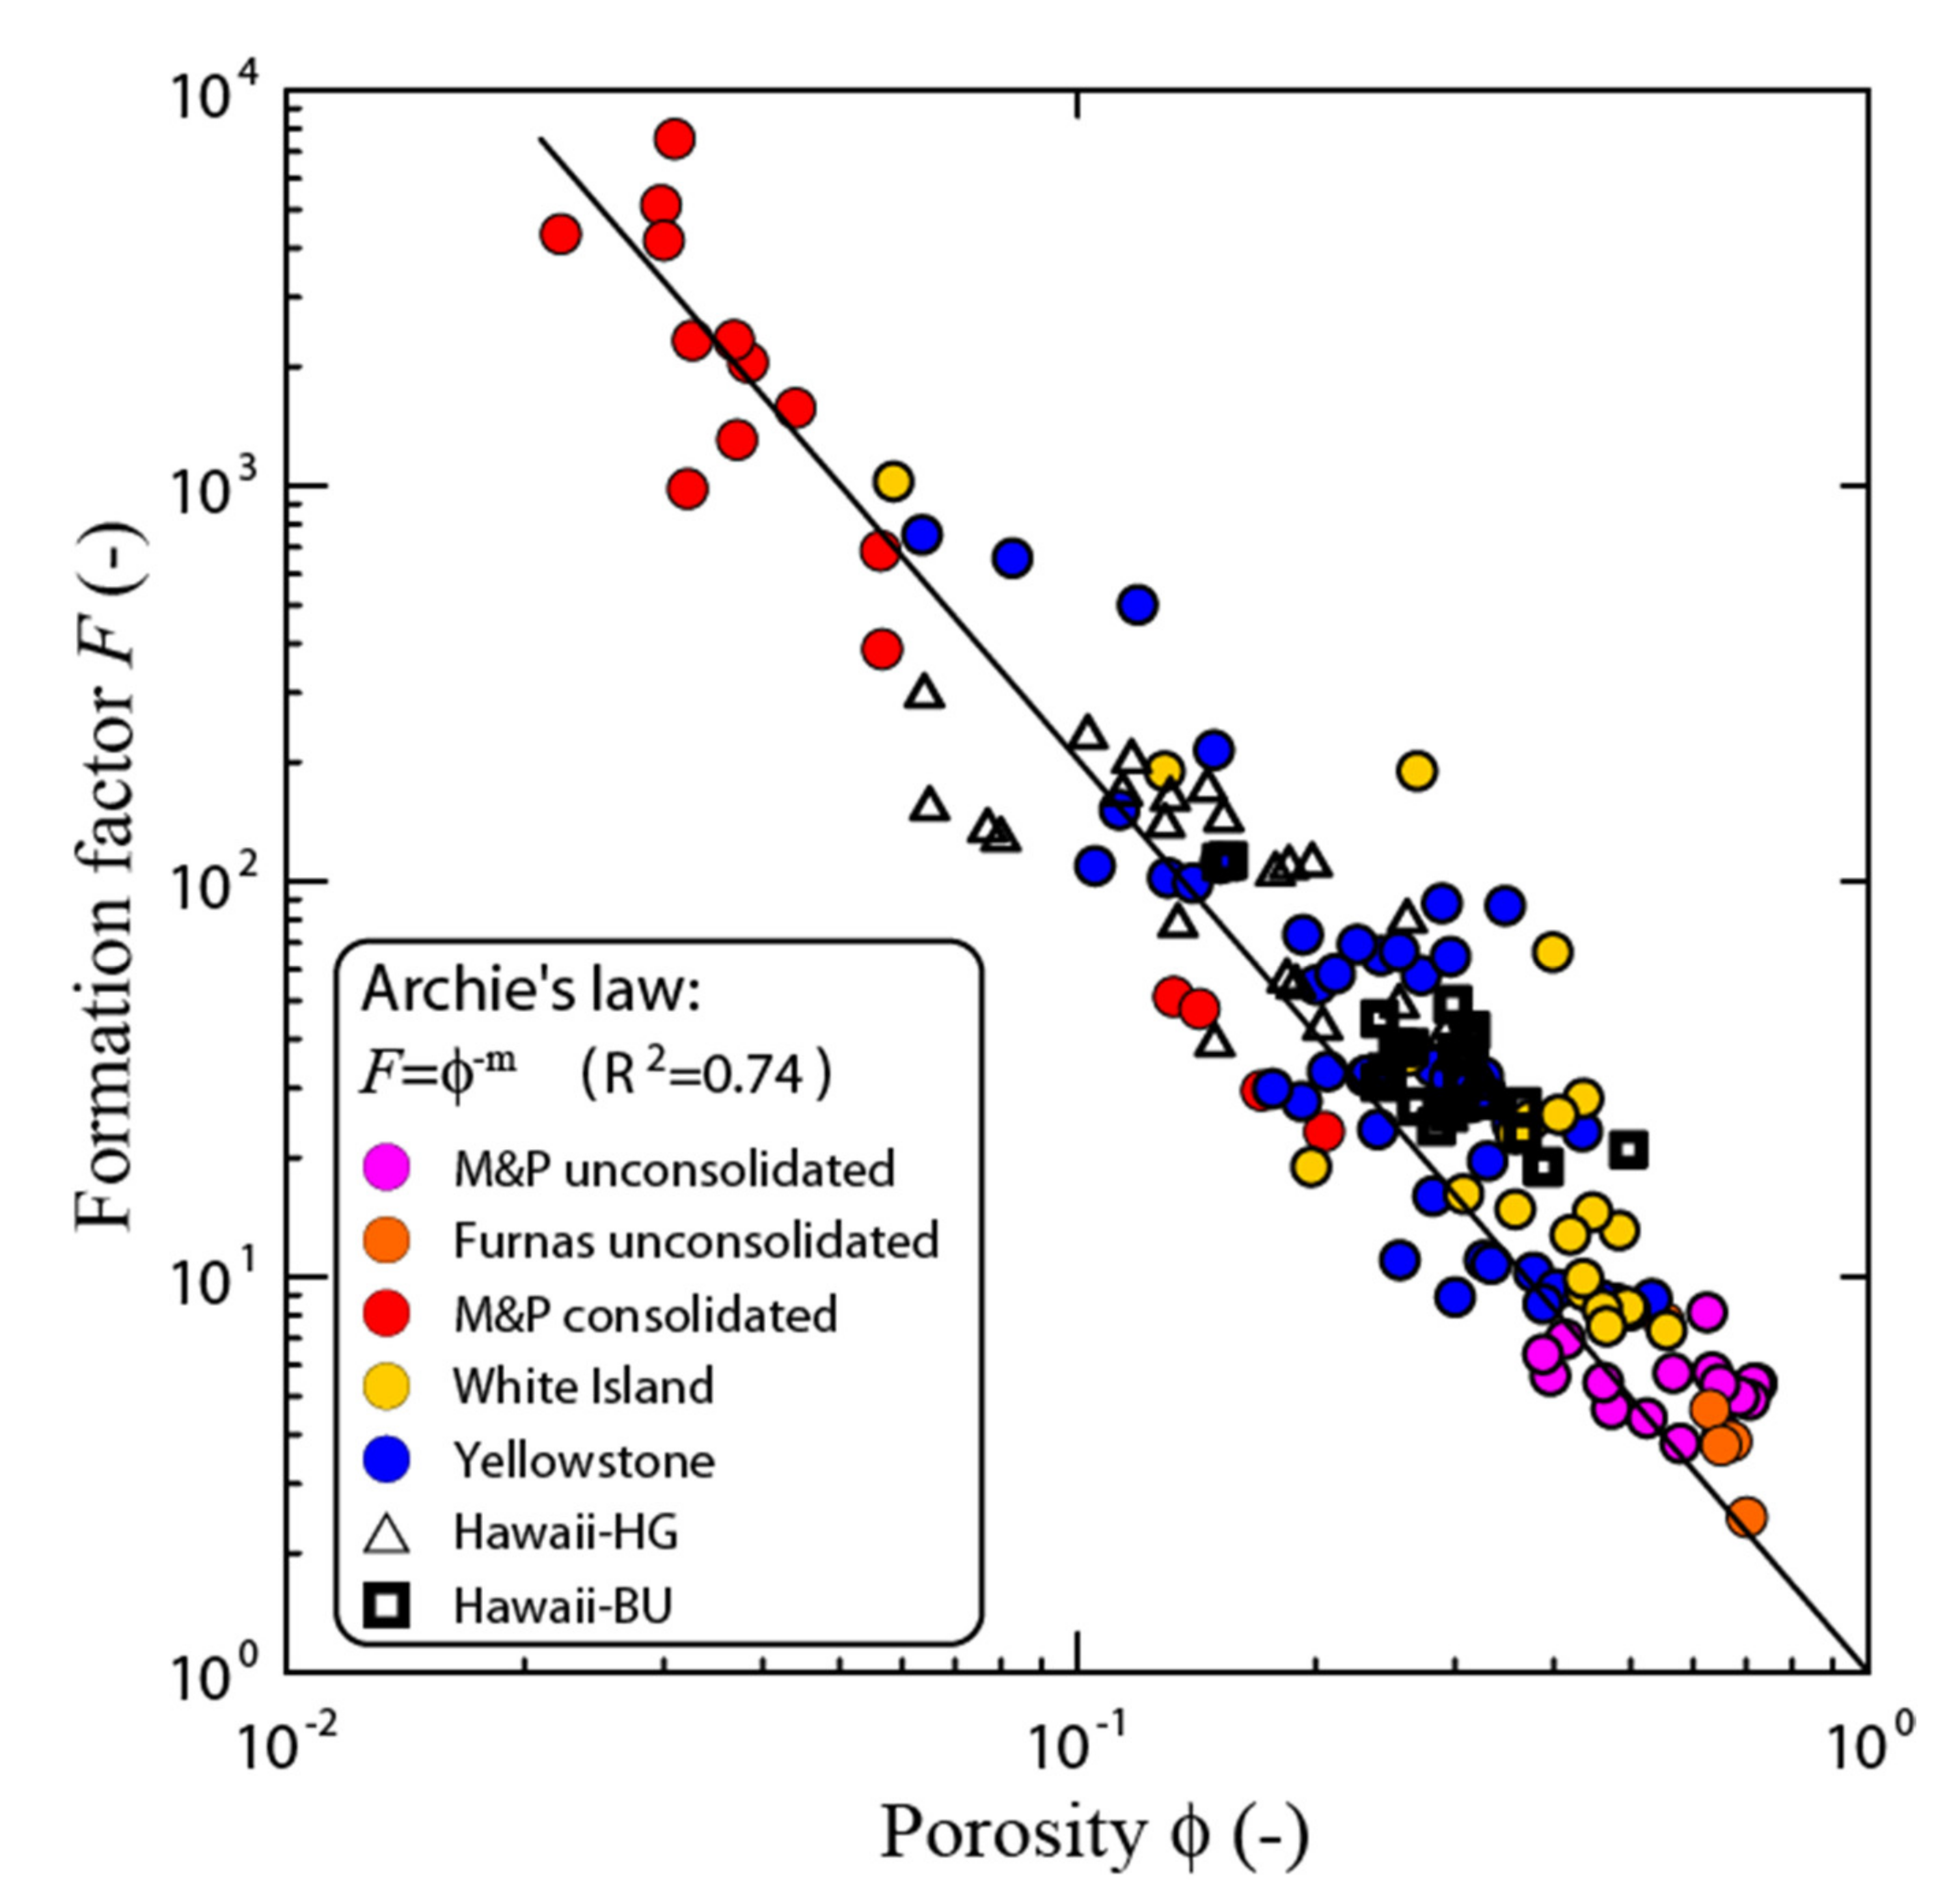
where F (dimensionless) corresponds to the formation factor connected to the connected porosity by Archie’s law with m (dimensionless) is called the porosity exponent or first Archie’s exponent [36], and n (dimensionless) corresponds to the saturation exponent (or second Archie’s exponent). The dependence of the formation factor with the porosity is shown in Figure 4 for volcanic rocks. The power-law trend yields a mean value for the cementation exponent (m ≈ 2.3 ± 0.1). Such power-law dependence can be associated with the fractal nature of the pore network (e.g., [72,73]).
Figure 4 shows the general relationship between the formation factor and the porosity of volcanic rocks for brine saturated rocks. The surface conductivity is related to the porosity and CEC by [39,40]
where is the grain density (in kg m−3, typically ρg = 2900 ± 100 kg m−3 for volcanic rocks), and B (Na+, 25 °C) = 3.1 ± 0.3 × 10⁻⁹ m2s−1V−1 denotes the mobility of the counterions on the surface of the clay minerals. For brine-saturated core samples, the dependence of the surface conductivity with the reduced CEC (i.e., the ratio ) is shown in Figure 5. In geothermal areas, recent studies point out the importance of surface conductivity in dominating the conductivity response of altered volcanic rocks (e.g., [22,37,52] and references therein).
3.2. Normalized Chargeability
Beside electrical conductivity, another property of interest for rocks is their low-frequency polarization [34]. Low-frequency polarization refers here to the reversible storage of electrical charges under a slowly varying electrical field. Its strength can be characterized by fundamental parameters called the normalized chargeability (e.g., [38]). Vinegar and Waxman [34] demonstrated the strong role played by the cation exchange capacity in controlling the polarization of clayey materials (clayey sands and sandstones in their case). The normalized chargeability of a rock is given as [39,40]
where λ (expressed in m2s−1V−1) denotes the apparent mobility of the counterions for the polarization λ (Na+, 25 °C) = 3.0 ± 0.7 × 10⁻¹⁰ m2s−1V−1, [39,40]. The development of Equation (3) has been built under the same theoretical umbrella as for Equations (1) and (2) in order to provide a unified framework to describe electrical properties in low- and high-temperature geothermal fields.
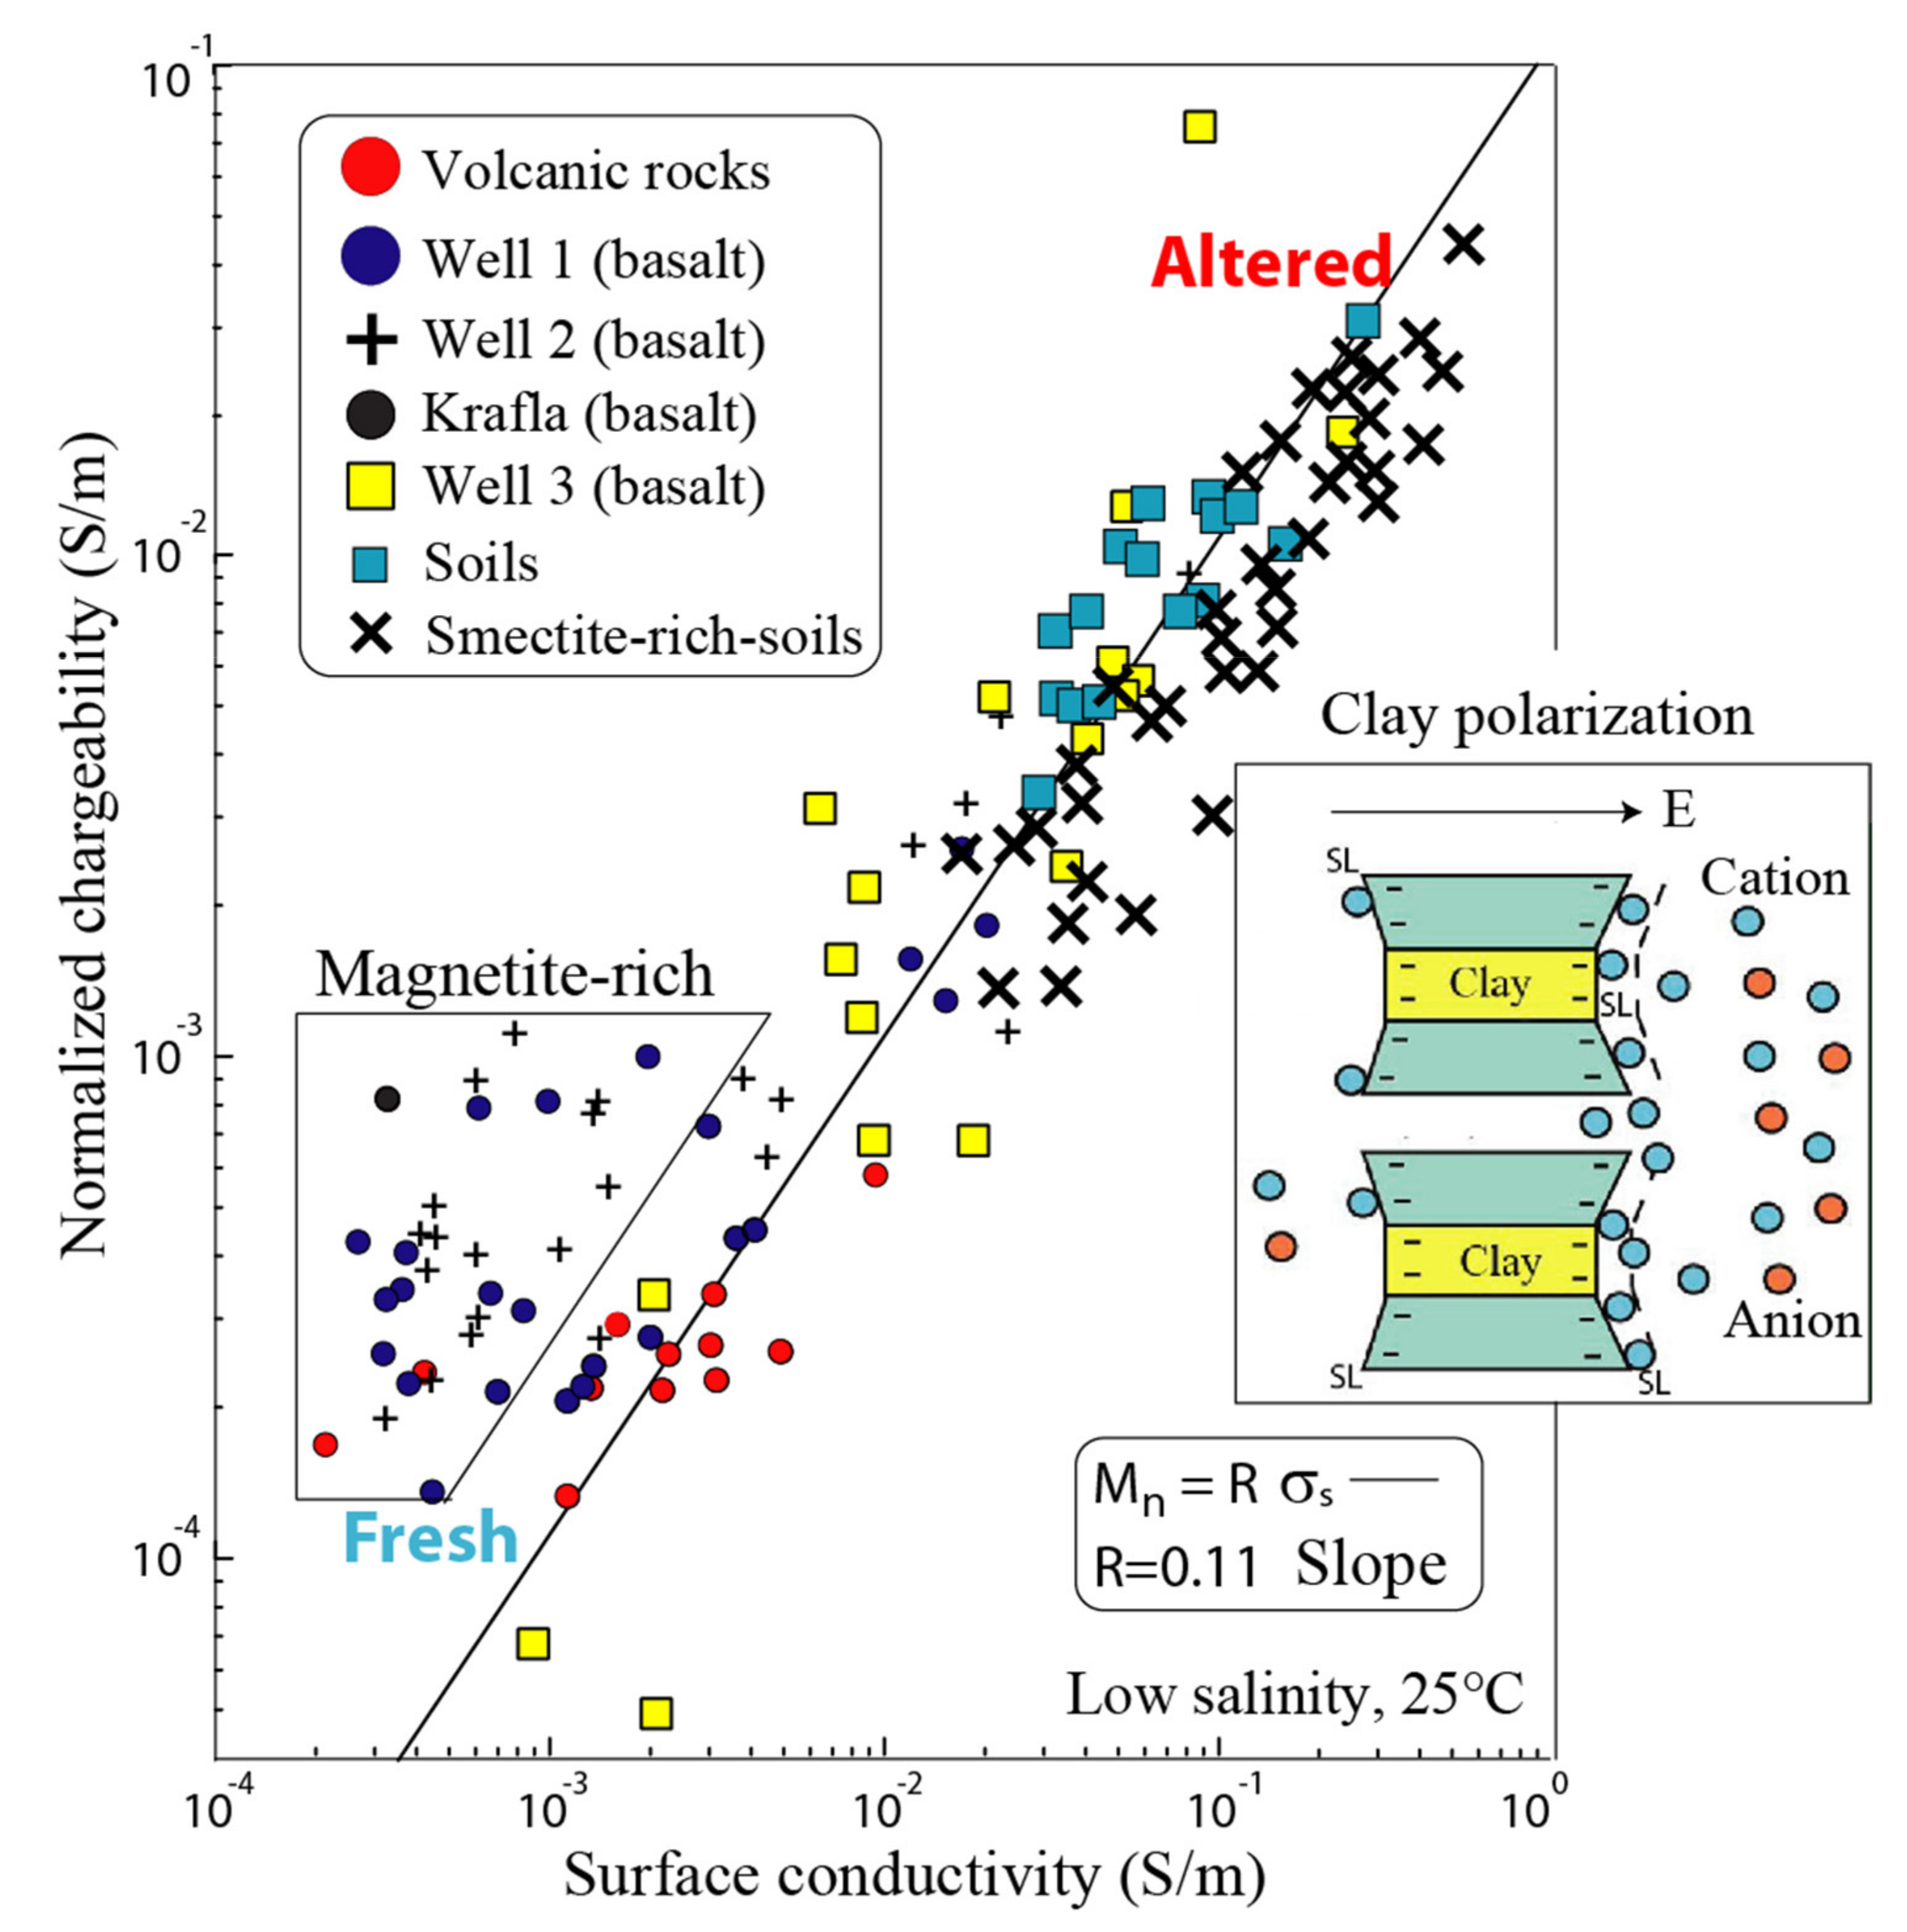
The ratio of the normalized chargeability by the surface conductivity is equal to the dimensionless ratio R = λ/B (independent of saturation and temperature). Figure 6 shows that R = 0.11 for volcanic rocks, which is a universal value for all type of low-temperature or high-temperature geothermal fields. Figure 6 implies that in turn the normalized chargeability scales also with the reduced CEC (i.e., ).
Note that with the assumption n ≈ m [74] the conductivity and the normalized chargeability can be written as,
where denotes the (vol.) water content (dimensionless). The presence of the vadose zone or steam or other gases (e.g., H2S, CO2) is therefore accounted for in these equations. The concentration of salts in the geothermal system primarily affects . Equations (4) and (5) can be used to image the water content and the CEC from tomograms of the electrical conductivity and normalized chargeability [21,75]. Equations (4) and (5) are valid up to 250 °C, and probably up to 600 °C. The effect of temperature (at a given pressure) may change the electrical properties through three direct effects: (i) the influence of temperature on the mobilities B and λ (described in Section 3.3 below), (ii) changes in the total dissolved content (TDS) of the liquid pore water, and (iii) change in saturation because of the presence of steam and other gases.
3.3. Influence of Temperature
For a given rock sample characterized by a constant CEC, the temperature dependence of the electrical conductivity and normalized chargeability is controlled by the temperature dependence of the mobility of the charge carriers (cations and anions), i.e. B and λ in Equations (4) and (5). It is related to the dependence of the viscosity of the pore water with temperature. For a given mineralogy, the temperature dependence of electrical conductivity and normalized chargeability are given by (e.g., [38])
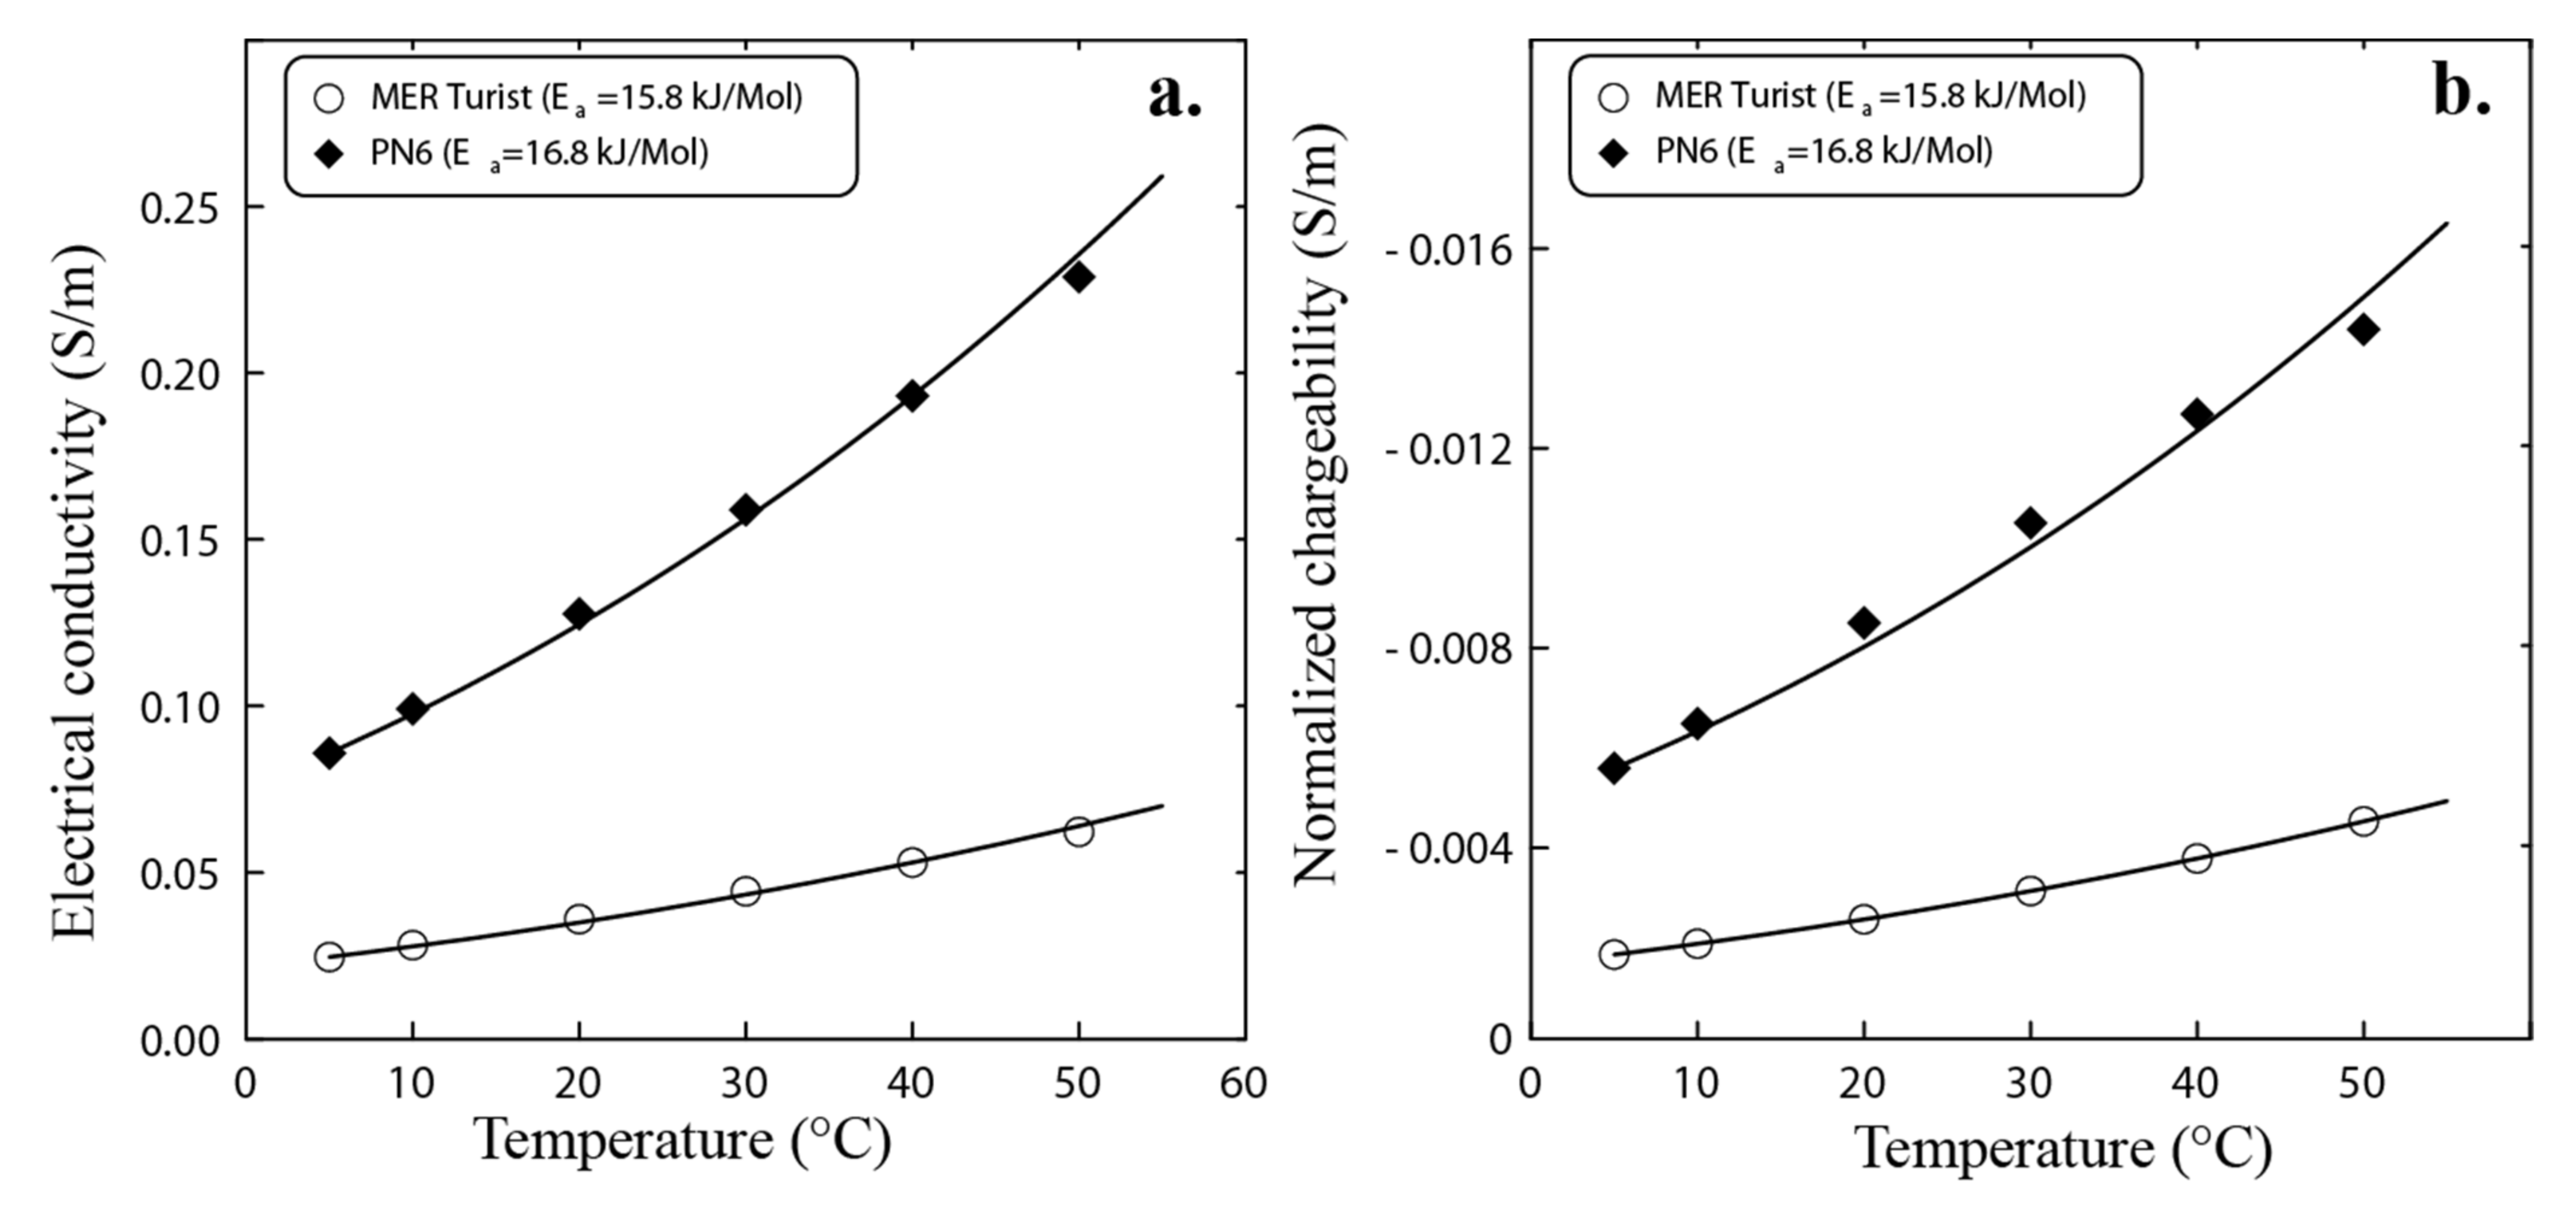
where Ea denotes the activation energy (in J Mol−1), T is the temperature in K, r = 8.314 J mol−1 K−1, (universal gas constant), and and are constant. Figure 7 shows that the activation energy for the conductivity and normalized chargeability of rocks is close to the activation energy of the viscosity of the pore water (~15–17 kJ Mol−1). This dependence is rather weak and is fundamentally related to the dependence of the mobility of the ions (B and λ) with respect to the dynamic viscosity of the pore water.
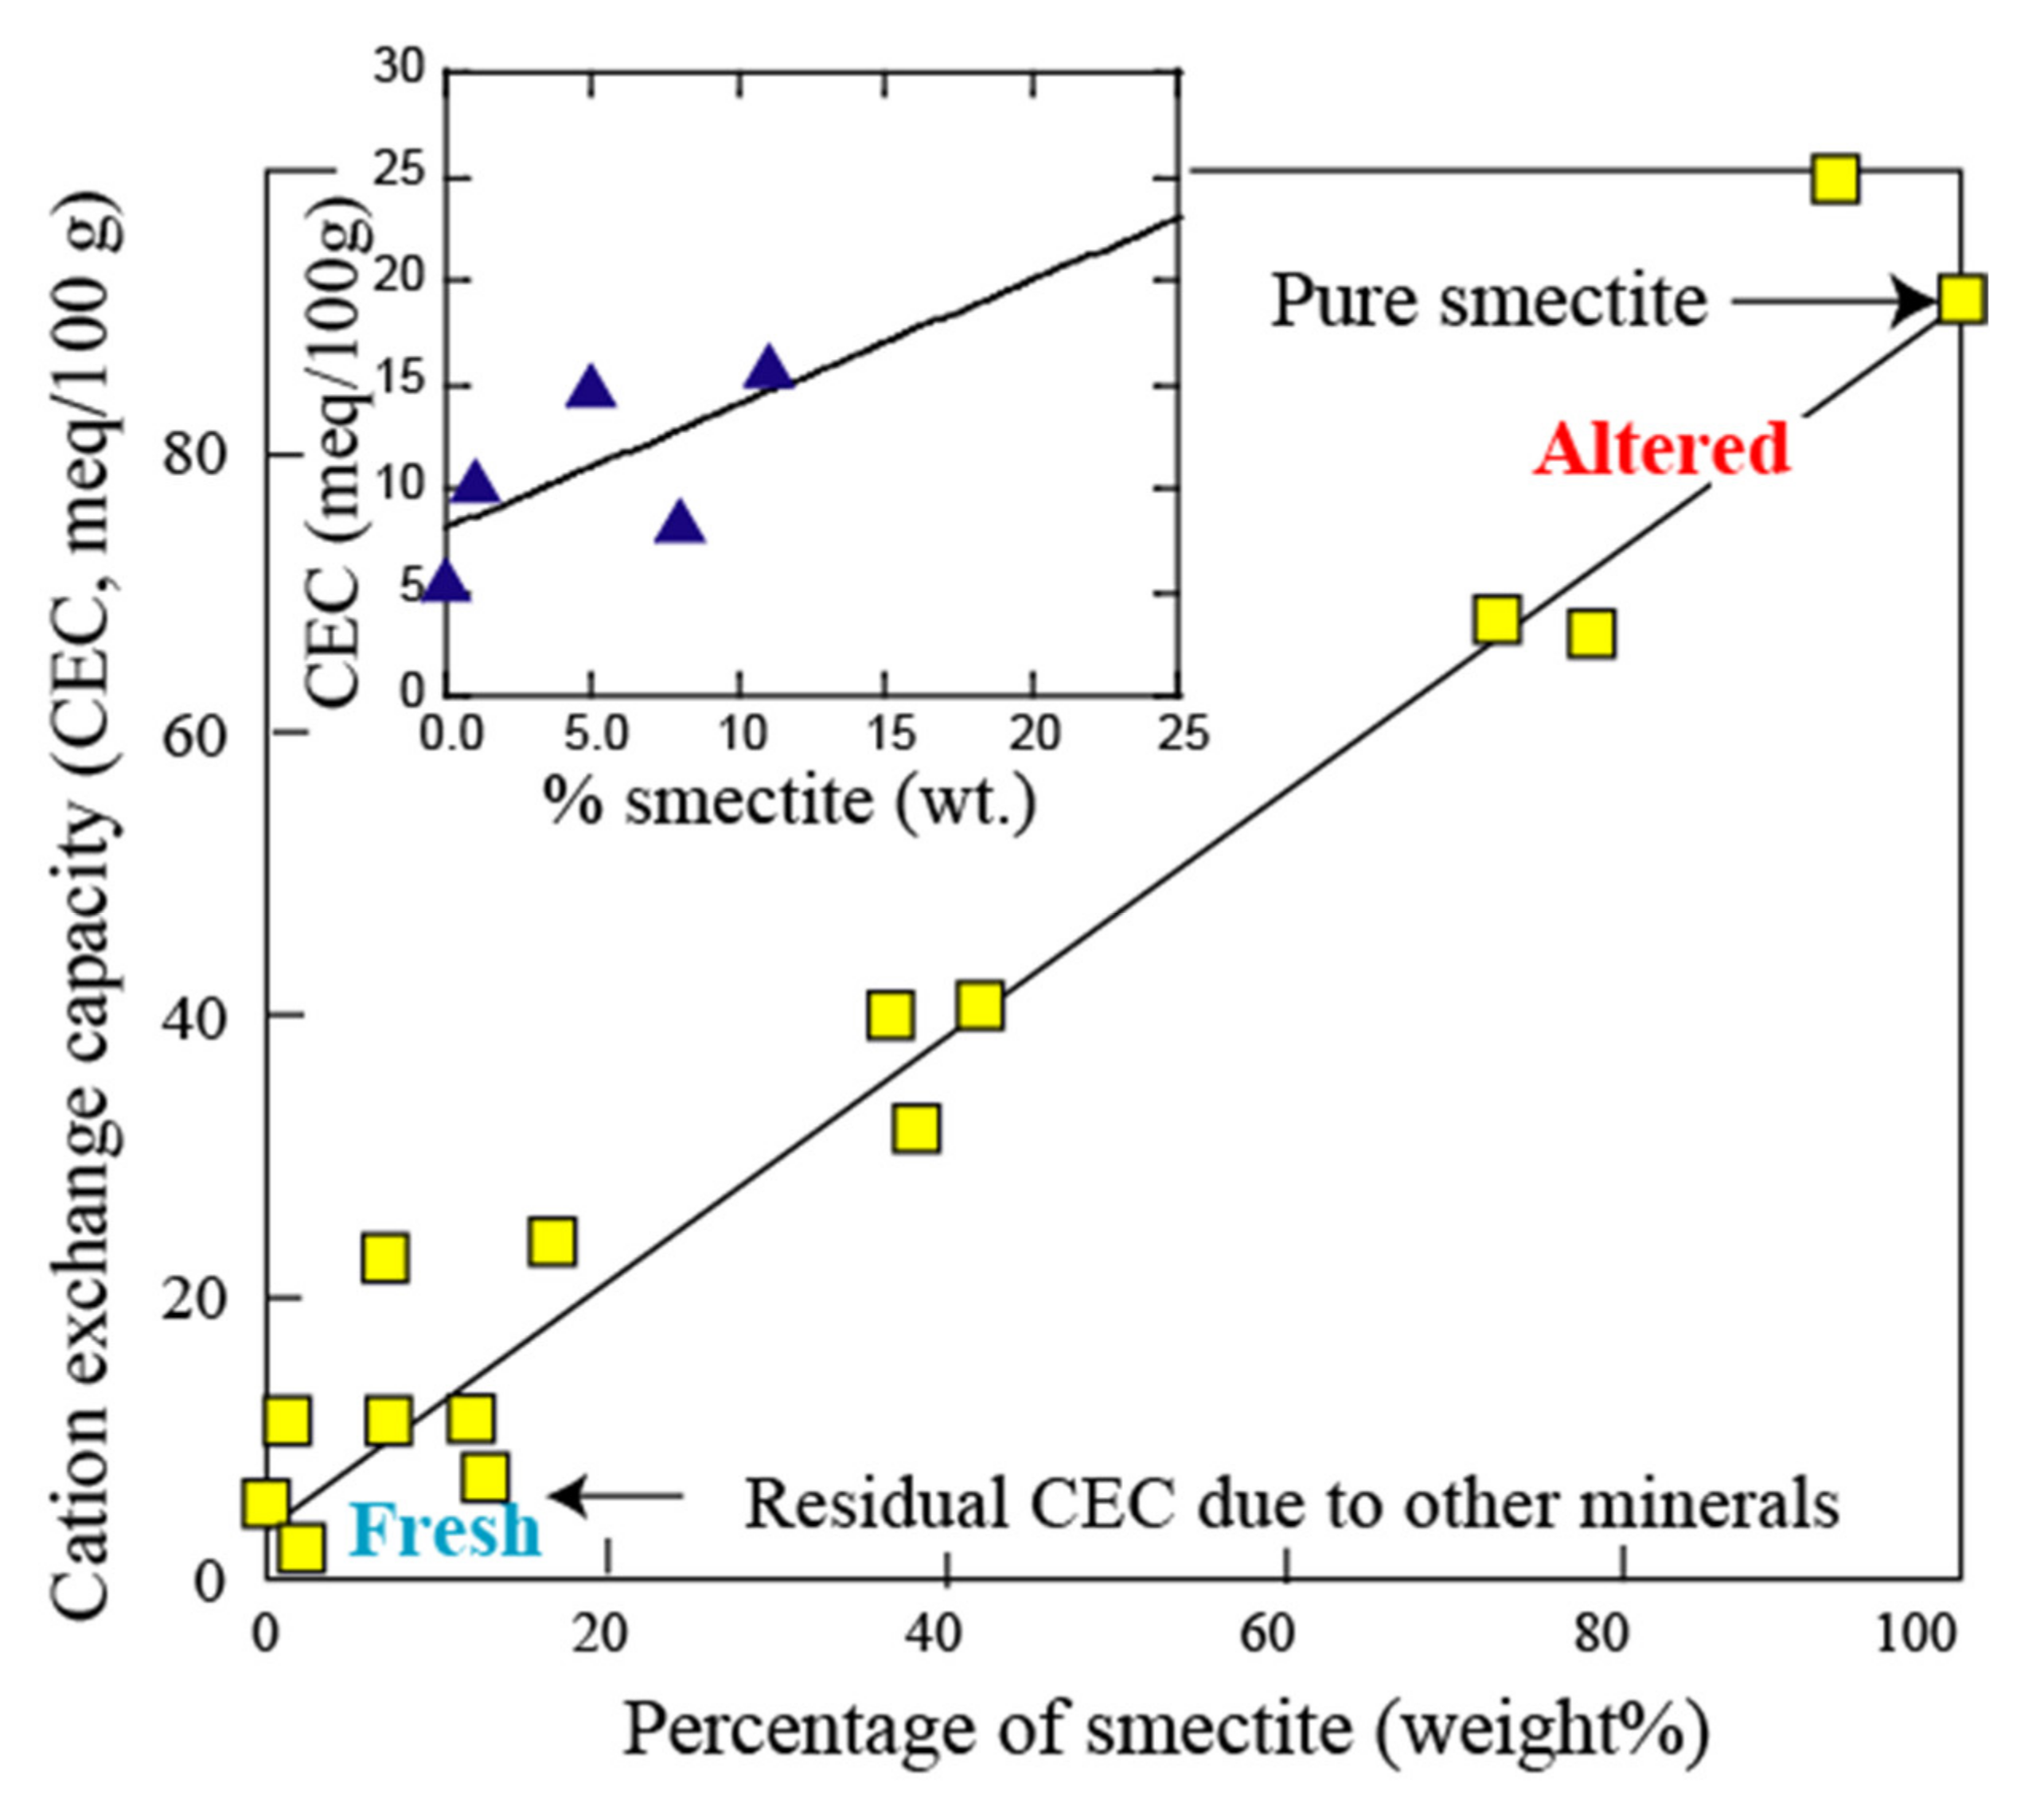
That said, in geothermal systems, the cation exchange capacity is not constant, because of the alteration pattern (e.g., [22]). Since smectite has the highest CEC among all secondary minerals (Figure 2), the surface conductivity and normalized chargeability are expected to be largely controlled by the presence of smectite. Figure 8 shows that the CEC of volcanic-rocks with smectite is dominated by the presence of smectite. In geothermal fields, the production of smectite and the transition of smectite to mixed layer clays are temperature-controlled processes inside the temperature window 50–220 °C (Figure 9b, see [76,77]), then the CEC of rocks is also temperature controlled. In this case, the normalized chargeability, surface conductivity, and conductivity are both temperature controlled. This is clearly shown in Figure 9, Figure 10 and Figure 11. The strong dependence between the geoelectrical properties and temperature exhibited in Figure 9, Figure 10 and Figure 11 is related to the alteration pattern rather than to the temperature dependence of the mobility of the charge carriers in the volcanic rock (following the temperature dependence shown by Equations (6) and (7)). In turn, this means that geoelectrical properties can be used to image the temperature field itself. If confirmed, this could be a breakthrough in the realm of volcanology.
As a side note, we would mention that Archie’s law as a conductivity equation () has been abusively used in a high number of papers in the realm of volcanology to interpret electrical resistivity data in volcanic areas (e.g., [78] and references therein). Borehole data combined with conductivity tomograms have unambiguously demonstrated the presence of conductive clay caps, where surface conductivity plays a dominant role because of the very high cation exchange capacity of smectite (see Figure 2 and Figure 10).Thus, we would like to emphasize that qualitative interpretation of conductivity models only based on Archie’s law’s equation should be abandoned since it leads to an erroneous interpretation of subsurface rock properties (e.g., [22,37]).
Figure 9.
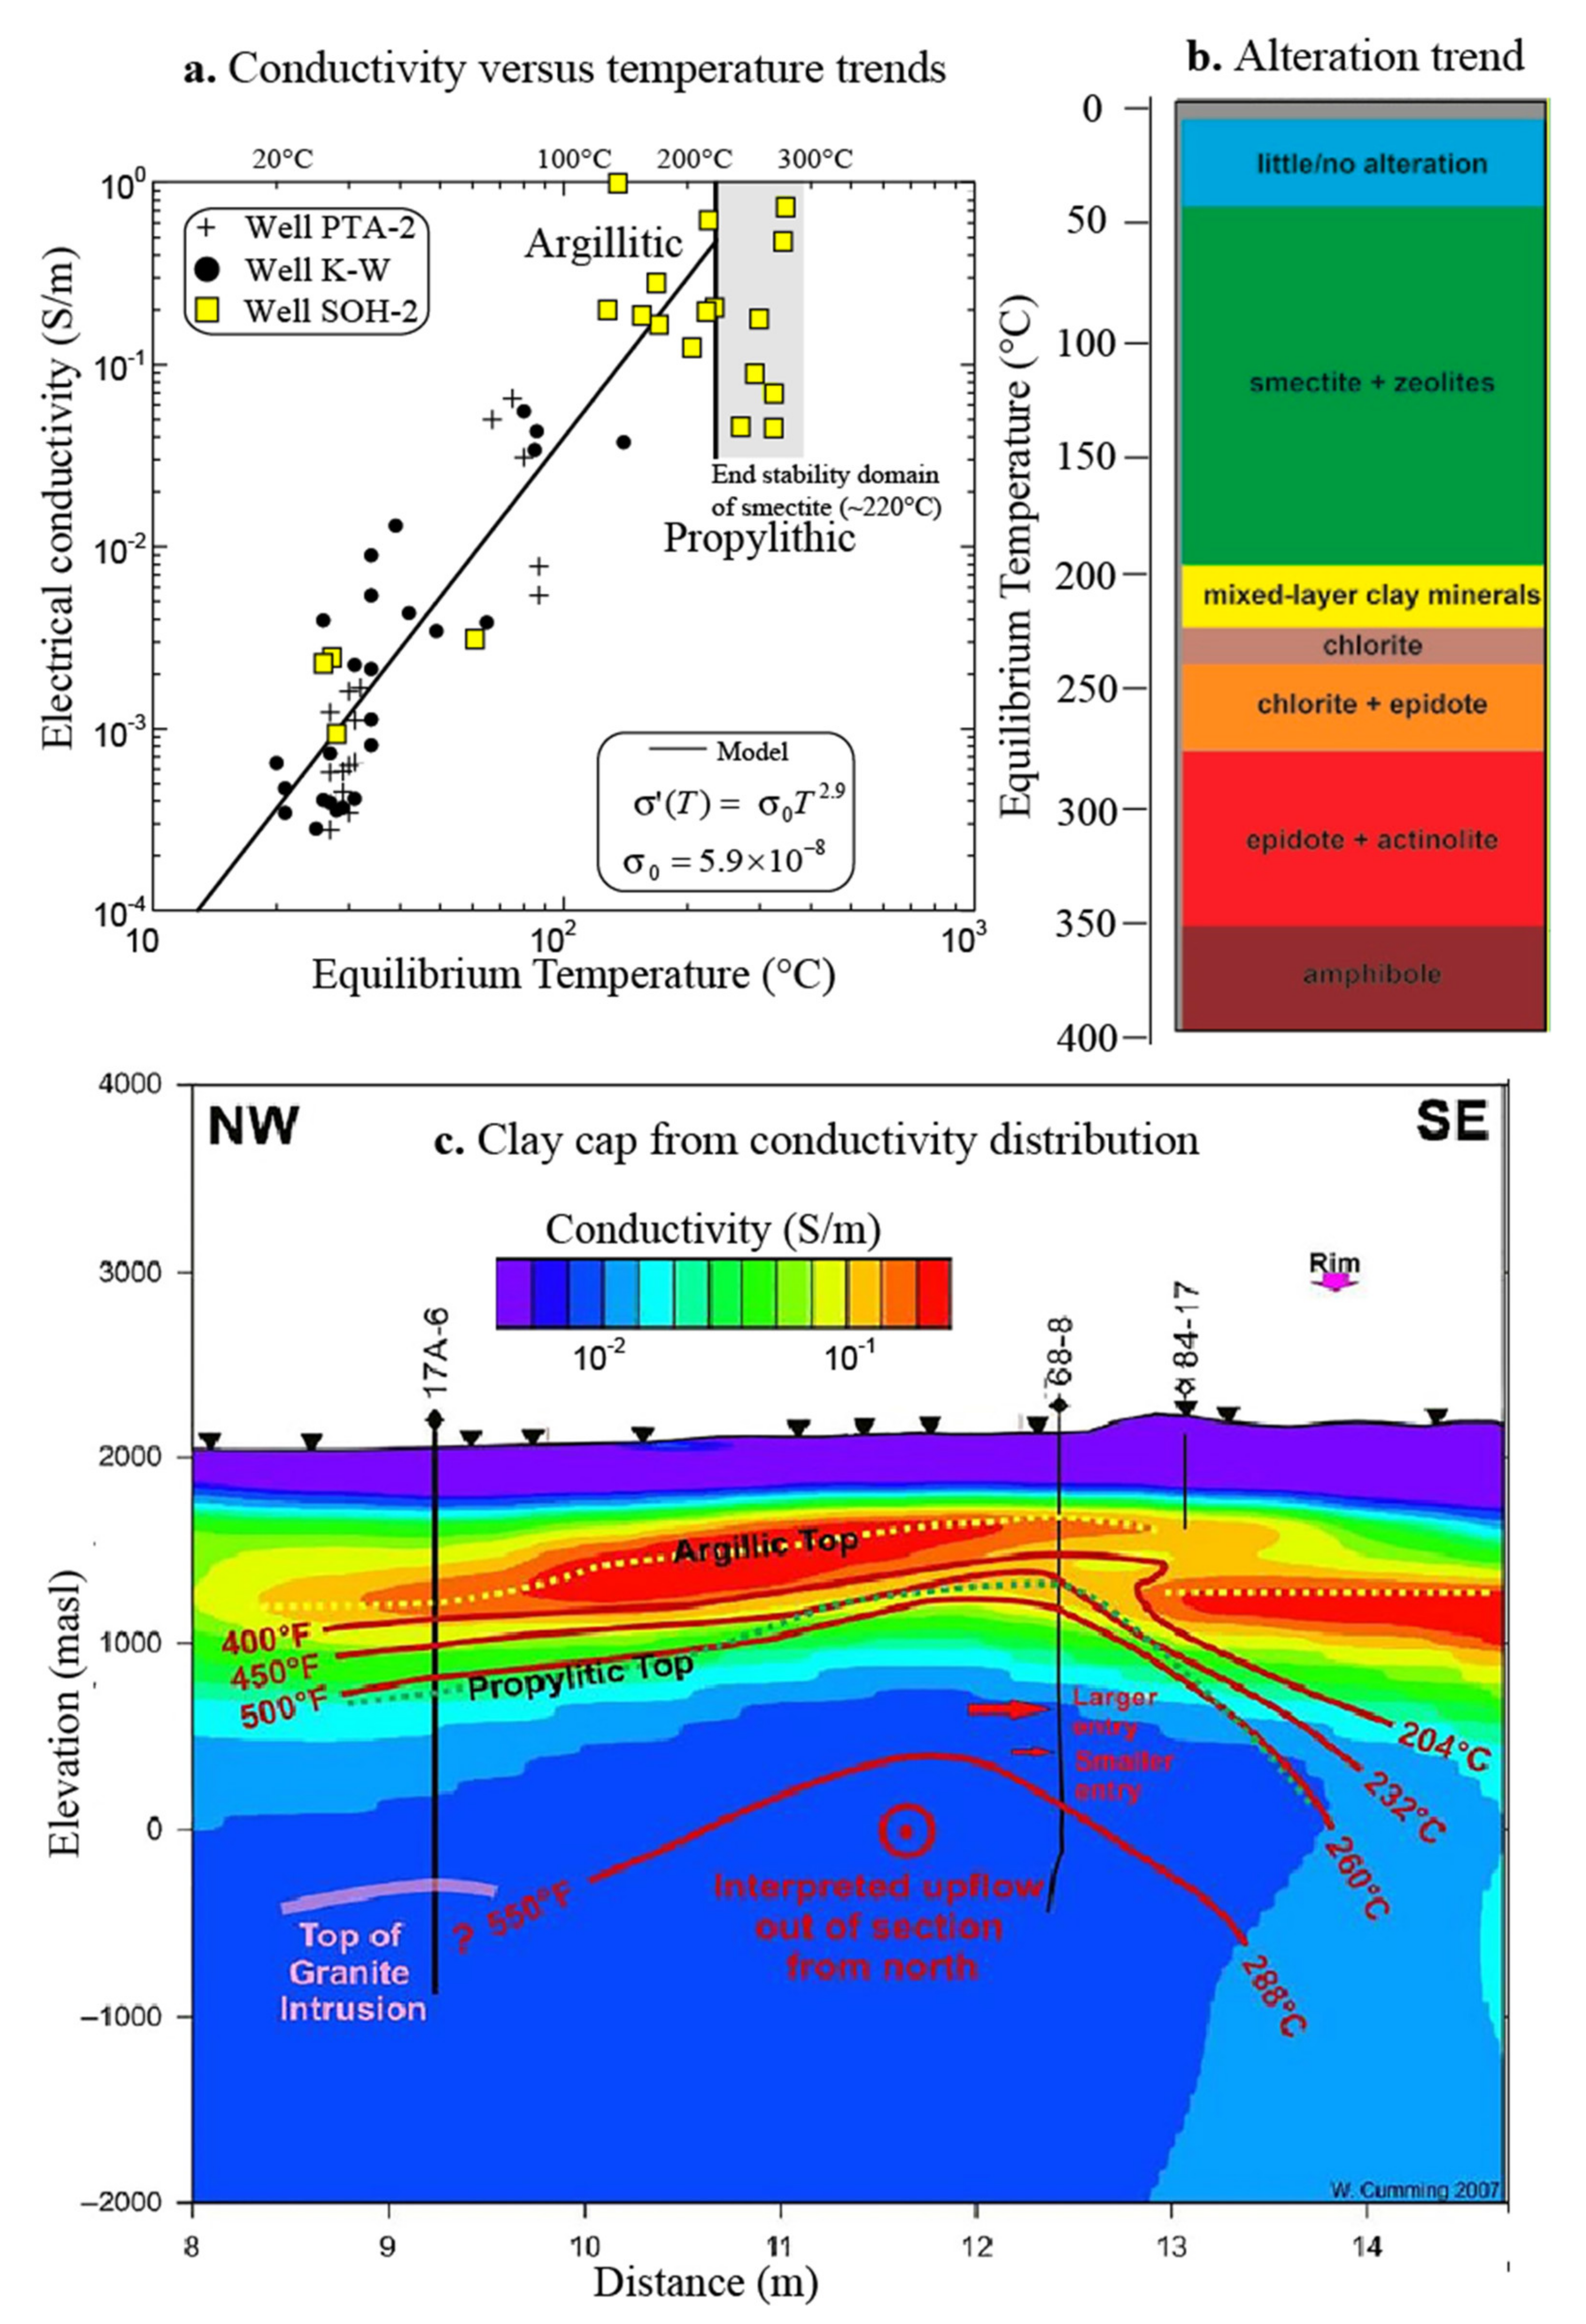
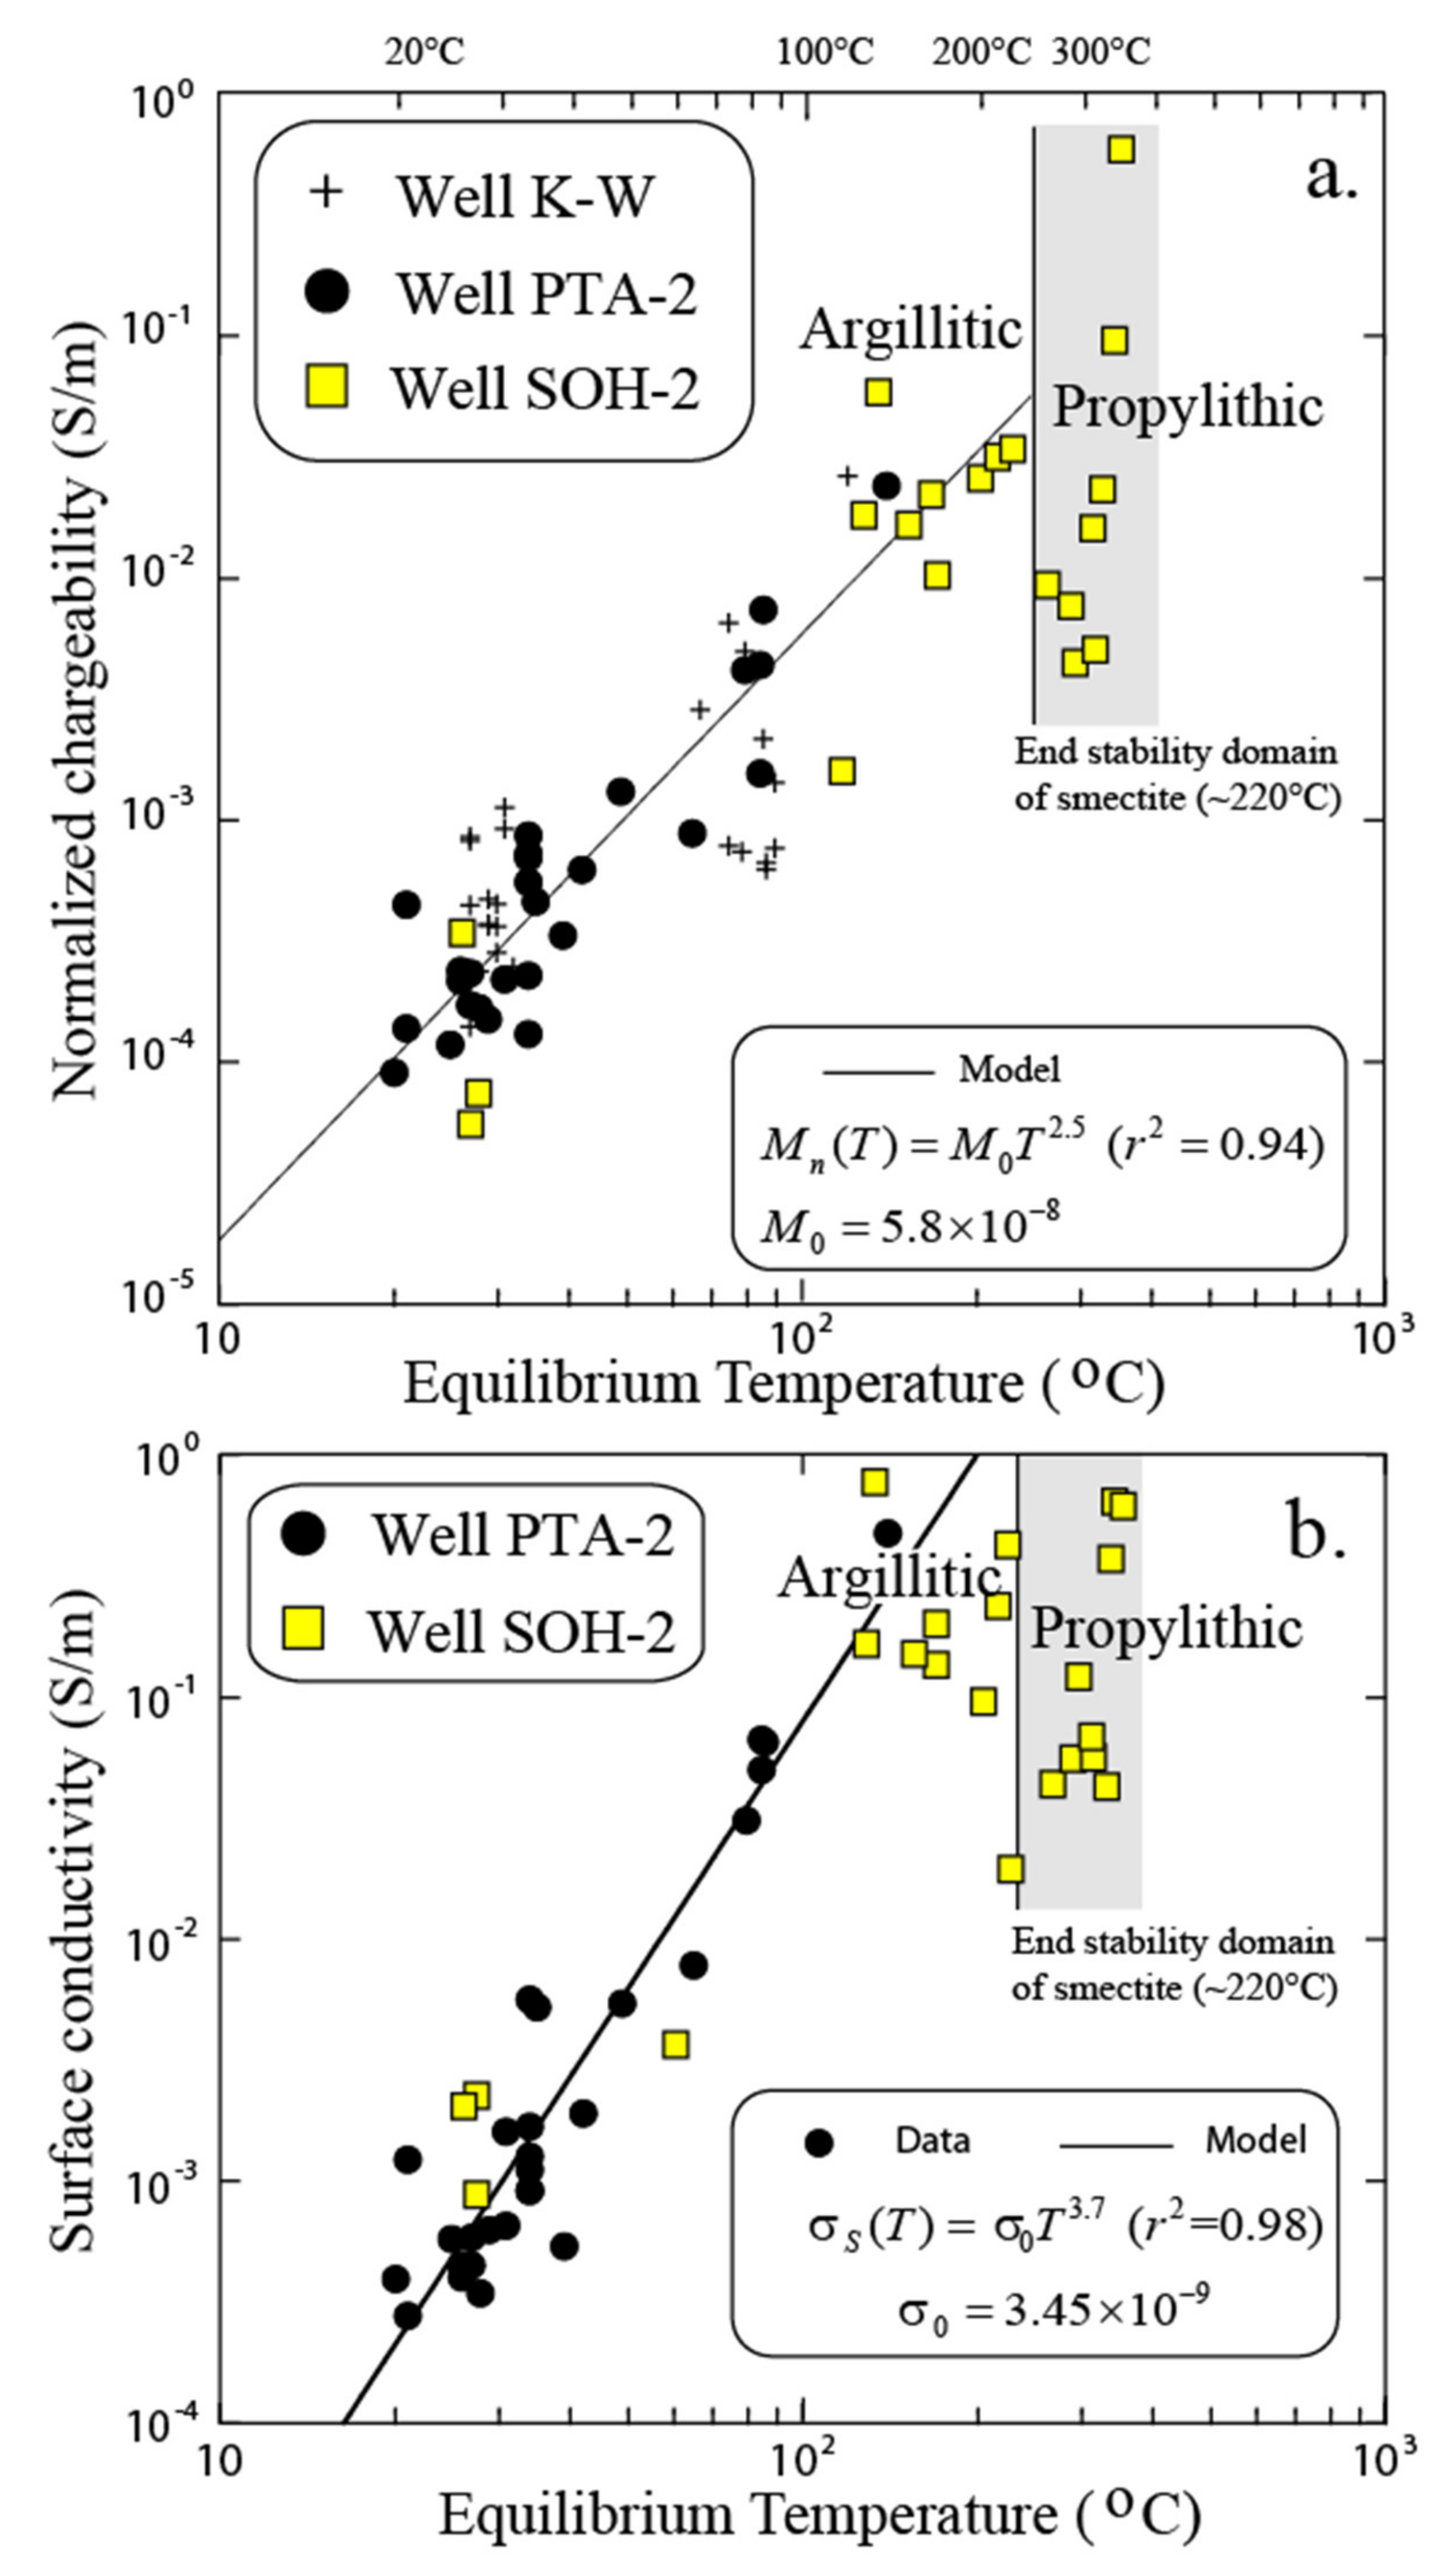
Conductivity, alteration, and temperature. (a) Temperature dependence of the electrical conductivity σ in volcanic areas using field data (samples from wells and in situ temperature measured in the same wells, see Revil et al. [52]). The electrical conductivity (measured on the core samples) is plotted versus the equilibrium temperature measured in the wells. The conductivity is corrected for the in situ temperature of the core samples in order to be used to interpret the field data. This dependence is much stronger than the dependence shown in Figure 7. (b) Alteration trend with the equilibrium temperature in Iceland for the secondary minerals (modified from Kousehlar et al. [79]). (c) Electrical conductivity distribution at Medecine lake geothermal system (USA). TGH Thermal Gradient Holes, reprinted from Cumming and Mackie [80].
Figure 9.
Conductivity, alteration, and temperature. (a) Temperature dependence of the electrical conductivity σ in volcanic areas using field data (samples from wells and in situ temperature measured in the same wells, see Revil et al. [52]). The electrical conductivity (measured on the core samples) is plotted versus the equilibrium temperature measured in the wells. The conductivity is corrected for the in situ temperature of the core samples in order to be used to interpret the field data. This dependence is much stronger than the dependence shown in Figure 7. (b) Alteration trend with the equilibrium temperature in Iceland for the secondary minerals (modified from Kousehlar et al. [79]). (c) Electrical conductivity distribution at Medecine lake geothermal system (USA). TGH Thermal Gradient Holes, reprinted from Cumming and Mackie [80].

Figure 10.
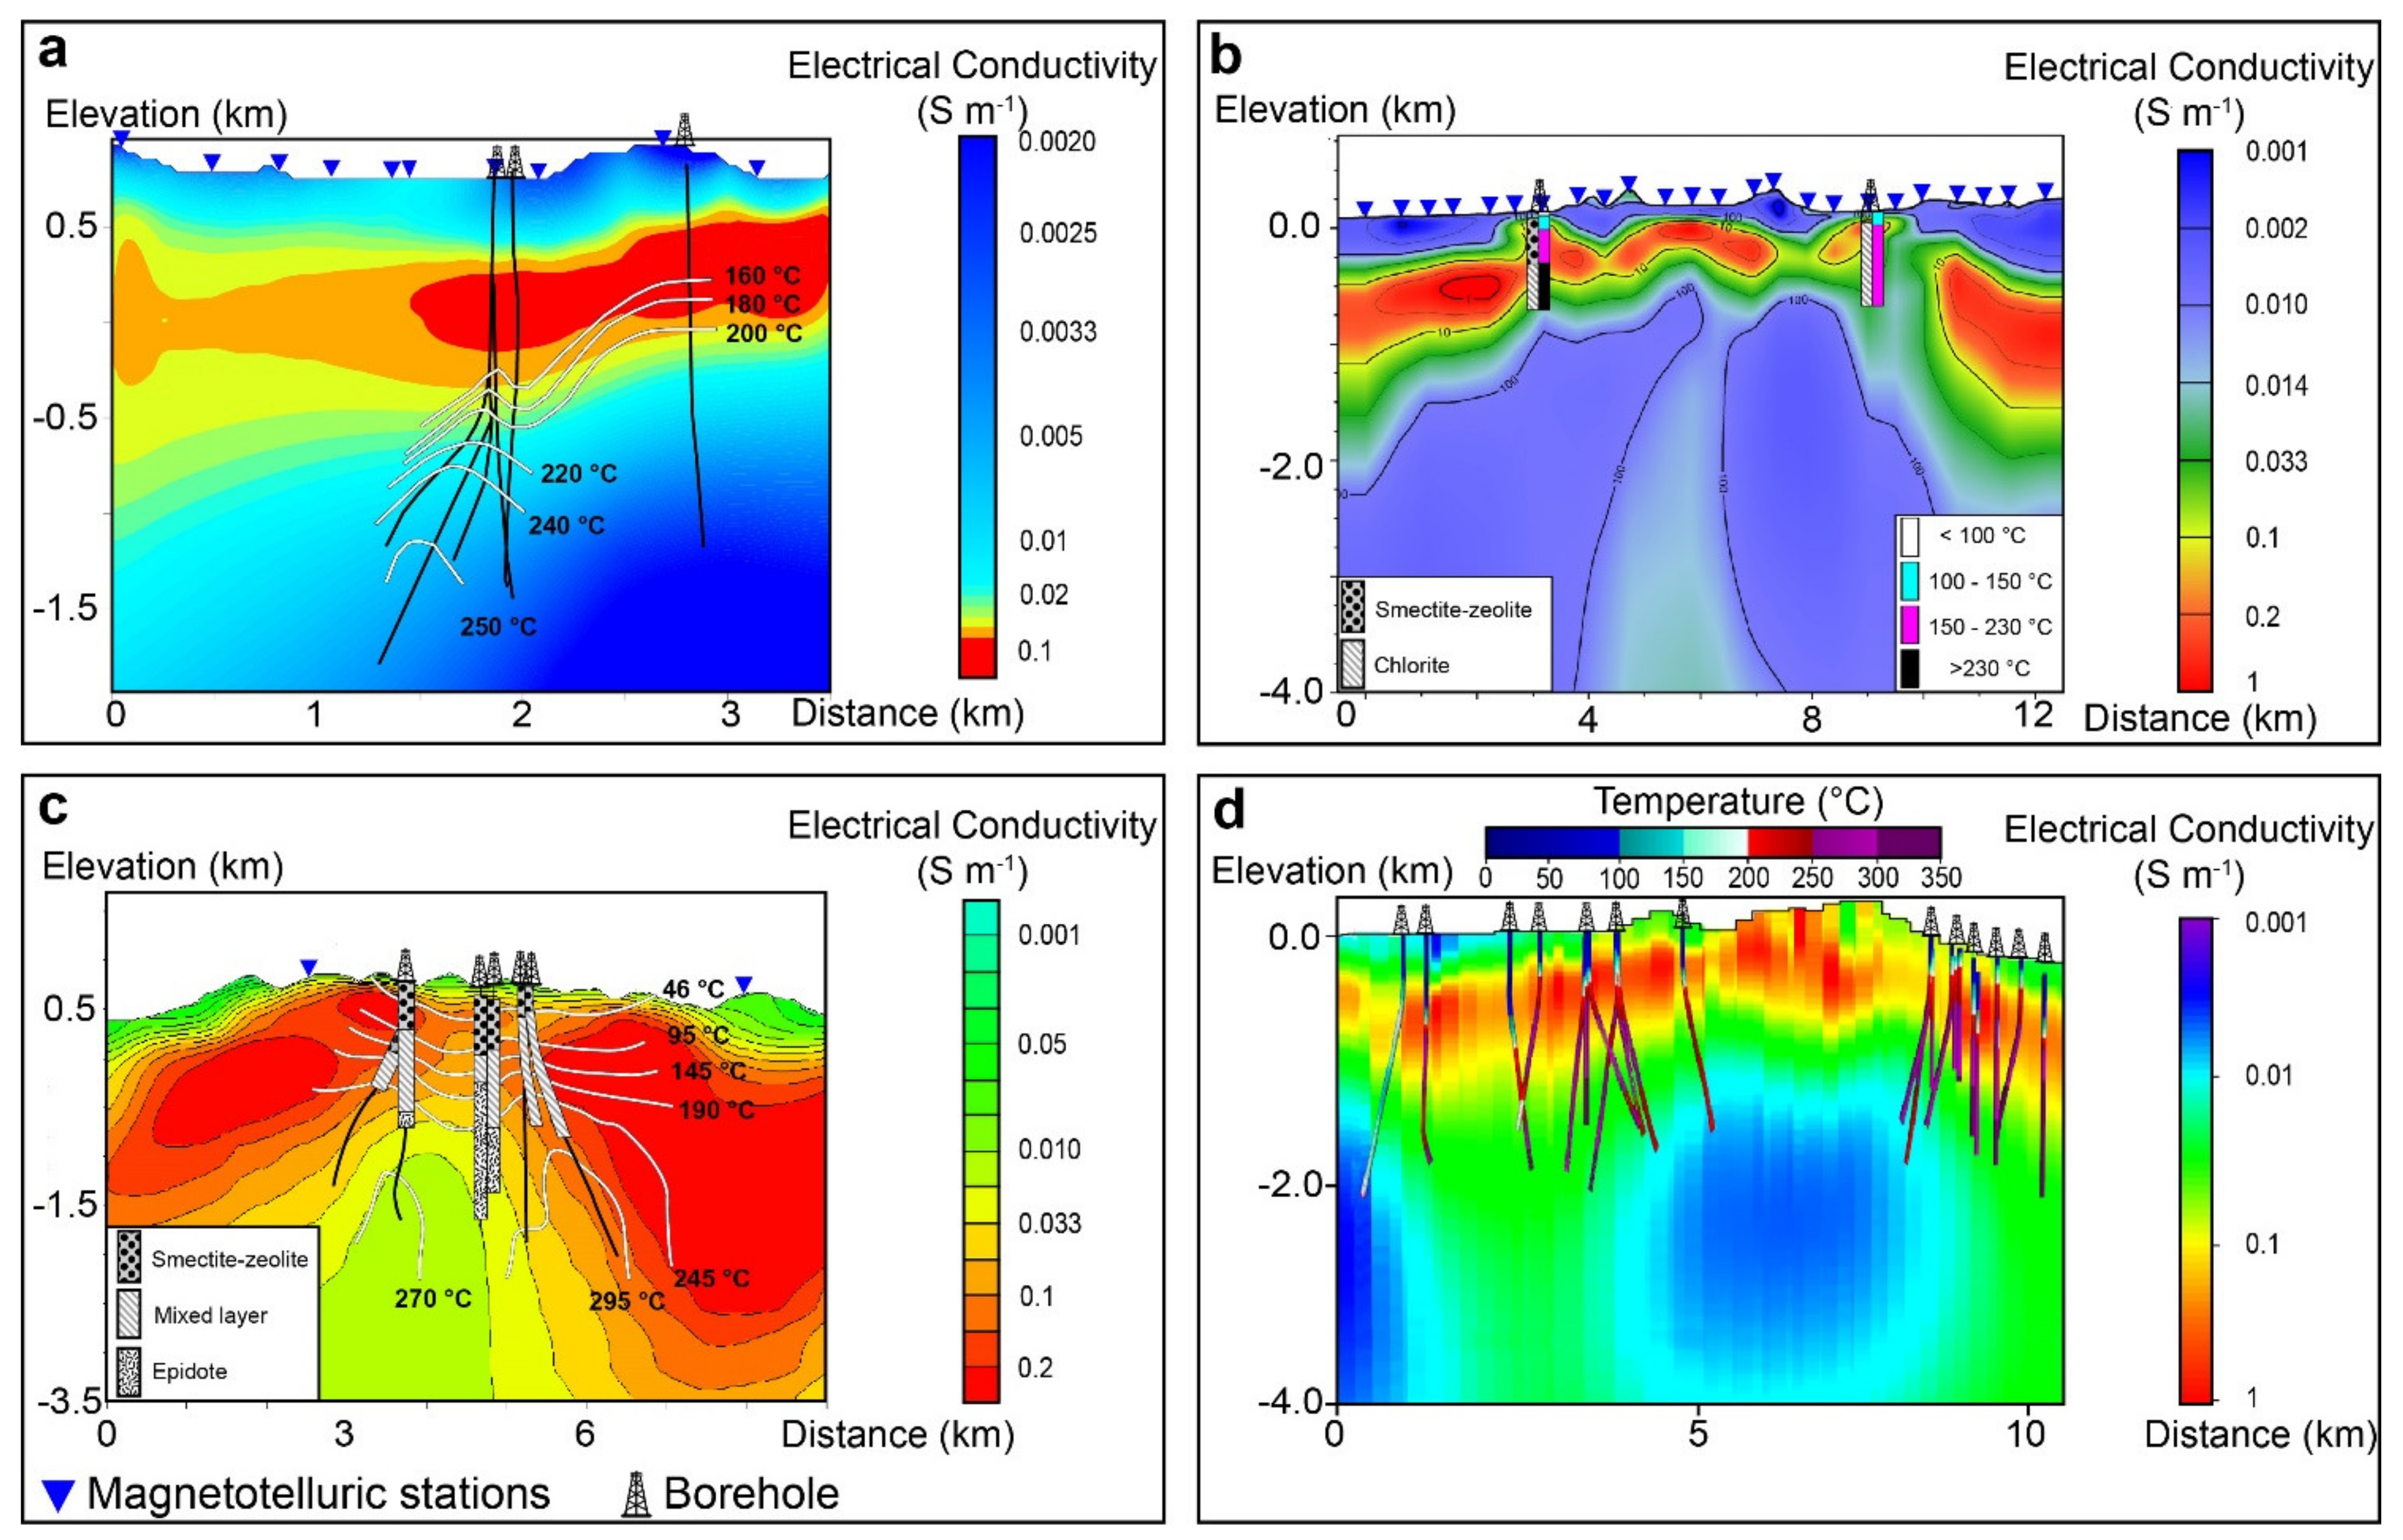
Electrical conductivity cross sections superimposed with rock lithology and temperature in boreholes. (a) Takigami geothermal area (modified after Ushijima et al. [81]). (b) Krýsuvík geothermal area, Iceland (modified after Hersir et al. [82]). (c) Bacon-Manito geothermal area, Philippines (modified after Tugawin et al. [83]). (d) Hengill geothermal fields, Iceland (modified after Gasperikova et al. [84]). Shallow resistive regions (<0.01 S·m−1) are associated with cold (<50 °C) and unaltered rocks, while conductive formations (0.1–1 S·m−1) correspond to a recognized smectite rich clay-cap with moderated-high temperatures (50–220 °C).
Figure 10.
Electrical conductivity cross sections superimposed with rock lithology and temperature in boreholes. (a) Takigami geothermal area (modified after Ushijima et al. [81]). (b) Krýsuvík geothermal area, Iceland (modified after Hersir et al. [82]). (c) Bacon-Manito geothermal area, Philippines (modified after Tugawin et al. [83]). (d) Hengill geothermal fields, Iceland (modified after Gasperikova et al. [84]). Shallow resistive regions (<0.01 S·m−1) are associated with cold (<50 °C) and unaltered rocks, while conductive formations (0.1–1 S·m−1) correspond to a recognized smectite rich clay-cap with moderated-high temperatures (50–220 °C).

3.4. Influence of Magnetite and Pyrite
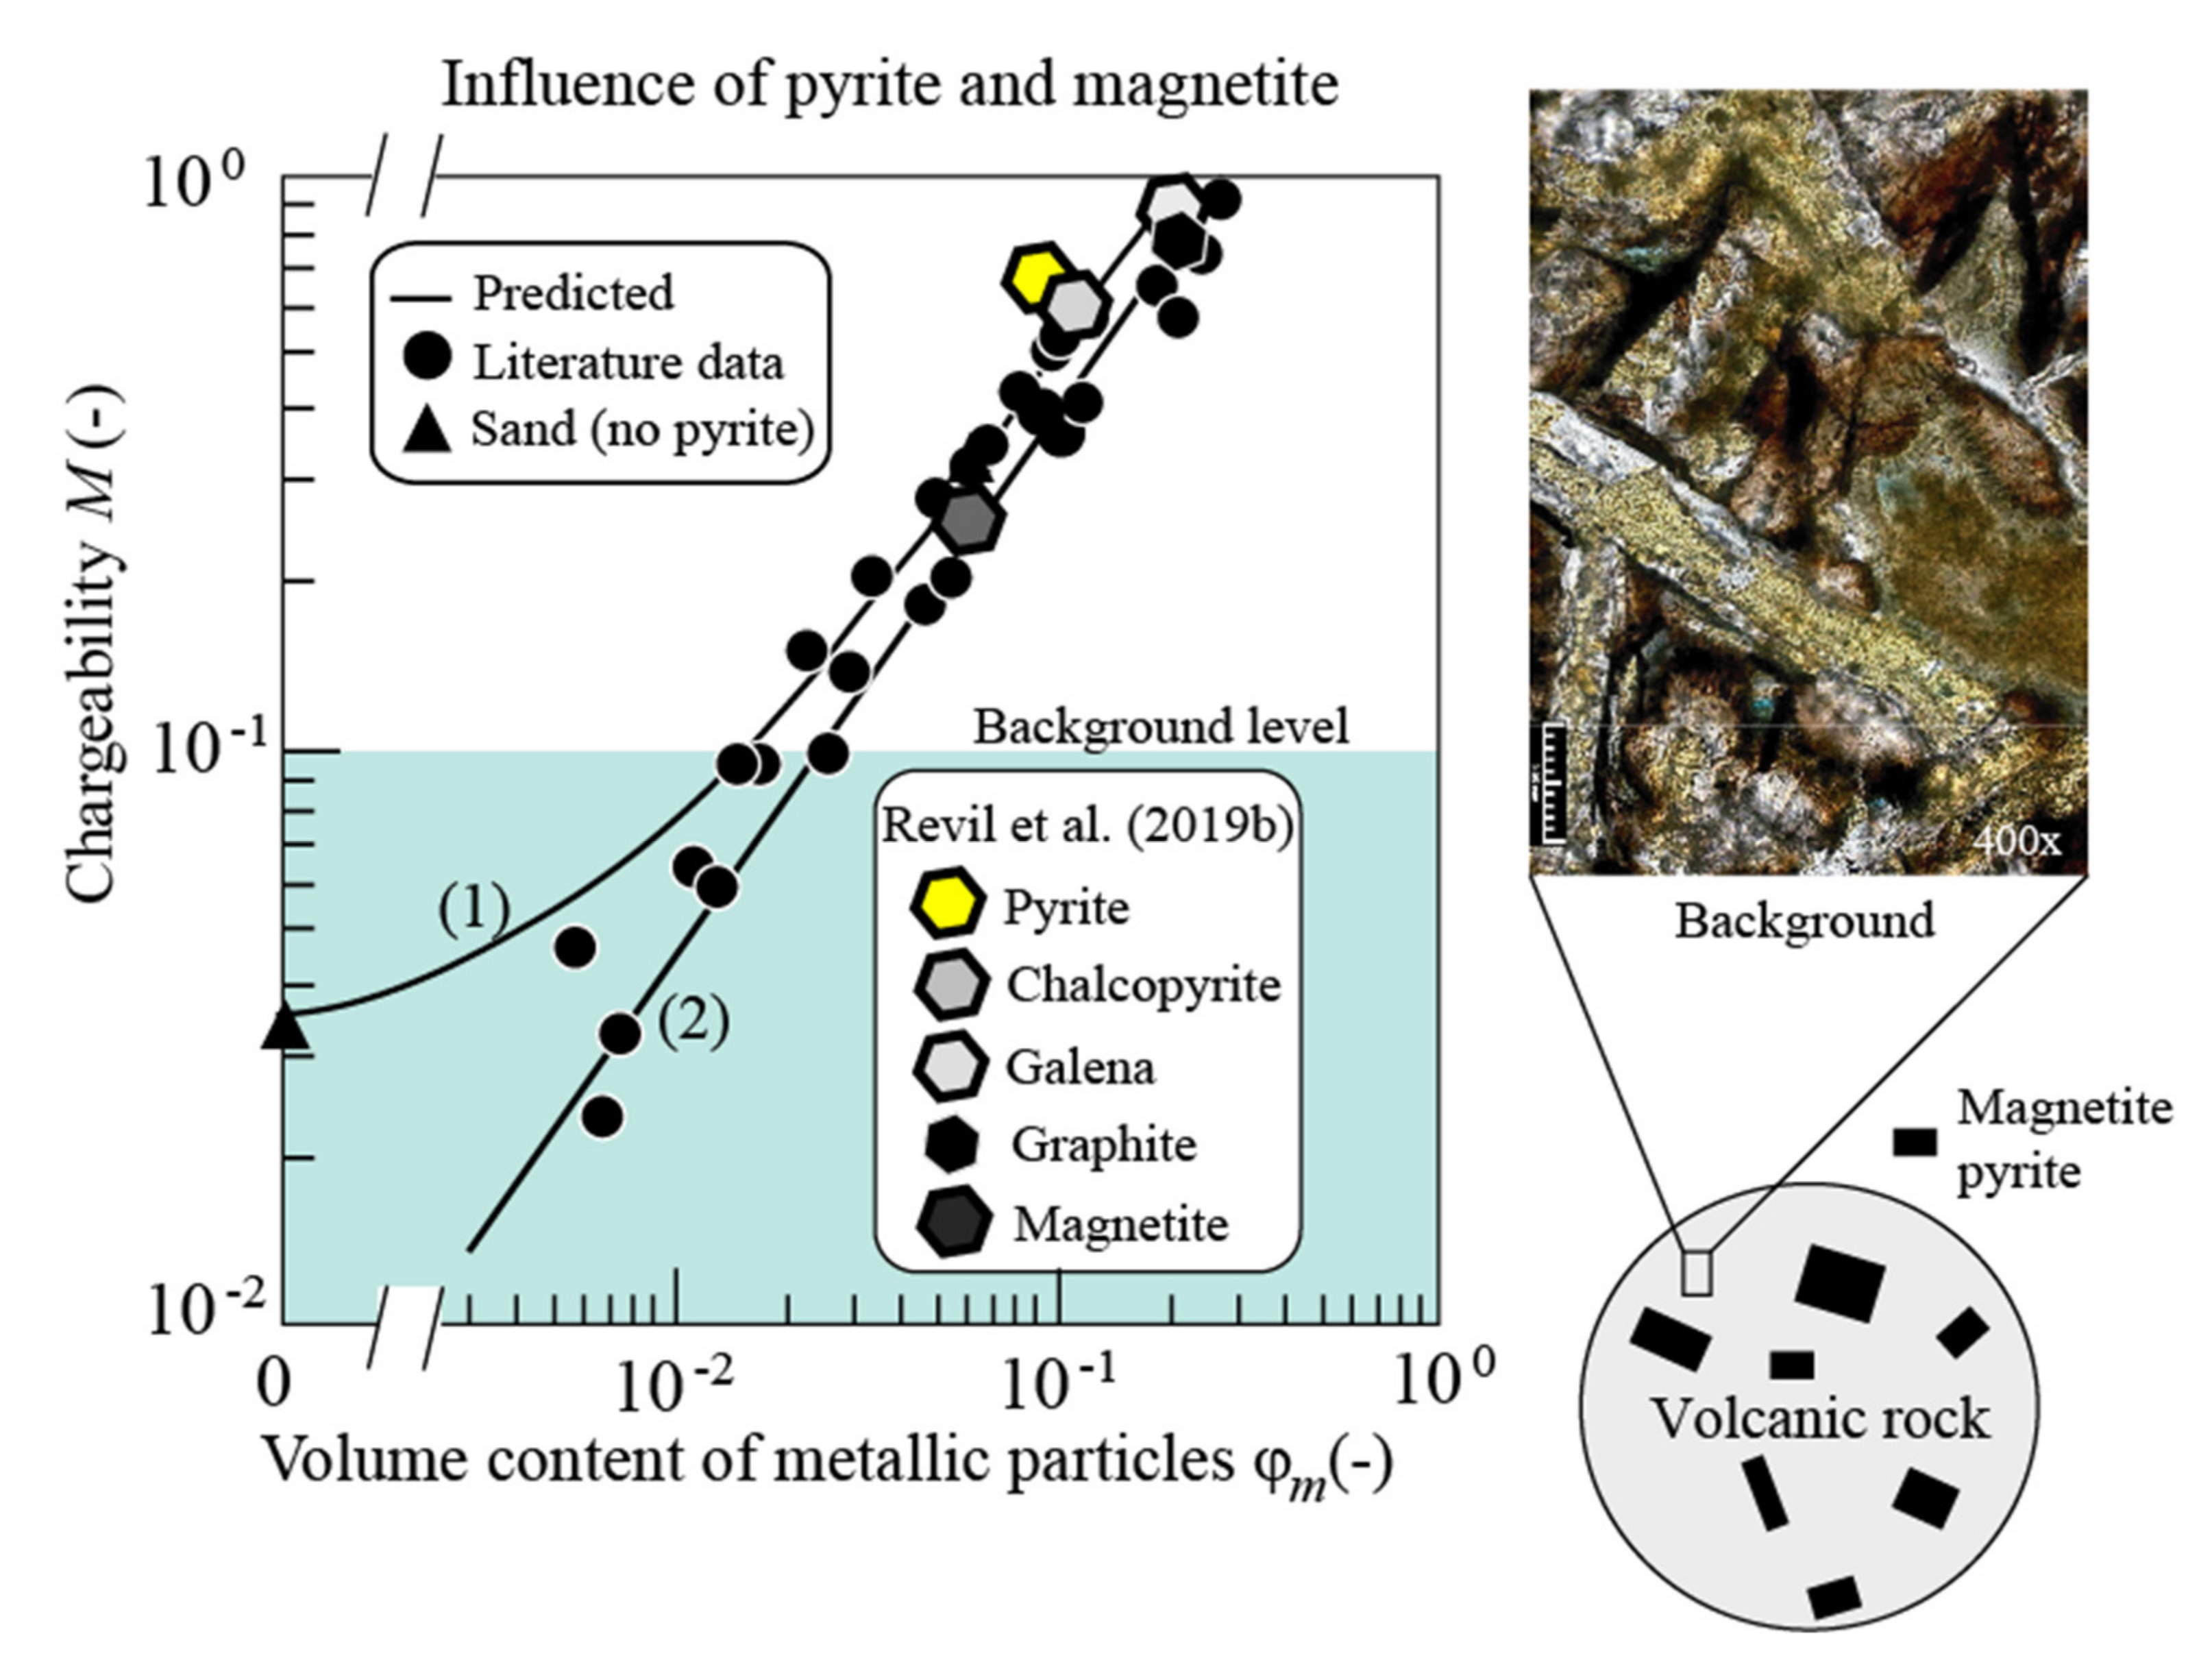
Magnetite (including titanomagnetite) is present in fresh basalts and serpentinized peridotites. Pyrite is an extremely common alteration mineral in volcanic and geothermal systems to temperatures exceeding 300 °C. The presence of pyrite and magnetite (two semi-conductors) have a strong effect on the normalized chargeability as discussed by Ghorbani et al. [38] and Revil et al. [52] for volcanic rocks. In presence of pyrite and magnetite (with volume fraction ), Revil et al. [52] obtained the following expression of the normalized chargeability of the mixture shown in Figure 12: , where refers to the normalized chargeability of the background given by Equation (5). Therefore a small amount of pyrite or magnetite (higher than 1 to 2 vol.% for altered clay-rich rocks, see Figure 12) has an effect on the normalized chargeability and chargeability of the material. For the type of mixture shown in Figure 12, the chargeability of the volcanic rocks (ratio of the normalized chargeability by the conductivity of the rock) is given by [52,85,86]
where the last term of Equation (8) corresponds to the chargeability of the background material. In other words, the chargeability depends both on the CEC and volume content of magnetite and pyrite. This shows the high interest to connect induced polarization parameters to the Ishikawa rock alteration index and reactive transport numerical models.
Figure 11.
Field temperature dependence of the normalized chargeability and surface conductivity versus equilibrium temperature in the wells. (a) Relationship between the normalized chargeability (corrected for the in situ temperature) and the equilibrium temperature (with T in °C) recorded in the wells. (b) Relationship between the surface conductivity (corrected for the in situ temperature) and the equilibrium temperature (with T in °C) recorded in the boreholes. This dependence is much stronger than the dependence shown in Figure 7 and can be understood in terms of the variation of the CEC with the temperature-dependent mineralogy of the alteration facies described in Figure 9b.

Figure 12.
Influence of pyrite and magnetite upon the chargeability (dimensionless) of a volcanic rocks. Depending on the degree of alteration, the maximum value associated with clay minerals is Mb = R = 0.10 ± 0.02. In this case, a critical volume fraction of 1 to 2% of pyrite or magnetite can have an effect upon the chargeability of the rock considered as a mixture of metallic and non-metallic grains. The effect on the conductivity itself is nearly negligible (see details in Revil et al. [75] and references therein). The literature data (pyrite and chalcopyrite) are from Pelton et al. [87], Mahan et al. [88], Phillips [89], and Gurin et al. [90]. The predicted trends 1 and 2 are based on Equation (8) using two distinct values for the chargeability of the background material.

4. Applications
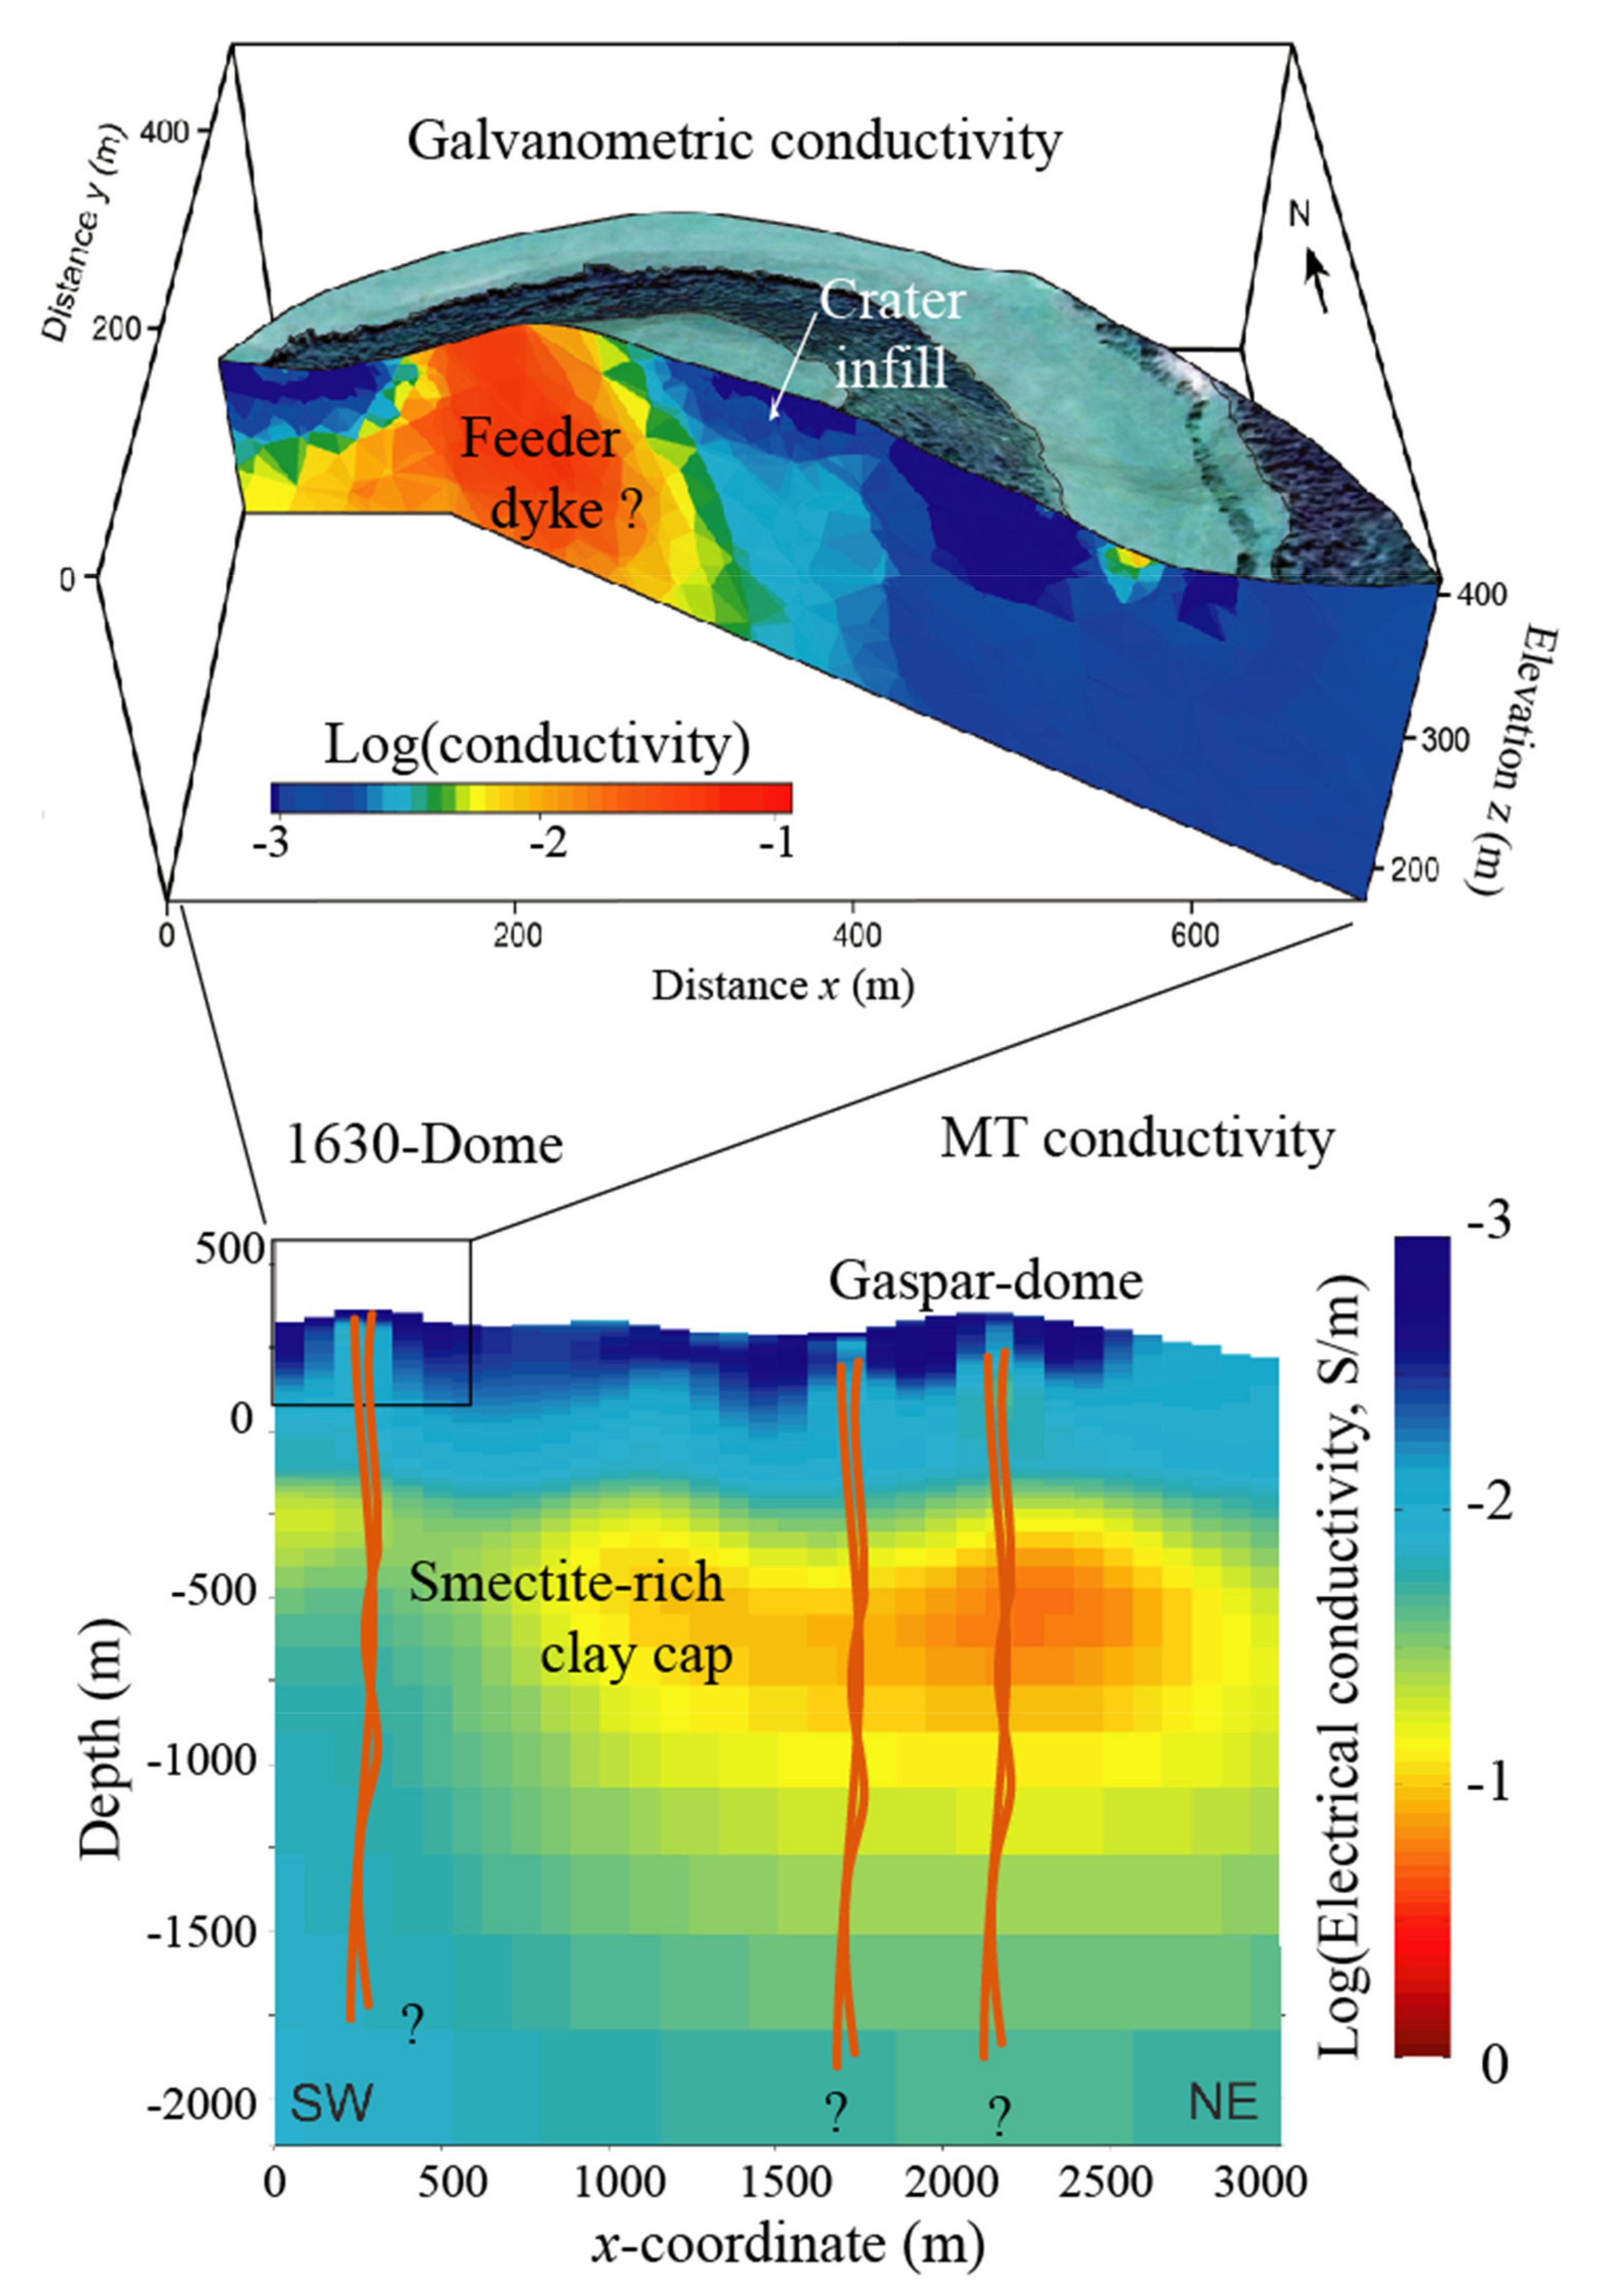
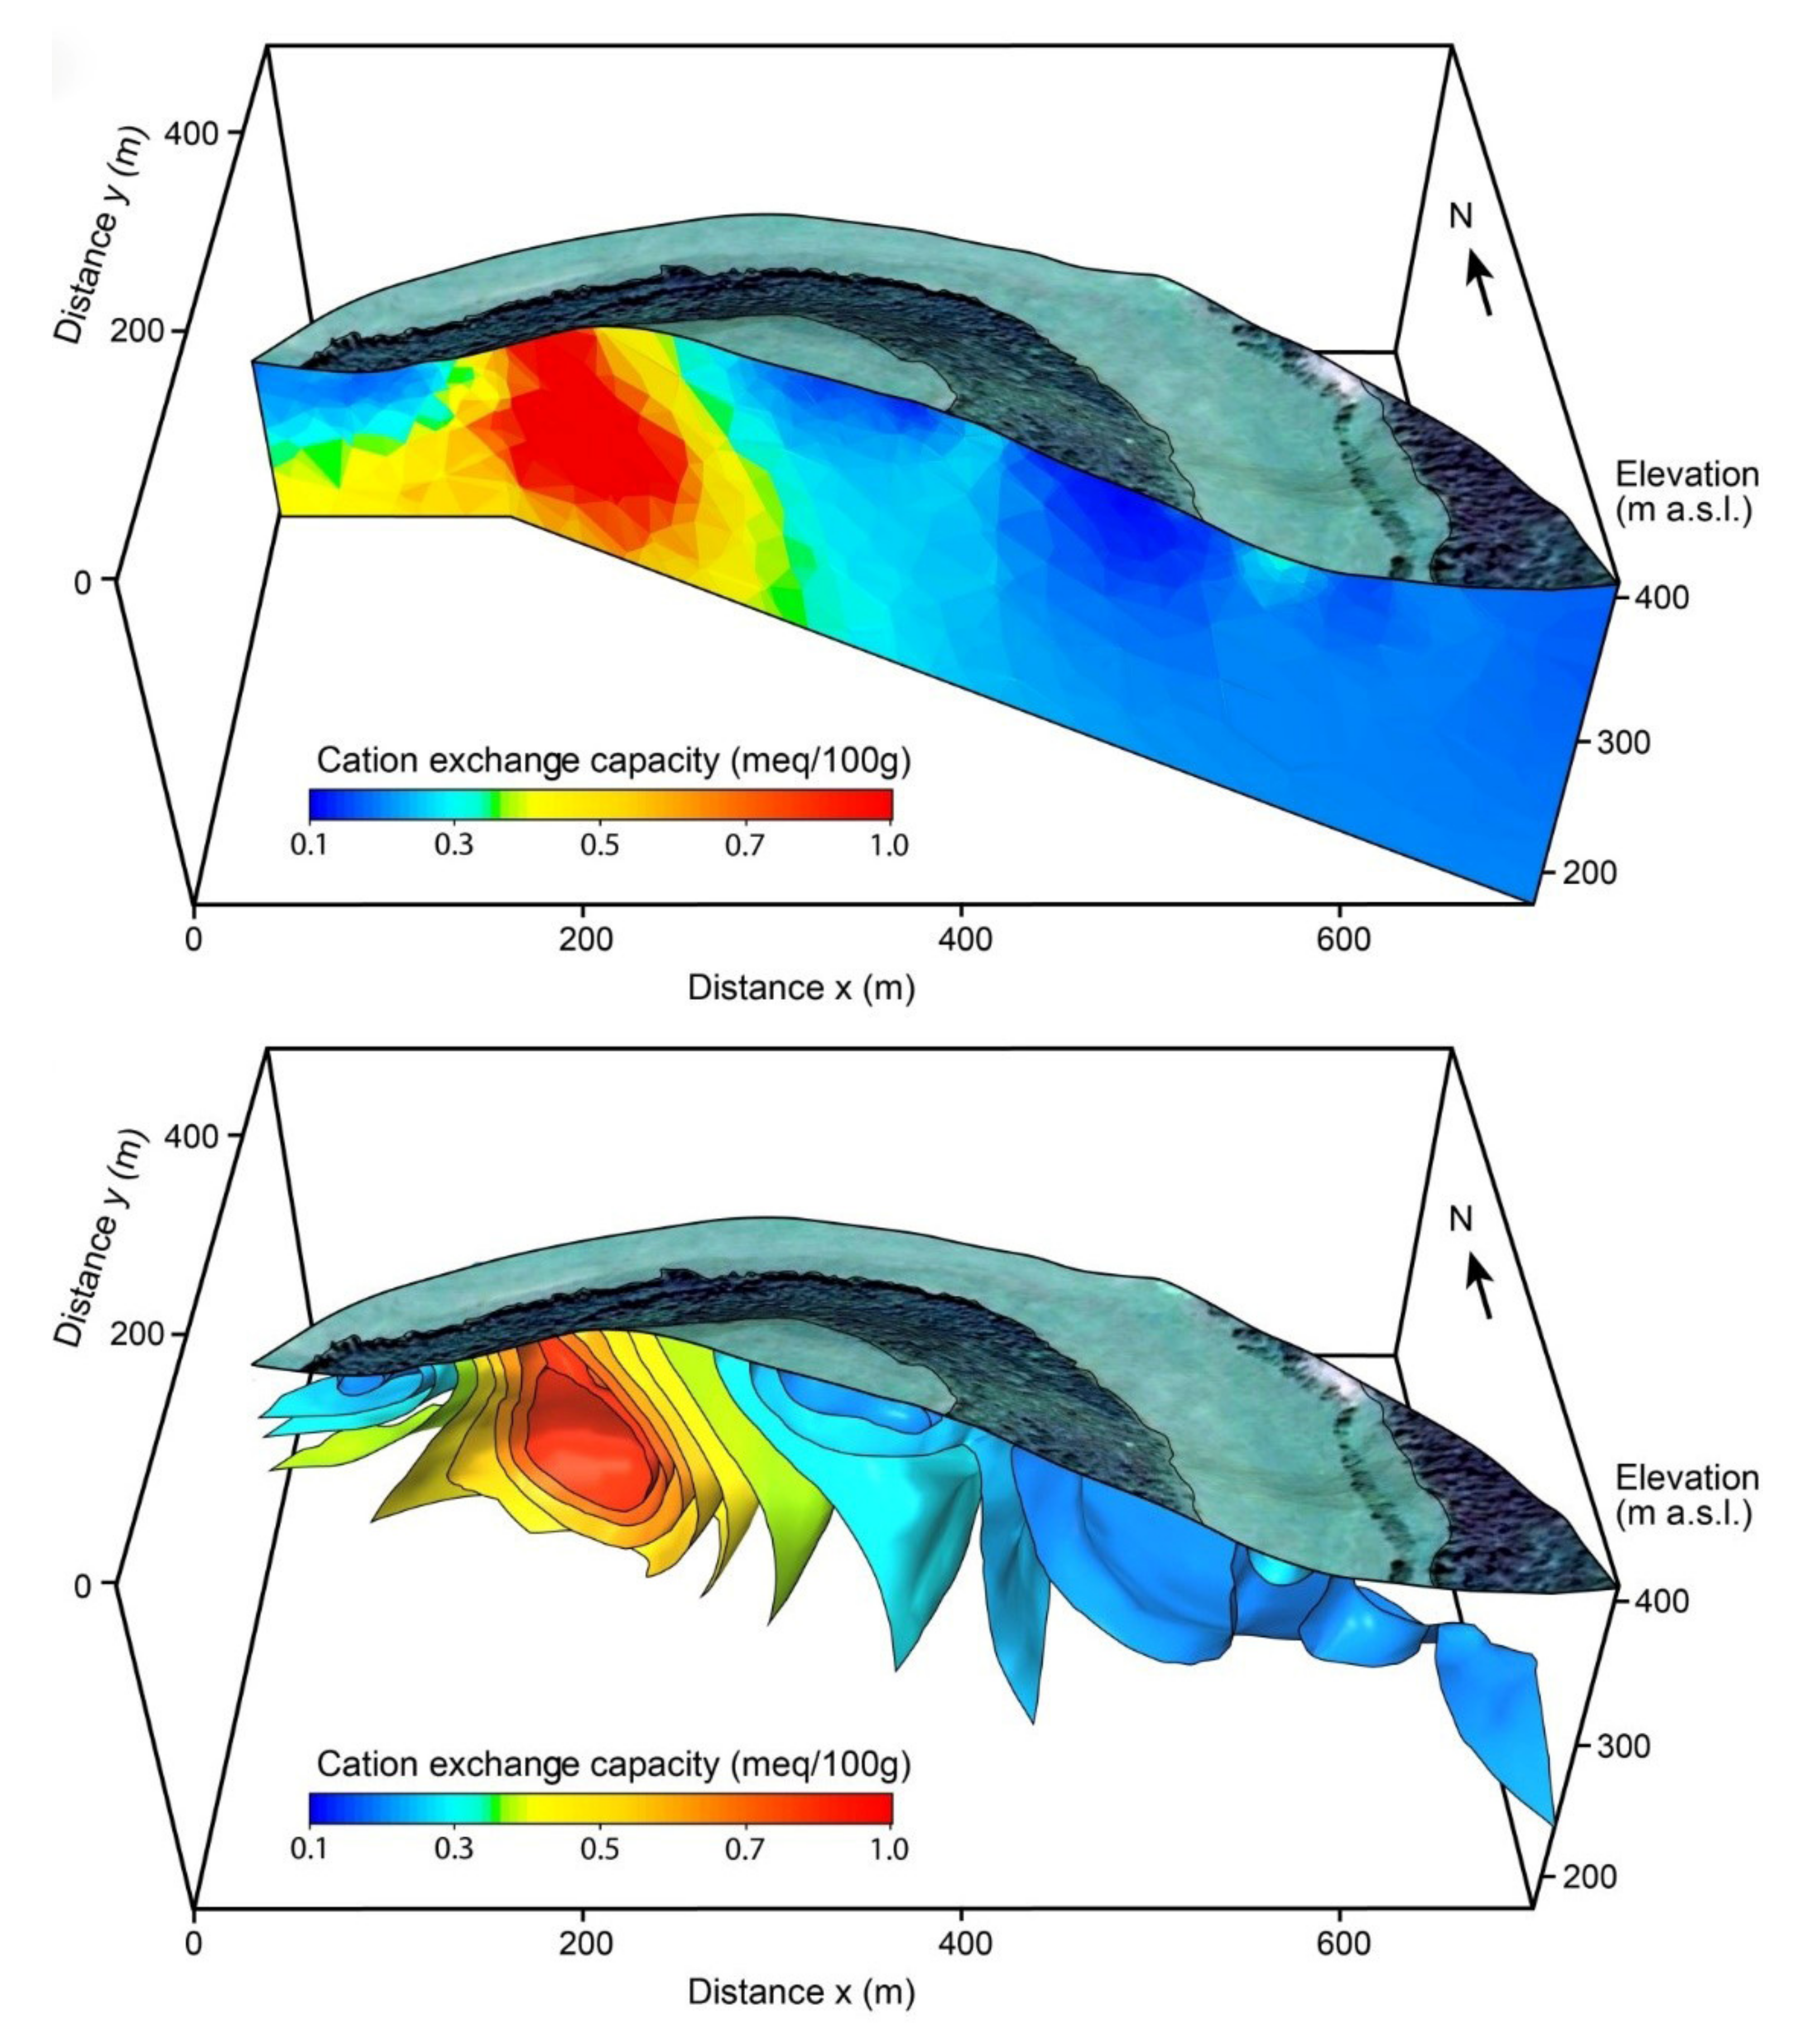
In this section, we show a few applications of electrical conductivity and normalized chargeability tomography applied to the hydrothermal systems of active volcanoes. In the first application, electrical conductivity tomography is used to identify volcanic vents because magmatic conduits are expected to be associated with alteration halos, which can be observed through their high surface conductivity. In Figure 13, the detection of vents associated with monogenic domes (1630-dome) at Furnas volcano (San Miguel Island, Portugal) can be clearly identified as conductive features. For the 1630-dome, high-resolution electrical conductivity is consistent with a deeper magnetotelluric conductivity profile highlighting conductive features associated with clay minerals at the outcrop. An induced polarization survey reveals that the conductive feature shown in Figure 13 has a relatively higher CEC (1 meq/100 g) with respect to the background value (0.01 meq/100 g) indicating a relatively high alteration level around the conduits (Figure 14). This example illustrates very well the advantage of using induced polarization with respect to electrical conductivity alone. Electrical conductivity cannot discriminate if a portion of a volcano is conductive because of the high ionic strength of the pore water or the presence of clay minerals. Induced polarization can quantitatively distinguish such distinct features.
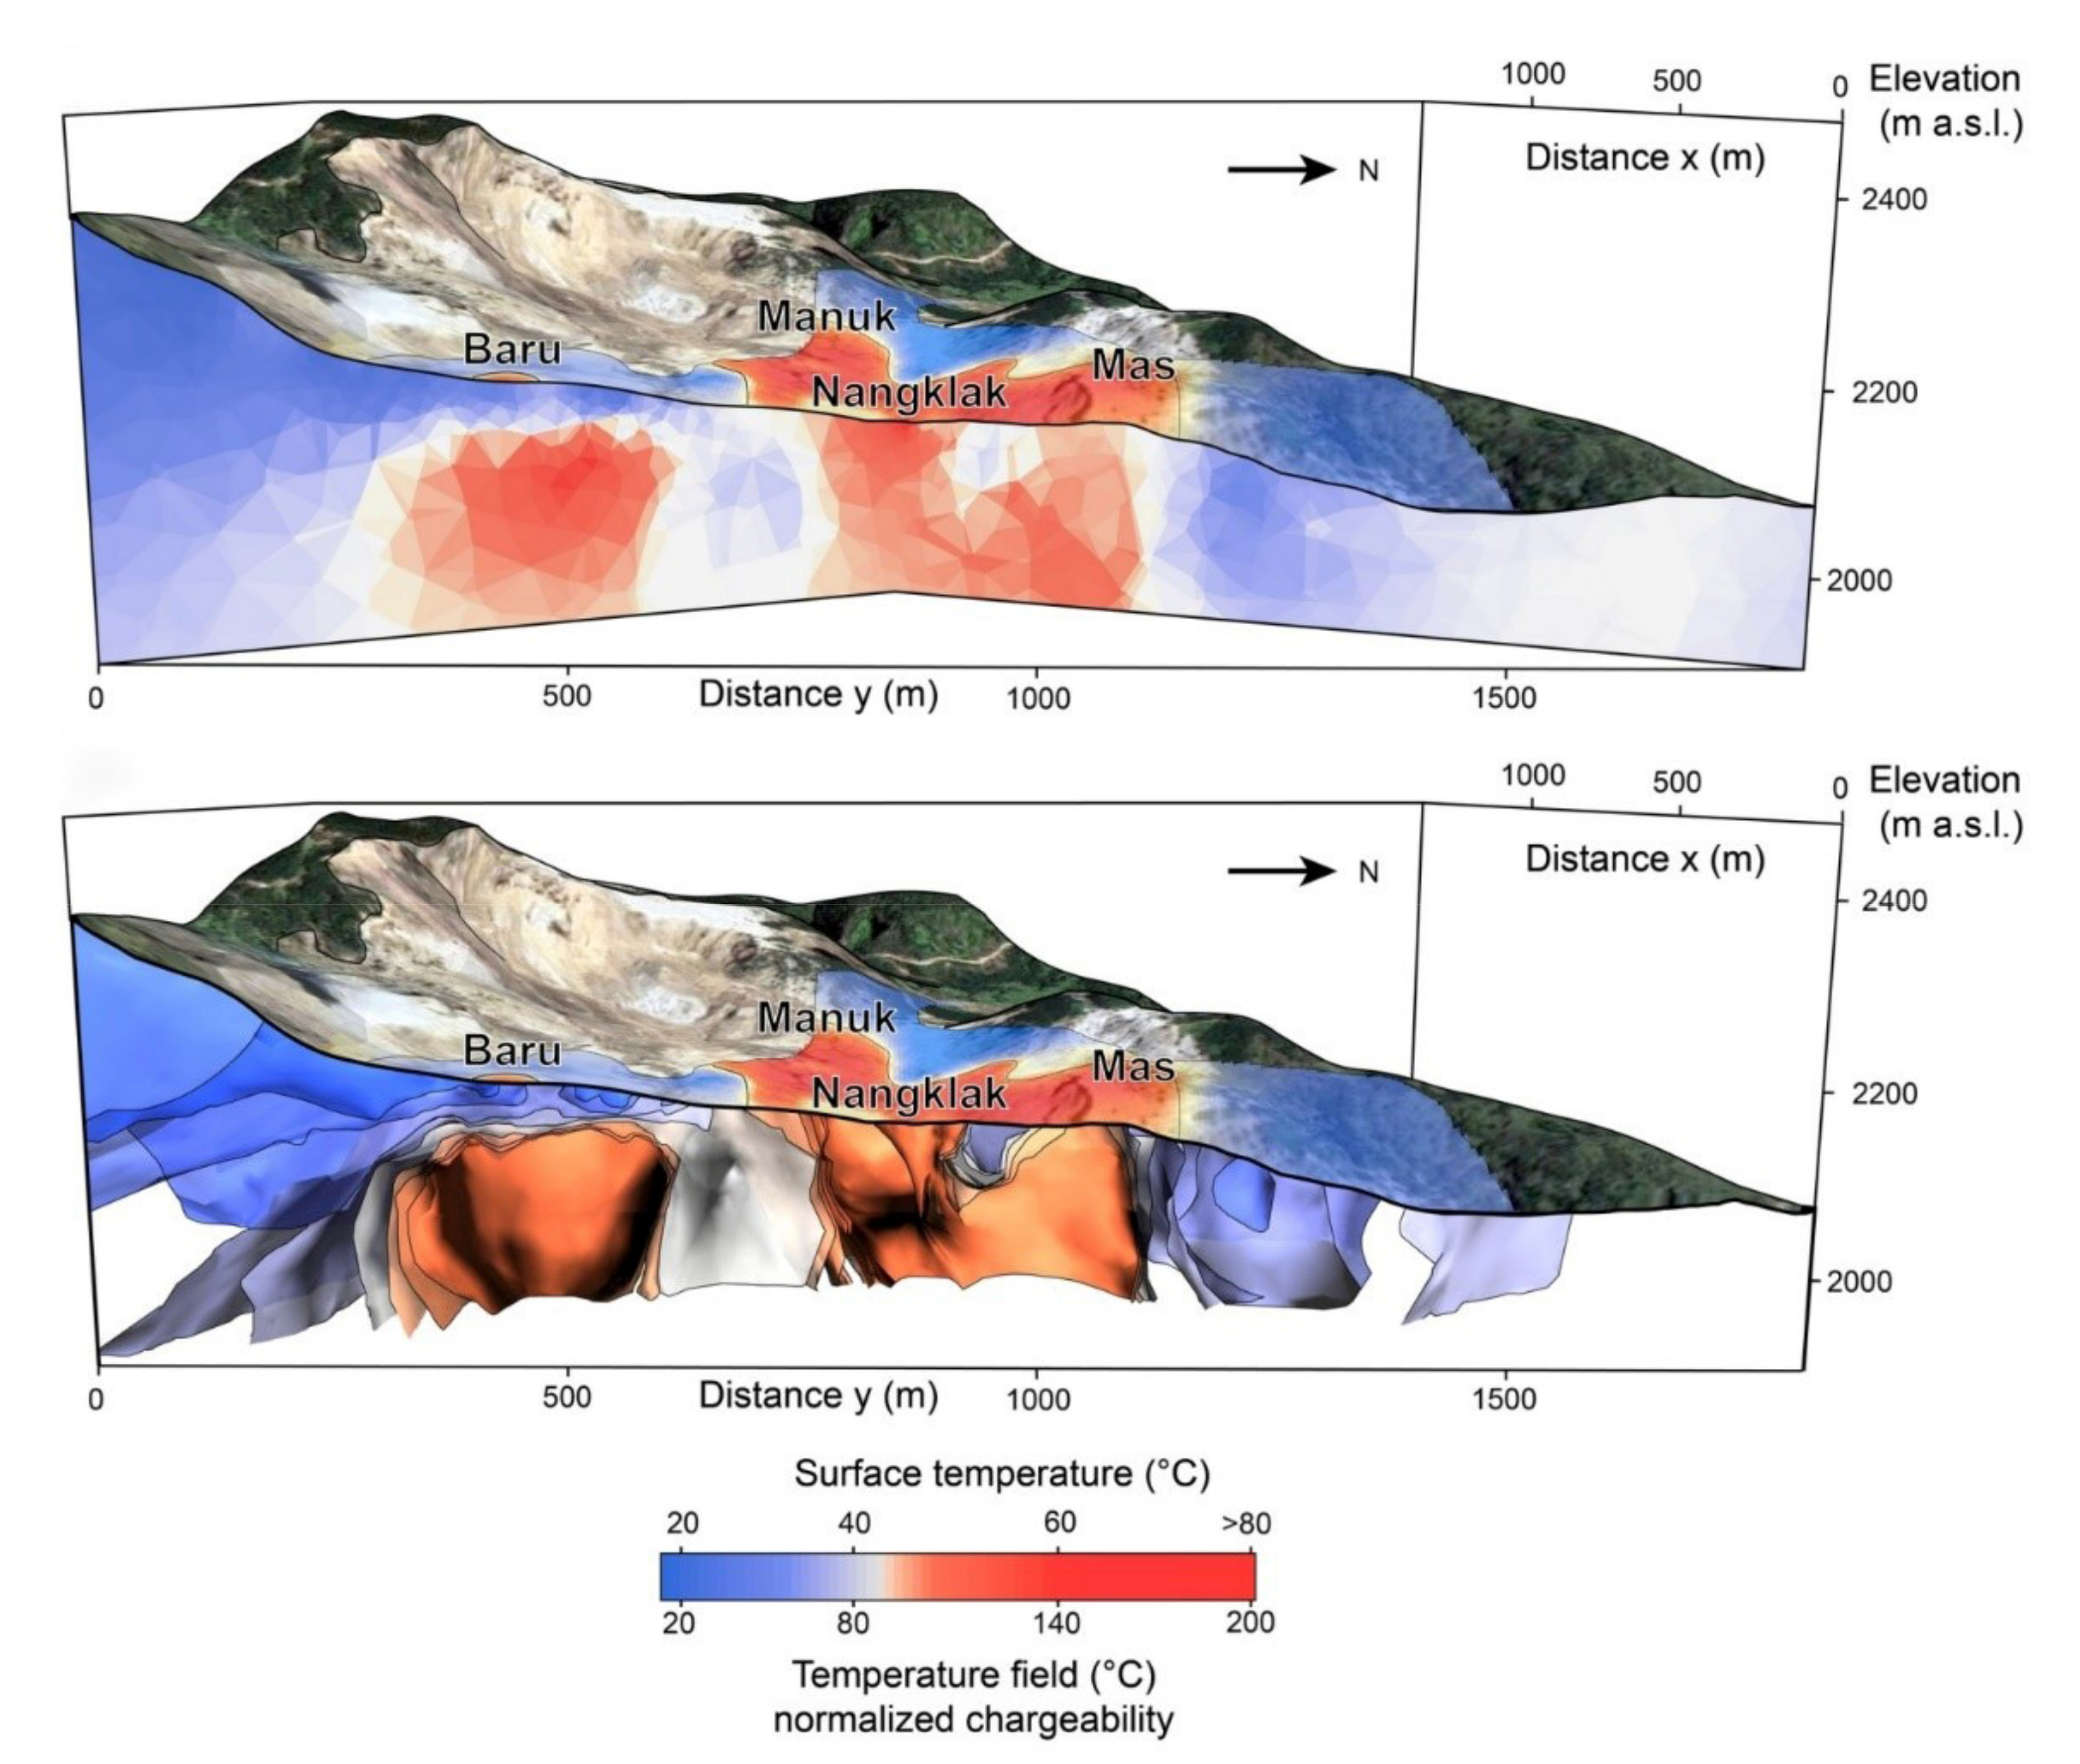
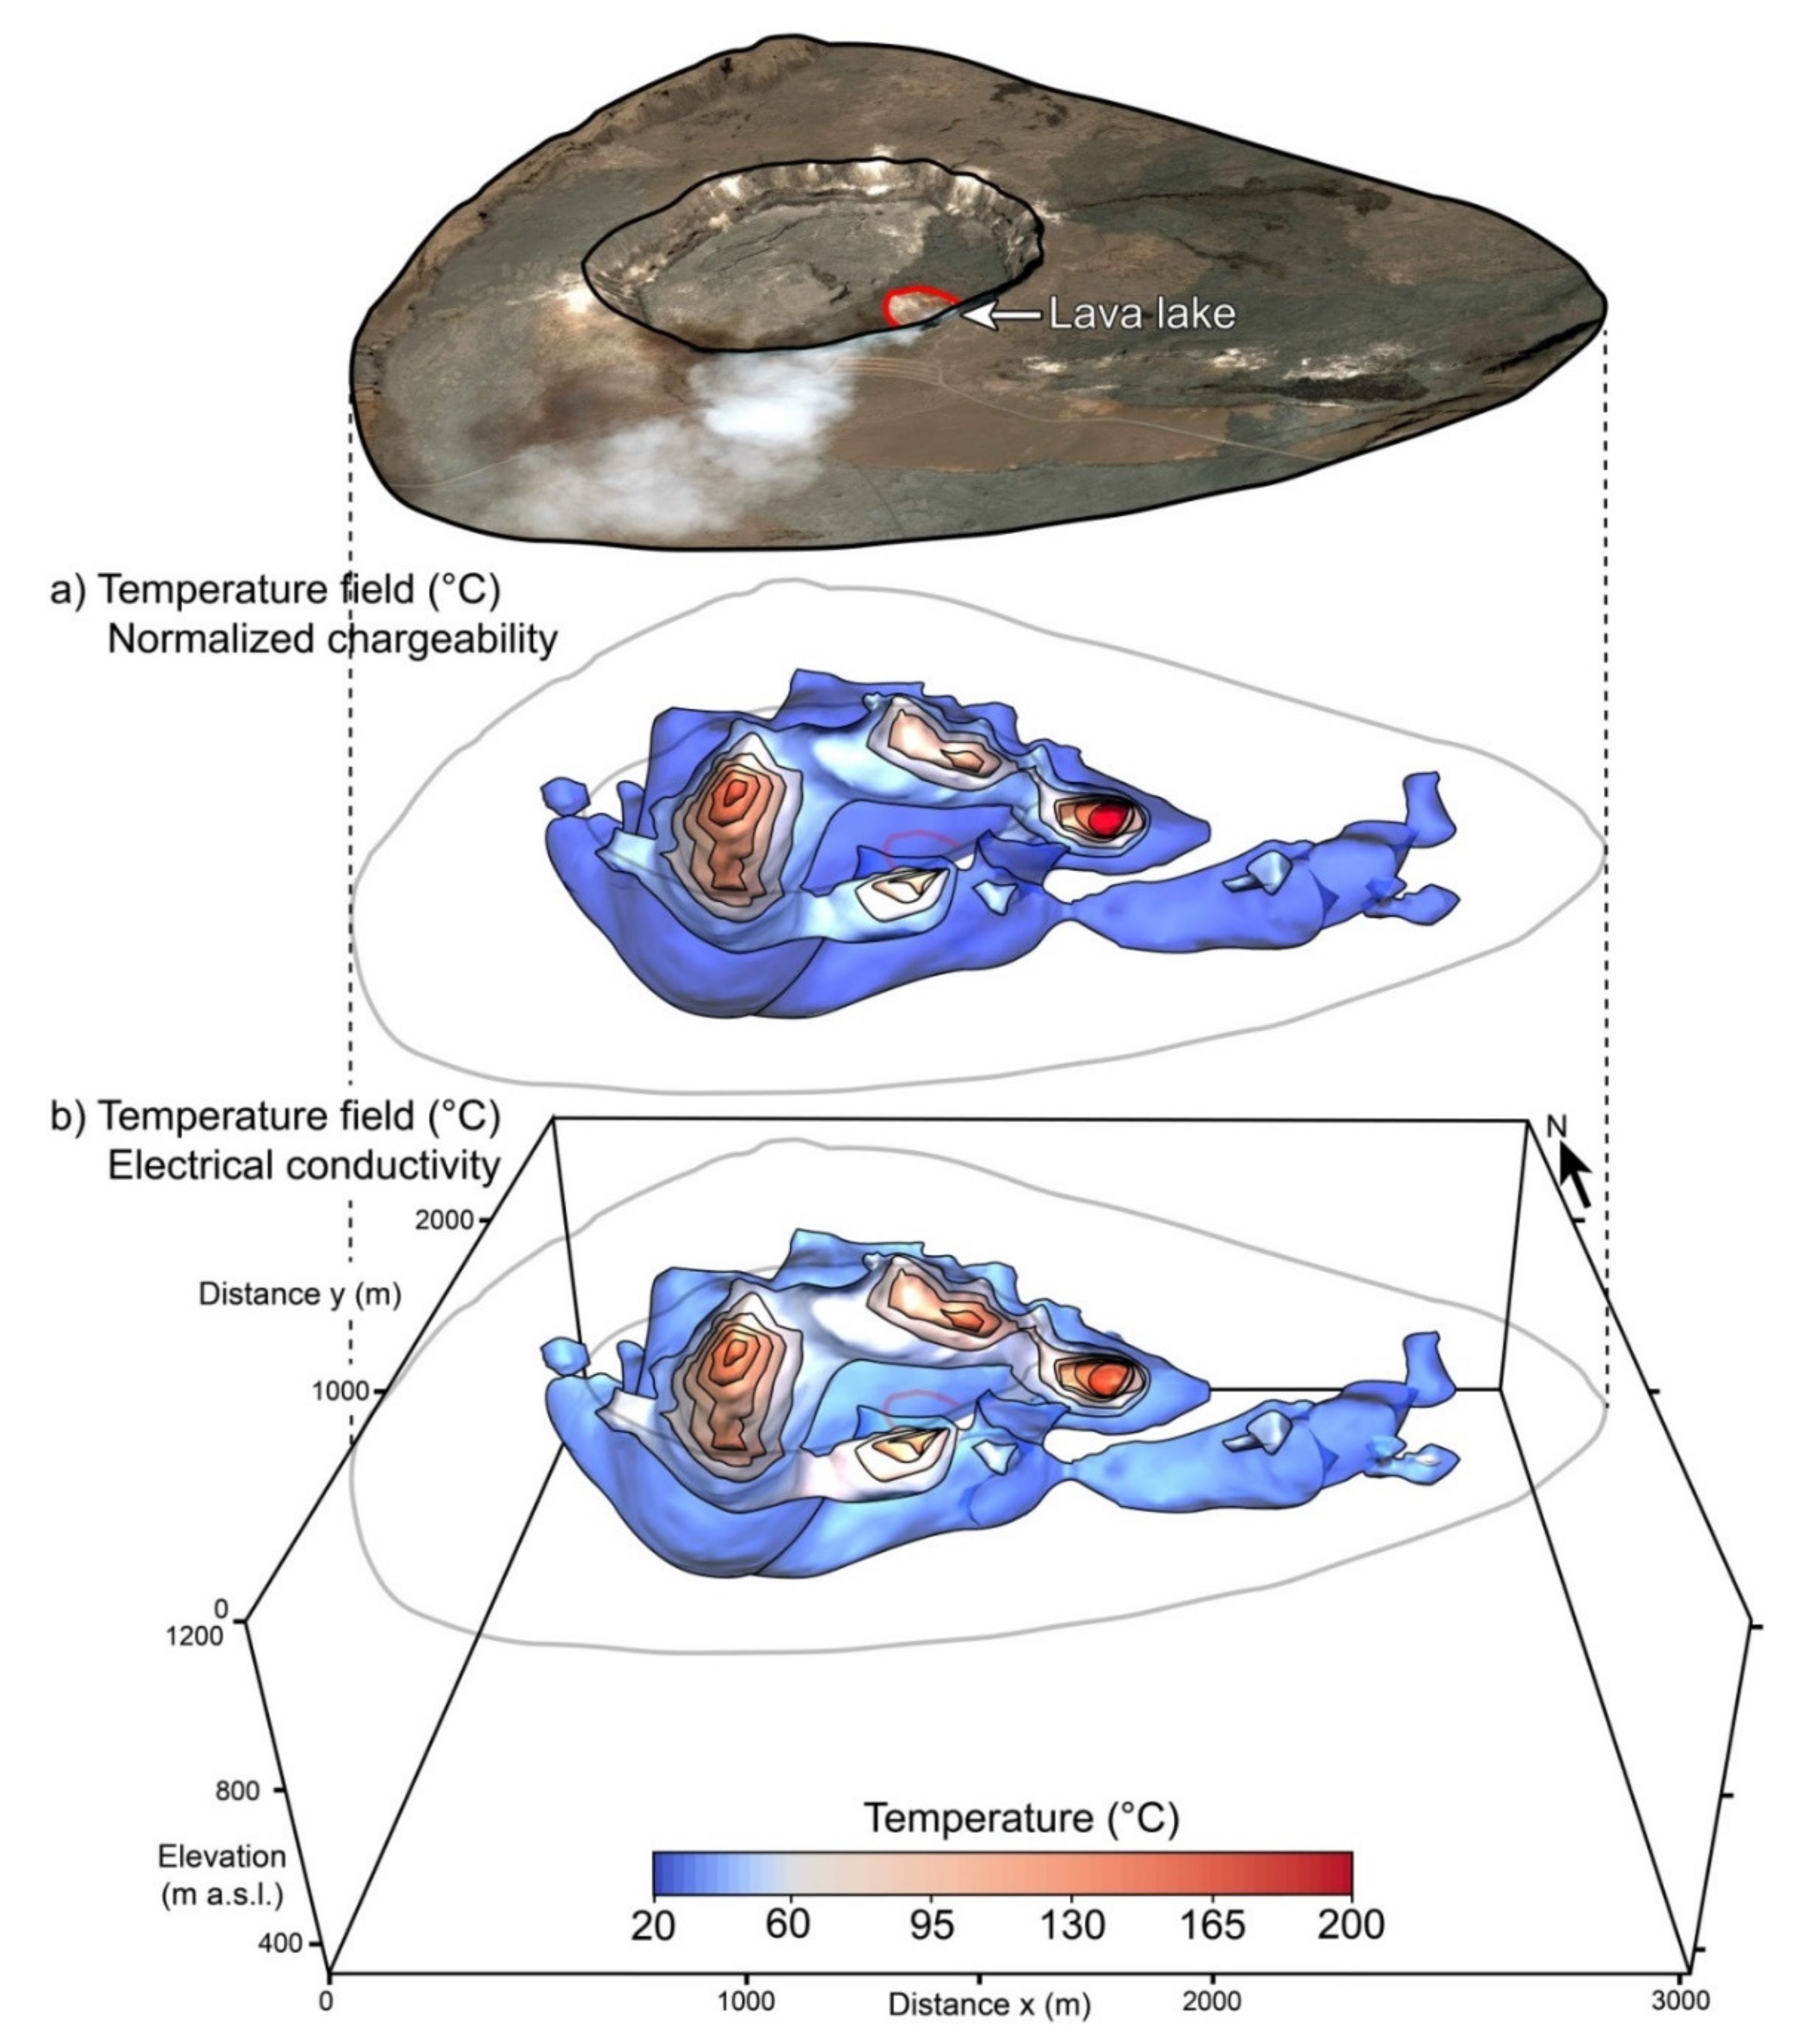
Papandayan volcano is a stratovolcano located in Indonesia. The upper part of Papandayan volcano was imaged through both electrical conductivity and normalized chargeability with a time-domain induced polarization survey. A tomogram of the subsurface temperature field using the normalized chargeability determined from the induced polarization measurements is shown in Figure 15. This 3D temperature distribution exhibits anomalies that are consistent with those observed at the ground surface by remote sensing. This is showing that the trends between the geoelectrical properties and temperature are likely highly reliable for various types of geothermal systems. Further checks in field conditions remain to be done to examine the level of uncertainty associated with such temperature predictions.
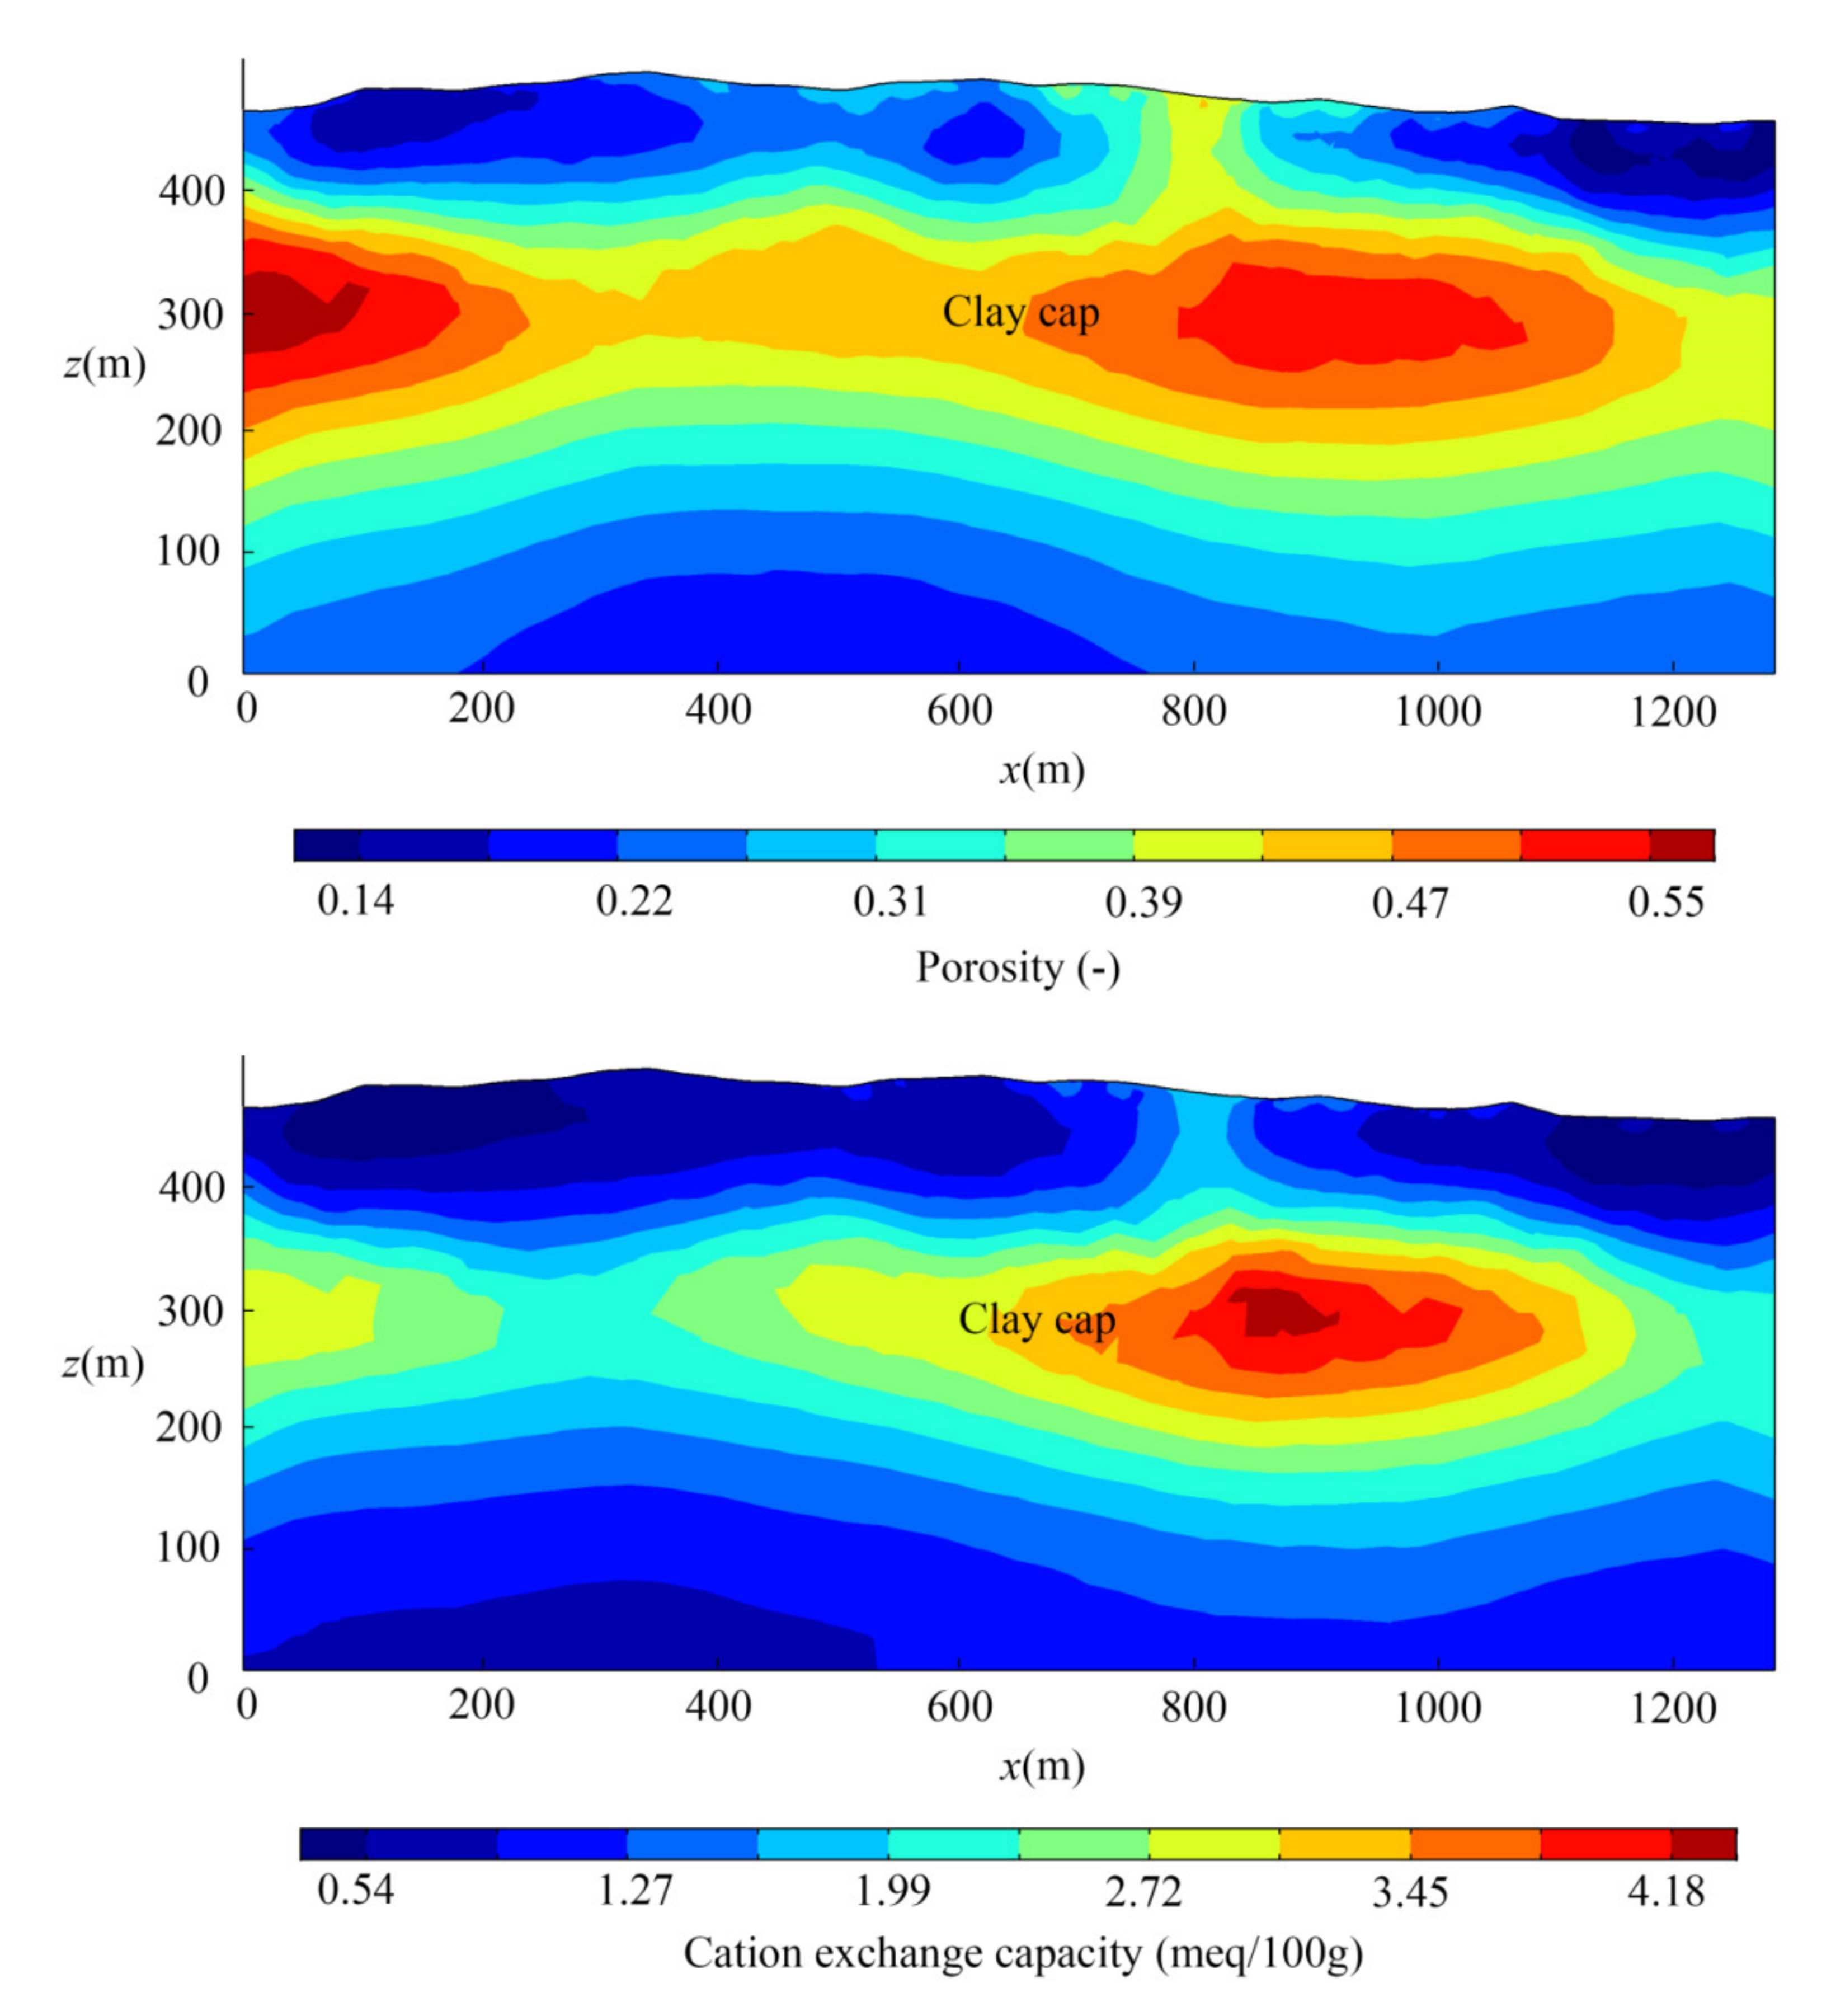
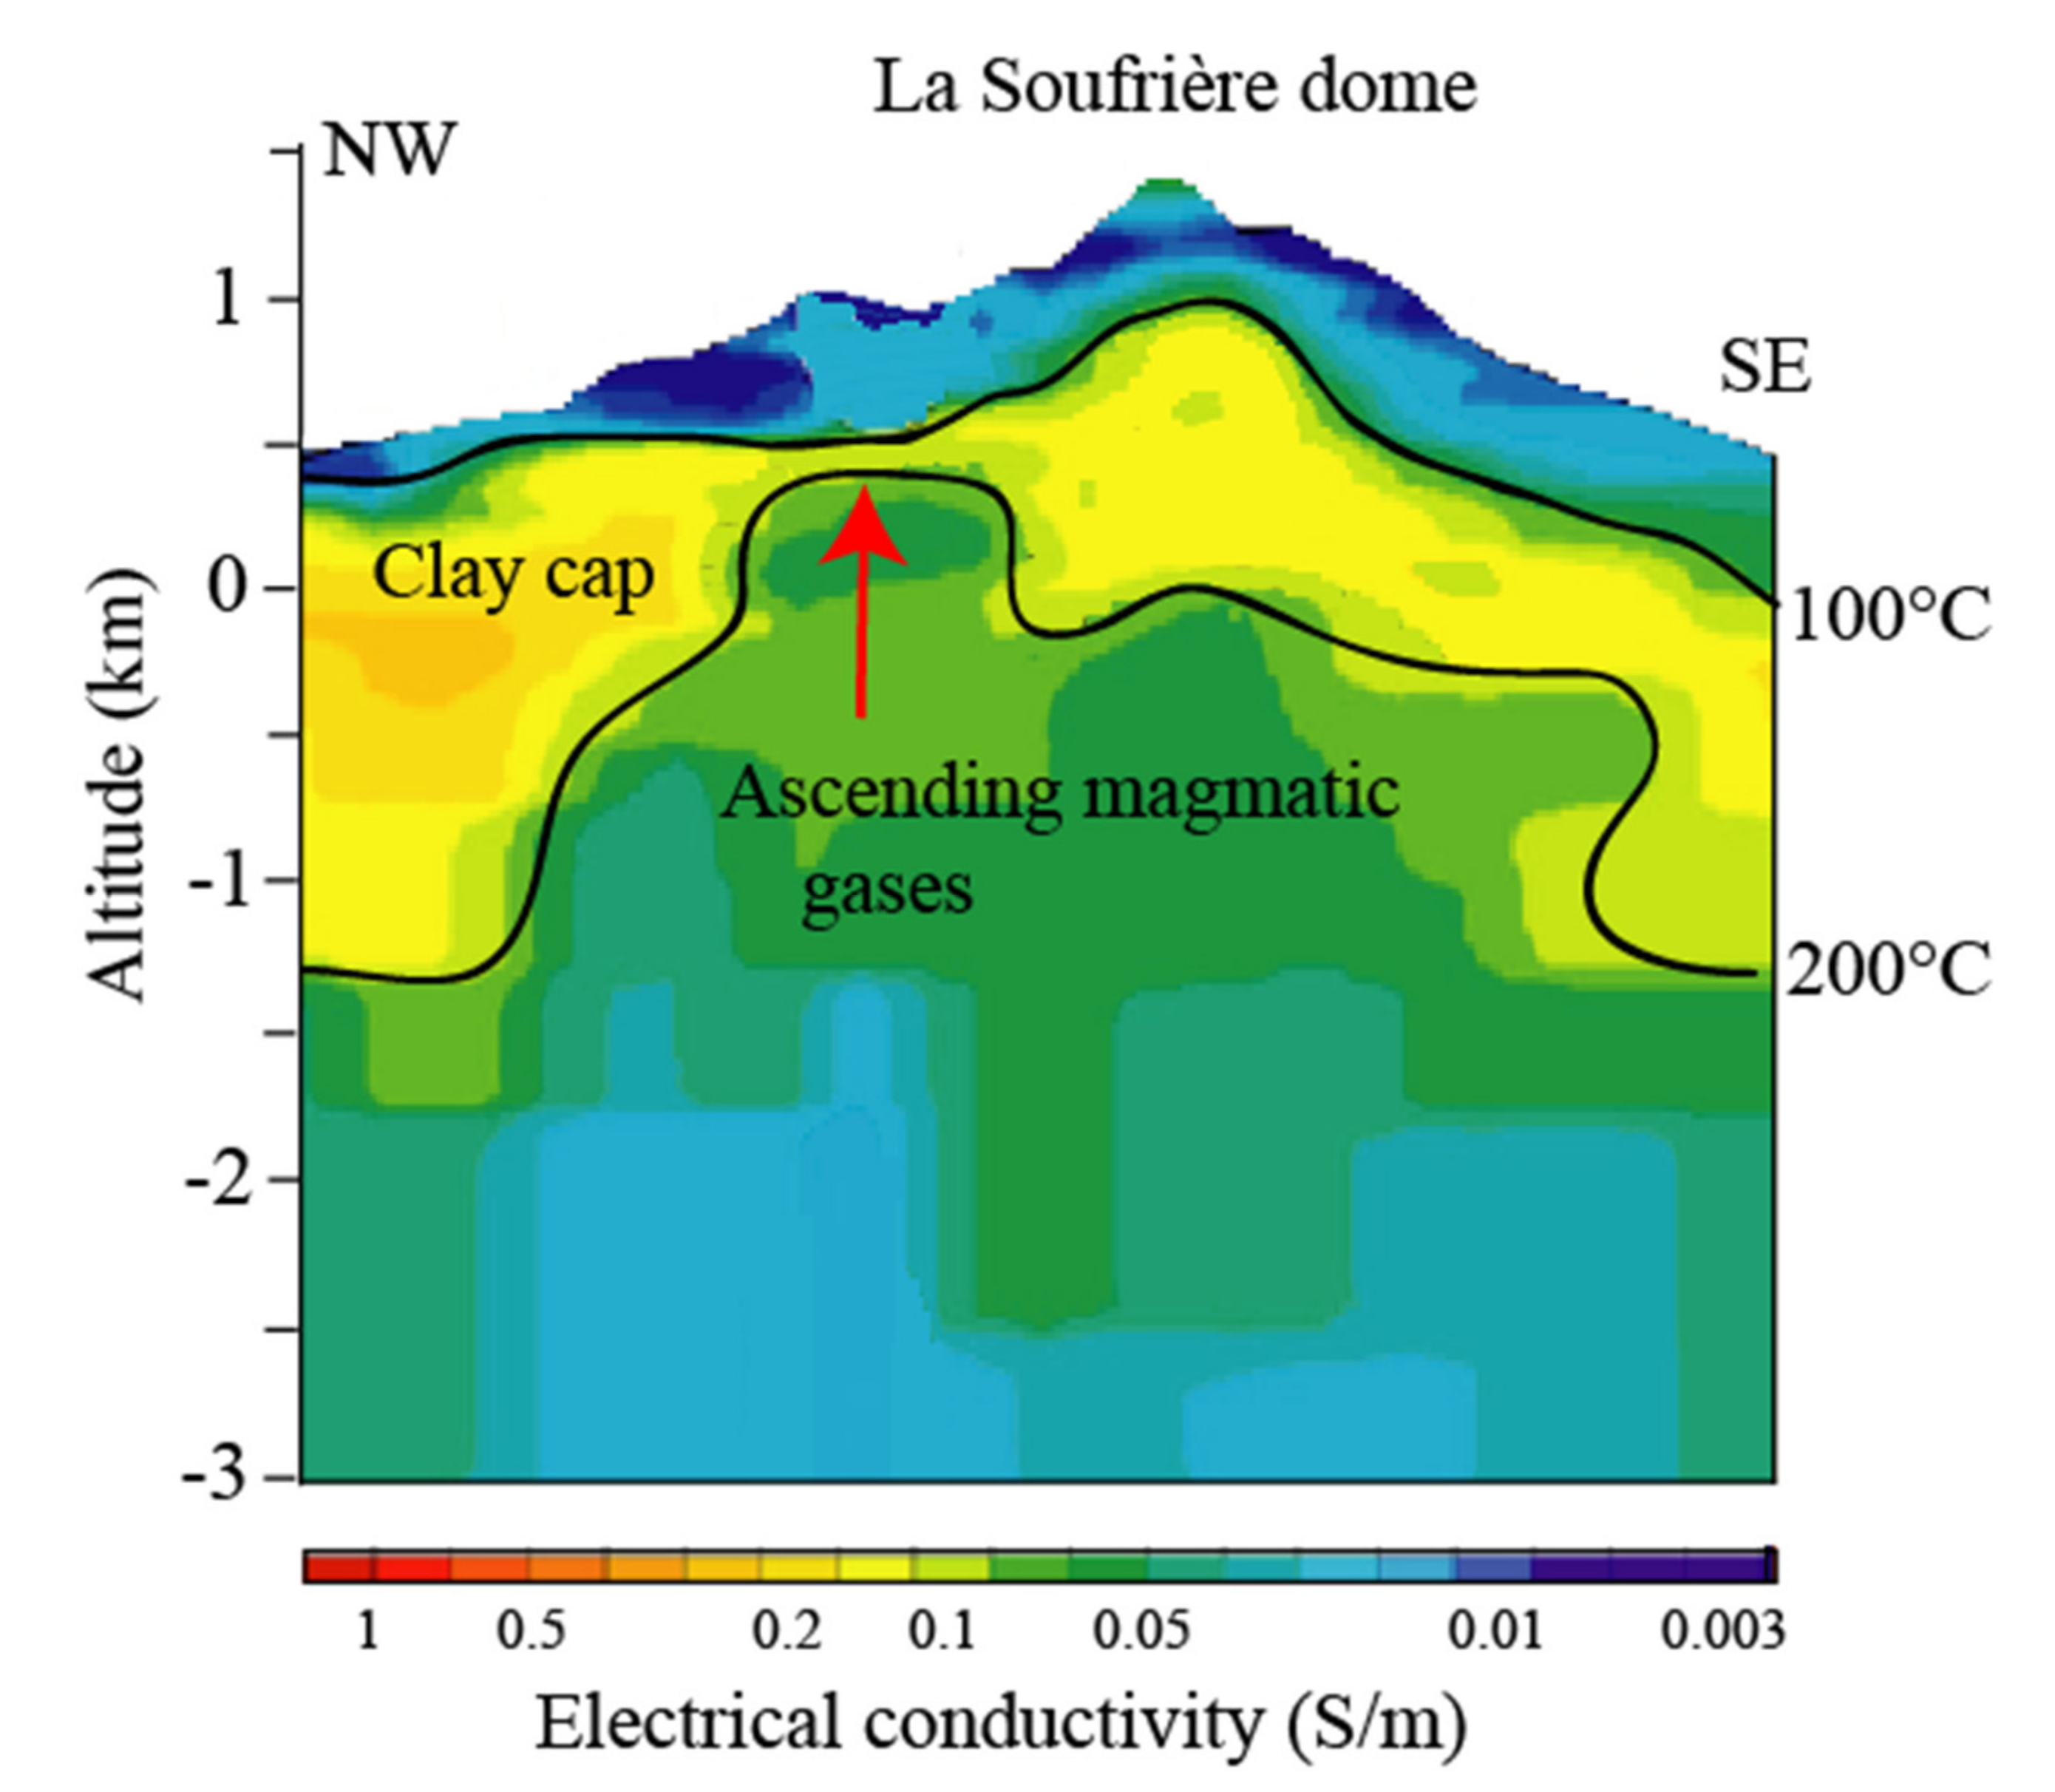
Figure 16 show the detection of clay caps using electrical conductivity and normalized chargeability for Krafla volcano (Iceland). Because of the presence of smectite, the conductivity and normalized chargeability are both high, because of the high cation exchange capacity. Similarly, Figure 17 and Figure 18 show the clay cap at La Soufrière stratovolcano (Guadeloupe Island, France) and Miyakejima volcano (Japan) from electrical conductivity alone. Induced polarization combined with numerical modeling of the paragenesis associated with these geothermal systems could be used to discriminate the alteration minerals that are present and their distributions. In turn, the results could be used to assess the hydrogeological and mechanical properties as discussed further below. In the case of Figure 16, thanks to Equations (4) and (5), the porosity (actually the volumetric water content) and the CEC distributions could be imaged using the conductivity and normalized chargeability distributions obtained by tomography. This approach offers exciting possibilities to image changes in subsurface fluid content using 4D induced polarization tomography, which could be helpful to monitor geothermal systems and active volcanoes.
Finally, Figure 19 presents the temperature fields obtained at Hawaii (USA) using both electrical conductivity and normalized chargeability fields obtained by tomography. This allows mapping the alteration degree and temperature field in the caldera of Kilauea volcano. This has, in turn, applications to characterize the mechanical stability of the rims of the main crater inside the caldera. In the next section, we discuss how induced polarization can be used to assess the Uniaxial Compressive Strength (UCS) of volcanic rocks.
We remind the readers that the use of Archie’s law as a conductive equation for all these cases would yield erroneous results because surface conductivity associated with the CEC is neglected. A simple sensitivity analysis demonstrates at the opposite that surface conductivity is usually the dominant conduction process, implying a strong control by the mineralogy regarding the geoelectrical properties of interest.
Figure 15.
Detection of hydrothermal vents at Papandayan volcano (Indonesia). Tomography of the temperature field using the normalized chargeability determined from the induced polarization measurements and comparison with the surface temperature field. The normalized chargeability can be used to assess the position of the altered sub-volumes associated with the upwelling of the acidic hydrothermal fluids (“m a.s.l.” stands for meters above sea level) and the formation of kaolinite that is typical of strato-volcanoes.

Figure 16.
Imaging the porosity and CEC of a smectite-rich clay cap using Equations (4) and (5) using tomograms of the electrical conductivity and normalized chargeability [92].
Figure 16.
Imaging the porosity and CEC of a smectite-rich clay cap using Equations (4) and (5) using tomograms of the electrical conductivity and normalized chargeability [92].

Figure 17.
Detection of smectite-rich clay cap at La Soufrière stratovolcano dome. The base of the clay cap corresponds roughly to the end of the stability temperature field of smectite (roughly 200–220 °C). The conductivity profile is from Raguenel et al. [93].
Figure 17.
Detection of smectite-rich clay cap at La Soufrière stratovolcano dome. The base of the clay cap corresponds roughly to the end of the stability temperature field of smectite (roughly 200–220 °C). The conductivity profile is from Raguenel et al. [93].

Figure 18.
Detection of smectite-rich clay cap at the stratovolcano of Miyakejima Island (Japan). The conductivity profile was retrieved by Gresse et al. [94] using Magnetotellurics. The base of the clay cap corresponds roughly to the end of the stability temperature field of smectite (~200–220 °C). Modified from Gresse et al. [94].

Figure 19.
Imaging temperature in a shield volcano (Kilauea, Hawaii Island, Hawaii, USA, see Revil et al. [52]). (a) Temperature field from the conductivity distribution using electrical conductivity imaging. (b) Temperature field from the normalized chargeability distribution obtained by tomography. This temperature tomogram is obtained using the trends shown in Figure 9 and Figure 10.

5. Discussion
There are three points we want to discuss in this section. The first one is the possibility to use induced polarization to determine permeability and mechanical properties in geothermal fields in addition to water content and CEC. The second point is the effect of magnetite in the shallow parts of volcanic areas and its influence upon induced polarization properties. The last one is the potential relationship between CEC and porosity paths associated with alteration.
In order to define an alteration index, a total volumetric charge density, , (expressed in C m−3) is defined as a function of the CEC expressed in C kg−1 (e.g., [34]) as
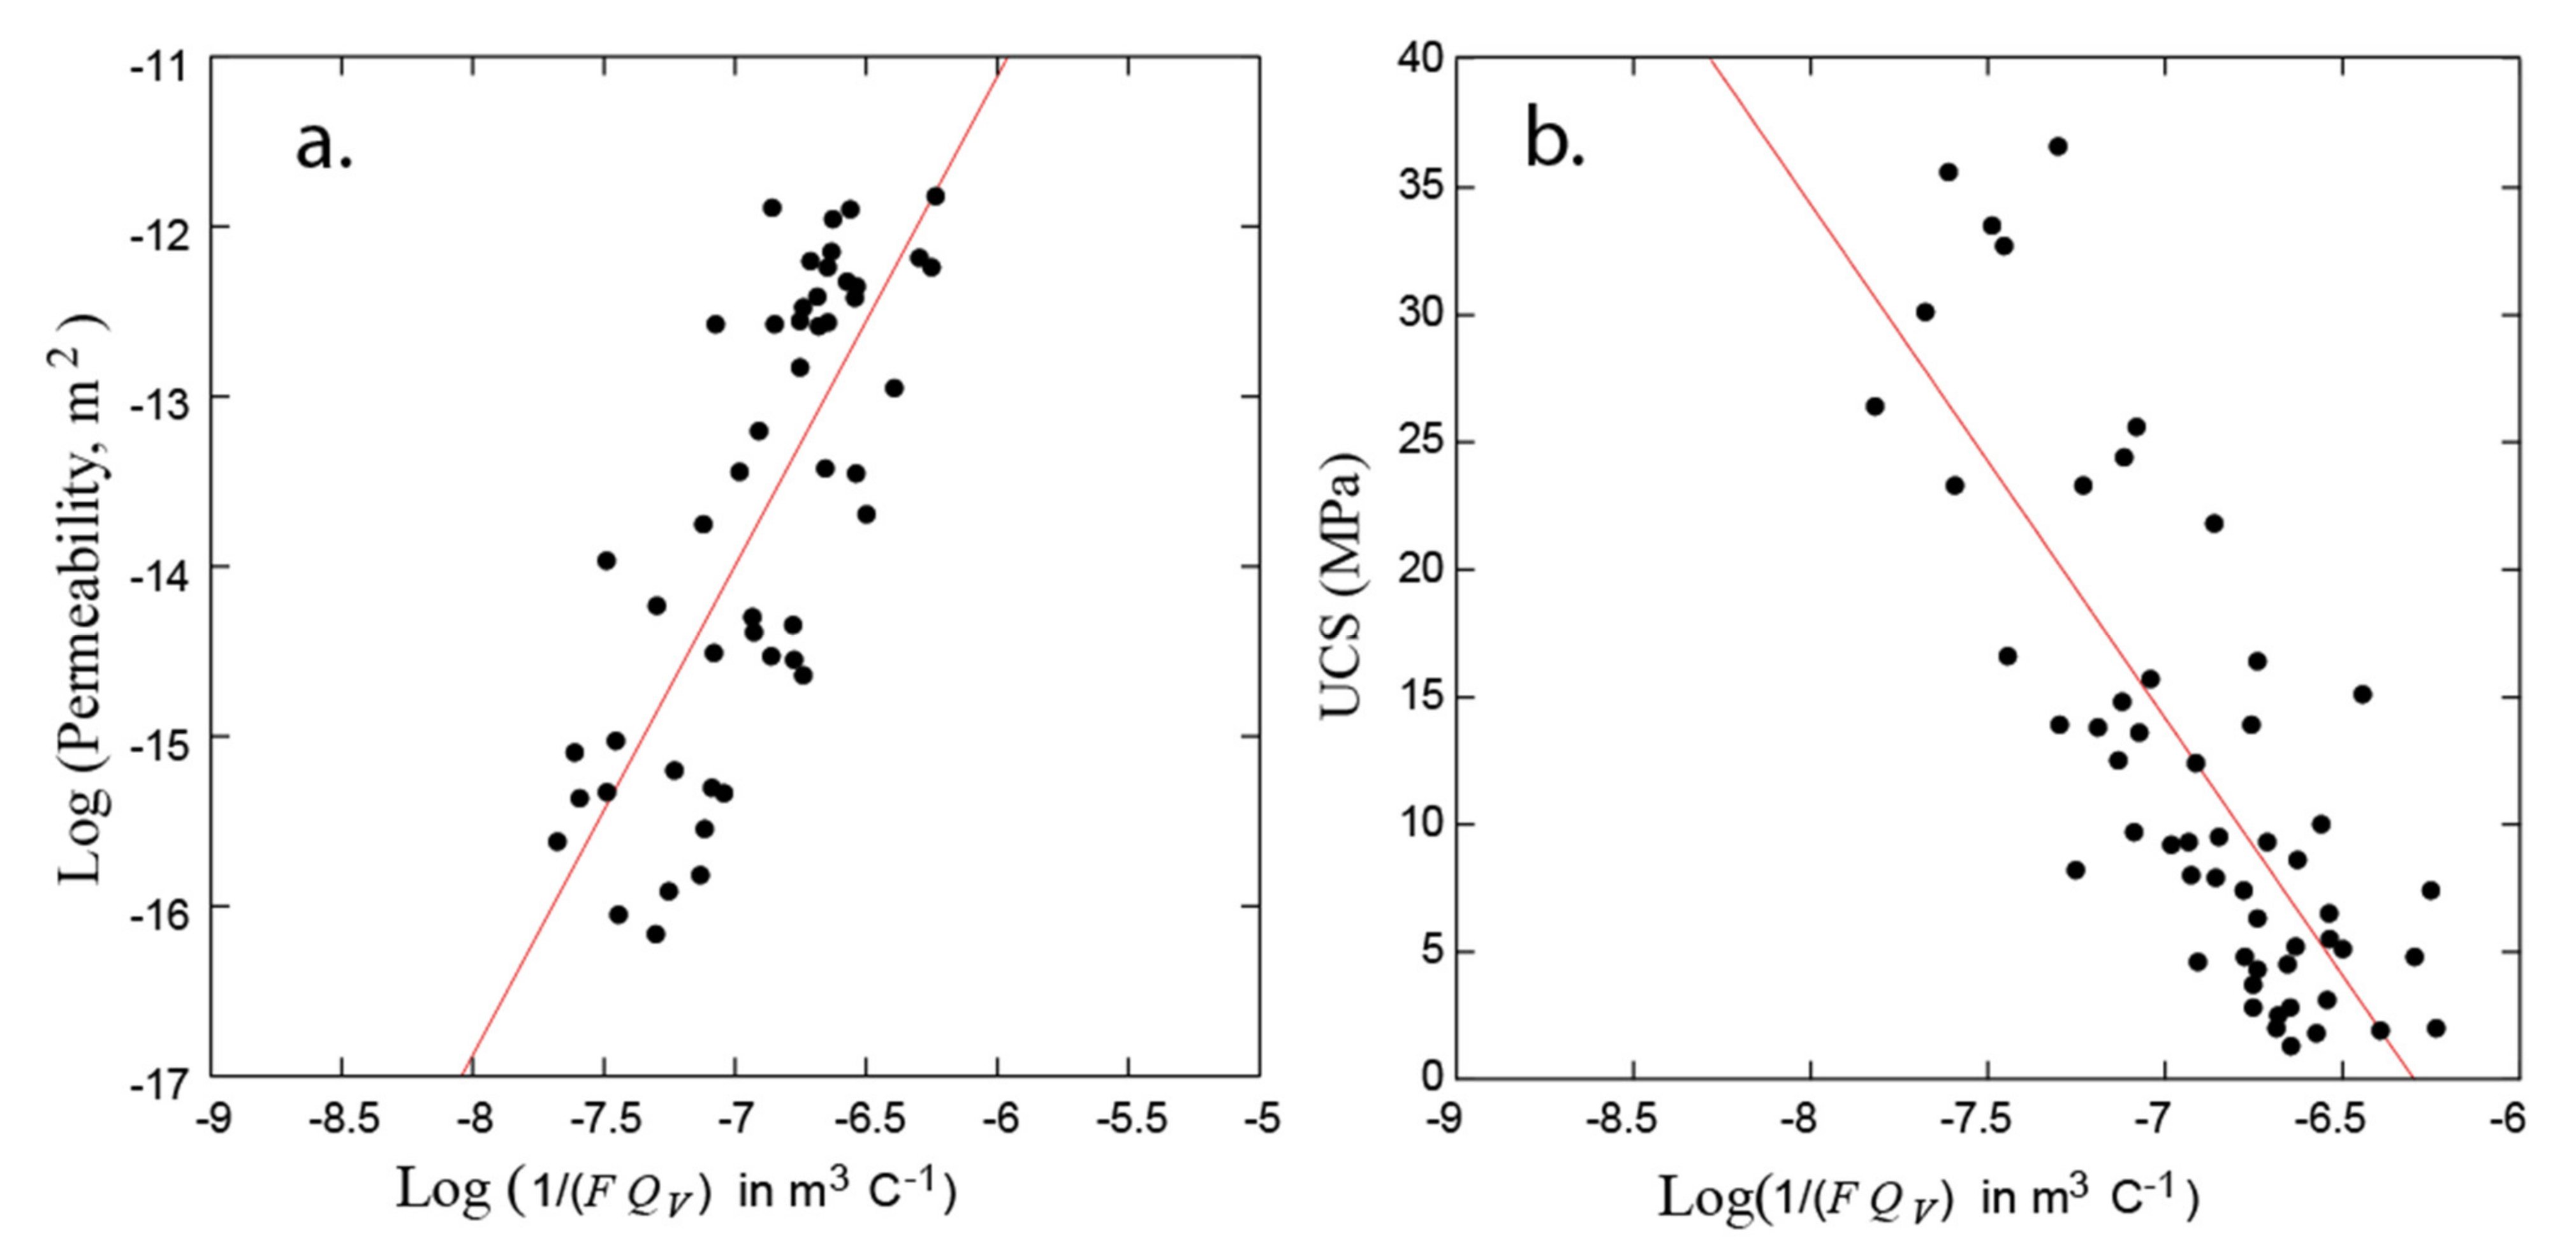
Revil et al. [16] proposed the following alteration indicator 1/FQV (in m3 C−1) and the following relationships for the permeability, k, and the uniaxial compressive strength (E in MPa)
where k0 and c are two fitting parameters (with k in m2) and a and b are empirical constants. In Figure 20, these relationships are used to predict permeability and uniaxial compressive strength.
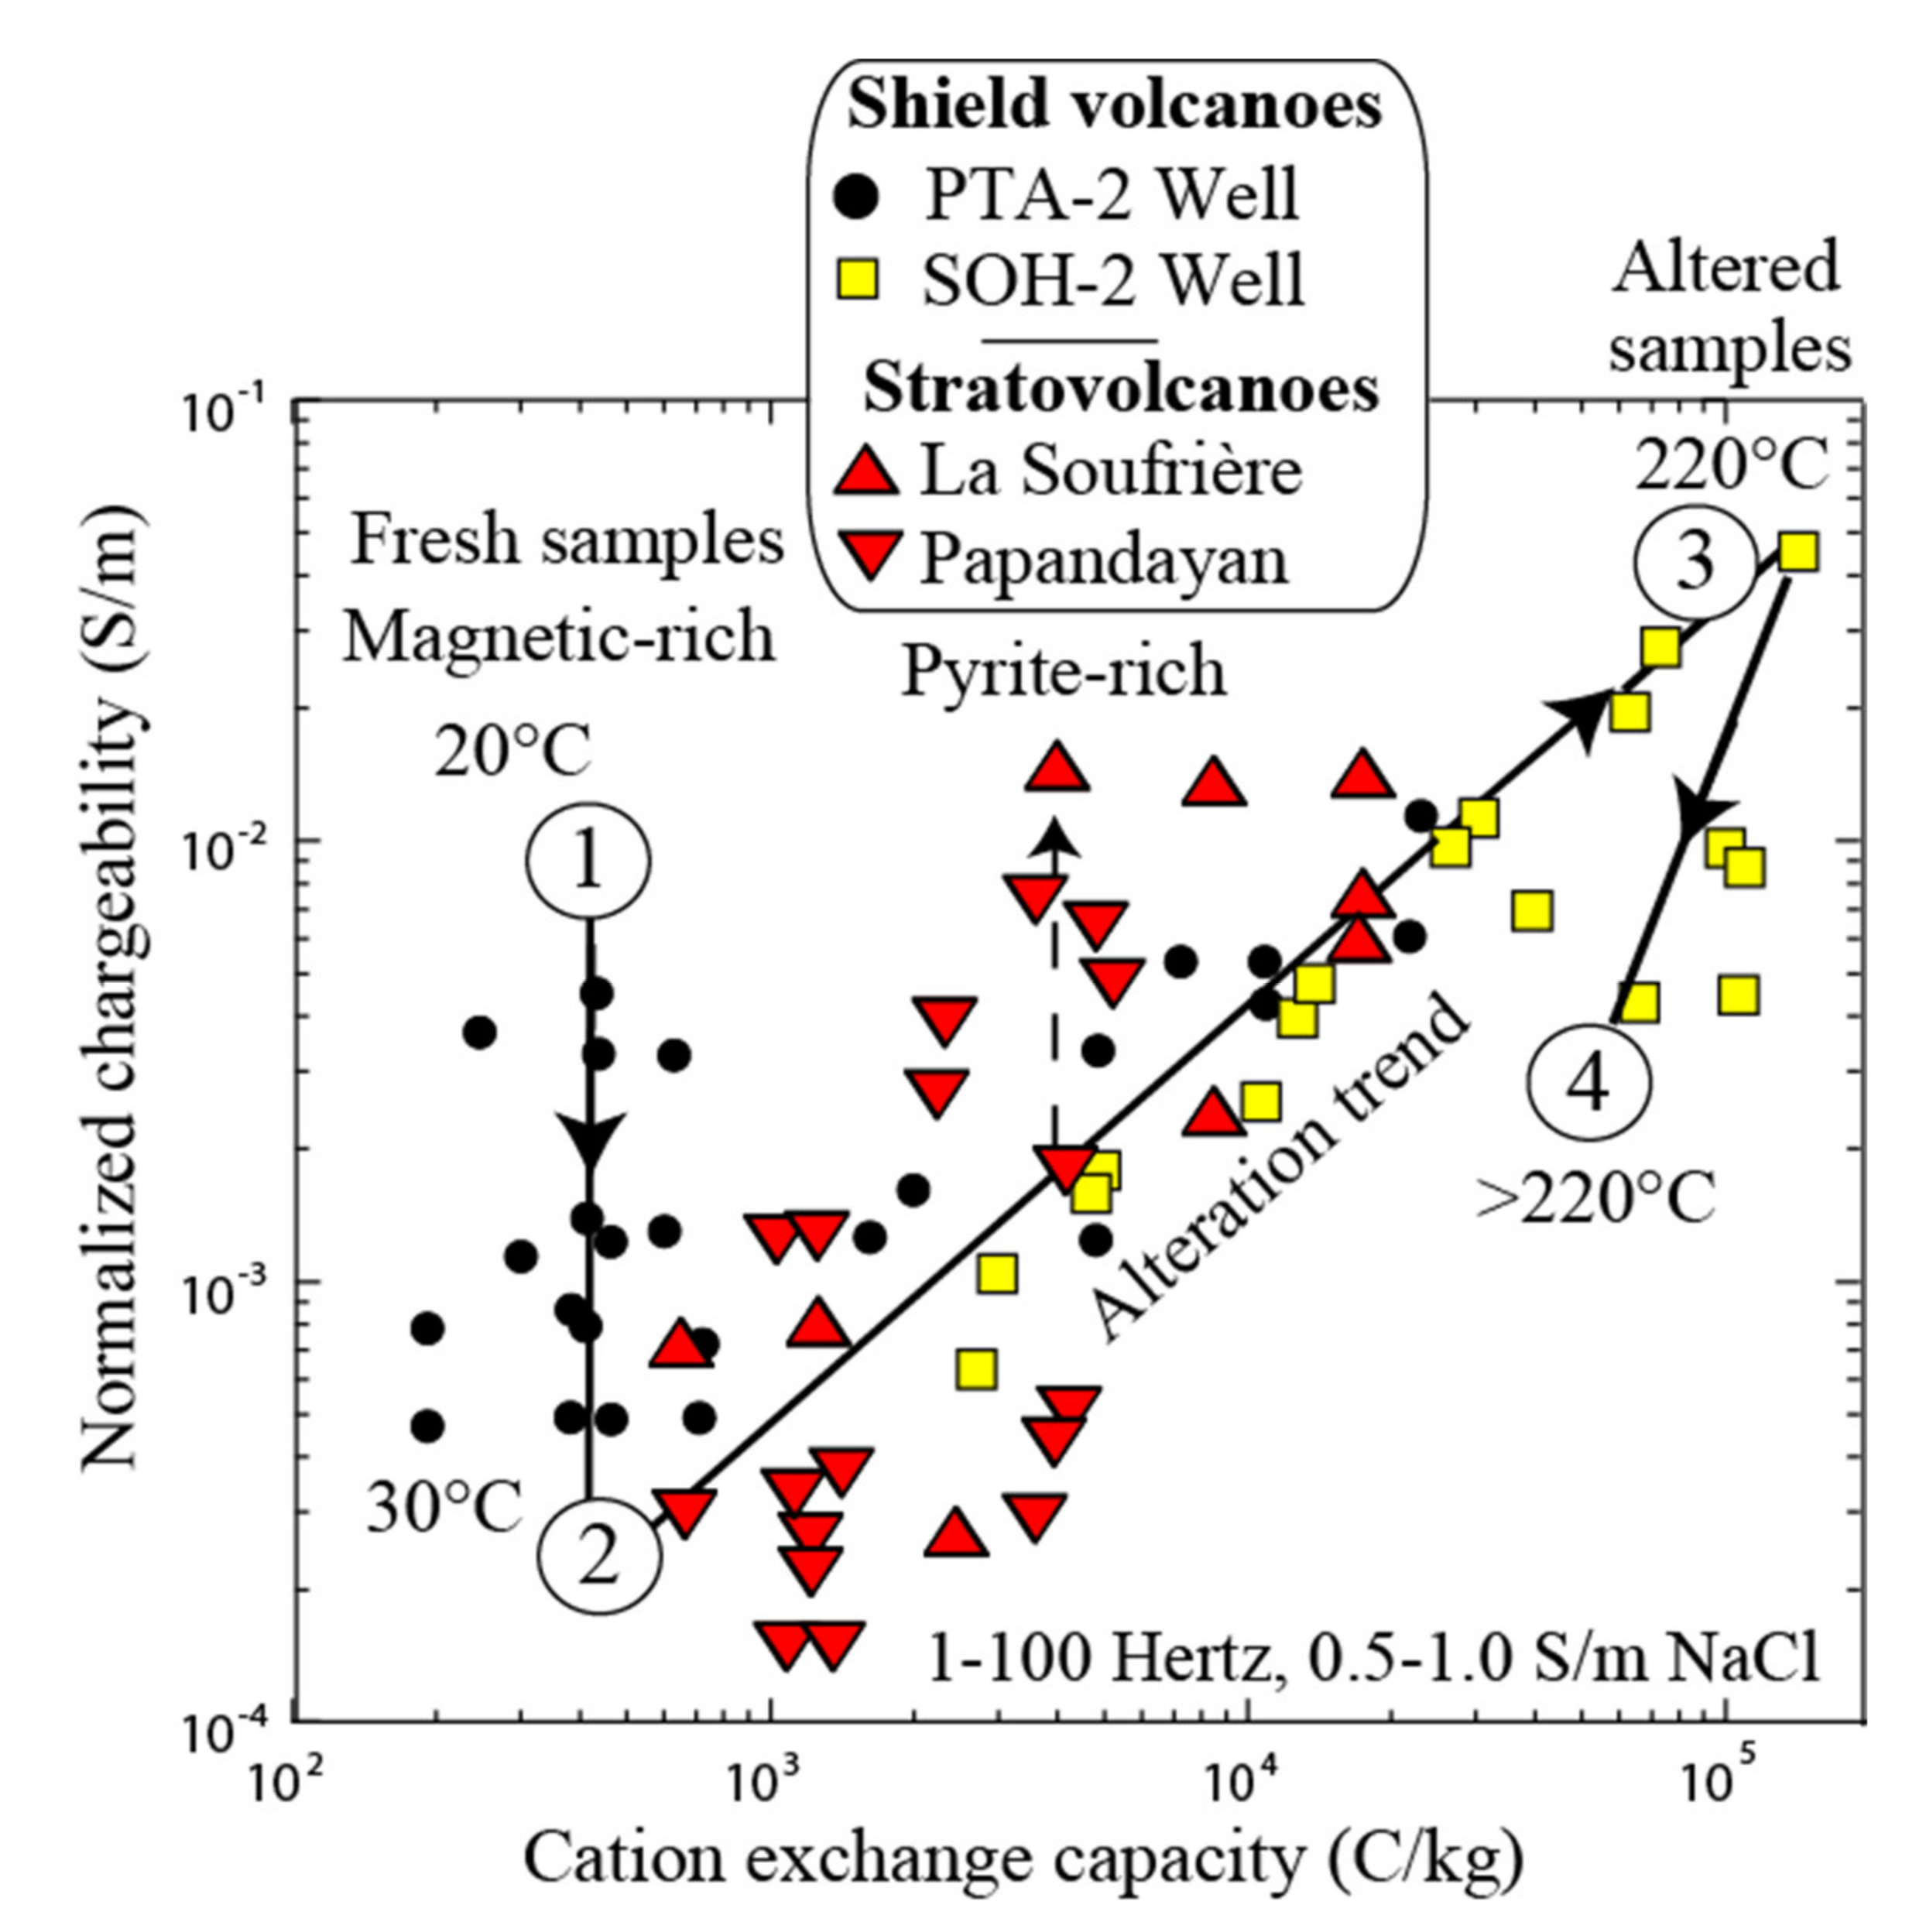
The second point to mention is the effect of magnetite. Semi-conductors such as pyrite and magnetite have a major effect on the normalized chargeability [85,86]. The effect of magnetite is shown in Figure 21 using data from Revil et al. [52]. That said, magnetite and titanomagnetite can also result from alteration (e.g., the alteration of olivine produces magnetite in the serpentinization path of peridotites). Pyrite can also result from the alteration process at temperatures higher than 300 °C and can transform to pyrrhotite in the temperature range 400–500 °C [95]. As shown in Figure 12, the presence of pyrite and magnetite can strongly influence the chargeability of rocks when their combined contents is above 1–2% (vol. fraction).
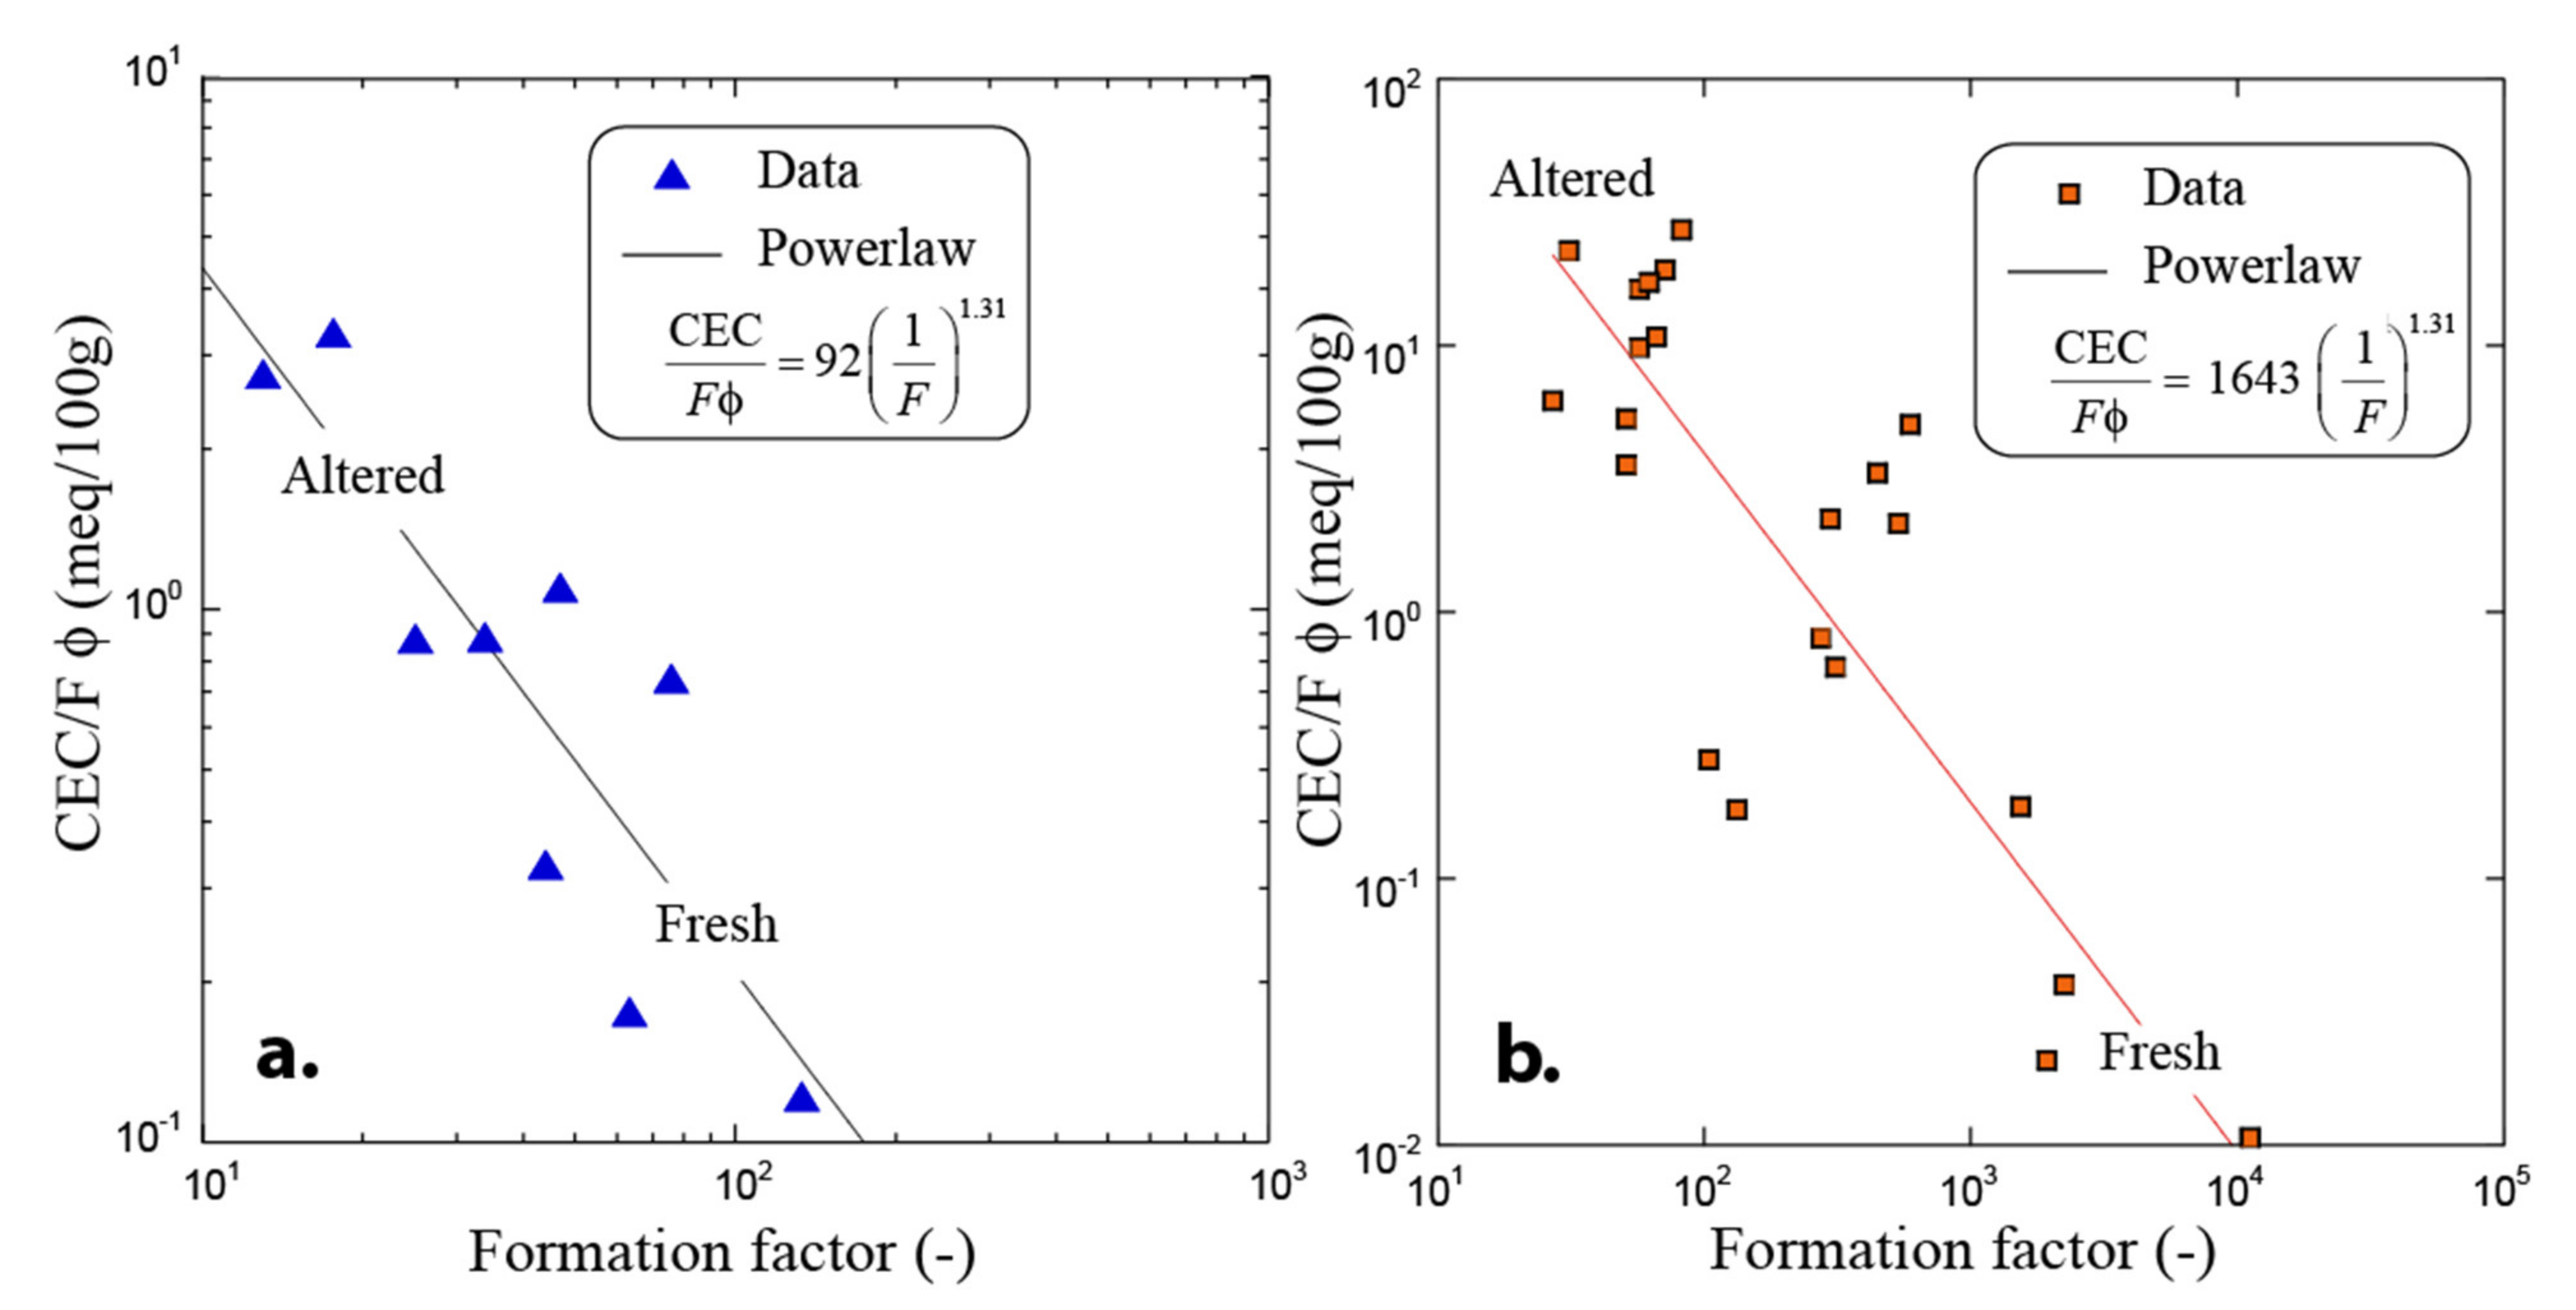
The third and last point to discuss is the potential connection between CEC and porosity along an alteration path. Previously, we have considered that CEC and porosity may change along an alteration path. However a potential relationship between the two parameters was not discussed. In Figure 22a,b, distinct relationships are shown for the shallow parts of strato-volcanoes (kaolinite-rich formations) and for shield volcanoes with smectite-rich formations. In other words, additional relationships may be expected along the alteration paths reducing even further the number of key-parameters to consider for geoelectrical forward or inverse modeling.
6. Conclusions
In geothermal fields, the mineral alteration pattern is a strong, temperature-controlled process. It affects both the porosity and cation exchange capacity, which in turn influence both the electrical conductivity and the low-frequency induced-polarization of rocks. It follows that induced polarization offers a unique non-intrusively geophysical imaging technique able to characterize geothermal fields, the vents of active volcanoes, clay caps, and can be used to image the temperature field of active volcanoes. With the recent developments in the underlying physics of induced polarization and the development of better imaging techniques, this method could be used to characterize hydraulic and mechanical properties of volcanoes and geothermal systems down to a depth of few kilometers. This opens many exciting perspectives regarding the development of induced polarization to characterize the mineral alteration patterns under high to low temperatures in geothermal fields using, for instance, deep learning algorithms and neural networks currently in vogue in various field of research. Numerical modeling could be used to assess the mineral paragenesis associated with alteration paths in geothermal systems (coupled with ground water flow) and petrophysics used to predict what should be the associated fields for electrical conductivity and normalized chargeability. Then geophysical measurements could be performed to refine such distributions and to select between different assumptions.
Author Contributions
Both authors contributed equally to the research presented in this paper. All authors have read and agreed to the published version of the manuscript.
Funding
This research received no external funding.
Acknowledgments
Andre Revil thanks the CNRS for its support over the years. The authors thank the help of many co-workers and students including Abdellahi Soueid Ahmed, Youzheng Qi, and Neha Panwar. Andre Revil thanks Hendra Grandis (Papandayan volcano) and Don Thomas (Kilauea volcano) for the fruitful discussions.
Conflicts of Interest
The authors declare no conflict of interest. The funders had no role in the design of the study; in the collection, analyses, or interpretation of data; in the writing of the manuscript, or in the decision to publish the results.
References
- Zimbelman, D.R.; Rye, R.O.; Breit, G.N. Origin of secondary sulfate minerals on active andesitic stratovolcanoes. Chem. Geol. 2005, 215, 37–60. [Google Scholar] [CrossRef] [Green Version]
- Pola, A.; Crosta, G.; Fusi, N.; Barberini, V.; Norini, G. Influence of alteration on physical properties of volcanic rocks. Tectonophysics 2012, 566–567, 67–86. [Google Scholar] [CrossRef]
- Wyering, L.D.; Villeneuve, M.C.; Wallis, I.C.; Siratovich, P.A.; Kennedy, B.M.; Gravley, D.M.; Cant, J.L. Mechanical and physical properties of hydrothermally altered rocks, Taupo Volcanic Zone, New Zealand. J. Volcanol. Geotherm. Res. 2014, 288, 76–93. [Google Scholar] [CrossRef]
- Frolova, J.; Ladygin, V.; Rychagov, S.; Zukhubaya, D. Effects of hydrothermal alterations on physical and mechanical properties of rocks in the Kuril–Kamchatka island arc. Eng. Geol. 2014, 183, 80–95. [Google Scholar] [CrossRef]
- Revil, A.; Murugesu, M.; Prasad, M.; Le Breton, M. Alteration of volcanic rocks: A new non-intrusive indicator based on induced polarization measurements. J. Volcanol. Geotherm. Res. 2017, 341, 351–362. [Google Scholar] [CrossRef]
- Mordensky, S.P.; Heap, M.J.; Kennedy, B.M.; Gilg, H.A.; Villeneuve, M.C.; Farquharson, J.I.; Gravley, D.M. Influence of alteration on the mechanical behaviour and failure mode of andesite: Implications for shallow seismicity and volcano monitoring. Bull. Volcanol. 2019, 81, 44. [Google Scholar] [CrossRef]
- Pirajno, F. Hydrothermal Processes and Mineral Systems; Springer: Amsterdam, The Netherlands, 2008; p. 1250. [Google Scholar]
- Bach, W.; Paulick, H.; Garrido, C.J.; Ildefonse, B.; Meurer, W.P.; Humphris, S.E. Unraveling the sequence of serpentinization reactions: Petrography, mineral chemistry, and petrophysics of serpentinites from MAR 15°N (ODP Leg 209, Site 1274). Geophys. Res. Lett. 2006, 33, 13. [Google Scholar] [CrossRef] [Green Version]
- Bonnemains, D.; Carlut, J.; Escartín, J.; Mével, C.; Andreani, M.; Debret, B. Magnetic signatures of serpentinization at ophiolite complexes. Geochem. Geophys. Geosystems 2016, 17, 2969–2986. [Google Scholar] [CrossRef] [Green Version]
- Eichelberger, J.C.; Carrigan, C.R.; Westrich, H.R.; Price, R.H. Non-explosive silicic volcanism. Nature 1986, 323, 598–602. [Google Scholar] [CrossRef]
- Mueller, S.; Scheu, B.; Spieler, O.; Dingwell, D.B. Permeability control on magma fragmentation. Geology 2008, 36, 399–402. [Google Scholar] [CrossRef]
- Collinson, A.S.D.; Neuberg, J.W. Gas storage, transport and pressure changes in an evolving permeable volcanic edifice. J. Volcanol. Geotherm. Res. 2012, 243–244, 1–13. [Google Scholar] [CrossRef]
- Cassidy, M.; Manga, M.; Cashman, K.; Bachmann, O. Controls on explosive-effusive volcanic eruption styles. Nat. Commun. 2018, 9, 2839. [Google Scholar] [CrossRef] [PubMed] [Green Version]
- Reid, M.E. Massive collapse of volcano edifices triggered by hydrothermal pressurization. Geology 2004, 32, 373–376. [Google Scholar] [CrossRef]
- Ball, J.L.; Taron, J.; Reid, M.E.; Hurwitz, S.; Finn, C.; Bedrosian, P. Combining Multiphase Groundwater Flow and Slope Stability Models to Assess Stratovolcano Flank Collapse in the Cascade Range. J. Geophys. Res. Solid Earth 2018, 123, 2787–2805. [Google Scholar] [CrossRef]
- Revil, A.; Coperey, A.; Heap, M.J.; Carbillet, L. A geophysical index to map alteration, permeability, and mechanical properties within volcanoes. Application to the soft volcanic rocks from Whakaari/White Island (New Zealand). J. Volcanol. Geotherm. Res. 2020, 401, 106945. [Google Scholar] [CrossRef]
- Romero, J.E.; Polacci, M.; Watt, S.; Kitamura, S.; Tormey, D.; Sielfeld, G.; Arzilli, F.; La Spina, G.; Franco, L.; Burton, M.; et al. Volcanic Lateral Collapse Processes in Mafic Arc Edifices: A Review of Their Driving Processes, Types and Consequences. Front. Earth Sci. 2021, 9, 325. [Google Scholar] [CrossRef]
- Stix, J. Understanding Fast and Slow Unrest at Volcanoes and Implications for Eruption Forecasting. Front. Earth Sci. 2018, 6, 56. [Google Scholar] [CrossRef] [Green Version]
- Mannen, K.; Tanada, T.; Jomori, A.; Akatsuka, T.; Kikugawa, G.; Fukazawa, Y.; Yamashita, H.; Fujimoto, K. Source constraints for the 2015 phreatic eruption of Hakone volcano, Japan, based on geological analysis and resistivity structure. Earth Planets Space 2019, 71, 135. [Google Scholar] [CrossRef] [Green Version]
- Franzson, H.; Kristjánsson, B.R.; Gunnarsson, G.; Björnsson, G.; Hjartarson, A.; Steingrímsson, B.; Gunnlaugsson, E.; Gísla-son, G. The Hengill–Hellisheiði geothermal field. Development of a conceptual geothermal model. In Proceedings of the World Geothermal Congress, Antalya, Turkey, 24–29 April 2005. [Google Scholar]
- Revil, A.; Qi, Y.; Ghorbani, A.; Coperey, A.; Ahmed, A.S.; Finizola, A.; Ricci, T. Induced polarization of volcanic rocks. 3. Imaging clay cap properties in geothermal fields. Geophys. J. Int. 2019, 218, 1398–1427. [Google Scholar] [CrossRef]
- Weisenberger, T.B.; Ingimarsson, H.; Hersir, G.P.; Flóvenz, Ó.G. Cation-Exchange Capacity Distribution within Hydrothermal Systems and Its Relation to the Alteration Mineralogy and Electrical Resistivity. Energies 2020, 13, 5730. [Google Scholar] [CrossRef]
- Blundy, J.; Afanasyev, A.; Tattitch, B.; Sparks, S.; Melnik, O.; Utkin, I.; Rust, A. The economic potential of metalliferous sub-volcanic brines. R. Soc. Open Sci. 2021, 8, 202192. [Google Scholar] [CrossRef] [PubMed]
- Schlumberger, C. Study of Underground Electrical Prospecting. Available online: https://archive.org/details/studyofundergrou00schlrich/page/n21/mode/2up (accessed on 12 June 2021).
- Titov, K.; Komarov, V.; Tarasov, V.; Levitski, A. Theoretical and experimental study of time domain-induced polarization in water-saturated sands. J. Appl. Geophys. 2002, 50, 417–433. [Google Scholar] [CrossRef]
- Kemna, A.; Binley, A.; Cassiani, G.; Niederleithinger, E.; Revil, A.; Slater, L.; Williams, K.H.; Orozco, A.F.; Haegel, F.-H.; Hördt, A.; et al. An overview of the spectral induced polarization method for near-surface applications. Near Surf. Geophys. 2012, 10, 453–468. [Google Scholar] [CrossRef] [Green Version]
- Gross, L.; Soueid Ahmed, A.; Revil, A. Induced polarization of volcanic rocks. 4. Large-scale induced polarization imaging. Geophys. J. Int. 2021, 225, 950–967. [Google Scholar] [CrossRef]
- Revil, A.; Finizola, A.; Piscitelli, S.; Rizzo, E.; Ricci, T.; Crespy, A.; Angeletti, B.; Balasco, M.; Barde Cabusson, S.; Bennati, L.; et al. Inner structure of La Fossa di Vulcano (Vulcano Island, southern Tyrrhenian Sea, Italy) revealed by high-resolution electric resistivity tomography coupled with self-potential, temperature, and CO2 diffuse degassing measurements. J. Geophys. Res. Solid Earth 2008, 113, B7. [Google Scholar] [CrossRef] [Green Version]
- Revil, A.; Johnson, T.C.; Finizola, A. Three-dimensional resistivity tomography of Vulcan’s forge, Vulcano Island, southern Italy. Geophys. Res. Lett. 2010, 37, 15. [Google Scholar] [CrossRef] [Green Version]
- Rosas-Carbajal, M.; Komorowski, J.-C.; Nicollin, F.; Gibert, D. Volcano electrical tomography unveils edifice collapse hazard linked to hydrothermal system structure and dynamics. Sci. Rep. 2016, 6, 29899. [Google Scholar] [CrossRef] [Green Version]
- Revil, A.; Finizola, A.; Ricci, T.; Delcher, E.; Peltier, A.; Barde-Cabusson, S.; Avard, G.; Bailly, T.; Bennati, L.; Byrdina, S.; et al. Hydrogeology of Stromboli volcano, Aeolian Islands (Italy) from the interpretation of resistivity tomograms, self-potential, soil temperature and soil CO2 concentration measurements. Geophys. J. Int. 2011, 186, 1078–1094. [Google Scholar] [CrossRef] [Green Version]
- Gresse, M.; Vandemeulebrouck, J.; Byrdina, S.; Chiodini, G.; Revil, A.; Johnson, T.C.; Ricci, T.; Vilardo, G.; Mangiacapra, A.; Lebourg, T.; et al. Three-Dimensional Electrical Resistivity Tomography of the Solfatara Crater (Italy): Implication for the Multiphase Flow Structure of the Shallow Hydrothermal System. J. Geophys. Res. Solid Earth 2017, 122, 8749–8768. [Google Scholar] [CrossRef]
- Lyklema, J.; Dukhin, S.S.; Shilov, V.N. The relaxation of the double layer around colloidal particles and the low-frequency dielectric dispersion: Part I. Theoretical considerations. J. Electroanal. Chem. Interfacial Electrochem. 1983, 143, 1–21. [Google Scholar] [CrossRef]
- Vinegar, H.J.; Waxman, M.H. Induced polarization of shaly sands. Geophysics 1984, 49, 1267–1287. [Google Scholar] [CrossRef]
- Leroy, P.; Revil, A.; Kemna, A.; Cosenza, P.; Ghorbani, A. Complex conductivity of water-saturated packs of glass beads. J. Colloid Interface Sci. 2008, 321, 103–117. [Google Scholar] [CrossRef]
- Archie, G.E. The electrical resistivity log as an aid in determining some reservoir characteristics. Pet. Trans. AIME 1942, 146, 54–62. [Google Scholar] [CrossRef]
- Revil, A.; Hermitte, D.; Spangenberg, E.; Cochemé, J.J. Electrical properties of zeolitized volcaniclastic materials. J. Geophys. Res. Solid Earth 2002, 107, ECV 3-1–ECV 3-17. [Google Scholar] [CrossRef]
- Ghorbani, A.; Revil, A.; Coperey, A.; Soueid Ahmed, A.; Roque, S.; Heap, M.J.; Grandis, H.; Viveiros, F. Complex conductivity of volcanic rocks and the geophysical mapping of alteration in volcanoes. J. Volcanol. Geotherm. Res. 2018, 357, 106–127. [Google Scholar] [CrossRef]
- Revil, A.; Breton, M.L.; Niu, Q.; Wallin, E.; Haskins, E.; Thomas, D.M. Induced polarization of volcanic rocks. 2. Influence of pore size and permeability. Geophys. J. Int. 2017, 208, 814–825. [Google Scholar] [CrossRef]
- Revil, A.; Le Breton, M.; Niu, Q.; Wallin, E.; Haskins, E.; Thomas, D.M. Induced polarization of volcanic rocks—1. Surface versus quadrature conductivity. Geophys. J. Int. 2017, 208, 826–844. [Google Scholar] [CrossRef]
- Árnason, K.; Eysteinsson, H.; Hersir, G.P. Joint 1D inversion of TEM and MT data and 3D inversion of MT data in the Hengill area, SW Iceland. Geothermics 2010, 39, 13–34. [Google Scholar] [CrossRef]
- Flóvenz, Ó.G.; Hersir, G.P.; Sæmundsson, K.; Ármannsson, H.; Friðriksson, Þ. 7.03-Geothermal Energy Exploration Techniques. In Comprehensive Renewable Energy; Sayigh, A., Ed.; Elsevier: Oxford, UK, 2012; pp. 51–95. [Google Scholar]
- Nieto, F.; Velilla, N.; Peacor, D.R.; Huertas, M.O. Regional retrograde alteration of sub-greenschist facies chlorite to smectite. Contrib. Mineral. Petrol. 1994, 115, 243–252. [Google Scholar] [CrossRef] [Green Version]
- Salaün, A.; Villemant, B.; Gérard, M.; Komorowski, J.-C.; Michel, A. Hydrothermal alteration in andesitic volcanoes: Trace element redistribution in active and ancient hydrothermal systems of Guadeloupe (Lesser Antilles). J. Geochem. Explor. 2011, 111, 59–83. [Google Scholar] [CrossRef]
- Finizola, A.; Ricci, T.; Deiana, R.; Cabusson, S.B.; Rossi, M.; Praticelli, N.; Giocoli, A.; Romano, G.; Delcher, E.; Suski, B.; et al. Adventive hydrothermal circulation on Stromboli volcano (Aeolian Islands, Italy) revealed by geophysical and geochemical approaches: Implications for general fluid flow models on volcanoes. J. Volcanol. Geotherm. Res. 2010, 196, 111–119. [Google Scholar] [CrossRef] [Green Version]
- Aran, D.; Maul, A.; Masfaraud, J.-F. A spectrophotometric measurement of soil cation exchange capacity based on cobaltihexamine chloride absorbance. Comptes Rendus Geosci. 2008, 340, 865–871. [Google Scholar] [CrossRef]
- Ciesielski, H.; Sterckeman, T.; Santerne, M.; Willery, J.P. Determination of cation exchange capacity and exchangeable cations in soils by means of cobalt hexamine trichloride. Effects of experimental conditions. Agronomie 1997, 17, 1–7. [Google Scholar] [CrossRef] [Green Version]
- Stimac, J.; Goff, F.; Goff, C.J. Chapter 46-Intrusion-Related Geothermal Systems A2-Sigurdsson, Haraldur. In The Encyclopedia of Volcanoes, 2nd ed.; Academic Press: Amsterdam, The Netherlands, 2015; pp. 799–822. [Google Scholar]
- Richards, J.P. Magmatic to hydrothermal metal fluxes in convergent and collided margins. Ore Geol. Rev. 2011, 40, 1–26. [Google Scholar] [CrossRef]
- Henley, R.W.; Ellis, A.J. Geothermal systems ancient and modern: A geochemical review. Earth-Sci. Rev. 1983, 19, 1–50. [Google Scholar] [CrossRef]
- Mas, A.; Guisseau, D.; Patrier Mas, P.; Beaufort, D.; Genter, A.; Sanjuan, B.; Girard, J.P. Clay minerals related to the hydrothermal activity of the Bouillante geothermal field (Guadeloupe). J. Volcanol. Geotherm. Res. 2006, 158, 380–400. [Google Scholar] [CrossRef]
- Revil, A.; Qi, Y.; Ghorbani, A.; Gresse, M.; Thomas, D.M. Induced polarization of volcanic rocks. 5. Imaging the temperature field of shield volcanoes. Geophys. J. Int. 2021. [Google Scholar] [CrossRef]
- Ishikawa, Y.; Sawaguchi, T.; Iwaya, S.; Horiuchi, M. Delineation of Prospecting Targets for Kuroko Deposits Based on Modes of Volcanism of Underlying Dacite and Alteration Haloes. Min. Geol. 1976, 26, 105–117. [Google Scholar] [CrossRef]
- Galley, A.; Hannington, M.D.; Jonasson, I. Volcanogenic massive sulphide deposits, in mineral deposits of Canada: A synthesis of major deposit types. Geol. Assoc. Can. Miner. Depos. Div. Spec. Publ. 2007, 5, 141–162. [Google Scholar]
- Gibson, H.L.; Galley, A.; Goodfellow, W.D. Volcanogenic massive sulphide deposits of the Archean, Noranda district, Québec. Geol. Assoc. Can. Miner. Depos. Div. Spec. Publ. 2007, 5, 533–552. [Google Scholar]
- Goodfellow, W. Metallogeny of the Bathurst Mining Camp, northern New Brunswick. Geol. Assoc. Can. Miner. Depos. Div. Spec. Publ. 2007, 5, 449–469. [Google Scholar]
- Chittoori, B.; Puppala, J. Quantitative Estimation of Clay Mineralogy in Fine-Grained Soils. J. Geotech. Geoenvironmental Eng. 2011, 137, 997–1008. [Google Scholar] [CrossRef]
- Patchett, J.G. An investigation of shale conductivity. In Society of Professional Well Logging Analysis 16th Logging Symposium; Society of Professional Well Log Analysts: Houston, TX, USA, 1975. [Google Scholar]
- Lipsicas, M. Molecular and surface interactions in clay intercalates. In Physics and Chemistry of Porous Media; Johnson, D.L., Sen, P.N., Eds.; American Institute of Physics: College Park, MD, USA, 1984; pp. 191–202. [Google Scholar]
- Zundel, J.P.; Siffert, B. Mécanisme de rétention de l’octylbenzene sulfonate de sodium sur les minéraux argileux. In Solid-Liquid Interactions in Porous Media; Technip: Paris, France, 1985; pp. 447–462. [Google Scholar]
- Lockhart, N.C. Electrical properties and the surface characteristics and structure of clays. II. Kaolinite—a nonswelling clay. J. Colloid Interface Sci. 1980, 74, 520–529. [Google Scholar] [CrossRef]
- Sinitsyn, V.A.; Aja, S.U.; Kulik, D.A.; Wood, S.A. Acid–base surface chemistry and sorption of some lanthanides on K+-saturated Marblehead illite: I. results of an experimental investigation. Geochim. Cosmochim. Acta 2000, 64, 185–194. [Google Scholar] [CrossRef]
- Avena, M.J.; De Pauli, C.P. Proton Adsorption and Electrokinetics of an Argentinean Montmorillonite. J. Colloid Interface Sci. 1998, 202, 195–204. [Google Scholar] [CrossRef]
- Shainberg, I.; Alperovitch, N.; Keren, R. Effect of Magnesium on the Hydraulic Conductivity of Na-Smectite-Sand Mixtures. Clays Clay Miner. 1988, 36, 432–438. [Google Scholar] [CrossRef]
- Su, Q.; Feng, Q.; Shang, Z. Electrical impedance variation with water saturation in rock. Geophysics 2000, 65, 68–75. [Google Scholar] [CrossRef]
- Ma, C.; Eggleton, R.A. Cation Exchange Capacity of Kaolinite. Clays Clay Miner. 1999, 47, 174–180. [Google Scholar] [CrossRef]
- Revil, A. Effective conductivity and permittivity of unsaturated porous materials in the frequency range 1 mHz–1GHz. Water Resour. Res. 2013, 49, 306–327. [Google Scholar] [CrossRef] [Green Version]
- Weller, A.; Nordsiek, S.; Debschütz, W. Estimating permeability of sandstone samples by nuclear magnetic resonance and spectral-induced polarization. Geophysics 2010, 75, E215–E226. [Google Scholar] [CrossRef]
- Weller, A.; Zhang, Z.; Slater, L.; Kruschwitz, S.; Halisch, M. Induced polarization and pore radius-A discussion. Geophysics 2016, 81, D519–D526. [Google Scholar] [CrossRef]
- Johnson, T.C.; Versteeg, R.J.; Ward, A.; Day-Lewis, F.D.; Revil, A. Improved hydrogeophysical characterization and monitoring through parallel modeling and inversion of time-domain resistivity and induced-polarization. Geophysics 2010, 75, 4. [Google Scholar] [CrossRef]
- Soueid Ahmed, A.; Revil, A.; Byrdina, S.; Coperey, A.; Gailler, L.; Grobbe, N.; Viveiros, F.; Silva, C.; Jougnot, D.; Ghorbani, A.; et al. 3D electrical conductivity tomography of volcanoes. J. Volcanol. Geotherm. Res. 2018, 356, 243–263. [Google Scholar] [CrossRef]
- Zhang, Z.; Kruschwitz, S.; Weller, A.; Halisch, M.; Prinz, C. Enhanced pore space analysis by use of μ-CT, MIP, NMR, and SIP. In Proceedings of the Annual Symposium of the Society of Core Analysts, Vienna, Austria, 27 August–1 September 2017. [Google Scholar]
- Wang, H.; Revil, A. Surface Conduction Model for Fractal Porous Media. Geophys. Res. Lett. 2020, 47, e2020GL087553. [Google Scholar] [CrossRef]
- Revil, A.; Skold, M.; Hubbard, S.S.; Wu, Y.; Watson, D.B.; Karaoulis, M. Petrophysical properties of saprolites from the Oak Ridge Integrated Field Research Challenge site, Tennessee. Geophysics 2013, 78, D21–D40. [Google Scholar] [CrossRef]
- Revil, A.; Razdan, M.; Julien, S.; Coperey, A.; Abdulsamad, F.; Ghorbani, A.; Gasquet, D.; Sharma, R.; Rossi, M. Induced polarization response of porous media with metallic particles — Part 9: Influence of permafrost. Geophysics 2019, 84, E337–E355. [Google Scholar] [CrossRef]
- Harvey, C.C.; Browne, P.R.L. Mixed-Layer Clay Geothermometry in the Wairakei Geothermal Field, New Zealand. Clays Clay Miner. 1991, 39, 614–621. [Google Scholar] [CrossRef]
- Morata, D.; Vázquez, M.; Nieto, F. HR-TEM studies in geothermal alteration mineralogy: From the nano scale to conceptual models. In Proceedings of the World Geothermal Congress, Melbourne, Australia, 17–19 April 2015. [Google Scholar]
- Bauer, K.; Muñoz, G. Joint Seismic and Magnetotelluric Exploration around the Geothermal Research Well Gross Schönebeck (NE German Basin). Eur. Assoc. Geosci. Eng. 2011. [Google Scholar] [CrossRef]
- Kousehlar, M.; Weisenberger, T.; Tutti, F.; Mirnejad, H. Fluid control on low-temperature mineral formation in volcanic rocks of Kahrizak, Iran. Geofluids 2012, 12, 295–311. [Google Scholar] [CrossRef]
- Cumming, W.; Mackie, R. 3D MT resistivity imaging for geothermal resource assessment and environmental mitigation at the glass mountain KGRA, California. Geothe Res. Counc. 2007, 31, 331–334. [Google Scholar]
- Ushijima, K.; Jotaki, H.; Mizunaga, H. Magnetotelluric Soundings in the Takigami Geothermal Area, Japan. In Proceedings of the World Geothermal Congress, Antalya, Turkey, 24–29 April 2005. [Google Scholar]
- Hersir, G.P.; Árnason, K.; Vilhjálmsson, A.M.; Saemundsson, K.; Ágústsdóttir, Þ.; Friðleifsson, G.Ó. Krýsuvík high temperature geothermal area in SW Iceland: Geological setting and 3D inversion of magnetotelluric (MT) resistivity data. J. Volcanol. Geotherm. Res. 2020, 391, 106500. [Google Scholar] [CrossRef]
- Tugawin, R.J.; Rigor, D.M.; Banos, C.; Layugan, D. Resistivity Model Based on 2D Inversion of Magnetotelluric Sounding Data in Bacon- Manito, Southern Luzon, Philippines. In Proceedings of the World Geothermal Congress 2015, Melbourne, Australia, 19–25 April 2015. [Google Scholar]
- Gasperikova, E.; Rosenkjaer, G.K.; Arnason, K.; Newman, G.A.; Lindsey, N.J. Resistivity characterization of the Krafla and Hengill geothermal fields through 3D MT inverse modeling. Geothermics 2015, 57, 246–257. [Google Scholar] [CrossRef] [Green Version]
- Revil, A.; Florsch, N.; Mao, D. Induced polarization response of porous media with metallic particles-Part 1: A theory for disseminated semiconductors. Geophysics 2015, 80, D525–D538. [Google Scholar] [CrossRef]
- Revil, A.; Abdel Aal, G.Z.; Atekwana, E.A.; Mao, D.; Florsch, N. Induced polarization response of porous media with metallic particles — Part 2: Comparison with a broad database of experimental data. Geophysics 2015, 80, D539–D552. [Google Scholar] [CrossRef]
- Pelton, W.H.; Ward, S.H.; Hallof, P.G.; Sill, W.R.; Nelson, P.H. Mineral discrimination and removal of inductive coupling with multifrequency IP. Geophysics 1978, 43, 588–609. [Google Scholar] [CrossRef]
- Mahan, M.K.; Redman, J.D.; Strangway, D.W. Complex resistivity of synthetic sulfide bearing rocks. Geophys. Prospect. 1986, 34, 743–768. [Google Scholar] [CrossRef]
- Phillips, C.R. Experimental Study of the Induced Polarization Effect Using Cole-Cole and GEMTIP Models. Master’s Thesis, University of Utah, Salt Lake City, UT, USA, 2010. [Google Scholar]
- Gurin, G.; Titov, K.; Ilyin, Y.; Tarasov, A. Induced polarization of disseminated electronically conductive minerals: A semi-empirical model. Geophys. J. Int. 2015, 200, 1555–1565. [Google Scholar] [CrossRef] [Green Version]
- Hogg, C.; Kiyan, D.; Rath, V.; Byrdina, S.; Vandemeulebrouck, J.; Revil, A.; Viveiros, F.; Carmo, R.; Silva, C.; Ferreira, T. 3-D interpretation of short-period magnetotelluric data at Furnas Volcano, Azores Islands. Geophys. J. Int. 2017, 213, 371–386. [Google Scholar] [CrossRef]
- Revil, A.; Qi, Y.; Ghorbani, A.; Soueid Ahmed, A.; Ricci, T.; Labazuy, P. Electrical conductivity and induced polarization investigations at Krafla volcano, Iceland. J. Volcanol. Geotherm. Res. 2018, 368, 73–90. [Google Scholar] [CrossRef]
- Raguenel, M.; Driesner, T.; Bonneau, F. Numerical modeling of the geothermal hydrology of the Volcanic Island of Basse-Terre, Guadeloupe. Geotherm. Energy 2019, 7, 28. [Google Scholar] [CrossRef] [Green Version]
- Gresse, M.; Uyeshima, M.; Koyama, T.; Hase, H.; Aizawa, K.; Yamaya, Y.; Morita, Y.; Weller, D.; Rung-Arunwan, T.; Kaneko, T.; et al. Hydrothermal and Magmatic System of a Volcanic Island Inferred From Magnetotellurics, Seismicity, Self-potential, and Thermal Image: An Example of Miyakejima (Japan). J. Geophys. Res. Solid Earth 2021, 126, e2021JB022034. [Google Scholar] [CrossRef]
- Lambert, J.M.; Simkovich, G.; Walker, P.L. Production of pyrrhotites by pyrite reduction. Fuel 1980, 59, 687–690. [Google Scholar] [CrossRef]
Figure 3.
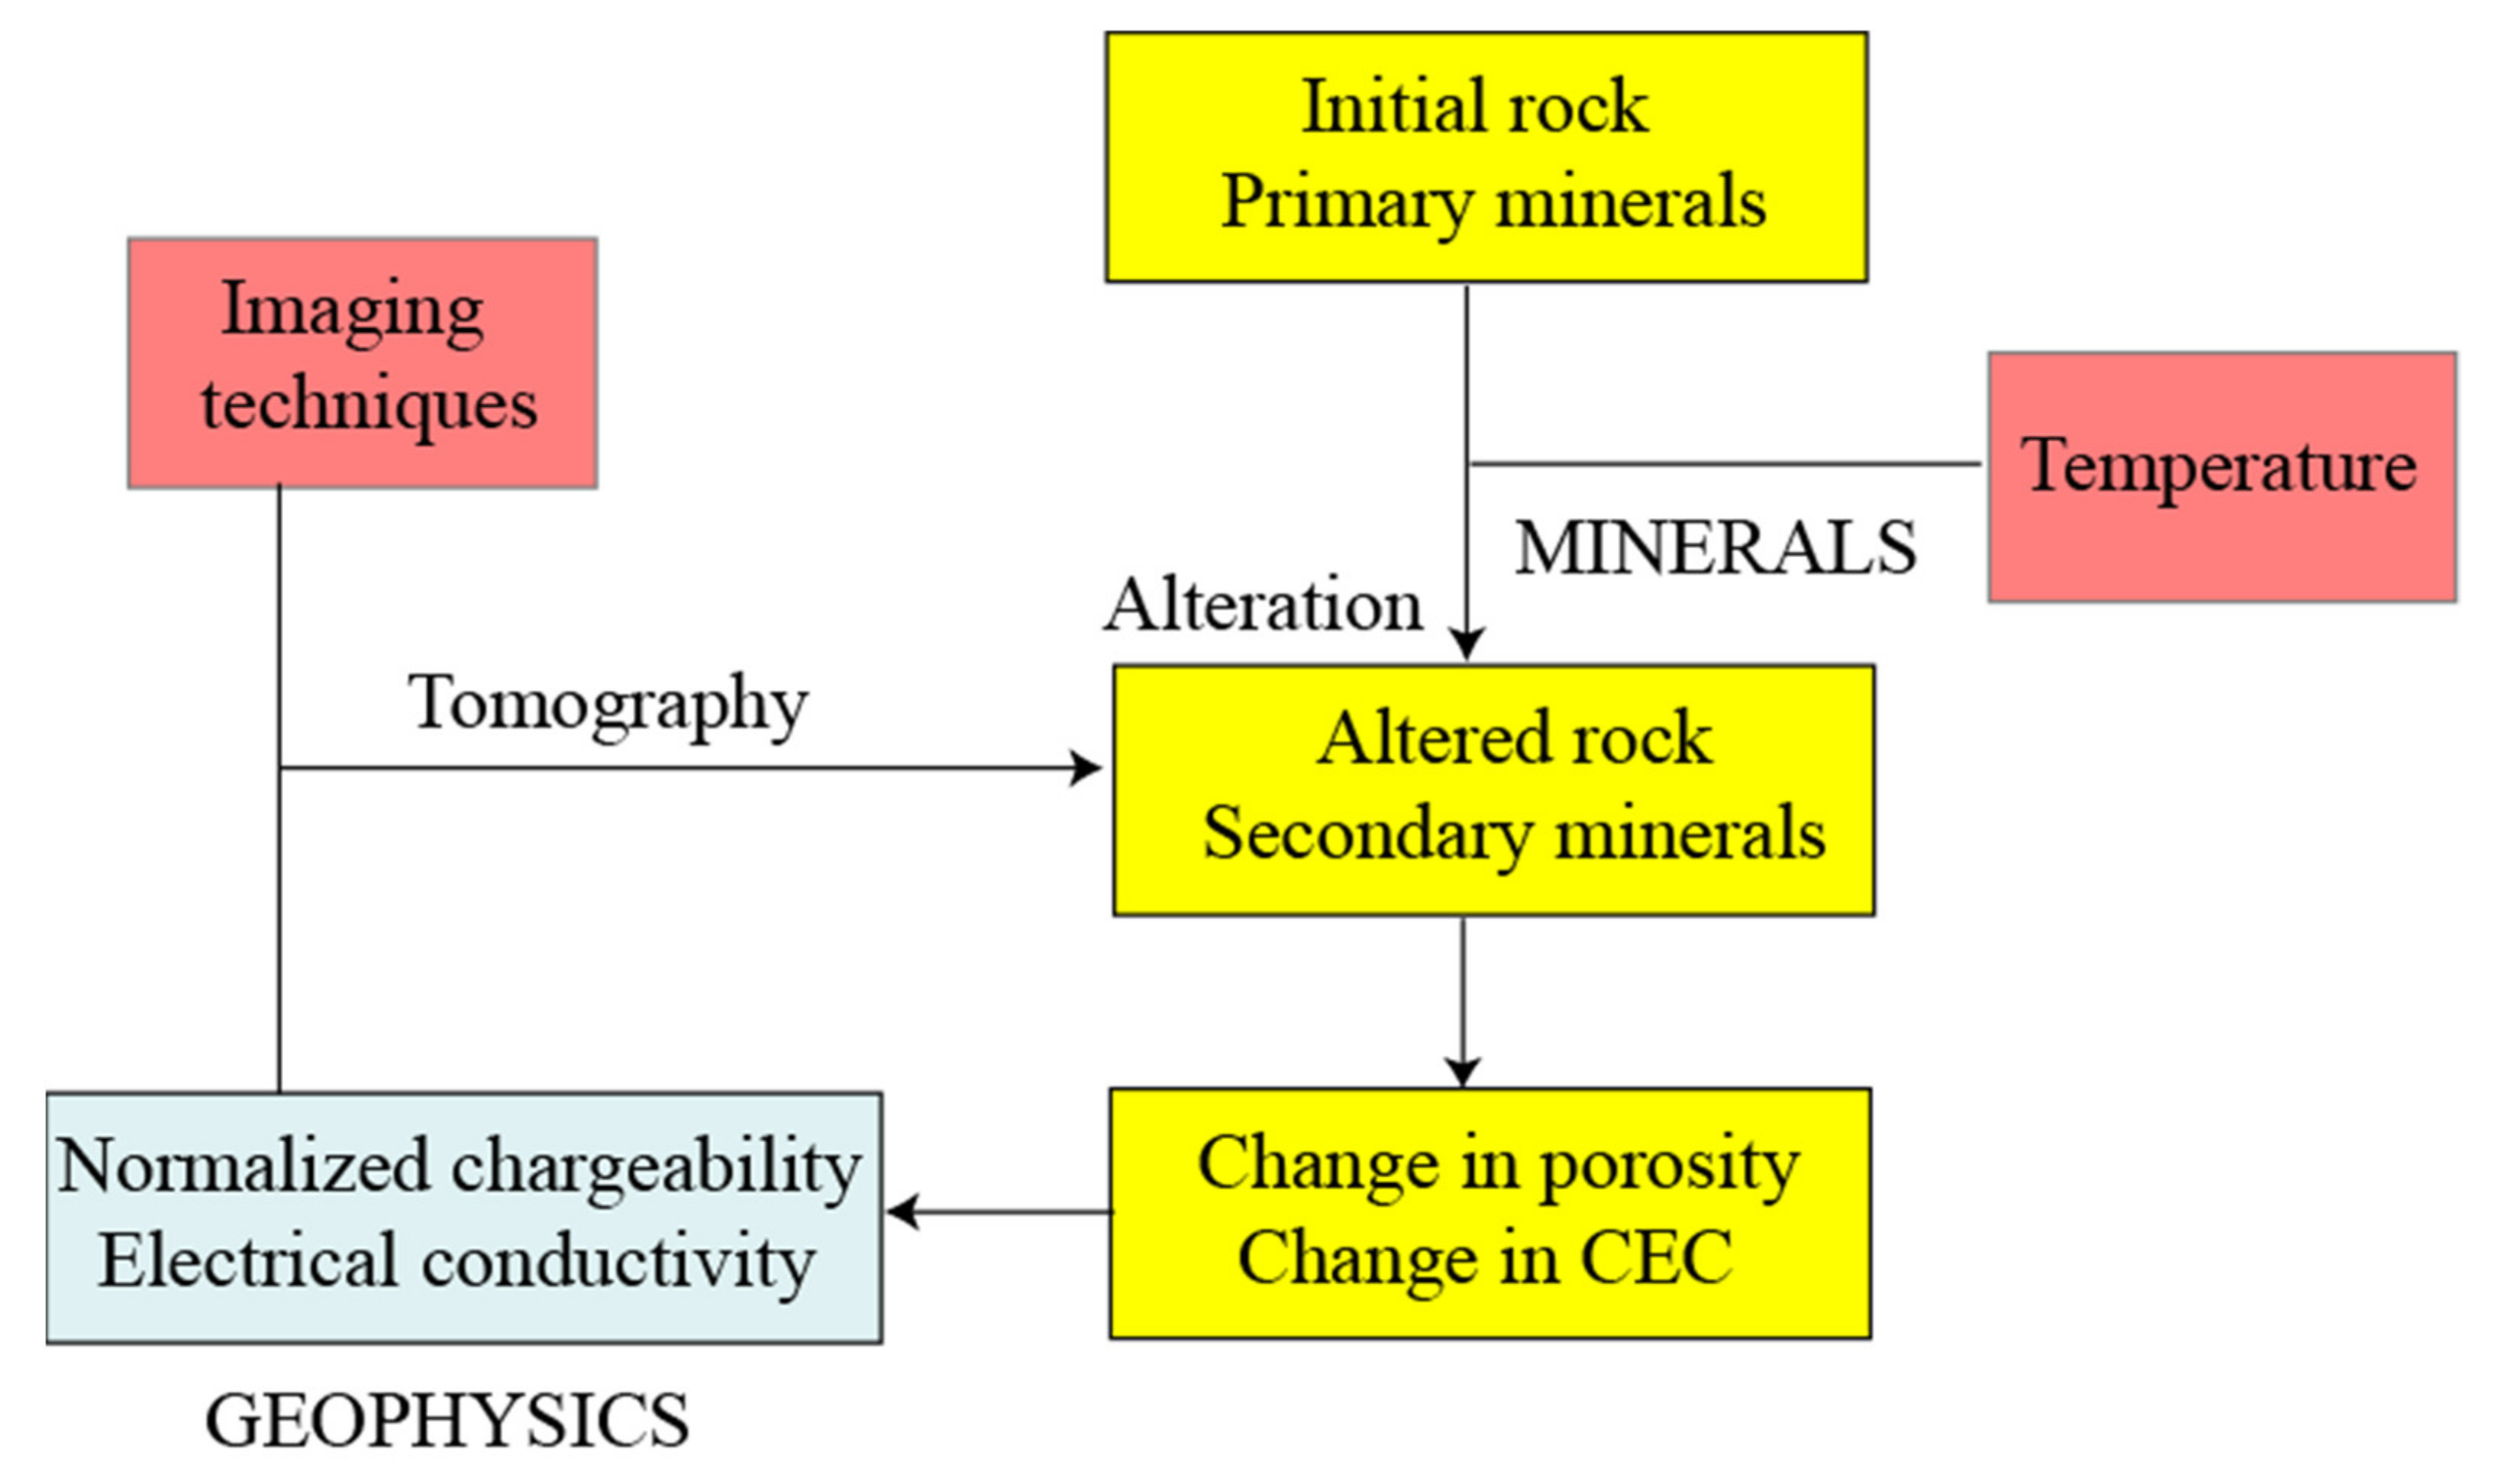
Sketch of the relationships between alteration and geophysics. Alteration modifies the porosity and CEC of (volcanic) rocks. In turn, this modifies the electrical conductivity and normalized chargeability of these rocks in a predictable way. This strong effect can be remotely observed using induced polarization tomography at any scale. This implies that induced polarization can be used to image alteration in volcanic areas and geothermal fields.
Figure 3.
Sketch of the relationships between alteration and geophysics. Alteration modifies the porosity and CEC of (volcanic) rocks. In turn, this modifies the electrical conductivity and normalized chargeability of these rocks in a predictable way. This strong effect can be remotely observed using induced polarization tomography at any scale. This implies that induced polarization can be used to image alteration in volcanic areas and geothermal fields.

Figure 4.
Formation factor F versus (connected) porosity for a set of volcanic rocks (modified from Ghorbani et al. [38]). The data are fitted with Archie’s law F = ϕ−m, where the mean cementation exponent is m = 2.31 ± 0.12. M&P denotes Merapi and Papandayan in Indonesia, respectively. HG and BU corresponds to two wells located on the island of Hawaii (USA).

Figure 5.
Relationship between surface conductivity σS (S m−1) versus the reduced (or normalized) CEC defined as CEC/Fϕ where CEC denotes the cation exchange capacity (expressed here in meq/100 g), F the formation factor, and ϕ the connected porosity (1 meq/(100 g) = 963.2 C kg−1) (Modified from Revil et al. [52]). The slope is equal to B ρg. Keeping in mind that the CEC is here expressed in meq/100 g, using B(Na+, 25 °C) = 3.1 × 10⁻⁹ m−2s−1V−1 (mobility of the cations along the mineral surface) and ρg = 2900 kg m−3, yield, a = 0.009 close to the observed trend a = 0.016 ± 0.08. The datasets show that the trend is unique for both stratovolcanoes and shield volcanoes. E denotes the electrical field, SL denotes the Stern Layer. The cations are in blue and the anions in red.

Figure 6.
Relationship between normalized chargeability and surface conductivity, both being related to the electrical double layer coating the surface of the minerals (modified from Revil et al. [52]). Core samples with magnetite usually found near the ground surface in volcanoes have been excluded. The slope of the trend provides the value of the fundamental dimensionless number R, which is the ratio of the two mobilities involved in the normalized chargeability and surface conductivity, respectively (i.e., and B, respectively). E denotes the electrical field and SL denotes the Stern Layer. The cations are in blue and the anions in red.

Figure 7.
Influence of temperature upon the electrical conductivity and the normalized chargeability of two core samples from Merapi and Papandayan strato-volcanoes in Indonesia, respectively (data from Ghorbani et al. [38]). The data are obtained in the laboratory using an isothermal bath. (a) Electrical conductivity versus temperature for the two core samples. (b) Normalized chargeability versus temperature. The lines correspond to fits using an Arrhenius law (see main text). The fitted activation energies are close to the activation energy of the viscosity of the pore water (15–17 kJ Mol−1). The direct effect of the temperature on the conductivity is roughly 2% per degree Celsius.

Figure 8.
Influence of the smectite content (from XRD, X-Ray Diffraction measurements) in volcanic rocks versus their CEC (modified from Revil et al. [52]). This plot confirms that the smectite content controls the CEC of the volcanic rocks and therefore both surface conductivity and normalized chargeability. The insert concerns the data obtained by Revil et al. (2002, see their Tables 1 and 2 [37]) for zeolized volcaniclastic rocks (CEC obtained by the cobalt hexamine method).

Figure 13.
Detection of vents associated with monogenic domes (1630- and Gaspar domes) at Furnas volcano (San Miguel Island, Portugal). Comparison of shallow high-resolution galvanometric electrical conductivity with respect to the deeper conductivity imaging using the MagnetoTelluric (MT) method. The upper figure shows our result and the lower, Hogg et al. [91]. Note that the two cross-sections are cut at the same position of the 1630-Dome and the depths are all referenced to the sea level.

Figure 14.
CEC distribution obtained from an induced polarization survey performed at the 1630-dome at Furnas volcano (San Miguel Island, Portugal).
Figure 14.
CEC distribution obtained from an induced polarization survey performed at the 1630-dome at Furnas volcano (San Miguel Island, Portugal).

Figure 20.
Prediction of permeability (k) and Uniaxial Compressive Strength (UCS) from an alteration index based on porosity and CEC (F denotes the formation factor and QV the excess of charge of the electrical double layer per unit pore volume). (a) Permeability as a function of alteration index for the rock samples from Whakaari (New Zealand). The coefficient of correlation is r2 = 0.60. The fitted parameters are discussed in the main text. The values of the empirical parameters defined above are given by = 1.46 × 10⁶ (log = 6.17 ± 2.35) and c = 2.88 ± 0.34, for our collection of volcanic rocks. (b) Uniaxial compressive strength (UCS) as a function of alteration indicator (see text for details) for the rock samples from Whakaari (New Zealand). The coefficient of correlation is R2 = 0.61. The fitted parameters are a = −20 ± 2 and b = −127 ± 15 (modified from [16]).

Figure 21.
Geoelectrical alteration path. Stage (1) corresponds to fresh magnetic-rich samples. Stage (3) corresponding to smectite-rich strongly altered core samples. From stages (1) to (2) the magnetic content decreases with the depth of burial. In stage (2), magnetic has disappeared and the alteration starts with an increase of the content in smectite until a temperature of 220 °C is reached at stage (3). Both porosity and CEC change along this trend. Above 220 °C, smectite is progressively replaced by chlorite and mixed-layer clays with a lower CEC (see Figure 9b).

Figure 22.
Alteration trend. (a) Alteration trend for (kaolinite-rich) stratovolcanoes. Reduced cation exchange capacity versus intrinsic formation factor. This trend is not predicted by the theory and can be seen as an additional relationship showing an alteration trend from fresh to altered core samples. Core samples from la Soufrière strato-volcano. (b) Alteration trend for (smectite-rich) shield volcanoes (Hawaii). Reduced cation exchange capacity versus intrinsic formation factor. This trend is not predicted by the induced polarization theory and can be seen as an additional relationship showing an alteration trend from fresh to altered core samples. Core samples from Hawaii.

Publisher’s Note: MDPI stays neutral with regard to jurisdictional claims in published maps and institutional affiliations. |
© 2021 by the authors. Licensee MDPI, Basel, Switzerland. This article is an open access article distributed under the terms and conditions of the Creative Commons Attribution (CC BY) license (https://creativecommons.org/licenses/by/4.0/).
Share and Cite
MDPI and ACS Style
Revil, A.; Gresse, M. Induced Polarization as a Tool to Assess Alteration in Geothermal Systems: A Review. Minerals 2021, 11, 962. https://doi.org/10.3390/min11090962
AMA Style
Revil A, Gresse M. Induced Polarization as a Tool to Assess Alteration in Geothermal Systems: A Review. Minerals. 2021; 11(9):962. https://doi.org/10.3390/min11090962
Chicago/Turabian StyleRevil, Andre, and Marceau Gresse. 2021. "Induced Polarization as a Tool to Assess Alteration in Geothermal Systems: A Review" Minerals 11, no. 9: 962. https://doi.org/10.3390/min11090962
Note that from the first issue of 2016, this journal uses article numbers instead of page numbers. See further details here.