Fabrication and Hydrodynamic Characterization of a Microfluidic Device for Cell Adhesion Tests in Polymeric Surfaces


Abstract
:1. Introduction
- The different biological cells can be monitored in real time with microscopy visualization techniques;
- Low-cost assays and reagents can be used in the microliter range helping in cost cutting;
- Leak-proof inlet and outlet connections can be made easily as the poly-dimethylsiloxane (PDMS) microfluidic channels are deformable;
- The surface can be easily modified and the geometry can be designed according to the application;
- The flow is always laminar, even at a high shear stress range.
2. Materials and Methods
2.1. Mold Preparation
2.2. PDMS Soft Lithography
2.3. Insertion of Polymer Wall Patches in the Channels
2.4. Bacteria and Culture Conditions
2.5. Cell Adhesion Test
2.6. Flow Conditions
2.7. Image Analysis
2.8. Hydrophobicity Test
2.9. Numerical Simulations
3. Results
3.1. Hydrophobicity
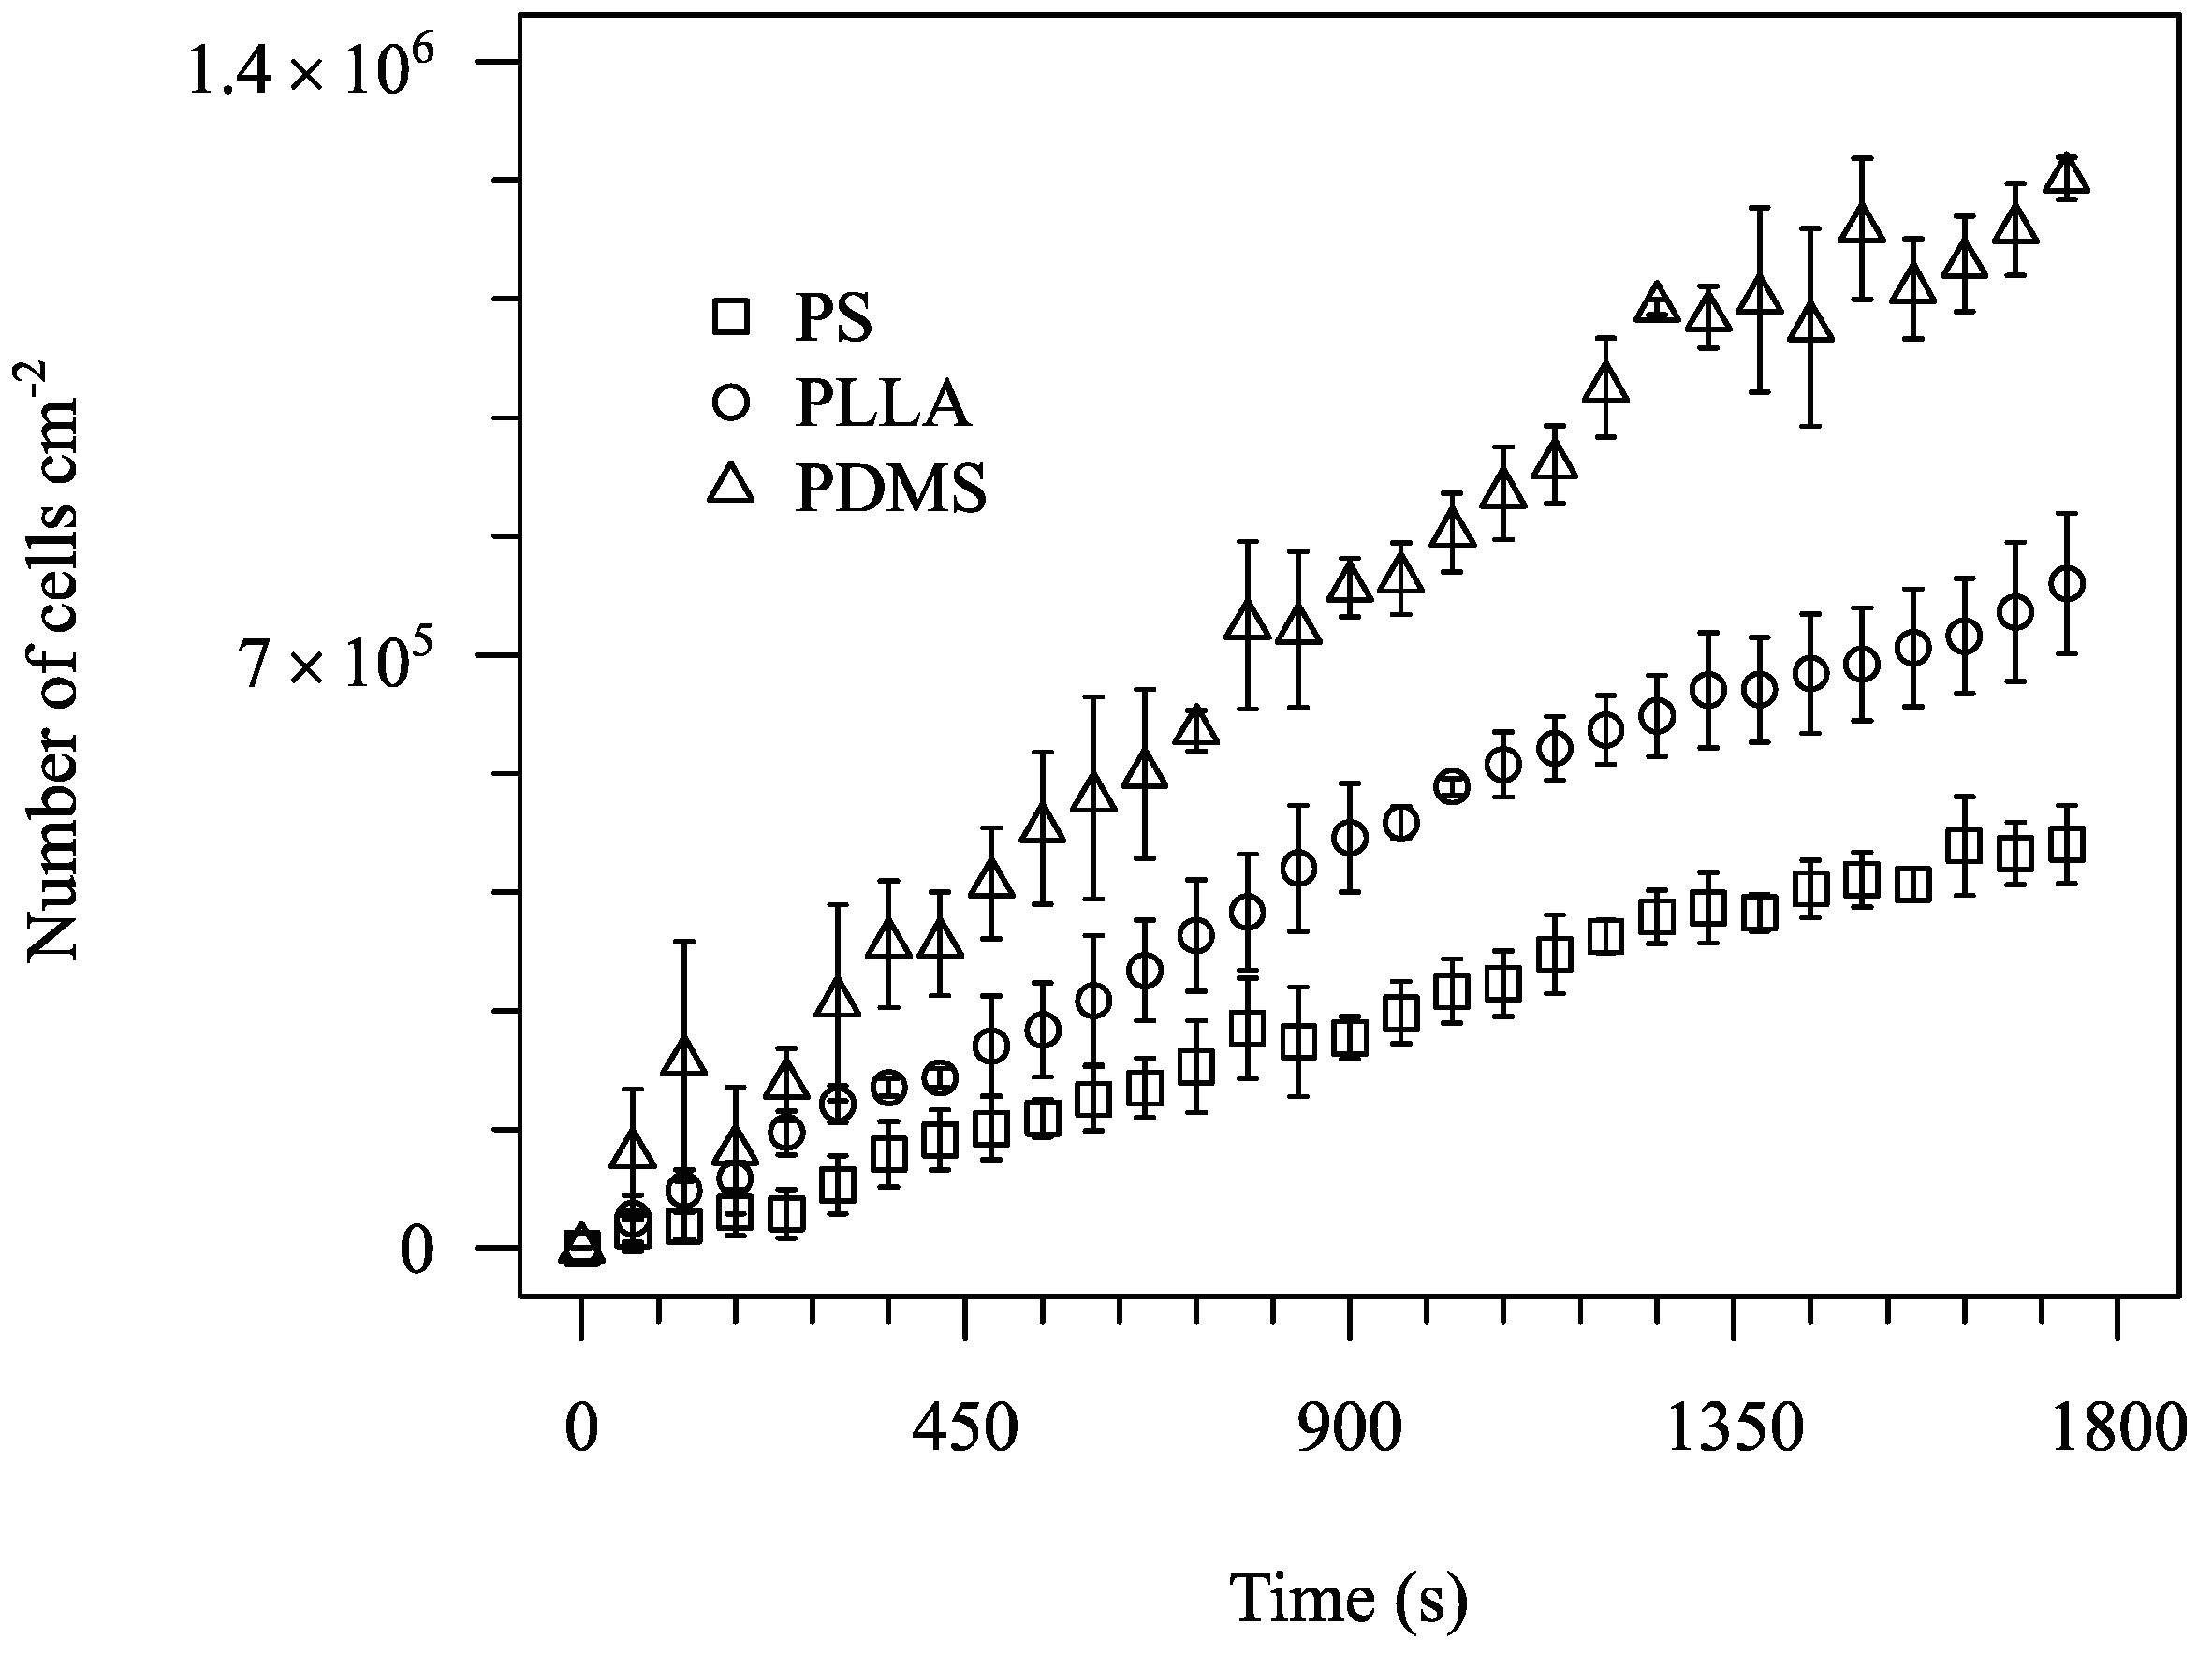
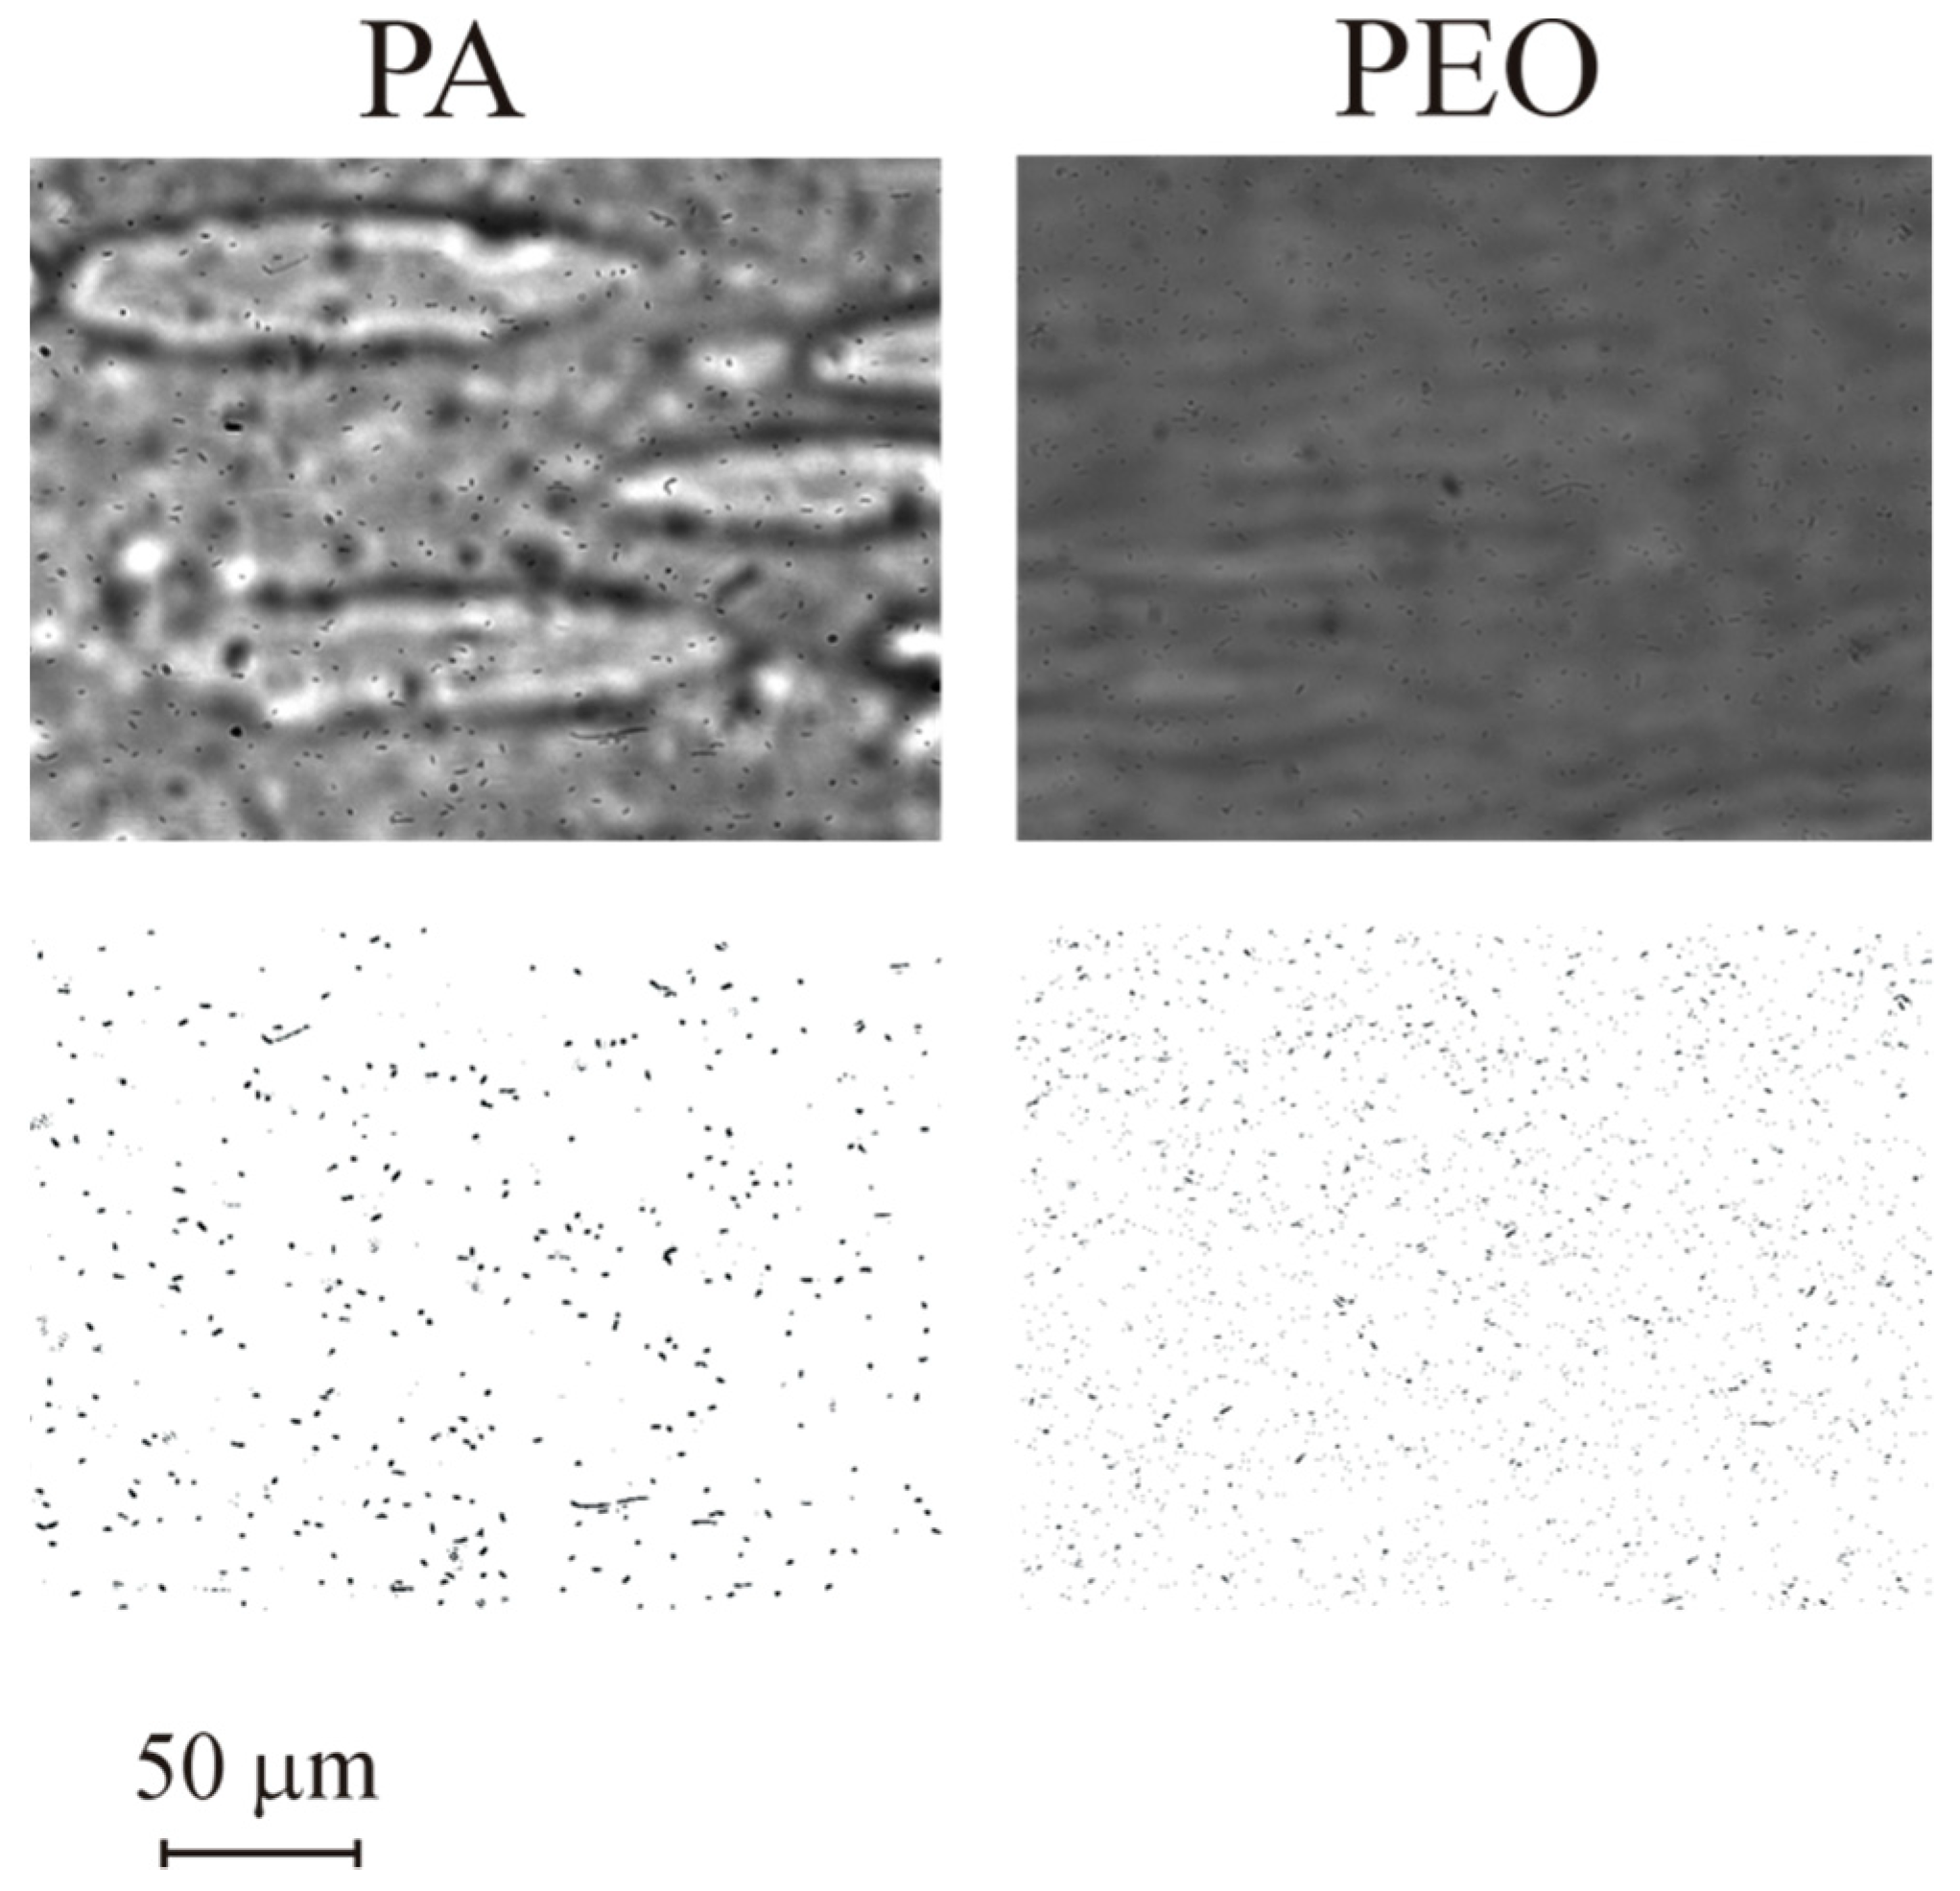
3.2. Adhesion
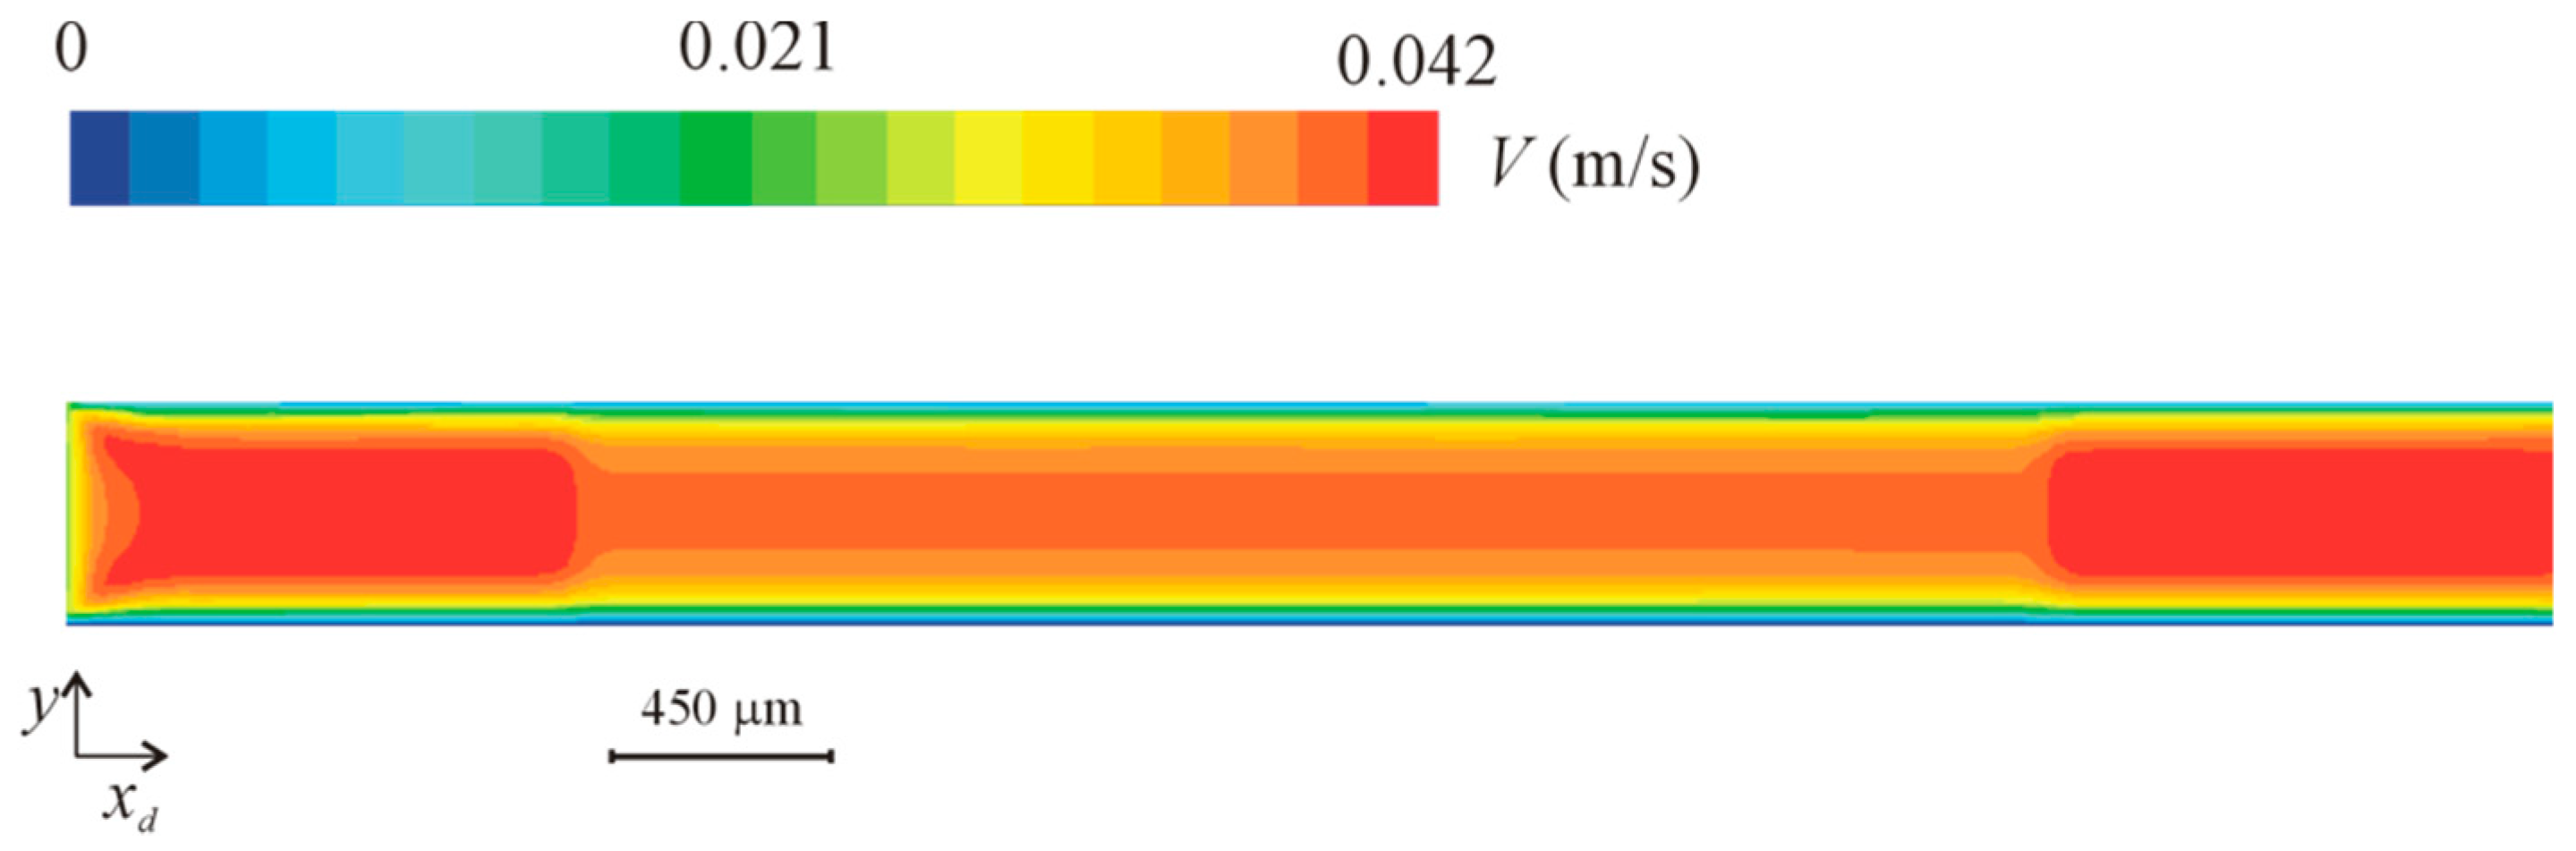
3.3. Numerical Simulation
4. Discussion
5. Conclusions
Author Contributions
Funding
Conflicts of Interest
References
- McCoy, W.F.; Bryers, J.D.; Robbins, J.; Costerton, J.W. Observations of Fouling Biofilm Formation. Can. J. Microbiol. 1981, 27, 910–917. [Google Scholar] [CrossRef]
- Donlan, R.M. Biofilms: Microbial Life on Surfaces. Emerg. Infect. Dis. 2002, 8, 881–890. [Google Scholar] [CrossRef] [PubMed] [Green Version]
- Costerton, J.W.; Stewart, P.S.; Greenberg, E.P. Bacterial Biofilms: A Common Cause of Persistent Infections. Science 1999, 284, 1318–1322. [Google Scholar] [CrossRef]
- Harris, L.G.; Richards, R.G. Staphylococci and Implant Surfaces: A Review. Injury 2006, 37 (Suppl. 2), S3–S14. [Google Scholar] [CrossRef] [PubMed]
- Kong, K.F.; Vuong, C.; Otto, M. Staphylococcus Quorum Sensing in Biofilm Formation and Infection. Int. J. Med. Microbiol. IJMM 2006, 296, 133–139. [Google Scholar] [CrossRef] [PubMed]
- Arciola, C.R.; Campoccia, D.; Speziale, P.; Montanaro, L.; Costerton, J.W. Biofilm Formation in Staphylococcus Implant Infections. A Review of Molecular Mechanisms and Implications for Biofilm-Resistant Materials. Biomaterials 2012, 33, 5967–5982. [Google Scholar] [CrossRef]
- Bjarnsholt, T.; Alhede, M.; Alhede, M.; Eickhardt-Sorensen, S.R.; Moser, C.; Kuhl, M.; Jensen, P.O.; Hoiby, N. The in Vivo Biofilm. Trends Microbiol. 2013, 21, 466–474. [Google Scholar] [CrossRef] [PubMed]
- Seth, A.K.; Geringer, M.R.; Hong, S.J.; Leung, K.P.; Mustoe, T.A.; Galiano, R.D. In Vivo Modeling of Biofilm-Infected Wounds: A Review. J. Surg. Res. 2012, 178, 330–338. [Google Scholar] [CrossRef] [PubMed]
- Esposito, S.; Purrello, S.M.; Bonnet, E.; Novelli, A.; Tripodi, F.; Pascale, R.; Unal, S.; Milkovich, G. Central Venous Catheter-Related Biofilm Infections: An Up-To-Date Focus on Meticillin-Resistant Staphylococcus Aureus. J. Glob. Antimicrob. Resist. 2013, 1, 71–78. [Google Scholar] [CrossRef] [PubMed]
- Middleton, J.C.; Tipton, A.J. Synthetic Biodegradable Polymers as Orthopedic Devices. Biomaterials 2000, 21, 2335–2346. [Google Scholar] [CrossRef]
- Abu-Lail, N.I.; Beyenal, H. Chapter 5.2—Characterization of Bacteria–Biomaterial Interactions, from a Single Cell to Biofilms. In Characterization of Biomaterials; Bandyopadhyay, A., Bose, S., Eds.; Academic Press: Oxford, OH, USA, 2013; pp. 207–253. [Google Scholar]
- Dillow, A.K.; Tirrell, M. Targeted Cellular Adhesion at Biomaterial Interfaces. Curr. Opin. Solid State Mater. Sci. 1998, 3, 252–259. [Google Scholar] [CrossRef]
- Ramakrishna, S.; Mayer, J.; Wintermantel, E.; Leong, K.W. Biomedical Applications of Polymer-Composite Materials: A Review. Compos. Sci. Technol. 2001, 61, 1189–1224. [Google Scholar] [CrossRef]
- Meng, B.; Wang, J.; Zhu, N.; Meng, Q.Y.; Cui, F.Z.; Xu, Y.X. Study of Biodegradable and Self-Expandable Plla Helical Biliary Stent in Vivo and in Vitro. J. Mater. Sci. Mater. Med. 2006, 17, 611–617. [Google Scholar] [CrossRef] [PubMed]
- Tamai, H.; Igaki, K.; Kyo, E.; Kosuga, K.; Kawashima, A.; Matsui, S.; Komori, H.; Tsuji, T.; Motohara, S.; Uehata, H. Initial and 6-Month Results of Biodegradable Poly-l-Lactic Acid Coronary Stents in Humans. Circulation 2000, 102, 399–404. [Google Scholar] [CrossRef]
- Colvin, A.; Sharma, C.; Parides, M.; Glashow, J. What is the Best Femoral Fixation of Hamstring Autografts in Anterior Cruciate Ligament Reconstruction?: A Meta-Analysis. Clin. Orthop. Relat. Res. 2011, 469, 1075–1081. [Google Scholar] [CrossRef] [PubMed]
- Beebe, D.J.; Mensing, G.A.; Walker, G.M. Physics and Applications of Microfluidics in Biology. Annu. Rev. Biomed. Eng. 2002, 4, 261–286. [Google Scholar] [CrossRef]
- Jain, K.K. Biochips and Microarrays: Technology and Commercial Potential; Urch Publishing: London, UK, 2000. [Google Scholar]
- Stone, H.A.; Stroock, A.D.; Ajdari, A. Engineering Flows in Small Devices Microfluidics Towards Lab-On-A-Chip. Annu. Rev. Fluid Mech. 2004, 36, 381–411. [Google Scholar] [CrossRef]
- Duffy, D.C.; McDonald, J.C.; Schueller, O.J.; Whitesides, G.M. Rapid Prototyping of Microfluidic Systems in Poly (Dimethylsiloxane). Anal. Chem. 1998, 70, 4974–4984. [Google Scholar] [CrossRef] [PubMed]
- Blanco, F.J.; Agirregabiria, M.; Garcia, J.; Berganzo, J.; Tijero, M.; Arroyo, M.T.; Ruano, J.M.; Aramburu, I.; Mayora, K. Novel Three-Dimensional Embedded Su-8 Microchannels Fabricated Using a Low Temperature Full Wafer Adhesive Bonding. J. Micromech. Microeng. 2004, 14, 1047–1056. [Google Scholar] [CrossRef]
- Che-Hsin, L.; Gwo-Bin, L.; Bao-Wen, C.; Guan-Liang, C. A New Fabrication Process for Ultra-Thick Microfluidic Microstructures Utilizing Su-8 Photoresist. J. Micromech. Microeng. 2002, 12, 590. [Google Scholar]
- Tseng, A.A. Recent Developments in Micromilling Using Focused Ion Beam Technology. J. Micromech. Microeng. 2004, 14, R15–R34. [Google Scholar] [CrossRef]
- Schlautmann, S.; Wensink, H.; Schasfoort, R.; Elwenspoek, M.; Van Den Berg, A. Powder-Blasting Technology as an Alternative Tool for Microfabrication of Capillary Electrophoresis Chips with Integrated Conductivity Sensors. J. Micromech. Microeng. 2001, 11, 386–389. [Google Scholar] [CrossRef]
- Becker, H.; Heim, U. Hot Embossing as a Method for the Fabrication of Polymer High Aspect Ratio Structures. Sens. Actuators A Phys. 2000, 83, 130–135. [Google Scholar] [CrossRef]
- Morales, A.M.; Lieber, C.M. A Laser Ablation Method for the Synthesis of Crystalline Semiconductor Nanowires. Science 1998, 279, 208–211. [Google Scholar] [CrossRef]
- Ikuta, K.; Hirowatari, K. In Real Three Dimensional Micro Fabrication Using Stereo Lithography and Metal Molding. In Proceedings of the IEEE Micro Electro Mechanical Systems, Fort Lauderdale, FL, USA, 7–10 February 1993; pp. 42–47. [Google Scholar]
- Bartholomeusz, D.A.; Boutte, R.W.; Andrade, J.D. Xurography: Rapid Prototyping of Microstructures Using a Cutting Plotter. J. Microelectromech. Syst. 2005, 14, 1364–1374. [Google Scholar] [CrossRef]
- Xia, Y.; Whitesides, G.M. Soft Lithography. Annu. Rev. Mater. Sci. 1998, 28, 153–184. [Google Scholar] [CrossRef]
- Eddings, M.A.; Johnson, M.A.; Gale, B.K. Determining the Optimal Pdms–Pdms Bonding Technique for Microfluidic Devices. J. Micromech. Microeng. 2008, 18, 067001. [Google Scholar] [CrossRef]
- Zhang, W.; Ferguson, G.; Tatic-Lucic, S. Elastomer-Supported Cold Welding for Room Temperature Wafer-Level Bonding. In Proceedings of the 17th IEEE International Conference on MEMS, Maastricht, The Netherlands, 25–29 January 2004; pp. 741–744. [Google Scholar]
- Koschwanez, J.H.; Carlson, R.H.; Meldrum, D.R. Thin Pdms Films Using Long Spin Times or Tert-Butyl Alcohol as a Solvent. PLoS ONE 2009, 4, e4572. [Google Scholar] [CrossRef] [PubMed]
- Moreira, J.M.; Araujo, J.D.; Miranda, J.M.; Simoes, M.; Melo, L.F.; Mergulhao, F.J. The Effects of Surface Properties on Escherichia Coli Adhesion are Modulated by Shear Stress. Coll. Surf. B Biointerfaces 2014, 123, 1–7. [Google Scholar] [CrossRef] [PubMed]
- Teodosio, J.S.; Simoes, M.; Melo, L.F.; Mergulhao, F.J. Flow Cell Hydrodynamics and Their Effects on E. Coli Biofilm Formation under Different Nutrient Conditions and Turbulent Flow. Biofouling 2011, 27, 1–11. [Google Scholar] [CrossRef] [PubMed]
- Simoes, M.; Simoes, L.C.; Cleto, S.; Pereira, M.O.; Vieira, M.J. The Effects of a Biocide and a Surfactant on the Detachment of Pseudomonas Fluorescens from Glass Surfaces. Int. J. Food Microbiol. 2008, 121, 335–341. [Google Scholar] [CrossRef] [PubMed]
- Ronald, L.S. Analysis of Pathoadaptive Mutations in Escherichia Coli; ProQuest: Michigan, MI, USA, 2008. [Google Scholar]
- Michelson, A. Platelets, 2nd ed.; Academic Press: Cambridge, MA, USA, 2002. [Google Scholar]
- Schneider, C.A.; Rasband, W.S.; Eliceiri, K.W. Nih Image to Imagej: 25 Years of Image Analysis. Nat. Methods 2012, 9, 671–675. [Google Scholar] [CrossRef]
- Van Oss, C. Interfacial Forces in Aqueous Media; Marcel Dekker Inc.: New York, NY, USA, 1994. [Google Scholar]
- Janczuk, B.; Chibowski, E.; Bruque, J.M.; Kerkeb, M.L.; Caballero, F.G. On the Consistency of Surface Free-Energy Components as Calculated from Contact Angles of Different Liquids—An Application to the Cholesterol Surface. J. Colloid Interface Sci. 1993, 159, 421–428. [Google Scholar] [CrossRef]
- Simoes, L.C.; Simoes, M.; Vieira, M.J. Adhesion and Biofilm Formation on Polystyrene by Drinking Water-Isolated Bacteria. Antonie Van Leeuwenhoek 2010, 98, 317–329. [Google Scholar] [CrossRef]
- Busscher, H.J.; Van Der Mei, H.C. Microbial Adhesion in Flow Displacement Systems. Clin. Microbiol. Rev. 2006, 19, 127–141. [Google Scholar] [CrossRef] [Green Version]
- Leonard, B.P. A Stable and Accurate Convective Modelling Procedure Based on Quadratic Upstream Interpolation. Comput. Methods Appl. Mech. Eng. 1979, 19, 59–98. [Google Scholar] [CrossRef]
- Issa, R.I. Solution of the Implicitly Discutised Fluid Flow Equations by Operating-Splitting. J. Comput. Phys. 1986, 62, 40–65. [Google Scholar] [CrossRef]
- Absolom, D.R.; Lamberti, F.V.; Policova, Z.; Zingg, W.; Van Oss, C.J.; Neumann, A.W. Surface Thermodynamics of Bacterial Adhesion. Appl. Environ. Microbiol. 1983, 46, 90–97. [Google Scholar]
- Pinto, E.; Faustino, V.; Rodrigues, R.; Pinho, D.; Garcia, V.; Miranda, J.; Lima, R. A Rapid and Low-Cost Nonlithographic Method to Fabricate Biomedical Microdevices for Blood Flow Analysis. Micromachines 2015, 6, 121–135. [Google Scholar] [CrossRef]


| Polymer | Solvent | Polymer Concentration (w/w) |
|---|---|---|
| Polyethylene oxide (PEO) | Dichloromethane (DCM) | 1.14% |
| Poly-l-lactide acid (PLLA) | Dichloromethane (DCM) | 5.00% |
| Polyamide (PA) | Trichloroethanol | 0.49% |
| Polydimethylsiloxane (PDMS) | Curing agent (Sylgard 184) | 10.0% |
| Flow Rate (μL/min) | Mean Velocity (m/s) | Reynolds Number | Nominal Wall Shear Stress (Equation (6)) (Pa) |
|---|---|---|---|
| 0.667 | 0.06 | 0.01 | |
| 1.35 | 0.12 | 0.02 | |
| 15 | 1.30 | 0.2 | |
| 65.1 | 5.65 | 1 |
| Polymer Surface | Hydrophobicity ΔG (mJ·m−2) | Zeta Potential (mV) |
|---|---|---|
| PLLA | −65.32 | −27.9 |
| PDMS | −61.82 | −29.3 |
| PA | −37.58 | −28.0 |
| PEO | 0.350 | −11.0 |
| PS | −49.56 | −29.8 |
© 2019 by the authors. Licensee MDPI, Basel, Switzerland. This article is an open access article distributed under the terms and conditions of the Creative Commons Attribution (CC BY) license (http://creativecommons.org/licenses/by/4.0/).
Share and Cite
Ponmozhi, J.; Moreira, J.M.R.; Mergulhão, F.J.; Campos, J.B.L.M.; Miranda, J.M. Fabrication and Hydrodynamic Characterization of a Microfluidic Device for Cell Adhesion Tests in Polymeric Surfaces. Micromachines 2019, 10, 303. https://doi.org/10.3390/mi10050303
Ponmozhi J, Moreira JMR, Mergulhão FJ, Campos JBLM, Miranda JM. Fabrication and Hydrodynamic Characterization of a Microfluidic Device for Cell Adhesion Tests in Polymeric Surfaces. Micromachines. 2019; 10(5):303. https://doi.org/10.3390/mi10050303
Chicago/Turabian StylePonmozhi, J., J. M. R. Moreira, F. J. Mergulhão, J. B. L. M. Campos, and J. M. Miranda. 2019. "Fabrication and Hydrodynamic Characterization of a Microfluidic Device for Cell Adhesion Tests in Polymeric Surfaces" Micromachines 10, no. 5: 303. https://doi.org/10.3390/mi10050303