Article

In Situ High-Energy X-ray Diffraction during Hot-Forming of a Multiphase TiAl Alloy

1
Institute of Materials Research, Helmholtz-Zentrum Geesthacht, Geesthacht 21502, Germany
2
Institute of Materials Physics and Technology, Hamburg University of Technology, Hamburg 21073, Germany
*
Author to whom correspondence should be addressed.
Metals 2015, 5(4), 2252-2265; https://doi.org/10.3390/met5042252
Submission received: 28 September 2015 / Revised: 19 November 2015 / Accepted: 23 November 2015 / Published: 30 November 2015
(This article belongs to the Special Issue Metals Challenged by Neutron and Synchrotron Radiation)

Abstract

:
Intermetallic γ-TiAl based alloys exhibit excellent high-temperature strength combined with low density. This makes them ideal candidates for replacing the twice as dense Ni base super-alloys, currently used in the medium temperature range (~700 °C) of industrial and aviation gas turbines. An important step towards the serial production of TiAl parts is the development of suitable hot-forming processes. Thermo-mechanical treatments often result in mechanical anisotropy due to the formation of crystallographic textures. However, with conventional texture analysis techniques, their formation can only be studied after processing. In this study, in situ high-energy X-ray diffraction measurements with synchrotron radiation were performed during hot-forming. Thus, it was possible to record the evolution of the phase constitution as well as the formation of crystallographic texture of different phases directly during processing. Several process temperatures (1100 °C to 1300 °C) and deformation rates were investigated. Based on these experiments, a process window can be recommended which results in the formation of an optimal reduced texture.

Graphical Abstract

1. Introduction

The demand to reduce both fuel consumption and greenhouse gas emissions from gas turbines and combustion engines is continuously increasing. This requires the development of novel lightweight materials which can withstand extreme conditions, like high stresses at elevated temperatures. Intermetallic γ-TiAl based alloys are the most promising candidates among these materials. They have, for example, similar high temperature strength and creep resistance to the currently used Ni base superalloys but only half of their density [1]. One recent, first industrial application of TiAl alloys is as low pressure turbine blade material in civil aircraft engines at service temperatures up to about 700 °C [2]. Great efforts are made to develop a suitable hot forming processes, e.g., forging routes, for serial production of TiAl parts [3,4,5,6]. Thus, research activities are currently focused on TiAl alloys with additional amounts of β-Ti(Al) stabilizing elements like Nb or Mo because the ductile bcc high-temperature β phase improves the formability at elevated temperatures [1,7].
Thermo-mechanical treatments (TMT), such as hot-rolling or forging, are well-established processes to improve mechanical properties and to homogenize the microstructure of metals and alloys as well as for near net-shape production. However, TMT can also produce unwanted mechanical anisotropy due to the formation of crystallographic texture. Thus, the study of texture formation is of great technological interest. If texture formation is understood, it could be used to control texture evolution in the future. Hot forming of γ-TiAl based alloys often takes place in phase fields with different phase compositions to those at room or service temperatures. But with conventional texture analysis techniques the texture formed can only be studied by post process metallographic methods [8,9]. This means that the real high temperature material conditions are often masked by lower temperature phase transformations or recrystallization.
First texture measurements after hot compression of γ-TiAl based alloys were performed by Fukutomi et al. [10] and Hartig et al. [11]. They discussed either pure deformation or dynamic recrystallization (DRX) as the dominant texture forming mechanism. Computer simulations of γ-TiAl deformation texture development, based on the single crystal yield surface model of γ-TiAl according to Mecking et al. [12] later allowed a clear discrimination between the above mentioned texture formation mechanisms. After hot forming on an industrial scale, e.g., hot-rolled TiAl sheets, γ-TiAl textures were observed that could also be described as a mixture of deformation and DRX components [13]. However hot forming of TiAl often takes place at temperatures and in phase fields with α-Ti(Al) as the main phase. For a long time little was known about the texture formation of α-Ti(Al) and its influence on the texture of γ-TiAl, to which it transforms at lower temperatures. The α-Ti(Al) texture was measured and studied for the first time by Schillinger et al. [14] and Stark et al. [15] using oil quenched as-rolled TiAl samples.
Over the last decade, new high-energy synchrotron sources were constructed, which, in combination with advanced sample environments, provide novel tools and analysis methods for engineering and materials science [16,17,18]. Such synchrotron sources offer the possibility for time-resolved in situ studies during materials processing [19,20]. In the current paper we have used a deformation dilatometer that has been modified for working in the synchrotron beamline to perform hot-compression experiments. In situ high-energy X-ray diffraction (HEXRD) measurements were performed during hot-forming. This setup enables an in situ observation of the interaction and evolution of several microstructural parameters during processing. In particular, we can directly observe the evolution of crystallographic texture, phase fractions, or grain size during deformation and simultaneously record the process parameters, like temperature, force, and length change. Thus, we have been able to systematically analyze texture evolution of a multi-phase alloy in different phase fields, both in situ and time resolved.

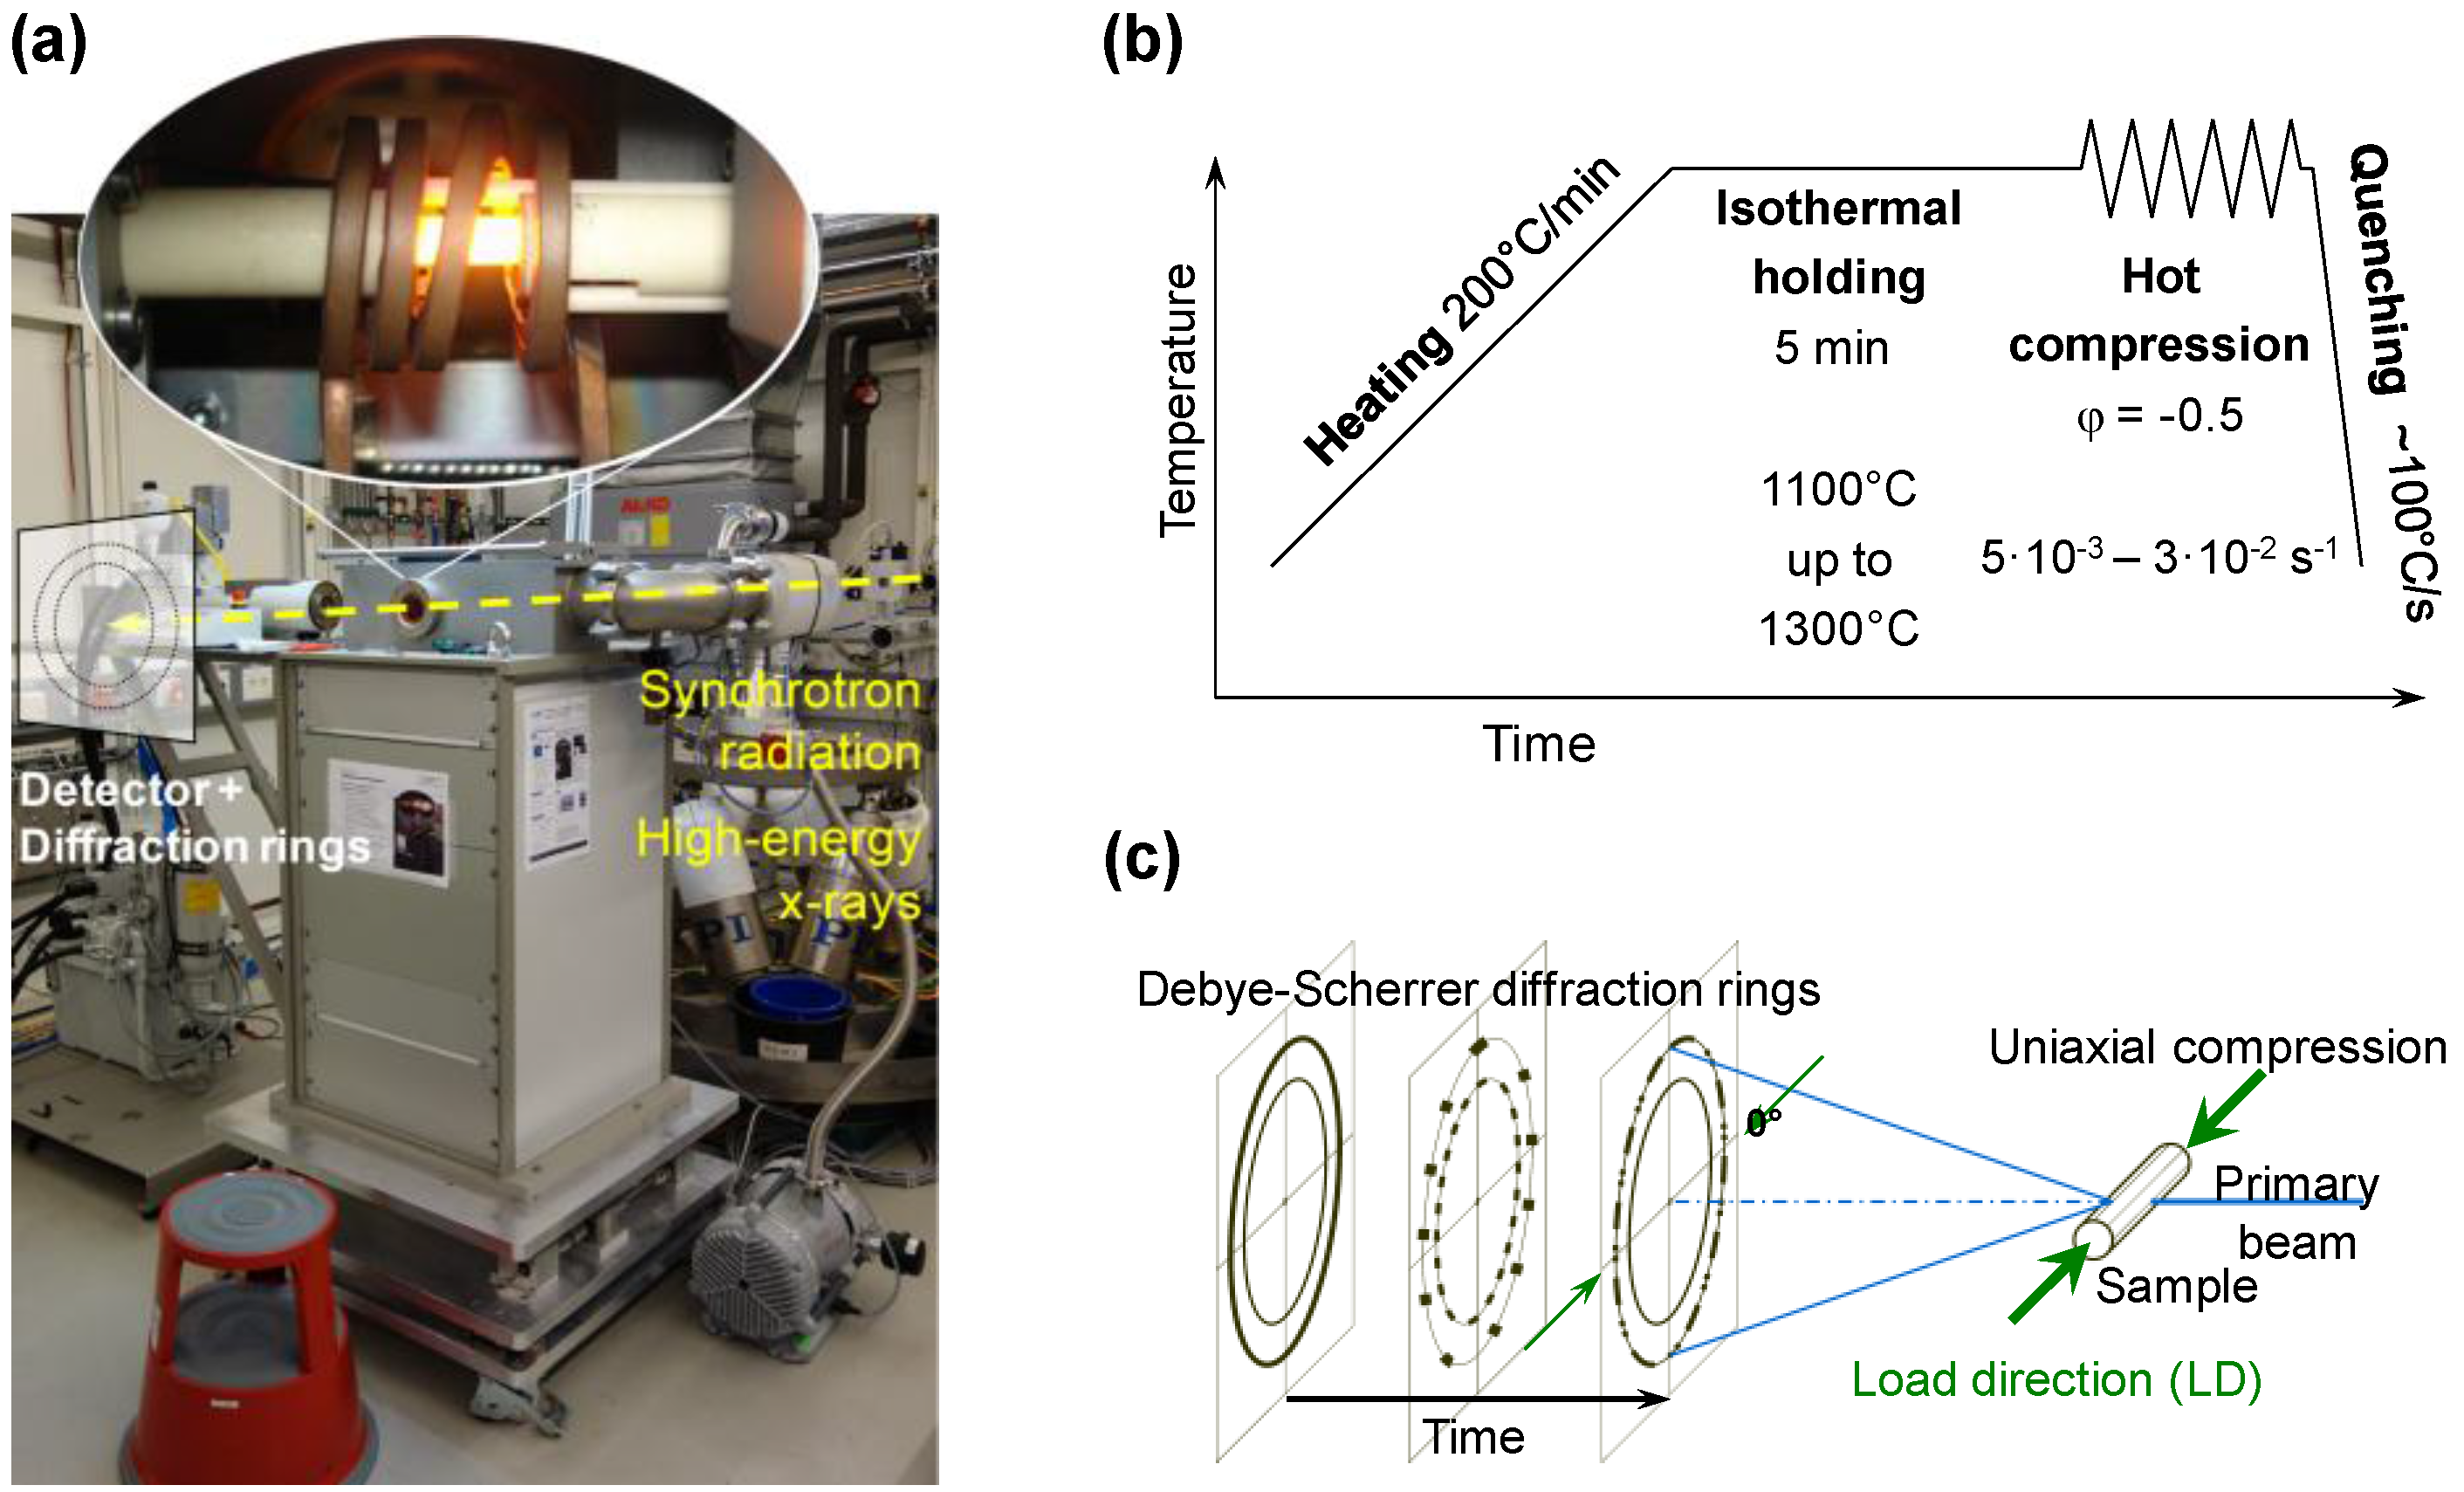
2. Experimental Section

We studied a novel Nb rich γ-TiAl based alloy with a nominal composition of Ti-42Al-8.5Nb (in at. %). In order to start with chemically homogeneous and texture free samples the alloy was powder metallurgically produced using the EIGA technique (Electron Induction Melting Gas Atomization) [21]. Alloy powder with a particle size up to 180 μm was filled under Ar atmosphere into Ti cans, which subsequently were degassed and sealed gas tight. These cans were hot-isostatically pressed (HIPed) for 2 h at 1250 °C at 200 MPa. The HIPed material contained about 500 μg/g oxygen and 110 μg/g nitrogen. Cylindrical samples 4 and 5 mm in diameter and 10 mm length were cut by spark erosion from the HIPed powder compact.
Several heating and hot compression tests were performed using a DIL 805A/D quenching and deformation dilatometer (TA Instruments, Hüllhorst, Germany) that had been modified for working in the Helmholtz-Zentrum Geesthacht synchrotron beamline HEMS at PETRA III, DESY (Hamburg, Germany) [17,22]. This setup is displayed in Figure 1a. In order to avoid sample oxidation the experiments were performed in an Ar atmosphere. The temperature was controlled by a spot welded type S thermocouple. The phase constitution of the Ti-42Al-8.5Nb alloy was measured during heating up to 1400 °C using a heating rate of 10 °C·min−1. An additional sample was heated up in 50 °C steps from 900 °C to 1300 °C. The sample was held at each temperature for at least 30 min (below 1100 °C for 1 h) to come closer to equilibrium conditions. Five temperatures between 1100 °C and 1300 °C were selected for the hot forming experiments in order to study the deformation behavior in different phase fields. A sketch with the process parameters is shown in Figure 1b. The specimens were heated up to the processing temperature at 200 °C·min−1 followed by isothermal holding at temperature for 5–10 min. Subsequently the specimens were deformed with deformation rates between 5 × 10⁻³·s−1 and 3 × 10⁻²·s−1 up to a total deformation of φ = −0.5 corresponding to about 40% height reduction. Immediately after deformation, within 1 s, the samples were quenched at a cooling rate of about 100 °C·s−1 by blowing with Ar gas, in order to keep the deformed microstructure.
During the experiments, high-energy X-ray diffraction (HEXRD) was performed in transmission geometry (Figure 1c). In order for a X-ray transmission through the samples a high-energy X-ray beam with an energy of 100 keV (corresponding to a wavelength of 0.124 Å) was used. The beam size was 1 mm × 1 mm. The resulting Debye-Scherrer diffraction rings were continuously recorded during deformation on a Perkin Elmer XRD 1622 (Perkin Elmer, Norwalk, CT, USA) flat panel detector with acquisition rates up to 5 Hz and an exposure time of 0.2–1 s. In order to calculate the instrumental parameters a calibration measurement was done using standardized lanthanum hexaboride (LaB6) powder. The diffraction rings were azimuthally integrated using FIT2D software (ESRF, Grenoble, France) [23]. Phase fractions and crystallographic textures were determined using the MAUD program (University of Trento, Trento, Italy) [24]. The Rietveld texture analysis method implemented in the Rietveld program MAUD enables refinement of both the phase parameters and the orientation distribution functions (ODF), which were calculated by means of the E-WIMV approach. Thus the effect of texture is taken into account while refining phase parameters and fractions. Changes in the phase contents up to ±3 vol. % during deformation might be ascribed to temperature oscillations.
Figure 1. (a) The deformation dilatometer mounted in the HEMS beamline. The insert shows the interior of the measurement chamber with a heated sample just before hot forming. Schematic diagrams showing; (b) the compression experiments and processing parameters; and (c) the diffraction geometry.
Metals 05 02252 g001
Microstructural analysis was performed on deformed and quenched samples that had been cut and vibration polished. Scanning electron microscopy (SEM) was performed in the back scattered electron (BSE) mode in a Zeiss Gemini electron microscope with field emission gun (Oberkochen, Germany).

3. Results and Discussion

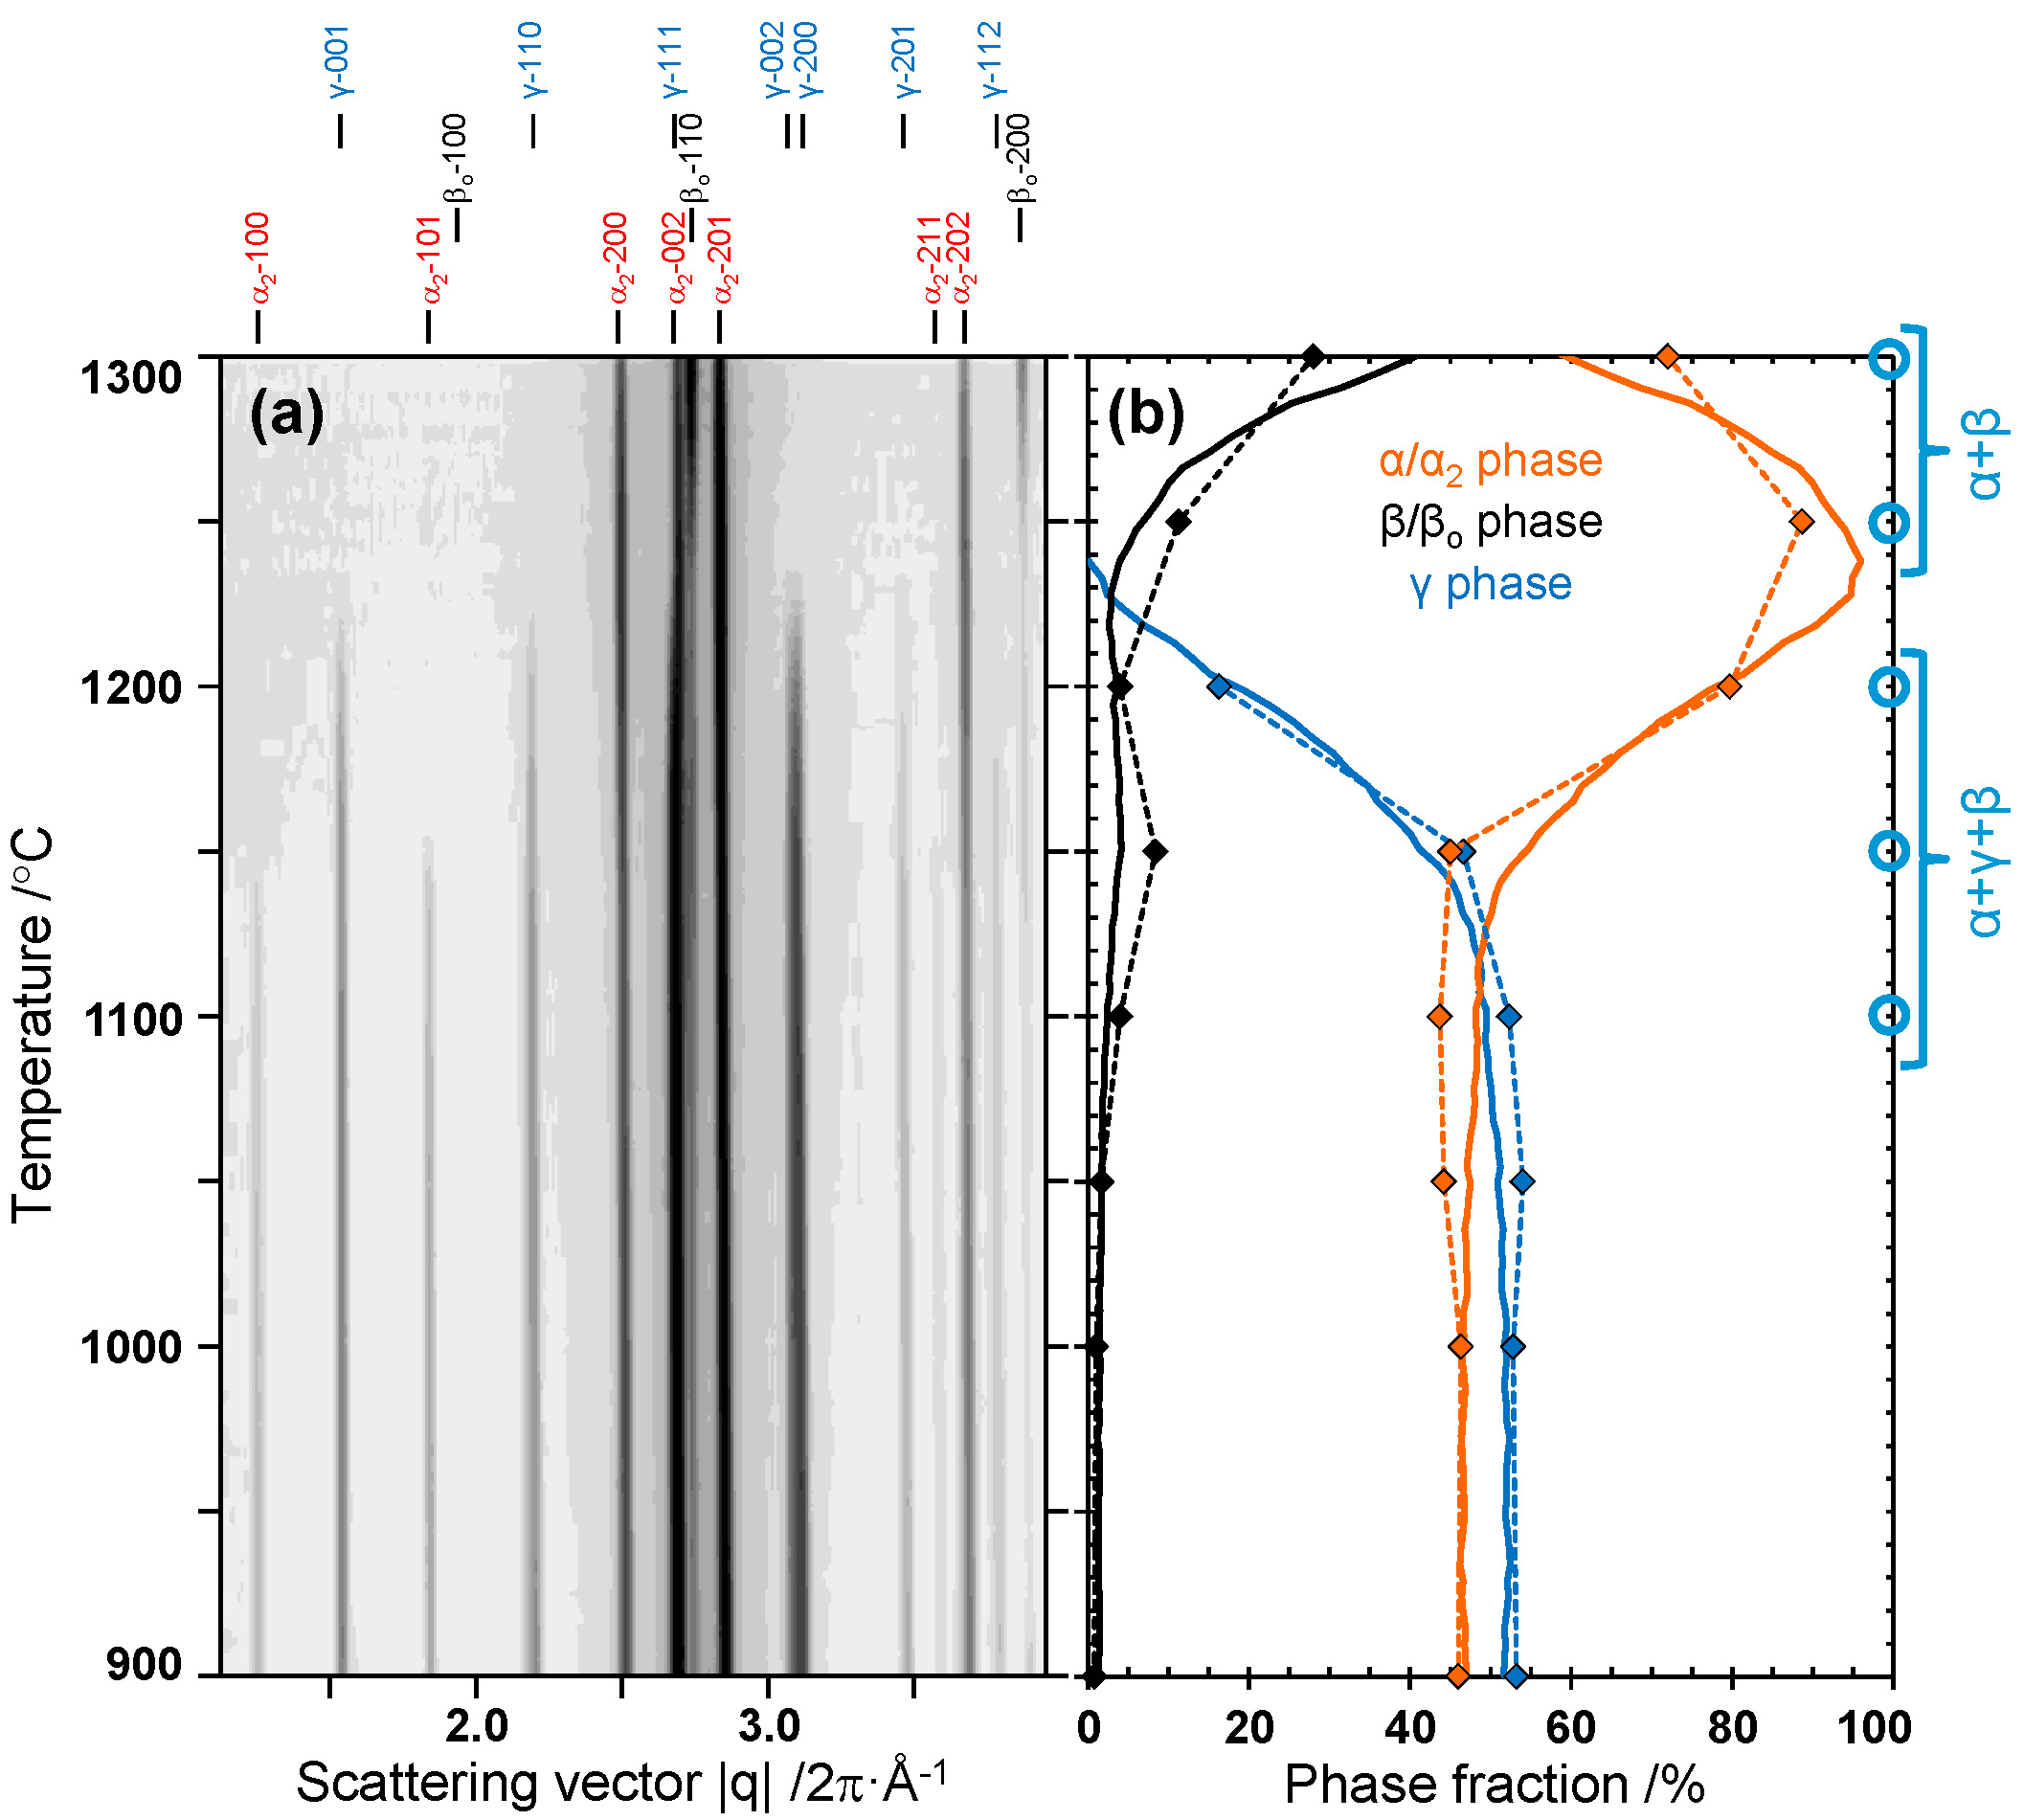
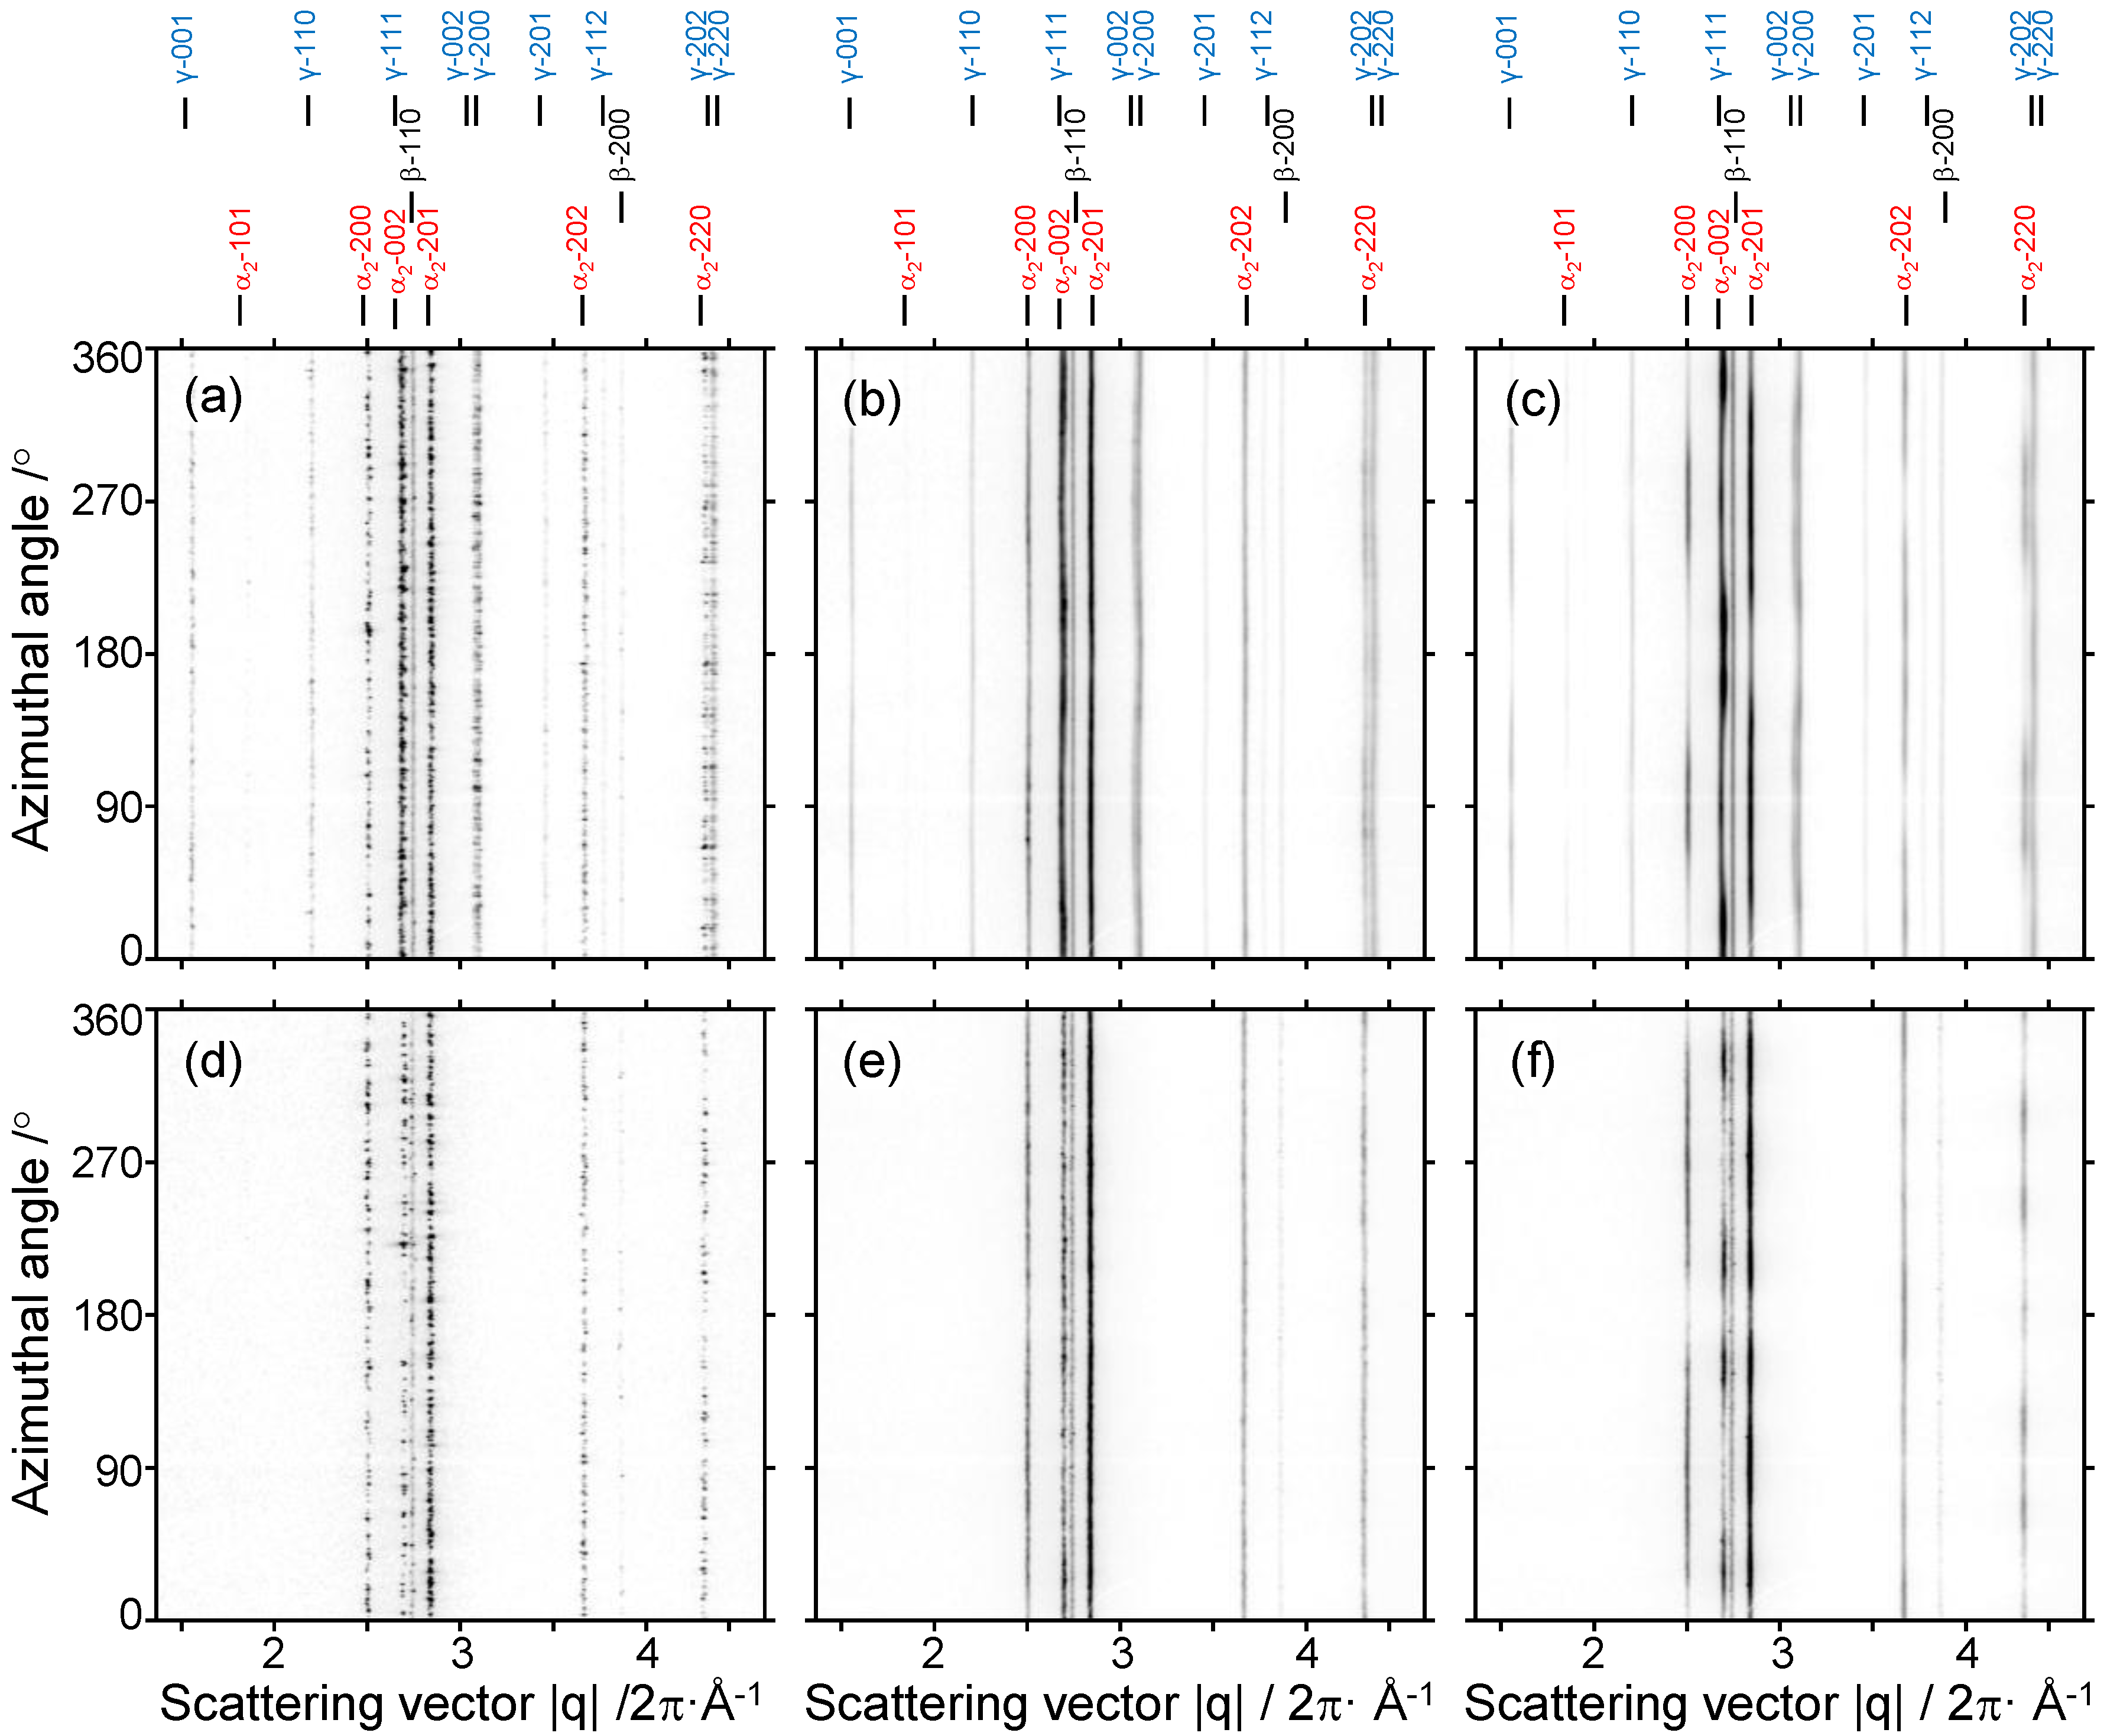
3.1. Development of Phase Constitution with Temperature for Ti-42Al-8.5Nb

The phase diagram of Nb rich γ-TiAl based alloys is rather complex and still under research [25,26] even though it is composed of only three elements. At temperatures up to service temperature (about 700 °C to 800 °C) γ-TiAl alloys mainly consist of the tetragonal γ-TiAl phase (L10 structure, P4/mmm) and the hexagonal α2-Ti3Al phase (D019 structure, P63/mmc). The ordered α2 phase transforms to the disordered hcp α-Ti(Al) phase (A3 structure, P63/mmc) at higher temperatures. Nb additionally stabilizes the cubic disordered bcc β-Ti(Al,Nb) phase (A2 structure, Im-3m) at high temperatures which can transform during cooling first to the ordered βo-TiAl(Nb) phase (B2 structure, Pm-3m) and then at lower temperatures to the ωo-Ti4Al3Nb phase (B82 structure, P63/mmc). Recent studies have shown that an orthorhombic phase (Cmcm) can also appear at temperatures around 600 °C [27]. More details regarding the structure and formation conditions of this orthorhombic phase will be published elsewhere.
Figure 2a shows the evolution of the diffraction patterns during heating between 900 °C and 1300 °C. The specific reflections of various phases are indicated above. From the results, the phase fractions over the temperature range were calculated by Rietveld analysis, see Figure 2b. The starting material, i.e., the HIPed powder compact, consists of 51 vol. % γ-TiAl, 48 vol. % α2-Ti3Al and 1 vol. % ωo-Ti4Al3Nb at room temperature. During heating, the ωo transforms to βo at 920 °C. The loss of the 100-α2 and 101-α2 superlattice reflections at 1155 °C and the 100-βo superlattice reflection at 1170 °C indicate the α2→α and βo→β order-disorder transformations. Above 1150 °C, the amount of γ significantly decreases until the γ solvus temperature Tγsol is reached at 1236 °C, indicating the end of the γ→α transformation. The transformation temperatures determined from this measurement are slightly shifted to higher values, compared to equilibrium conditions, due to the continuous heating. In order to converge to the equilibrium conditions, the results were compared to a stepwise heating experiment holding the sample at each temperature for at least 30 min. The phase fractions calculated at the end of each heating step are plotted in Figure 2b. In the temperature range between 1000 °C and 1200 °C the amount of γ and β/βo increases at the expense of α/α2, while holding at temperature compared to continuous heating. Because the high Nb content impedes diffusion, the formation of phase equilibrium needs some time. It is interesting to note that under these conditions the β phase fraction has a local peak at about 1150 °C. The differences between both measurements at temperatures above 1200 °C might be caused by intensive grain growth, while holding at temperature.
Figure 2. Phase constitution as a function of temperature for Ti-42Al-8.5Nb. (a) Evolution of the diffraction patterns during heating; (b) Phase fractions determined by Rietveld analysis. Continuous lines: heating rate of 10 °C·min−1. Dashed lines: stepwise heating.
Metals 05 02252 g002
From the results we have chosen five working temperatures representing different phase fields and different phase contents for the hot forming experiments. Three experiments were performed in the (γ + α/α2 + β/βo) 3-phase field, one of them at 1150 °C, i.e., at the relative β peak and another at 1200 °C, where the γ content is very low. Two additional temperatures were chosen in the (α + β) 2-phase field, representing a low or a high β content.

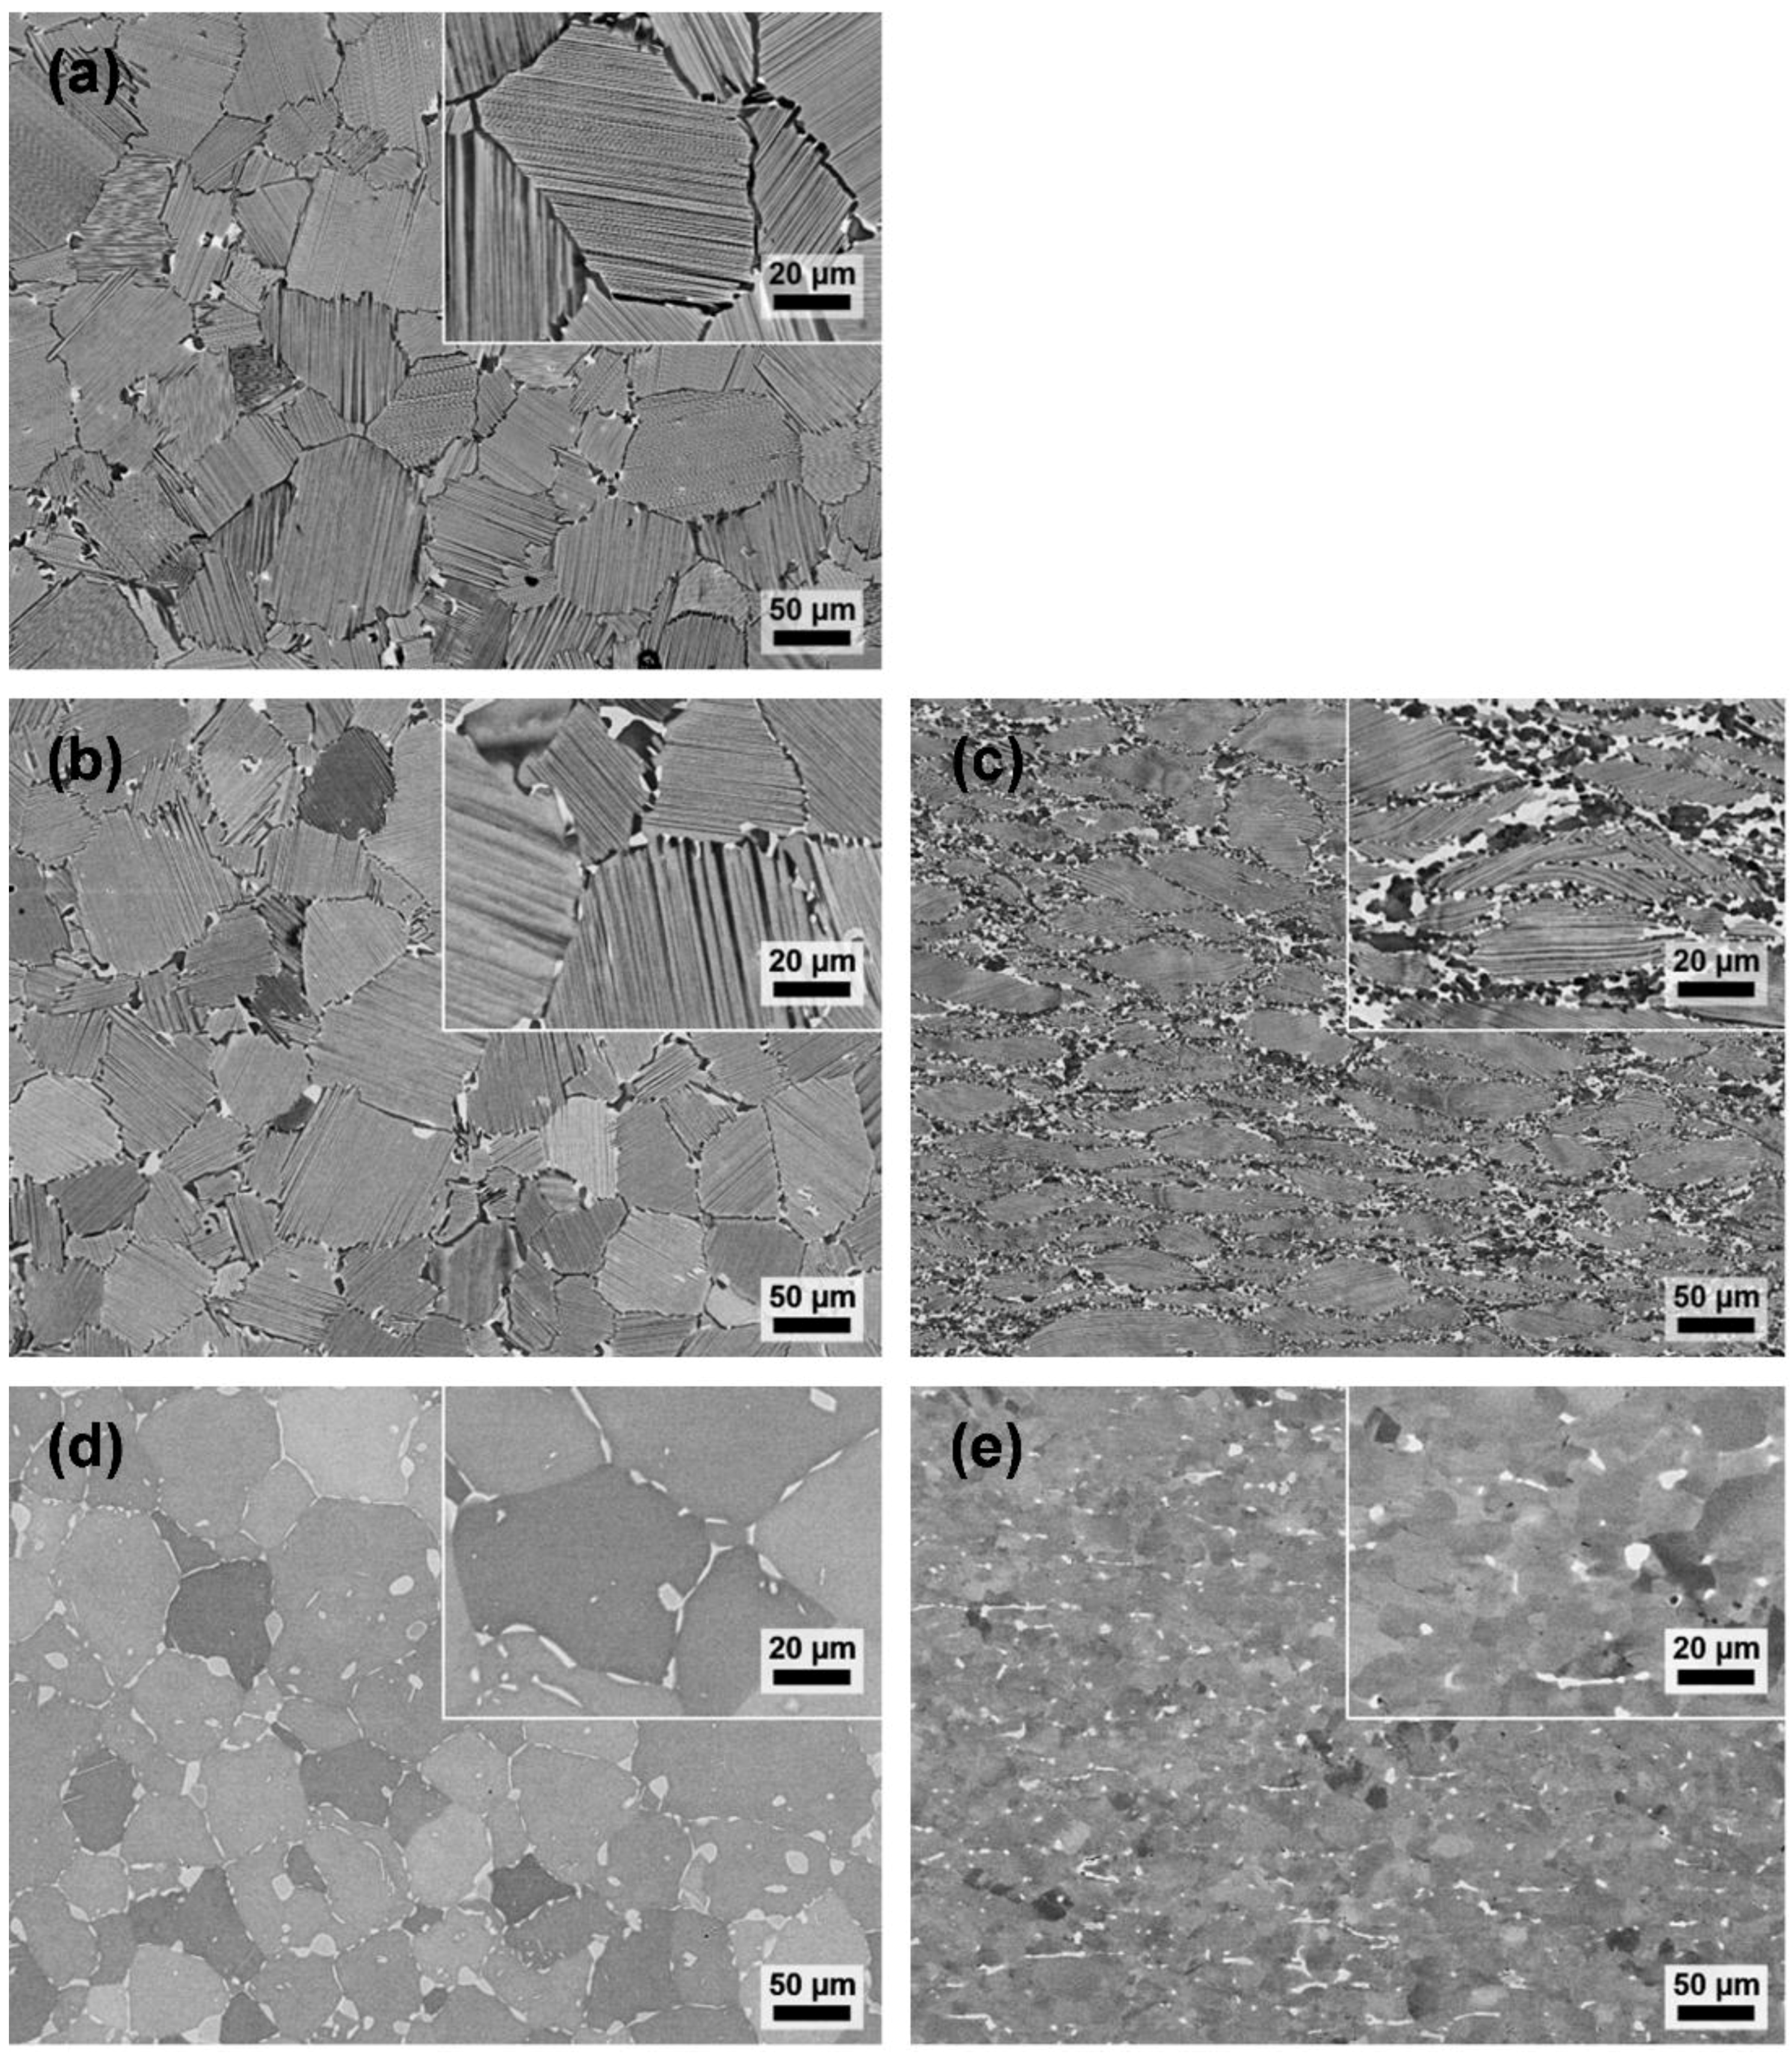
3.2. Microstructures before and after Deformation

The SEM images in Figure 3 show characteristic microstructures of the Ti-42Al-8.5Nb alloy before and after deformation. Different phases can be distinguished in the micrographs due to their different brightness in the BSE mode. The γ phase is imaged as dark grey whereas the α/α2 phase appears light grey and the β phase and its derivates are almost white.
Figure 3. SEM micrographs taken in the BSE mode. (a) HIPed starting material at room temperature; (be) Microstructures of specimens from two hot forming experiments heated up to process temperatures of (b,c) 1150 °C and (d,e) 1250 °C and quenched (b,d) before and (c,e) after deformation. The γ phase appears dark grey, α2/α as light grey, and βo/β almost white. The load direction is vertical ↓.
Metals 05 02252 g003
The starting material (Figure 3a) consists of large (α2 + γ) lamellar colonies with a diameter of 50–100 μm. Additionally, a few small globular γ and β grains can be observed at triple points and colony boundaries. This relatively coarse grained microstructure can be attributed to HIPing at 1250 °C which is almost in a single-phase α phase field and the subsequent slow furnace cooling.
Figure 3b–e show microstructures of two representative deformation experiments, one performed in the (γ + α2 + βo) three phase field at 1150 °C (Figure 3b,c) and the second performed above the γ solvus temperature Tγsol in the (α + β) two phase field at 1250 °C (Figure 3d,e). To get an impression of the microstructure immediately before deformation two samples were heated up, held at temperature, and then quenched (Figure 3b,d). At 1150 °C (Figure 3b), the microstructure still consists of lamellar colonies, however, the lamellae have coarsened and the amount of α has increased. At 1250 °C (Figure 3d), the microstructure consists of large globular α grains, i.e., the former (α2 + γ) lamellar colonies, small globular β grains both within and between the α grains, and fine β precipitates that almost completely decorate the α grain boundaries.
At both temperatures the samples were deformed with a compression rate of 5 × 10⁻³·s−1 up to a total reduction of about 40% and subsequently quenched in order to retain the deformed microstructure (Figure 3c,e). After deformation at 1150 °C (Figure 3c) the lamellar microstructure has started to recrystallize. The lamellar colonies are elongated perpendicular to the compression direction and exhibit a high aspect ratio. They are surrounded by fine grained, dynamically recrystallized areas. It is clearly visible that DRX starts at kinks within lamellar colonies and at colony boundaries, both places with an increased dislocation density. After deformation at 1250 °C (Figure 3e) the microstructure is completely dynamically recrystallized and significantly refined. No aspect ratio is apparent, bended grain boundaries indicate a bulging mechanism.

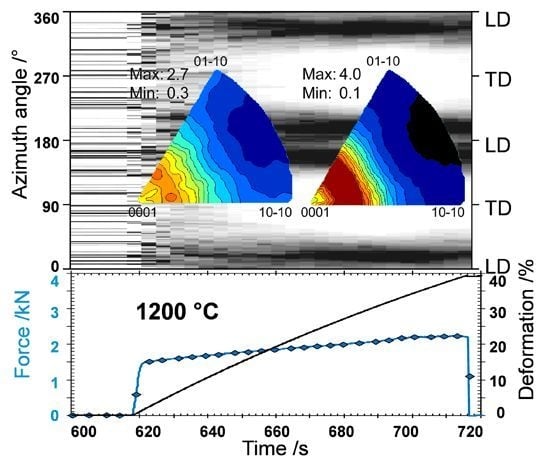
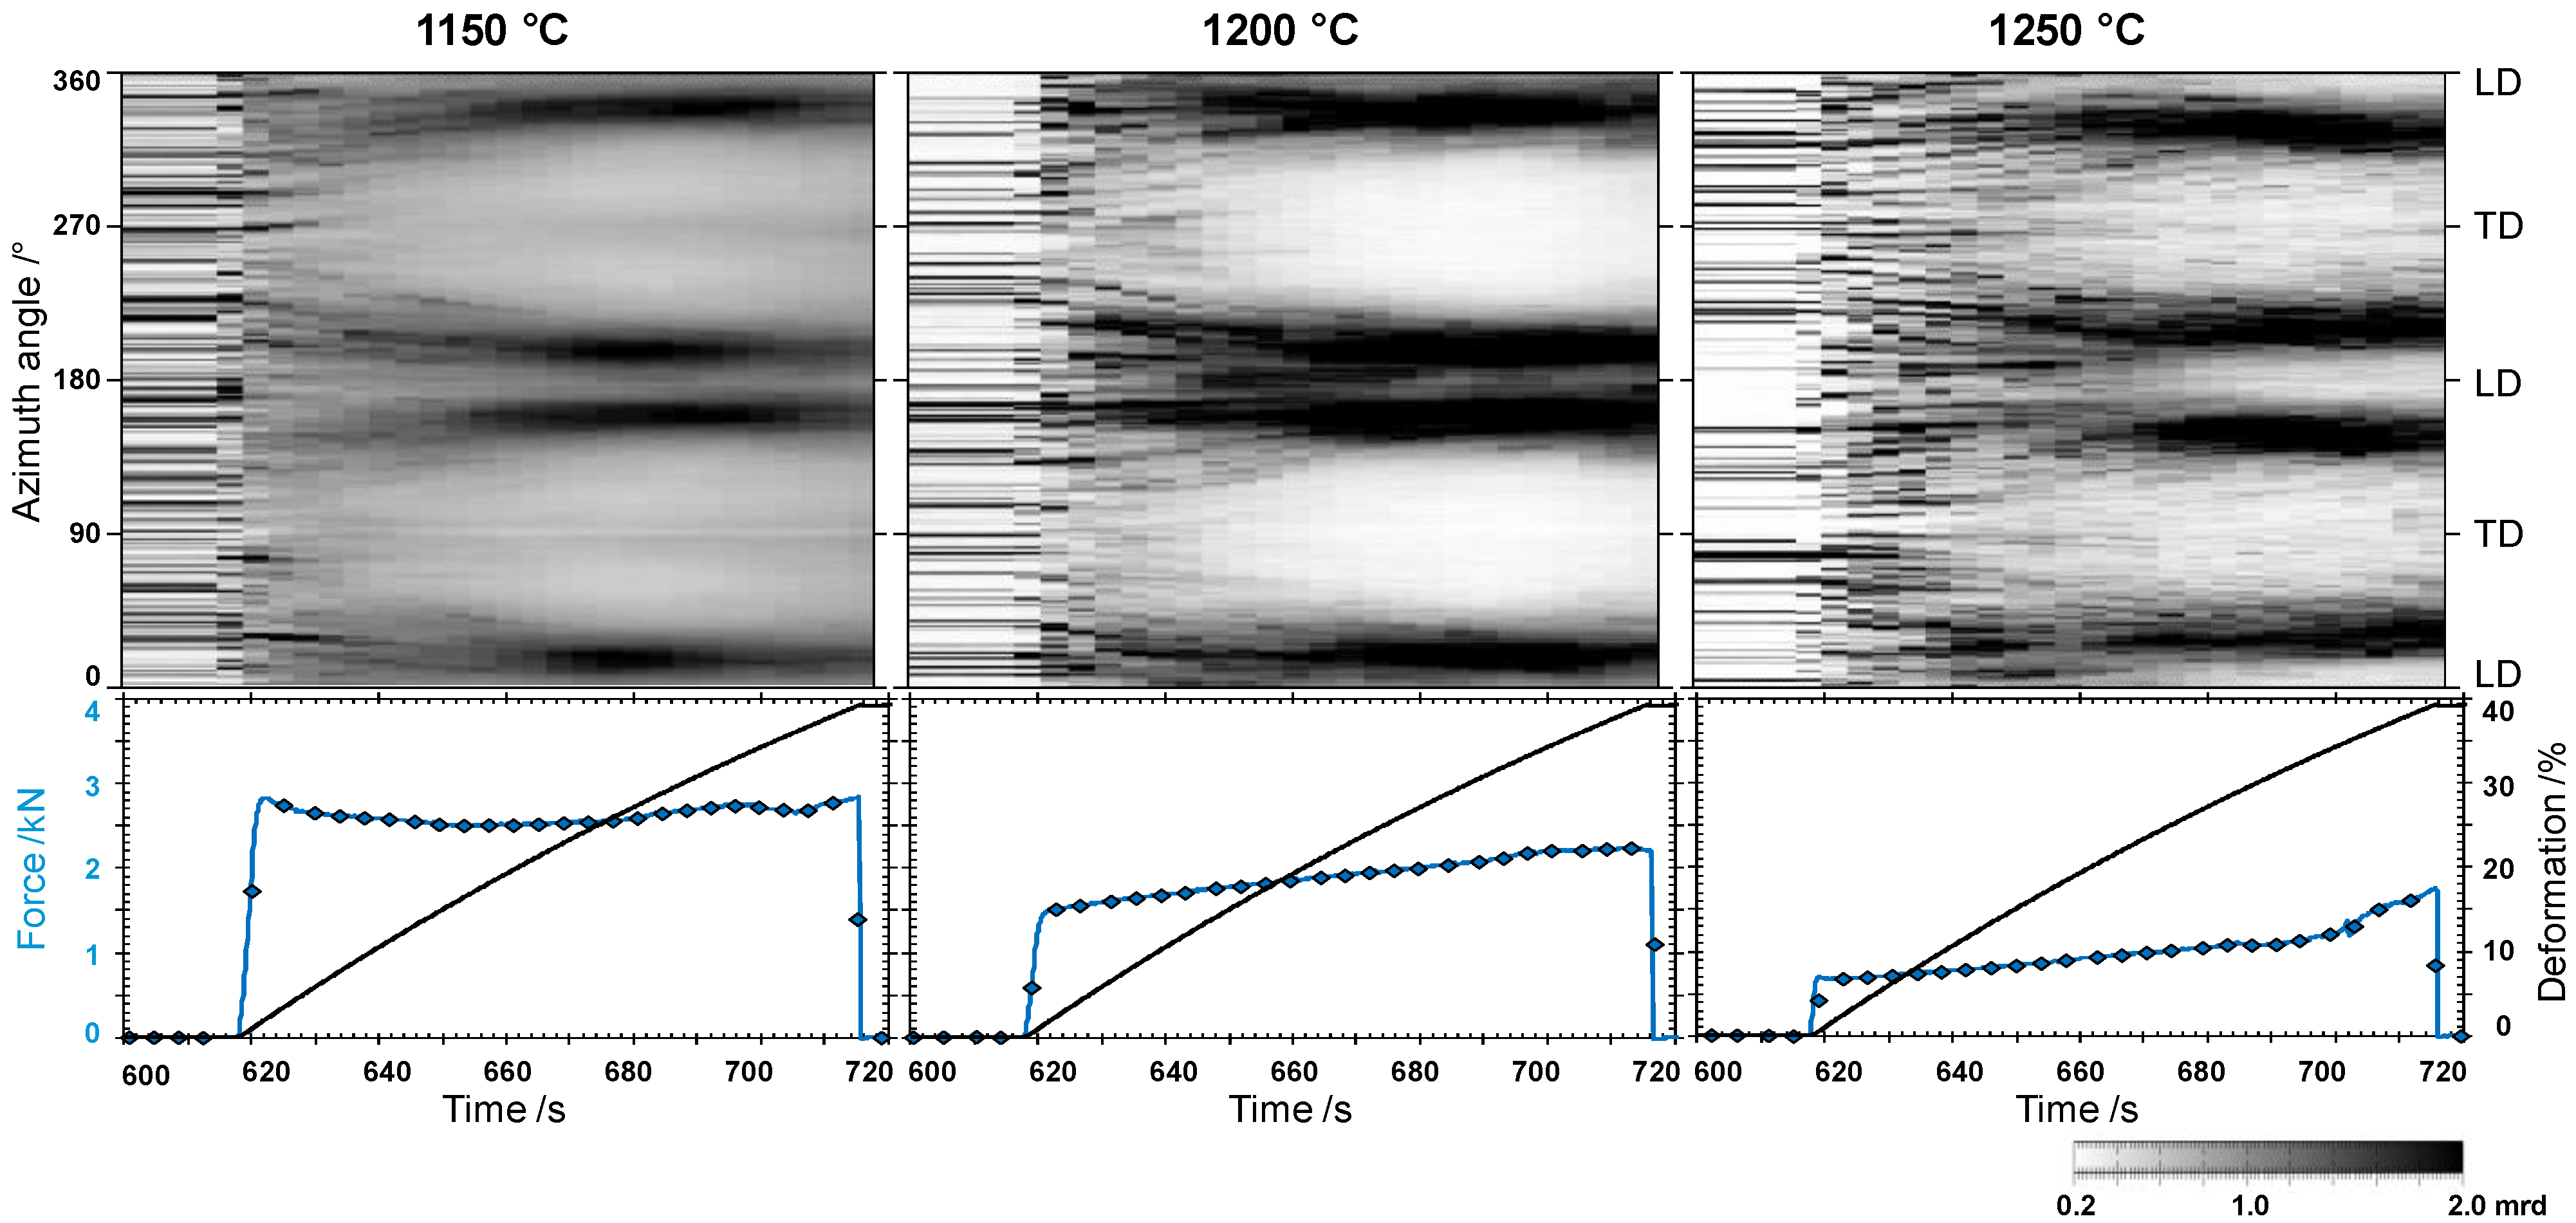
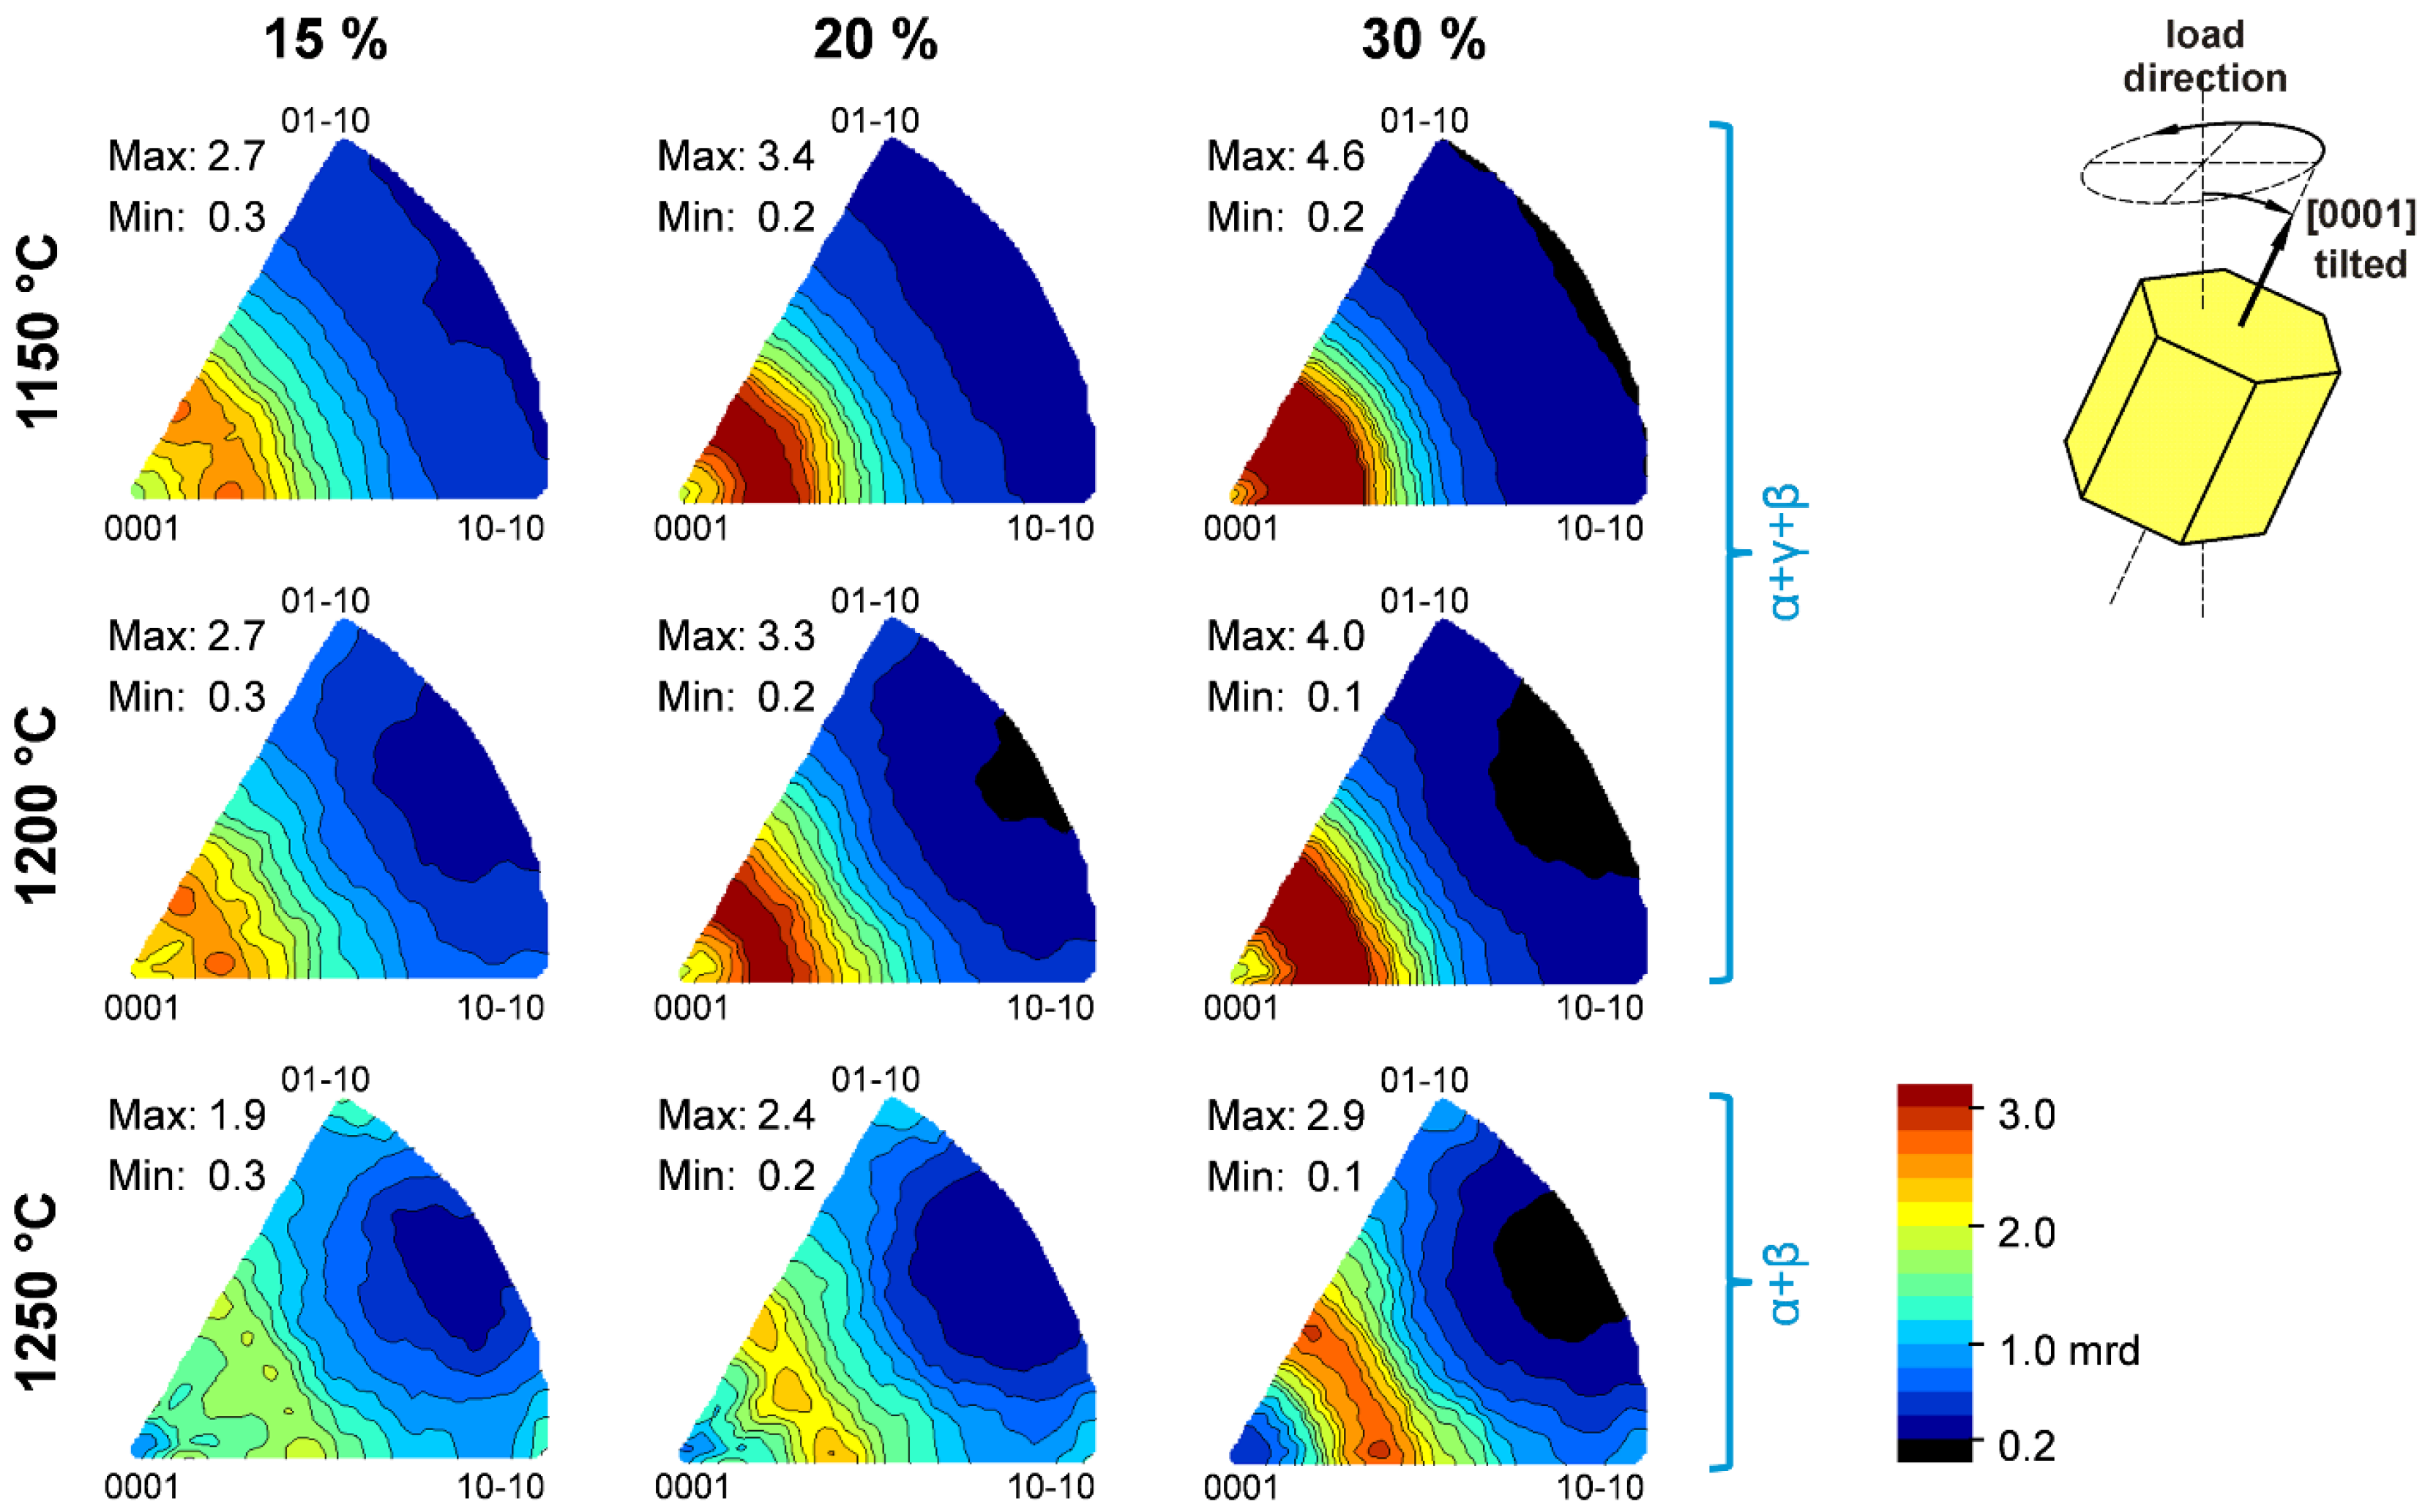
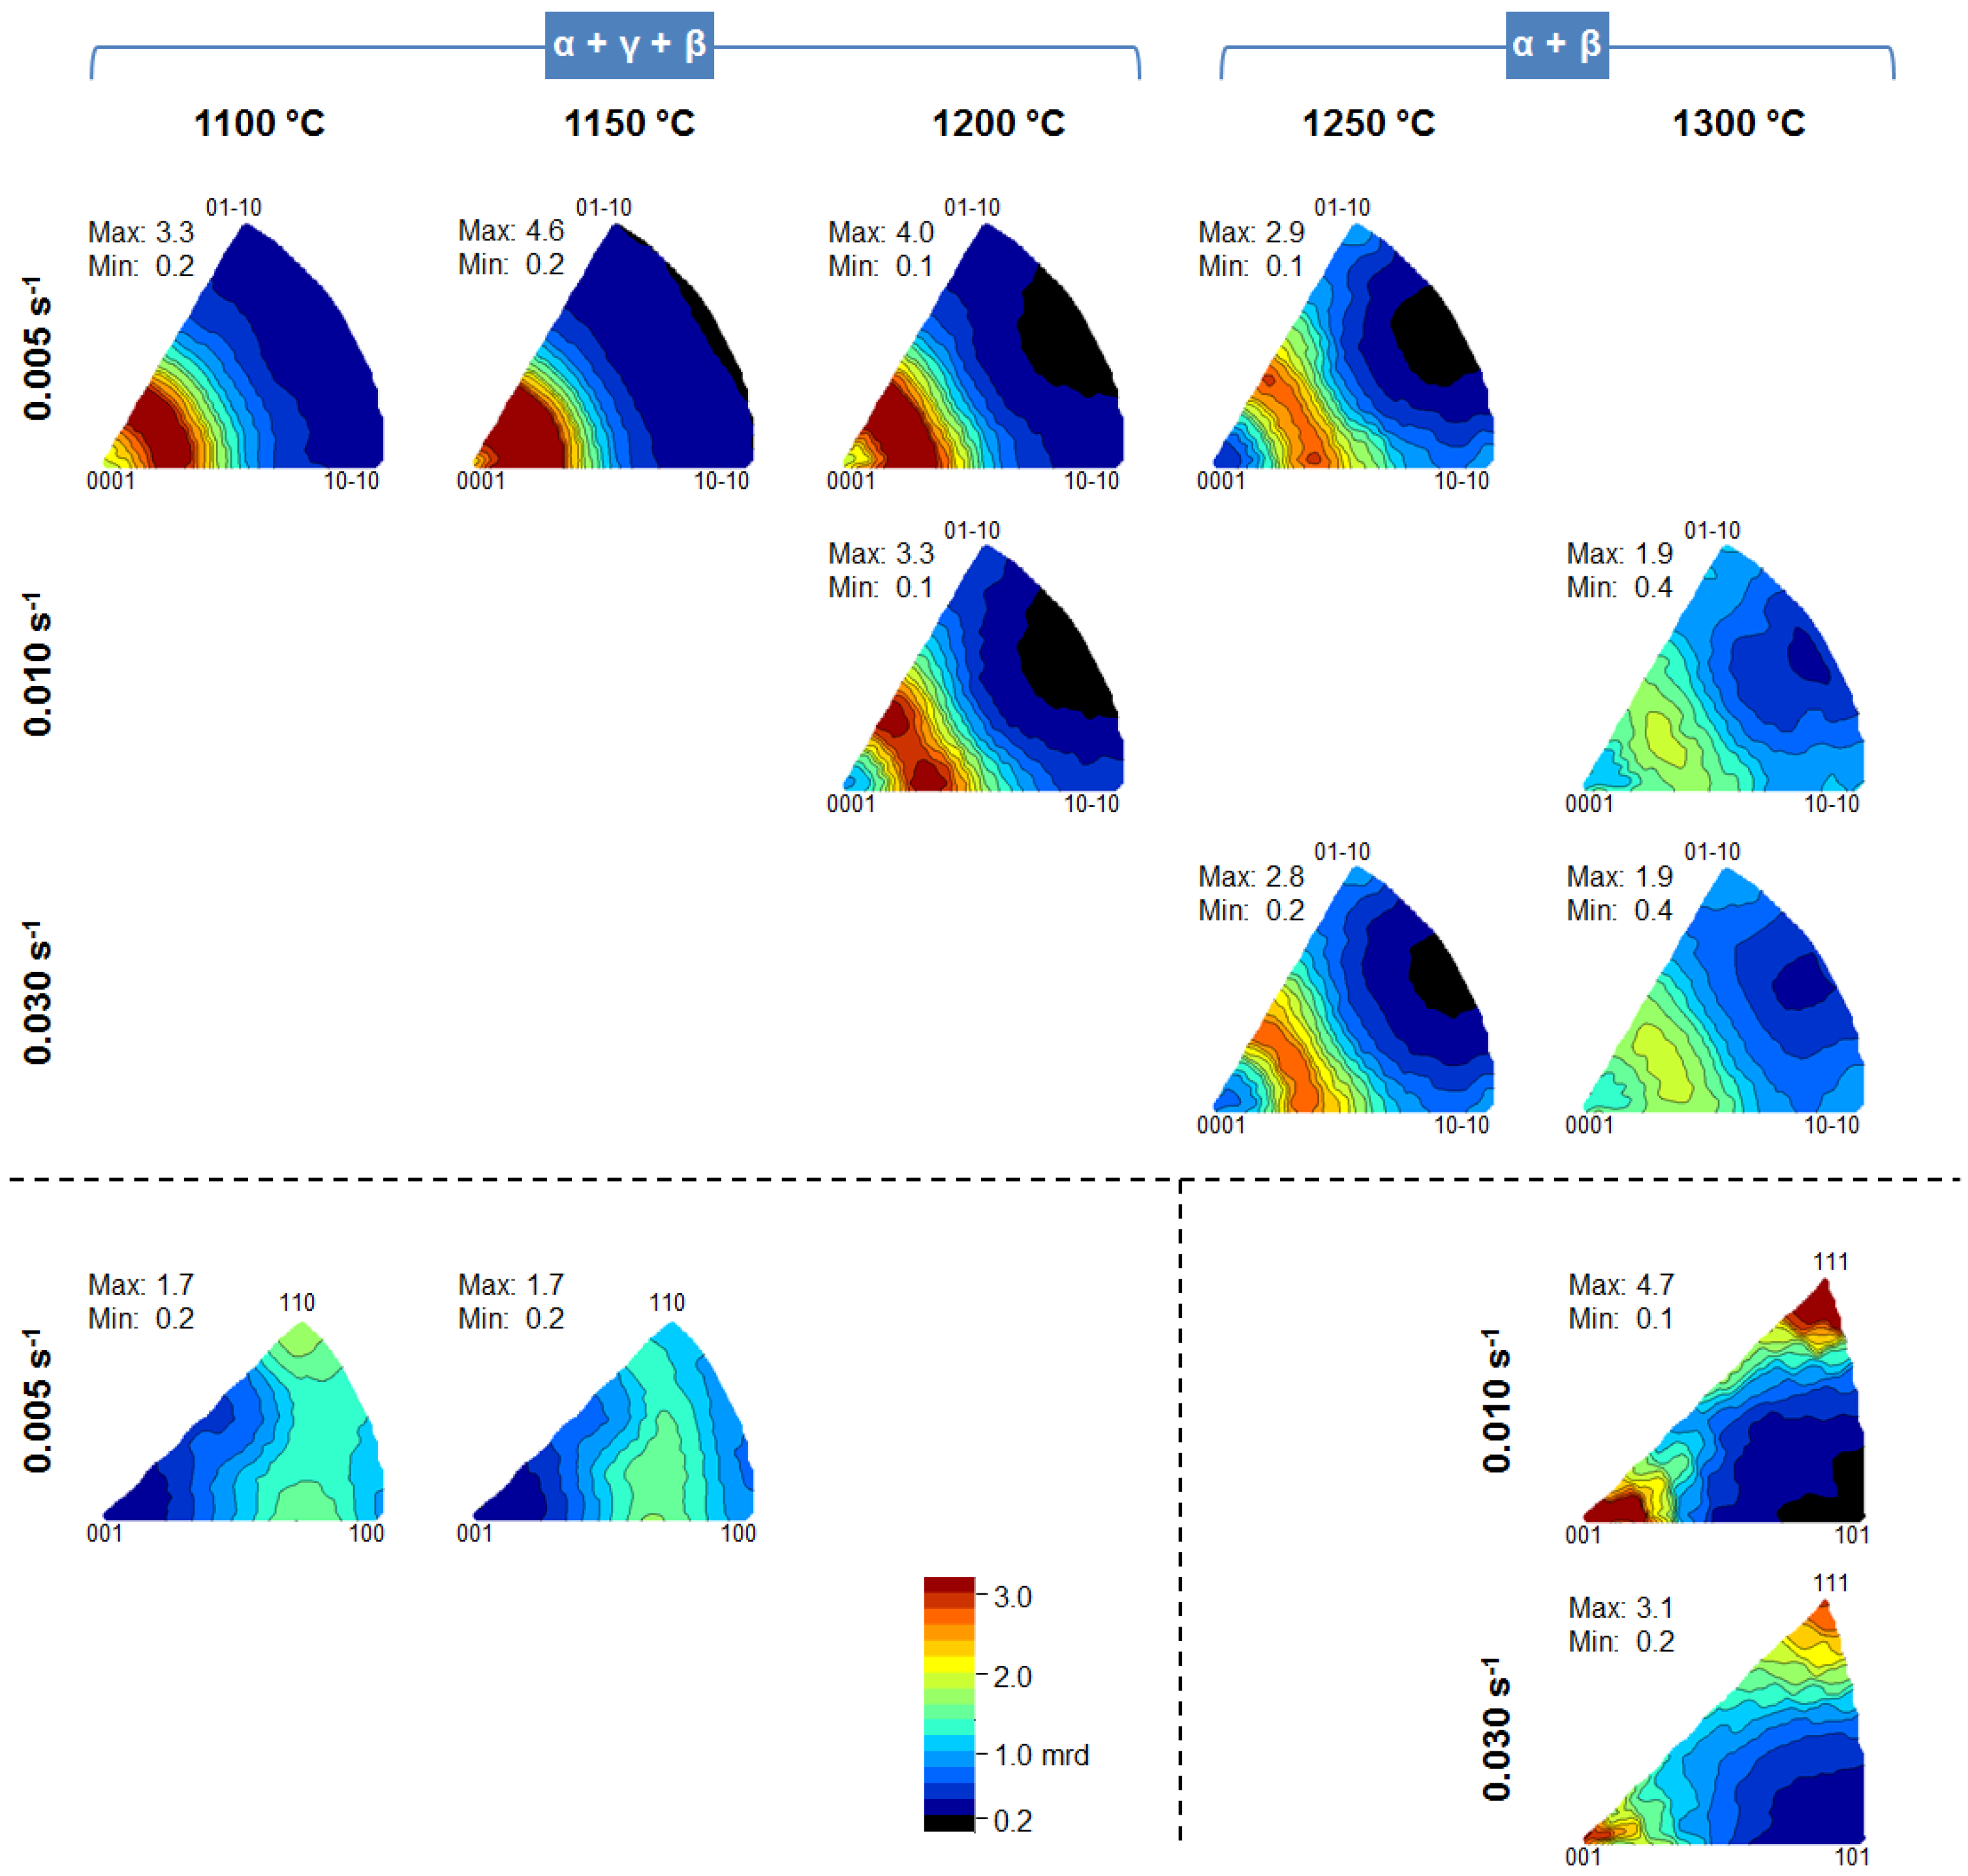
3.3. Texture Formation

During the hot forming experiments the diffraction rings were continuously recorded. This has opened up the possibility to observe the formation and evolution of the crystallographic texture in the TiAl specimens both in situ and time resolved. Figure 4 shows unrolled Debye Scherrer rings at different stages during the deformation experiments at 1150 °C and 1250 °C. In order to ease analysis of the diffraction rings with respect to the different phases, the rings were unrolled to lines from 0° to 360° and the respective phase reflections identified, as indicated in Figure 4. The state immediately before deformation is represented by Figure 4a,d. The rings are spotty indicating the relatively coarse grained microstructure as shown in Figure 3b,d. The spots are equally distributed along the rings and no preferred orientation is visible. After 10% deformation (Figure 4b,e) the spots have azimuthally broadened (i.e., along the ring) and thus the rings have become continuous. This can be attributed to the increase of crystal mosaicity and generation of small angle grain boundaries at the beginning of plastic deformation [19,20]. Additionally the grains also start to rotate due to dislocation motion. Depending on their specific slip systems the grains rotate into preferred orientations [28] which depend on the applied stress direction during deformation. This results in a shift of intensity along the rings. After 30% deformation, see Figure 4c,f, the intensity accumulation at preferred orientations is clearly visible which indicates the formation of the deformation texture.
Figure 4. Unrolled diffraction rings taken during two hot forming experiments at (ac) 1150 °C; (df) 1250 °C; (a,d) before deformation; (b,e) after 10%; and (c,f) after 30% deformation. The reflections of the various phases are indicated at the top of the figure.
Metals 05 02252 g004
A simple and effective way to illustrate the crystallographic evolution during deformation is through the use of azimuth angle vs. time plots (AT plots) as introduced by Liss et al. [20,29]. Such diagrams are constructed from a specific unrolled ring that is repeatedly plotted from the sequence of diffraction ring images that are collected over increasing time. The time resolved intensity changes along this ring represent the evolution of grain size and crystallographic texture during deformation. Figure 5 shows AT plots for the 002 reflection of the hexagonal α phase during hot forming experiments at 1150 °C, 1200 °C, and 1250 °C. The simultaneously measured parameters of force and deformation are displayed below the diagrams. In order to allow a quantitative comparison of different deformation conditions, the intensities have been normalized to multiples of a random distribution (mrd). As mentioned above, the sharp spots before deformation can be attributed to relatively coarse grains or lamellar colonies and indicate almost perfect crystals. They are equally azimuthally distributed and the intensity distribution does not significantly change during elastic deformation. As plastic flow starts, the spots become more and more diffuse indicating an increasing dislocation density, number of crystal defects, and tilting between crystallite blocks. Obviously, many individual spots move continuously to preferred orientations due to rotation of the crystal lattice of these grains. After about 15%–20% deformation, almost symmetrical intensity maxima are formed at certain angular distances from the load direction indicating the formation of the deformation texture.
Figure 5. Azimuth angle vs. time diagrams for the α-002 reflection during hot compression at 1150 °C, 1200 °C, and 1250 °C using a compression rate of 5 × 10⁻³·s−1. The azimuthal orientation distribution is coded using a greyscale. The process parameters of force and deformation are indicated below the diagrams. LD: Load direction. TD: Transverse direction.
Metals 05 02252 g005
Besides the relatively similar intensity evolution, some specific differences can be observed between the different deformation temperatures. In the 002-α AT plot for deformation at 1200 °C the intensity is concentrated at 20° from the load direction, and regions between these preferred orientations are almost intensity free. During deformation at 1250 °C, new spots continuously occur in between preferred orientations indicating the formation of dynamically recrystallized grains which then start to rotate again towards the preferred orientations. Interestingly, the dynamically recrystallized nuclei apparently have a different orientation to the highly deformed grains, while the texture of this specimen is determined by deformation. Additionally, the angle between the load direction and the preferred orientation increases to about 30°. This indicates a variation of the deformation mechanism most probably due to increased DRX and/or due to the change from a 3-phase to a 2-phase field. During deformation at 1150 °C a weak, additional preferred orientation arises in the 002-α AT plot at the transverse direction (TD). Unfortunately, the peaks of 002-α and 111-γ overlap. Thus it is not possible to separate the intensity contribution of each phase on the ring. Due to the increased amount of γ at lower temperatures, like 1150 °C, this AT plot shows a combination of α and γ during deformation texture evolution.
AT plots can reveal some unique, direct information which cannot be gathered by other methods, for example, different stages of texture formation during deformation or different predominant deformation mechanisms [29]. AT plots are suitable for single-phase materials, like Mg alloys [30], and multiphase alloys, as long as no overlapping reflections are used, and reflections with a low multiplicity, like 002-α. However, AT plots reach their limit when describing real textures. For real texture analysis one has to calculate the ODF and discuss the texture by means of inverse or recalculated pole figures. In our experiments this was possible because we performed uniaxial deformation and the load direction was parallel to the detector plane (Figure 1c). Under these circumstances the intensity distribution around the rings after texture formation is axially symmetric and thus the complete texture information is obtained within one single detector image, without any need for additional sample rotations.
Figure 6 shows the evolution of the α phase deformation texture during the above discussed experiments, using inverse pole figures in load direction. They show the frequency distribution of crystallographic directions in the load direction. The inverse pole figures after deformation of 15%, 20%, and 30% are presented for each forming temperature. Obviously, the intensity and sharpness of the deformation texture increases during each experiment. The inverse pole figures show that only directions within a certain distance to the c axis [0001] are aligned in load direction. This is the typical appearance of the tilted basal fiber texture as sketched on the right side in Figure 6. It is a typical deformation texture that is formed during compression of hexagonal phases like the α phase [31].
Figure 6. Evolution of the α phase deformation texture during hot compression at different forming temperatures represented as inverse pole figures in load direction after 15%, 20%, and 30% deformation. The sketch on the right illustrates the tilted basal fiber texture which is typically formed.
Metals 05 02252 g006
Figure 7 illustrates inverse pole figures, obtained after 30% deformation at different temperatures, as well as with different deformation rates. The upper part shows the α phase which is the dominant phase during deformation within the temperature range employed. The lower part of the figure shows inverse pole figures for the γ phase for tests performed at 1100 °C and 1150 °C and of the β phase at 1300 °C. The inverse pole figures for γ and β could be calculated due to their high volume fraction at these temperatures. The deformation texture of the tetragonal γ phase consists of weak <110> and <302> fibers. These are typical compression texture components of γ which have already been described in many previous articles [8,13]. The cubic β phase forms significant <001> and <111> fibers which are typical compression texture components of bcc metals. A significant difference in the α deformation texture can be observed between experiments performed in the 3-phase and in the 2-phase fields. With the higher temperatures in the 2-phase field, the texture becomes weaker and more diffuse and the tilt angle between the load direction and the intensity maximum increases. This can be attributed to the larger amount of ductile β phase which has a higher number of slip systems than the hexagonal α phase. Thus, the β phase takes over an increasing part of plastic deformation. This might also explain the strong β deformation texture formed during the experiments at 1300 °C.
Figure 7. Inverse pole figures in load direction after 30% deformation showing the deformation textures formed during hot compression within different phase fields. Upper figures: the hexagonal α phase. Lower figures: the tetragonal γ phase and the cubic β phase, respectively.
Metals 05 02252 g007
From a technical point of view the texture of hot formed TiAl components should be as weak as possible. Thus, based on these results it is recommended that hot forming of novel low-Al, high-Nb γ-TiAl based alloys should be performed at temperatures just above the γ solvus temperature. In this temperature region the α deformation texture starts to weaken and the β phase fraction is small enough so that it does not contribute significantly to the deformation texture.

4. Summary

In situ high-energy XRD experiments have been performed on a Nb rich γ-TiAl based alloy with a nominal composition of Ti-42Al-8.5Nb during heating and hot compression. The experiments facilitate a direct observation of the high-temperature state that is not masked by post process alterations.
The phase constitution was directly recorded using HEXRD during heating, and different phase fields were identified for the hot forming experiments.
Formation of the deformation texture at elevated temperatures could be directly observed during the experiments. To our knowledge this study is one of very few in situ HEXRD texture investigations that have been published. The basic deformation texture is formed within the first 15%–20% of deformation. The deformation texture of the main component, the α phase, is significantly weaker in the high-temperature 2-phase field compared to the low temperature 3-phase field. This can be attributed to the higher amount of ductile bcc β phase as well as to increased DRX. It has been observed that dynamically recrystallized nuclei were formed with new orientations, which were rotated during further deformation towards orientations of the deformation texture.
This study demonstrates that in situ synchrotron radiation experiments can be a powerful tool in developing suitable process parameters especially for hot-forming of multiphase alloys, since it allows a simultaneous analysis of the constitution as well as microstructural and textural changes.

Acknowledgments

The authors thank Frank-Peter Schimansky and Dirk Matthiessen for producing the alloy powder, René Kirchhof for technical assistance at the beamline HEMS at DESY, and Jonathan Paul for fruitful discussions.

Author Contributions

Andreas Stark, Michael Oehring, Andreas Schreyer and Florian Pyczak designed the experiments. The in situ HEXRD experiments were performed by Andreas Stark, Michael Oehring, Marcus Rackel and Aristide Tchouaha Tankoua and they were supported by Lars Lottermoser, who programmed the special beamline makros, and Norbert Schell, who is responsible for the HEMS beamline. Aristide Tchouaha Tankoua prepared the samples and performed the SEM measurements together with Marcus Rackel. Marcus Rackel analyzed the XRD data and Andreas Stark performed the texture analysis. The manuscript was written by Andreas Stark and intensively discussed with Michael Oehring and Florian Pyczak.

Conflicts of Interest

The authors declare no conflict of interest.

References

  1. Appel, F.; Paul, J.D.H.; Oehring, M. Gamma Titanium Aluminide Alloys: Science and Technology; Wiley-VCH: Weinheim, Germany, 2011. [Google Scholar]
  2. Bewlay, B.P.; Weimer, M.; Kelly, T.; Suzuki, A.; Subramanian, P.R. The Science, Technology, and Implementation of TiAl Alloys in Commercial Aircraft Engines. MRS Proc. 2013, 1516, 49–58. [Google Scholar] [CrossRef]
  3. Bolz, S.; Oehring, M.; Lindemann, J.; Pyczak, F.; Paul, J.; Stark, A.; Lippmann, T.; Schrüfer, S.; Roth-Fagaraseanu, D.; Schreyer, A.; et al. Microstructure and mechanical properties of a forged β-solidifying γ TiAl alloy in different heat treatment conditions. Intermetallics 2015, 58, 71–83. [Google Scholar] [CrossRef]
  4. Schwaighofer, E.; Clemens, H.; Lindemann, J.; Stark, A.; Mayer, S. Hot-working behavior of an advanced intermetallic multi-phase γ-TiAl based alloy. Adv. Mater. Sci. Eng. A 2014, 614, 297–310. [Google Scholar] [CrossRef]
  5. Cheng, L.; Xue, X.; Tang, B.; Kou, H.; Li, J. Flow characteristics and constitutive modeling for elevated temperature deformation of a high Nb containing TiAl alloy. Intermetallics 2014, 49, 23–28. [Google Scholar] [CrossRef]
  6. Liang, X.-P.; Liu, Y.; Li, H.-Z.; Zhou, C.-X.; Xu, G.-F. Constitutive relationship for high temperature deformation of powder metallurgy Ti-47Al-2Cr-2Nb-0.2W alloy. Mater. Des. 2012, 37, 40–47. [Google Scholar] [CrossRef]
  7. Clemens, H.; Mayer, S. Design, Processing, Microstructure, Properties, and Applications of Advanced Intermetallic TiAl Alloys. Adv. Eng. Mater. 2013, 15, 191–215. [Google Scholar] [CrossRef]
  8. Stark, A.; Bartels, A.; Clemens, H.; Kremmer, S.; Schimansky, F.-P.; Gerling, R. Microstructure and Texture Formation During Near Conventional Forging of an Intermetallic Ti-45Al-5Nb Alloy. Adv. Eng. Mater. 2009, 11, 976–981. [Google Scholar]
  9. Stark, A.; Schimansky, F.-P.; Clemens, H. Texture Formation during Hot-Deformation of High-Nb Containing γ-TiAl Based Alloys. Solid State Phenom. 2010, 160, 301–306. [Google Scholar] [CrossRef]
  10. Fukutomi, H.; Hartig, C.; Mecking, H. Change of Microstructure in a TiAl Intermetallic Compound during High Temperature Deformation. Z. Met. 1990, 81, 272–277. [Google Scholar]
  11. Hartig, C.; Fukotomi, H.; Mecking, H.; Aoki, K. Texture and Microstructure of Ti-49 at. % Al after Dynamic Recrystallization and Annealing. ISIJ Int. 1993, 33, 313–320. [Google Scholar] [CrossRef]
  12. Mecking, H.; Hartig, C.; Kocks, U.F. Deformation modes in γ-TiAl as derived from the single crystal yield surface. Acta Mater. 1996, 44, 1309–1321. [Google Scholar] [CrossRef]
  13. Bartels, A.; Schillinger, W.; Grassl, G.; Clemens, H. Texture formation in γ-TiAl sheets. In Gamma Titanium Aluminides 2003; Kim, Y.-W., Clemens, H., Rosenberger, A.H., Eds.; TMS: Warrendale, PA, USA, 2003; pp. 275–286. [Google Scholar]
  14. Schillinger, W.; Bartels, A.; Gerling, R.; Schimansky, F.-P.; Clemens, H. Texture evolution of the γ- and the α/α2-phase during hot rolling of γ-TiAl based alloys. Intermetallics 2006, 14, 336–347. [Google Scholar] [CrossRef]
  15. Stark, A.; Bartels, A.; Gerling, R.; Schimansky, F.-P.; Clemens, H. Microstructure and Texture Formation during Hot Rolling of Niobium-Rich Gamma TiAl Alloys with Different Carbon Contents. Adv. Eng. Mater. 2006, 8, 1101–1108. [Google Scholar] [CrossRef]
  16. Liss, K.-D.; Bartels, A.; Schreyer, A.; Clemens, H. High-Energy X-rays: A tool for Advanced Bulk Investigations in Materials Science and Physics. Textures Microstruct. 2003, 35, 219–252. [Google Scholar] [CrossRef]
  17. Staron, P.; Fischer, T.; Lippmann, T.; Stark, A.; Daneshpour, S.; Schnubel, D.; Uhlmann, E.; Gerstenberger, R.; Camin, B.; Reimers, W.; et al. In situ experiments with synchrotron high-energy X-rays. Adv. Eng. Mater. 2011, 13, 658–663. [Google Scholar] [CrossRef]
  18. Reimers, W.; Pycalla, A.R.; Schreyer, A.; Clemens, H. (Eds.) Neutrons and Synchrotron Radiation in Engineering Materials Science; Wiley-VCH: Weinheim, Germany, 2008.
  19. Liss, K.-D.; Bartels, A.; Clemens, H.; Bystrzanowski, S.; Stark, A.; Buslaps, T.; Schimansky, F.-P.; Gerling, R.; Scheu, C.; Schreyer, A. Recrystallization and phase transitions in a γ-TiAl-based alloy as observed by ex situ and in situ high-energy X-ray diffraction. Acta Mater. 2006, 54, 3721–3735. [Google Scholar] [CrossRef]
  20. Liss, K.-D.; Yan, K. Thermo-mechanical processing in a synchrotron beam. Mater. Sci. Eng. A 2010, 528, 11–27. [Google Scholar] [CrossRef]
  21. Gerling, R.; Clemens, H.; Schimansky, F.-P. Powder metallurgical processing of intermetallic Gamma Titanium Aluminides. Adv. Eng. Mater. 2004, 6, 23–38. [Google Scholar] [CrossRef]
  22. Schell, N.; King, A.; Beckmann, F.; Fischer, T.; Müller, M.; Schreyer, A. The High Energy Materials Science Beamline (HEMS) at PETRA III. Mater. Sci. Forum 2014, 772, 57–61. [Google Scholar] [CrossRef]
  23. Hammersley, A.P.; Svensson, S.O.; Hanfland, M.; Fitch, A.N.; Häusermann, D. Two-dimensional detector software: From real detector to idealised image or two-theta scan. High Press. Res. 1996, 14, 235–248. [Google Scholar] [CrossRef]
  24. Lutterotti, L.; Bortolotti, M.; Ischia, G.; Lonardelli, I.; Wenk, H.-R. Rietveld texture analysis from diffraction images. Z. Krist. 2007, 26, 125–130. [Google Scholar] [CrossRef]
  25. Witusiewicz, V.T.; Bondar, A.A.; Hecht, U.; Velikanova, T.Y. The Al-B-Nb-Ti system: IV. Experimental study and thermodynamic re-evaluation of the binary Al-Nb and ternary Al-Nb-Ti systems. J. Alloys Compd. 2009, 472, 133–161. [Google Scholar] [CrossRef]
  26. Stark, A.; Oehring, M.; Pyczak, F.; Schreyer, A. In situ observation of various phase transformation paths in Nb-rich TiAl alloys during quenching with different rates. Adv. Eng. Mater. 2011, 13, 700–704. [Google Scholar] [CrossRef]
  27. Rackel, M.; Stark, A.; Gabrisch, H.; Schimansky, F.-P.; Schell, N.; Schreyer, A.; Pyczak, F. In situ synchrotron radiation measurements of orthorhombic phase formation in an advanced TiAl alloy with modulated microstructure. MRS Proc. 2015. [Google Scholar] [CrossRef]
  28. Yan, K.; Liss, K.-D.; Garbe, U.; Daniels, J.; Kirstein, O.; Li, H.; Dippenaar, R. From single grains to texture. Adv. Eng. Mater. 2009, 11, 771–773. [Google Scholar] [CrossRef]
  29. Liss, K.-D.; Schmoelzer, T.; Yan, K.; Reid, M.; Peel, M.; Dippenaar, R.; Clemens, H. In situ study of dynamic recrystallization and hot deformation behavior of a multiphase titanium aluminide alloy. J. Appl. Phys. 2009. [Google Scholar] [CrossRef]
  30. Garces, G.; Morris, D.G.; Muñoz-Morris, M.A.; Perez, P.; Tolnai, D.; Mendis, C.L.; Stark, A.; Lim, H.K.; Kim, S.; Schell, N.; et al. Plasticity analysis by synchrotron radiation in a MgY2Zn1 alloy with bimodal grain structure and containing LPSO phase. Acta Mater. 2015, 94, 78–86. [Google Scholar] [CrossRef]
  31. Wassermann, G.; Grewen, J. Texturen Metallischer Werkstoffe; Springer: Berlin, Germany, 1962. [Google Scholar]

