Prediction of Earing of Hot-Rolled Al Sheets from Pole Figures


Institute of Physical Metallurgy, Metal Forming and Nanotechnology, University of Miskolc, 3515 Miskolc, Hungary
*
Author to whom correspondence should be addressed.
Metals 2021, 11(1), 99; https://doi.org/10.3390/met11010099
Submission received: 11 December 2020
/
Revised: 30 December 2020
/
Accepted: 1 January 2021
/
Published: 6 January 2021
(This article belongs to the Section Metal Casting, Forming and Heat Treatment)
Abstract
:The formation of uneven cup heights during deep drawing is called earing. This phenomenon is caused by the planar anisotropy of formability in sheets, which is the result of crystallographic texture. In addition to analytical and finite element methods, a simple and quick method was developed recently to predict the earing profile of Al sheets solely from the data of {200} pole figures. So far, the method was applied on final state sheets cold rolled to 0.3–3 mm thickness and subsequently annealed. Within this manuscript, the earing prediction method is applied on 3003 type Al sheets with the thickness of ~6 mm, being in the hot-rolled state. Texture examinations were performed at different depths, from which earing profiles were calculated. For comparison, earing profiles were calculated from Lankford values that were determined by tensile tests. It is shown that in the case of hot-rolled Al sheets, if the grain structure is uniform across the thickness of the sheet, the earing profile can be appropriately calculated from the full {200} pole figure obtained from surface X-ray Diffraction (XRD) texture measurements.
1. Introduction
The plastic anisotropy of aluminum sheets can be characterized experimentally through deep drawing tests performed on circular blanks. If texture is present, the obtained cup height varies versus the angle (φ) relative to rolling direction (RD). To save time and costs, the earing profile can also be calculated. Fukui and Kudo found empirically that the profile can be predicted from the Lankford value Δr = (r0 + r90)/2 − r45 [1]. In general, earing prediction methods are analytical methods [2,3,4] or finite element (FE) methods. The latter are usually applied nowadays [5]. In addition to these, a simple empirical method has been proposed by the authors which predicts earing directly from the data of texture measurements [6,7,8]. Very good correlation was obtained between predicted and measured earing profiles in the case of 0.3 and 3 mm thicknesses for both rolling and recrystallization textures and also for unidirectional and cross rolling as well. Despite that the earing prediction methods are time and cost efficient, deep drawing tests did not vanish completely since the calculation method needs to be experimentally validated, and they are still practiced by some companies. However, such tests cannot be carried out above a certain sheet thickness. The limiting thickness, of course, depends on the deep-drawing equipment itself. Hot-rolled aluminum sheets are generally in the range where deep drawing experiments cannot always be performed. Studies can be found about the microstructure and texture in pure aluminum, 3014 type and 5XXX type sheets [9,10,11,12], or mechanical properties of 7075 type alloy [13] in the hot-rolled state. In others, the texture and microstructure evolution during annealing [14,15] is discussed in 1050 type hot-rolled sheets. Hutchinson et al. examined the effect of hot-rolling parameters on earing of 1XXX, 3XXX and 5XXX type sheets, but they examined the earing behavior in the final state of the sheets [16,17]. There are only a few reports in which earing behavior of hot-rolled sheets is examined [12,18]. In these, experimental deep drawing tests were carried out. The objective of the present manuscript was to apply the earing prediction method proposed by Benke et al. [6,7,8] on hot-rolled aluminum sheets for the first time and validate it with experiment-based data. Since deep-drawing test was not possible to be performed due to the thickness of hot-rolled sheets, the validation is based on the correlation between r-values and earing profile proposed by Yoon et al. [19]. It is worth to mention that in the referred work the earing profile was obtained first through FE analysis, from which the Lankford values were determined. The correlation was also used in the work by Lelotte et al. [20] in which the Lankford values were determined from FE simulated tensile tests and the deep drawing tests were also simulated. In our case, the r-values are obtained first through experimental tensile tests from which the earing profile is calculated using Yoon’s formula.
2. Materials and Methods
For the examinations, a 3003 type hot-rolled aluminum sheet with 5.9 mm thickness, which was manufactured by ARCONIC-Köfém Ltd. (Székesfehérvár, Hungary), was used. The width of the sheet was 1200 mm. Two sample pairs were cut from the sheet: one pair from the side (at ~200 mm from the edge) and one from the center (at ~600 mm from the edge) of the sheet. From each pair, one sample was subjected to optical microscopy to reveal the grain structure. For this, longitudinal sections were prepared with Barker etchant and a Zeiss Axiovert 40 type optical microscope (Zeiss, Headquartered in Oberkochen, Germany) was used. From the other pieces of sample pairs, 30 mm diameter samples were cut for texture measurements. Texture measurements were carried out on the surface and at different depths of the original thickness. Texture measurements were performed with a Bruker D8 Advance X-ray diffractometer (Bruker, Billerica, MA, USA) equipped with an Eulerian cradle and CuKα X-ray tube. Incomplete pole figures of the {111}, {200}, and {220} reflections were measured to χ = 75° sample tilting angle. The complete {200} pole figure was recalculated with the own software of the equipment, TexEval (Bruker-AXS, Ver. 1.06.86., Bruker, Billerica, MA, USA). During recalculation, orthotropic deformation was used. The earing prediction method is presented in detail in refs. [6,7,8]. In short, the vertical projection of the recalculated {200} full intensity distribution function on the rolling plane (RD-TD) was calculated. To obtain this, every χ-cut of the recalculated pole figure was fitted with a set of Gaussian functions. The area of each function was calculated, then they were multiplied (weighted) with the sin of their χ value corresponding to the peak. The weighted intensities were summarized for the actual χ-cut. At last, the summarized values were plotted versus angle relative to RD (ϕ). Average earing was calculated as the ratio of average intensity of “ears” (peak intensity-valley intensity) and average intensity expressed in %. Since average earing was derived here from intensity data and not cup height values, the use of a scaling factor was required. According to ref. [6], the scaling factor was found to be 24 for the deep drawing parameters (blank diameter, die diameter, punch diameter) used in this work during the validation process.
For validation, tensile test specimens with 50 mm marked length (L0), 5.9 mm thickness (A0), and 10 mm width (B0) were cut from the center and at ¼ width of the hot-rolled sheet in 5 different directions, namely in the 0°, 22.5°, 45°, 67.5°, and 90° with respect to RD. For each direction, three parallel tensile test specimens were prepared. Tensile tests were performed with an Instron 5982 type universal mechanical tester (Instron, Norwood, Massachusetts, USA). During testing, instantaneous length (L) and width (B) were continuously measured with a video extensometer. Instantaneous thickness was calculated from A and L according to Equation (1). The calculations were performed with Maple 18 software. Data after the maximum value of engineering stress were neglected to exclude plastic instability (necking). The calculations were performed for all 5 examined directions and all three parallel test specimens.
Logarithmic strains (φA) and (φB) were calculated using Equations (2) and (3), respectively for the full strain range of interest (excluding necking).
The r-values were also calculated according to Equation (4) for the full strain range of interest.
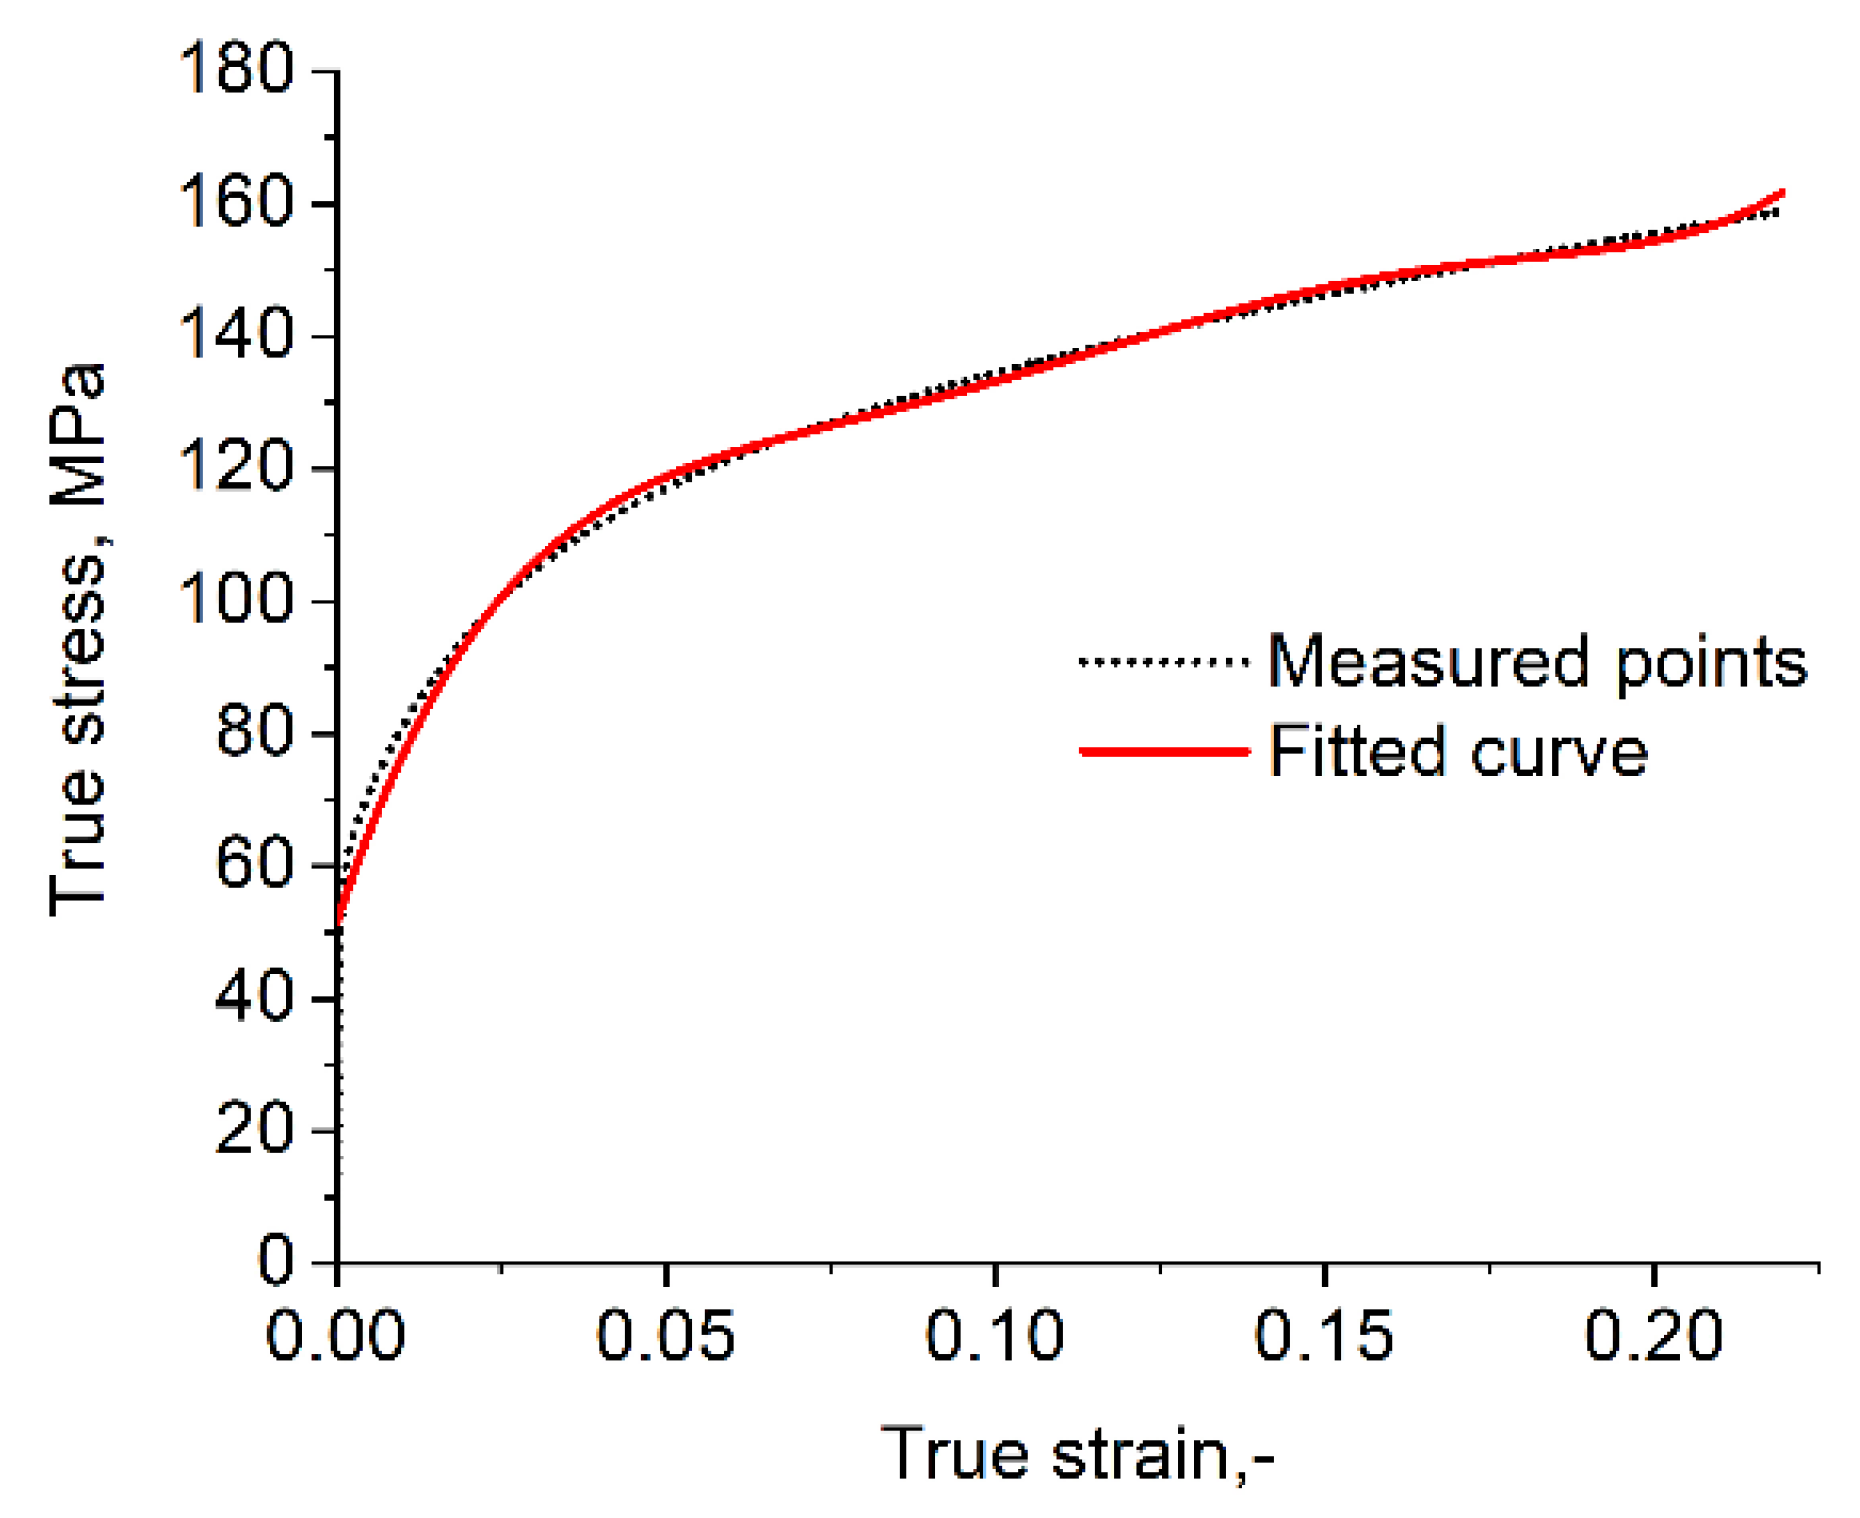
The true stress–true strain (logarithmic strain) dataset was fitted to exclude the noise originating from the measurement. The fit was needed to get the real stress and the real strain as a function. The function will be integrable to calculate the value of the strain energy density. An example for the measured data and fitted curve is shown in Figure 1.
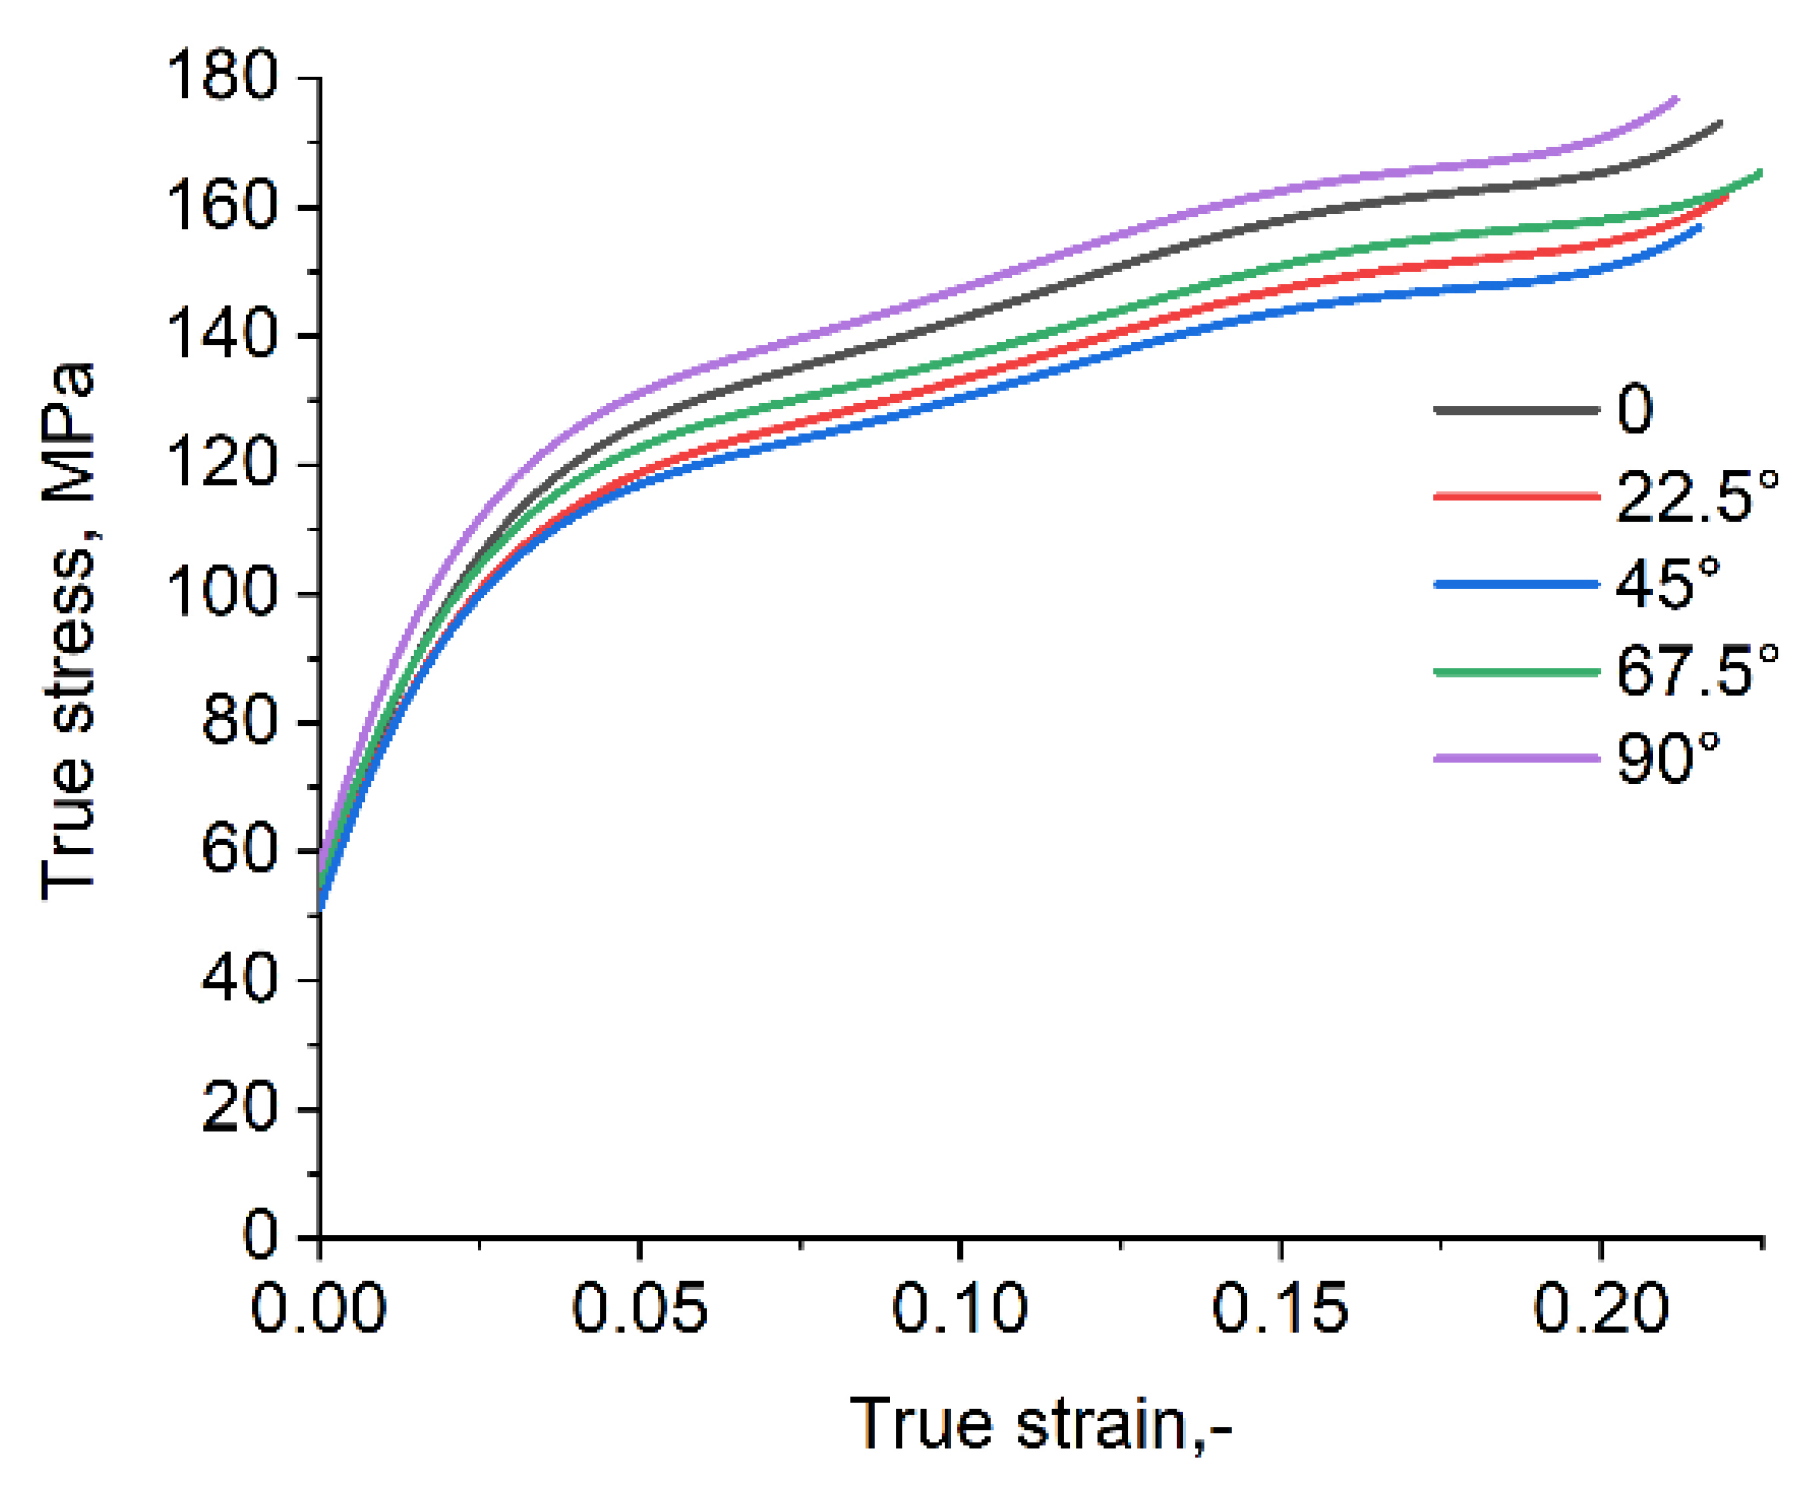
Figure 2 shows the fitted true stress-true strain curves of specimens taken from different directions. It can be seen that different stresses are required to reach a certain strain value for the specimens taken in different directions from the initial sheet. This originates from the crystallographic texture of the sheet, which causes different formability in different directions.
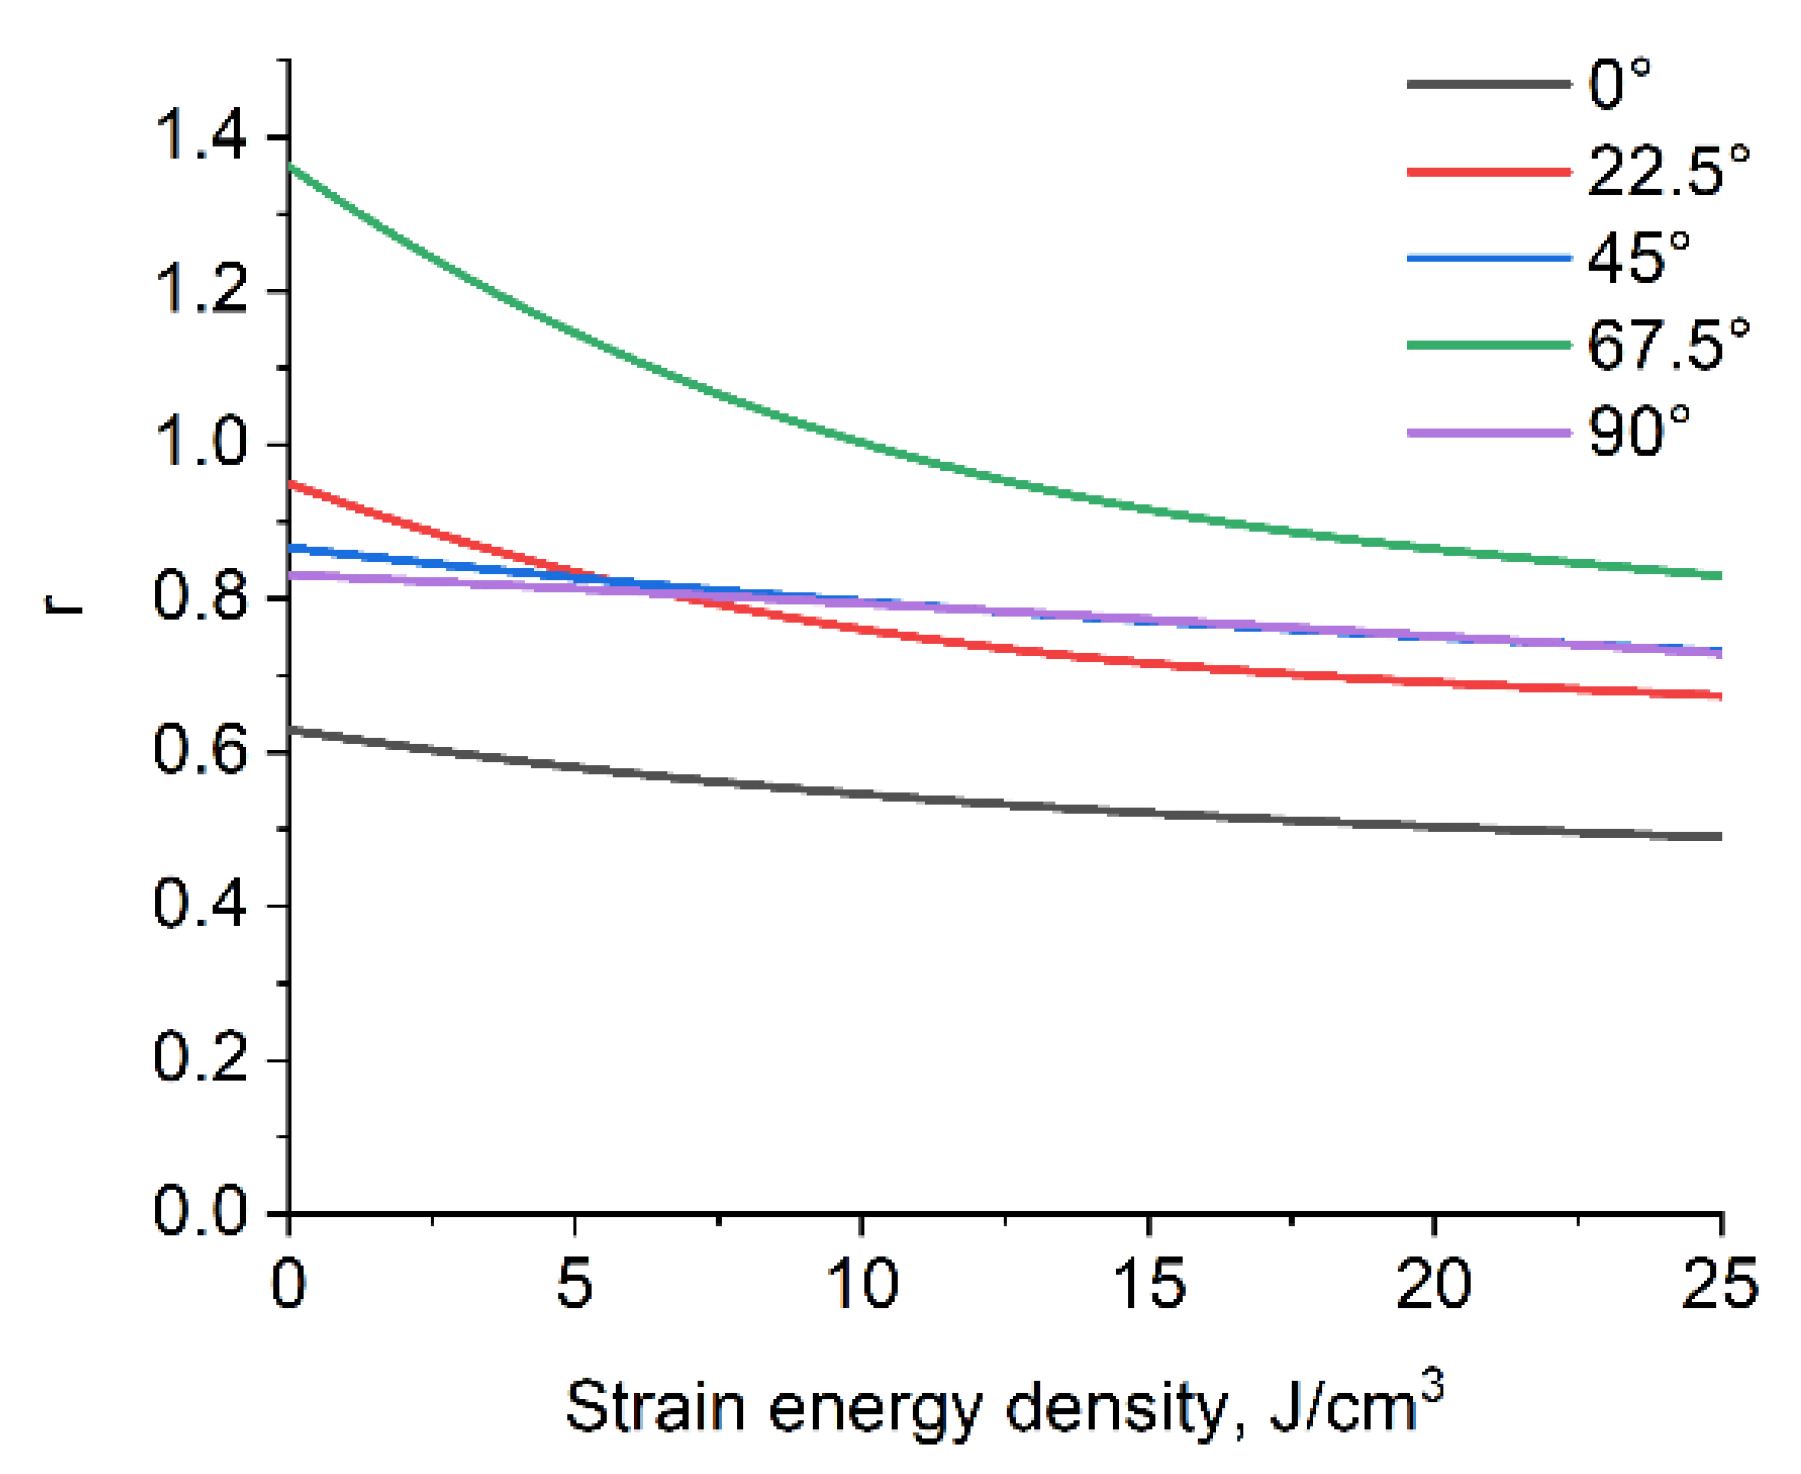
Afterwards, true stress was integrated by true strain. Thus, the strain energy density (J/cm3) variation along the uniform elongation regime was obtained. Then, r-values were plotted as a function of strain energy density. Figure 3 shows such plots in all 5 examined directions.
For each sample direction, r-values were determined for a constant strain energy density value (namely at 25 J/cm3, being the last common point before necking) for all 5 directions instead of constant axial (logarithmic) strains. This method was chosen to avoid the disturbing effect originating from that textured tensile test specimens show different formability in different directions. The r-values of the parallel test specimens were averaged. The earing profile was obtained from the averaged r-values according to Yoon’s formula (Equation (5)) which is described in reference [19] in detail.
where hφ is the peak height for the given angle, rp is the rounding radius, Rb is half the diameter of blank, Rc is the quarter of the punch diameter and the outer diameter of the cup, rφ is the Lankford number for the given angle, and t0 is the thickness of the sheet.
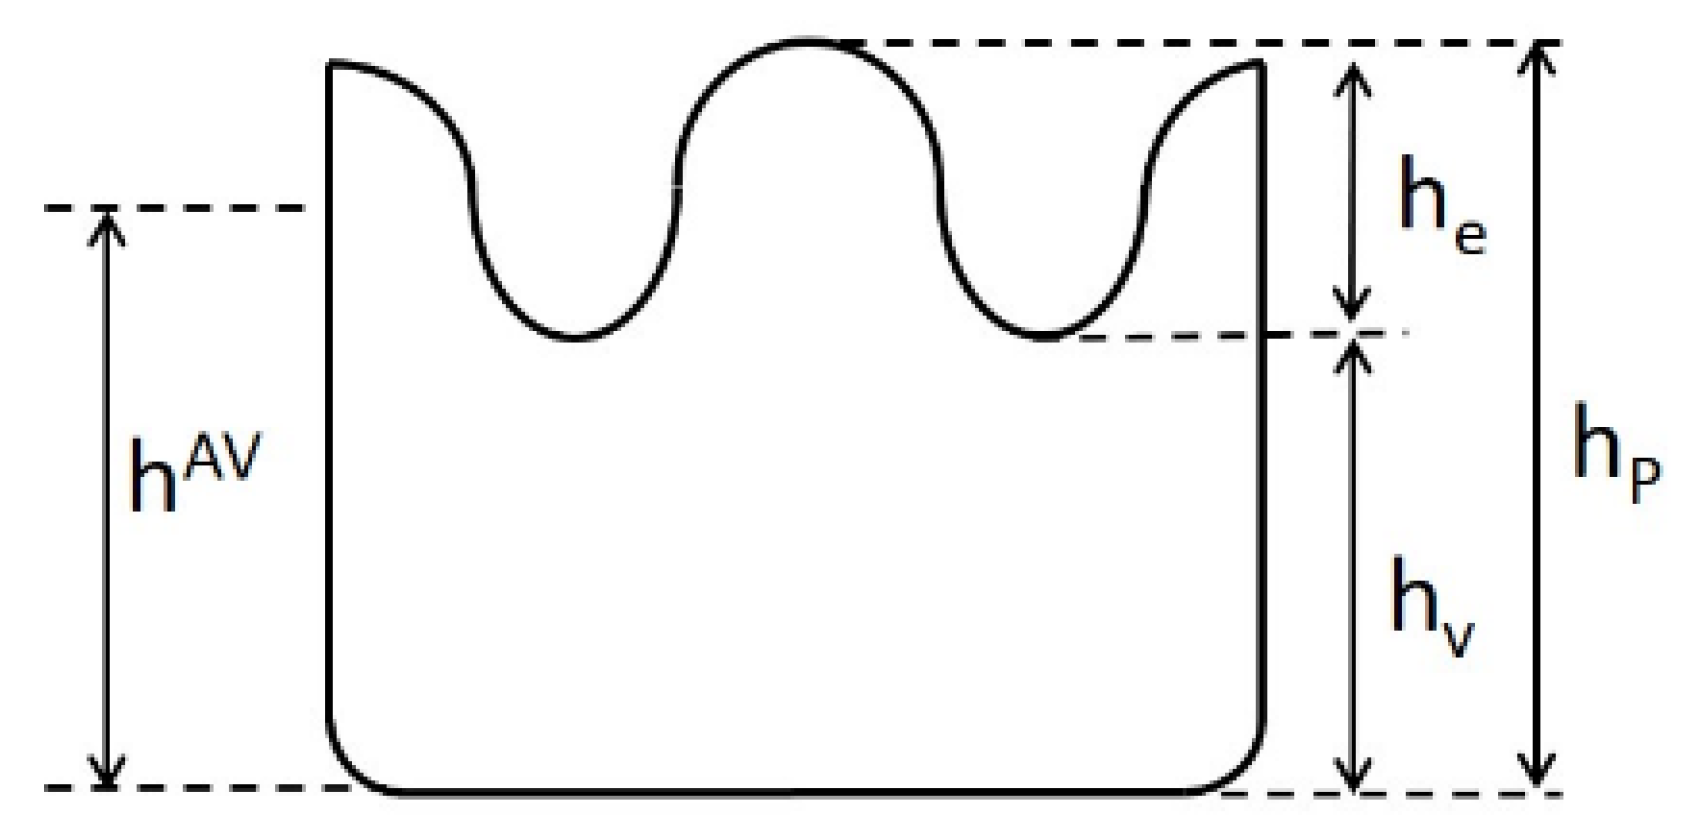
The following deep drawing parameters were used during the calculation. Blank diameter: 65 mm, die diameter: 39 mm, punch diameter: 33 mm, sheet thickness: 5.9 mm. From the earing profile, average earing was calculated as the ratio of average ear height and average cup height (Figure 4), expressed in % based on Equations (6)–(10).
where is the mean peak height, hpn is the peak height, np is the number of peaks, is the mean valley height, hvn is the valley height, nv is the number of valleys, he is the average ear height; is the average cup height; z is the average earing [6].
3. Results
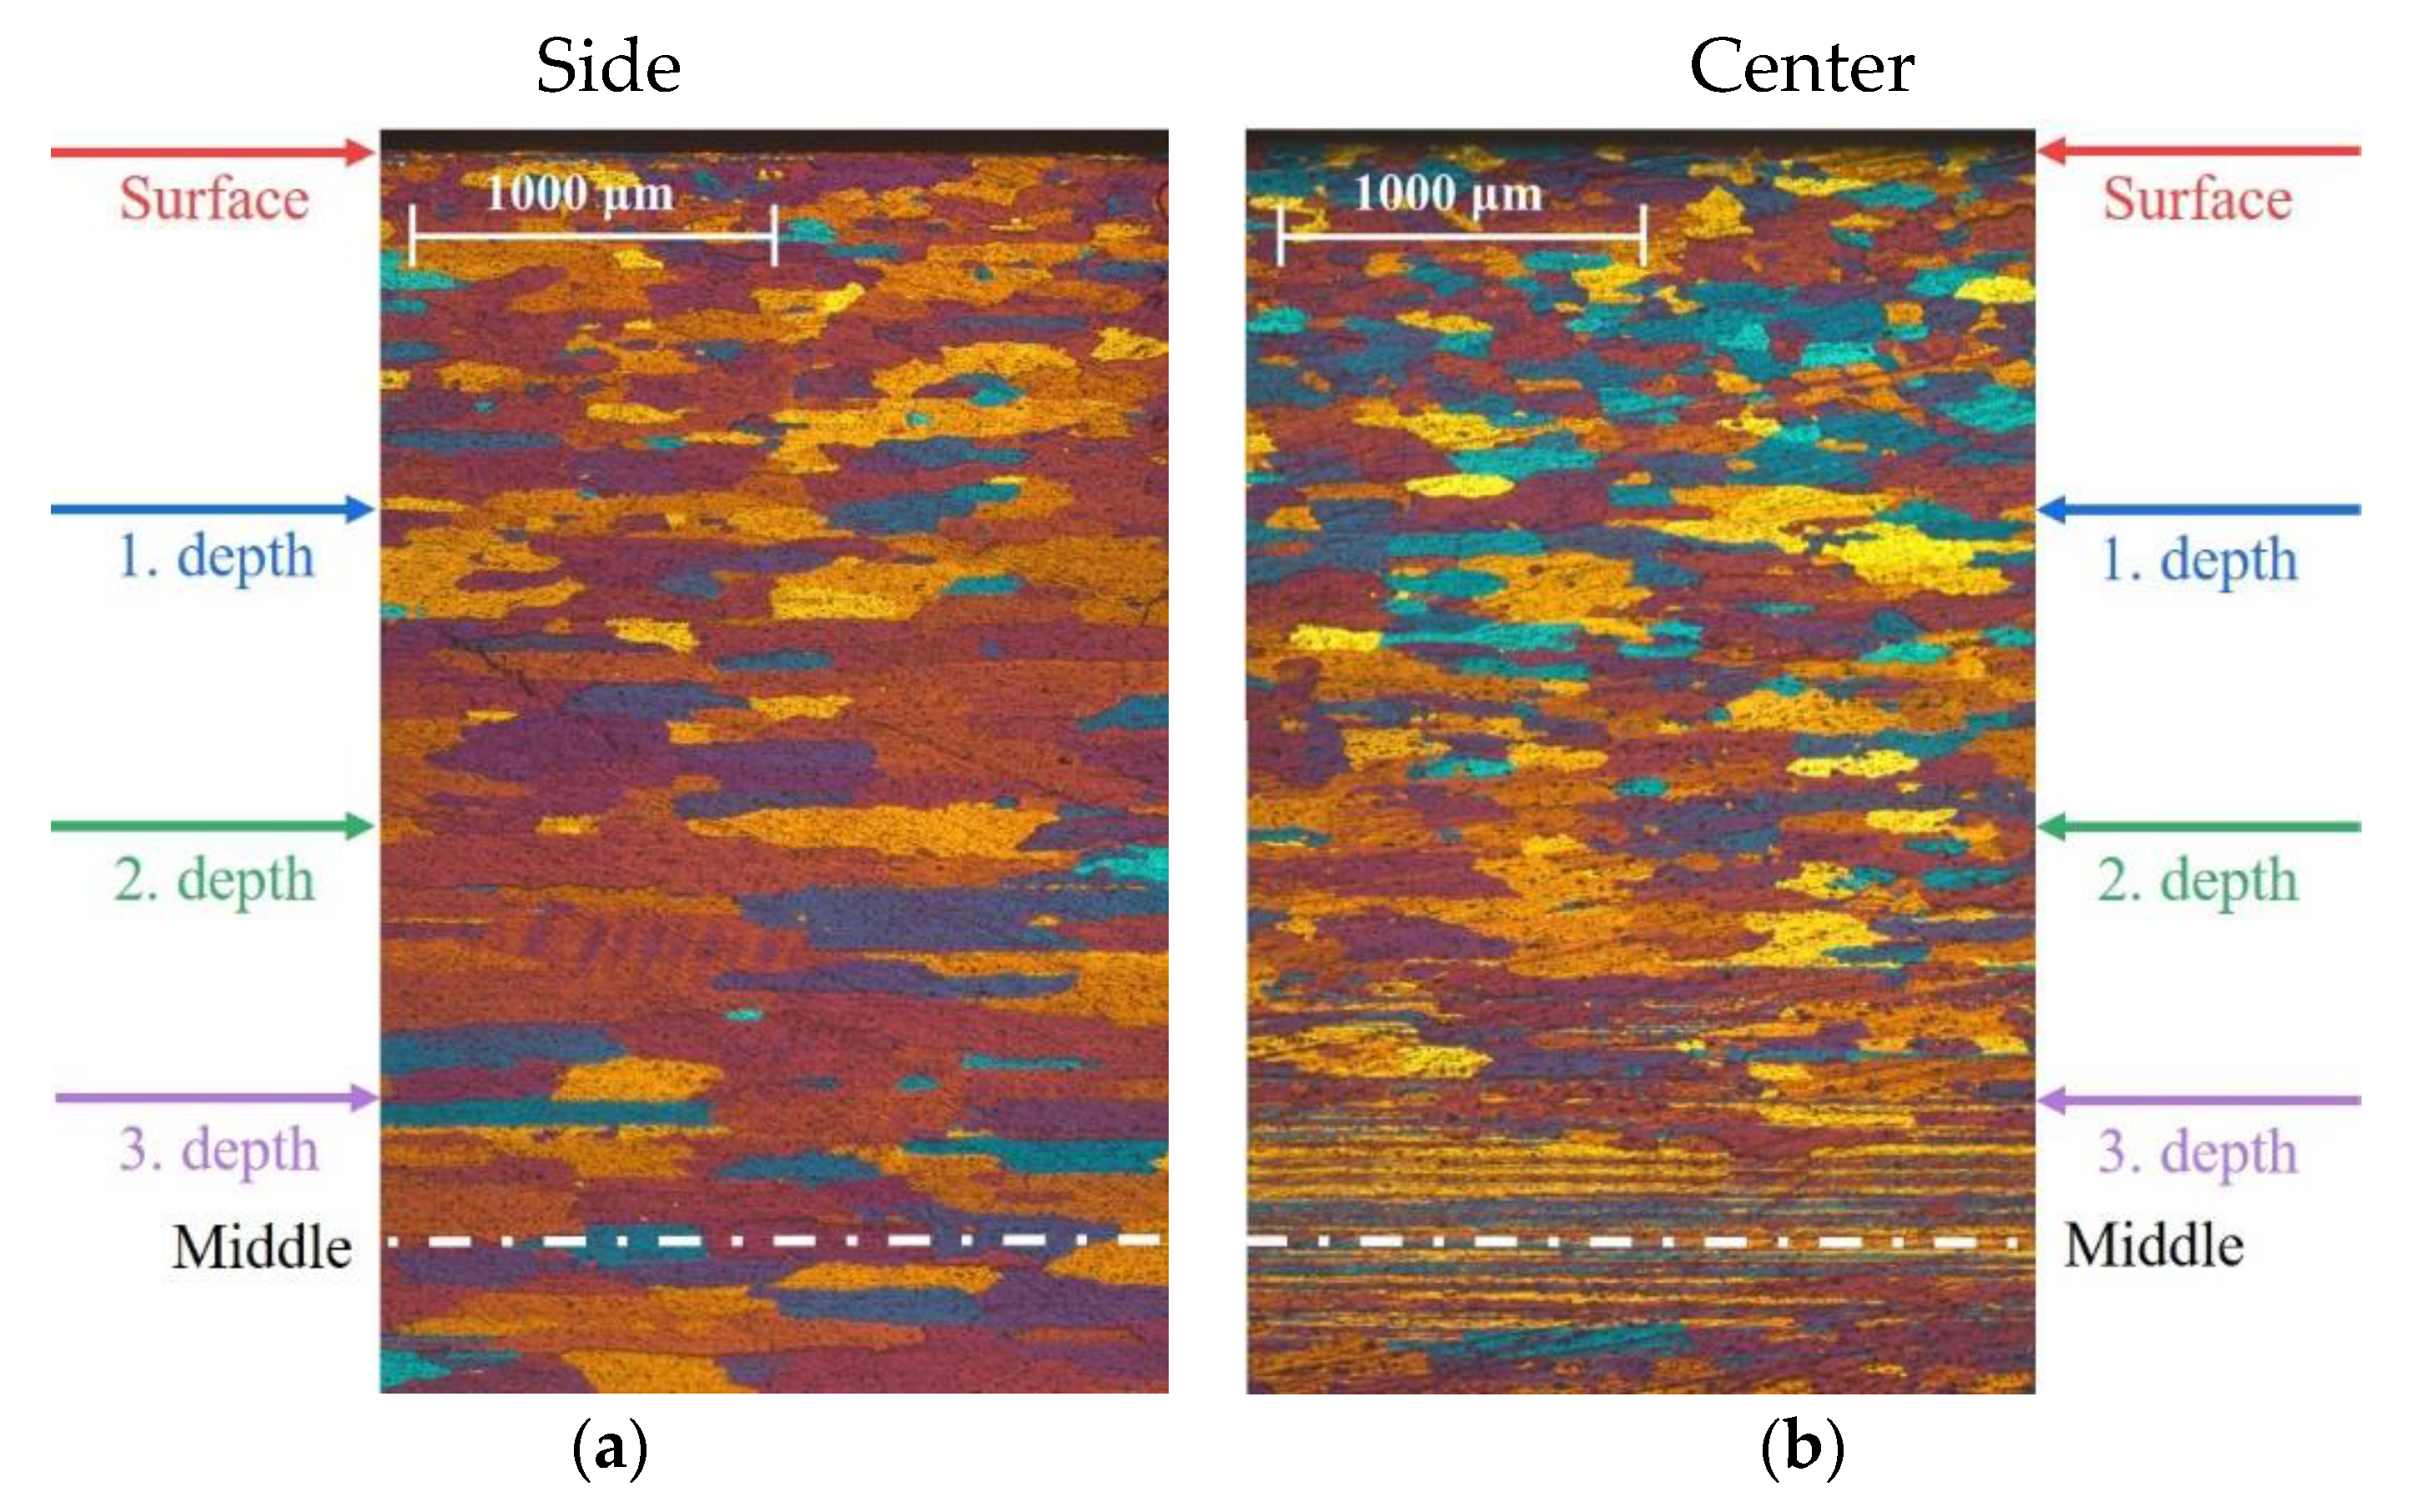
Figure 5 shows the grain structure of the examined sheet on longitudinal sections taken from the side (Figure 5a) and center (Figure 5b). The locations of XRD texture measurements are also highlighted. It can be seen, that in the sample taken from the side, slightly elongated grains are present near the surface region and along the thickness as well. Although the size of the grains increases from the surface towards the middle of the sheet, the elongation of grains is quite uniform. Bands of equiaxial grains or highly deformed grains cannot be found. Within the sample taken from the center, however, slightly elongated grains can be found near the surface regions, while a band of heavily deformed grains is formed near the middle of the sheet.
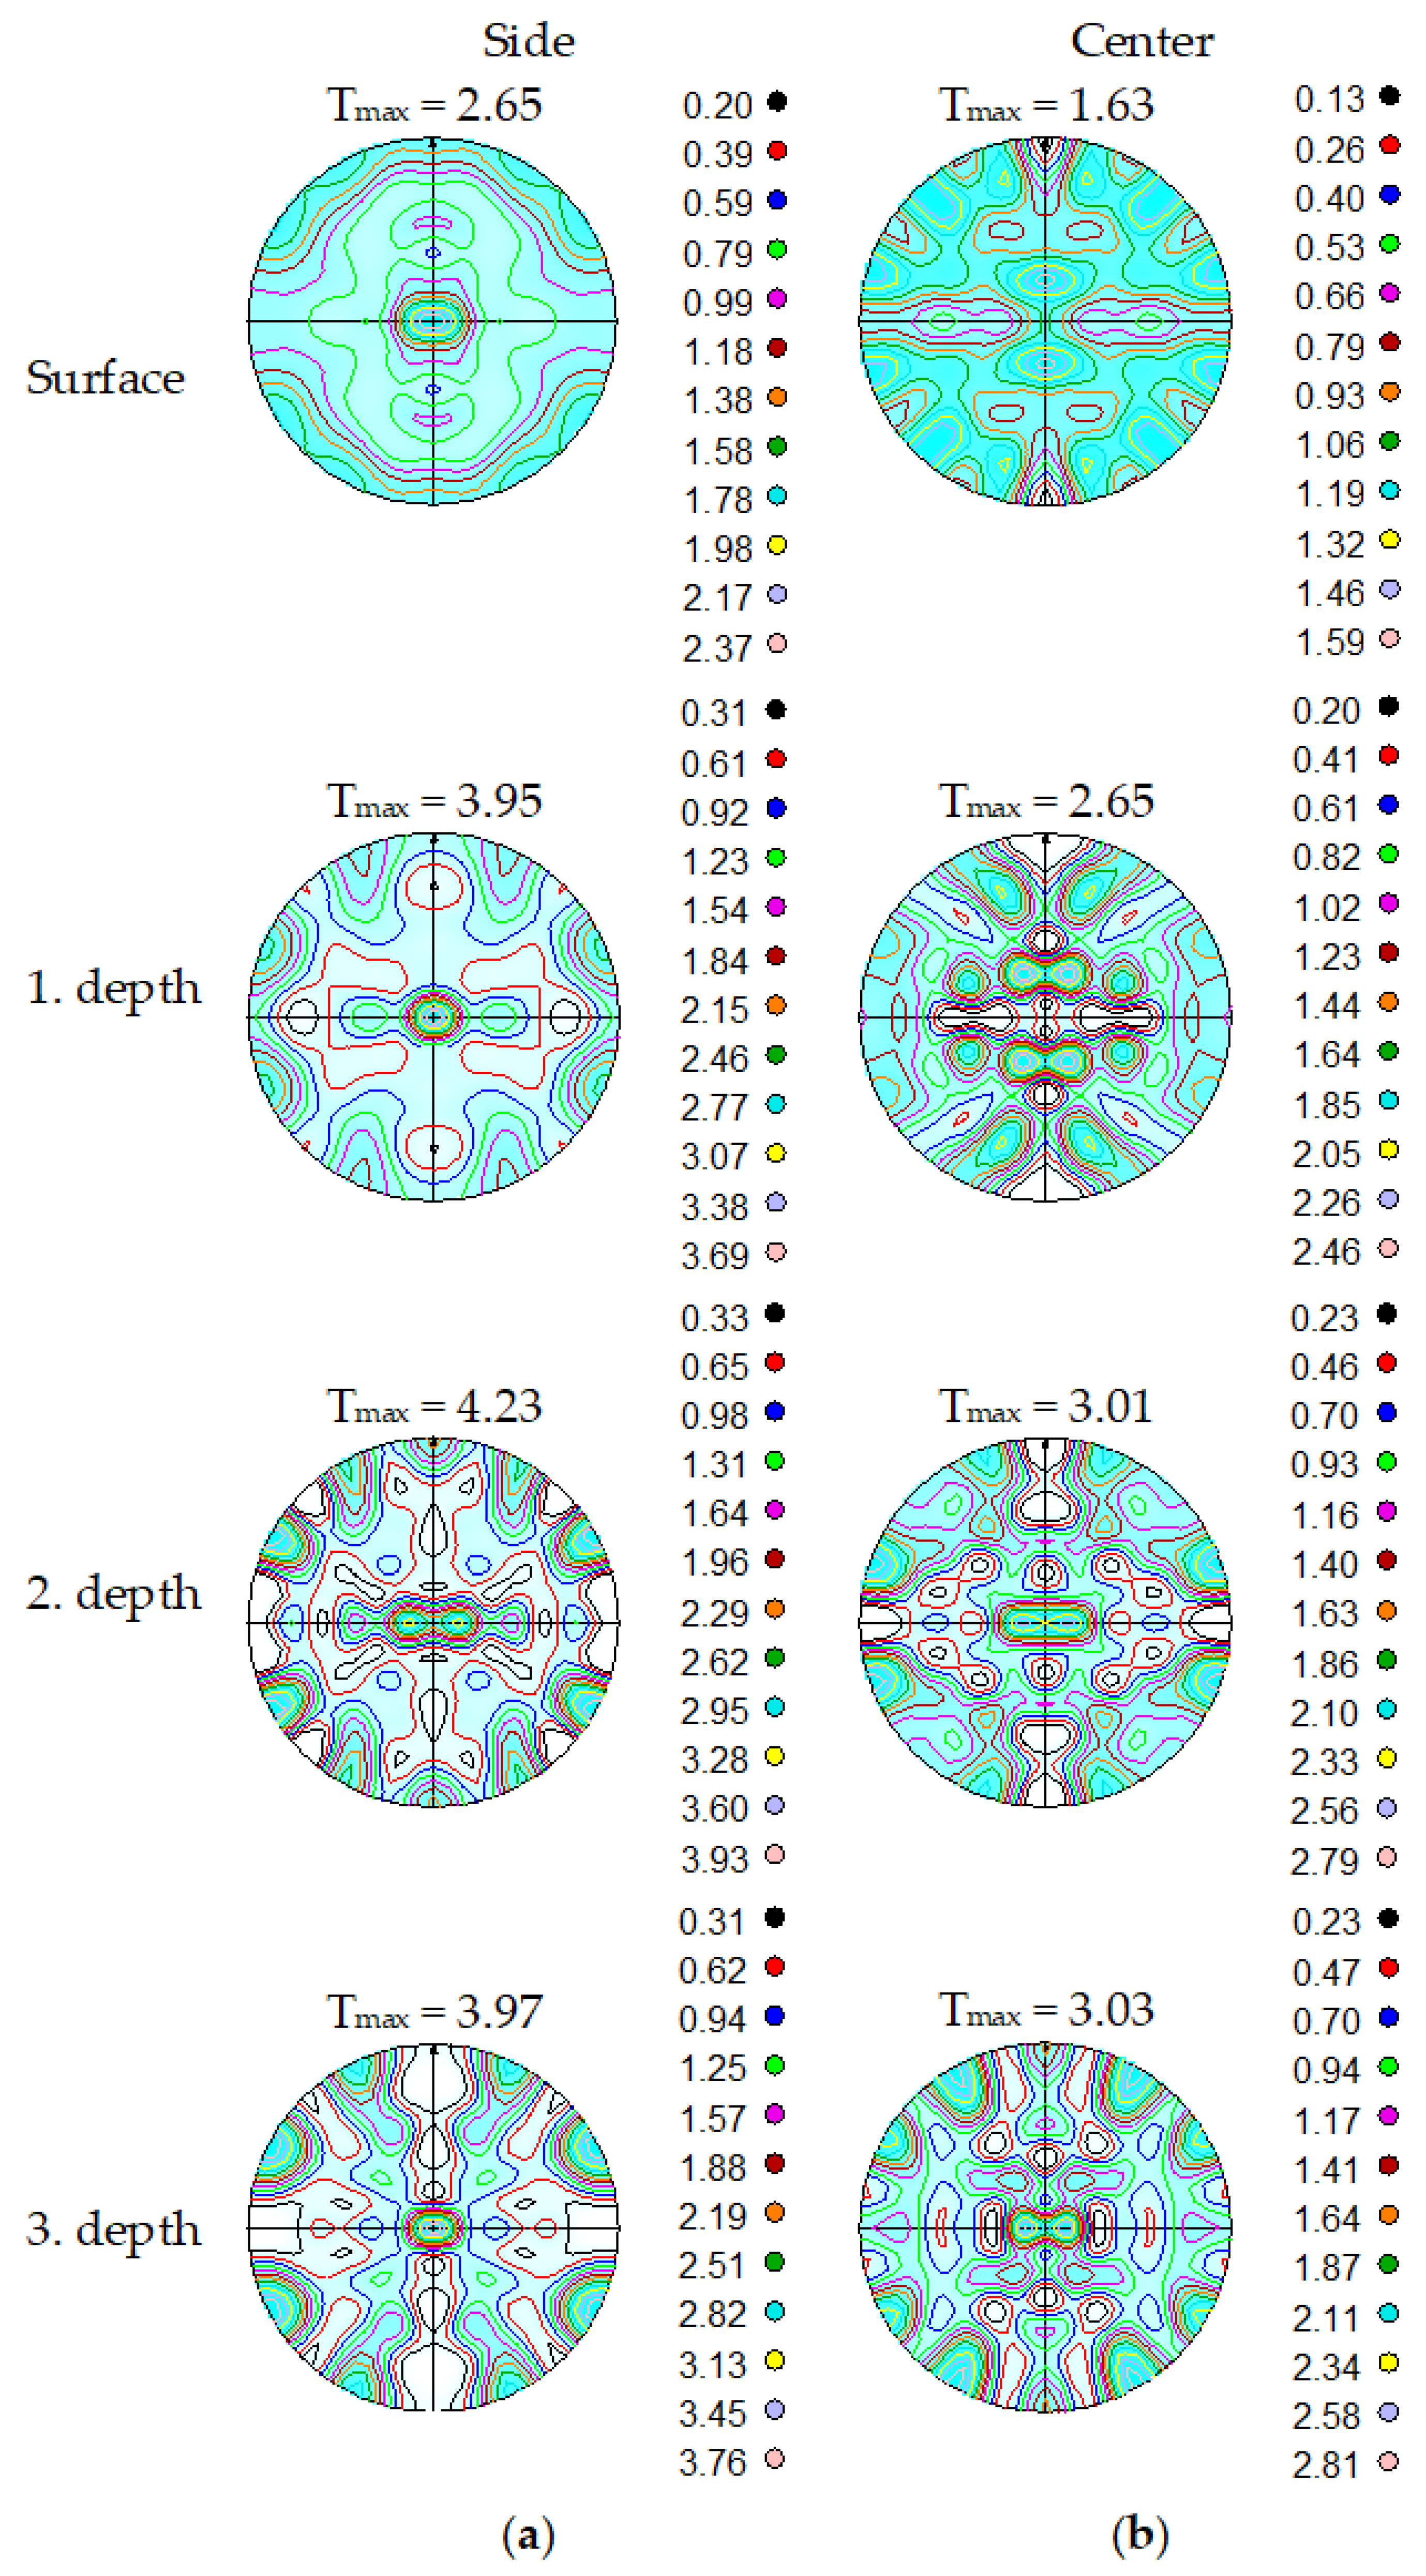
Figure 6 summarizes the recalculated full {200} pole figures obtained from different depths of the samples taken from the side and the center. The values of pole density levels and the maximal value of texture (Tmax) are also presented. Based on the pole figures, it is evident that the textures observed in the samples cannot be characterized as pure rolling or recrystallization textures, as they are somewhere in between those. It is also apparent by the density level and Tmax values that the magnitude of texture increases with depth. The texture of the sample taken from the side differs from that of the sample taken from the center. However, as the depth of inspection is increased, the pole figure of the sample from the center becomes more similar to that of sample from the side.
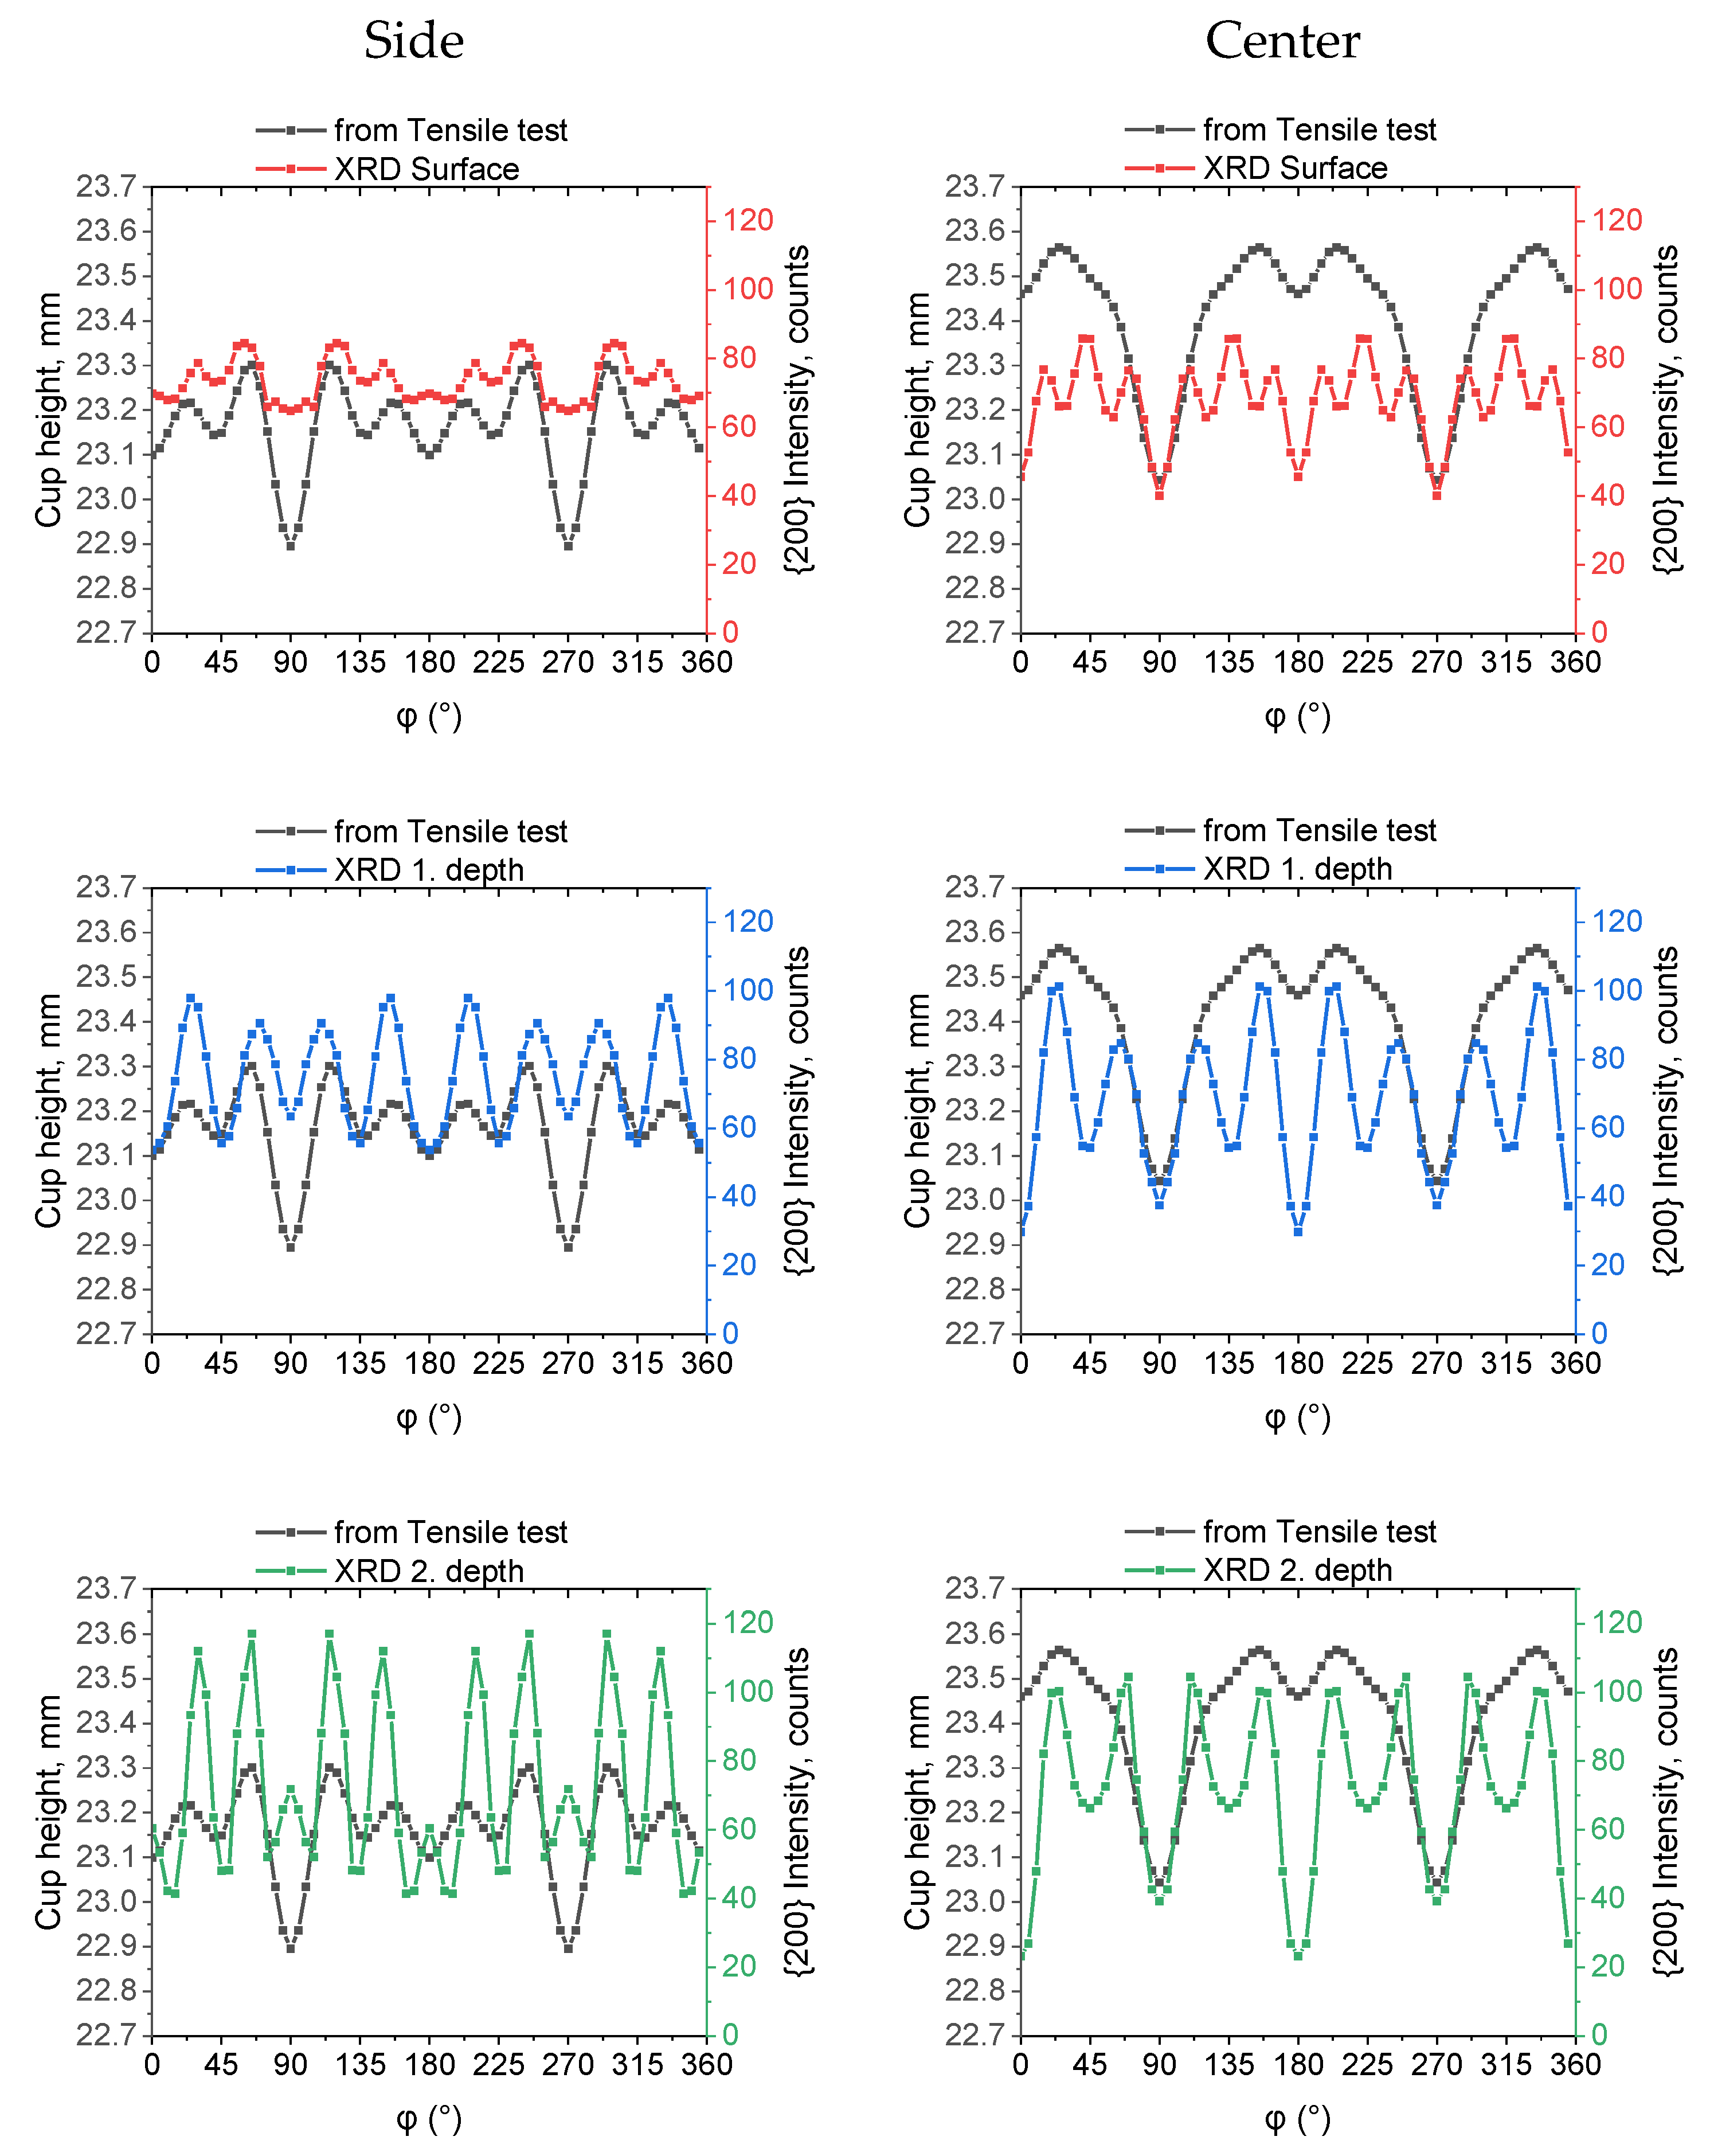
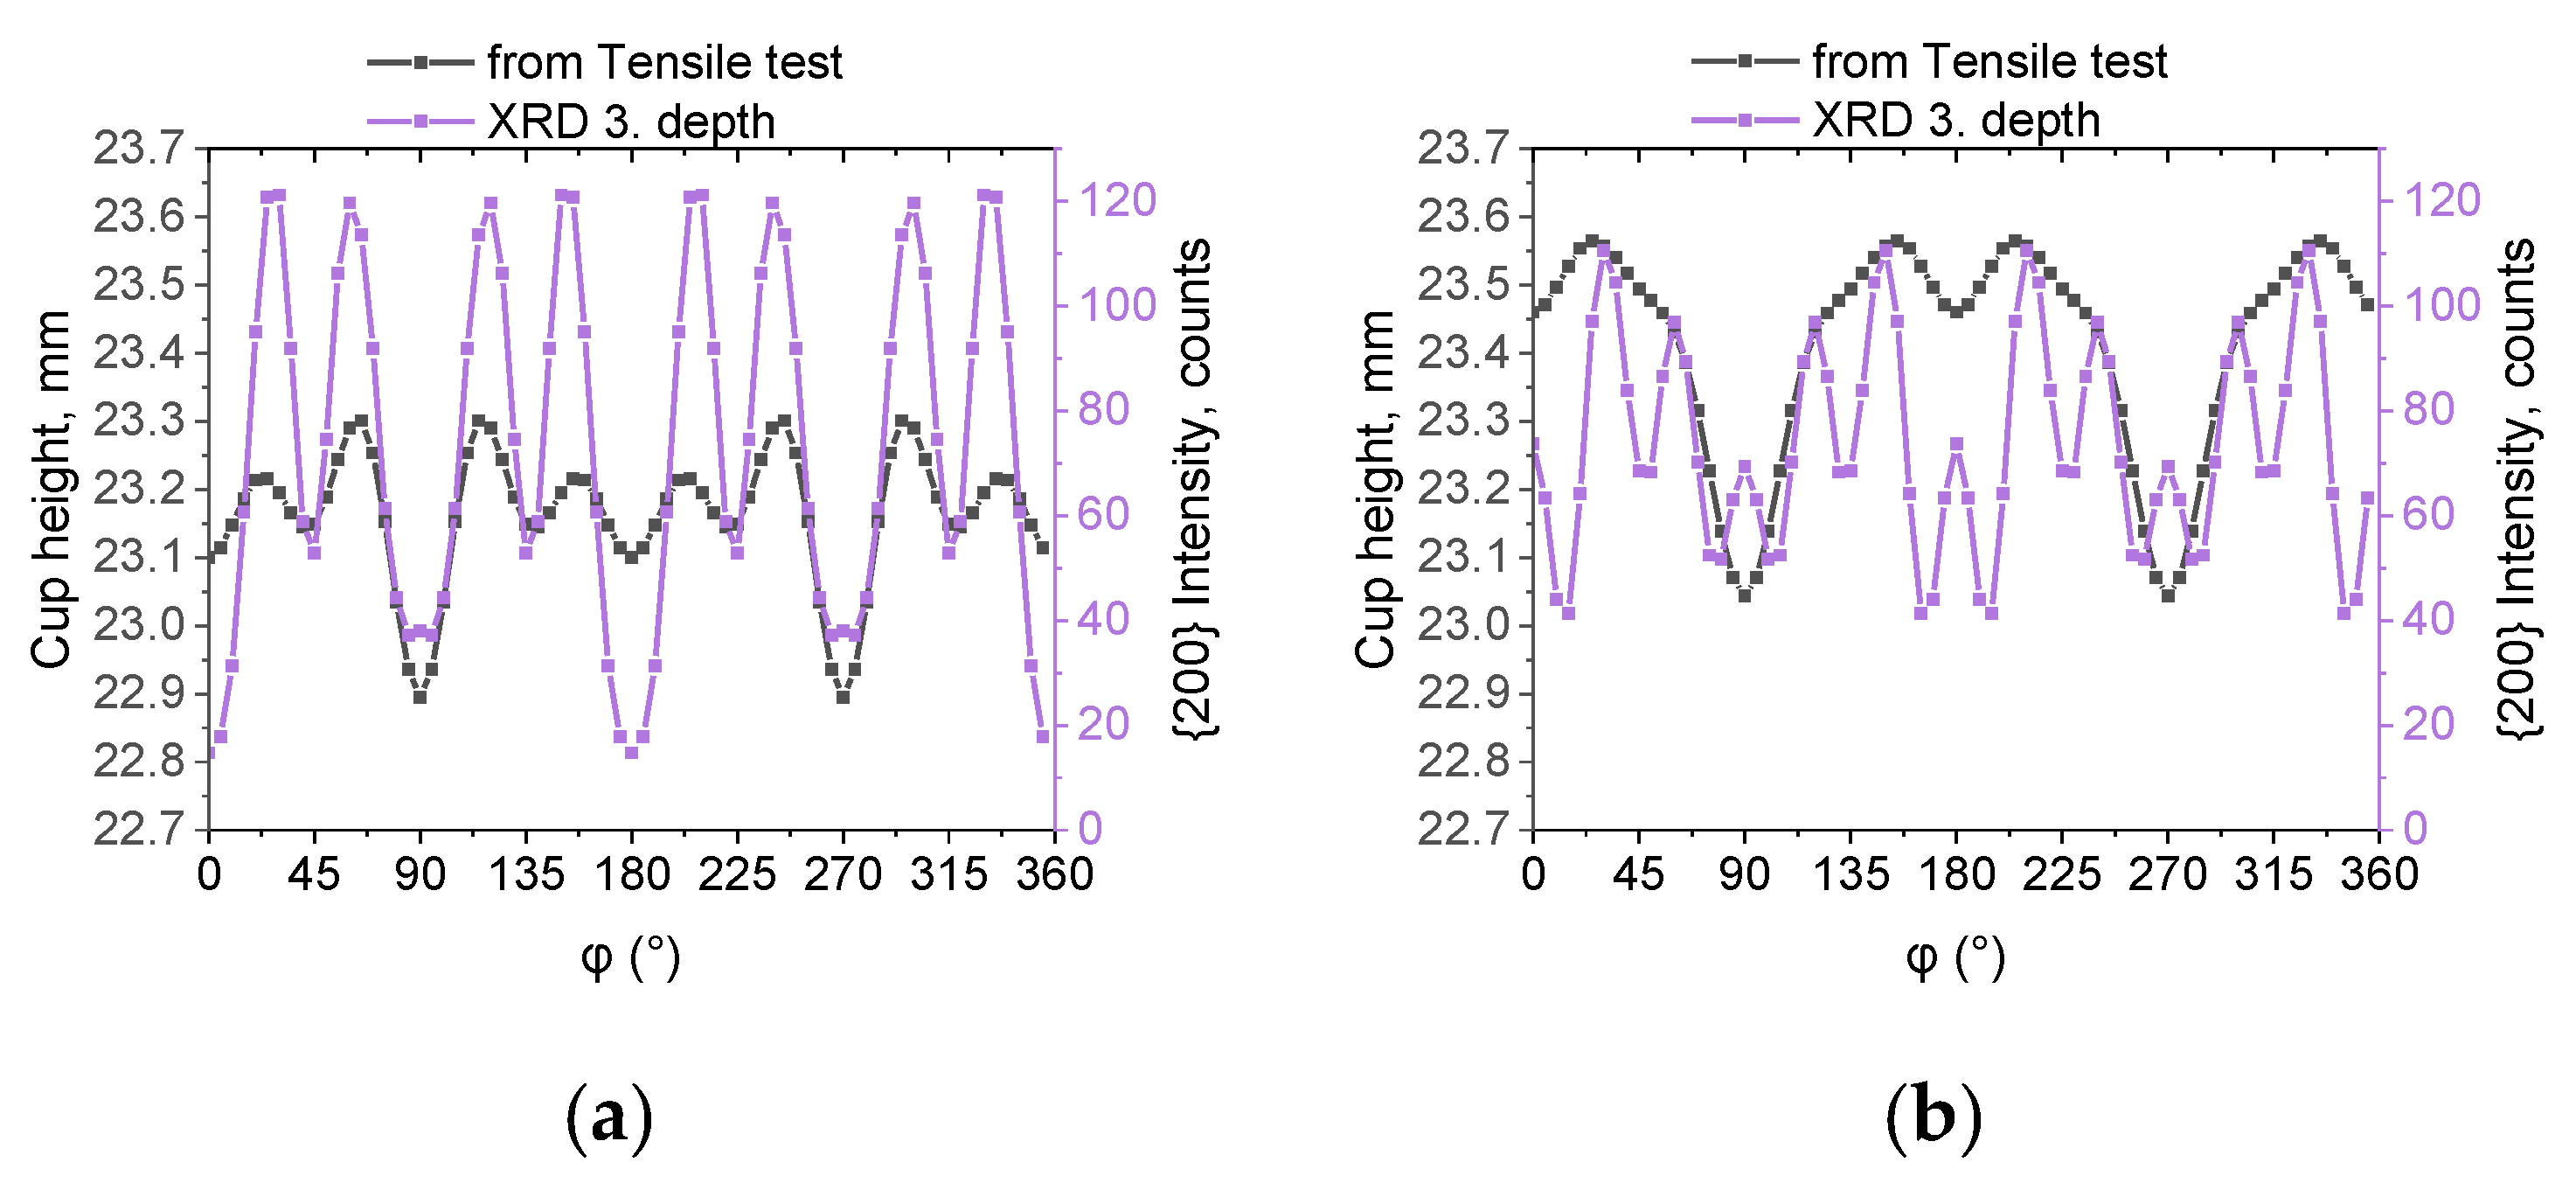
In Figure 7, the earing profiles predicted from the Lankford values are plotted together with the earing profiles obtained from XRD texture measurements performed at different depths of samples taken from the side (a) and center of the sheet (b). In the case of the sample taken from the side, the ears and valleys on earing profiles obtained from XRD measurements at different depths appear exactly at those φ values, where ears and valleys can be found on the earing profile derived from Lankford values. The relative height of ears and valleys increase with increasing depth. However, the profile deduced from surface XRD measurement is very similar to that calculated from the Lankford values. In the case of the sample taken from the center, the major valleys on all XRD-derived profiles appear exactly where valleys can be seen on the earing profile deduced from tensile tests. On surface XRD profiles, there are 3 ears in the φ = 0°–90° range, but only 2 on the profiles of increased depth and 1 of the Lankford value-derived curve. (Actually, 2 additional minor ears appear at φ = 0° and 90° on the curve of 3. depth.) This confirms that as the examination depth is increased, the texture of sample from center becomes more similar to those of sample from the side. The envelope of the multiple ears observed on the XRD-derived curves are close to the ears of the tensile test-derived curve. It is worth to note that the value of average earing (the ratio of average ear height and average cup height) was very low, namely 0.81% and 1.34% for the sample taken from the side and from the center, respectively. That is, the presented earing profiles are of two samples with very weak earing.
4. Discussion
It was seen that if the morphology (that is, the elongation) of grains does not show relevant differences in depth, similar {200} pole figures can be obtained from the different depths of examination of a relatively thick (~6 mm) sheet. Consequently, the earing profiles deduced from these pole figures also have similar character. It was also shown that in such cases, the earing profile that is calculated from surface texture measurements and the earing profile that is obtained from Lankford values determined by tensile tests—describing the earing behavior with the full thickness of the sheet—show a good correlation. The presented results are of a hot-rolled sheet having relatively large thickness (~6 mm) and showing very weak earing (~1%), which means that the height variation versus φ is rather small. The fact that the earing profile with even such weak earing characteristics was appropriately reconstructed proves the suitability of the method. In fact, the applicability of the method for larger earing was presented in our previous works [6,7].
5. Conclusions
It was shown that in such cases when the grain structure of Al sheets does not show relevant changes in depth, the predicted earing profiles of different depths calculated as the vertical projection of the full {200} pole figures on the rolling plane and the earing profile obtained from r-values give similar results. This is true for surface texture measurements as well. Thus, it can be concluded that if the elongation of grains is uniform across the thickness of the examined sheet, the earing behavior of relatively thick sheets can be predicted from full {200} pole figures originating from surface texture measurements.
Author Contributions
Conceptualization, A.H.; methodology, A.H. and M.B.; validation, A.H. and M.S.; formal analysis, M.S.; investigation, A.H. and M.B.; data curation, A.H.; writing—original draft preparation, A.H. and M.B.; writing—review and editing, V.M.; visualization, M.B.; supervision, V.M.; funding acquisition, V.M., M.B. All authors have read and agreed to the published version of the manuscript.
Funding
This work was supported by the Janos Bolyai Research Scholarship of the Hungarian Academy of Sciences and the NKFIH K119566 project. The described article was carried out as part of the EFOP-3.6.1-16-2016-00011 “Younger and Renewing University—Innovative Knowledge City—institutional development of the University of Miskolc aiming at intelligent specialisation” project implemented in the framework of the Szechenyi 2020 program. The realization of this project is supported by the European Union, co-financed by the European Social Fund.
Institutional Review Board Statement
Not applicable.
Informed Consent Statement
Informed consent was obtained from all subjects involved in the study.
Data Availability Statement
Data available on request. The data presented in this study are available on request from the corresponding author.
Conflicts of Interest
The authors declare no conflict of interest.
References
- Fukui, S.; Kudo, H. The earing in deep-drawing and directionality in tension-test of sheet metal. Rep. Inst. Sci. Technol. Univ. Tokyo 1950, 4, 33. [Google Scholar]
- Sowerby, R.; Johnson, W. Prediction of earing in cups drawn from anisotropic sheet using slip-line field theory. J. Strain Anal. 1974, 9, 102–108. [Google Scholar] [CrossRef]
- Tucker, G.E.G. Texture and earing in deep drawing of aluminium. Acta Metall. 1961, 9, 275–286. [Google Scholar] [CrossRef]
- Kanatake, N.; Tozawa, Y.; Otani, T. Calculations from texture of earing in deep drawing for fcc metal sheets. Int. J. Mech. Sci. 1983, 25, 337–345. [Google Scholar] [CrossRef]
- Engler, O.; Mertens, N.; Van Dam, P. Texture-based design of a convoluted cut-edge for earing-free beverage cans. J. Mater. Process. Technol. 2011, 211, 1278–1284. [Google Scholar] [CrossRef]
- Benke, M.; Hlavacs, A.; Imre, P.; Mertinger, V. Prediction of earing of aluminium sheets from {h00} pole figures. Eur. J. Mech. 2020, 81, 103950. [Google Scholar] [CrossRef]
- Benke, M.; Schweitzer, B.; Hlavacs, A.; Mertinger, V. Prediction of earing of cross-rolled Al sheets from {h00} pole figures. Metals 2020, 10, 192. [Google Scholar] [CrossRef] [Green Version]
- Schweitzer, B.; Benke, M.; Hlavacs, A.; Mertinger, V. Earing Prediction of Unidirectionally and Cross-rolled, Annealed AW-5056 Al Sheets from {h00} Pole Figures. Acta Mater. Trans. 2020, 3, 38–42. [Google Scholar] [CrossRef]
- Weiland, H.; Hirsch, J.R. Microstructure and local texture in hot rolled aluminum. Texture Microstruct. 1991, 14, 647–652. [Google Scholar] [CrossRef] [Green Version]
- Huh, M.Y.; Park, J.C.; Lee, S. Interpretation of hot rolling and cold rolling texture in high purity aluminium. Met. Mater. 1996, 2, 141–149. [Google Scholar] [CrossRef]
- Mao, Y.; Gokhale, A.M.; Harris, J. Computer simulations of realistic microstructures of coarse constituent particles in a hot-rolled aluminum alloy. Comp. Mater. Sci. 2006, 37, 543–556. [Google Scholar] [CrossRef]
- Engler, O.; Löchte, L.; Hirsch, J. Polycrystal-plasticity simulation of six and eight ears in deep-drawn aluminum cups. Acta Mater. 2007, 55, 5449–5463. [Google Scholar] [CrossRef]
- Abolhasani, A.; Zarei-Hanzaki, A.; Abedi, H.R.; Rokni, M.R. The room temperature mechanical properties of hot rolled 7075 aluminum alloy. Mater. Des. 2012, 34, 631–636. [Google Scholar] [CrossRef]
- Bacroix, B.; Driver, J.H.; Le Gall, R.; Maurice, C.; Penelle, R.; Réglé, H.; Tabourot, L. Recrystallization and texture development in hot rolled 1050 aluminum. Mater. Sci. Forum 2004, 467, 357–362. [Google Scholar]
- Alvi, M.H.; Cheong, S.W.; Suni, J.P.; Weiland, H.; Rollet, A.D. Cube texture in hot-rolled aluminum alloy 1050 (AA1050)—Nucleation and growth behavior. Acta Mater. 2008, 56, 3098–3108. [Google Scholar] [CrossRef]
- Hutchinson, W.B.; Oscarsson, A.; Karlsson, A. Control of microstructure and earing behaviour in aluminium alloy AA3004 hot bands. Mater. Sci. Technol. 1989, 5, 1118–1127. [Google Scholar] [CrossRef]
- Hutchinson, W.B.; Ekström, H.E. Control of annealing texture and earing in non-hardenable aluminium alloys. Mater. Sci. Technol. 1990, 6, 1103–1112. [Google Scholar] [CrossRef]
- Engler, O. Control of texture and earing in aluminium alloy AA 3105 sheet for packaging applications. Mater. Sci. Eng. A. 2012, 538, 69–80. [Google Scholar] [CrossRef]
- Yoon, J.W.; Barlat, F.; Dick, R.E.; Karabin, M.E. Prediction of six or eight ears in a drawn cup based on a new anisotropic yield function. Int. J. Plast. 2006, 22, 174–193. [Google Scholar] [CrossRef]
- Lelotte, T.; Duchene, L.; Habraken, A.M. Fast method to predict an earing profile based on Lankford’s coefficients and yield locus. In Proceedings of the III European Conference on Computational Mechanics Solids, Structures and Coupled Problems in Engineering, Lisbon, Portugal, 5–8 June 2006; p. 540. [Google Scholar]
Figure 1.
An example for the true stress–true strain measured data and the fitted curve. Direction: 22.5°.
Figure 1.
An example for the true stress–true strain measured data and the fitted curve. Direction: 22.5°.

Figure 2.
Fitted true stress–true strain curves for different directions.

Figure 3.
The variation of r-values versus strain energy density for the uniform elongation regime of tensile test specimens cut in different directions.
Figure 3.
The variation of r-values versus strain energy density for the uniform elongation regime of tensile test specimens cut in different directions.

Figure 4.
Deep drawn cup parameters for the average earing calculation [6].
Figure 4.
Deep drawn cup parameters for the average earing calculation [6].

Figure 5.
Grain structure on longitudinal sections. (a) Sample from the side and (b) from the center of the hot-rolled sheet.
Figure 5.
Grain structure on longitudinal sections. (a) Sample from the side and (b) from the center of the hot-rolled sheet.

Figure 6.
Recalculated full {200} pole figures taken from different depths. (a) Sample from the side and (b) from the center of the hot-rolled sheet.
Figure 6.
Recalculated full {200} pole figures taken from different depths. (a) Sample from the side and (b) from the center of the hot-rolled sheet.

Figure 7.
Earing profiles predicted from the Lankford values of tensile tests and from XRD texture measurements taken from different depths. (a) Sample from the side and (b) from the center of the hot-rolled sheet.
Figure 7.
Earing profiles predicted from the Lankford values of tensile tests and from XRD texture measurements taken from different depths. (a) Sample from the side and (b) from the center of the hot-rolled sheet.


Publisher’s Note: MDPI stays neutral with regard to jurisdictional claims in published maps and institutional affiliations. |
© 2021 by the authors. Licensee MDPI, Basel, Switzerland. This article is an open access article distributed under the terms and conditions of the Creative Commons Attribution (CC BY) license (http://creativecommons.org/licenses/by/4.0/).
Share and Cite
MDPI and ACS Style
Hlavacs, A.; Szucs, M.; Mertinger, V.; Benke, M. Prediction of Earing of Hot-Rolled Al Sheets from Pole Figures. Metals 2021, 11, 99. https://doi.org/10.3390/met11010099
AMA Style
Hlavacs A, Szucs M, Mertinger V, Benke M. Prediction of Earing of Hot-Rolled Al Sheets from Pole Figures. Metals. 2021; 11(1):99. https://doi.org/10.3390/met11010099
Chicago/Turabian StyleHlavacs, Adrienn, Mate Szucs, Valeria Mertinger, and Marton Benke. 2021. "Prediction of Earing of Hot-Rolled Al Sheets from Pole Figures" Metals 11, no. 1: 99. https://doi.org/10.3390/met11010099
Note that from the first issue of 2016, this journal uses article numbers instead of page numbers. See further details here.