Effect of Ultrasonic Surface Rolling Treatment on Corrosion Behavior of Alloy 690
by
 , and
, and
Jiang Liu
1, 
Junbiao Liu
1,
Xuehui Zhang
1,*,
Tahir Ahmad
2,
Tongxiang Liang
1,*,
Longfei Zeng
1,
Chunming Wang
1 and
Bin Yang
1,* 1
Faculty of Materials Metallurgy and Chemistry, Jiangxi University of Science and Technology, Ganzhou 341000, China
2
Department of Metallurgy and Materials Engineering, CEET, University of the Punjab, Lahore 54500, Pakistan
*
Authors to whom correspondence should be addressed.
Metals 2020, 10(7), 917; https://doi.org/10.3390/met10070917
Submission received: 17 June 2020
/
Revised: 4 July 2020
/
Accepted: 7 July 2020
/
Published: 9 July 2020
Abstract
:The nanograins (NG) on the top surface layer of alloy 690 were successfully prepared by ultrasonic surface rolling treatment (USRT). The average grain size of NG alloy 690 was 55 nm, and the thickness of the NG surface layer was about 1 μm. Meanwhile, the surface roughness was significantly reduced after surface nanocrystalliztion. The corrosion behavior of alloy 690 before and after USRT was studied in a secondary side environment containing chloride. Electrochemical corrosion experiments demonstrated that the passive film generated by USRT was denser than that formed on coarse-grained (CG) alloy 690. Pitting corrosion was prone to occur in grain boundaries of CG alloy 690, and the pits on the surface of NG alloy 690 were smaller than those generated on CG alloy 690 after 1000 h of an immersion experiment.
1. Introduction
Alloy 690 is currently the mainstream material of heat transfer tubes for pressurized water reactor (PWR) plants due to its good corrosion resistance in a water environment with high temperature and a high-pressure environment [1,2,3]. The stress corrosion cracking (SCC) resistance of alloy 690 is superior than that of austenitic stainless steel and alloy 600 [4,5]. However, the occurrence of SCC is unavoidable with its long-term service in PWR [6]. A better explanation of the corrosion behavior of alloy 690, especially the SCC behavior, is required to evaluate and confirm. Moreover, the pitting corrosion is prone to occur in alkaline environments containing chloride [7], which include the aqueous environments on the secondary side of PWR. Therefore, increasing the corrosion resistance of this alloy on the secondary side of PWR containing chloride solutions is an urgent issue.
The effect of grain refinement on the corrosion resistance of metals was extensively investigated. Grain refinement significantly improves the corrosion resistance of the 304 stainless steel, Cu-0.4%Mg alloy and alloy TC11 [8,9,10]. Lv et al. [11] found that fine-grains can improve the corrosion resistance of alloy 690 due to the enrichment of Cr2O3 in the passive film. Cr2O3 is formed more easily on the surface of alloy 690 in borate buffer solution since Cr diffusion channels are provided by grain refinement [12]. The formation of a more dense passive film is also attributed to the greater number of nucleation sites of nanograins in alloy 690 [13]. Ultrasonic surface rolling treatment (USRT) is currently the popular method of surface nanocrystallization (SNC) for the fabrication of nanocrystals. After the USRT process, the surface performance, especially the hardness and corrosion behavior of many metals, was found to be significantly enhanced [14,15,16]. A lower surface roughness and a nanostructured layer can be also obtained after USRT [17]. Although the effects of USRT enhancing the corrosion of alloy 690 have been extensively investigated, no useful studies have been performed to define the relationship between USRT and an alkaline environment containing chloride on the secondary side of PWR.
In this paper, the surface of nickel-based alloy 690 was processed by USRT. The effect of chloride on the corrosion behavior of alloy 690 before and after nanocrystallization on the alkaline secondary side environment of PWR was studied in detail.
2. Materials and Experimental Procedures
2.1. Samples Preparation
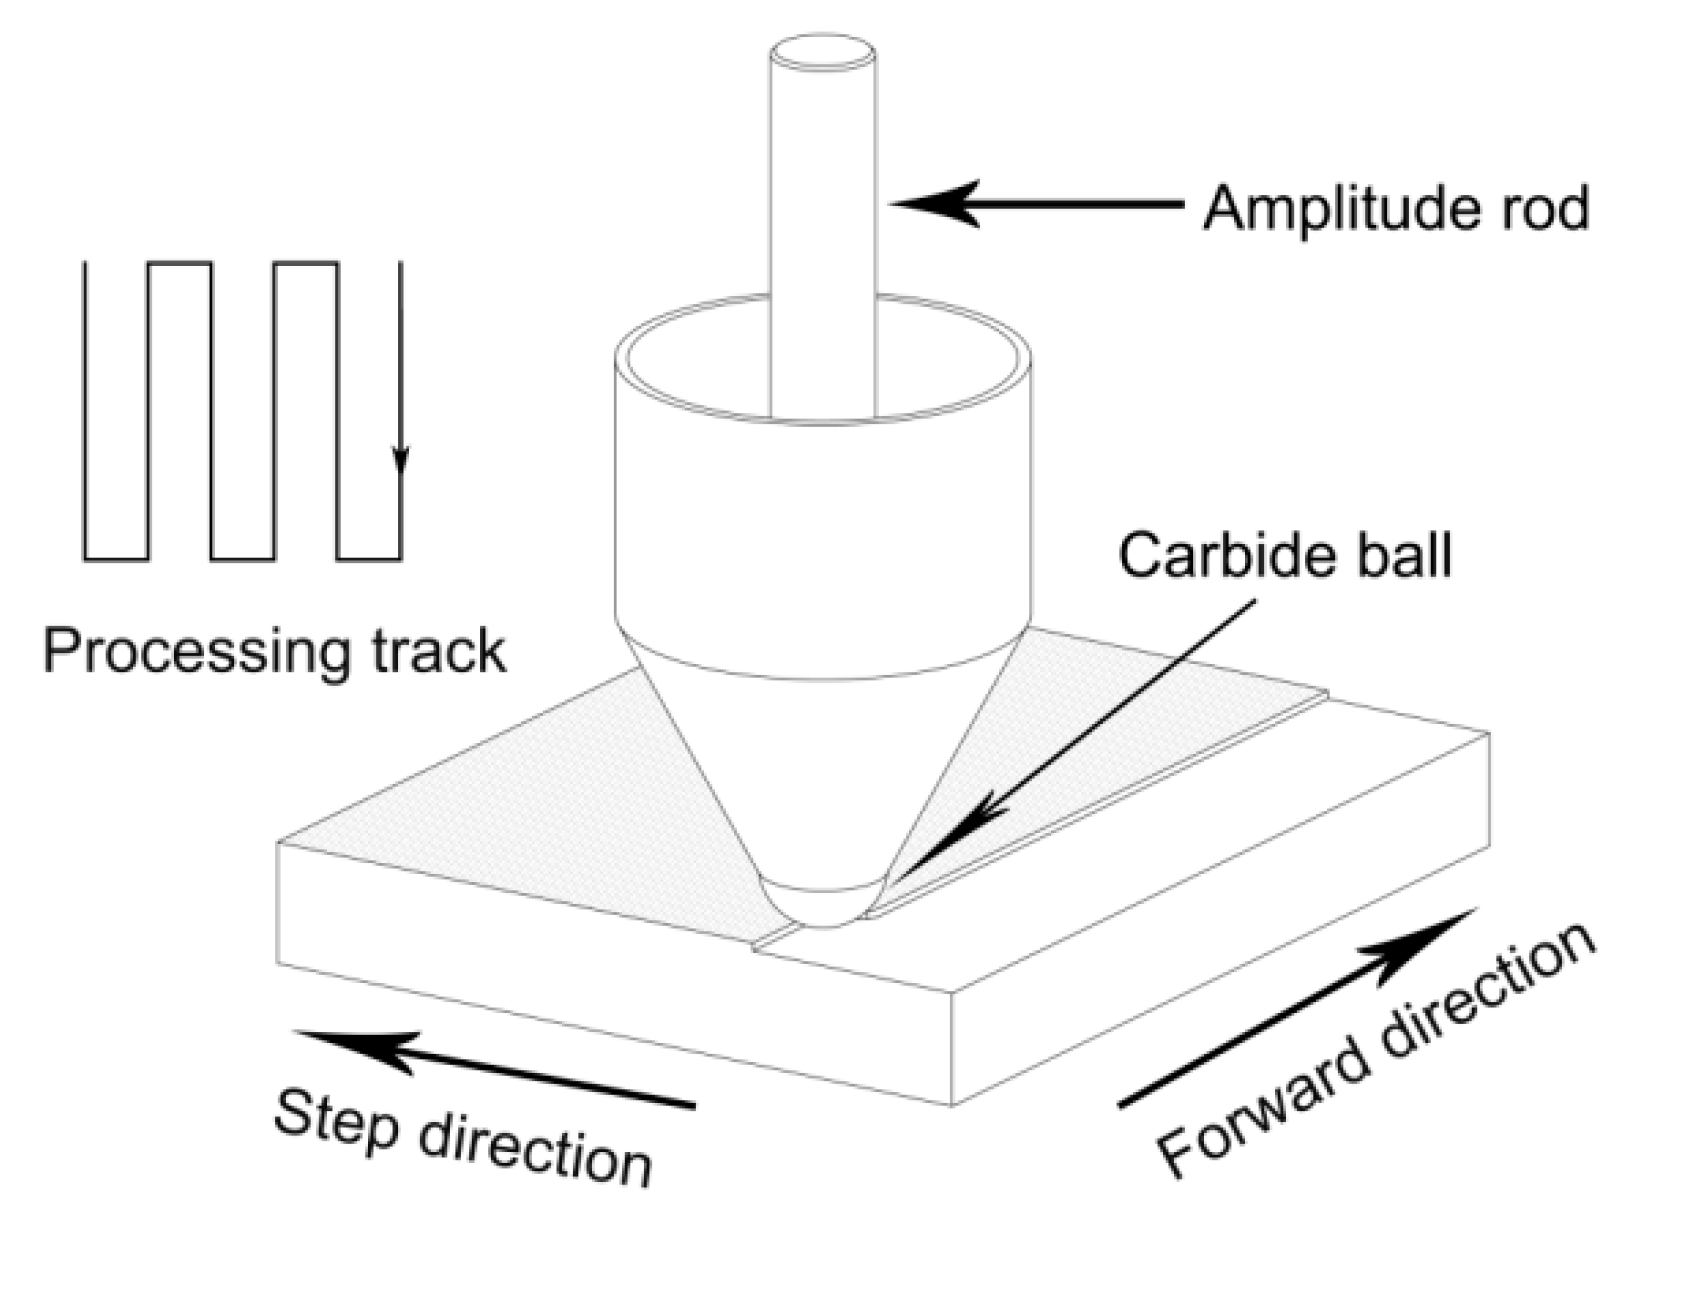
The chemical composition of alloy 690 used in this study is shown in Table 1. The alloy was first annealed at 1100 °C for 1 h and then water quenched rapidly. After that, it was annealed at 715 °C for 15 h to obtain Cr-carbide precipitation continuously distributed between the crystals. The samples were cut into 10 × 10 mm2 pieces and then sanded with sandpaper of #320, followed by USRT. A schematic illustration of the machining process is shown in Figure 1. The high-frequency vibration and pressure introduced by the amplitude rod were transmitted to the surface of alloy 690 through the carbide ball, and the pre-applied reduction was set by the machine, causing significant deformation. The vibration at a certain frequency can flatten the surface of the alloy 690 that undergoes severe plastic deformation, thereby greatly reducing the surface roughness after processing. The process parameters of USRT were as follows: the material of carbide ball was WC with a diameter of 20 mm, the ultrasonic frequency was 28 kHz, and under the pressure of 0.2 MPa, the preloading depth was 0.2 mm, the step length was 0.08 mm, and the velocity in the forward direction was 2 m/min.
2.2. Nanostructure Characterization
The characterization of surface roughness before and after the nanocrystallization of alloy 690 was performed by an atomic force microscope (AFM, MFP-3D-BIO, Oxford, UK). An X-ray diffractometer (XRD, X’ Pert PRO MPD, PANalytical, Almelo, Netherlands) was used to observe the changes in the diffraction peak before and after USRT using Cu Kα1 radiation. Further, the cross-sectional morphology of this alloy was investigated using a transmission electron microscope (TEM, Fei Tecnal G2S-TWIN, FEI, Hillsboro, OR, USA). The cross-section of each sample was prepared by using a focused ion beam (FIB, Fei Helios 600, FEI, Hillsboro, OR, USA) system.
2.3. Electrochemical Experiment
The original samples were polished with #600, #1000, #2000, and #3000 sandpaper and then polished with alumina polishing paste to eliminate the effect of roughness on corrosion performance. The samples of this alloy were cut into 10 × 10 × 40 mm3 pieces and then encapsulated with resin to expose only one side of 10 × 10 mm2. Electrical contact was made on the back of the sample with a copper wire. An electrochemical work station (CHI760E, CH Instruments, Shanghai, China) was used to study the electrochemical corrosion performance of alloy 690 before and after treatment. To simulate the alkaline secondary side environment, the solution composition was 8 mg/L N2H4 and 1M NaCl with ethanolamine to match the pH to 9.8. Ethanolamine was used to maintain an alkaline environment, and N2H4 was used as a reducing agent to keep the pH of PWR stable. Saturated calomel served as a reference electrode, and a platinum plate of 10 × 10 × 0.1 mm3 served as a counter electrode in electrochemical corrosion experiments. The run time of the open circuit potential was 3600 s after using cathodic polarization at a potential of −1.2 V for 200 s. The frequency range of electrochemical impedance spectroscopy (EIS) was 105 Hz to 10−2 Hz with an amplitude signal of 5 mV. The potentiodynamic polarization curves were carried out by scanning from −0.6 V to 0 V with a scanning rate of 5 mV/s.
2.4. Immersion Experiment
The samples of alloy 690 were immersed in a sealed autoclave made of Hastelloy for 1000 h. The solution composition was the same as in the electrochemical experiment. The experimental temperature was 25 °C. The surface morphology after immersion was observed by using a scanning electron microscope (SEM, Fei MLA650F, FEI, Hillsboro, OR, USA). The composition on the surface of coarse-grained (CG) and NG alloy 690 after immersion was tested by X-ray photoelectron spectroscopy (XPS, ESCALAB 250Xi, Thermo Fisher, Waltham, MA, USA). A monochromatic aluminum target was used in the XPS test with an energy of 1486.6 eV. The experimental data processing software used was Avantage v5.979 and the C 1 s peak was corrected to 284.8 eV.
3. Results and Discussion
3.1. Nanocrystalline Characterization
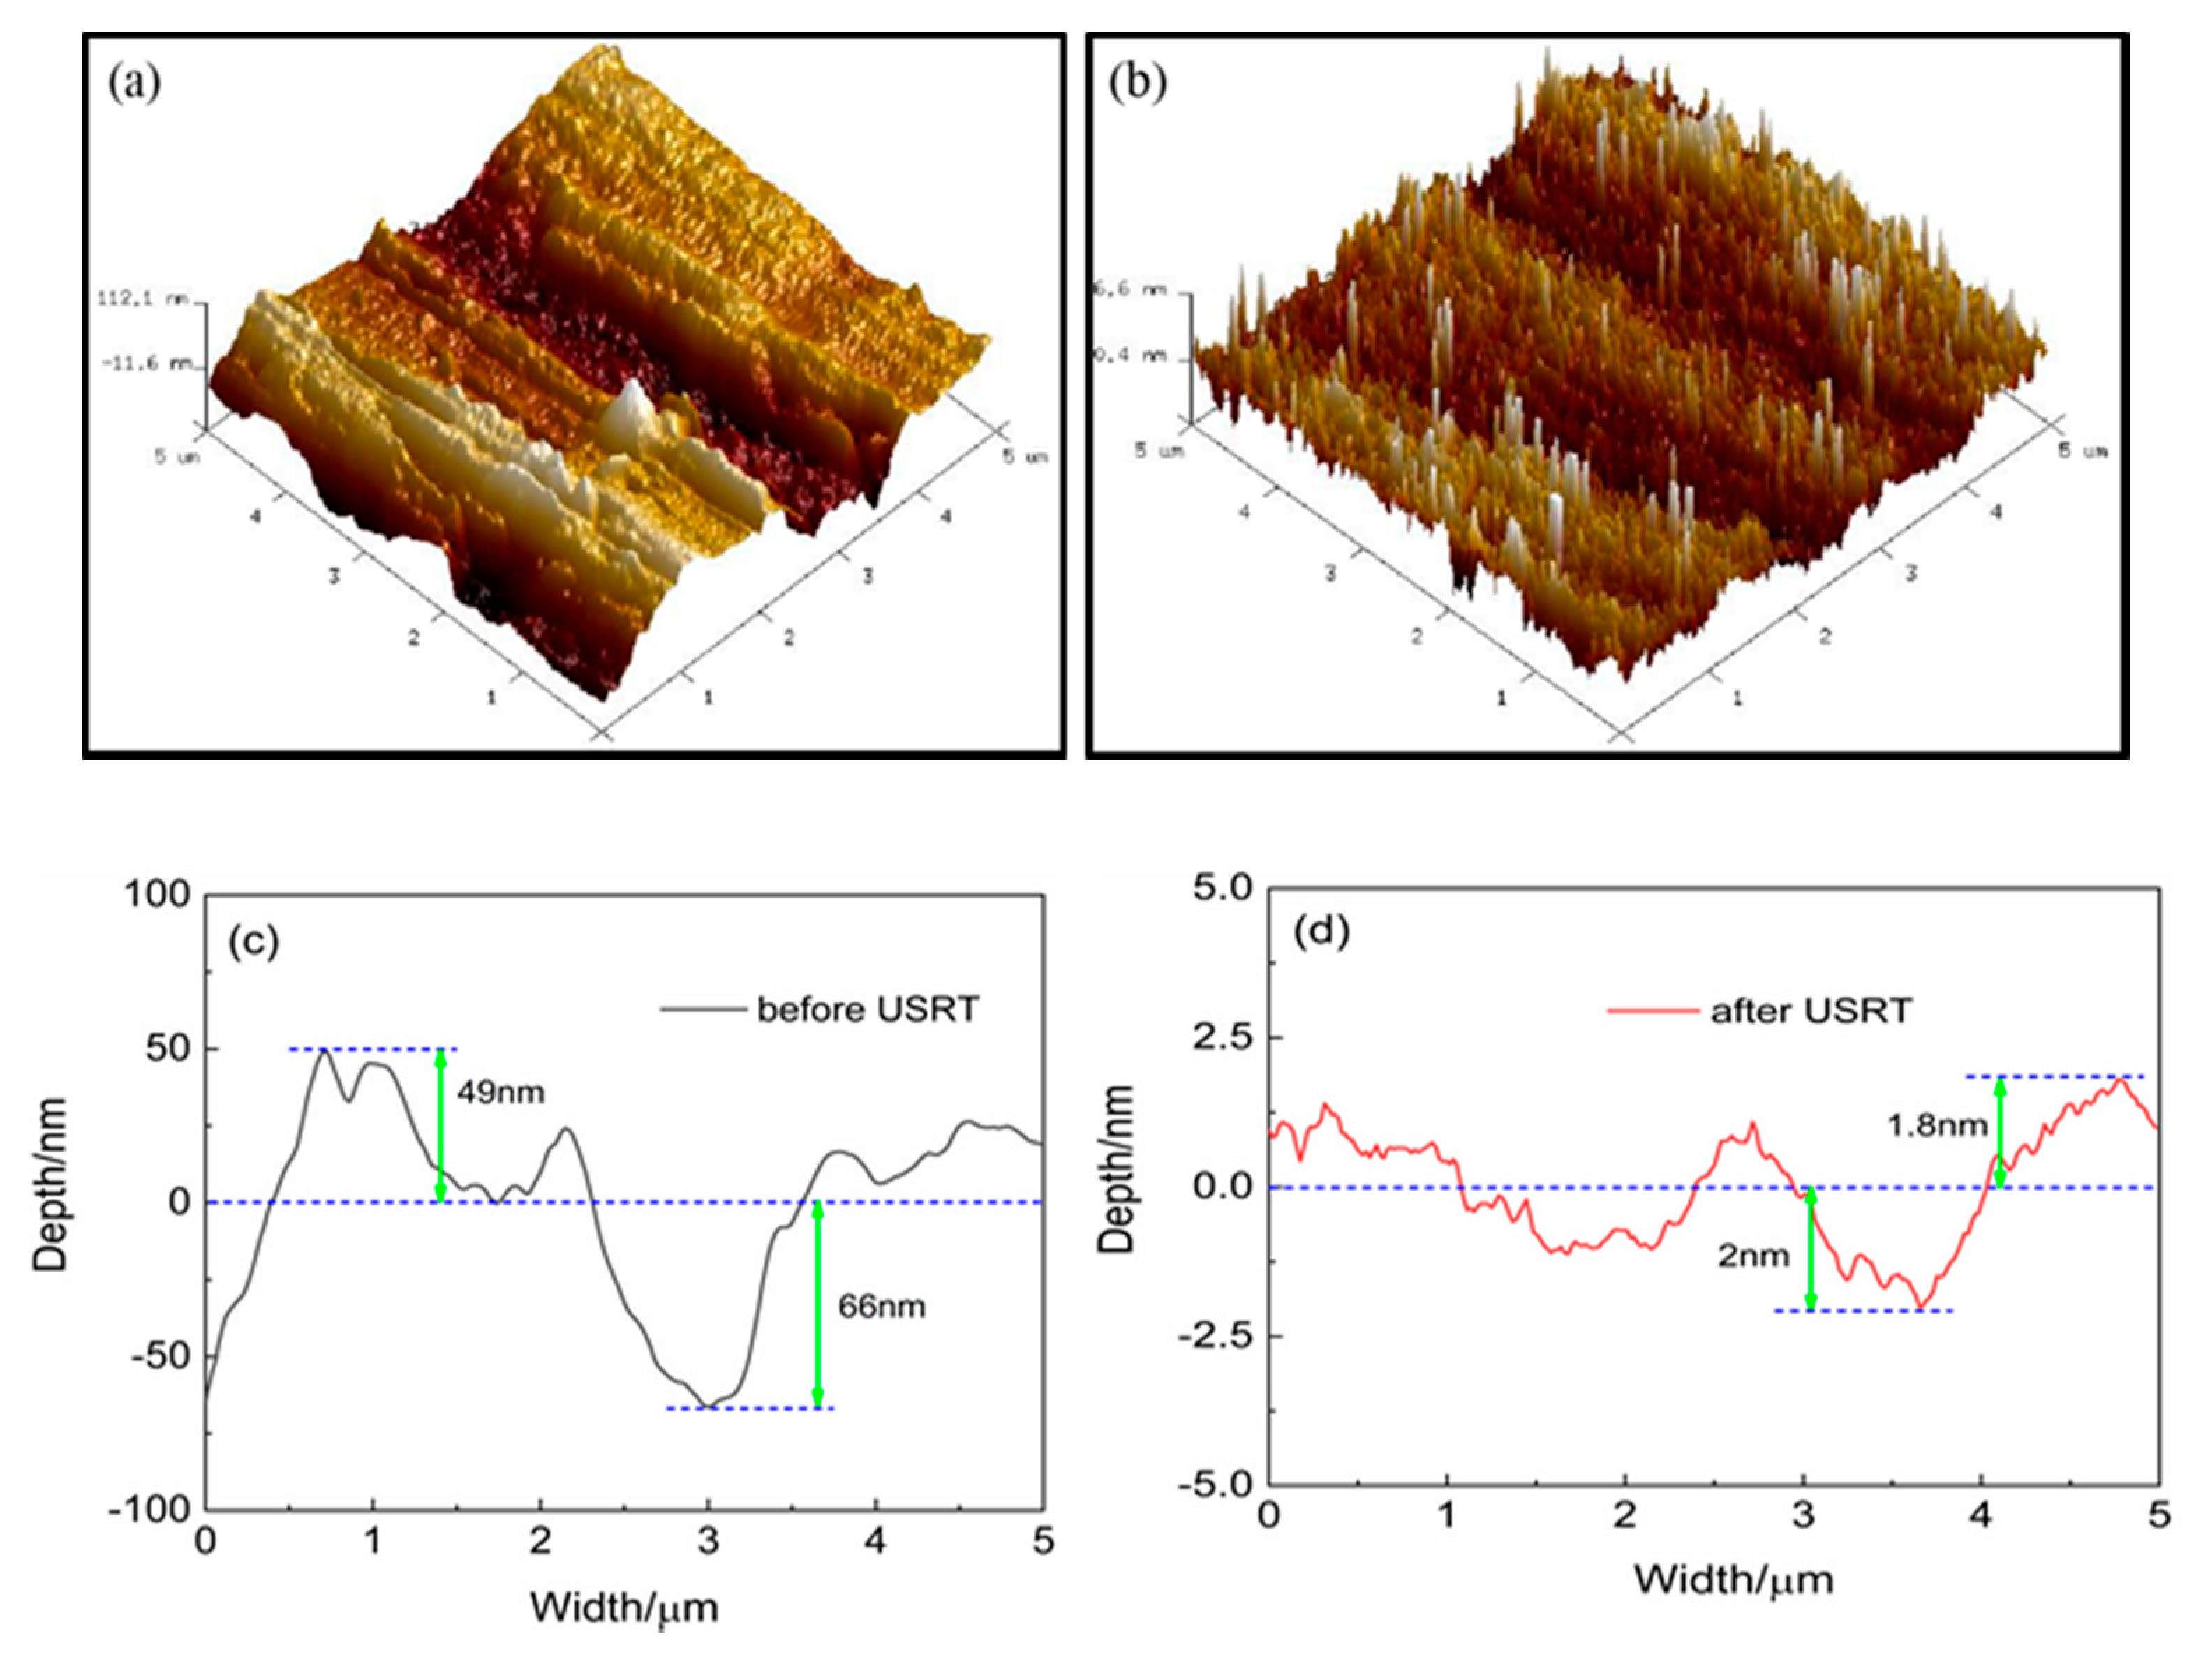
Figure 2 shows the surface morphology of alloy 690 before and after USRT. The average surface roughness of the original sample was about 30 nm (Figure 2a), and a significant reduction occurred after processing with a surface roughness of 1.4 nm (Figure 2b). The two-dimensional section clearly illustrates a significant flattening effect after USRT, as shown in Figure 2d, when compared with the original sample shown in Figure 2c. The gully on the surface of the original sample is filled due to the inflow of material from the protrusion, leading to a considerable reduction in surface roughness after USRT.
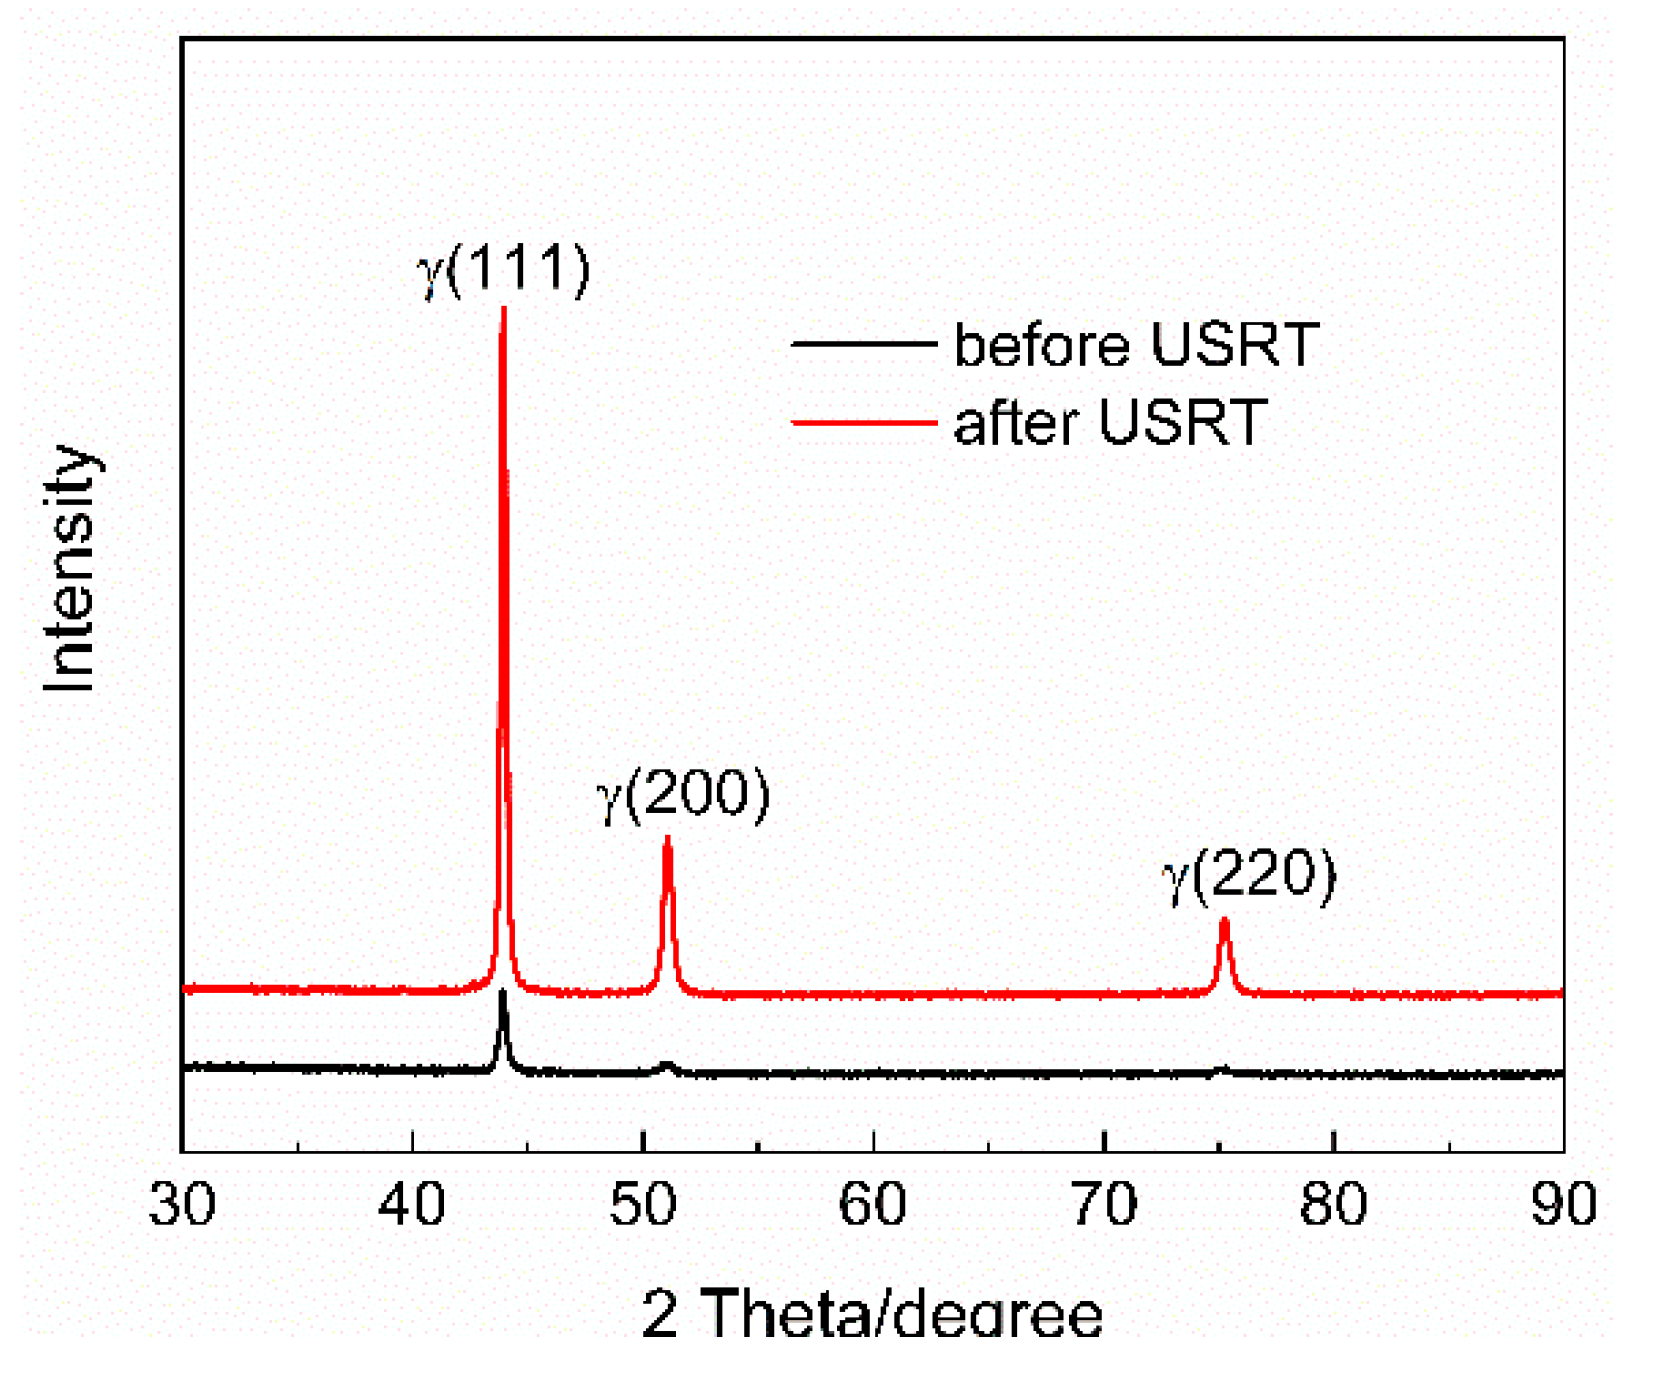
The differences in XRD diffraction peaks before and after surface nanocrystallization are shown in Figure 3. It is observed that phase transformation did not occur, and the diffraction peaks exhibited significant broadening after USRT. It has been reported that the broadening of the diffraction peak is caused by microscopic stress and grain refinement [18]. The average grain size of alloy 690 after USRT was about 28 nm, which was deduced from the broadening diffraction peak using the Scherrer Equation [19]. The right shift of the diffraction peak indicates the generation of compressive stress after USRT.
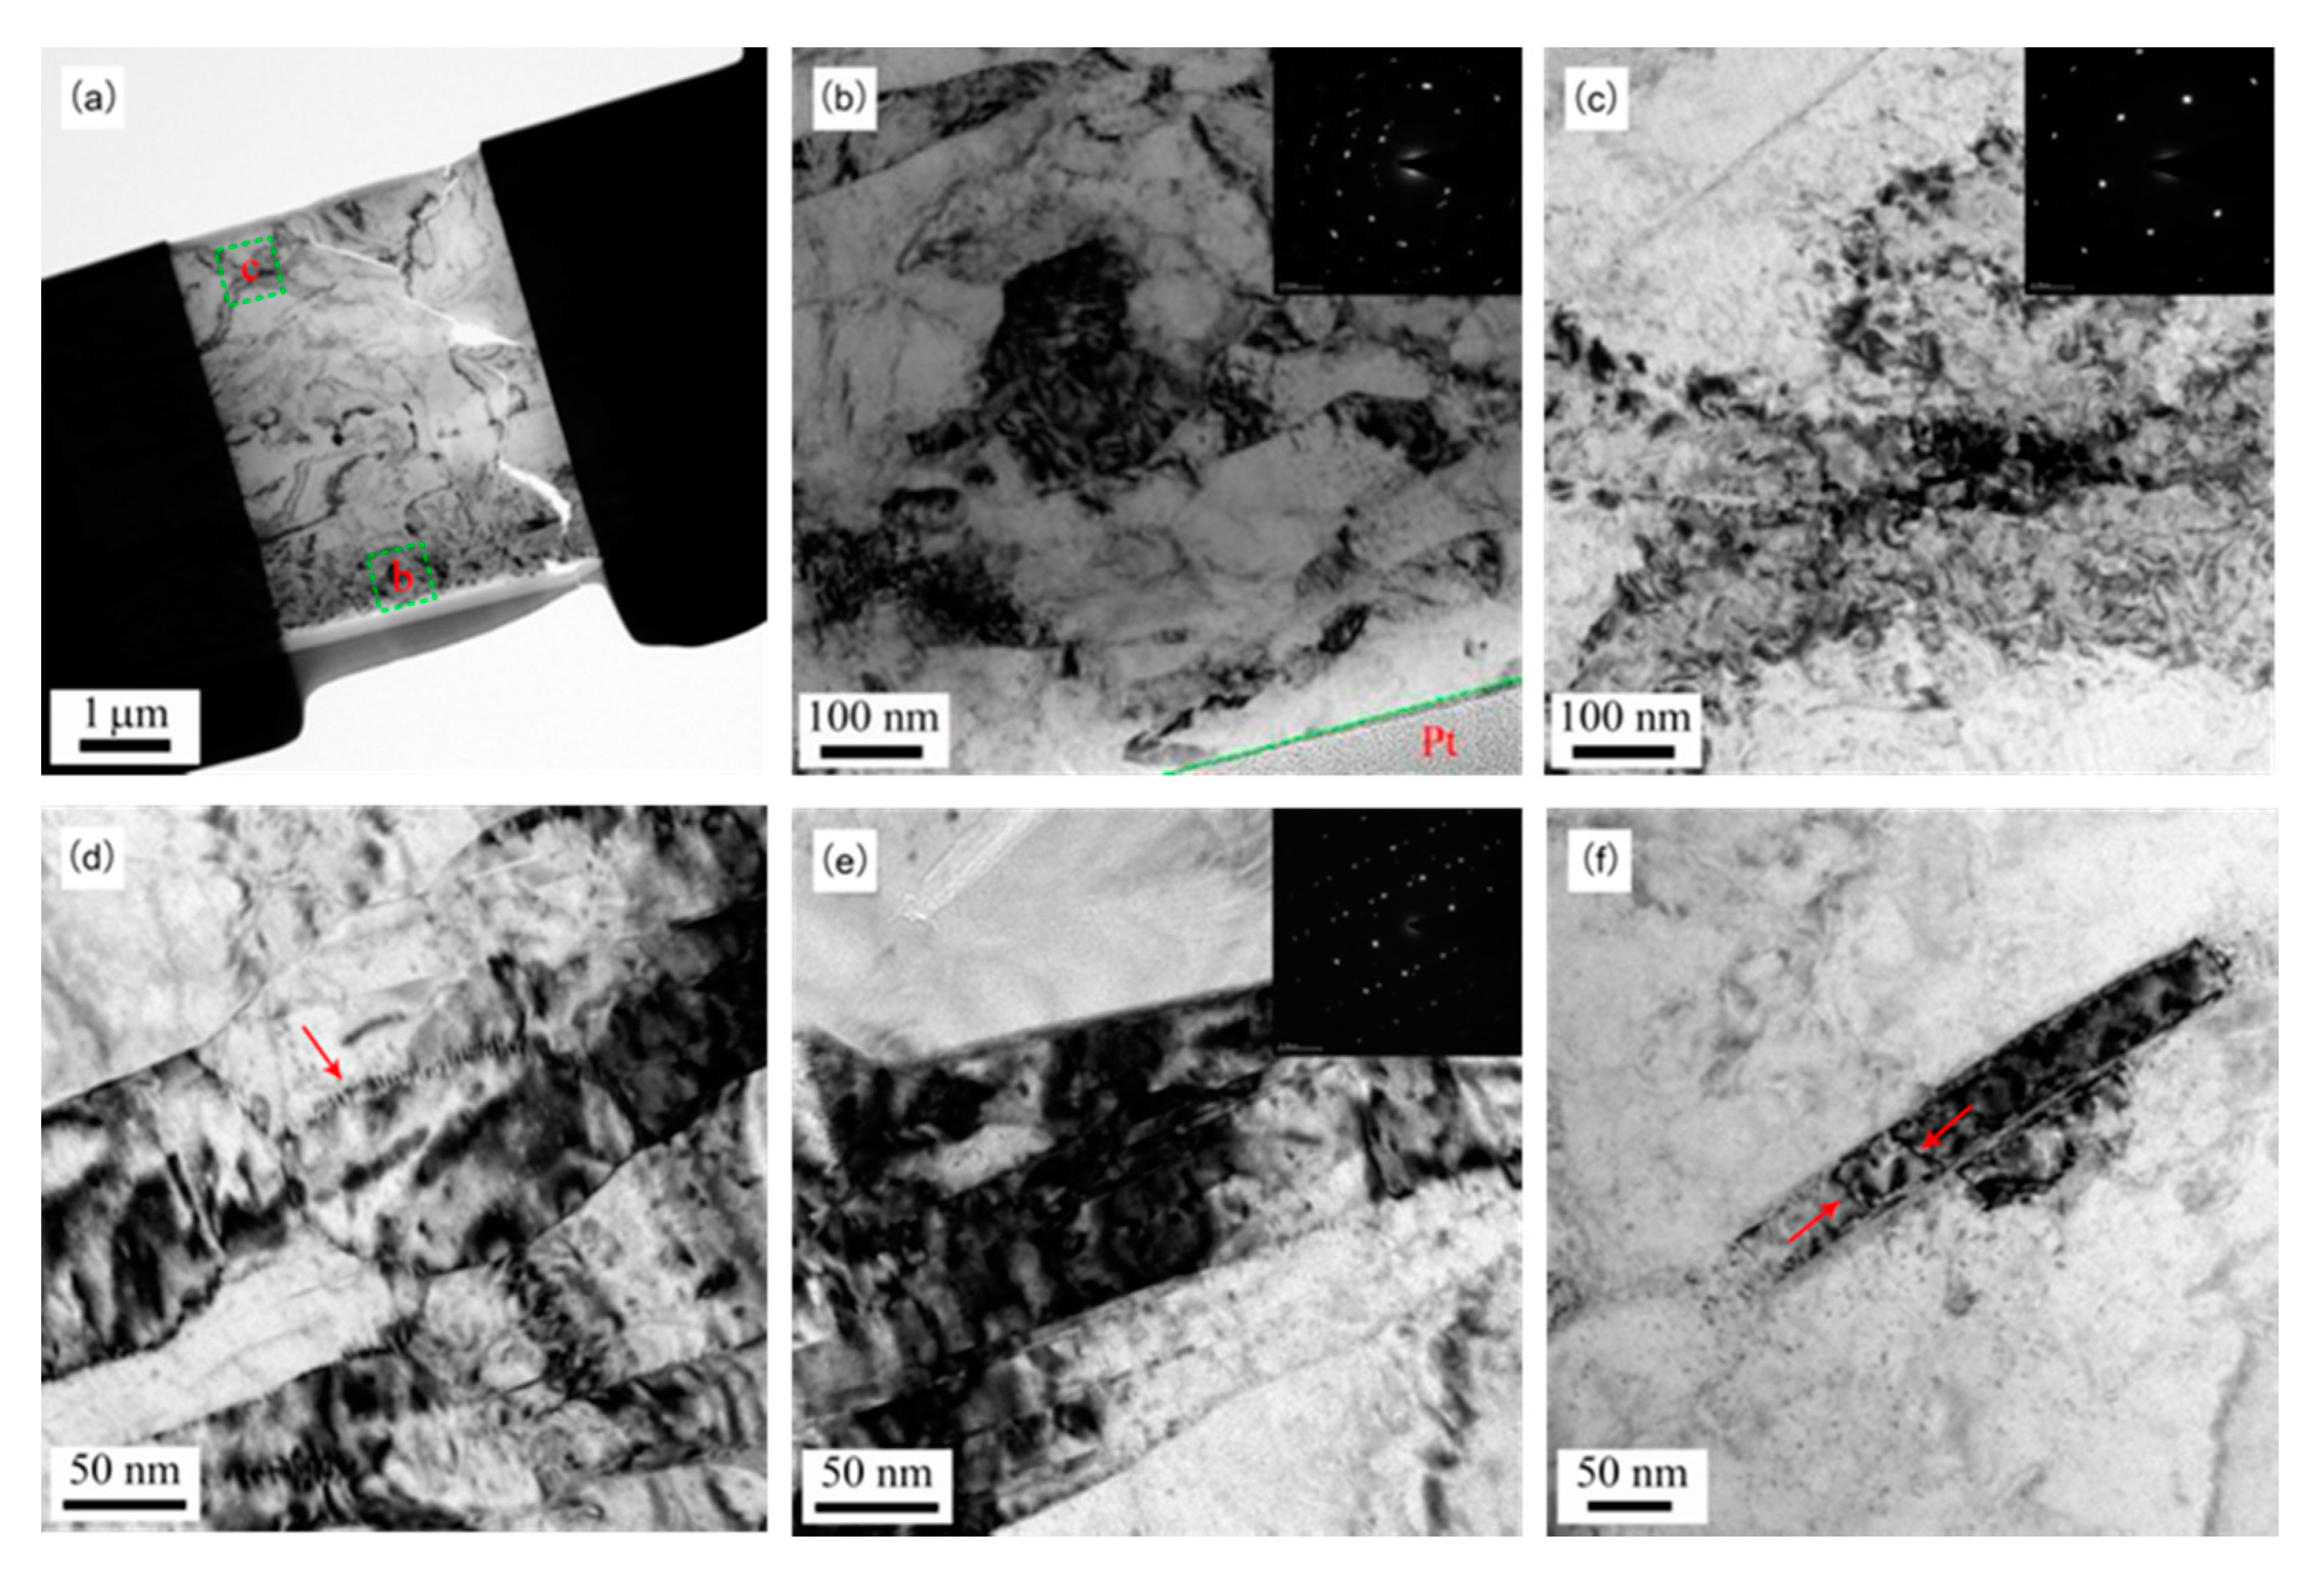
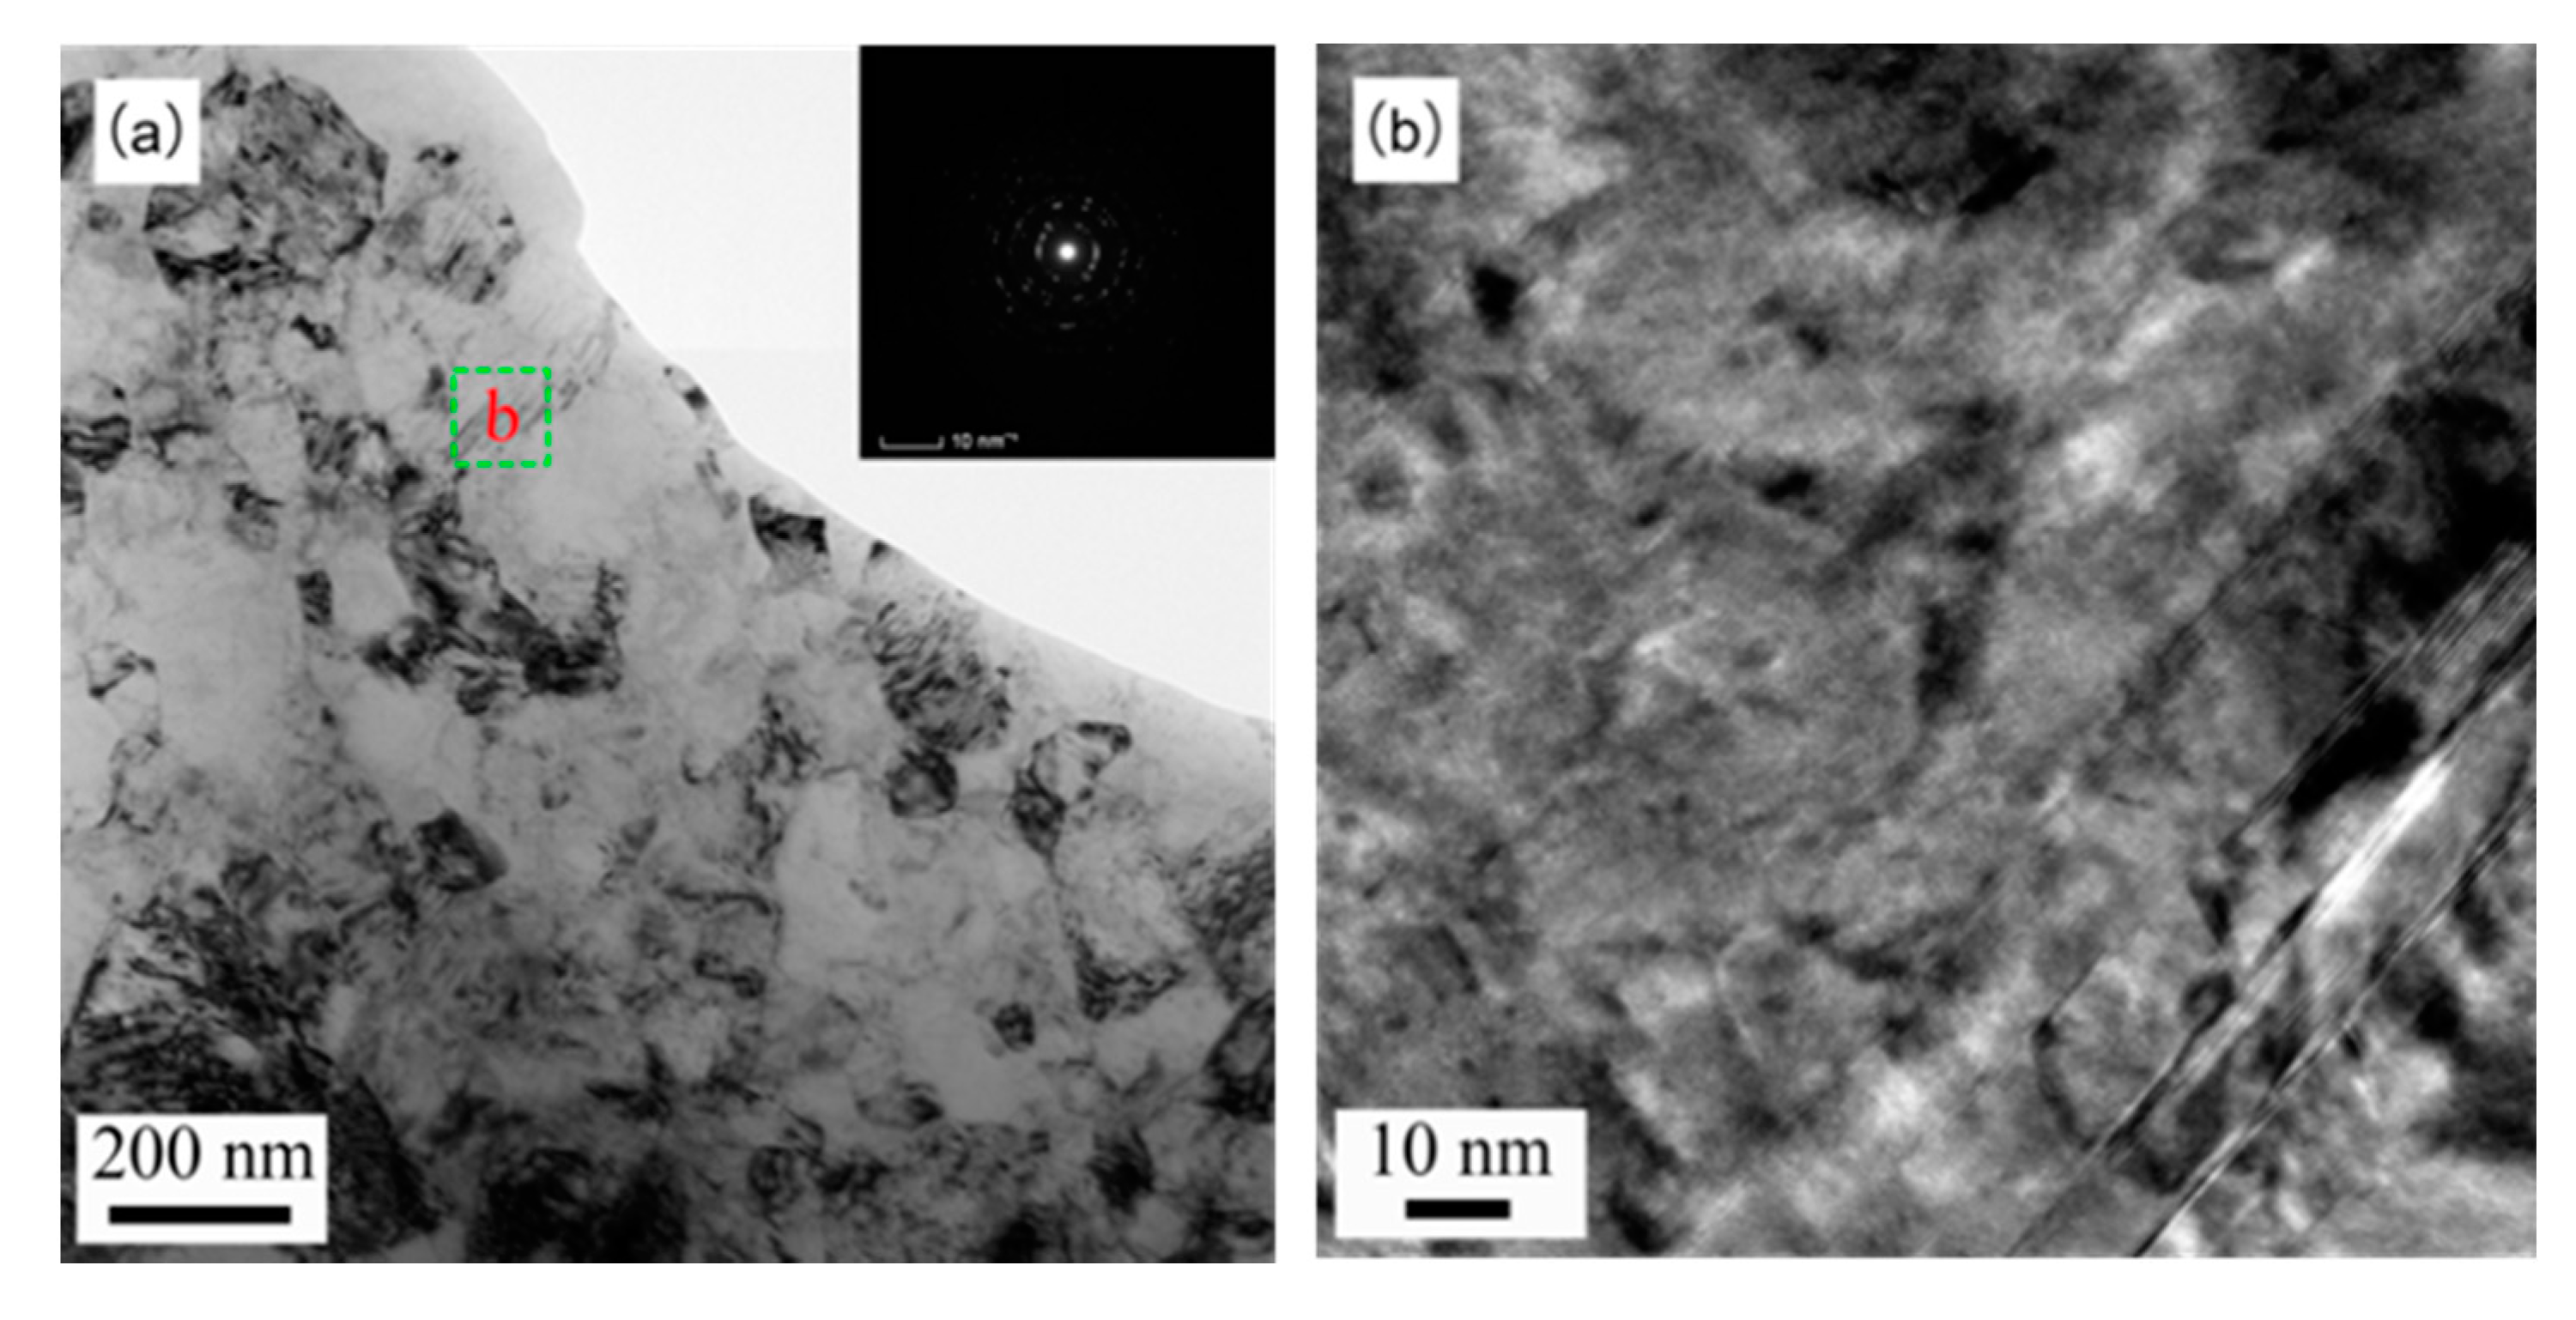
The cross-sectional morphology of alloy 690 after USRT was obtained using FIB and TEM, as shown in Figure 4. An ultra-thin cut of about 5-μm thick was made in the depth direction using a FIB. A gradient refinement NG layer of less than 100 nm was clearly observed in the depth range of 1 μm (Figure 4a). Nanograins of less than 100 nm formed at the outermost layer, as shown in Figure 4b, which is a magnified view of Figure 4a. The unoriented equiaxed grains were produced after USRT, which was confirmed by using selected area electron diffraction, as shown in the inset of Figure 4b. A large amount of dislocation entanglement occurred at a depth of 5 μm, as shown in Figure 4c. As observed in Figure 4d, a large number of dislocations were activated and hindered near the grain boundary due to the blocking effect of the grain boundary with increasing stress. When the distortion caused by dislocation accumulation was large enough, the twin was activated and formed, as shown in Figure 4e. The evolution of single-system twins to multi-system twins occurred, and more fine grains were produced when the strain continued to increase, as shown in Figure 4f. The surface topography is shown in Figure 5. An average grain size of 55 nm was obtained from Figure 5a, and the thinner twins layer still existed, as shown in Figure 5b.
3.2. Electrochemical Corrosion Results
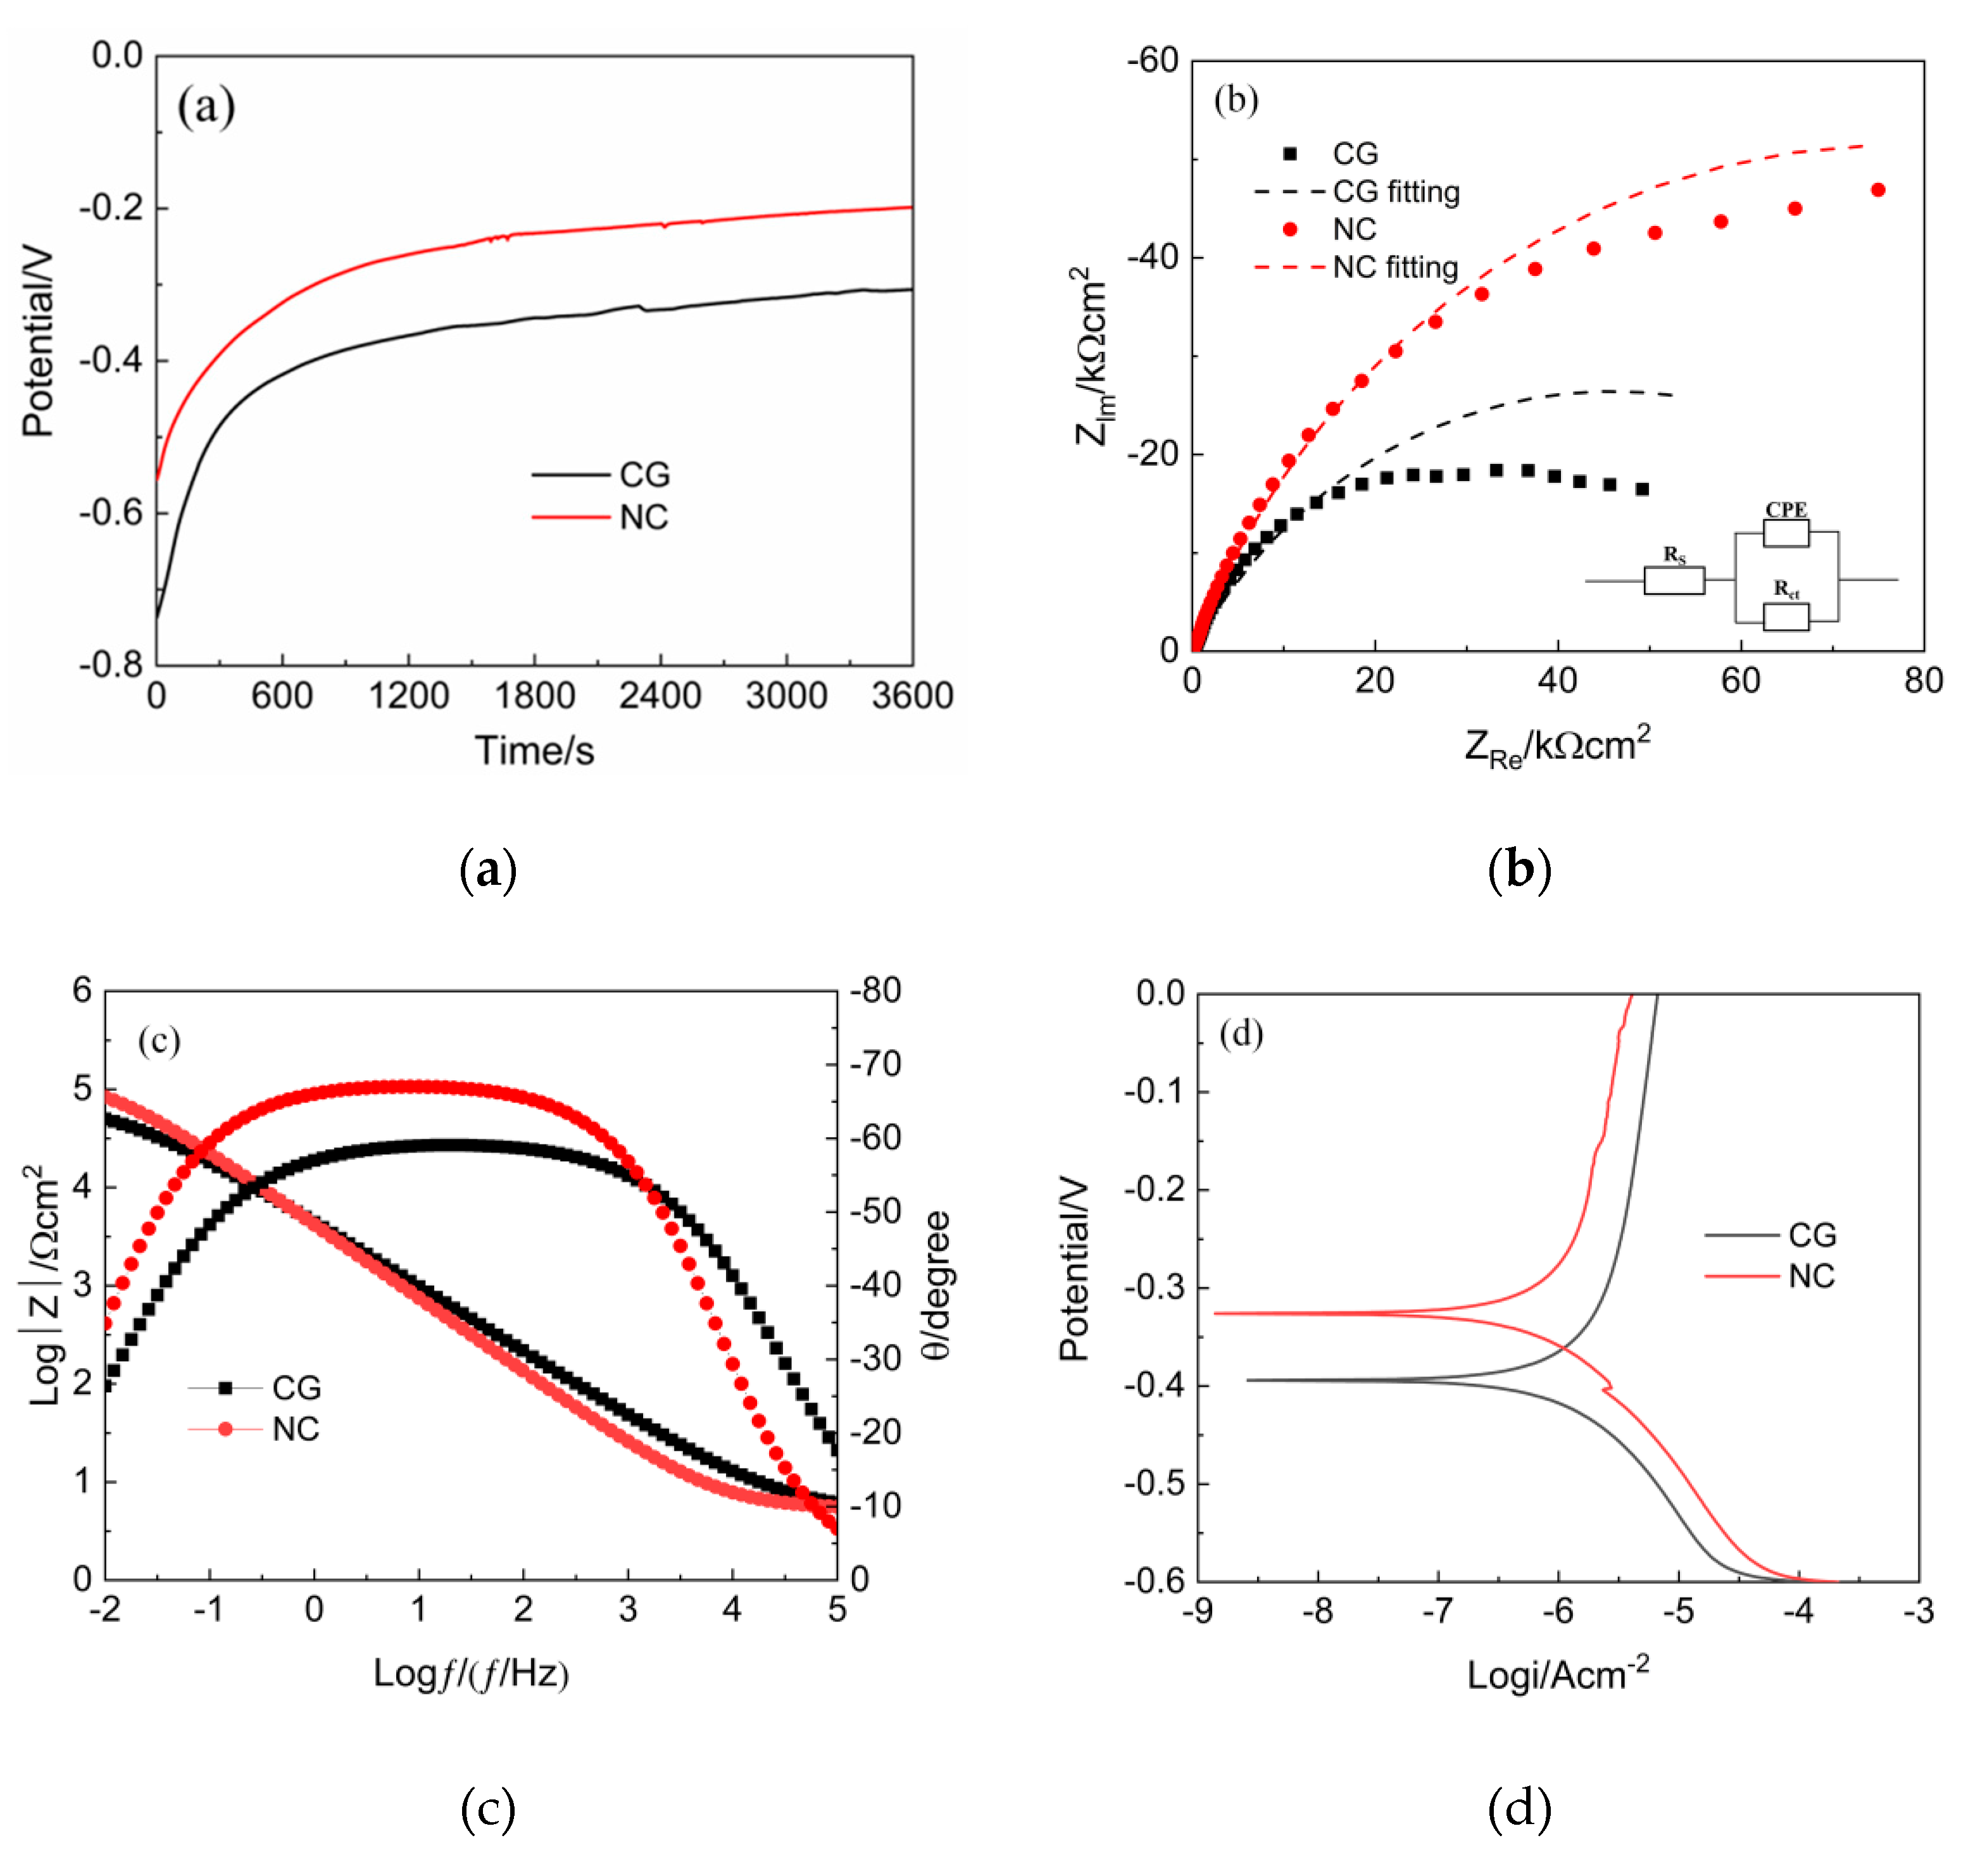
Figure 6a shows a plot of the open circuit potential (OCP) versus time for the CG and NG alloy 690. The higher the positive value of OCP is, the better the passivation effect, demonstrating that a more complete and dense passive film can be generated. It was observed that the OCP shifted sharply to more positive values for both CG and NG samples within 600 s of running time, indicating the formation of passive films. The slow shift of OCP after 600 s indicated that the passive films formed on the surface of both were unstable due to the corrosive attack of chloride ions. Some peaks were present on the surface of CG and NG alloy 690, proving that pitting corrosion is the main type of corrosion that occurs in a chloride-containing solution [20]. The higher positive open circuit potential of NG sample indicates a lower corrosion driving force and better corrosion resistance than CG samples [21]. The increase in the diameter of the capacitive reactance arc in a Nyquist diagram indicates that the protective effect of the formed passive film improved [22].
The NG alloy 690 had a significantly larger capacitive diameter than the CG alloy 690, indicating that the passive film formed on the surface was more stable, as shown in Figure 6b. The equivalent circuit diagram fitting from EIS is also shown where Rs, CPE, and Rct represent the solution resistance, electric double layer capacitor, and the charge transfer resistance, respectively. The relevant values obtained by fitting are listed in Table 2. The Rs values of alloy 690 before and after nanocrystallization were almost identical, indicating that the solution components of the two tests were basically identical. The impedance of CPE can be described as the following expression [23]:
YO and jw are the admittance constant, the imaginary corner frequency, and the dispersion index, respectively. n is a dimensionless parameter, indicating the degree to which the electric double layer capacitance deviates from the ideal capacitance. The value of n is 0.7520 for NG and 0.6651 for CG, which indicates a better dispersion effect of NG alloy 690. The significant increase in the charge transfer resistance of alloy 690 after USRT reduces the corrosion rate with OH− and Cl− corrosion in the secondary side environment.
The Bode plots in Figure 6c show the relationship between frequency, impedance, and phase angle. It can be observed that there was only one time constant for both CG and NC alloy 690. Figure 6d shows the potentiodynamic polarization curves of alloy 690 before and after USRT; the corresponding electrochemical parameters are shown in Table 3. Ecor, Icor, Rp, βa, and βc are the corrosion potential, corrosion current density, polarization resistance, anodic Tafel slope, and cathodic Tafel slope, respectively. The positive increased corrosion potential and the decreasing corrosion current density in NG alloy 690 indicate that its corrosion resistance is better than that of CG.
3.3. Immersion Results
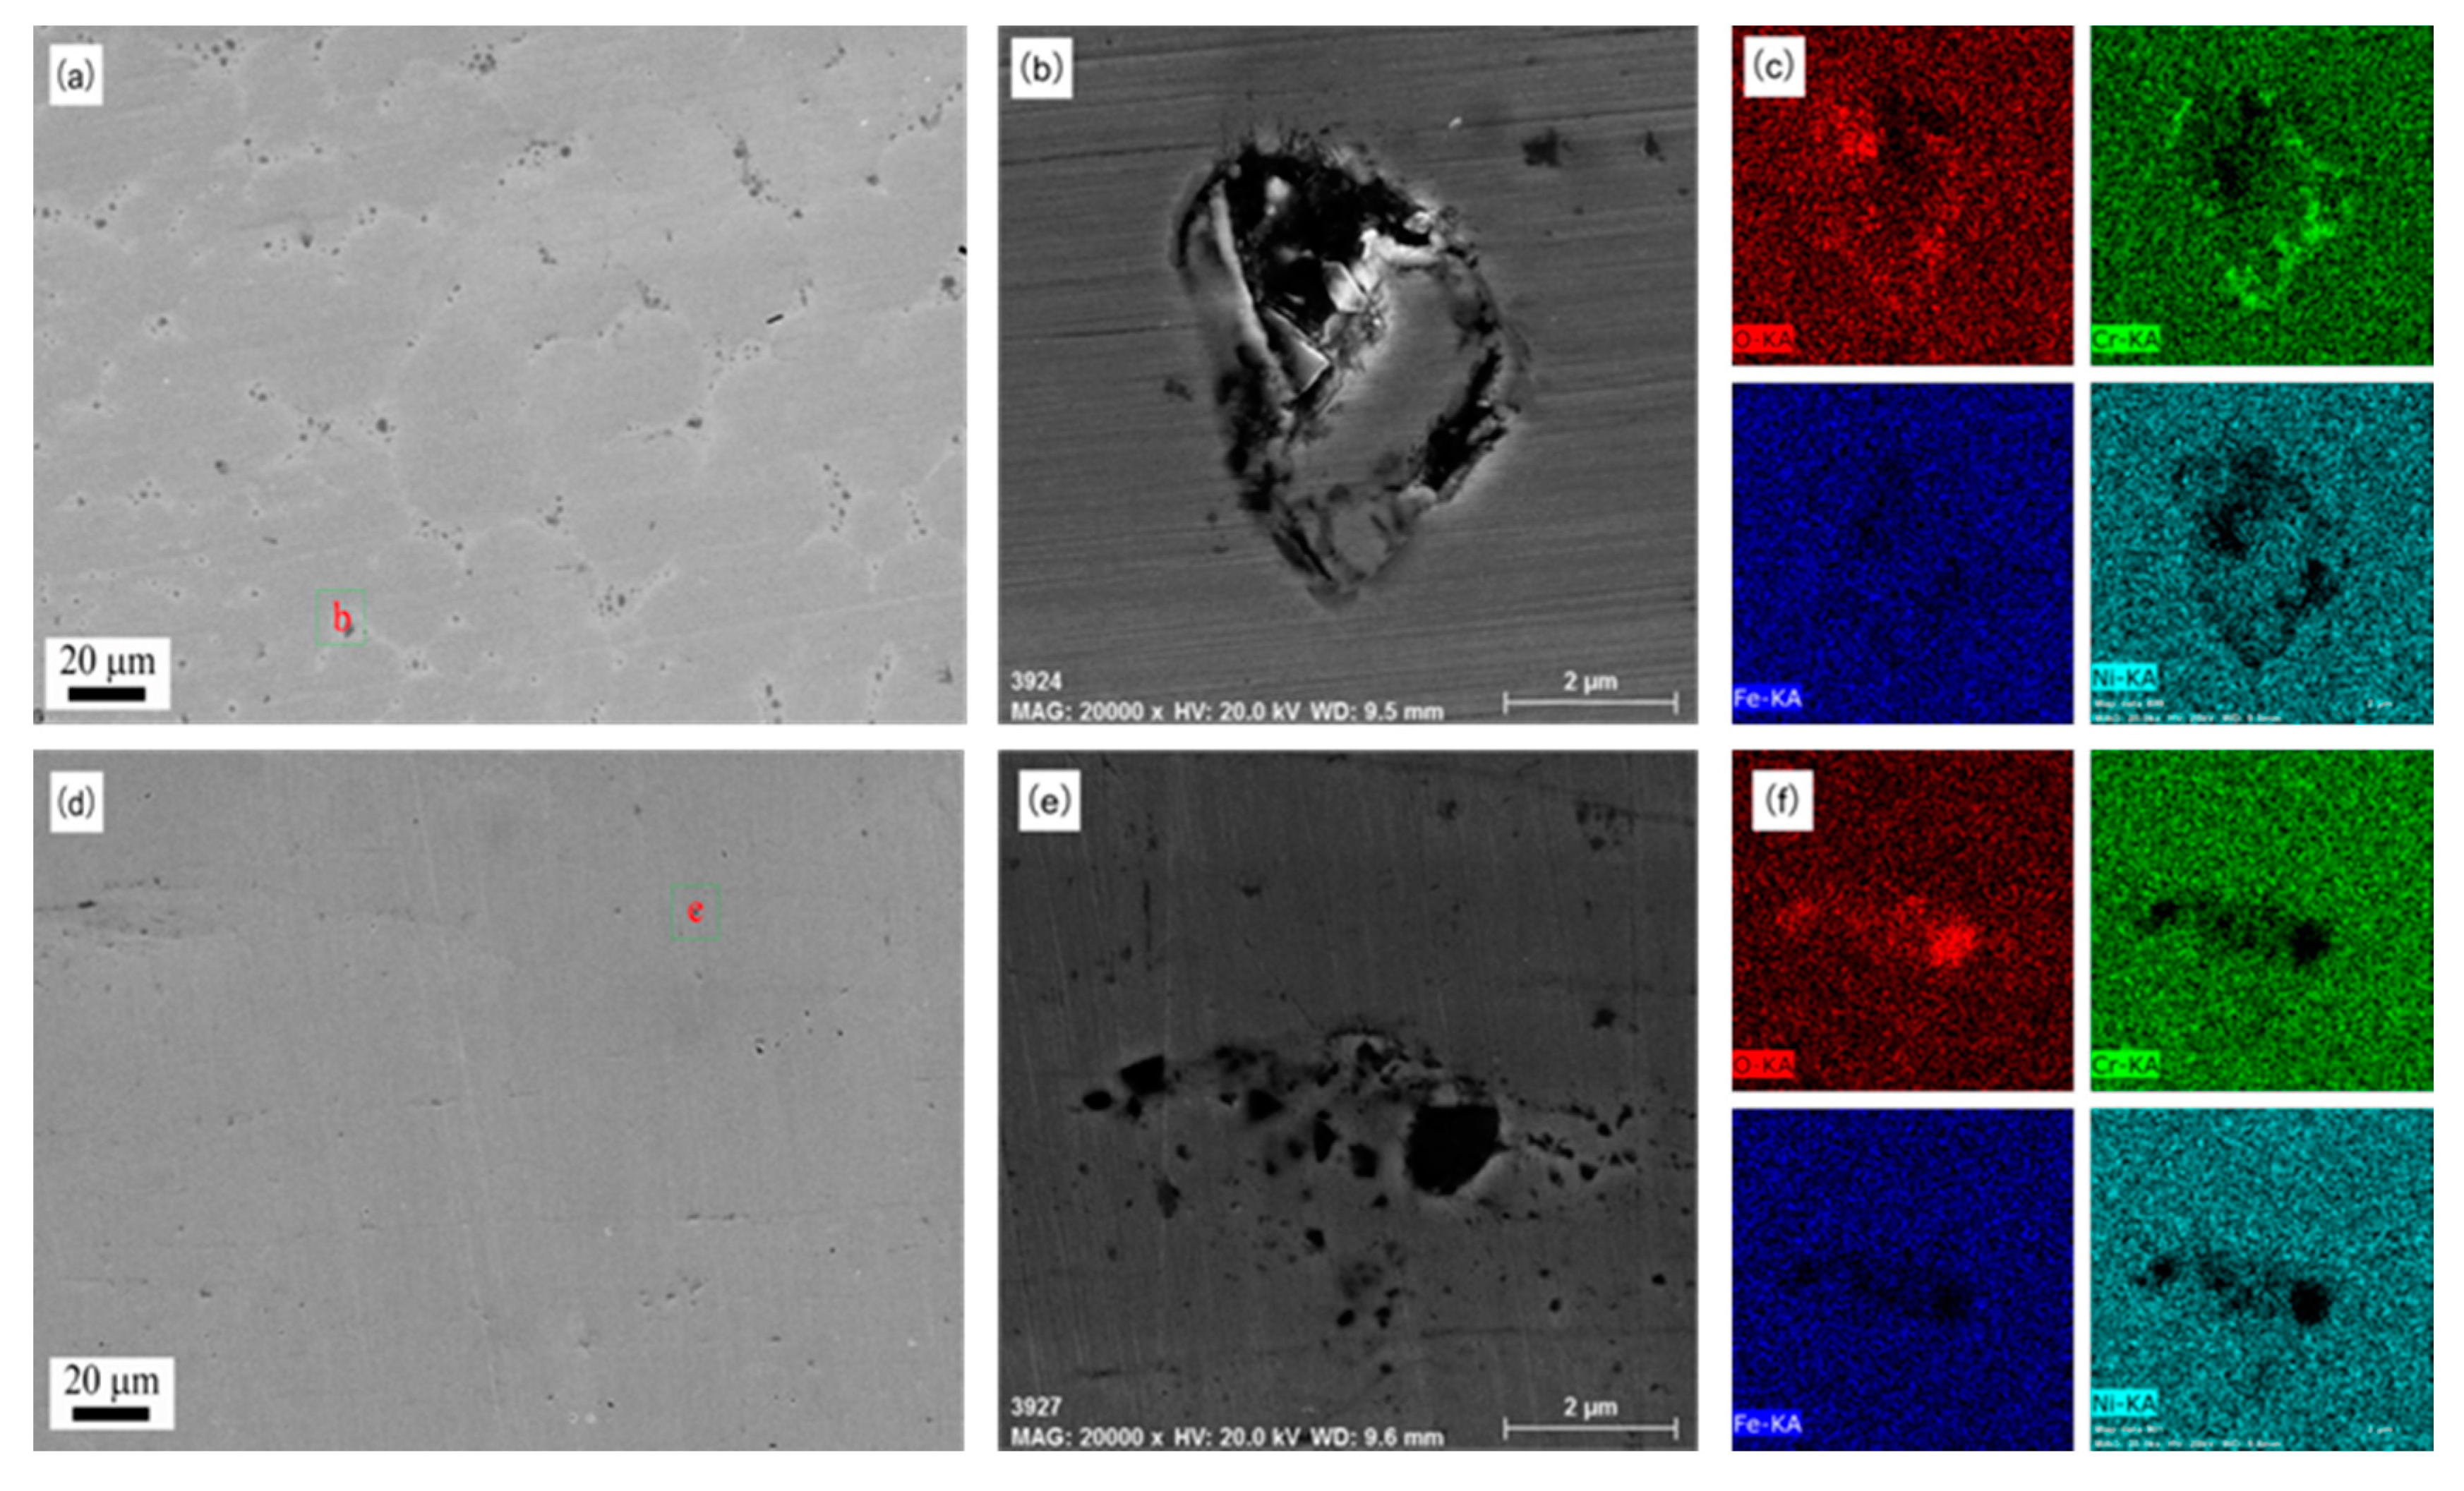
The corrosion morphology of alloy 690 before and after USRT with an immersion time of 1000 h in the secondary side alkaline environment containing chloride is shown in Figure 7. The pitting corrosion preferentially occurred on the grain boundary of alloy 690 coarse grains (CG) when there was almost no corrosion performance in the crystals. A magnified view of pit in Figure 7a is shown in Figure 7b, and the corresponding surface mapping results for O, Cr, Fe, and Ni obtained by EDX elemental analysis are shown in Figure 7c. O and Cr were obviously observed in the corrosion pit when Fe and Ni were lost, revealing that Fe and Ni were dissolved before Cr in alkaline solution containing chloride. However, the pitting corrosion was greatly reduced on the surface of NG alloy 690, as shown in Figure 7d. An amplified view of the pit in Figure 7d indicates that smaller pits formed after USRT in Figure 7e. The surface mapping in Figure 7f demonstrates that the formation of corrosion pits was due to the dissolution of the alloying elements into the corrosive solution.
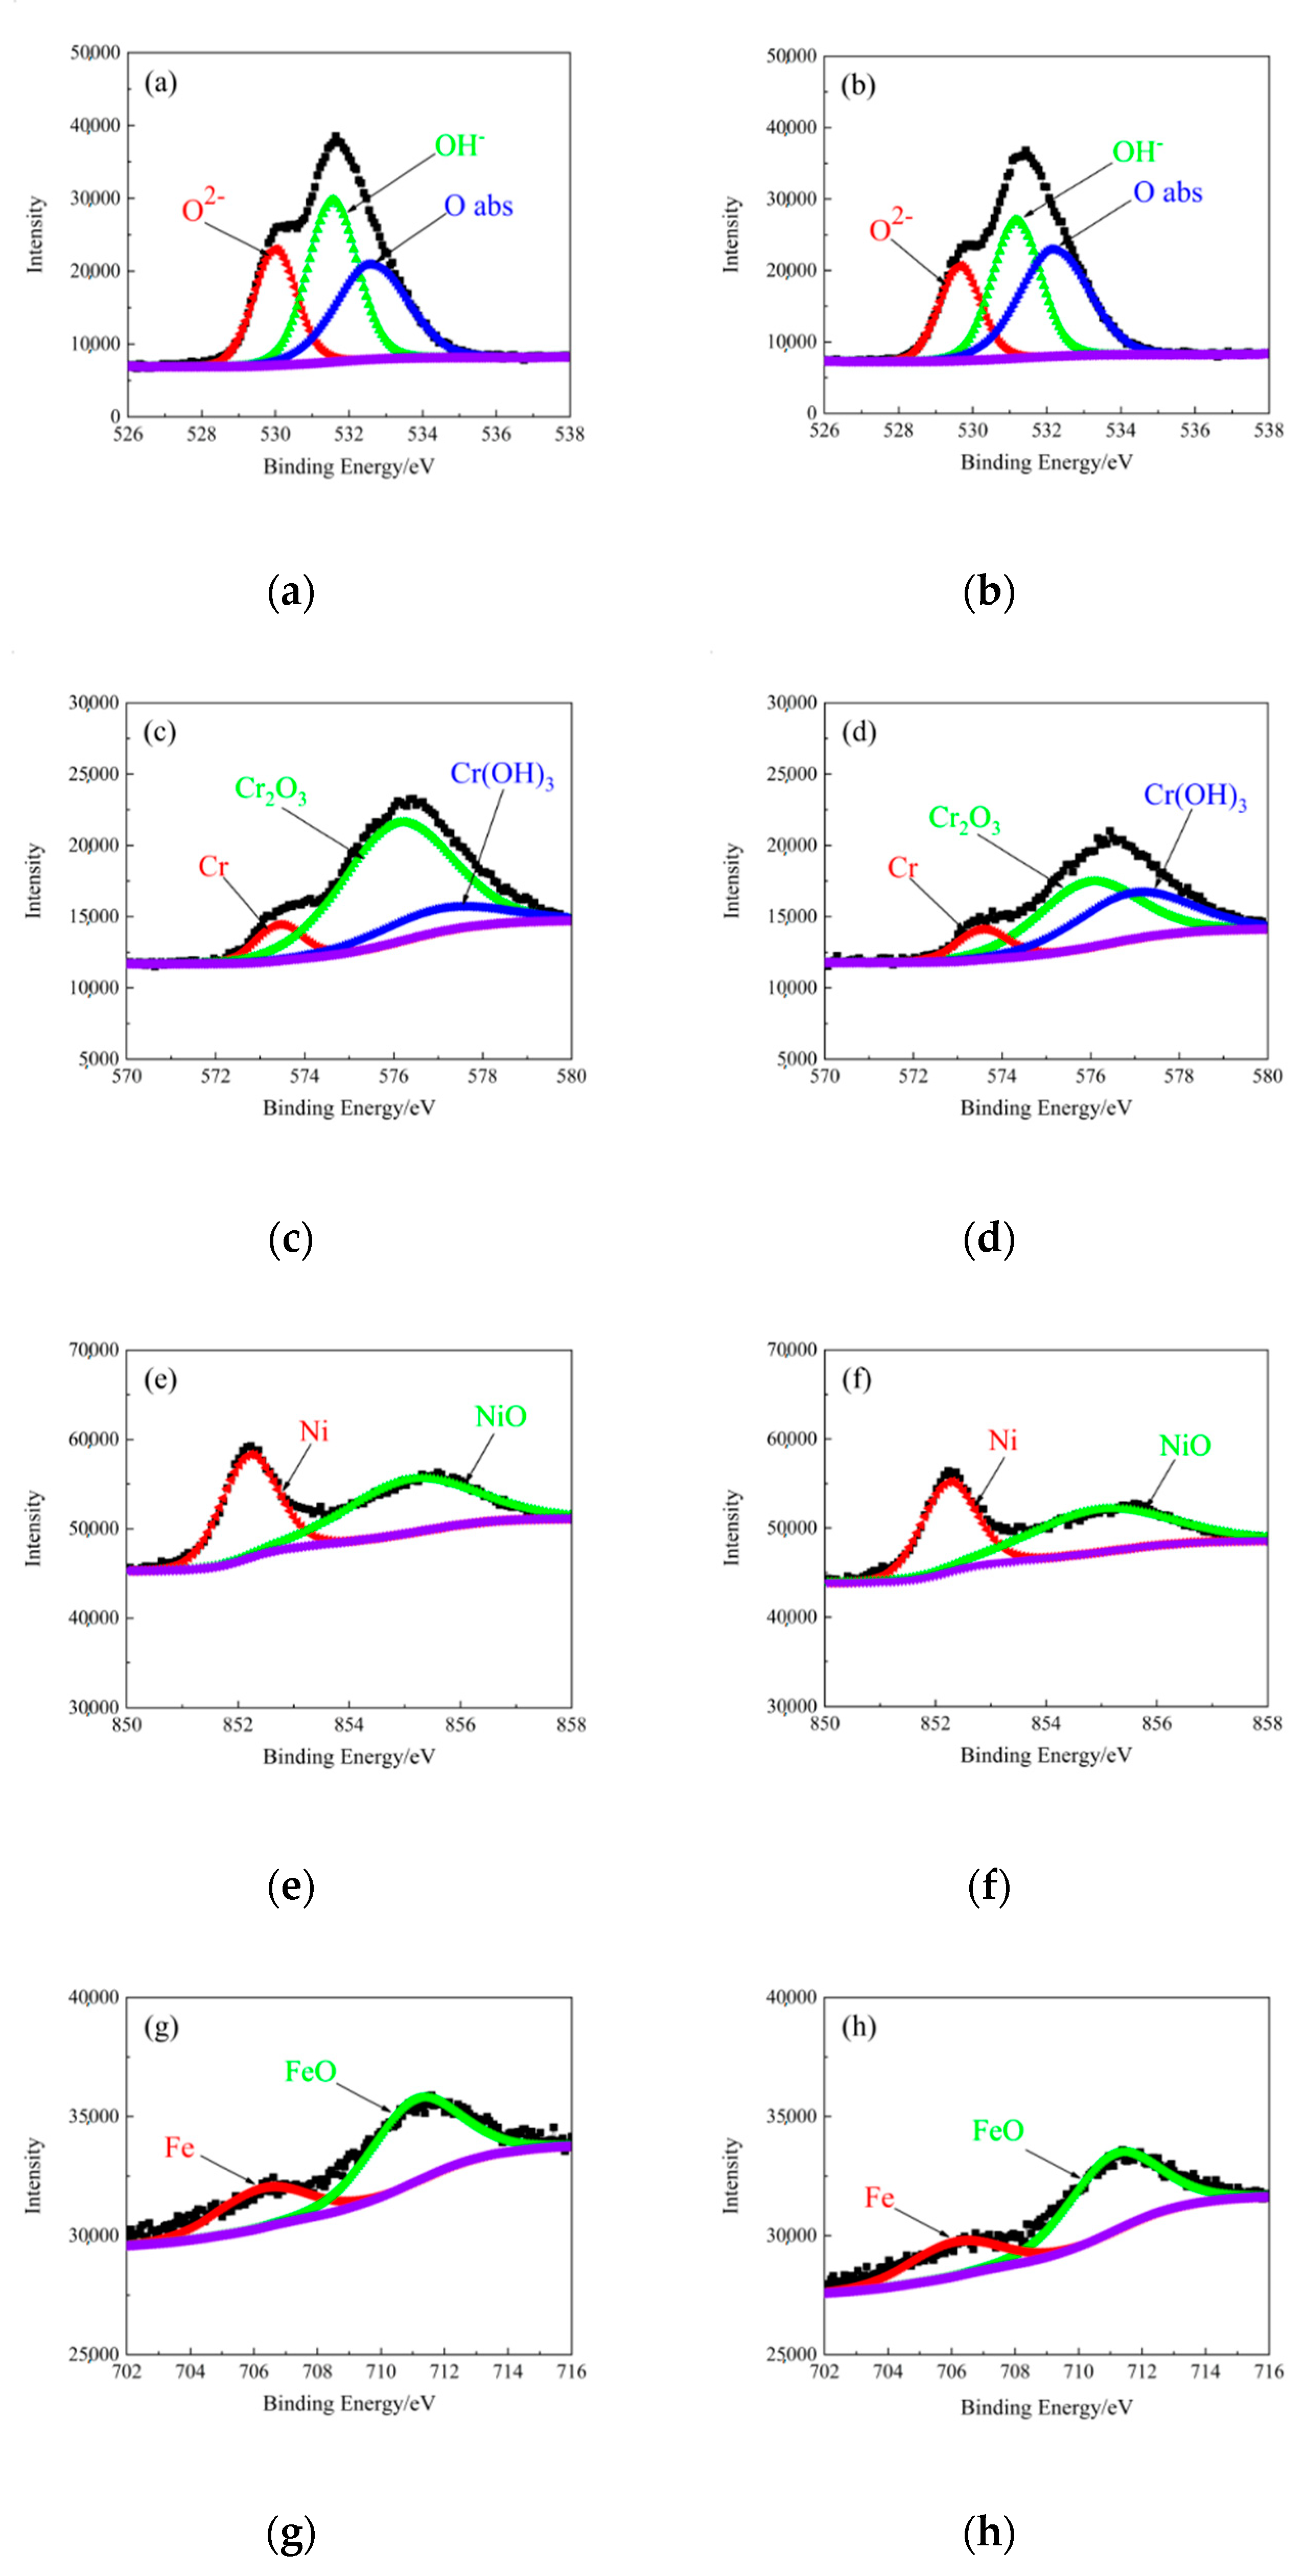
The XPS spectra of CG and NG alloy 690 after immersion in the secondary side environment are shown in Figure 8. A decrease in Cr2O3 and an increase in Cr(OH)3 contents were observed on the surface of NG alloy 690, as shown in Figure 8a, when compared with CG alloy 690, as shown in Figure 8b. Moreover, the amount of FeO significantly reduced after nanocrystallization, as shown in Figure 8d, and the NiO also showed little reduction after USRT compared with that shown in Figure 8e,f, proving that the structure of the passive film is denser after nanocrystallization.
4. Discussion
4.1. The Formation of Passive Film
The formation of a passive film is a fast process, as shown in Figure 6a. Cr(OH)3 preferentially nucleates and grows on the surface of alloy 690 as a result of selective dissolution of Fe and Ni [24]. Cr will preferentially bind to OH− because Cr(OH)3 has lower standard free energy than Cr2O3 [25]. The oxidation process of Cr in an alkaline environment is as follows:
Nanocrystallization provides a channel for the diffusion of Cr3+, causing more chromium ionic species to accumulate on the surface of NG alloy 690. Therefore, denser Cr(OH)3 film is produced on the surface after USRT when more Cr combined with OH− compared with that shown in Figure 8a,b. Moreover, the formation of a denser passive film shown in Figure 6b on the NG surface hinders the further reaction of Cr, OH−, and Cr(OH)3, resulting in a significant reduction of Cr2O3.
Fe is oxidized to FeO rather than porous Fe2O3 in a highly reducing alkaline environment containing hydrazine, as shown in Figure 8c,d. The formation of FeO becomes more difficult due to the blocking of denser passive film on the surface after USRT. The reaction process is as follows:
The NiO content of the surface of NG alloy 690 is also slightly reduced when compared with CG alloy 690, as shown in Figure 8e,f. The formation process of NiO is as follows:
4.2. Pitting Behavior
The presence of chloride ions makes the formed passive film unstable, as shown in Figure 6a, which indicates that chloride ions have a dissolution effect on the passive film. However, the passive film generated on the surface of NG alloy 690 is denser than that on CG alloy 690, which more effectively prevents further corrosion of the substrate by chloride ions, resulting in less pitting on the surface of alloy 690 after USRT compared with that shown in Figure 7a,e.
A continuous, large amount of intergranular carbide precipitation is distributed in alloy 690 after thermal treatment [26], which is the reason why the alloy 690 undergoes intergranular corrosion in a chloride-containing environment, as shown in Figure 7a. However, surface nanocrystallization also induces dissolution of intergranular carbide precipitates while causing grain refinement [27]. The reduction of grain boundary defects after nanocrystallization of alloy 690 leads to weakening of chloride ion corrosion.
It is reported that chloride ions promote the dissolution of the matrix material due to its catalysis, as follows [28]:
where Men+ is produced by the dissolution corrosion of metal. It can be concluded that the Cr element dissolves last compared with Fe and Ni, as shown in Figure 7c, indicating that Cr has better anti-solvent properties in the secondary side environment containing chloride. The content of Cr will increase on the surface of alloy 690 after nanocrystallization [11], which is another important factor that improves the corrosion resistance of chloride ions .
5. Conclusions
In summary, we designed and fabricated alloy 690 with surface gradient nanocrystalline structure and high surface quality by using the USRT technique. The average grain size of NG was 55 nm, and the thickness was about 1 μm. The gradient microstructure along the depth direction mainly includes dislocations, twins, and nanocrystals. Moreover, the NG alloy 690 exhibits a higher positive OCP and Ecorr value, a larger capacitive diameter, and a lower Icorr value, indicating that the passive film can be easily formed, which shows a better corrosion performance than that of CG alloy 690. In addition, only slight pitting corrosion occurred in the NG alloy 690 after 1000 hours of an immersion experiment. In conclusion, grain refinement can significantly improve the corrosion resistance of alloy 690.
Author Contributions
J.L. (Jiang Liu) and T.A. contributed to the data analysis; J.L. (Jiang Liu) and X.Z. contributed to the writing; J.L. (Junbiao Liu) contributed to the figures and tables; X.Z. and B.Y. contributed to study design and funding; T.L. contributed to the project administration and funding; L.Z. contributed to the data collectionl; C.W. contributed to the literature search of this paper. All authors have read and agreed to the published version of the manuscript.
Funding
This work was financially supported by the National Natural Science Foundation of China (grant 51871114 and 51804138), the National Key Research and Development Program of China (grant 2016YFB0301400), the National Natural Science Foundation of Jiangxi Province (grant 20192ACBL21013), the Postdoctoral Science Foundation of China (grant 2019M652290), the Postdoctoral Science Foundation of Jiangxi Province (grant 2018KY05).
Conflicts of Interest
The authors declare no conflict of interest.
References
- Kuang, W.J.; Song, M.; Was, G. Insights into the stress corrosion cracking of solution annealed alloy 690 in simulated pressurized water reactor primary water under dynamic straining. Acta. Mater. 2018, 151, 321–333. [Google Scholar] [CrossRef]
- Lim, Y.S.; Kim, D.J.; Kim, S.W.; Kim, H.P. Crack growth and cracking behavior of alloy 600/182 and alloy 690/152 welds in simulated PWR primary water. Nucl. Eng. Technol. 2019, 51, 228–237. [Google Scholar] [CrossRef]
- Kuang, W.J.; Was, G.S. The effect of grain boundary structure on the intergranular degradation behavior of solution annealed alloy 690 in high temperature, hydrogenated water. Acta. Mater. 2020, 163, 120–130. [Google Scholar] [CrossRef]
- Chen, Y.; Ohopra, W.K.; Soppet, N.L.; Rago, D.; Shack, W.J. Irradiation-Assisted Stress Corrosion Cracking of Austenitic Stainless Steels and Alloy 690 from Halden Phase-II Irradiations; Technical Report for Argonne National Lab.(ANL): Argonne, IL, USA, September 2008. [Google Scholar]
- Moss, T.; Was, G.S. Accelerated stress corrosion crack initiation of alloys 600 and 690 in hydrogenated supercritical water. Metall. Mater. Trans. A. 2017, 48, 1613–1628. [Google Scholar] [CrossRef]
- Moss, T.; Kuang, W.J.; Was, G.S. Stress corrosion crack initiation in alloy 690 in high temperature water. Curr. Opin. Solid State Mater. Sci. 2018, 22, 16–25. [Google Scholar] [CrossRef]
- Chen, Y.Y.; Chou, L.B.; Shih, H.C. Factors affecting the electrochemical behavior and stress corrosion cracking of alloy 690 in chloride environments. Mater. Chem. Phys. 2006, 97, 37–49. [Google Scholar] [CrossRef]
- Liu, J.; Wang, C.M.; Zhang, W.L.; Xia, T.T.; Zhang, X.H.; Liang, T.X.; Ahmad, T.; Yang, B. Corrosion behaviour of nanocrystalline 304 stainless steel in simulated secondary side environment. Mater. Sci. Technol. 2019, 35, 907–915. [Google Scholar] [CrossRef]
- Song, D.; Jiang, J.H.; Guan, X.N.; Qiao, Y.X.; Li, X.B.; Chen, J.Q.; Sun, J.P.; Ma, A.B. Effect of surface nanocrystallization on corrosion resistance of the conformed Cu-0.4%Mg alloy in NaCl solution. Metals 2018, 8, 765. [Google Scholar] [CrossRef] [Green Version]
- Tong, Z.P.; Ren, X.D.; Ren, Y.P.; Dai, F.Z.; Ye, Y.X.; Zhou, W.F.; Chen, L.; Ye, Z. Effect of laser shock peening on microstructure and hot corrosion of TC11 alloy. Surf. Coat. Technol. 2018, 335, 32–40. [Google Scholar] [CrossRef]
- Lv, J.L.; Liang, T.X.; Wang, C.; Guo, T. Comparison of corrosion behavior between coarse grained and nano/ultrafine grained alloy 690. Appl. Surf. Sci. 2016, 360, 403–408. [Google Scholar]
- Lv, J.L. Effect of grain size on mechanical property and corrosion resistance of the Ni-based alloy 690. J. Mater. Sci. Technol. 2018, 34, 1685–1691. [Google Scholar] [CrossRef]
- Li, N.N.; Shi, S.Q.; Luo, J.L.; Lu, J.; Wang, N. Effects of surface nanocrystallization on the corrosion behaviors of 316L and alloy 690. Surf. Coat. Technol. 2017, 309, 227–231. [Google Scholar] [CrossRef]
- Xia, T.T.; Zeng, L.F.; Zhang, X.H.; Liu, J.; Zhang, W.L.; Liang, T.X.; Yang, B. Enhanced corrosion resistance of a Cu-10Ni alloy in a 3.5 wt% NaCl solution by means of ultrasonic surface rolling treatment. Surf. Coat. Technol. 2019, 363, 390–399. [Google Scholar] [CrossRef]
- Wang, C.M.; Xu, G.M.; Zeng, L.M.; Tang, Z.H.; Zhang, X.H.; Liang, T.X. Enhanced corrosion behavior and mechanical properties of Al-Zn-Mg-Cu sheet alloy by ultrasonic surface rolling treatment. Metall. Mater. Trans. A. 2020, 51, 1967–1971. [Google Scholar] [CrossRef]
- Xu, G.M.; Wang, C.M.; Li, Q.L.; Zhang, X.H.; Zhu, Z.Y.; Liang, T.X.; Yang, B. Effects of ultrasonic rolling on surface performance of 7B85-T6 alloy. Mater. Manuf. Process. 2020, 35, 250–257. [Google Scholar] [CrossRef]
- Wang, T.; Wang, D.P.; Liu, G.; Gong, B.M.; Song, N.X. Investigations on the nanocrystallization of 40Cr using ultrasonic surface rolling processing. Appl. Surf. Sci. 2008, 255, 1824–1829. [Google Scholar]
- Chen, L.; Ren, X.D.; Zhou, W.F.; Tong, Z.P.; Adu-Gyamfi, S.; Ye, Y.X.; Ren, Y.P. Evolution of microstructure and grain refinement mechanism of pure nickel induced by laser shock peening. Mat. Sci. Eng. A. 2018, 728, 20–29. [Google Scholar] [CrossRef]
- Khatami, R.; Fattah-alhosseini, A.; Keshavarz, M.K. Effect of grain refinement on the passive and electrochemical behavior of 2024 Al alloy. J. Alloy. Compd. 2017, 708, 316–322. [Google Scholar] [CrossRef]
- Cao, F.H.; Len, V.H.; Zhang, Z.; Zhang, J.Q. Corrosion behavior of magnesium and its alloy in NaCl solution. Russ. J. Electrochem. 2007, 43, 837–843. [Google Scholar] [CrossRef]
- Wang, L.W.; Liu, Z.Y.; Cui, Z.Y.; Du, C.W.; Wang, X.H.; Li, X.G. In situ corrosion characterization of simulated weld heat affected zone on API X80 pipeline steel. Corros. Sci. 2014, 85, 401–410. [Google Scholar] [CrossRef]
- Luo, H.; Yu, Q.; Dong, C.F.; Sha, G.Z.; Liu, B.; Liang, J.X.; Wang, L.; Han, G.; Li, X.G. Influence of the aging time on the microstructure and electrochemical behaviour of a 15-5PH ultra-high strength stainless steel. Corros. Sci. 2018, 139, 185–196. [Google Scholar] [CrossRef]
- Brytan, Z.; Niagaj, J.; Reimann, L. Corrosion studies using potentiodynamic and EIS electrochemical techniques of welded lean duplex stainless steel UNS S82441. Appl. Surf. Sci. 2016, 388, 160–168. [Google Scholar] [CrossRef]
- Huang, J.B.; Wu, X.Q.; Han, E.H. Electrochemical properties and growth mechanism of passive films on Alloy 690 in high-temperature alkaline environments. Corros. Sci. 2010, 52, 3444–3452. [Google Scholar] [CrossRef]
- Ziemniak, S.E.; Jones, M.E.; Combs, K.E.S. Solubility and phase behavior of Cr (III) oxides in alkaline media at elevated temperatures. J. Solution. Chem. 1998, 27, 33–66. [Google Scholar] [CrossRef]
- Lee, T.H.; Suh, H.Y.; Han, S.K.; Noh, J.S.; Lee, J.H. Effect of a heat treatment on the precipitation behavior and tensile properties of alloy 690 steam generator tubes. J. Nucl. Mater. 2016, 479, 85–92. [Google Scholar] [CrossRef] [Green Version]
- Liu, W.B.; Hang, C.Z.; Xia, Z.X.; Yang, Z.G.; Wang, P.H.; Chen, J.M. Strain-induced refinement and thermal stability of a nanocrystalline steel produced by surface mechanical attrition treatment. Mat. Sci. Eng. A. 2013, 568, 176–183. [Google Scholar] [CrossRef]
- Zhang, B.; Wang, J.; Wu, B.; Guo, X.W.; Wang, Y.J.; Chen, D.; Zhang, Y.C.; Du, K.; Oguzie, E.E.; Ma, X.L. Unmasking chloride attack on the passive film of metals. Nat Commun. 2018, 9, 2559. [Google Scholar] [CrossRef]
Figure 1.
The simulation of the machining process.

Figure 2.
Surface topography of alloy 690 (a,b) 3D and (c,d) 2D (a,c) before and (b,d) after ultrasonic surface rolling treatment (USRT).
Figure 2.
Surface topography of alloy 690 (a,b) 3D and (c,d) 2D (a,c) before and (b,d) after ultrasonic surface rolling treatment (USRT).

Figure 3.
XRD patterns of alloy 690 before and after USRT.

Figure 4.
The cross-sectional morphology of alloy 690 after USRT. (a) A gradient refinement nanograin (NG) layer; (b) magnified view of (a); (c) dislocation entanglement; (d) dislocations activated and hindered near the grain boundary; (e) twins formation; and (f) fine grains production.
Figure 4.
The cross-sectional morphology of alloy 690 after USRT. (a) A gradient refinement nanograin (NG) layer; (b) magnified view of (a); (c) dislocation entanglement; (d) dislocations activated and hindered near the grain boundary; (e) twins formation; and (f) fine grains production.

Figure 5.
(a)The top surface morphology of alloy 690 after USRT and corresponding selected area electron diffraction; (b) high resolution morphology of selected area in (a).
Figure 5.
(a)The top surface morphology of alloy 690 after USRT and corresponding selected area electron diffraction; (b) high resolution morphology of selected area in (a).

Figure 6.
Corrosion behavior of alloy 690 before and after USRT. (a) open circuit potential (OCP) curves, (b) Nyquist impedance spectra and corresponding equivalent circuit model (Rs is the solution resistance, Rct is the charge-transfer resistance, and CPE is the constant phase element), (c) Bode diagram, (d) potentiodynamic polarization curves.

Figure 7.
The SEM of alloy 690 (a) before and (d) after USRT with immersion in the secondary side environment for 1000 h; (b,e) the magnified figures and (c,f) corresponding surface mapping in (a,d), respectively.
Figure 7.
The SEM of alloy 690 (a) before and (d) after USRT with immersion in the secondary side environment for 1000 h; (b,e) the magnified figures and (c,f) corresponding surface mapping in (a,d), respectively.

Figure 8.
XPS spectra of (a,b) O1s, (c,d) Cr 2p3/2, (e,f) Ni 2p3/2 and (g,h) Fe 2p3/2 of alloy 690 (a,c,e,g) before and (b,d,f,h) after USRT with immersion in the secondary side environment.
Figure 8.
XPS spectra of (a,b) O1s, (c,d) Cr 2p3/2, (e,f) Ni 2p3/2 and (g,h) Fe 2p3/2 of alloy 690 (a,c,e,g) before and (b,d,f,h) after USRT with immersion in the secondary side environment.


Table 1.
Chemical composition of alloy 690.
| Ni | Cr | Fe | C | Al | Ti | Mn | Si | Cu | P | S |
|---|---|---|---|---|---|---|---|---|---|---|
| 60.4 | 29.8 | 8.9 | 0.022 | 0.225 | 0.25 | 0.28 | 0.06 | 0.023 | 0.006 | 0.002 |
Table 2.
Equivalent circuit results obtained from electrochemical impedance spectroscopy (EIS) data fitting.
Table 2.
Equivalent circuit results obtained from electrochemical impedance spectroscopy (EIS) data fitting.
| Sample | Rs (Ω cm2) | CPE | Rct (Ω cm2) | |
|---|---|---|---|---|
| Yo (Ω−1 cm−2 sn) | n | |||
| CG | 5.569 | 5.536 × 10⁻⁵ | 0.6651 | 9.186 × 10⁴ |
| NG | 5.654 | 5.510 × 10⁻⁵ | 0.7520 | 1.535 × 10⁵ |
Table 3.
Electrochemical parameters of the polarization curve.
| Sample | Ecor (mV) | Icor (μA cm−2) | Rp (Ω cm2) | Βa (mV Dec−1) | Βc (mV Dec−1) |
|---|---|---|---|---|---|
| CG | −0.394 | 1.383 | 7.163 × 10⁵ | 3.391 | −6.944 |
| NG | −0.326 | 1.044 | 8.703 × 10⁵ | 2.979 | −6.981 |
© 2020 by the authors. Licensee MDPI, Basel, Switzerland. This article is an open access article distributed under the terms and conditions of the Creative Commons Attribution (CC BY) license (http://creativecommons.org/licenses/by/4.0/).
Share and Cite
MDPI and ACS Style
Liu, J.; Liu, J.; Zhang, X.; Ahmad, T.; Liang, T.; Zeng, L.; Wang, C.; Yang, B. Effect of Ultrasonic Surface Rolling Treatment on Corrosion Behavior of Alloy 690. Metals 2020, 10, 917. https://doi.org/10.3390/met10070917
AMA Style
Liu J, Liu J, Zhang X, Ahmad T, Liang T, Zeng L, Wang C, Yang B. Effect of Ultrasonic Surface Rolling Treatment on Corrosion Behavior of Alloy 690. Metals. 2020; 10(7):917. https://doi.org/10.3390/met10070917
Chicago/Turabian StyleLiu, Jiang, Junbiao Liu, Xuehui Zhang, Tahir Ahmad, Tongxiang Liang, Longfei Zeng, Chunming Wang, and Bin Yang. 2020. "Effect of Ultrasonic Surface Rolling Treatment on Corrosion Behavior of Alloy 690" Metals 10, no. 7: 917. https://doi.org/10.3390/met10070917
Note that from the first issue of 2016, this journal uses article numbers instead of page numbers. See further details here.