
An Analysis of Cholesteric Spherical Reflector Identifiers for Object Authenticity Verification


Interdisciplinary Center for Security Reliability and Trust (SnT), University of Luxembourg, 4365 Luxembourg, Luxembourg
*
Author to whom correspondence should be addressed.
Mach. Learn. Knowl. Extr. 2022, 4(1), 222-239; https://doi.org/10.3390/make4010010
Submission received: 23 January 2022
/
Revised: 17 February 2022
/
Accepted: 21 February 2022
/
Published: 24 February 2022
(This article belongs to the Special Issue Selected Papers from CD-MAKE 2021 and ARES 2021)
Abstract
:Arrays of Cholesteric Spherical Reflectors (CSRs), microscopic cholesteric liquid crystals in a spherical shape, have been argued to become a game-changing technology in anti-counterfeiting. Used to build identifiable tags or coating, called CSR IDs, they can supply objects with unclonable fingerprint-like characteristics, making it possible to authenticate objects. In a previous study, we have shown how to extract minutiæ from CSR IDs. In this journal version, we build on that previous research, consolidate the methodology, and test it over CSR IDs obtained by different production processes. We measure the robustness and reliability of our procedure on large and variegate sets of CSR IDs’ images taken with a professional microscope (Laboratory Data set) and with a microscope that could be used in a realistic scenario (Realistic Data set). We measure intra-distance and interdistance, proving that we can distinguish images coming from the same CSR ID from images of different CSR IDs. However, without surprise, images in Laboratory Data set have an intra-distance that on average is less, and with less variance, than the intra-distance between responses from Realistic Data set. With this evidence, we discuss a few requirements for an anti-counterfeiting technology based on CSRs.
1. Introduction
From a broader perspective, this paper is about how to verify that an object is authentic. In certain sectors, this problem is well known, for instance in biometrics and fingerprint authentication. It calls for taking afresh a fingerprint and comparing it to the real person’s print previously taken, registered, and stored by a trusted party. For comparison, object verification, a problem relevant in anti-counterfeiting, is the process of confirming that an object identified by reference number is the same object that was originally produced and labeled that way, and not a fake imitation.
The main challenge in anti-counterfeiting, and object verification is that only a few objects have unclonable identifiable characteristics, so it is unfeasible, impractical, or too expensive, to produce fakes. One has to resort to external guarantees of authenticity. A common solution is watermarking: special marks hard to reproduce without sophisticated technology are added to the object, often stealthily. In banknotes, for instance, signs detectable in ultra-violet, raised printing, holograms, and glossy stripes are used to increase confidence about a banknote’s authenticity if one knows where and what to look for. Watermarking is object-specific, applicable only to certain materials, and it is not identifying: banknotes use serial numbers for that purpose. Other techniques are digital. They employ deep learning to recognize what features an object, or better several thousands of pictures of an object, have in common. Machine learning can give excellent results, but the training process can be time-consuming, needs large training data set, and the criteria learned for a reliable classification may not be explainable. Instead of a whole picture of an object, one can look only at certain minutiæ (i.e., details). This helps to speed up the process because those minutiæ have been proven capable to distinguish one “instance” object from another. In fingerprint analysis, to return to our example, minutiæ are certain specific points in the ridges in a grayscale skeleton image of a fingerprint. Today, fingerprint analysis algorithms that look for minutiæ are available and are fast, but the basic idea was conceived decades ago. Once more, not all objects possess detectable minutiæ or have been the subject of years of research to obtain fast and efficient verification algorithms.
What would be ideal in anti-counterfeiting would be a material that can be paired with a large family of objects, providing them with fingerprint-like features. The material should be also tamper-evident (i.e., irremovable without damage) and physically unclonable. Its identifiable features should be non-reproducible using similar technologies so that it is impossible or costly to produce counterfeits. In this paper, we study one of such a material which is the result of years of research in soft matter physics. The material is known as Cholesteric Liquid Crystal (ChLCs).
Liquid crystals have been used extensively in the production of screens of several digital devices, but when molded into a spherical shape they become reflectors: they reflect lights and create colorful patterns (see Figure 1). ChLCs in spherical shape are called Cholesteric Spherical Reflectors (CSRs). The selective reflection coming from CSRs can be controlled by adjusting the chemical composition of the liquid crystals, and so can be the size of the droplets during the production process; as well the positions of CSRs and the distribution of different CSR types [1,2]. Specific features of the light source, such as the angle of incidence and polarization, provide an advantage for unpredictability [1,2,3] and these unpredictable and unique optical reflection patterns can be captured with a mobile camera [4,5]. Lenzini et al. [4] suggested that ChLC-shells have intrinsic unclonable properties and therefore may be used as Physical Unclonable Function (PUF) for security applications.
Contribution
We address the problem of understanding how to process images of CSRs, extract information from them, and design a verification procedure for CSRs. We work on CSRs contained in physical supports or tags, which we call CSR Identifiers (CSR IDs). We aim to test the following hypothesis:
Hypothesis 1.
CSR can be a material of choice for object “fingerprint” verification, because we can extract identifying information from their responses and clearly distinguish images taken from a specific CSR ID from images taken from other CSR IDs, as well as from fake images made up to simulate a CSR’s responses.
We investigate Hypothesis 1 in the most general way possible. In fact, CSRs are not a single, well-established physical entity as human fingerprints are. They can be produced in the form of shells or droplets (a droplet is filled with ChLCs, a shell is hollow inside and contains ChLCs only in the external surface.), and as such, they have different sizes (their diameter ranges from 10 μm to 100 μm). They are produced following different protocols, by using different chemicals, different pipelines, and polymerization phases and as such CSRs can be tuned to reflect different “colors” e.g., in the visible and in the invisible spectrum; they can be hosted by different media (e.g., plastic tags, transparent films, drying-up coatings), and the hosting material interferes on how light is reflected.
In addition, raw images of CSRs also differ if taken with a professional microscope, such as the images in Figure 2, or with more affordable microscopes, for instance, a microscope built in a smartphone or connect to it wirelessly or with a USB port as the one in Figure 3. To address such diversity of challenges makes testing Hypothesis 1 difficult. We look for a single strategy that works across the whole range of images that we can obtain from the families of CSRs currently available to us.
Processing CSR images and extracting features from CSR IDs have been pioneered in Lenzini et al. [4] and Arenas et al. [6]. The first work compares histograms of images, a very basic strategy, to see whether the information hidden in the colored patterns is enough to discern among different arrays of CSRs. Results were preliminary with plenty of room for improvement.
The second work delves into more sophisticated image processing strategies and more tailored similarity measures. One measure was defined in terms of the number of zero pixels after image subtraction; the other was defined by comparing colored circles, (herein, blobs) that correspond to spots of reflected light (see Figure 2). A blob is a 4—tuple of integers, respectively the coordinate of its center, radius, and dominant color. The authors suggested that these blobs are the minutiæ of CSRs, and discussed a measure of similarity over the blob space, which we also report here. In fact, this article is the journal version of Arenas et al. [6], a conference paper. As such, it includes the original methods but extends the research considerably. In addition to a new introduction that better frames the work, a revised methodology, and an improved implementation, it has a novel experimental part with more and different data sets. The images considered in Arenas et al. [6] were “perfect and neat” images of CSR IDs’ responses taken with a professional microscope, the ones used in a Physics Laboratory. The scenario of reference was inevitably artificial. To simulate a real situation with noise due to imperfect read-out, Arenas et al. [6] created a large number of synthetic images by shifting, rotating, cropping, and blurring the original images. A large number of artificial and fake images, only apparently looking as images of CSRs, were also included in the data set.
In this work, we extend Arenas et al.’s data sets as follows: we added Gaussian noise to the images, the one introduced by electronic circuit noise in digital cameras [7]. This is considered a must-have in image processing. In addition to the old data set, we collected hundreds of new images in a completely different setting. All images are taken from an updated collection of CSR IDs produced using a newer production process that generates smaller CSRs with a nonprofessional microscope. This new data set includes images that are much closer to what a user would obtain in a real object verification scenario. The data analysis has been completely updated. Thanks to the new data set, we were able to renew a within-sample analysis, measuring intra- and inter-distance between different tags made with the same production technology, and with pictures taken using the same read-out device, but also to run a completely new cross-sample analysis. We report on statistics over the intra- and inter-distances calculated over CSRs samples produced with different technologies, hosted on different media, and taken with different read-out hardware and conditions.
We believe that the findings of this work give more quality evidence to not reject Hypothesis 1. It gives ground to discuss a few engineering requirements for using CSRs in anti-counterfeiting.
2. Previous Research on CSRs in Object Verification
Counterfeiting and piracy of goods are big challenges for companies to develop innovative products. Studies from the Organisation for Economic Cooperation and Development (OECD) and the EU Intellectual Property Office (EUIPO) show an increase of illicit trades in the global markets [8,9]. From this point of view, one of the challenges for the product’s authentication is to guarantee that the claimed element is genuine. Each authentication system has different drawbacks caused by security vulnerabilities and authorization attacks. Authentication systems are nontrivial to implement, mainly when dealing with random variables that are not perfectly reproducible when measured multiple times, as is the case of CSRs. The state of the art of PUF technologies is wide, as reported by McGrath et al. [10], there exist silicon-, optical-, magnetic-based technologies, among others. However, due to the scope of the current study, we focus exclusively on optical PUFs. Pappu et al. [11] introduced the concept of optical PUFs as physical one-way functions, they proposed tokens in which particles are distributed randomly over a transparent surface and when challenged with a laser, unique and unclonable identifiers are observed. Any variation in the incidence angle of the laser corresponds to a different pattern, being the laser’s position the challenge, and the resulting pattern the response. This complex interaction has attracted the attention of different industries and researchers leading to the advent of a plethora of optical PUFs for authentication applications [12,13,14].
Dachowicz et al. [15] developed an optical PUF anti-counterfeiting system of manufactured metallic goods. The authors implemented their solution for 50 pieces of special steel parts with an estimated classification error rate of less than 1%. Arppe-Tabbara et al. [16] proposed a PUF-based optical authentication system based on tags in which a handful of particles is thrown on a surface (e.g., QR-codes). Each thrown generates a unique pattern, and the number of particles makes the chance of two identical patterns occurring zero. Wang et al. [17] have studied the use of polymer substrate fingerprinting to construct an anti-counterfeiting tool for polymer banknotes. They extract fingerprints of each banknote using the inherent uneven thickness in the coating layer and the random dispersion of impurities from the ink to extract unique fingerprints for each banknote. The authors have used 340 distinct banknotes to produce 6200 images. They obtain a fingerprint of 2048-bits of information with 900-bit of entropy. Then, they computed the intra- and inter-distance approach, very similar to our study, and authenticated banknotes with high accuracy.
The first work suggesting that ChLC-shells have intrinsic unclonable properties for security applications is [2]. The argument has been backed with some evidence in [4], where the authors hypothesized that CSRs are optical PUFs [11] because of two arguments: the large variations of patterns obtainable by changing the angle of incidence of the light and the tags’ production process (one cannot control nor predict where the CSRs will eventually be displaced, which makes aggregation of CSRs arguably physically unclonable). For reference, let us call a tag containing CSRs as CSR ID. Because of their optical patterns and their physical unclonability, CSR IDs are being presented as a potential technology for object authentication and anti-counterfeiting [3]. However, and the following statement holds also for other optical PUFs, CSR IDs cannot unleash their potential to give objects their fingerprint unless one proves that is feasible to extract the identifying information contained in their responses and to use it for verification. Even better would be to extract reliable and robust bitstrings from a CSR ID, enabling the design of cryptographically strong authentication protocols.
Table 1 shows a comparison of these 4 studies, 2 of them benefit from the internal structure of the material (banknote and steel) whereas the others rely on the specially produced tags. These techniques seem to encode enough information for uniquely identifying, but more work is required for better estimation of the information encoding capacity of our development.
3. Definitions and Requirements
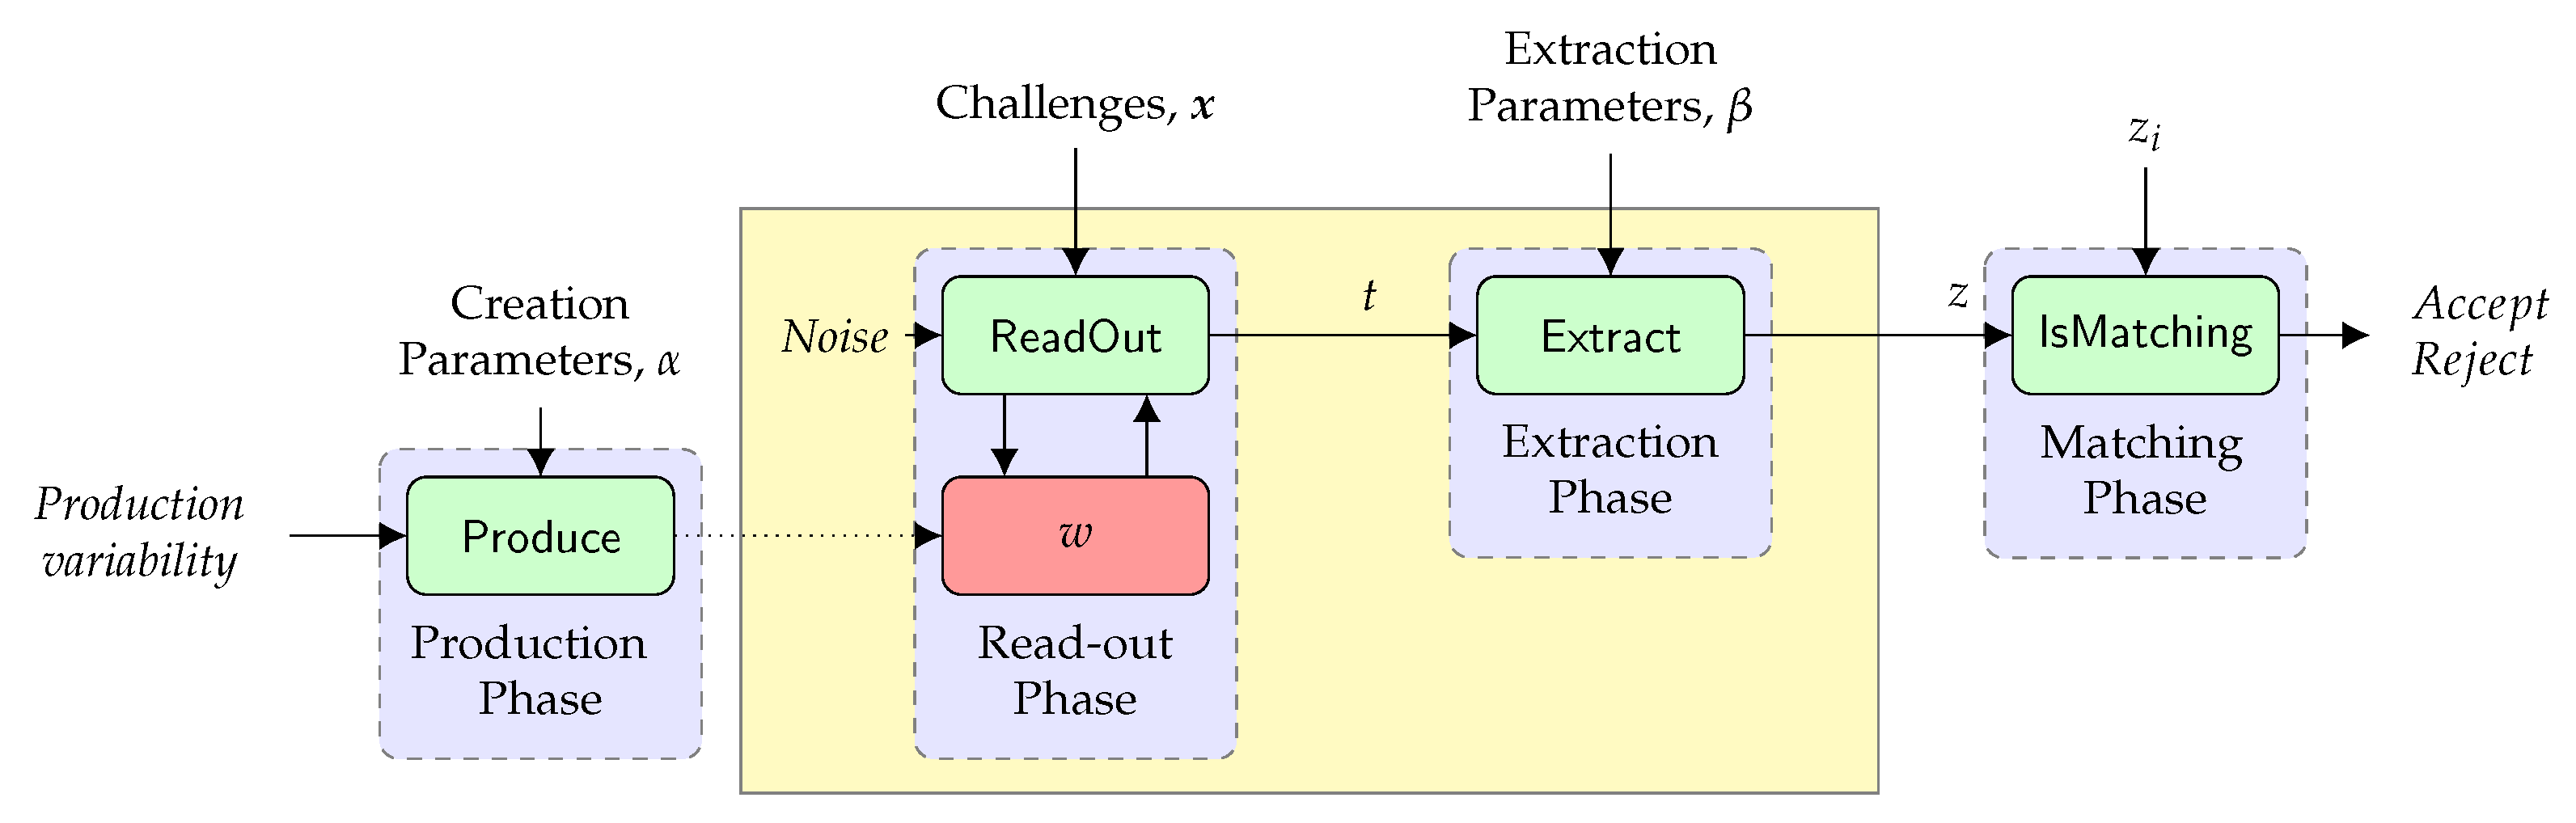
The problem of object verification using CSRs is, in theory, a simple authentication problem. Let us call an object i tagged with a CSR ID w. Verifying that an object that carries a tag w and claiming to be i is original means testing whether , where ‘’ denotes physical identity. In practice, the test implies reading out some piece t of identifying information from w, a process that we write as . Since w is a CSR ID, t will be a picture of the tag’s optical response as one of those reported in Figure 2. This is not enough, however. To verify w’s originality, we need to extract some unique identifiable feature from t, say z. Let us write this process as . For instance, z can be obtained by applying Gabor filters [17] or some feature extraction methods (e.g., see [18]). Verifying w means retrieving the safely stored of the original object, and compare it against . Figure 4, adapted from [4] and from [19], visualizes the workflow and its steps, where is the last verification test, according to a measure of similarity, likelihood, or distance defined over the space of features. The figure shows also the process for the production of CSRs: represents factors at production that contribute to the entropy carried by w.
A full authentication protocol will be more elaborated than just matching z and , but disregarding this aspect at the moment, what matters is that robustness and reliability of the authentication procedure depends on w, on the readout/extraction procedures, and on the algorithm used for the matching. These procedures should be designed, implemented, and combined to satisfy the following property:
If w were a PUF, a read-out would not be unique. It would change in response to a challenge , that is . That is:
We do not consider such a challenge-response behavior of CSRs in this paper. A challenge-response for CSRs would be possible if we were able to set the angle of illumination. We are not yet technologically capable to control this variable with precision.
3.1. Robustness and Reliability
In practice, assessing whether requirement (1) holds true must be quantified experimentally. It requires the availability of a large data set of different images from different readouts. This is necessary even if there is a vast literature on image processing and information extraction (e.g., see [20]), because any material is different and has its own physical features, different responses, and ways to be analyzed.
3.1.1. Robustness
A robust authentication process should, for a specific CSR ID, accept any image of optical responses of that tag despite the inevitable presence of noise during the readout. In fact, any retake (i.e., any optical response taken from the same tag at another moment in time) contains noise of different sources e.g., due to the use of different devices, different ambient light, and position of the physical tag under the camera. If are the extracted features of the reference image , and the corresponding identifying information extracted from any retake image of w, then robustness is formalized as follows:
Definition 1.
[Robustness]
Informally, whenever the CSR ID is original, our matching procedure comparing extracting features should not be rejected even in the presence of noise. As we will see in the next section, robustness is assessed in terms of false-negative ratio and intra-distance between a reference readout and all its retakes. Definition 1 does not suggest how to implement or : it defines a property they are required to satisfy.
It also suggests that the chosen implementation should work for all different images coming from CSR IDs. This is advisable: we do not wish to have a family of and each for each CSR IDs. We seek for an implementation that is as much as possible independent from the different images we can encounter with CSR IDs.
3.1.2. Reliability
A verification procedure for CSRs should also be reliable. This means that it should reject any image of any other CSR ID. Noisy images, with natural noise (here we do not consider an adversary forging images, but images with noise due to retakes), should not be such that to make the verification procedure accepting.
Definition 2.
[Reliability]
We will measure the reliability in terms of false-positive ratio and inter-distance between readout from a CSR ID and the set of retakes from other CSR IDs.
3.2. Algorithms Design
From Arenas et al. [6], we discuss one specific design for and . Our strategy takes inspiration from feature extraction and minutiæ detection, two techniques used in the biometric analysis (e.g., [21]). They consist in extracting from an image a few specific features that are argued to be identifying.
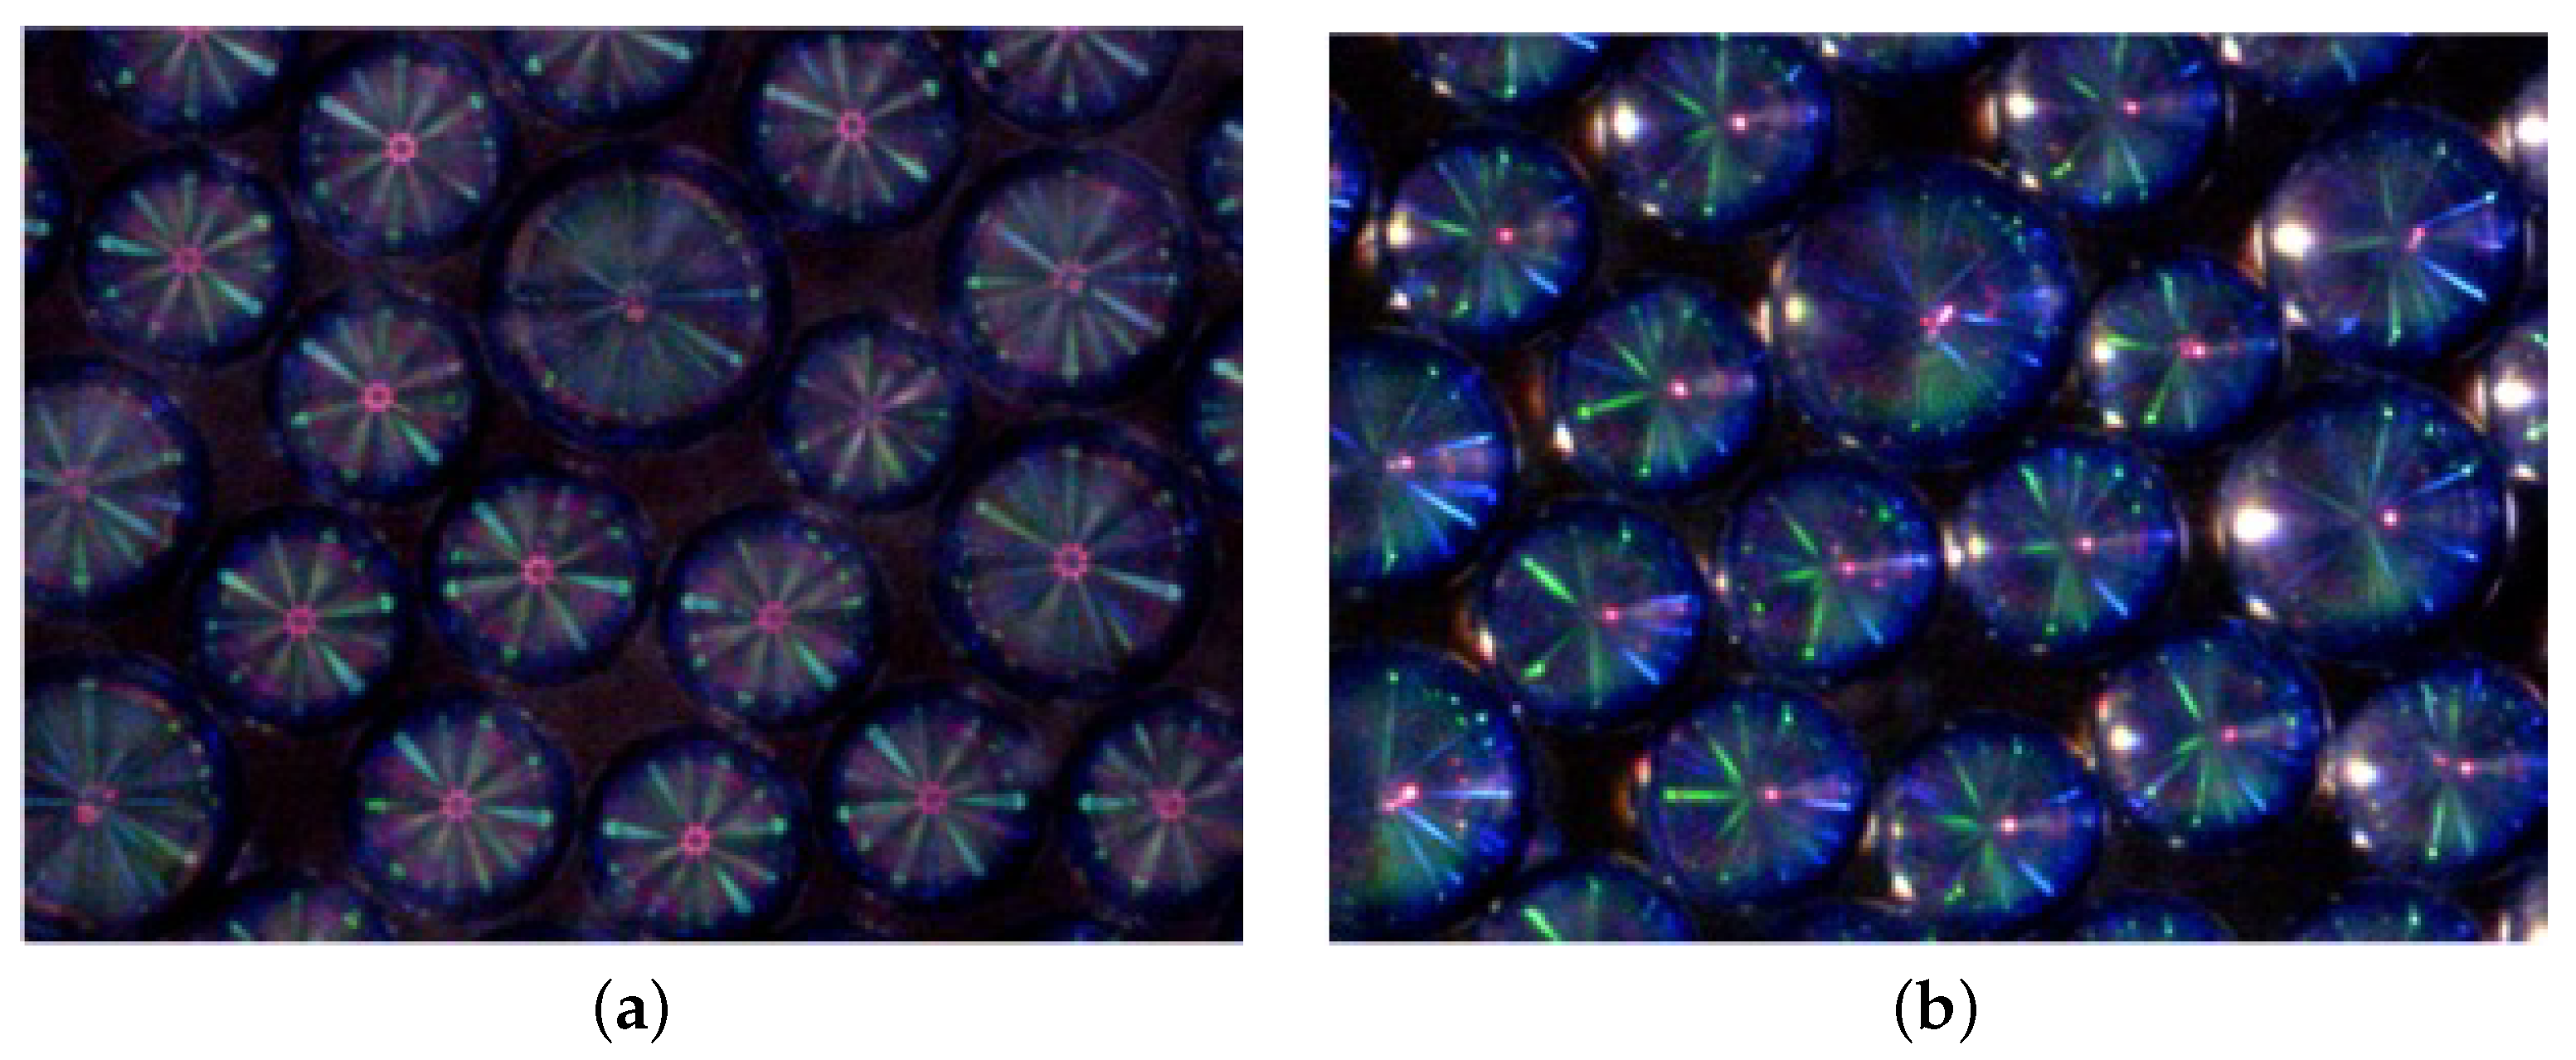
What can be minutiæ in a CSR ID’s response? CSRs are spherical objects. When photographed, they appear like circles; thus circles and their centers are well-defined concepts derived from “physical” properties of CSRs. In addition, in a CSR ID’s response, at least when the illumination is perpendicular to the sample (as in Figure 1a and in all images in Figure 2), there are other spots of reflected light. Along the perpendicular illumination, one can observe reflection spots from every center of CSRs. These colored elements are observable across all responses. Other colored spots are present, due to radial and azimuthal distributions with respect to the centers of each CSR.
These observations suggest that we can consider as minutiæ the colored circles of different sizes and positions (i.e., the blobs) that can be recognized in an image of a CSR ID when illuminated perpendicularly. Primary minutiæ emerge because CSRs have a physical center and secondary minutiæ are aligned with “cross-communication” between CSRs. Blobs can be recognized and extracted from a picture using refined image processing procedures.
Our current implementation works with such minutiæ, visible when the illumination is perpendicular to the surface of a CSR ID. If we change the angle of illumination, as in Figure 1b, other colored patterns emerge that have a circular shape. They cannot be considered blobs anymore. In that case, our approach is not valid. But, we commented already that changing the angle illumination is not a controllable variable at the moment. Perpendicular light is what naturally comes from microscopes, even those embedded in phones. Setting a different angle of illumination, e.g., at , requires a considerable effort. Setting the illumination at any other angle, e.g., at , is currently not even feasible. This means to suspend using the full challenge-response behavior that CSRs can offer. Analyzing nonstandard images such as the one in Figure 1b is left for future work.
We stress that here we analyze the minutiæ/blobs in images obtained from a single challenge-response combination. We could repeat the procedure for images corresponding to different challenges to exploit the PUF-characteristics of CSR-based authentication. While we thus do not fully probe the PUF aspects of the tags in this paper, the procedures that we develop here will form the basic algorithmic building blocks for the full implementation of CSRs authentication.
We describe an implementation in Python of and of this design idea in the next section. We give here the main features of how we calculate a similarity score, and the predicate . Let be a list of blobs extracted from a read-out z, and and be, respectively, the circle (i.e., centre position and radius) of b and its colour e.g., in . We call the processed version of t which has been aligned with . Our implementation of similarity score depends on an equivalence relation that defines when two blobs do match according to the relative positions of their circles and their colours. A possible algorithm for is as follows:
and are thresholds, and is a distance over RGB color space. We can construct local matching structures [22,23], as the set of minutiæ in and in relation to one another according to (5). After the image alignment, given a local structure, we can calculate a global matching score as follows:
Equation (6) is a linear function that ranges in . It returns 0 if the blob structures have no matching blobs; the value increases linearly with the number of matching blobs. It returns 1 when two blob structures match entirely. Equation (6) is a simple measure of similarity, but serves the scope of this paper: testing Hypothesis 1. Other measures are possible. For instance, instead of a linear function, we can use a sigmoid function if we prefer a similarity score that increases significantly only after a certain threshold of matching.
4. Materials and Methods
4.1. CSR IDs and Response Data Sets
The CSR IDs were produced by the Experimental Soft Matter Physics (ESMP) group of the Department of Physics and Materials Science at the University of Luxembourg. The group is constantly working on improving CSR physical and optical properties [3,5,24]. For this work, they produced two batches of tags, using different production processes: Process One and Process Two. The names are fictional, but what counts is that different processes give slightly different CSRs. We were in the position to verify Hypothesis 1 reducing the dependency of our results on one particular production process.
Batch Process One consists of 12 CSR IDs physically resembling plastic supports of the size of a small Lego piece (see Figure 3). Tags contain droplets of diameter ranging from 50 μm to 100 μm. Batch Process Two included 52 CSR IDs, also containing droplets but with a smaller diameter, varying, across tags, from 20 μm to 50 μm. These tags look-alike small rigid plastic films, less thick than the tags in the previous batch. We comment on the thickness because it affects the noise due to the reflection of light in the support. The batches were used to generate two different data sets of responses which we call Laboratory Data set, and Realistic Data set.
4.1.1. Process One and Laboratory Data set
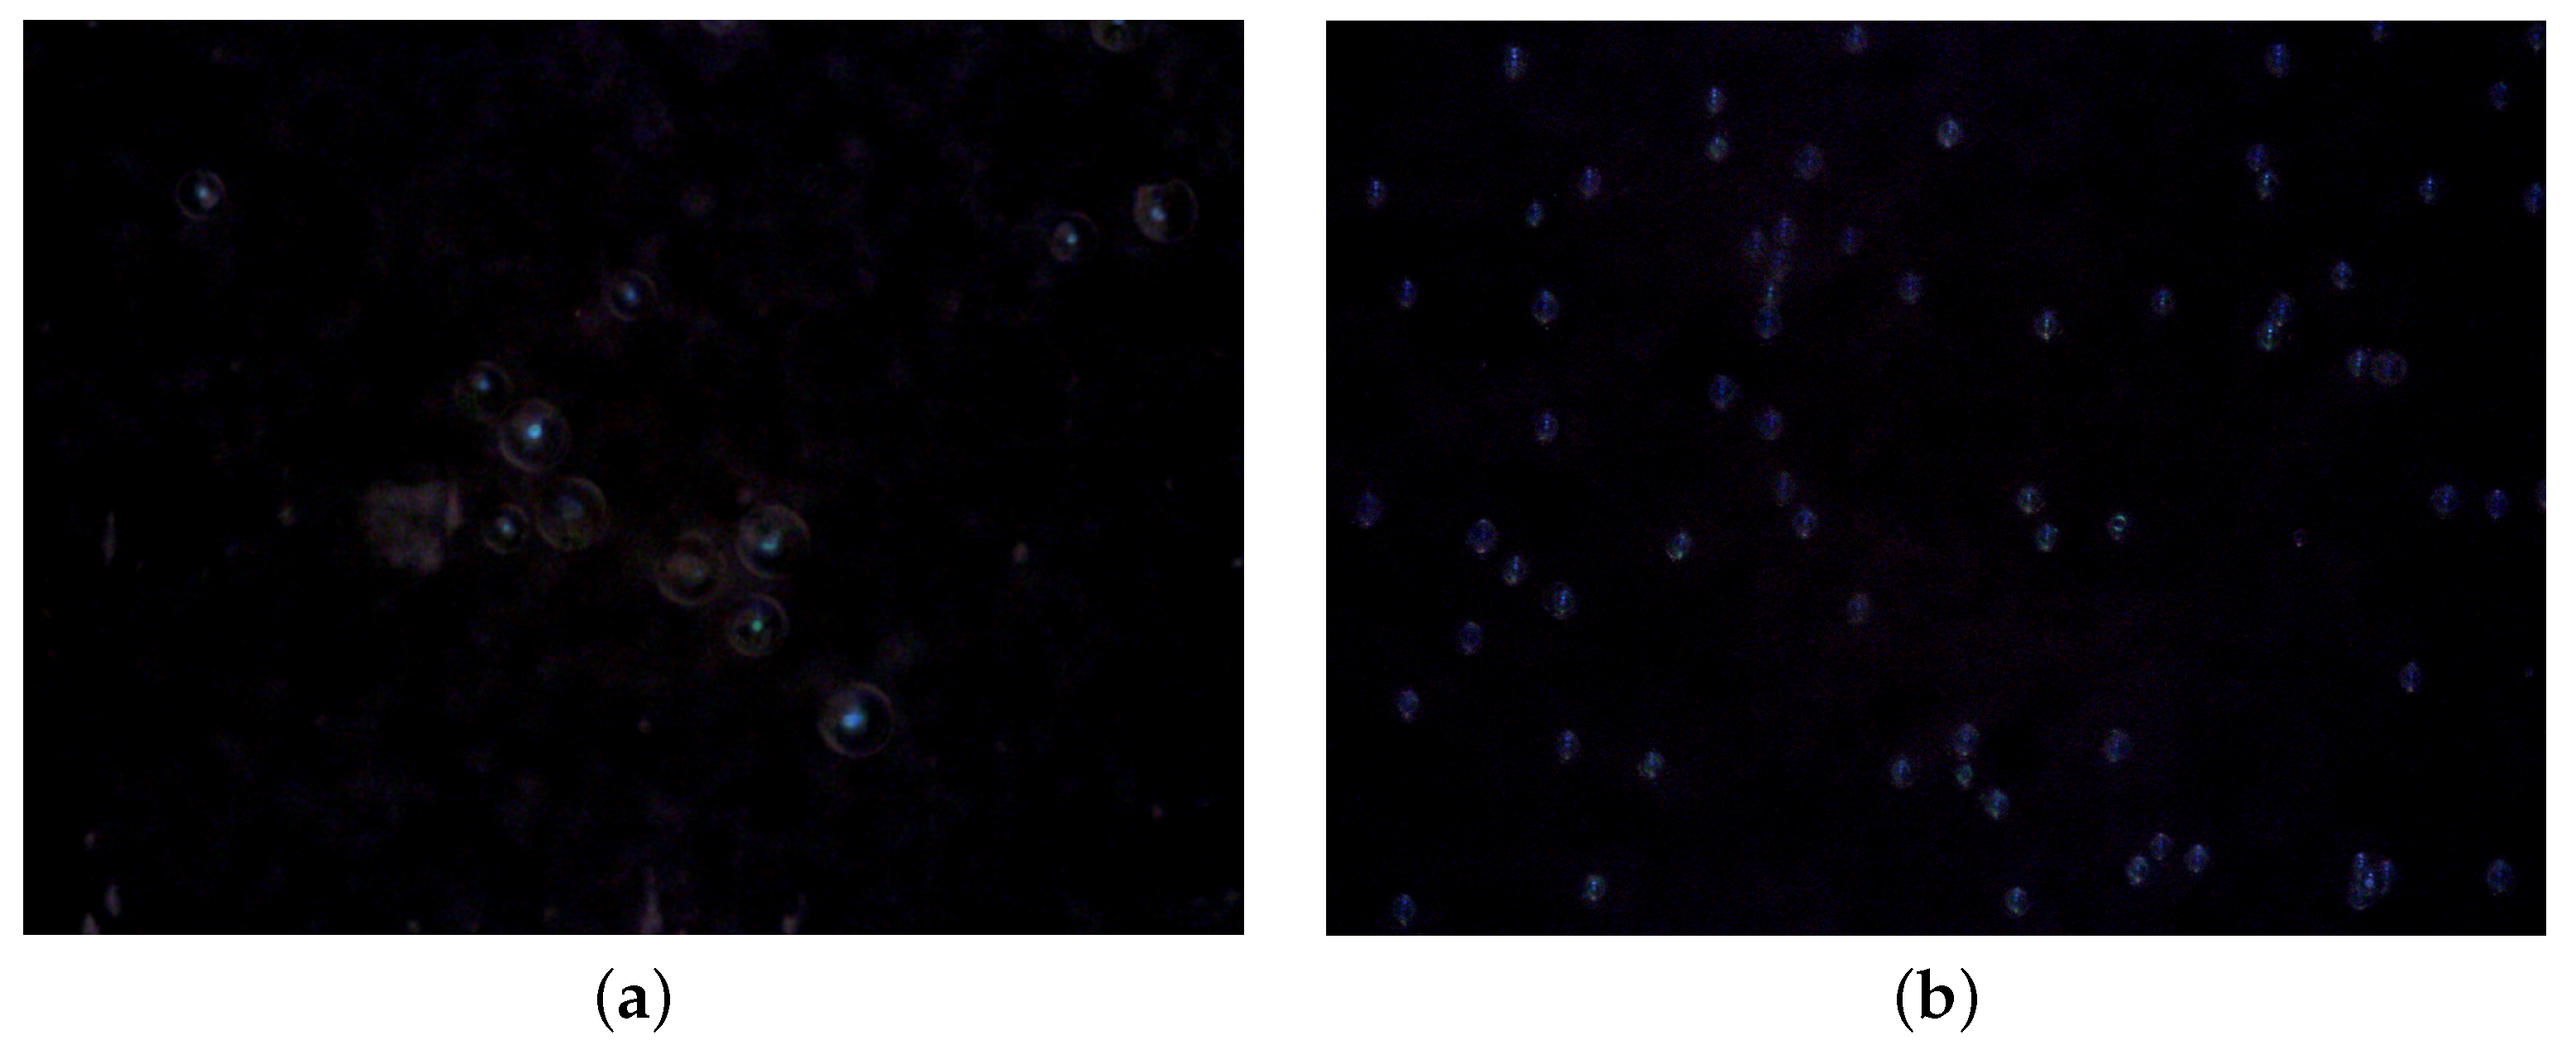
The CSR responses coming from Process One were acquired with an Olympus professional polarized microscope equipped with a digital camera and illumination perpendicular to the sample. This microscope is an expensive piece of equipment. We used it to start studying CSRs for verification in optimal laboratory conditions. Figure 5a shows a CSR response acquired with the Olympus microscope and we observe that each CSR presents well-defined and colored patterns.
Laboratory Data set consists of 540 images. It contains 12 original images from the laboratory, and the others obtained by artificially injecting noise into the original 12. The noise is supposed to simulate user and ambient noise (i.e., similarity noise) and noise due to the use of digital technology (i.e., Gaussian noise). The similarity noise considers the external conditions, such as rotation and the presence of regions out of focus, as described in [6]. The Gaussian noise simulates the photonic and electronic noise inherent in a device, it occurs during the image acquisition under low-light conditions, which makes it difficult for the visible light sensors to efficiently capture details of the object [7].
We generated a set of CSR responses by applying to the reference images the operations listed in Table 2. The ranges have been determined to noise within realistic external conditions. For the rotation operation, we considered anticlockwise steps of 1 degree up to 5 degrees. The blurring operation ranges from and is limited up to a pixel window. The blurring effect averages out changes in pixel intensity. Larger kernels (window of pixels) have more values factored into the average, implying that a larger kernel will blur the image more than a smaller kernel [25,26]. We also added Gaussian noise with a maximum standard deviation of .
4.1.2. Process Two and Realistic Data set
The CSR responses coming from Process Two were acquired with a USB Dino-Lite digital microscope at a perpendicular illumination to the sample and flexible LED control. Unlike the professional microscope, which uses a reflection cube to split the light, the Dino-Lite microscope uses LEDs located at the outer part of the optical tube. This microscope is an affordable piece of equipment and can be easily used by a layman. It has a black surface to hold the sample, without retro illumination. This is not optimal: images are much darker, as we will see in the next section.
Figure 5b shows a CSR response acquired with this microscope. The CSRs are still visible but are smaller with a significant loss in detail. Still, circles and spots of colors are recognizable. These images may be closer to the images acquired by an end-user with no experience and/or professional microscopes. In addition, the Dino-Lite is the closest device we had in use to simulate a user taking pictures with a mobile device. A wireless version of a microscope can in fact be used with phones. In the future, we plan to create further data sets taken with the last generation of smartphones, such as the OPPO Find X3, which have a microscope built-in.
We could operate the Dino-Lite microscope from a laptop and easily acquire 100 images at intervals of time between each acquired image of 2 s. At least for the experiment considered in this work, we did not introduce artificial noise. The images we took were affected by some real noise already. A student positioned the CSR IDs under the microscope; by hand, she put the image in focus, choosing the magnification; the artificial and the natural ambient light coming from the outside was changing (e.g., daylight from the morning to evening, the tables holding the microscope were one under the artificial light, the other far from it).
The position of the tags is not too critical as they were taken more or less at the same position. We deal with the lighting conditions as they may vary due to the nature of the sensor/camera, meaning that they have inherent Gaussian noise. The illumination was perpendicular to the sample, as shown in Figure 1, but the pictures were taken in an office room with light pollution, mainly ambient light, and light coming from outside through a large window This noise due to external conditions, such as some regions out of focus is clearly visible in some pictures. The total generated data set is shown in Table 3.
4.2. Image Processing and Alignment
Implementing all steps of the process in Figure 4 requires the implementation of image processing procedures to align images and extract minutiæ i.e., the positions, radii, and colors of blobs.
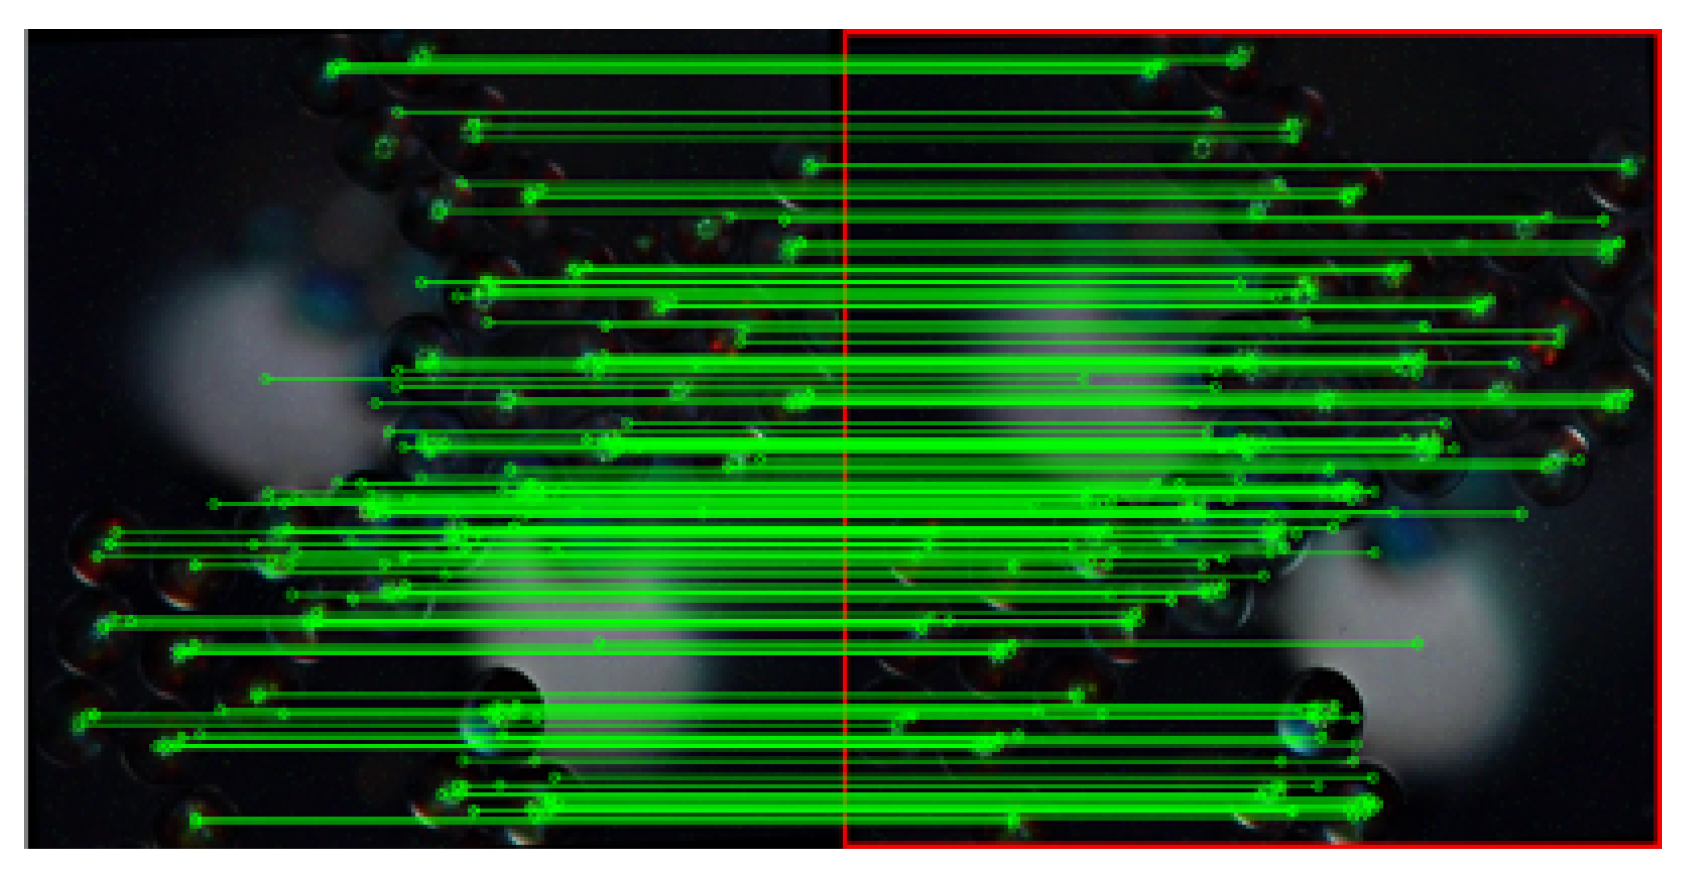
We performed the alignment between w and based on the algorithm described in [6]. The alignment relies on the Scale-Invariant Feature Transform (SIFT) [27] and the Random Sample Consensus (RANSAC) [28] methods to extract the key points representing the features of images; we resort to the homography method to calculate the alignment of two images, as observed in Figure 6. We converted both images, reference and aligned, into gray-scale, then we computed the histogram matching. This transformation adjusts the pixel intensity of the aligned images according to the illumination and contrast of the reference image.
4.3. Matching and Similarity Score
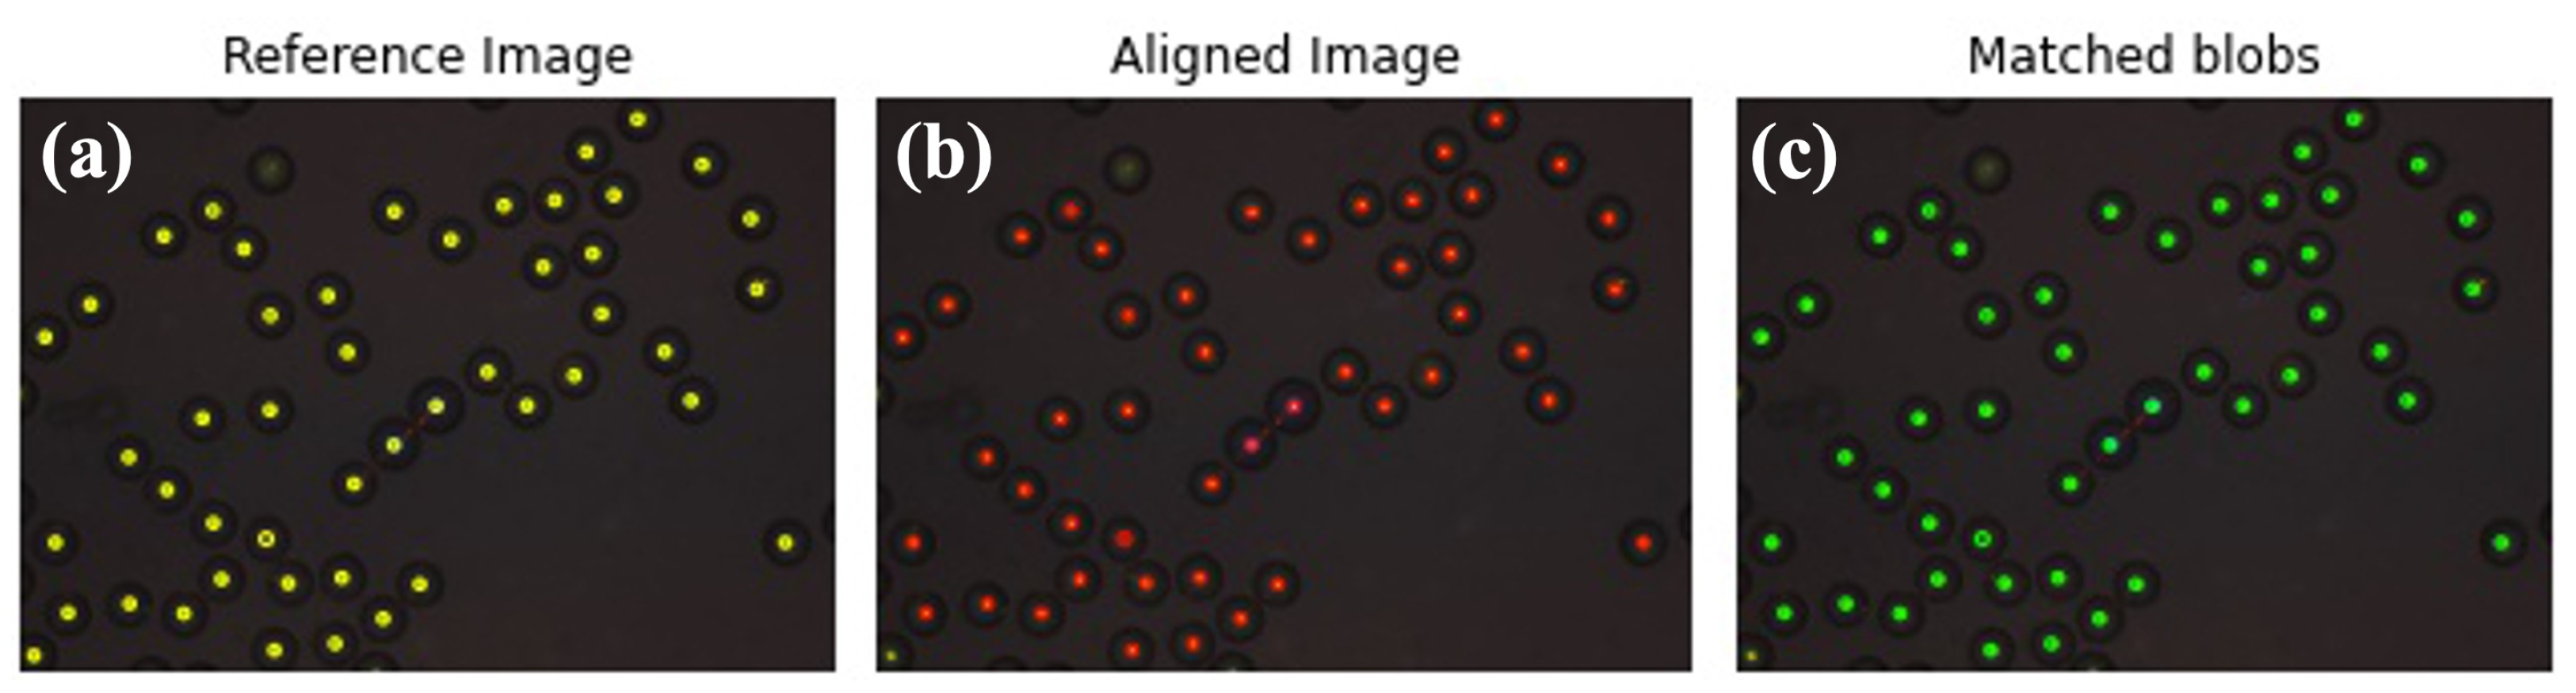
After alignment, we extracted the positions and radii of blobs of the reference image (gray-scale) and of the aligned image (after histogram matching) using a blob detection algorithm. The position and the radius are extracted by using a blob detection algorithm from the Scikit-image library, producing a matrix of size , where n is the number of extracted blobs. We compared the position of each blob of the reference image with each blob in the aligned image for obtaining the matched blobs. Figure 7 shows this process in images, in which blobs’ features and colors are encoded as lists.
4.4. Implementation
The implementation was conducted in Python 3.8.7 on Ubuntu 20.04 LTS Operating System (CPU Intel® CoreTM i3-10100 at 3.60 GHz—8 Cores, 32 GB RAM with 64-bits).
To evaluate reliability and robustness, we set the experiment depicted in Table 4. The alignment was obtained in approximately 0.295 ± 0.091 s whereas the blobs detection took around 20.777 ± 4.637 s. The processing time for the blob detection has a large variance since the complexity of extracting the blobs depends on the structure of the images (i.e., blob density). We improved this performance by implementing a parallelized process by using six cores.
Our code and the data sets are available on git at https://gitlab.uni.lu/irisc-open-data/2021-nofakes (accessed on 22 January 2022).
5. Results
As explained in Section 4.2, a proper alignment is required. When two images do not align is because there are no common features between them and therefore no matching blobs. We expected and confirmed that if alignment fails, the similarity score is zero or very close to zero.
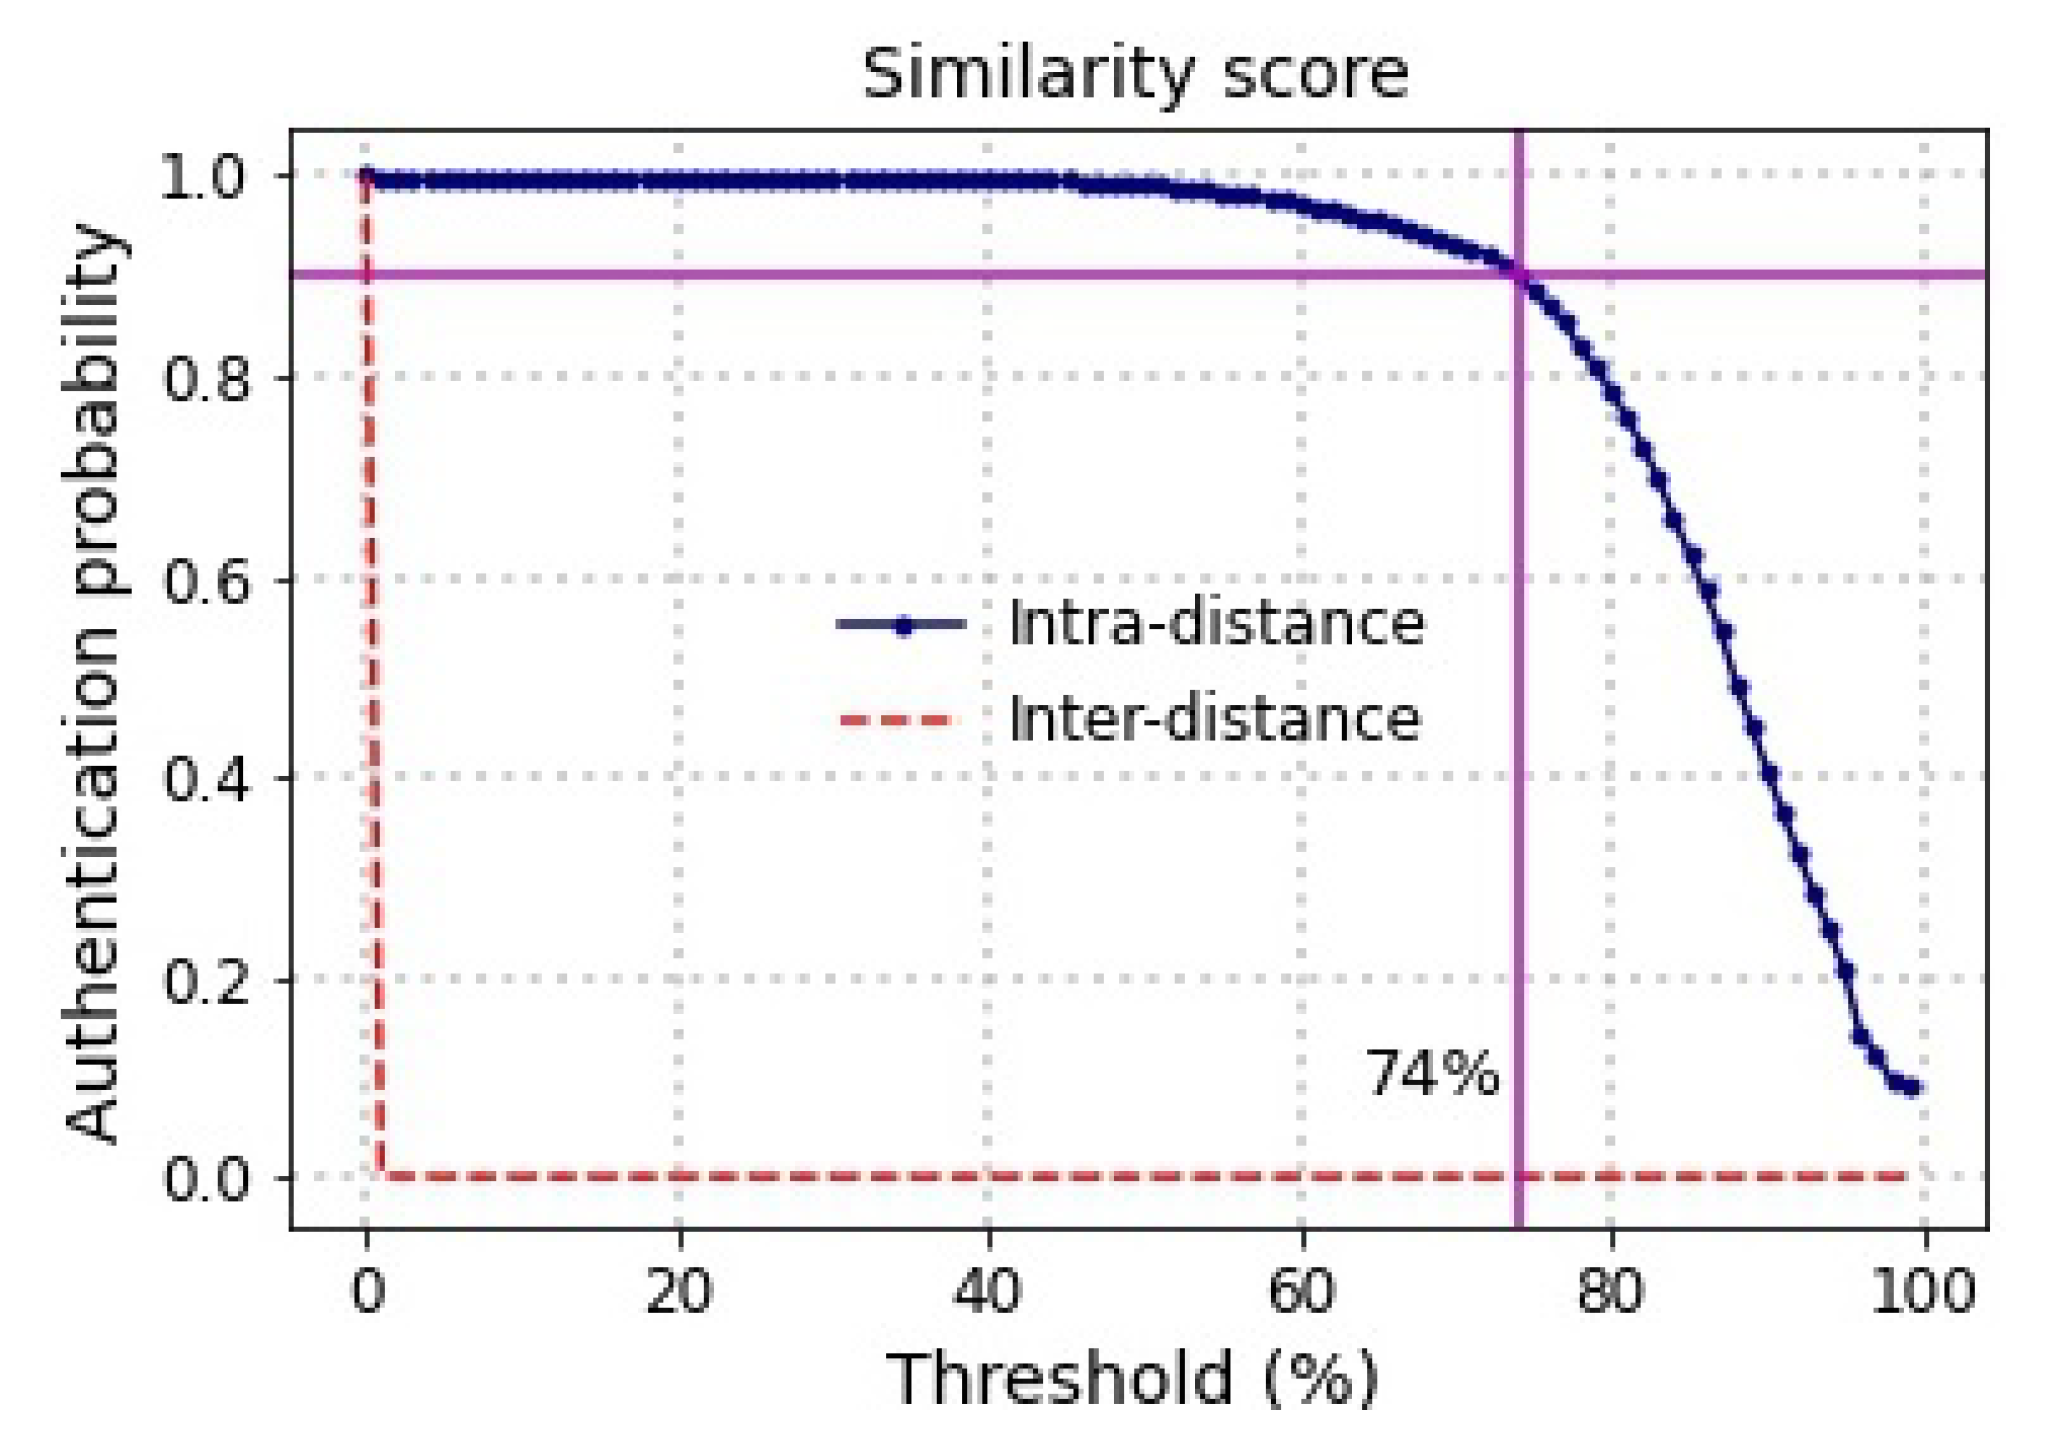
For each comparison, we calculated the . From the score distribution of each reference image compared with the set of references and retakes from other images, we estimated the reliability, in terms of false-positive ratio and inter-distance. Figure 8 depicts that there is a trade-off between the acceptance rate and false positives according to the choice of the threshold. The expected authentication rate for correctly identifying a retake image is when choosing a threshold value up to 50%. The corresponding acceptance rate for incorrectly flagging an unrelated response is , i.e., the false-positive ratio is also zero. We can guarantee an authentication greater than when choosing a threshold up to 74%.
The total execution time for the inter-distance for a total of 23,960 comparisons was about four hours and a half. When the alignment fails, the blob detection algorithm, which is the most computational-intensive process, is not triggered. For the intra-distance comparisons, we observed a difference between Laboratory Data set and Realistic Data set. For the first one, the execution time per CSR response was on average 4.43 s, i.e., ≈40 min for the complete data set. In contrast, for the Realistic Data set, the execution time per comparison was on average 15.14 s. The execution time differs because the responses from Realistic Data set are darker (background and CSRs) and, the alignment and blob detection algorithms take more time in executing these tasks.
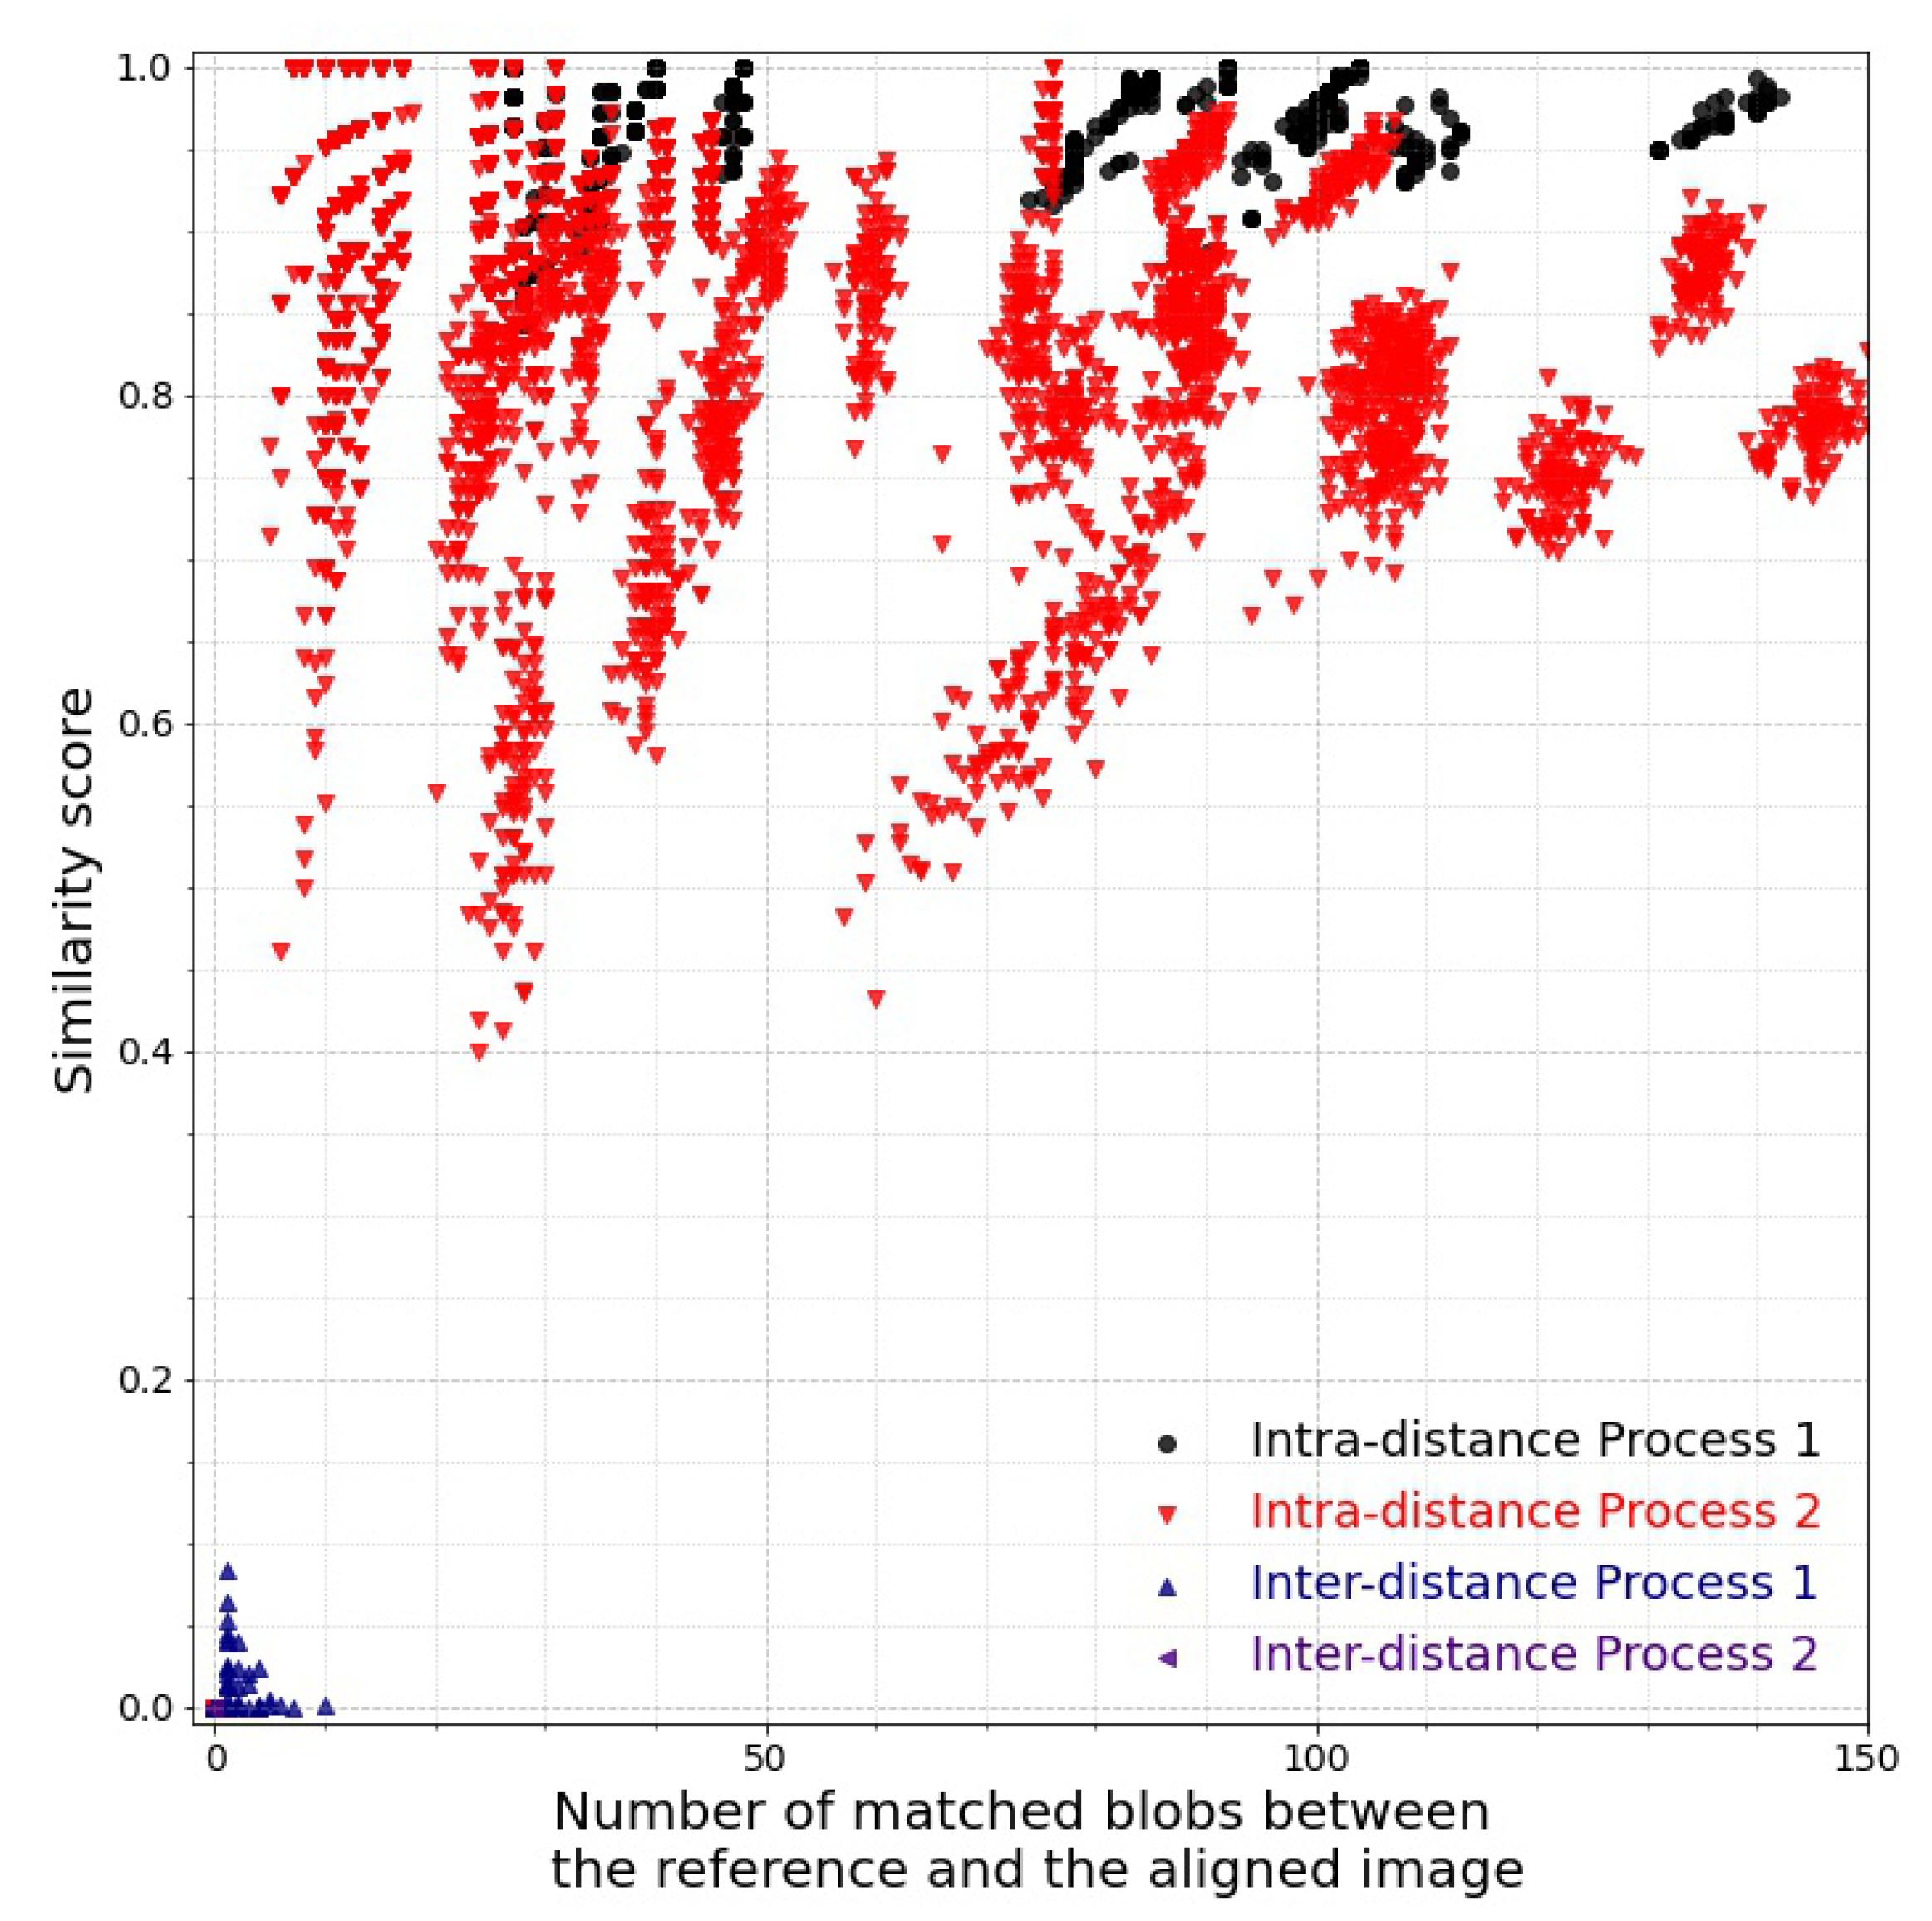
Figure 9 shows the similarity score as a function of the number of detected blobs. A separation between the intra- and inter-distance clusters can be observed. Some values of intra-distance, mostly related to the Realistic Data set, are lower than expected because of two main reasons: a low number of CSRs is detected and, low contrast between the background and the CSRs is observed, making difficult the detection of the CSRs. What does our analysis mean with respect to Hypothesis 1? A criterion to assess whether the hypothesis is confirmed or falsified is that the intra-distance scores must be neatly separated from the inter-distance score. In addition, at least, the minimal intra-distance must be bigger than the maximal inter-distance for all the samples compared and for both Laboratory Data set and Realistic Data set. This condition is fulfilled, as clearly observed in Figure 9.
6. Discussion
Interdisciplinary research on CSRs, beyond the interest they spurred in physics and chemistry for their optical properties, is on the rise due to the variety of potential applications of the material. For instance, since CSRs can be made left- and right- circular polarized, we can use them to encode binary information. Schwartz et al. [5] have envisioned using this feature to make fiducial markers, which are black and white codes that help robots navigate in an environment. In this idea, CSRs work at macroscopic level: by using polarized lenses (such as the 3D glasses we enjoy at movie theaters) the left and right polarized presence can be revealed and separated. The CSR fiducial can be “read” as if it were a normal binary code. From fiducial markers to QR codes the step is a matter of engineering and the properties we have studied in this work about security, and concerning the microscopic characteristics emerging because of light being reflected by and across single CSRs, suggest an important potential scenario for information security: the possibility to combine macro- and micro- properties of CSRs in future QR-codes made of CSRs, then bringing into the same physical element (e.g., the printed code) both numerical identifiers and unpredictable unique unclonable information that can be used to prove the authenticity of the code. In short, with CSRs, it is conceivable to produce unclonable QR codes. We believe this be the real game-changer in fighting against substandard, spurious, falsely labeled, falsified, and counterfeit (SFFC) products.
There is still a lot of research to be done before this vision becomes reality. If CSR IDs are indeed unclonable, and if the patterns they produce are unique and usable in authentication, we have to prove that such information can be reliably and robustly extracted and used for the purpose. We need evidence that images of CSR ID’s optical patterns taken with a camera can work as a substitute of fingerprint for objects, functional to verify an object’s authenticity. Despite any speculative arguments, there has been so far not enough evidence that CSRs’ patterns contain identifiable information to reliably and robustly distinguish one CSR ID from another. In addition, using CSR IDs for real means to verify that such pieces of identifiable information can be extracted not only from ideal images of CSRs taken out of the laboratory but from everyday noisy images taken with everyday devices, for instance, a USB microscope or a phone. To shed light on such problems is what is motivating our recent research and this research we report here in particular.
In a previous conference paper [6], we suggested looking for minutiæ in CSRs images, blobs of colors that find their justification because CSRs are spheres that reflect spots of colors. We have designed a method to extract such blobs, to compare them, and to calculate the ratio of similarity between two CSRs’ images on the basis of the number and the quality of blobs that match between a taken and a reference image. In this work, we have improved those algorithms and carried out a set of experiments to calculate intra- and inter-distance over two large data sets: the first containing tens of CSRs images taken in the lab to which we have added transformations and Gaussian noise; the second data set consists of a hundred of raw images (i.e., .tif) taken with a USB microscope, which a person could use in a real scenario, and under everyday conditions of noise such as ambient light.
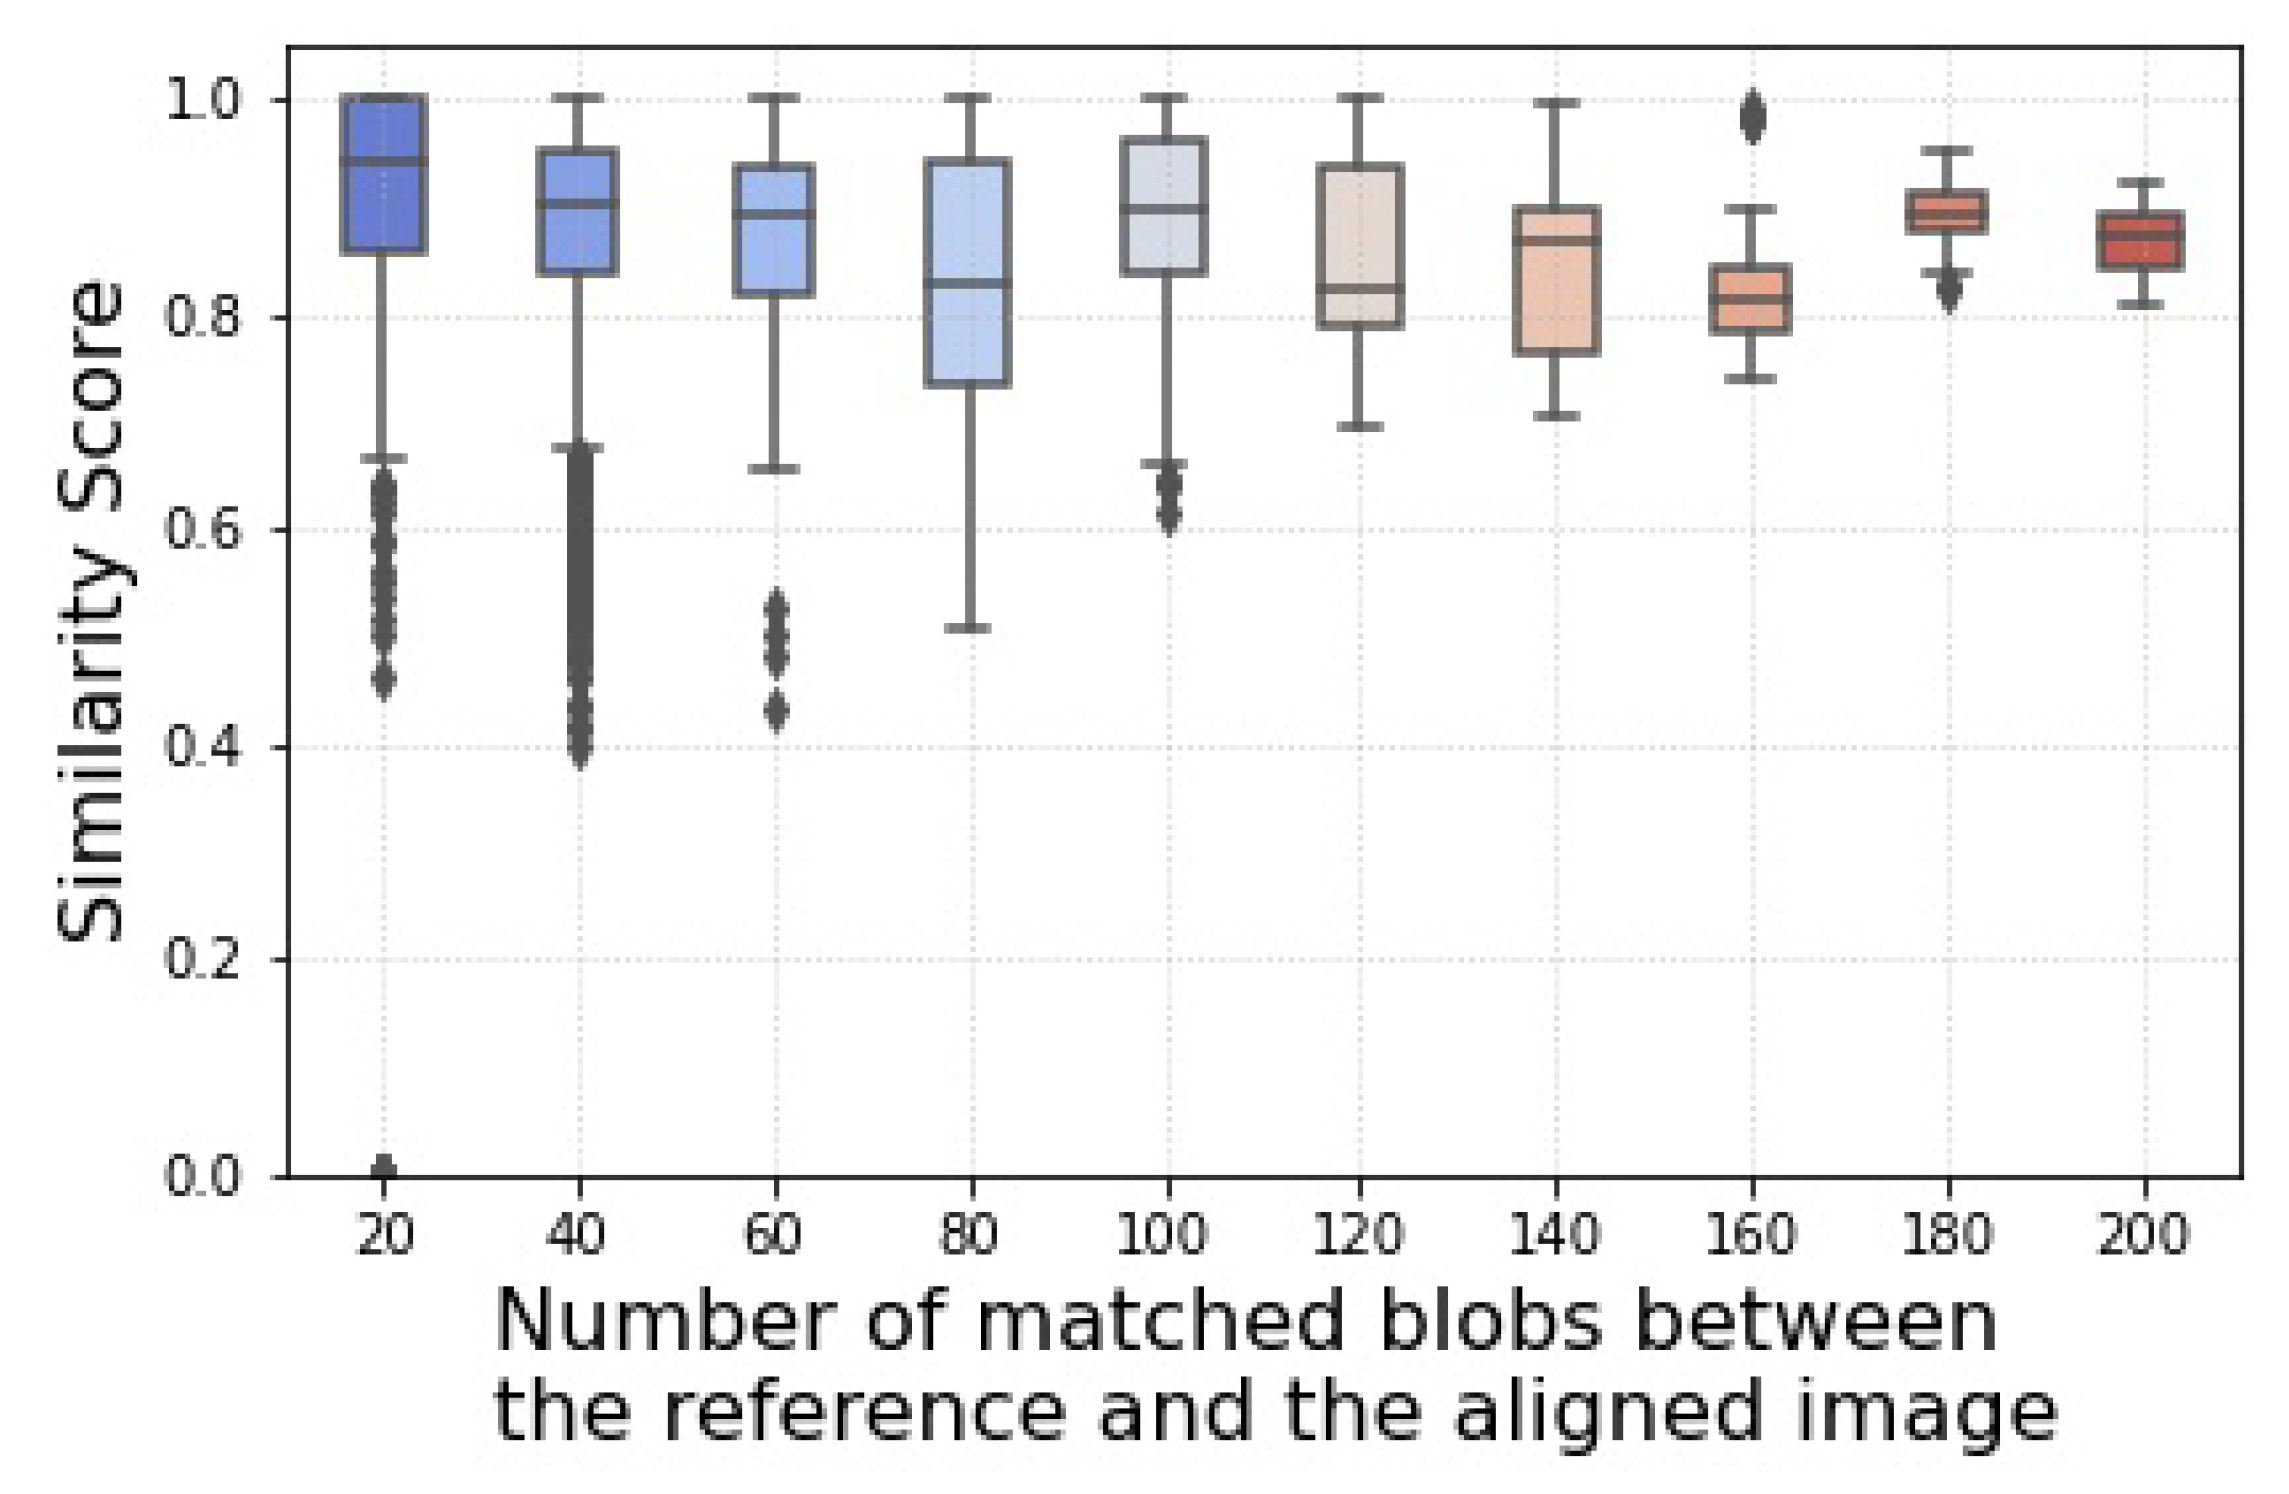
Our results show that intra- and inter-distance for both categories are neatly separated, Figure 9, giving arguments in favor of the hypothesis we opened. The absolute score of the intra- distance is, in certain cases that we are going to discuss, lower for images taken under realistic conditions than for those taken in the more controlled taken in the laboratory. Figure 10 shows that, on average, our similarity score remains high and with an acceptable variance, but when the number of detected blobs is small, several out-liners appear. This suggests the presence of noise in our processing, noise that we were not yet able to tame. We comment on the source of such noise in the next paragraph but yet Figure 9 and Figure 10 confirm that blobs do represent meaningful minutiæ and that they are key elements in distinguishing one CSR ID from another. We have evidence for our hypothesis.
Looking at Figure 10, we notice that the number of outliers is high when the number of detected blobs is small. The amount of information from the blobs is just not enough to distinguish reliably two tags, and the nature of our similarity score functions (see Equation (5)) does the rest: when the number of detected blobs is small, small variations in the number of matching blobs causes large variations in the output score.
However, when and why do we detect not enough blobs? We have identified three reasons. The first is that there are few CSRs in a tag. Controlling this variable is out of our control, but we can make it a requirement that CSR IDs should have enough CSRs. Our methods need minutiæ to work reliably. Our does not work well with a low number of blobs. A small mismatch causes a large variance in the score, as Figure 10 shows.
A second reason is that our algorithm for blob extraction, in certain cases, fails to recognize but a few CSRs in a tag. We observed this happening for a few images in the Realistic Data set, but not in general. Our algorithm seems to works well, but it performs badly with certain images. We have run the algorithm several times to understand what could cause such an effect. One fact that we noticed is that the blobs’ detection algorithm depends on the intrinsic parameters of the skimage.feature.blob_log module that we used in our implementation, i.e., the parameters to detect smaller and larger blobs. This parameter must be optimized and tuned depending on the nature of the images. Our two data sets, for instance, understandably requires different parameter settings.
However, even when the parameters have been optimized, an analysis by the eye of the images where we obtain a particularly low score confirms previous observations we had, but never articulated explicitly: that reflections that have a bluish color seem to be harder to be detected as blobs than a reflection of other colors (e.g., see Figure 7). Perhaps there is not enough contrast between the black background and the bluish reflection, as in the image in Figure 11b. This is an image that caused some of the low scores in the diagram. The image may look all black in print, but blueish spots can be seen with some effort. We need to investigate this question more deeply, but that problem with bluish spots was observed before in images in Laboratory Data set; there the spots were there due to secondary, cross-CSRs, reflections. Their effect was mild, not enough to increase the noise of the output to observable levels as instead happens in Figure 9.
One last reason for having a small number of blobs can be that the images have, simply put, a “bad quality”. This problem can be addressed and solved by working on improving the read-out process. To compare to the state of the art in related technology, fingerprint sensors, the read-out has a retro illumination and more images are taken one after the other so that the minutiæ detection depends on images of the best quality, rather than on just a single one. Improvements can also come from the technology used to produce CSRs; “tuned” to reflect light at different frequencies, the central spots color should have more contrast against the background of the object that will carry the CSR ID. In our case, the central spots are blue and the background of the microscope’s holder is black: not an optimal combination of colors.
7. Conclusions and Future Work
The goal of this work was to look for evidence for or against the hypothesis that CSRs can be a material with potential in the quest for a reliable technology for object authentication. We aimed to analyze as much as images as possible from different batches of production for tags that contain CSRs. These were images that were given to us and taken from a professional microscope, and images we could generate ourselves with cheap technology once we had the possibility to operate on existing tags. We also looked for objective measurements in order to quantify the truth of our intuition, as stated in previous works [3], that CSR IDs contains enough entropy to be used as identifiers.
Despite a few drawbacks, it is fair to conclude that, because of our choice of using a large number of different types of CSR IDs, our investigation brings evidence for the acceptance of the hypothesis: CSRs have the potential to provide objects with unique fingerprint-like features. However, our proof-of-concept technology and methodology are still at an early stage; they can be improved and tweaked to work better. For that, we foresee a common effort both from the side of engineering (e.g., to acquire better images, controlling the position of a tag below a read-out device, or to put images on focus) and computer image processing (e.g., to extract blobs) before we can improve the performances we obtained here. We have identified a few requirements for improving a future CSR-based object verification technology.
For our future work, we intend to explore what happens when we take pictures with new generation phones such as the OPPO Find X3 that mounts an embedded microscope. We are also working on different solutions for authentication. The first consists of using Siamese Neural Networks for the verification. Despite the drawback of requiring more images and a longer time for the training, we do not know whether machine learning will be a competitive approach to ours. An evidence-based discussion would help highlight the pros and cons of our solution with respect to a solution built entirely on machine learning. We are also working on designing security protocols for a possible remote verification process. Here, the verifier holds the object and takes pictures of it, but the reference images are on an authentication server. In this scenario, we need to protect the messages flow and the information from curious parties, including the verifier(s). We are devising a solution based on secure sketches and fuzzy extractors applied on the blob space, so derive a consistent identifying bit string from noisy CSR images and on a verification protocol that uses Homomorphic Encryption to protect the data exchanged for the verification.
Author Contributions
Conceptualization, M.P.A., H.D. and G.L.; Data curation, M.P.A.; Formal analysis, M.P.A., H.D. and G.L.; Funding acquisition, G.L.; Investigation, M.P.A., H.D. and G.L.; Methodology, M.P.A., H.D. and G.L.; Resources, G.L.; Software, M.P.A. and H.D.; Validation, G.L.; Visualization, M.P.A.; Writing—original draft, G.L.; Writing—review and editing, M.P.A. and G.L. All authors have read and agreed to the published version of the manuscript.
Funding
This research was funded by the Luxembourg National Research Fund (FNR) with the projects Security in the Shell “SSh” (C17/MS/11688643), and No more Fakes “NOFAKES”: (PoC20/ 15299666/NOFAKES-PoC).
Data Availability Statement
Datasets and source code are available at: https://gitlab.uni.lu/irisc-open-data/2021-nofakes (accessed on 22 January 2022).
Acknowledgments
The authors acknowledge J. Lagerwall, Y. Geng, and H. Agha for providing the CSR IDs and the initial images in Laboratory Data set. We thank Laura Lavezza for the acquisition of the Realistic Data set.
Conflicts of Interest
The authors declare no conflict of interest.
Abbreviations
The following abbreviations are used in this manuscript:
| ChLC | Cholesteric Liquid Crystal |
| CRP | Challenge-Response Pair |
| CSR | Cholesteric Spherical Reflector |
| CSR ID | CSR Identifier |
| PUF | Physical Unclonable Function |
| SFFC | Substandard, spurious, falsely labeled, falsified, and counterfeit products |
References
- Geng, Y.; Noh, J.; Drevensek-Olenik, I.; Rupp, R.; Lagerwall, J. Elucidating the fine details of cholesteric liquid crystal shell reflection patterns. Liq. Cryst. 2017, 44, 1948–1959. [Google Scholar] [CrossRef] [Green Version]
- Geng, Y.; Noh, J.; Drevensek-Olenik, I.; Rupp, R.; Lenzini, G.; Lagerwall, J.P. High-fidelity spherical cholesteric liquid crystal Bragg reflectors generating unclonable patterns for secure authentication. Sci. Rep. 2016, 6, 1–9. [Google Scholar] [CrossRef] [PubMed]
- Schwartz, M.; Lenzini, G.; Geng, Y.; Rønne, P.B.; Ryan, P.Y.; Lagerwall, J.P. Cholesteric Liquid Crystal Shells as Enabling Material for Information-Rich Design and Architecture. Adv. Mater. 2018, 30, 1–19. [Google Scholar] [CrossRef] [PubMed]
- Lenzini, G.; Ouchani, S.; Roenne, P.; Ryan, P.Y.; Geng, Y.; Lagerwall, J.; Noh, J.H. Security in the shell: An optical physical unclonable function made of shells of cholesteric liquid crystals. In Proceedings of the 2017 IEEE Workshop on Information Forensics and Security (WIFS), Rennes, France, 4–7 December 2017; pp. 1–6. [Google Scholar] [CrossRef]
- Schwartz, M.; Geng, Y.; Agha, H.; Kizhakidathazhath, R.; Liu, D.; Lenzini, G.; Lagerwall, J.P.F. Linking Physical Objects to Their Digital Twins via Fiducial Markers Designed for Invisibility to Humans. Multifunct. Mater. 2021, 4, 1–19. [Google Scholar] [CrossRef]
- Arenas, M.; Demirci, H.; Lenzini, G. Cholesteric Spherical Reflectors as Physical Unclonable Identifiers in Anti-counterfeiting. In Proceedings of the 16th International Conference on Availability, Reliability and Security, Vienna, Austria, 17–20 August 2021; ACM: New York, NY, USA, 2021; pp. 1–11. [Google Scholar] [CrossRef]
- Deledalle, C.A.; Denis, L.; Tupin, F. How to Compare Noisy Patches? Patch Similarity Beyond Gaussian Noise. Int. J. Comput. Vis. 2012, 99, 86–102. [Google Scholar] [CrossRef] [Green Version]
- Bansal, D.; Malla, S.; Gudala, K.; Tiwari, P. Anti-counterfeit technologies: A pharmaceutical industry perspective. Sci. Pharm. 2013, 81, 1–13. [Google Scholar] [CrossRef] [PubMed] [Green Version]
- OECD/EUIPO. Global Trade in Fakes. Available online: https://www.oecd-ilibrary.org/deliver/74c81154-en.pdf?itemId=%2Fcontent%2Fpublication%2F74c81154-en&mimeType=pdf (accessed on 22 January 2022).
- McGrath, T.; Bagci, I.E.; Wang, Z.M.; Roedig, U.; Young, R.J. A PUF taxonomy. Appl. Phys. Rev. 2019, 6, 1–25. [Google Scholar] [CrossRef] [Green Version]
- Pappu, R.; Recht, B.; Taylor, J.; Gershenfeld, N. Physical One-Way Functions. Science 2002, 297, 2026–2031. [Google Scholar] [CrossRef] [PubMed] [Green Version]
- Shariati, S.; Standaert, F.X.; Jacques, L.; Macq, B. Analysis and experimental evaluation of image-based PUFs. J. Cryptogr. Eng. 2012, 2, 189–206. [Google Scholar] [CrossRef]
- Rührmair, U.; Hilgers, C.; Urban, S.; Weiershäuser, A.; Dinter, E.; Forster, B.; Jirauschek, C. Optical PUFs Reloaded. Available online: https://eprint.iacr.org/2013/215.pdf (accessed on 22 January 2022).
- Mesaritakis, C.; Akriotou, M.; Kapsalis, A.; Grivas, E.; Chaintoutis, C.; Nikas, T.; Syvridis, D. Physical Unclonable Function based on a Multi-Mode Optical Waveguide OPEN. Sci. Rep. 2018, 8, 1–12. [Google Scholar] [CrossRef]
- Dachowicz, A.; Atallah, M.; Panchal, J.H. Optical PUF Design for Anti-Counterfeiting in Manufacturing of Metallic Goods. Available online: https://eprint.iacr.org/2013/215.pdf (accessed on 22 January 2022).
- Arppe-Tabbara, R.; Tabbara, M.; Sørensen, T.J. Versatile and validated optical authentication system based on physical unclonable functions. ACS Appl. Mater. Interfaces 2019, 11, 6475–6482. [Google Scholar] [CrossRef] [PubMed]
- Wang, S.; Toreini, E.; Hao, F. Anti-Counterfeiting for Polymer Banknotes Based on Polymer Substrate Fingerprinting. IEEE Trans. Inf. Forensics Secur. 2021, 16, 2823–2835. [Google Scholar] [CrossRef]
- Lee, J.W.; Hong, H.G.; Kim, K.W.; Park, K.R. A Survey on Banknote Recognition Methods by Various Sensors. Sensors 2017, 17, 313. [Google Scholar] [CrossRef] [PubMed] [Green Version]
- Armknecht, F.; Maes, R.; Sadeghi, A.R.; Standaert, F.X.; Wachsmann, C. A Formalization of the Security Features of Physical Functions. In Proceedings of the 2011 IEEE Symposium on Security and Privacy, Oakland, CA, USA, 22–25 May 2011; IEEE: Oakland, CA, USA, 2011; pp. 397–412. [Google Scholar] [CrossRef]
- Maes, R. Physically Unclonable Functions Constructions, Properties and Applications; Springer: Berlin/Heidelberg, Germany, 2014; p. 206. [Google Scholar] [CrossRef]
- Xu, Y.; Zhang, D.; Yang, J.Y. A feature extraction method for use with bimodal biometrics. Pattern Recognit. 2010, 43, 1106–1115. [Google Scholar] [CrossRef]
- Jiang, X.; Yau, W.Y. Fingerprint minutiae matching based on the local and global structures. In Proceedings of the IEEE 15th International Conference on Pattern Recognition (ICPR-2000), Barcelona, Spain, 3–7 September 2000; pp. 1038–1041. [Google Scholar]
- Mali, K.; Bhattacharya, S. Fingerprint Recognition Using Global and Local Structure. Int. J. Comput. Sci. Eng. 2001, 15, 1952–1964. [Google Scholar]
- Geng, Y.; Kizhakidathazhath, R.; Lagerwall, J.P. Encoding Hidden Information onto Surfaces Using Polymerized Cholesteric Spherical Reflectors. Adv. Funct. Mater. 2021, 31, 2100399. [Google Scholar] [CrossRef]
- Gedraite, E.S.; Hadad, M. Investigation on the effect of a Gaussian Blur in image filtering and segmentation. In Proceedings of the ELMAR-2011, Zadar, Croatia, 14–16 September 2011; pp. 393–396. [Google Scholar]
- Peng, W.H.; Lee, M.Y.; Li, T.H.; Huang, C.H.; Lin, P.C. Performance comparison of image keypoint detection, description, and matching methods. In Proceedings of the 2016 IEEE 5th Global Conference on Consumer Electronics, GCCE 2016, Kyoto, Japan, 11–14 October 2016; pp. 4–5. [Google Scholar] [CrossRef]
- Khan, A.M.; Perez, J.G.; Wells, C.E.; Fuentes, O. Computer vision evidence supporting craniometric alignment of rat brain atlases to streamline expert-guided, first-order migration of hypothalamic spatial datasets related to behavioral control. Front. Syst. Neurosci. 2018, 12, 7. [Google Scholar] [CrossRef] [PubMed] [Green Version]
- Fischler, M.A.; Bolles, R.C. Random Sample Consensus: A Paradigm for Model Fitting with Applications to Image Analysis and Automated Cartography. Commun. ACM 1981, 24, 381–395. [Google Scholar] [CrossRef]
Figure 1.
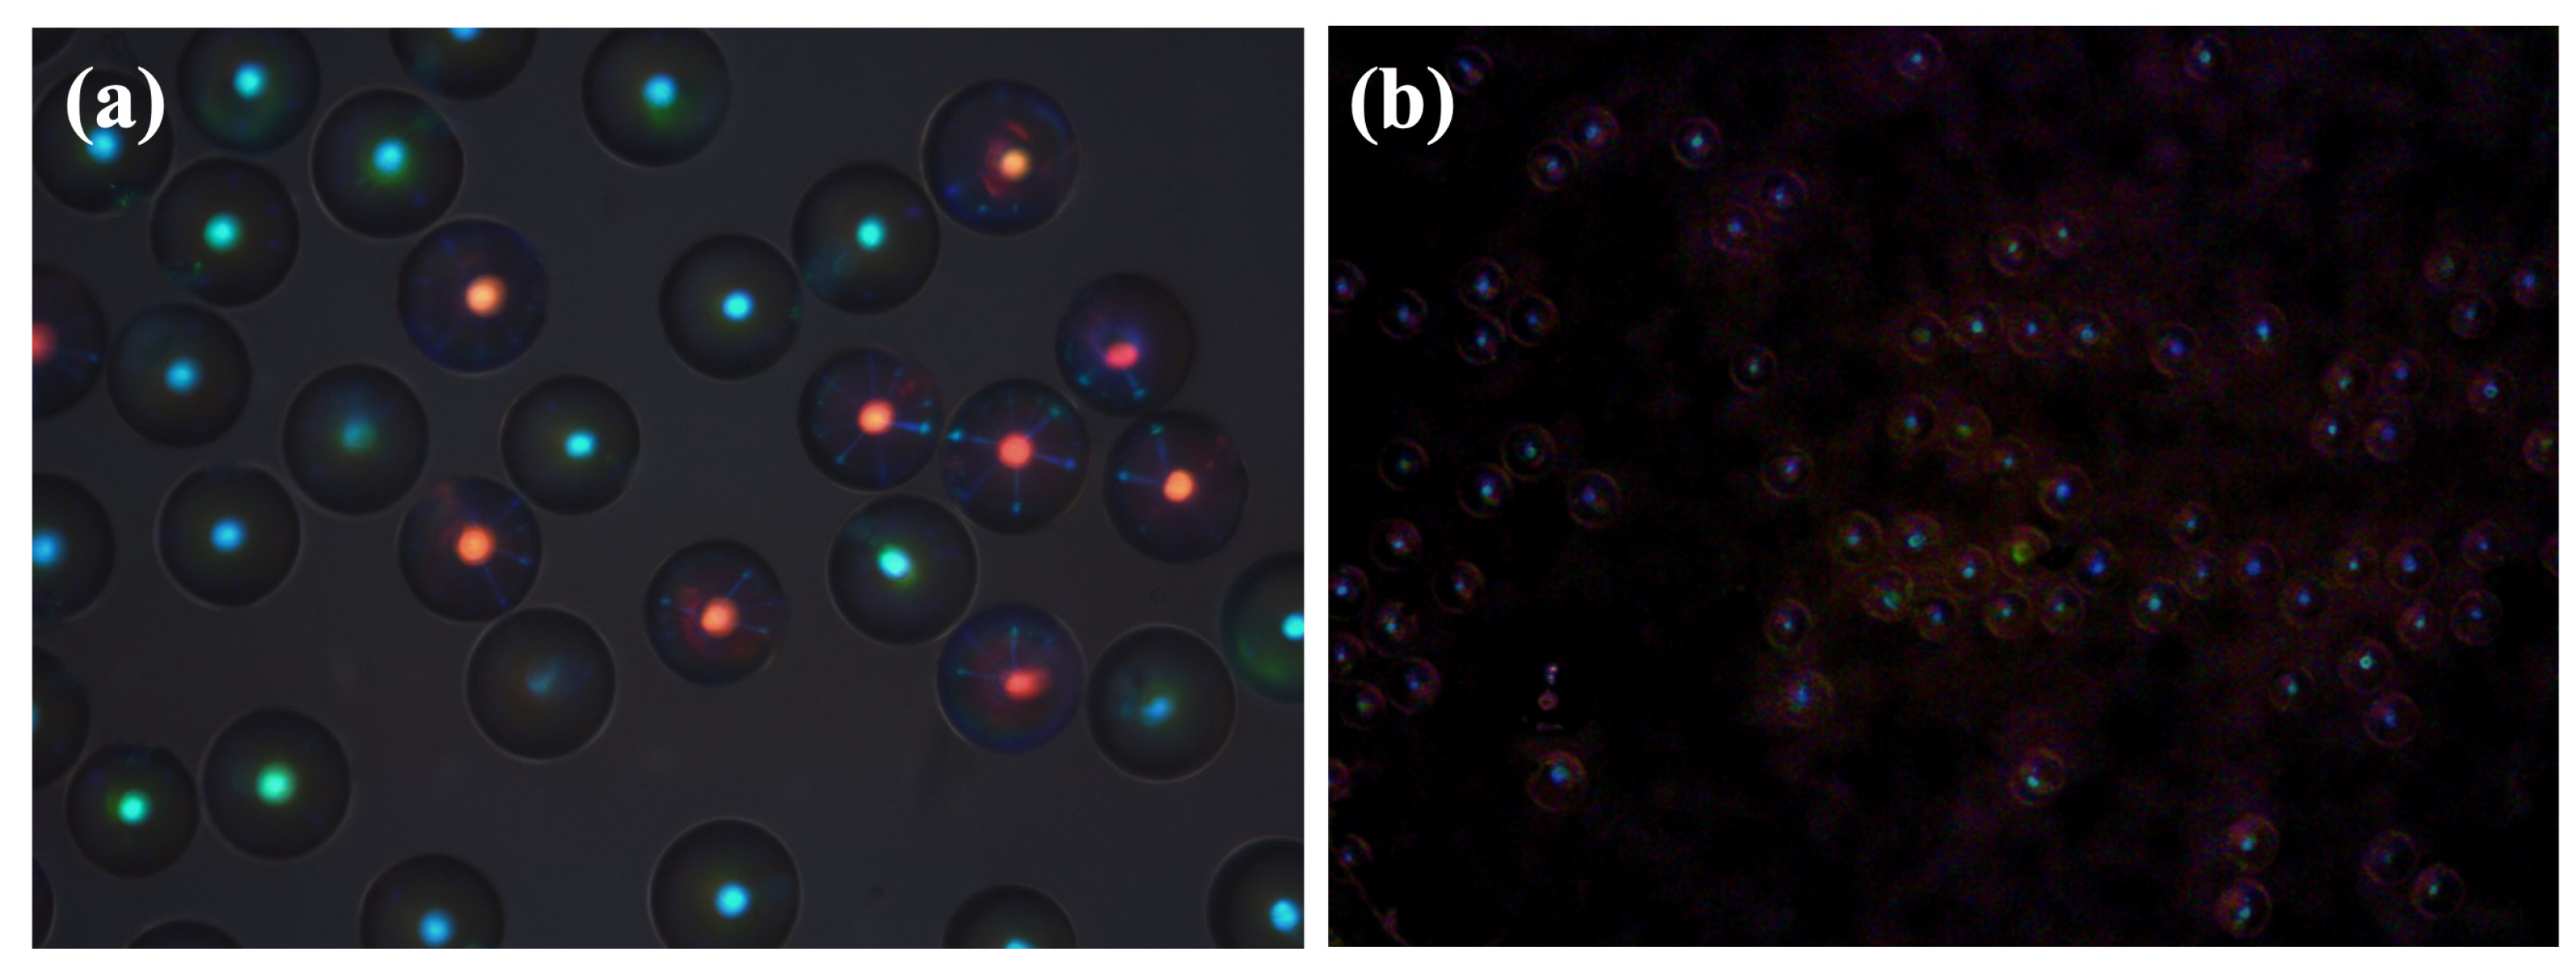
CSR images taken with a non-professional optical microscope at different angles of illumination: (a) perpendicular with respect to the sample, (b) 45° with respect to the sample, the response changes considerably.
Figure 1.
CSR images taken with a non-professional optical microscope at different angles of illumination: (a) perpendicular with respect to the sample, (b) 45° with respect to the sample, the response changes considerably.

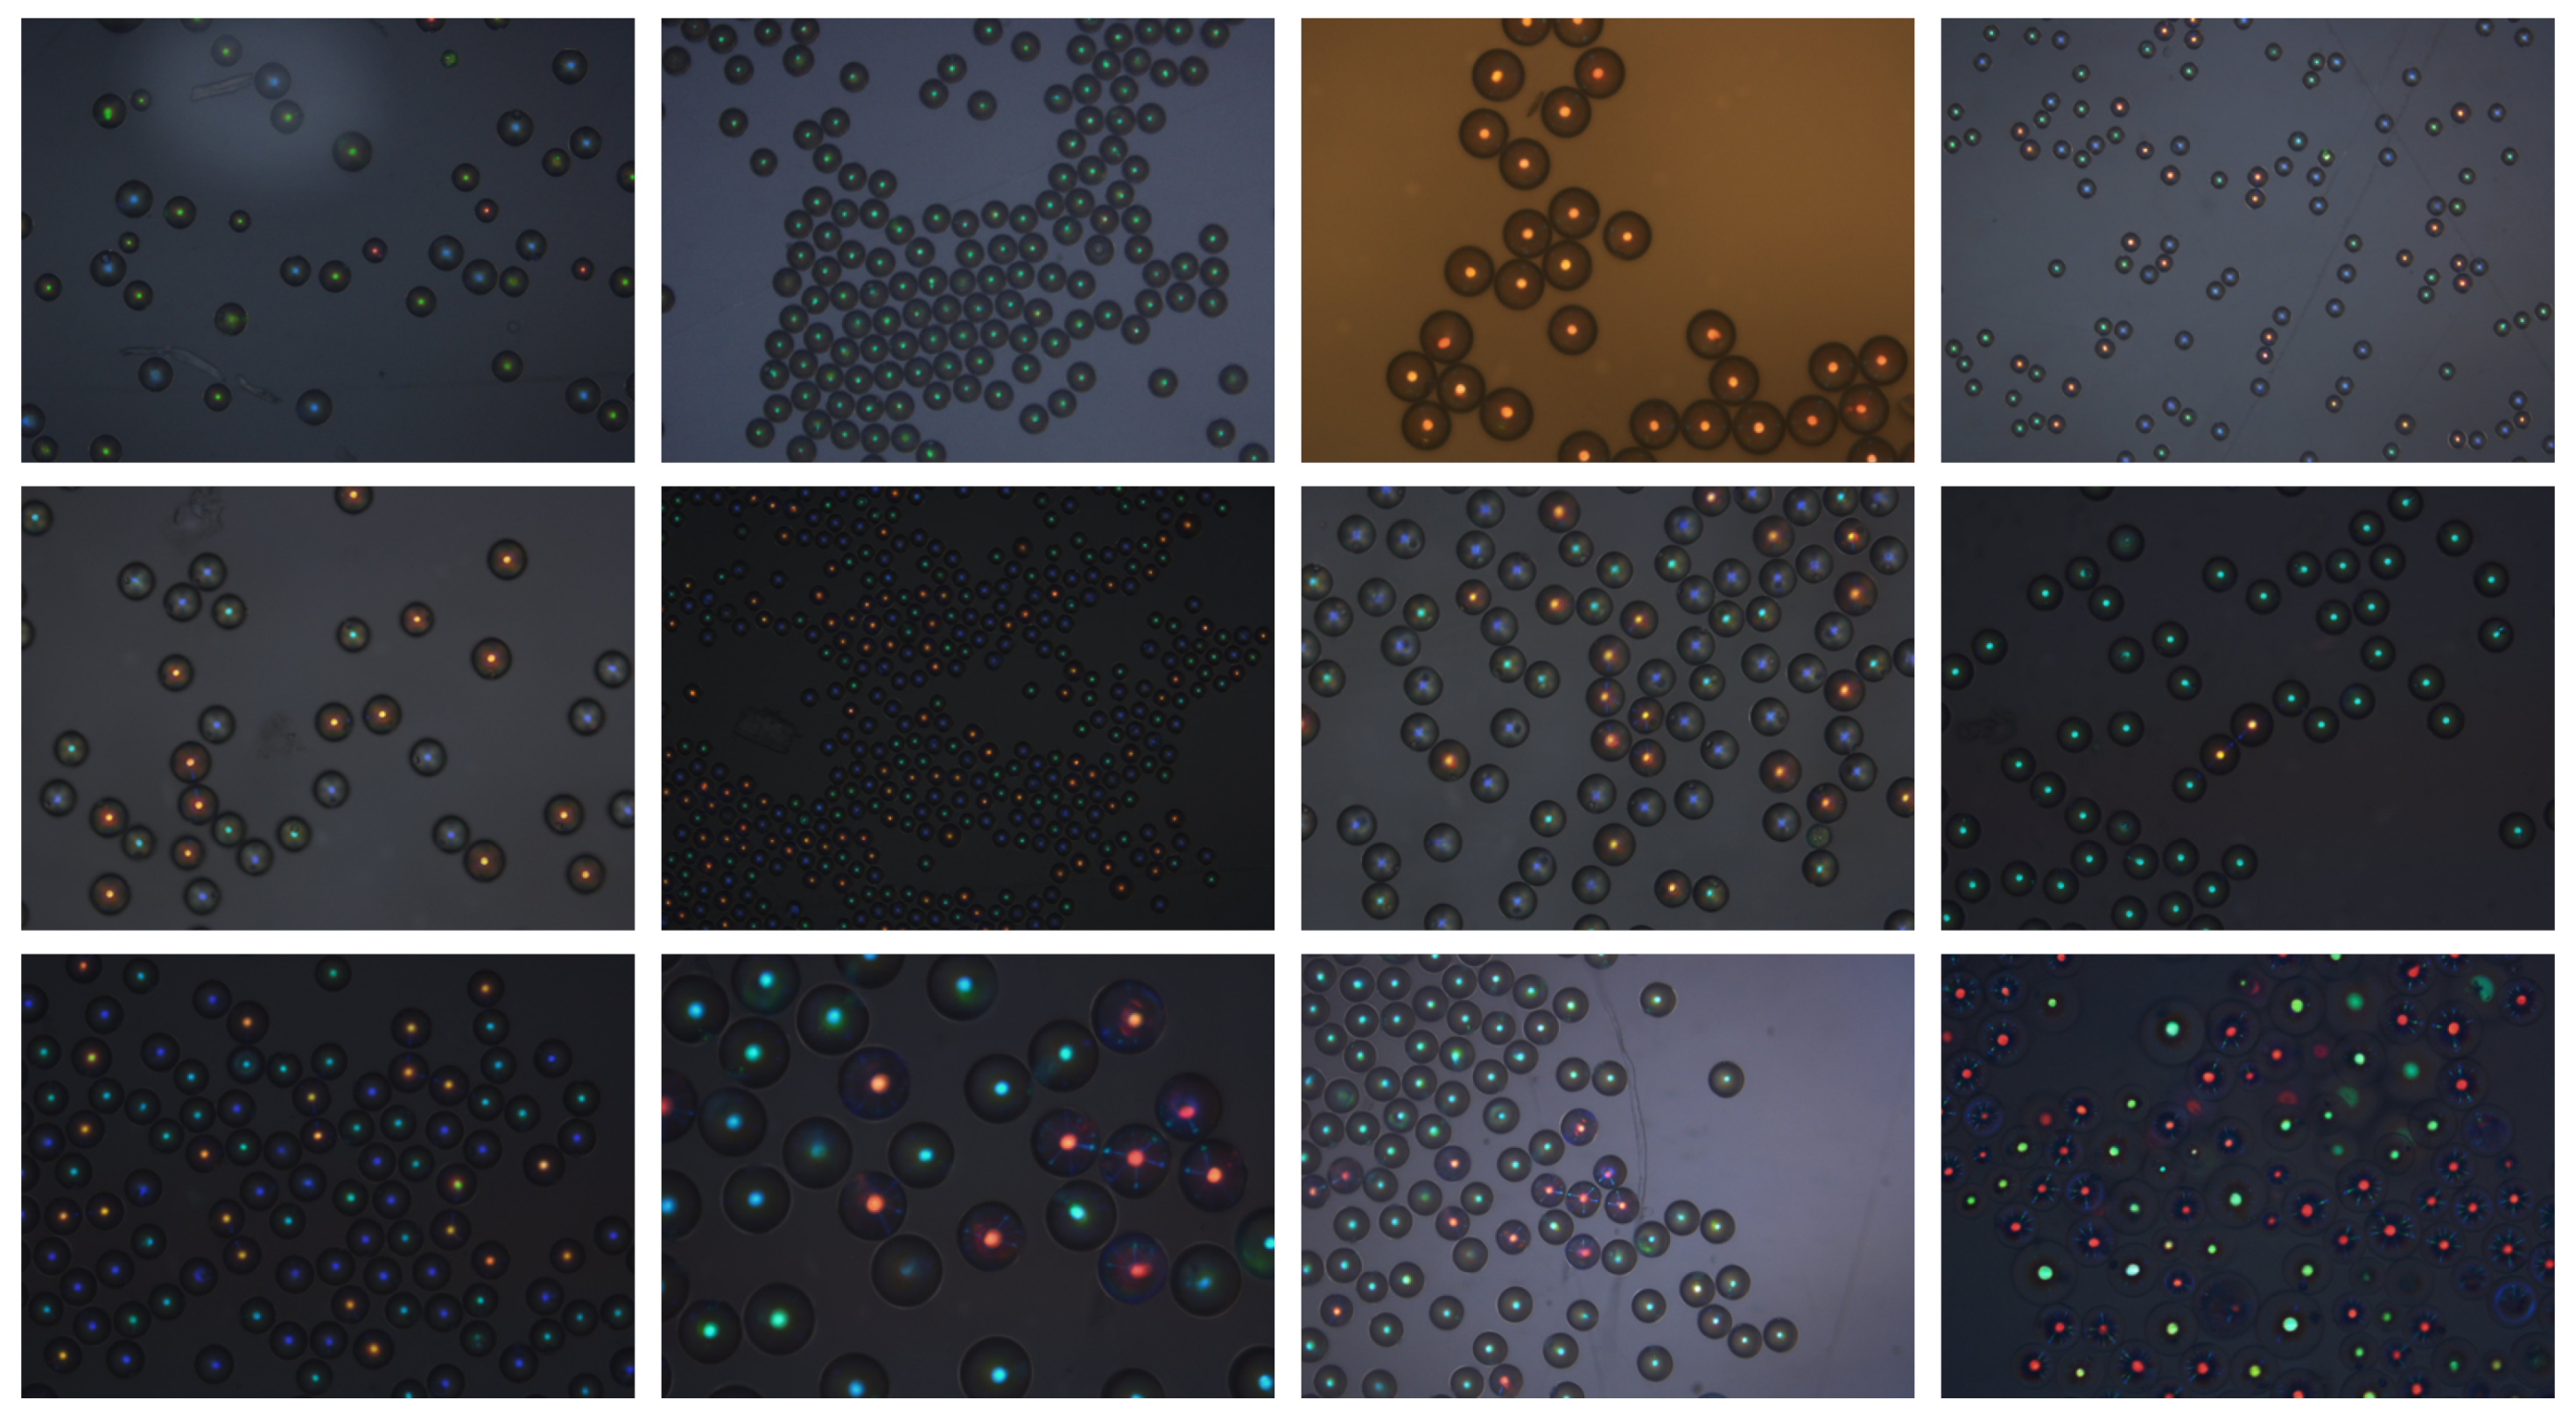
Figure 2.
We observe great variability in both CSRs and backgrounds of the Laboratory Data set [6]. It is observed a circular reflection spot at the center of every CSR, these colored elements are present across all different responses. There are also other colored features in the patterns, with certain radial and azimuthal distributions with respect to the centers of each CSR, e.g., the image in column 4 row 3.

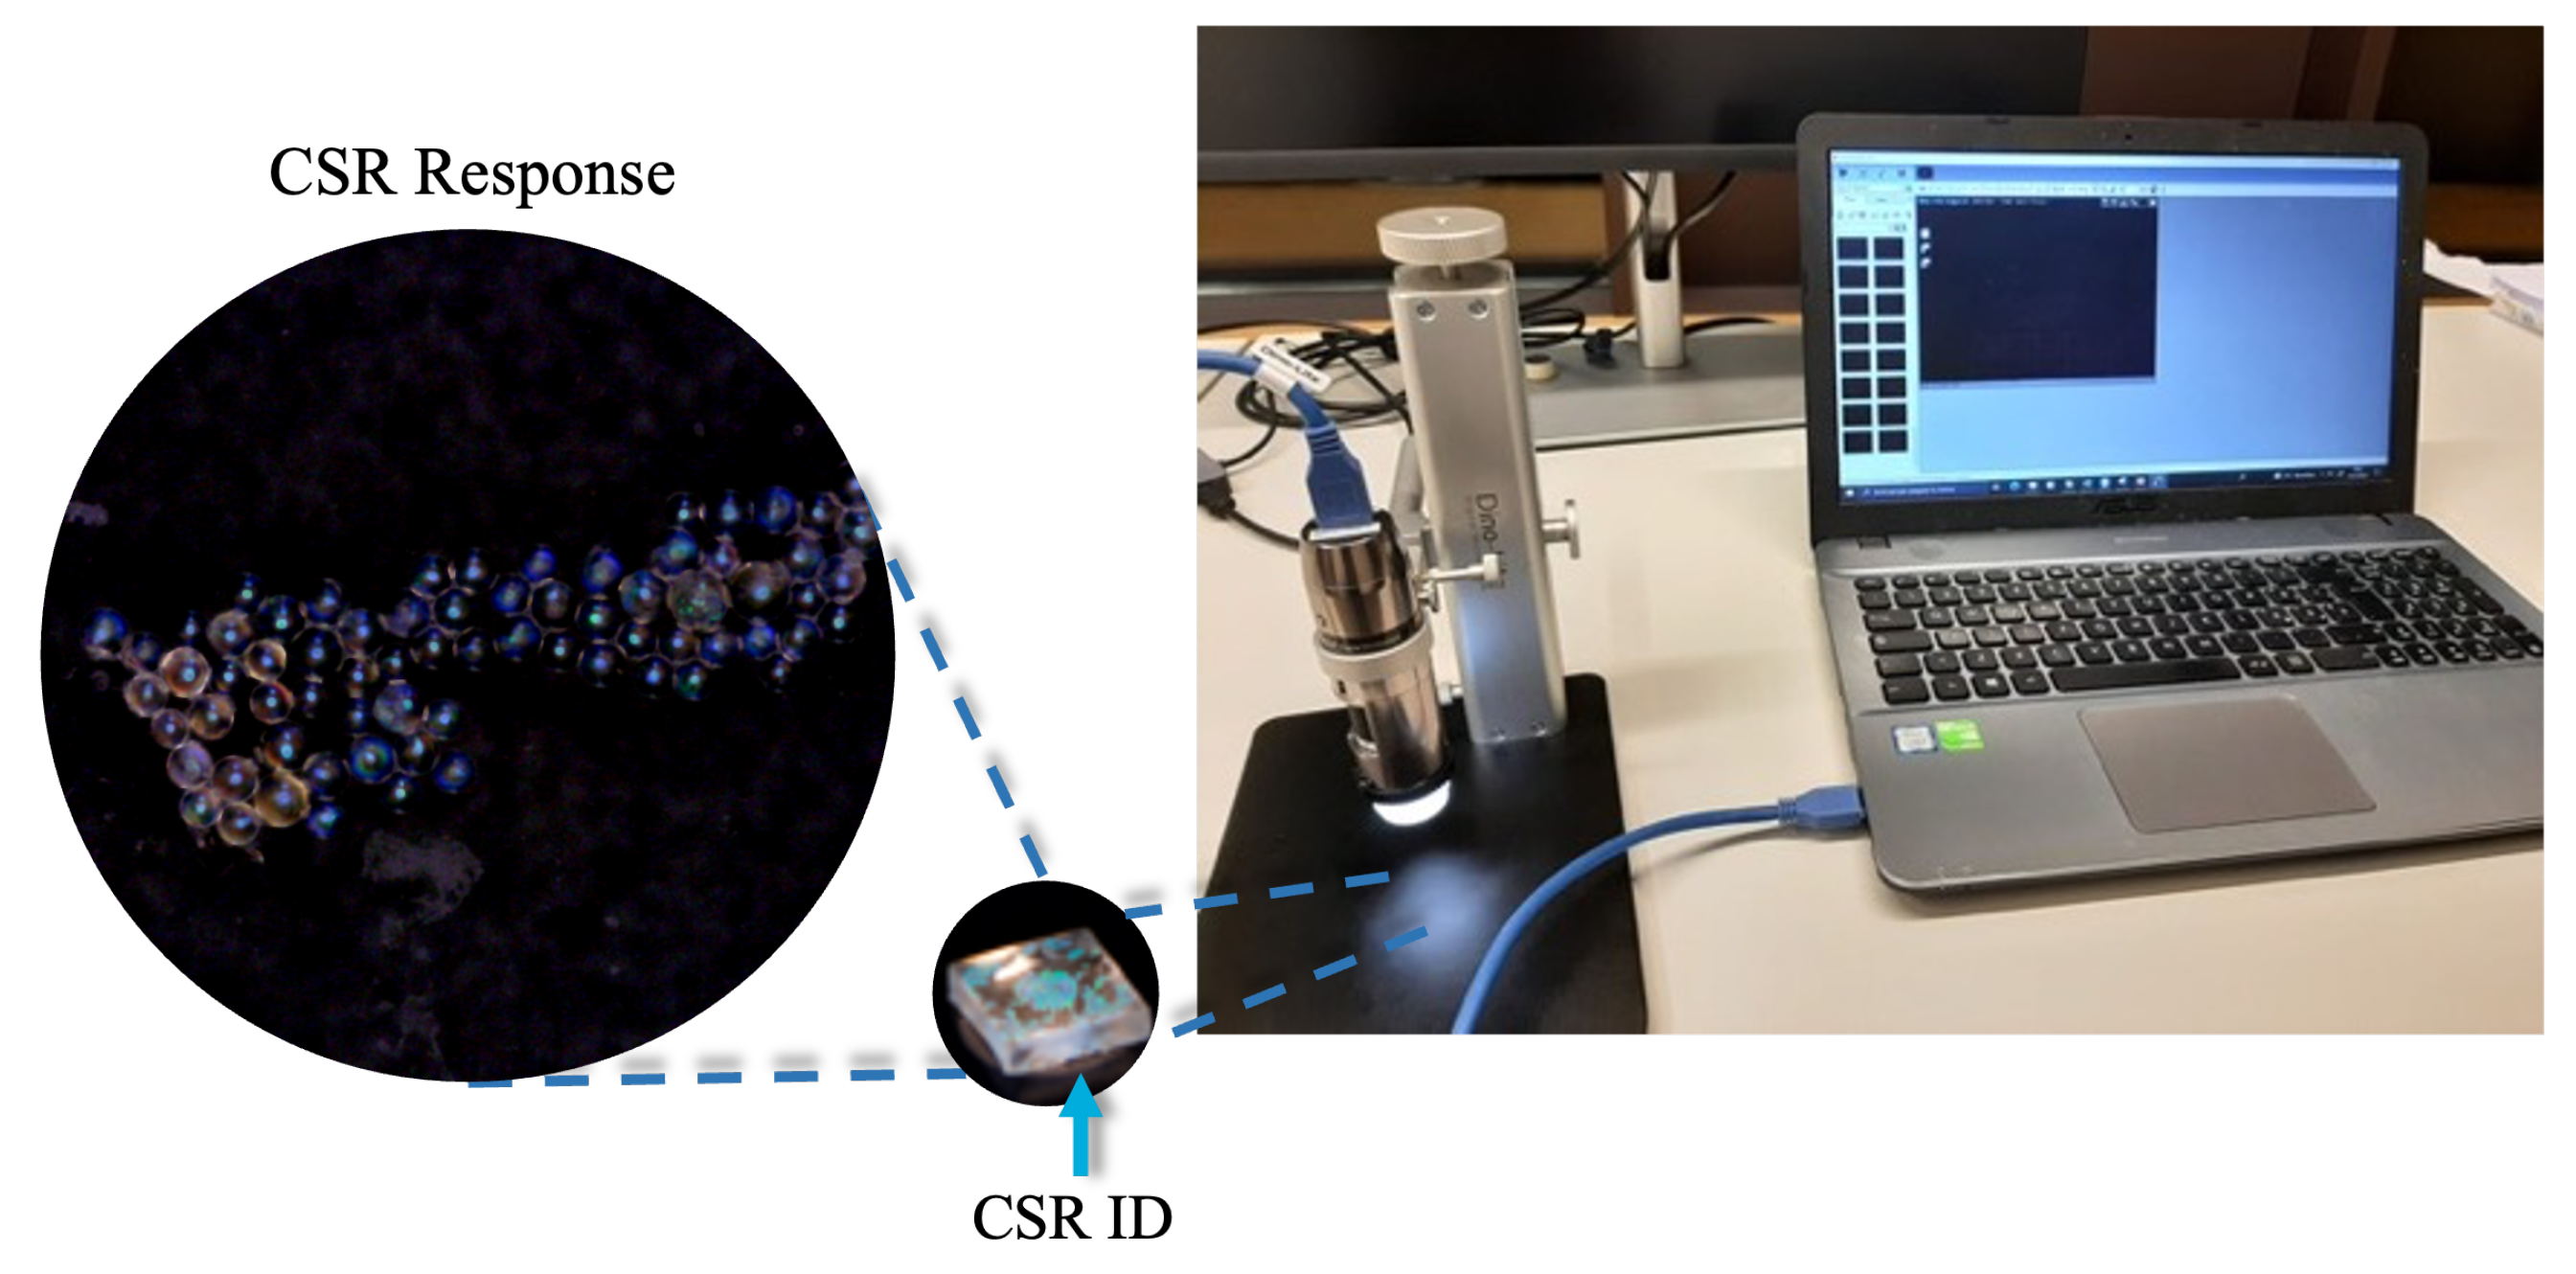
Figure 3.
CSR ID: physical object composed by CSRs hardened into a matrix—that can be a polymeric or a glass. CSR response: image acquired from the physical object by using a Dino-Lite microscope.
Figure 3.
CSR ID: physical object composed by CSRs hardened into a matrix—that can be a polymeric or a glass. CSR response: image acquired from the physical object by using a Dino-Lite microscope.

Figure 4.
A generic framework for physical functions. Readout, Extraction, and Matching: three phases for object verification. Adapted from [4,19].

Figure 5.
(a) CSR response of a Process One tag acquired with the Olympus microscope; (b) CSR response of a Process Two tag acquired with the Dino-Lite microscope.
Figure 5.
(a) CSR response of a Process One tag acquired with the Olympus microscope; (b) CSR response of a Process Two tag acquired with the Dino-Lite microscope.

Figure 6.
Keypoint matching between a reference and a retake CSR response. Keypoints in both images are represented as circles. Green lines represent correct matches.
Figure 6.
Keypoint matching between a reference and a retake CSR response. Keypoints in both images are represented as circles. Green lines represent correct matches.

Figure 7.
Detected blobs’ in a CSR response: (a) reference image, (b) aligned image, (c) matched blobs between the reference and the aligned images.
Figure 7.
Detected blobs’ in a CSR response: (a) reference image, (b) aligned image, (c) matched blobs between the reference and the aligned images.

Figure 8.
True/False-positive acceptance rate at changing of the similarity score used as a threshold. Setting the threshold at 74% gives a true acceptance rate of about 90%.
Figure 8.
True/False-positive acceptance rate at changing of the similarity score used as a threshold. Setting the threshold at 74% gives a true acceptance rate of about 90%.

Figure 9.
Clustering, and intra-distance and the inter-distance results while comparing images in Laboratory (Process 1) and Realistic data sets (Process 2).
Figure 9.
Clustering, and intra-distance and the inter-distance results while comparing images in Laboratory (Process 1) and Realistic data sets (Process 2).

Figure 10.
Similarity score as a function of the number of detected blobs.

Figure 11.
Images with low intra-distance: (a) one with not enough CSRs and, (b) one at low contrast and where our image processing fails to detect most of the CSRs.
Figure 11.
Images with low intra-distance: (a) one with not enough CSRs and, (b) one at low contrast and where our image processing fails to detect most of the CSRs.


Table 1.
Comparison between different authentication technologies.
| Dachowicz et al. [15] | Arppe-Tabbara et al. [16] | Wang et al. [17] | This Work | |
|---|---|---|---|---|
| Application | Steel tracking | Authentication | Banknote authenticity | Authentication |
| Number of tags/items | 50 | 9720 | 340 | 64 |
| Number of Images | NA | NA | 6200 | 5560 |
| Information encoding capacity | NA | 900 bits | NA | |
| Information source | Steel micrographias | Special nano material printed tags | Internal randomness in banknote ink | CSR tags |
| Measuring Device | AmScope MU500 5.1MP digital microscope | Smart phone camera | Epson V850 and Panasonic DMC-FZ72 Camera | DinoLite USB-microscope |
| False Positive Rate | <0.01 | Around 0 | Around 0 | Around 0 |
Table 2.
Operations applied to each reference CSR response (from Process One) for obtaining the set of retaken images.
Table 2.
Operations applied to each reference CSR response (from Process One) for obtaining the set of retaken images.
| Sequence | Operation | Range |
|---|---|---|
| 1 | Rotation | 1–5° (anticlockwise) |
| 2 | Blurring | (2 × 2)–(4 × 4) |
| 3 | Gaussian noise | 0.2–0.4 |
Table 3.
Generated dataset for CSR responses acquired from different microscopes.
| Number of CSR IDs | Number of Images | Number of Images with Noise | |
|---|---|---|---|
| Laboratory Data set | 12 | 12 | 540 |
| Realistic Data set | 52 | 5024 | 5024 |
Table 4.
Dataset for Process One and Process Two.
| Type | Production | Number of Comparisons | Execution Time (h) |
|---|---|---|---|
| Intra-distance | Laboratory Data set | 540 | 0.66 |
| Realistic Data set | 5024 | 2.32 | |
| Inter-distance | Laboratory Data set | 7649 | 4.60 |
| Realistic Data set | 16,314 |
Publisher’s Note: MDPI stays neutral with regard to jurisdictional claims in published maps and institutional affiliations. |
© 2022 by the authors. Licensee MDPI, Basel, Switzerland. This article is an open access article distributed under the terms and conditions of the Creative Commons Attribution (CC BY) license (https://creativecommons.org/licenses/by/4.0/).
Share and Cite
MDPI and ACS Style
Arenas, M.P.; Demirci, H.; Lenzini, G. An Analysis of Cholesteric Spherical Reflector Identifiers for Object Authenticity Verification. Mach. Learn. Knowl. Extr. 2022, 4, 222-239. https://doi.org/10.3390/make4010010
AMA Style
Arenas MP, Demirci H, Lenzini G. An Analysis of Cholesteric Spherical Reflector Identifiers for Object Authenticity Verification. Machine Learning and Knowledge Extraction. 2022; 4(1):222-239. https://doi.org/10.3390/make4010010
Chicago/Turabian StyleArenas, Mónica P., Hüseyin Demirci, and Gabriele Lenzini. 2022. "An Analysis of Cholesteric Spherical Reflector Identifiers for Object Authenticity Verification" Machine Learning and Knowledge Extraction 4, no. 1: 222-239. https://doi.org/10.3390/make4010010