
In Situ Ultrasonic Testing for Wire Arc Additive Manufacturing Applications
by
 , , and
Ana Beatriz Lopez
1,
José Pedro Sousa
2,
João P. M. Pragana
3,
Ivo M. F. Bragança
3,4,
Telmo G. Santos
5,6 and
Carlos M. A. Silva
3,* 1
European Federation for Welding, Joining and Cutting (EWF), 2740-119 Porto Salvo, Portugal
2
Nondestructive Testing Laboratory, Instituto de Soldadura e Qualidade (ISQ), 2740-120 Porto Salvo, Portugal
3
IDMEC, Instituto Superior Técnico, Universidade de Lisboa, Av. Rovisco Pais, 1049-001 Lisbon, Portugal
4
CIMOSM, Instituto Superior de Engenharia de Lisboa, Instituto Politécnico de Lisboa, 1549-020 Lisbon, Portugal
5
UNIDEMI, Department of Mechanical and Industrial Engineering, NOVA School of Science and Technology, Universidade NOVA de Lisboa, 2829-516 Caparica, Portugal
6
LASI, Laboratório Associado de Sistemas Inteligentes, 4800-058 Guimarães, Portugal
*
Author to whom correspondence should be addressed.
Machines 2022, 10(11), 1069; https://doi.org/10.3390/machines10111069
Submission received: 13 October 2022
/
Revised: 4 November 2022
/
Accepted: 8 November 2022
/
Published: 12 November 2022
(This article belongs to the Special Issue Design for Additive Manufacturing: Engineering Data and Assessment Tools)
Abstract
:In this paper, we present a non-destructive testing (NDT) technique based on in situ detection of defects up to 100 °C by ultrasonic testing (UT) during construction of parts by a metal additive manufacturing technology known as wire arc additive manufacturing (WAAM). The proposed technique makes use of interlayer application of commercial solder flux to serve as coupling medium for in situ inspection using a special-purpose UT probe. The experimental work was carried out in deposited ER5356 aluminum straight walls following a threefold structure. First, characterization tests with geometrically similar walls with and without interlayer application of solder flux highlight its neutrality, with no effect on the chemical, metallurgical and mechanical properties of the walls. Secondly, UT tests on walls at temperatures ranging from room temperature to 100 °C demonstrate the satisfactory performance of the solder flux as a coupling medium, with little to no soundwave amplitude losses or noise. Finally, acoustic attenuation, impedance and transmission estimations highlight the effectiveness of the proposed technique, establishing a basis for the future development of automated NDT systems for in situ UT of additive manufacturing processes.
1. Introduction
Wire arc additive manufacturing (WAAM) has attracted increasing interest over the years in the manufacturing sector, owing to accessibility and sustainability in fabricating large-scale metal parts by means of high deposition rates and material efficiency. Contrary to other metal additive manufacturing processes, WAAM can be carried out using low-cost equipment that is accessible to most manufacturing companies and research institutions worldwide [1,2]. However, there are some downsides to this technology that affect the quality of WAAM parts, limiting their ability to satisfy standard industrial requirements [3,4]. The most noticeable downsides concern the rough surface quality and low geometric precision of WAAM parts, which can usually be circumvented by employing fine machining operations in postprocessing steps [5].
Other defects in the microscopic range, such as porosity, cracking or lack of fusion [6,7,8], may appear within parts; such defects cannot be solved with machining operations but require other solutions in the form of heat treatment, surface rolling or even optimization of the processing parameters. The application of any of these solutions, besides being time- and energy-consuming, requires prior knowledge with respect to the morphology, dimensions and cause of typical defects in WAAM parts [9].
To this end, non-destructive testing (NDT) can be implemented to detect and evaluate different types of defects on parts without putting their service use in jeopardy [10], unlike destructive tests usually performed on a limited amount of dedicated samples. Several NDT methods are readily available in several industrial sectors that make use of conventional manufacturing technologies, such as metal forming, casting and welding, among others. We recently conducted a broad review of NDT methods in terms of their applicability to the analysis of different types of defects on samples produced by WAAM [11].
According to the aforementioned review, ultrasonic-based NDTs are used when a high inspection quality and flexibility can be assured in wide scanning areas [12]. These experimental tests are carried out by generating waves via a transmitting transducer/probe, which are passed through samples and ultimately returned to the same transducer (pulse–echo mode) or to a separated receiving transducer (pitch–catch mode) [13,14]. Ultrasonic NDT (hereafter simply referred to a UT) is not new and has been widely used to evaluate welded structures for decades in engineering applications [15].
Simulation and experimental analyses were recently conducted to understand the interaction between the emitted UT beam and the WAAM component [11]. In general terms, results show that phased-array UT (PAUT) is suitable for the detection of WAAM defects, including sizing, morphology and location, but only for a maximum of 91 μm average waviness profiles. This value implies carrying out postprocessing by machining before testing, as standard waviness values for WAAM parts can easily surpass the range of millimeters [16]. Moreover, contact-based immersion UT is normally used to promote uniform coupling between the probe and samples to convey acoustic energy while avoiding large impedance mismatches caused by an air media [10].
Non-contact acoustic and ultrasonic systems are available in the market and represent a reliable solution for in-process inspection for several materials, such as wooden panel paintings, composite panels, graphite, etc. [17]. However, in the case of metals, their efficiency rapidly decreases with distance between the probes and the surface of the test object. Moreover, the available frequencies for such air-coupled ultrasound techniques are very low (typically below 200 or 400 kHz), corresponding to very high wavelengths, therefore hindering the detection of small defects. Other non-contacting ultrasonic transducers include EMATs (electromagnetic acoustic transducers) and capacitance transducers [18,19]. However, both these devices are much less sensitive than piezoelectric transducers and can only operate at short distances from electrically conducting surfaces.
Nevertheless, UT remains suitable, mostly in cases in which offline inspection of WAAM parts is to be carried out, i.e., after all part layers have been deposited. In order to employ UT for in situ applications in WAAM, a coupling medium is necessary to enable transmission and reception of soundwaves with minimal reflection between the two media (probe wedge and material to be inspected). Additionally, the coupling must endure heat dissipation from the as-built metal layers without compromising the mechanical, chemical and metallurgical properties of WAAM parts [20]. We believe that this last segment is crucial because it assures that any in situ UT-based analysis will not significantly affect the productivity of WAAM, as there is no need to remove coupling residues left out before restarting the material deposition cycles.
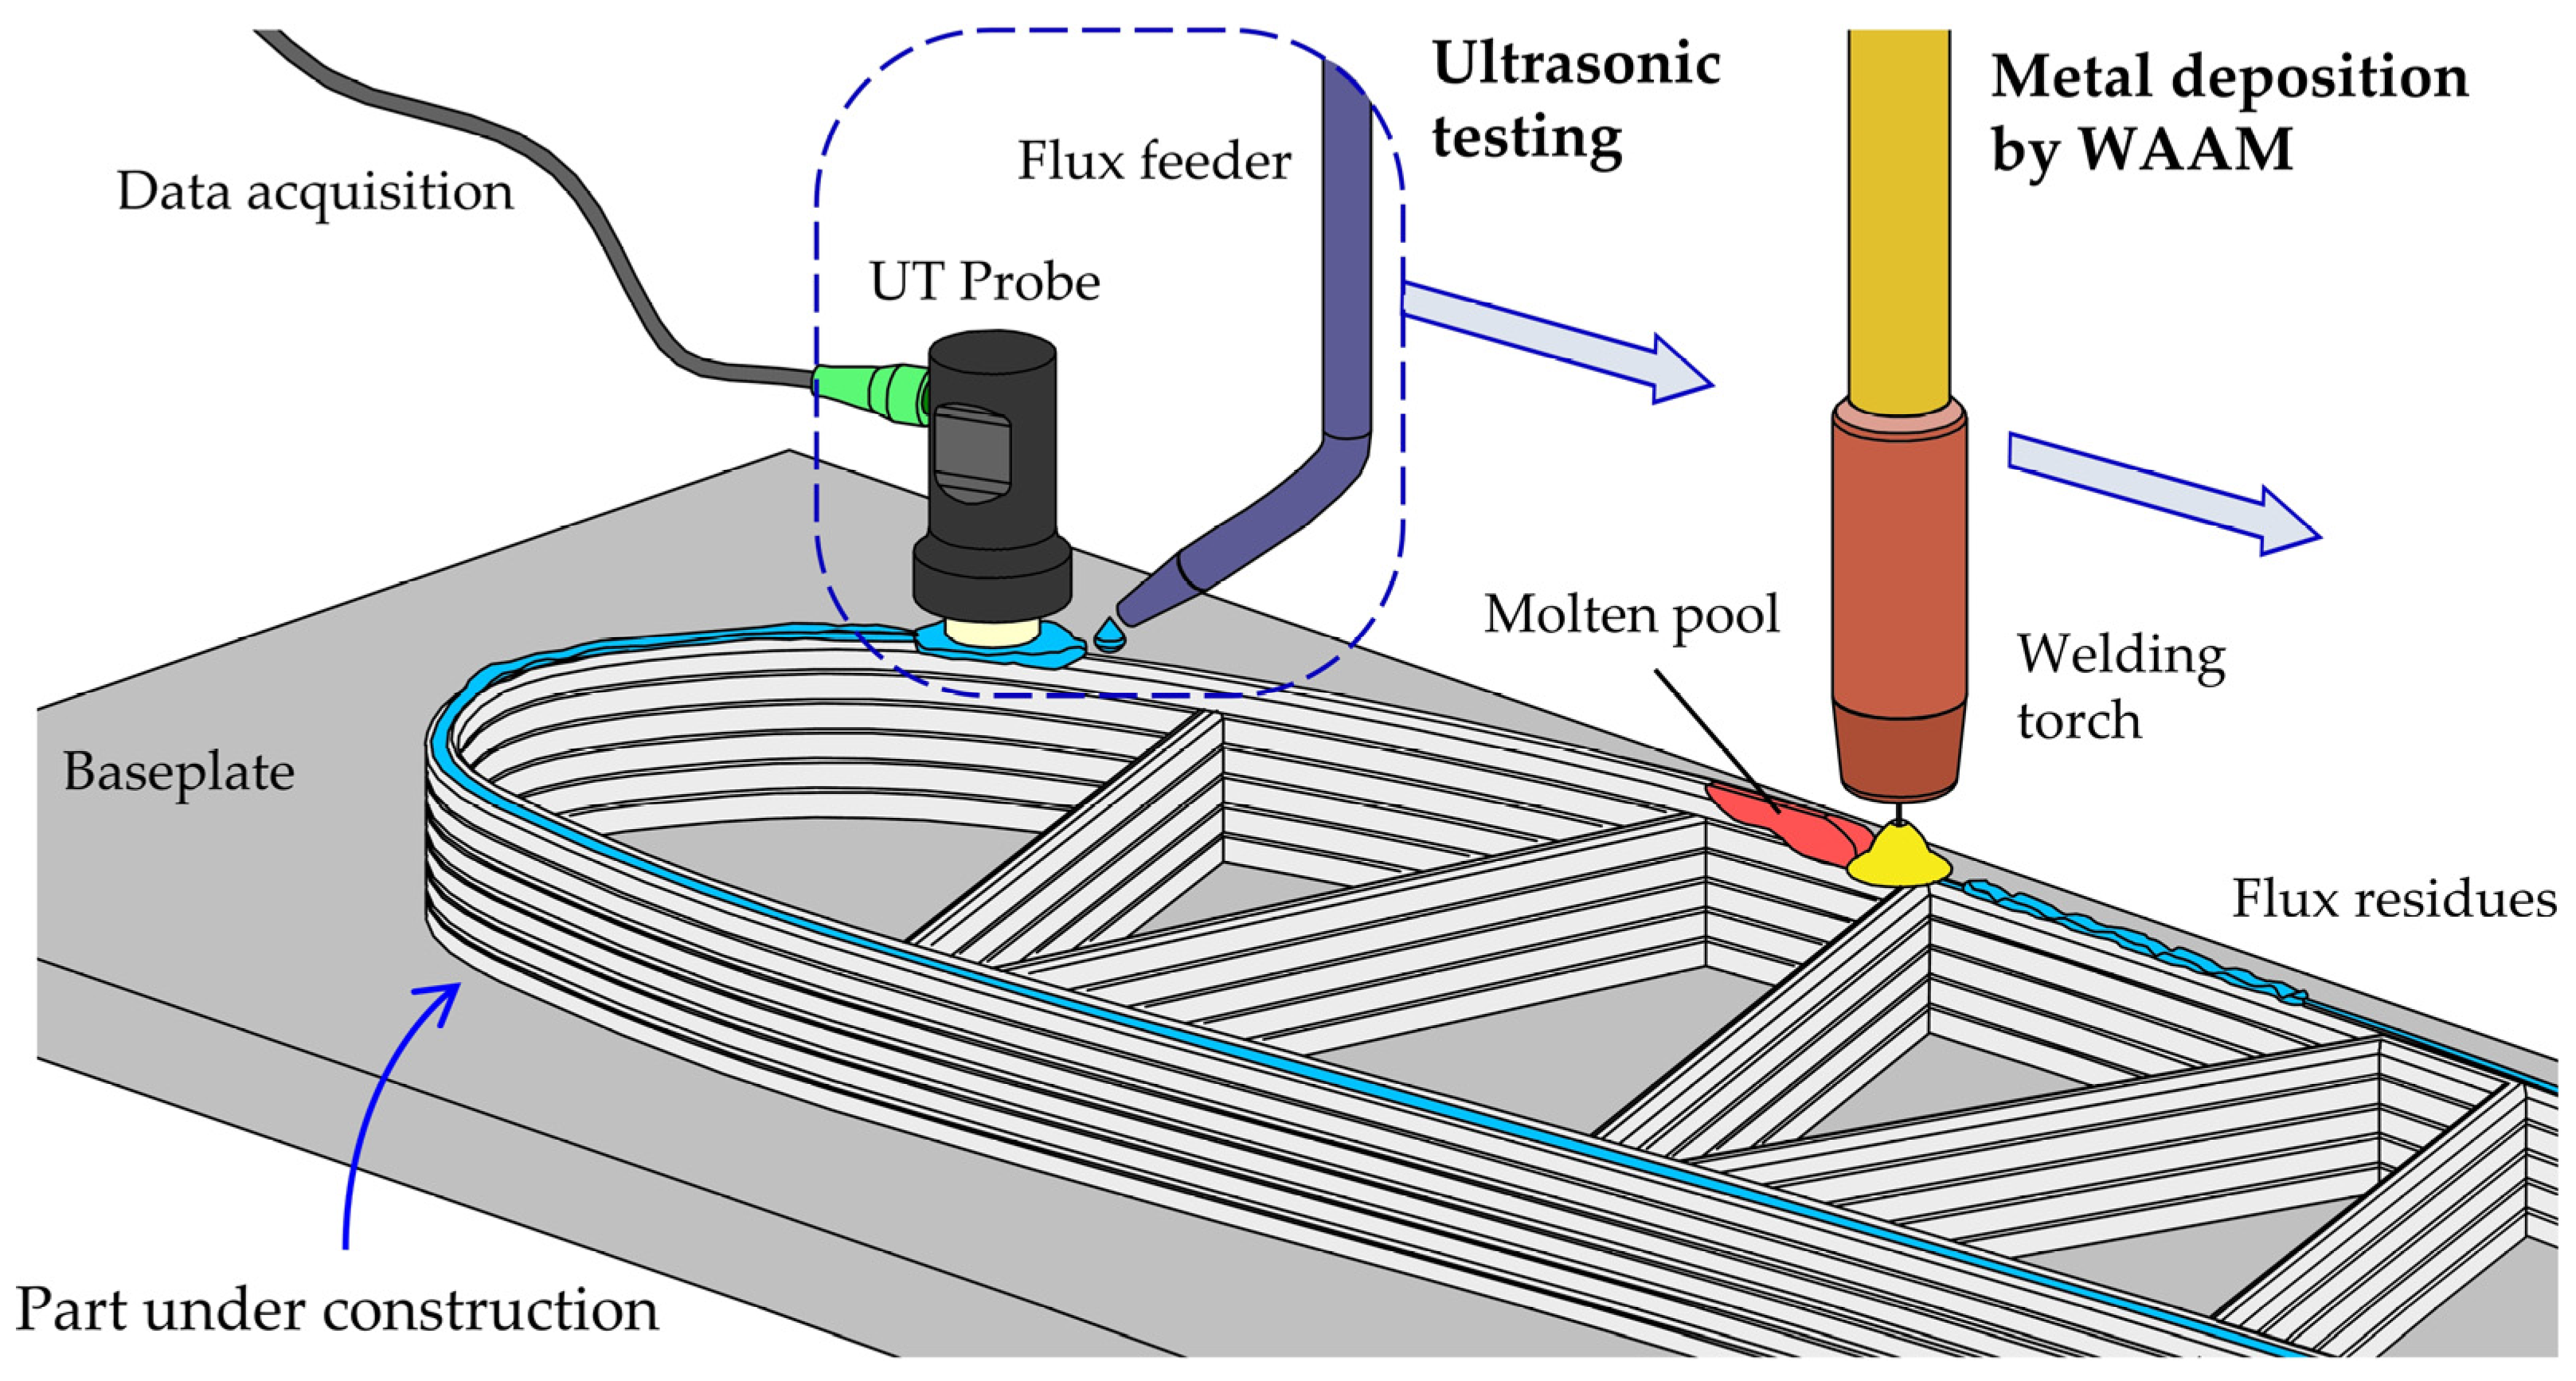
In view of the challenges presented above, the focus of the present study is the applicability of in situ UT in WAAM using solder flux as the coupling medium between the UT probe and the deposited material. The proposed technique involves the following three main mechanisms performed in sequence: (1) metal deposition by WAAM through a welding torch; (2) application of solder flux by means of a coupling feeder on top of the regions of the part to be analyzed and (3) utilization of a UT contact probe to selectively scan the desired regions of the part (Figure 1).
The feasibility of the proposed in situ UT technique follows a threefold structure, which will be presented throughout this paper. First, comparisons of the metallurgical, mechanical and chemical characteristics were carried out on walls with and without interlayer application of solder flux. Secondly, UT using a solder-flux-based coupling medium was tested at temperatures ranging from room temperature to 100 °C to detect defects within the walls. Finally, the acoustic properties of the solder flux were further investigated demonstrate its effectiveness as a coupling medium for in situ UT during layer-by-layer WAAM construction.
2. Materials and Methods
2.1. Metal Deposition
Metal deposition by WAAM was carried out using 1.2 mm diameter ER5356 aluminum welding wire, with 10 mm thick 6061-T6 aluminum baseplates as consumables. The welding wire was supplied by ESAB (United Kingdom), the chemical composition of which is disclosed in Table 1.
An in-house WAAM system was used, comprising a KRC6 Kuka 6-axis robot equipped with a Fronius TPS 4000 cold metal transfer welding power source. High-purity (99.99%) argon was used as shielding gas; the main processing parameters utilized during metal deposition by WAAM are summarized in Table 2. The solder flux used in the experiments was liquid FL50 supplied by JBC (Spain).
The deposition strategy consisted of single bead layers built using a torch with a working angle of 90 degrees for the production of straight walls with a height of 140 mm height, a length of 200 mm and a thickness of approximately 10 mm. The remaining construction procedures are presented in Table 3 for three different wall sets sorted according to their testing purpose.
First, wall sets #1 and #2 consisting of straight aluminum walls built without and with interlayer application of solder flux, respectively, were used to assess differences at three levels: (i) mechanical, (ii) metallurgical and (iii) chemical. The aim of this procedure was to verify whether solder flux can be safely applied after the deposition of each layer without requiring removal and, most importantly, without leading to any unwanted changes in the material properties. The experimental tests used to analyze the chemical, metallurgical and mechanical characteristics of wall sets #1 and #2 are further described in Section 2.2.
Secondly and finally, the performance and effectiveness of the solder flux as a coupling medium for UT were tested with wall set #3, with straight aluminum walls with artificial defects in their interior at varying depths for further detection and analysis via UT on the top region of the final walls. Conclusions were subsequently drawn with respect to the acoustic capabilities of the selected solder flux. The experimental tests used to fulfill the aforementioned purposes are further detailed in Section 2.3.
2.2. Characterization Tests
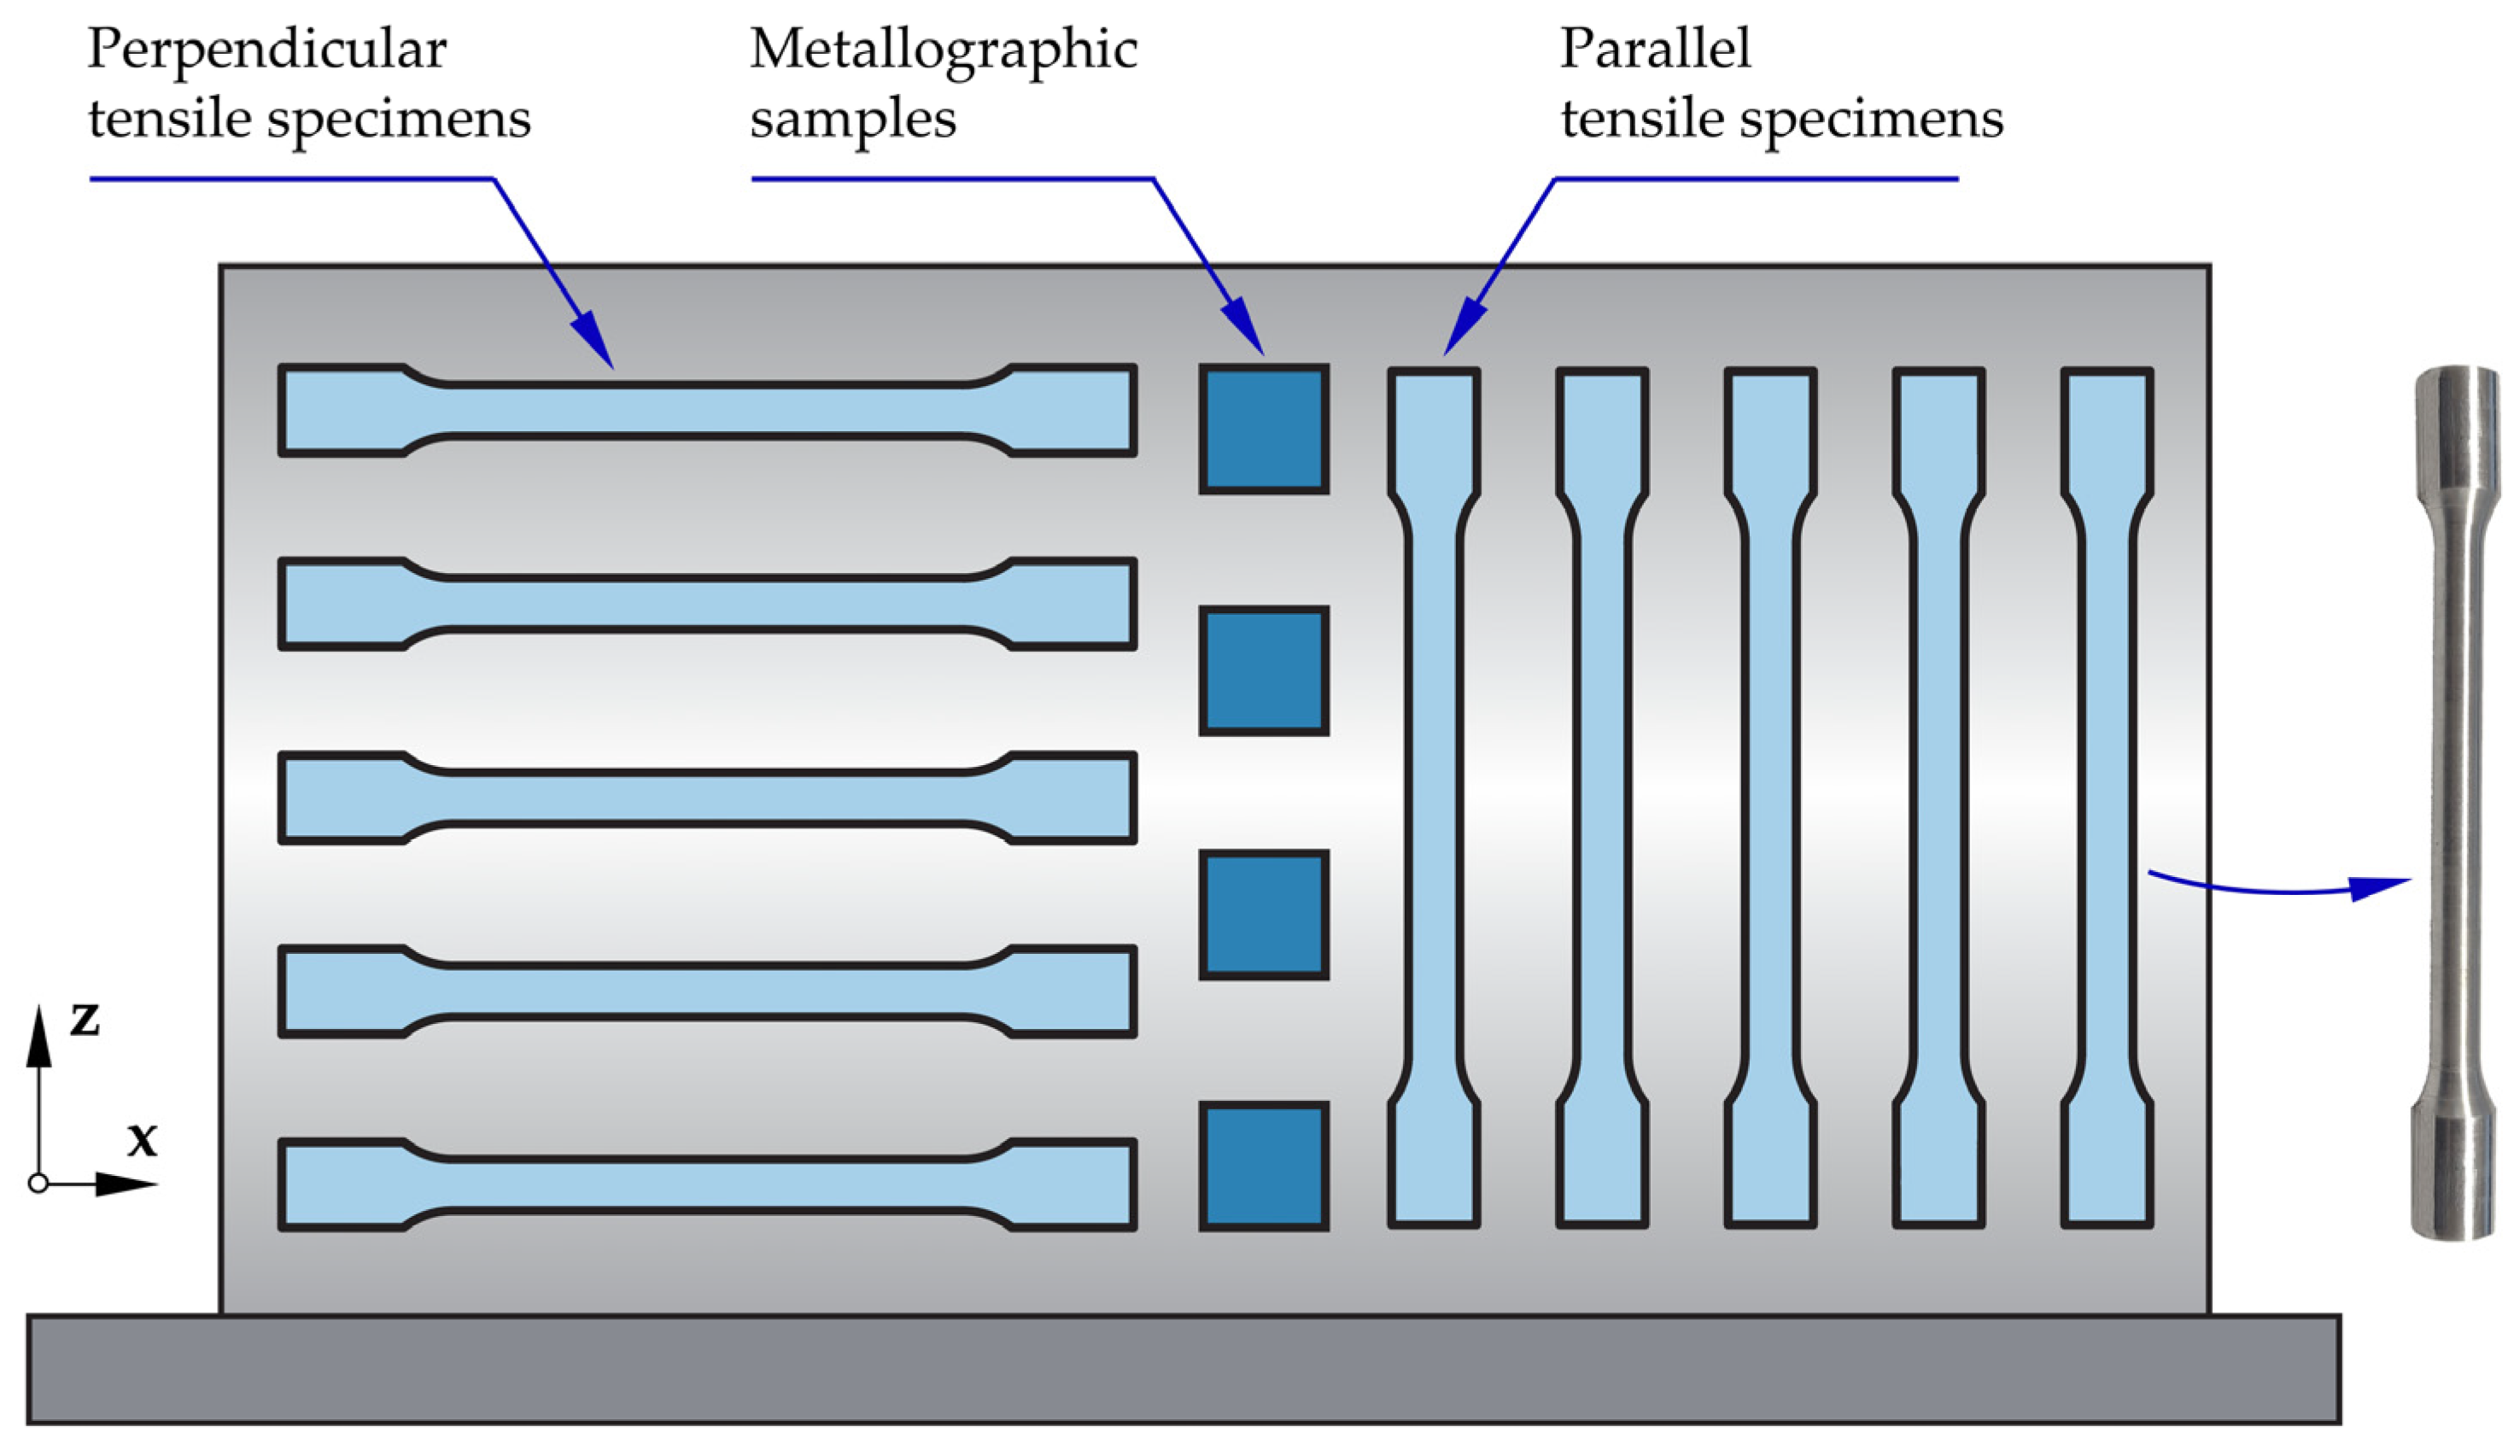
Straight ER5356 aluminum walls built by WAAM with and without interlayer application of solder flux (refer back to wall set IDs #1 and #2 of Table 3) were metallurgically and chemically characterized of by means of scanning electron microscopy (SEM). To this end, metallographic samples parallel to the building direction (z-axis, as shown in Figure 2) were extracted from the aluminum walls to observe and analyze the microstructural features of the deposited material for both wall sets.
Afterwards, the metallographic samples were cleaned, ground, polished and etched by immersion using Keller’s etch to reveal the microstructure of the deposited material. Observations were conducted using a Motic BA310 MET-H optical microscope. Other images extracted from micro areas of the metallographic samples were analyzed by energy dispersive spectrometry (EDS) to assess particle distribution in the deposited material and verify its chemical composition.
The mechanical properties of the deposited material were obtained from tensile tests carried out at room temperature on an INSTRON 5900 universal testing machine. The tests were conducted according to the guidelines provided by ASTM standard E8/E8 M-16 [21] using round dogbone specimens cut from the aluminum straight walls perpendicular and parallel to the building direction used during deposition (Figure 2). Milling and turning were required after deposition to extract tensile test specimens with the required geometry, dimensions and surface conditions.
Lastly, the fracture surfaces of the tensile testing specimens were cleaned and further analyzed using a Hitachi S-2400 scanning electron microscope (SEM) with the objective of observing and characterizing the fracture morphology of the deposited material.
2.3. Non-Destructive Testing
Aluminum straight wall set #3 (refer back to Table 3) was first inspected using the conventional OmniScan® SX (Olympus, Japan) ultrasonic testing (UT) equipment. To this end, local artificial defects in the form of small linear pores were machined using a Ø 2 mm drilling tool, with depths ranging from 2 and 6 mm from the top of the walls. After drilling, metal deposition was restarted so that the defects remained enclosed in the interior of the walls, where they would be unnoticeable in other surface-character NDT, such as by visual inspection or dry penetration testing [22]. Artificial defects were then detected by UT at temperatures ranging from room temperature to 100 °C on the topmost layer after covering it with FL50 solder flux.
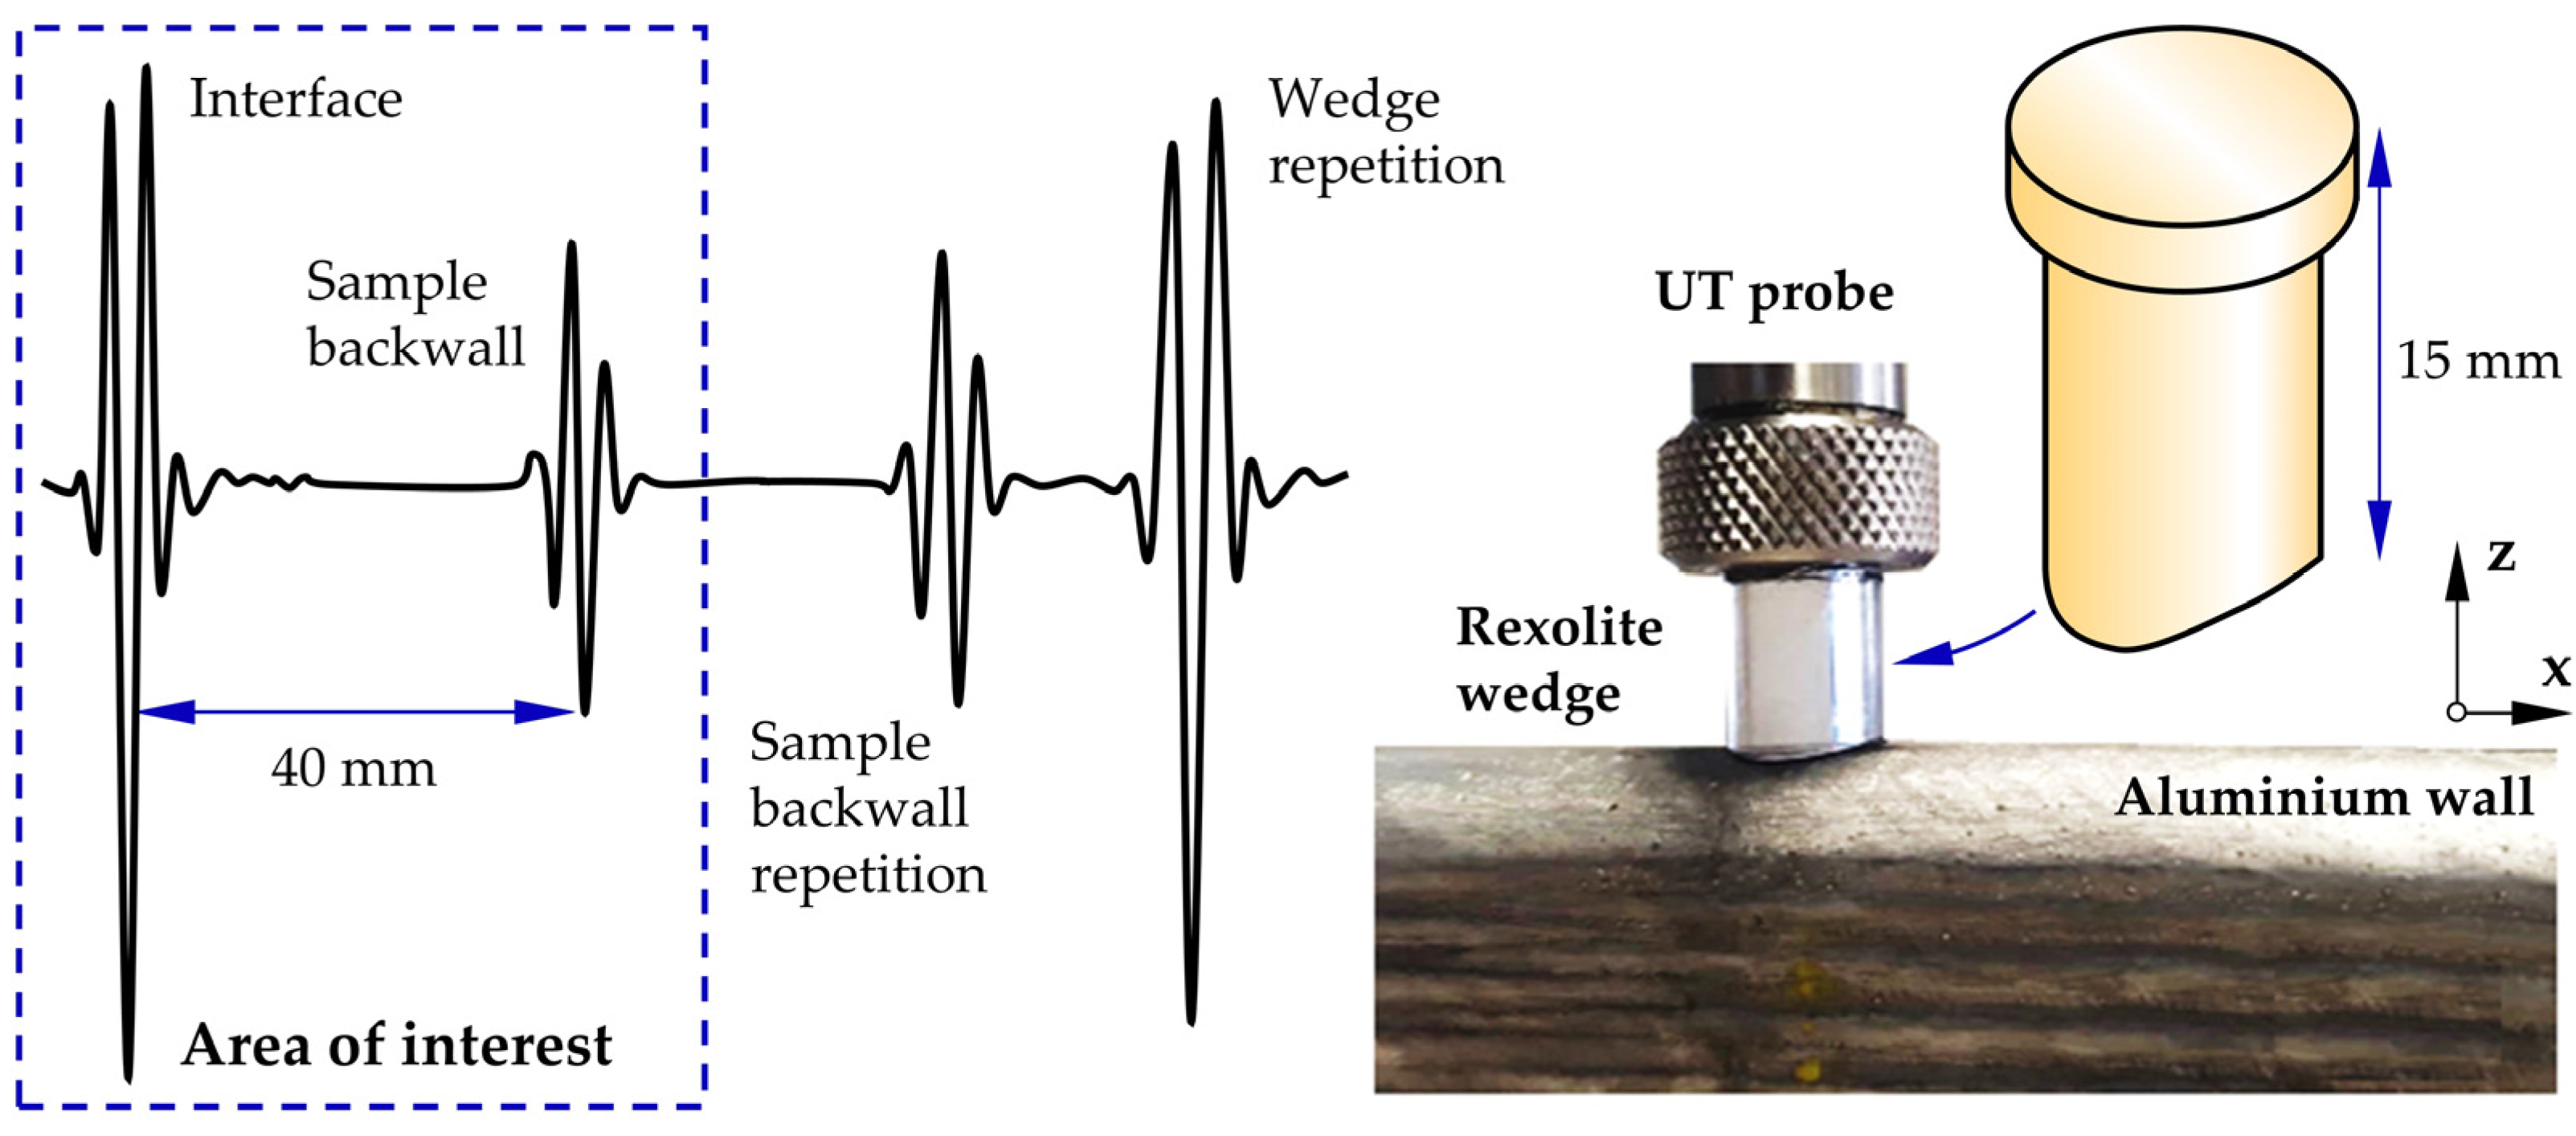
An Olympus 5 MHz small-footprint probe with a 5 mm diameter equipped with a special-purpose cylindrically shaped wedge was used for UT inspections (Figure 3). The wedge was made of Rexolite® 1422 (widely used in manufacturing of wedges [23]) and was shaped to accommodate the curvature of the top surface of the deposited aluminum walls under study. In addition, the wedge height () was purposely designed to avoid echo repetitions in the area of interest. This was performed considering the sound velocities in the aluminum () and Rexolite solid () media with a 40 mm detection height () as follows:
The wedge height () must also account for fluctuations in the sound intensity that can recur within the Fresnel region (also known as the near field) of the emitted soundwaves. This region is adjacent to the UT probe and is followed by the Fraunhofer region (far field), where the soundwave reaches its maximum intensity and therefore produces the strongest echoes and, consequently, the most accurate results [24]. The transition point () between the two fields can be calculated based on the acquisition frequency () and diameter () of the UT probe, as well as the speed of sound in Rexolite® (1422 ) as follows:
Equation (2) yields a transition point situated 13.3 mm from the UT probe, which resulting in the maximum intensity of the soundwave coincident to the inspected walls.
The results obtained using the proposed UT technique were validated using standard offline UT tests on deposited walls fully immersed in a water-filled tank at room temperature. Technical information on the UT equipment and inspection tank used for immersion UT can be found elsewhere [15]. Afterwards, the same walls were further tested by digital radiography (DR) using a SMART 583-1007 from YXLON International instrument (Hattingen, Germany) to provide insights with respect to sizing, morphology and the location of artificial defects.
3. Results and Discussion
3.1. Material Properties
The first subsection of results presented in the paper covers the analysis of the chemical, metallurgical and mechanical characteristics of ER5356 aluminum walls built by WAAM with or without interlayer application of FL50 solder flux.
Based on these results, one of the following three scenarios is expected to occur: (1) the solder flux reacts with the molten material, and its properties are deteriorated; (2) the solder flux has a synergistic effect on the molten material, improving its properties; or (3) the solder flux behaves as a neutral agent during deposition, with little or no effect on the characteristics of the deposited material. We believe that scenarios (2) and (3) are acceptable to validate the applicability of the solder flux in situ, whereas scenario (1) would imply that the solder flux is not suitable for in situ UT.
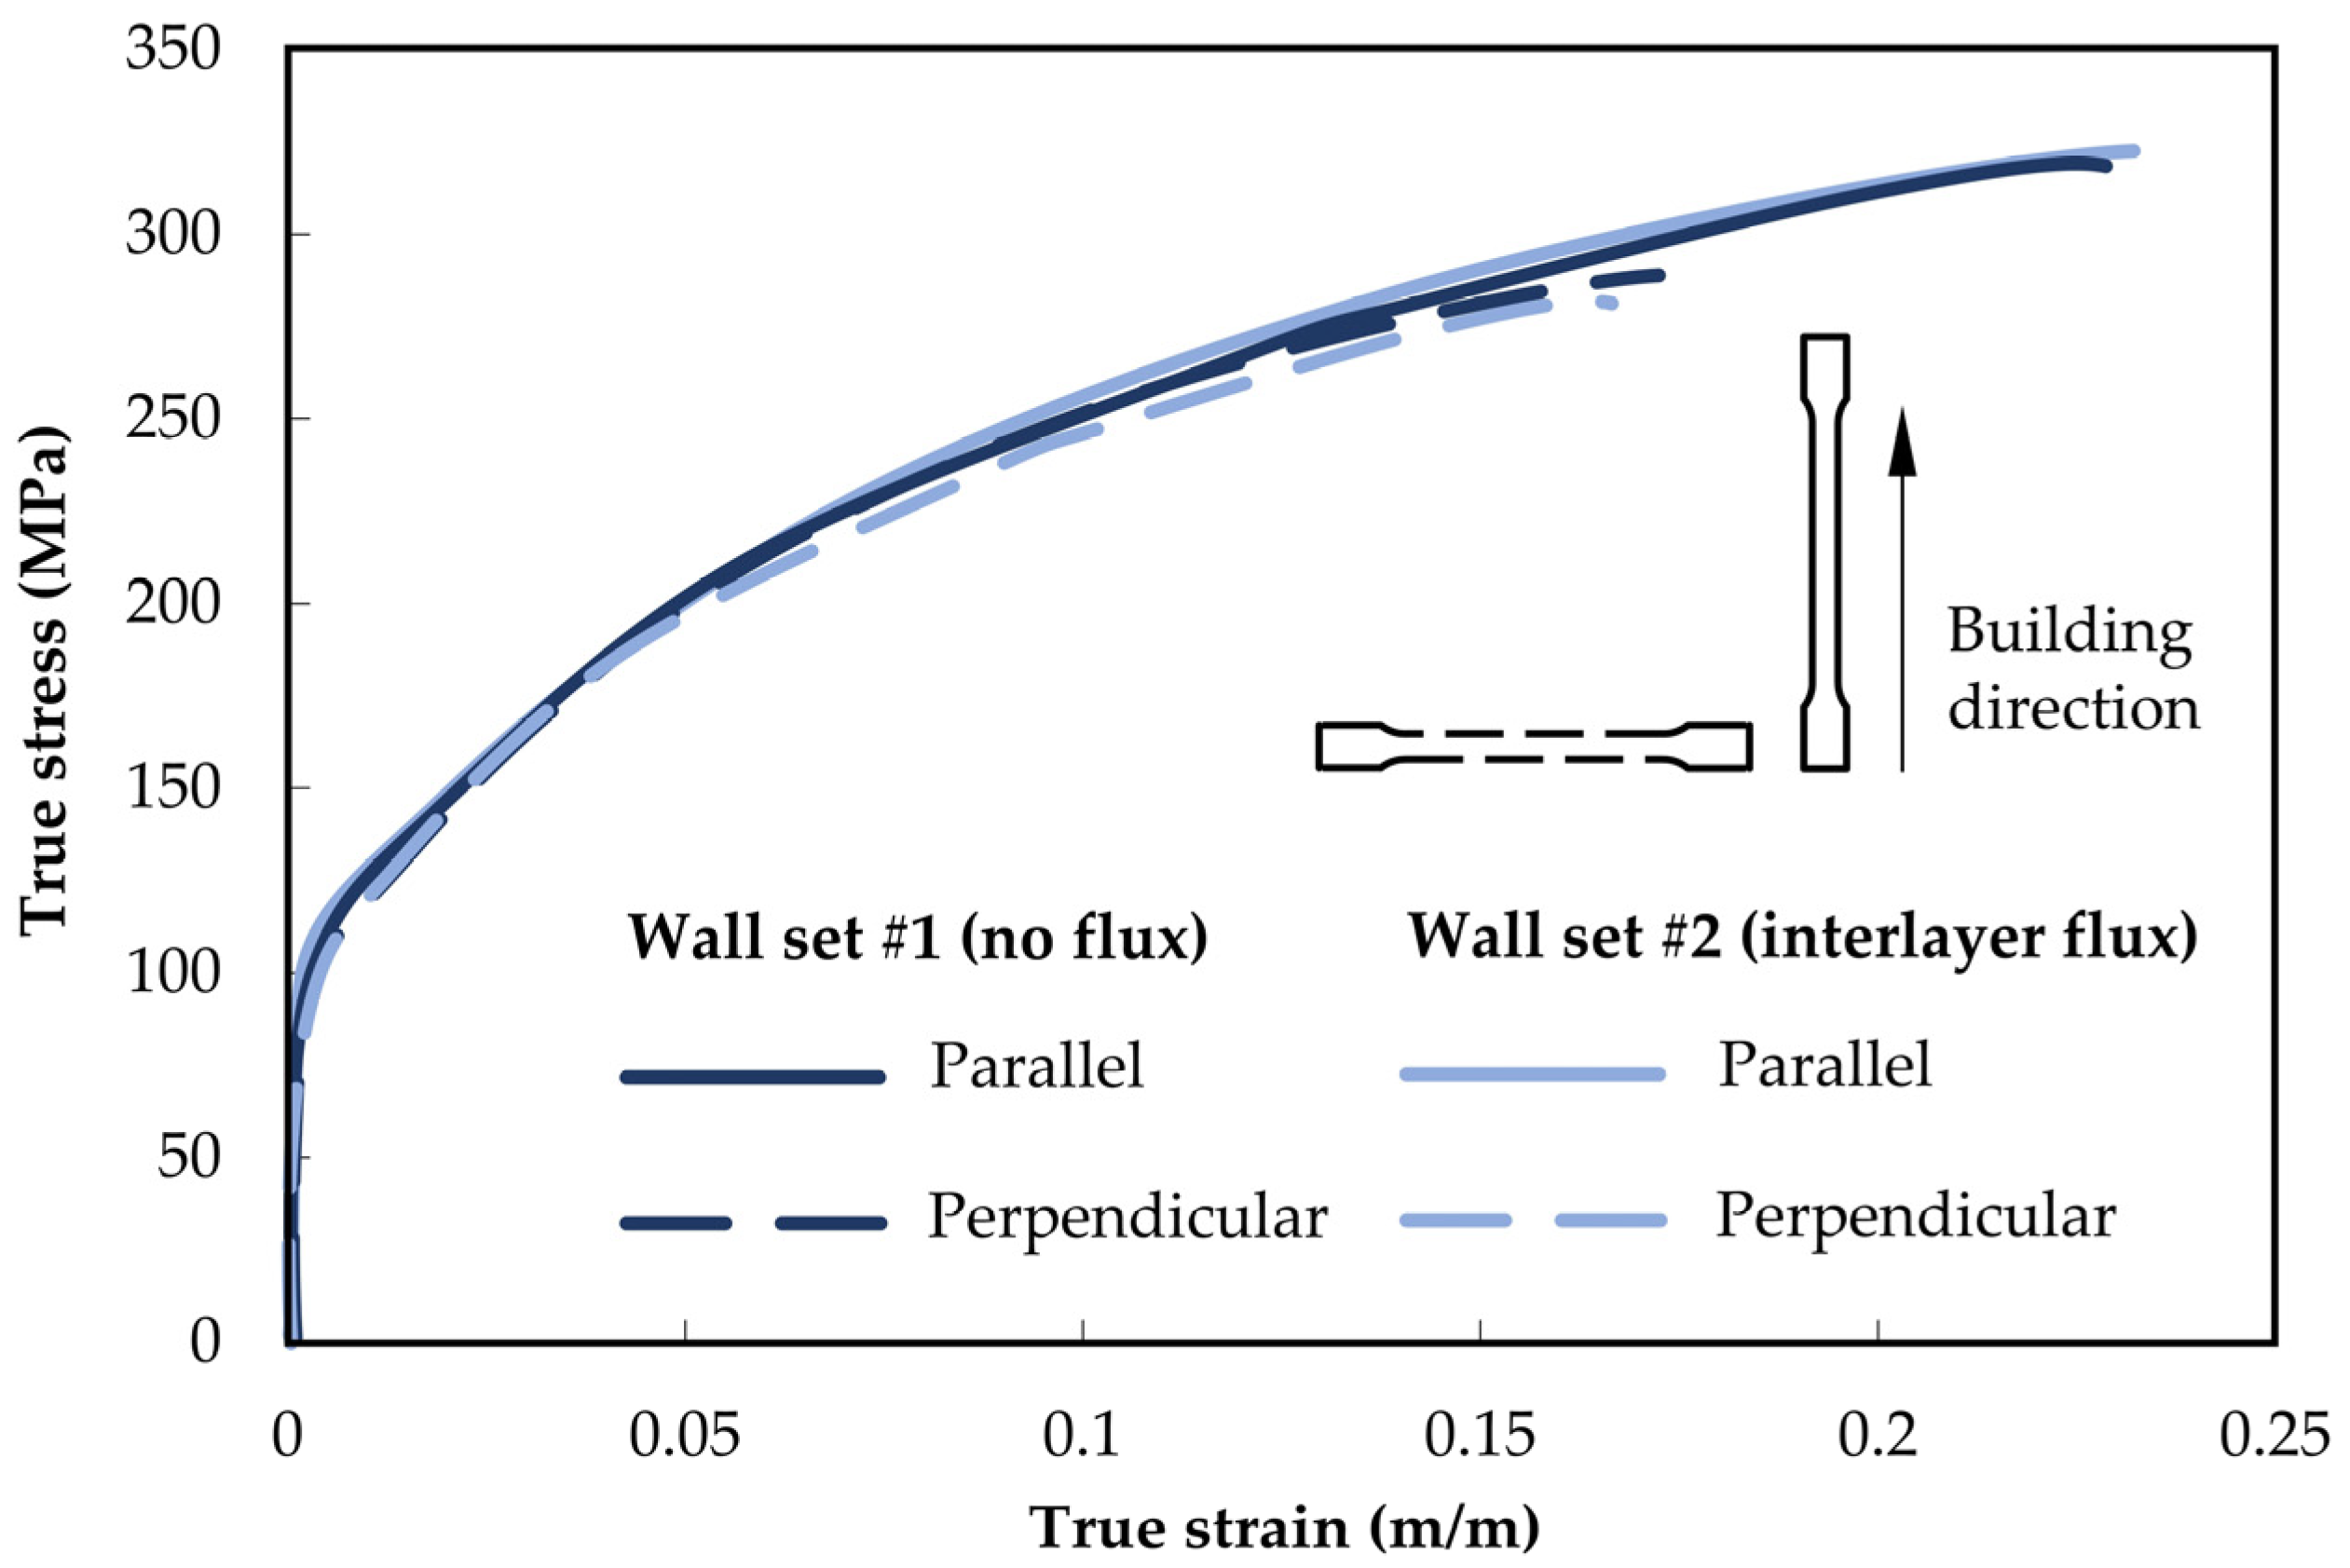
Figure 4 presents the average true stress–strain curves obtained in the tensile tests with round dogbone specimens taken from wall sets #1 and #2 parallel and perpendicular to the building direction. By considering the same specimen orientation, both average stress–strain curves were found to be nearly equal to one another. The mechanical properties obtained from tensile testing shown in Table 4 follow the same logic, denoting very similar values for the Young’s modulus (), yield strength (), ultimate tensile strength () and elongation at break () in both wall sets. Moreover, these properties are similar to those commonly found in standard commercial Al-Mg alloys with equivalent compositions, indicating that WAAM-based aluminum depositions can accommodate industrial requirements.
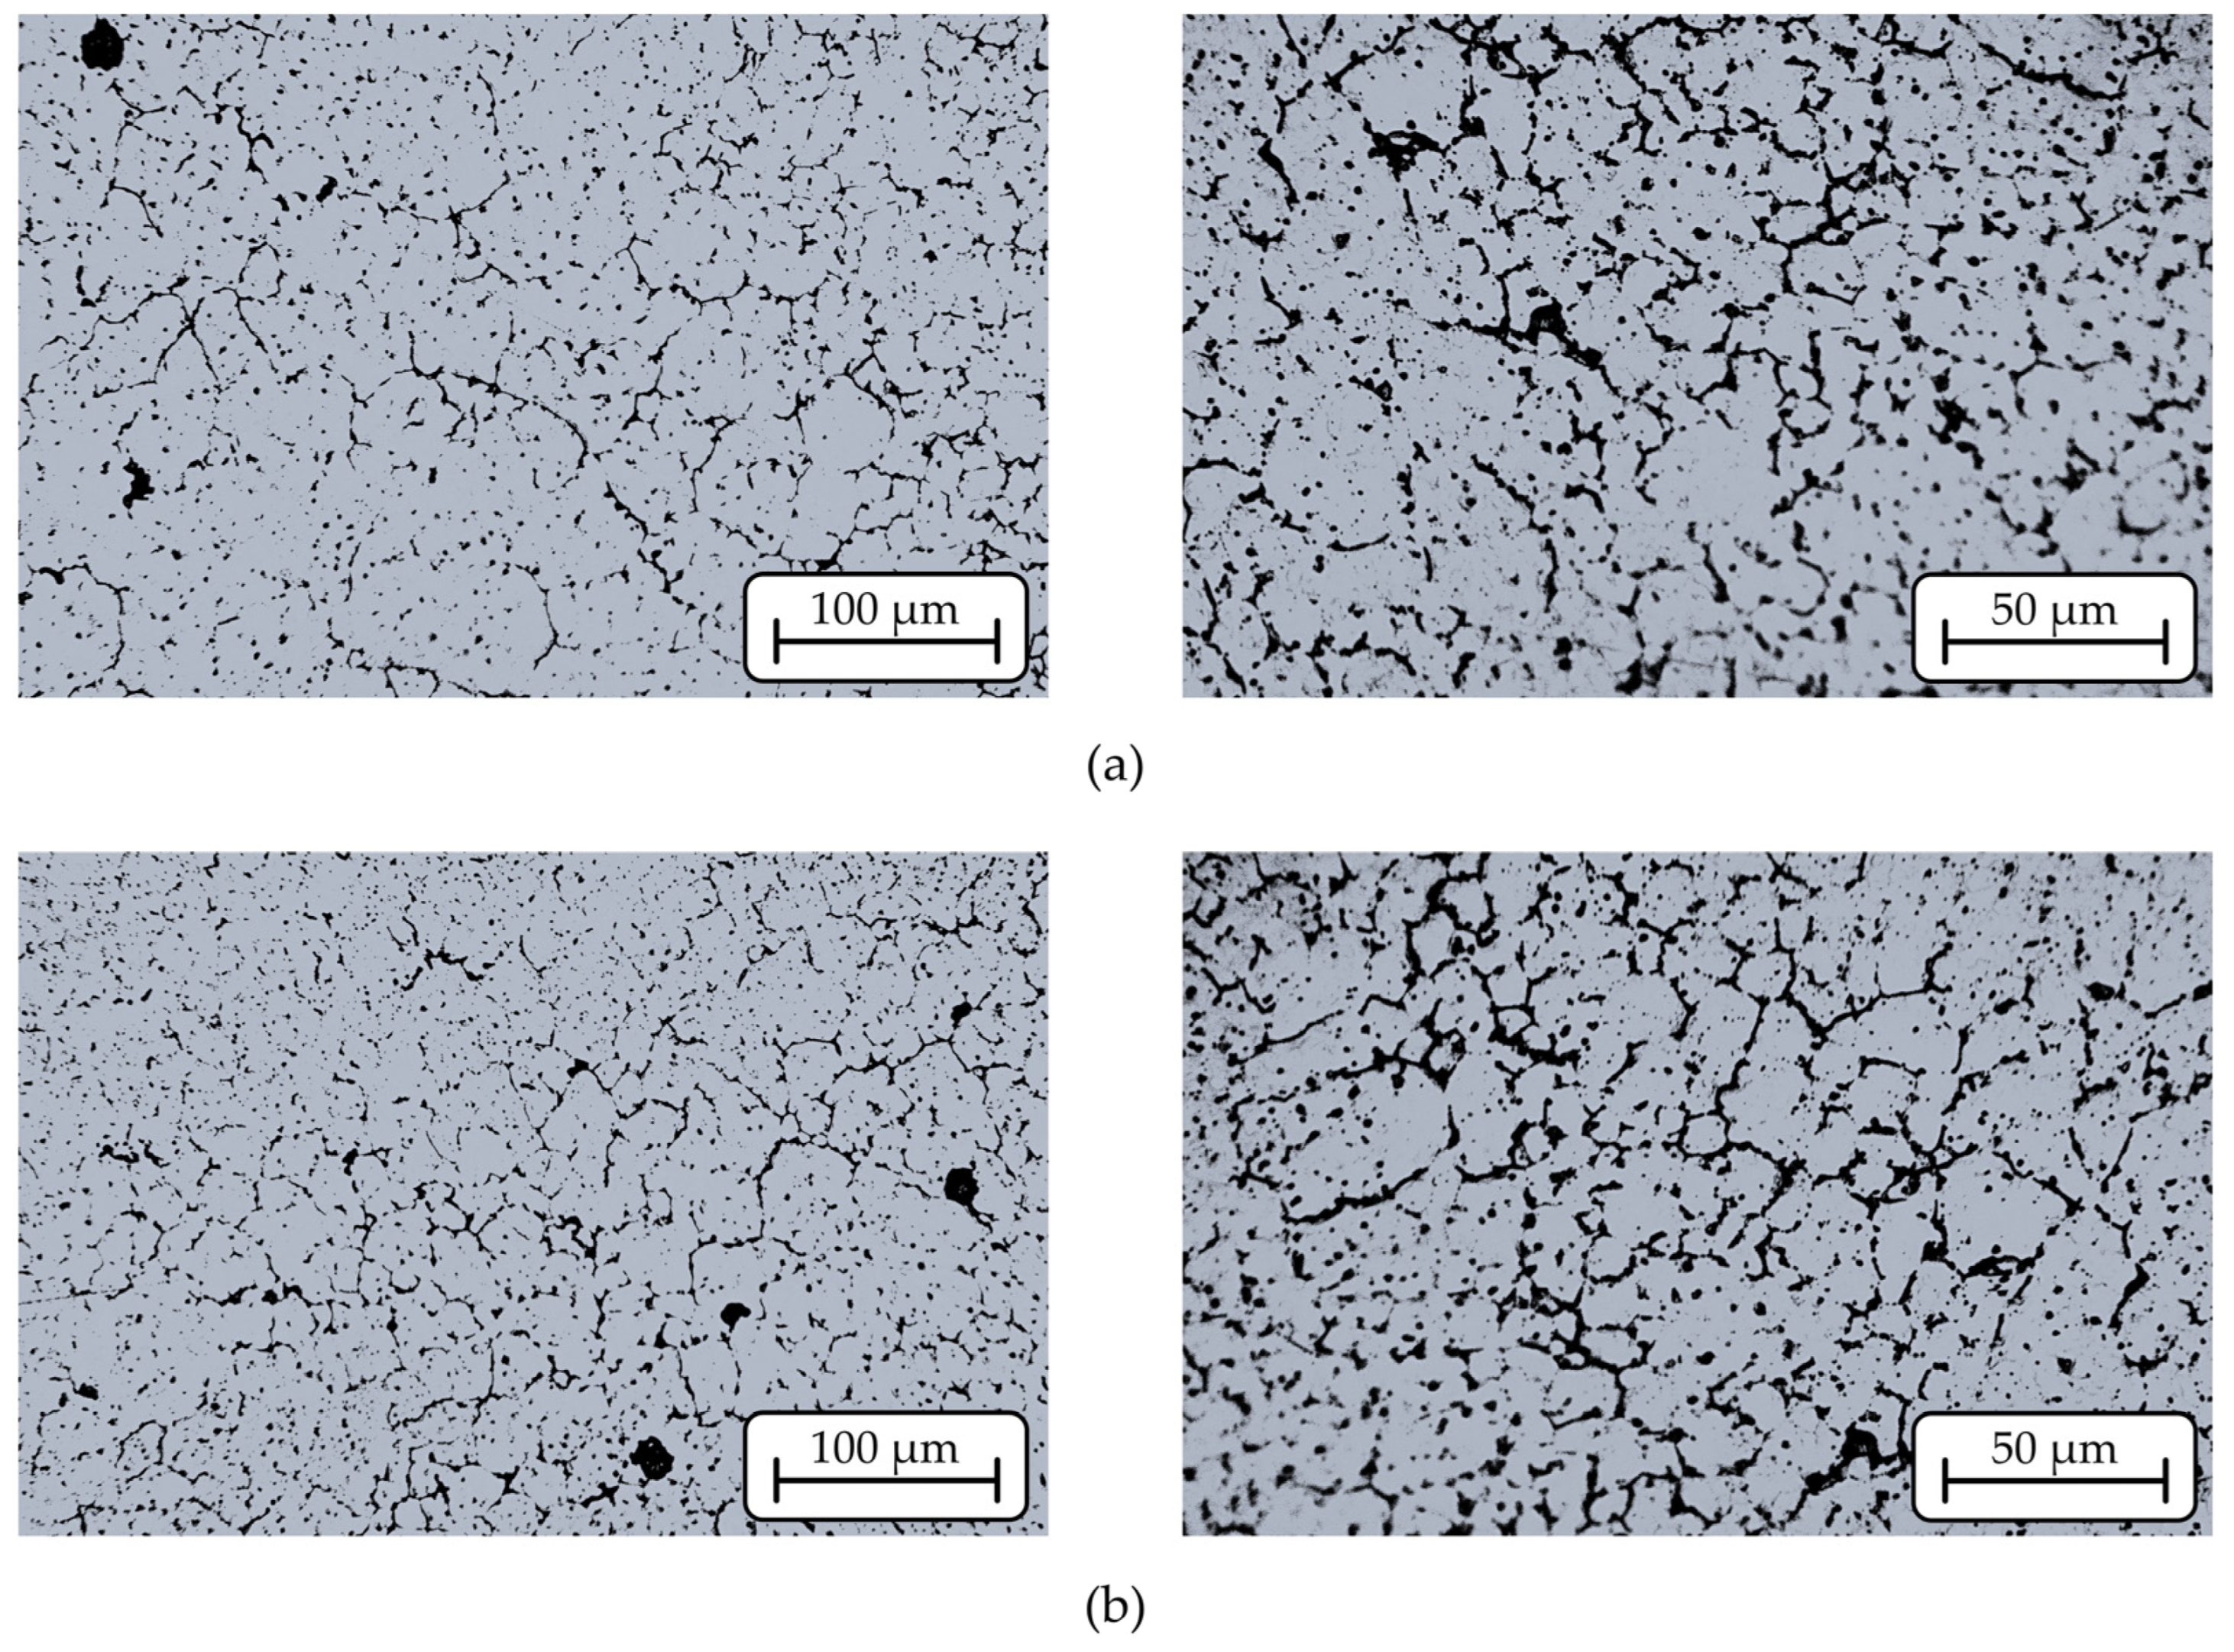
Figure 5 shows the microstructure obtained from metallographic samples cut from the aluminum walls from sets #1 (without solder flux) and #2 (with interlayer application of solder flux). These images were obtained by optical microscopy under two different magnifications.
Both microstructures are composed of equiaxed patterns and irregularly sized grains, highlighting the presence of small spherical pores. This type of microstructure corresponds to what is typically found in most metal alloys processed by WAAM and analyzed in the as-built condition (i.e., without any mechanical or thermally based postprocessing operations) [25], mainly attributed to the heating–cooling cycles that occur during metal deposition [26].
Comparing of the optical microscopic images taken of the metallographic samples of wall sets #1 (Figure 5a) and 2# (Figure 5b) revealed no significant differences, justifying the near-similar mechanical behavior and properties of the wall shown in Figure 4 and Table 4.
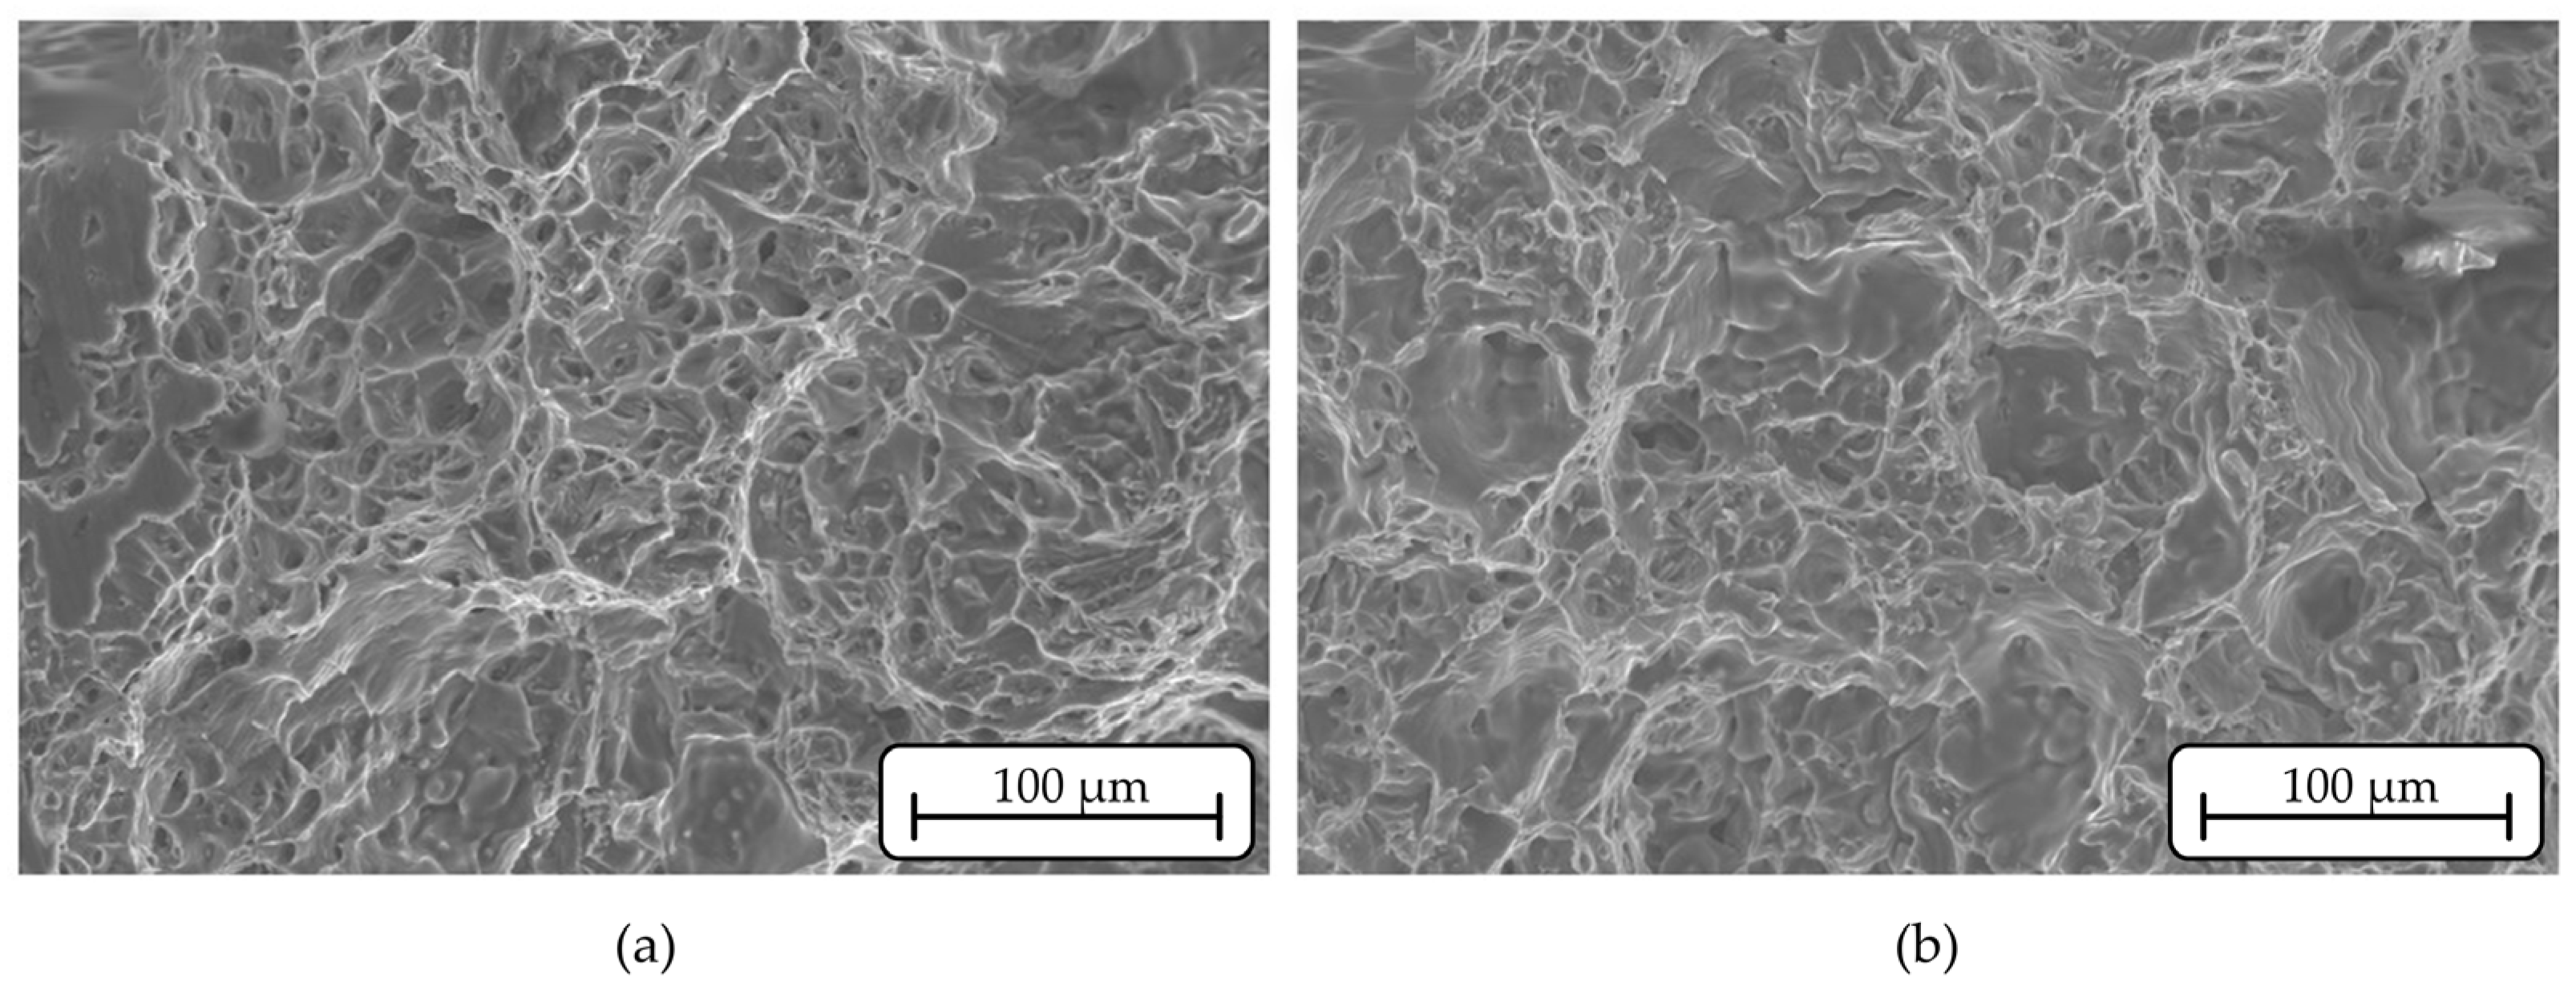
The morphology of the fractured surfaces from the tensile testing specimens is shown in Figure 6a,b for wall sets #1 and #2. The images were obtained by SEM and reveal a dimple-based structure with a highly stochastic size and depth. This structure is typical of ductile fracturing with crack opening by tension (mode I of fracture mechanics) along the length of the specimens [26]. No significant differences were detected between the results of the two wall sets.
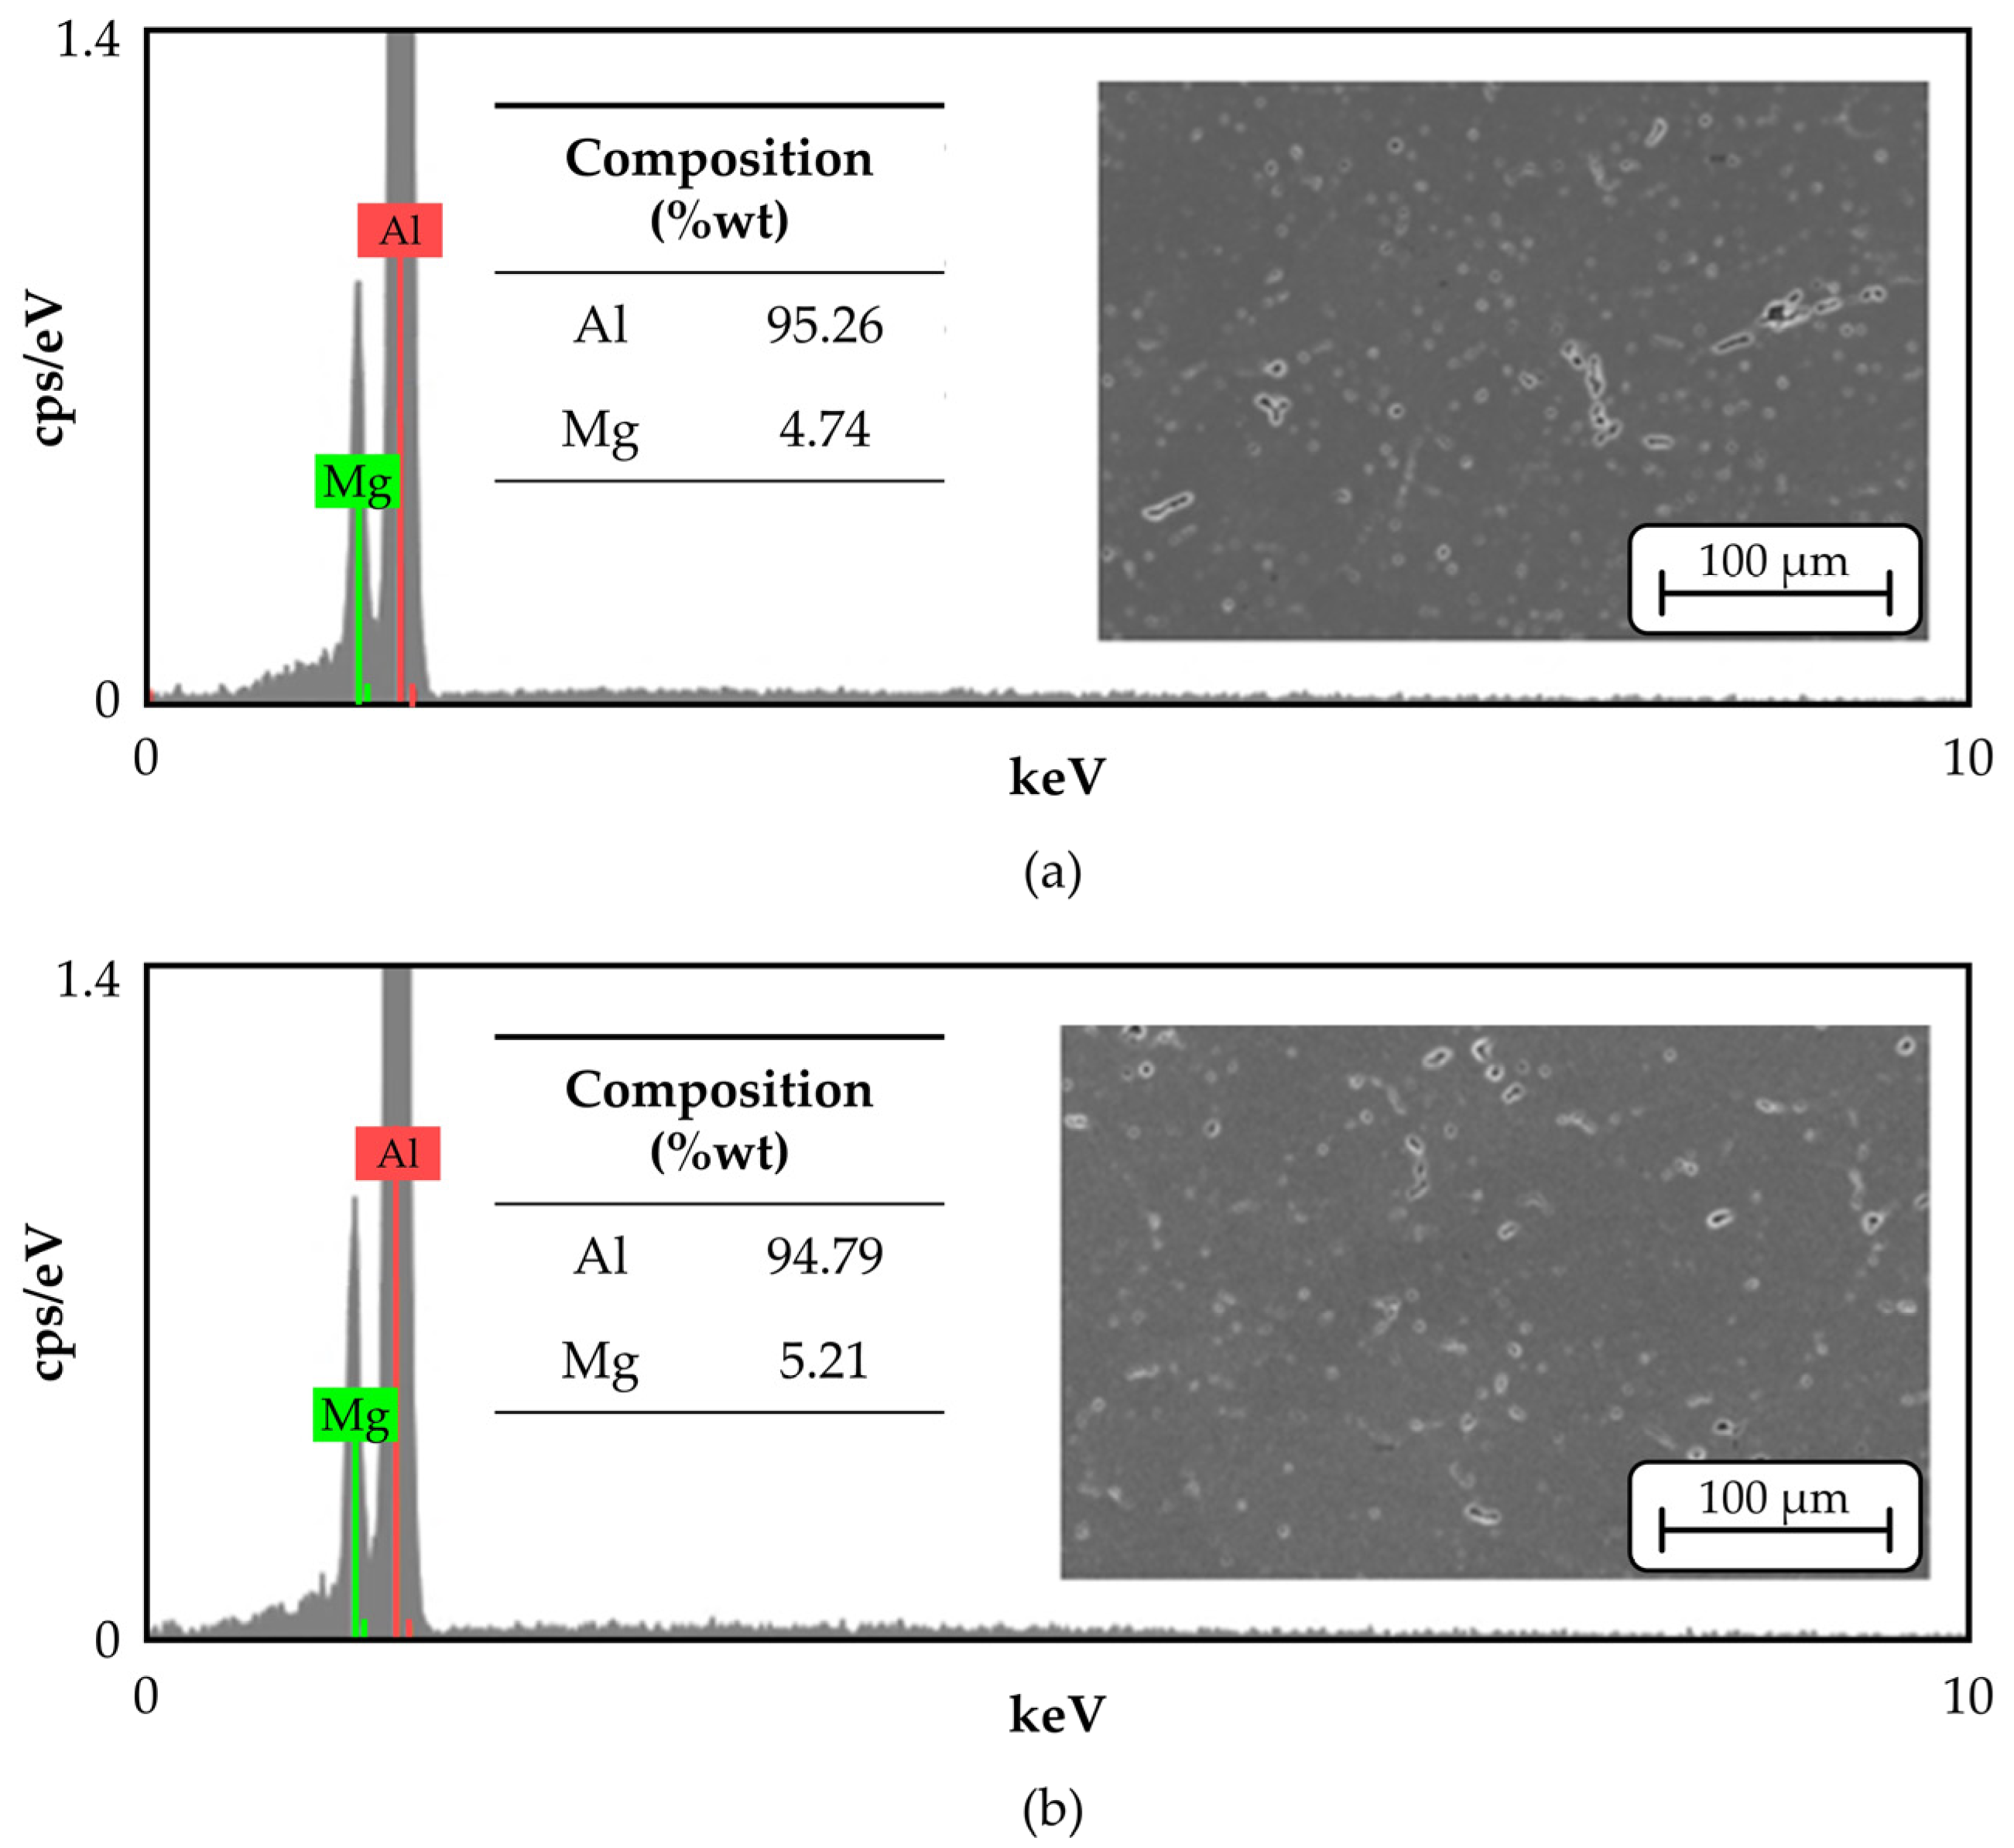
Finally, the chemical compositions of the metallographic samples cut from wall sets #1 and #2 are shown in Figure 7a,b, respectively. The distributions of aluminum (Al) and magnesium (Mg) obtained by EDS analysis are also very similar and reveal a homogenous distribution of particles without showing signs of inclusions or segregations. Based on these results, it is possible to conclude that the FL50 solder flux applied between all layers was completely volatilized during metal deposition by WAAM without leading to any effect whatsoever on the material properties.
3.2. Ultrasonic Testing
Ultrasonic tests were carried out in wall set #3 (refer to Table 3 of Section 2.1), in which artificial defects were created by drilling. To this end, a Rexolite® 1422 wedge was attached to an Olympus small-footprint UT probe to conduct continuous scans on the top region of the walls using FL50 solder flux as a coupling medium.
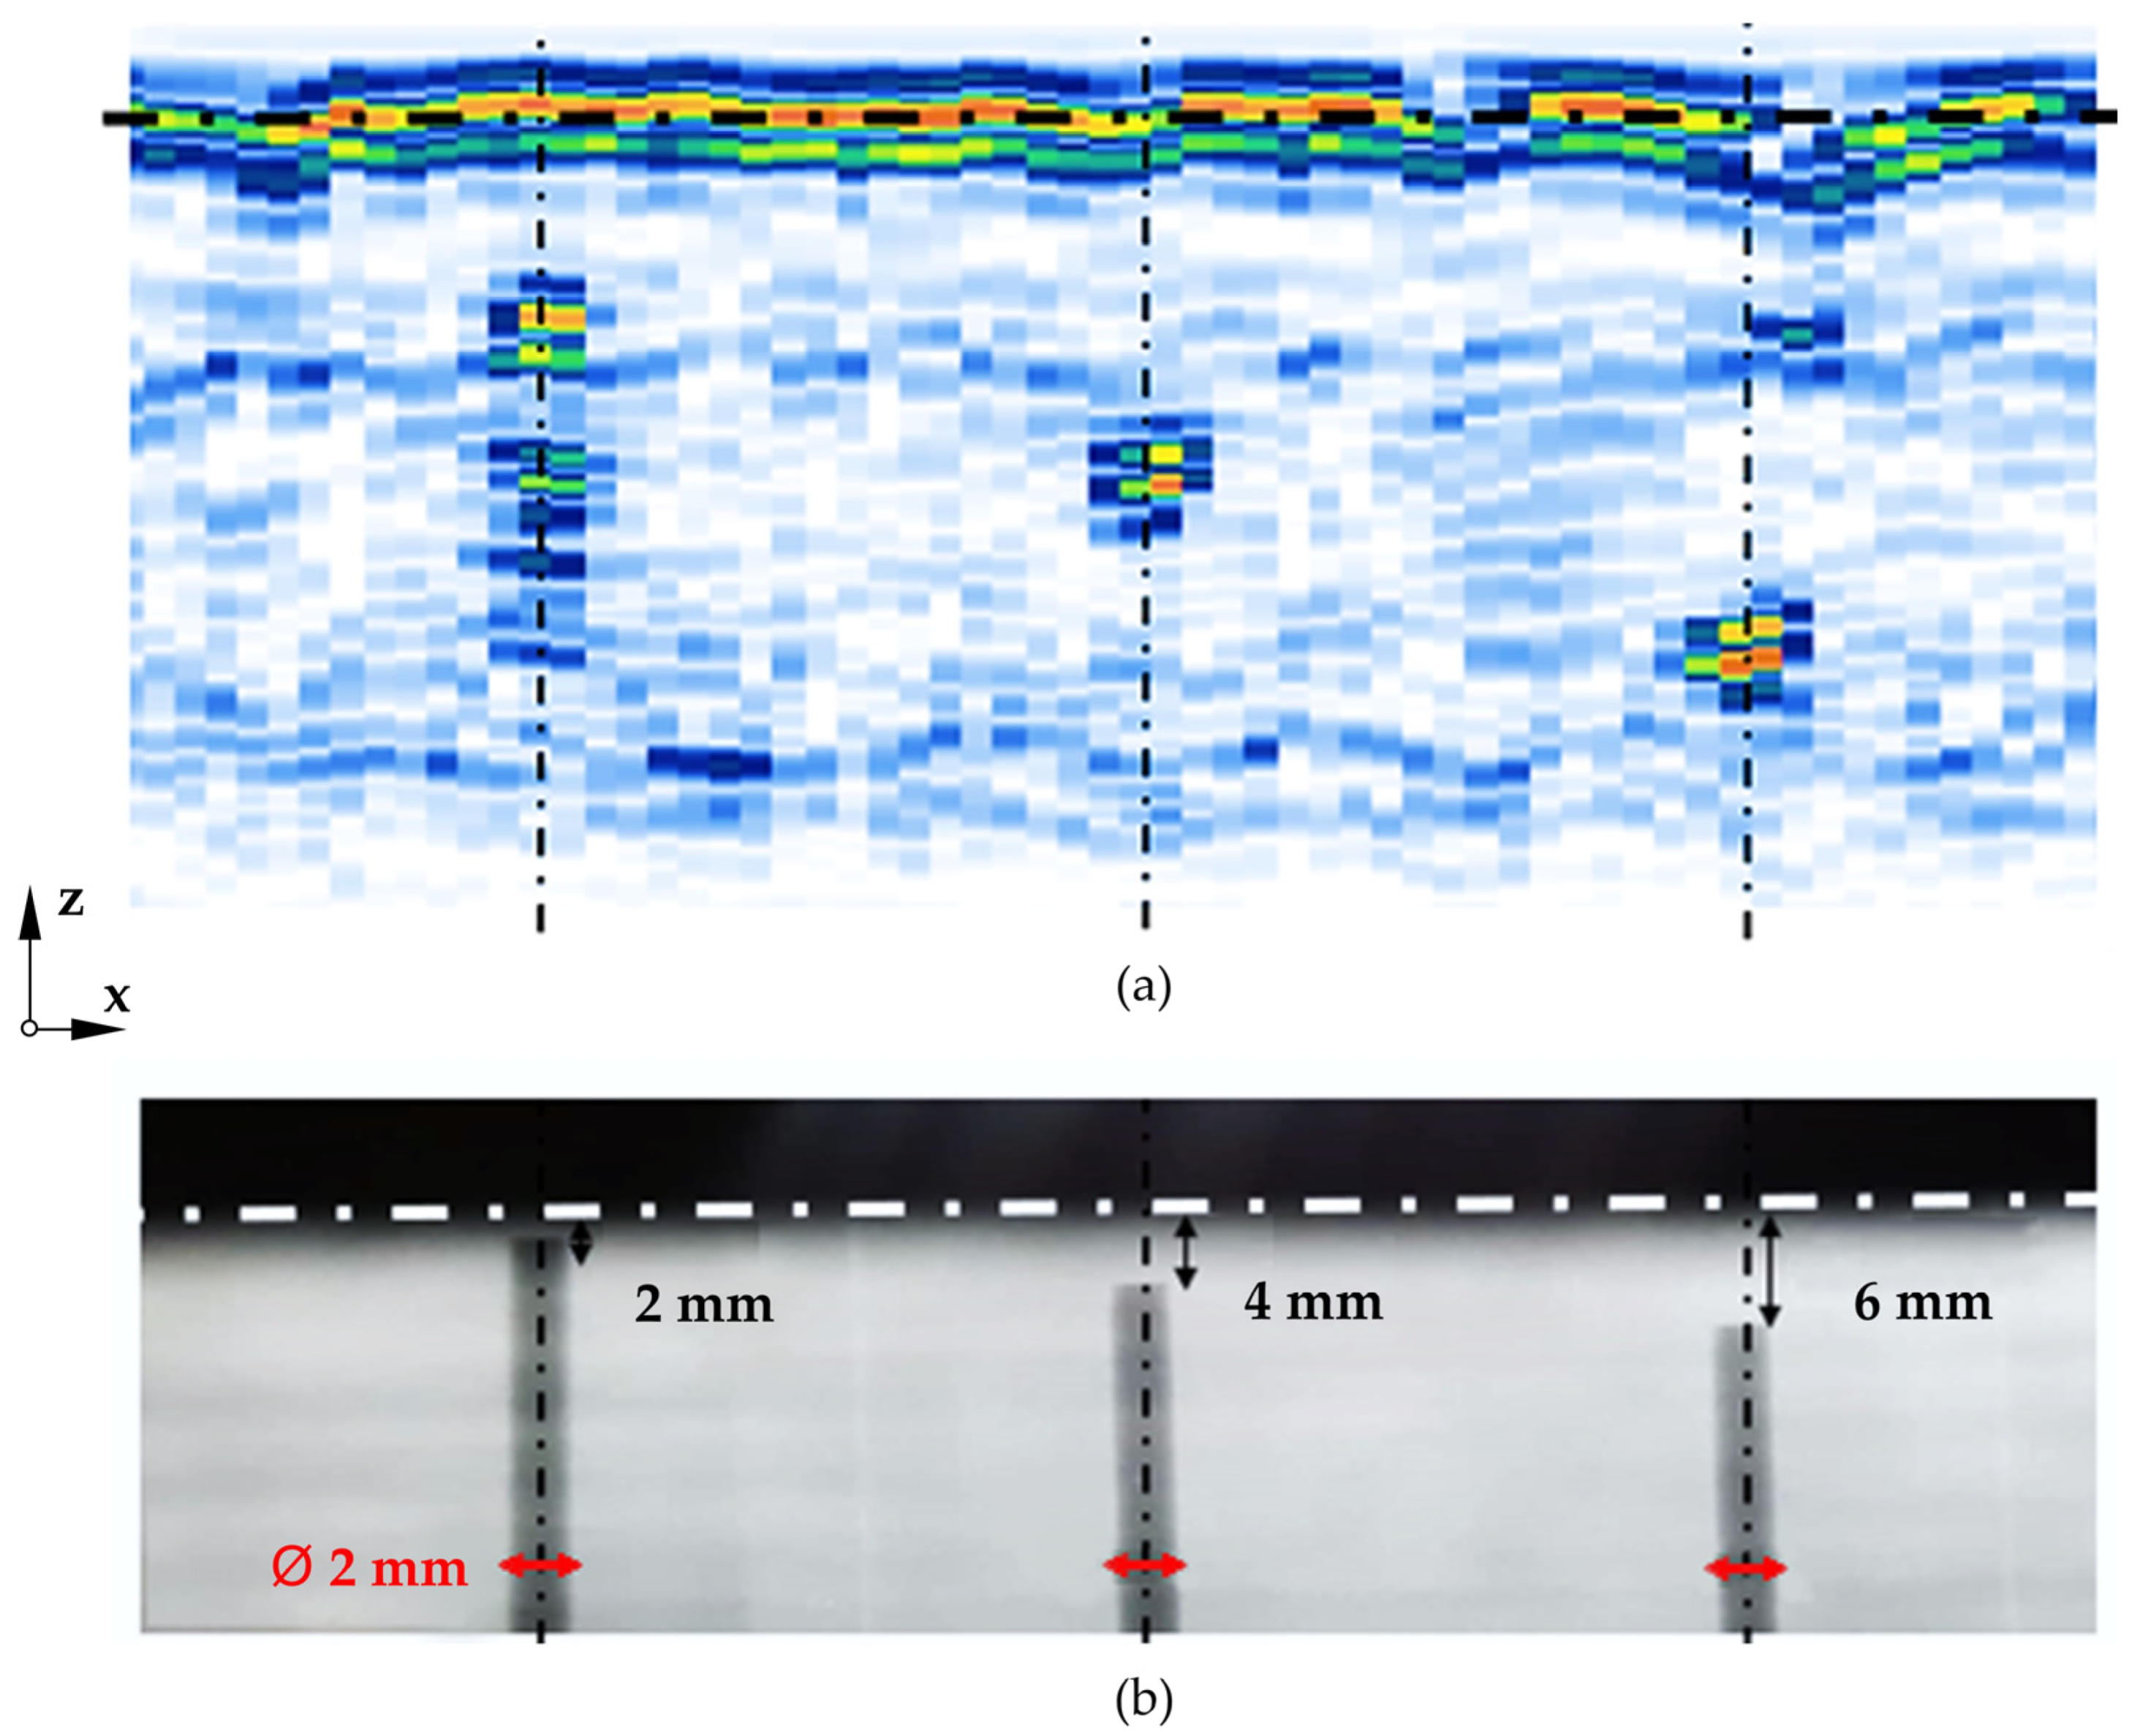
Figure 8 shows the artificial defects at 2 mm, 4 mm and 6 mm depths detected at room temperature by two different NDTs: (a) the proposed UT technique and (b) DR used for reference purposes. The developed experimental setup involving the UT equipment, wedge and coupling medium fulfills the requirements needed to detect defects residing in the interior of the deposited ER5356 aluminum walls at all considered depths.
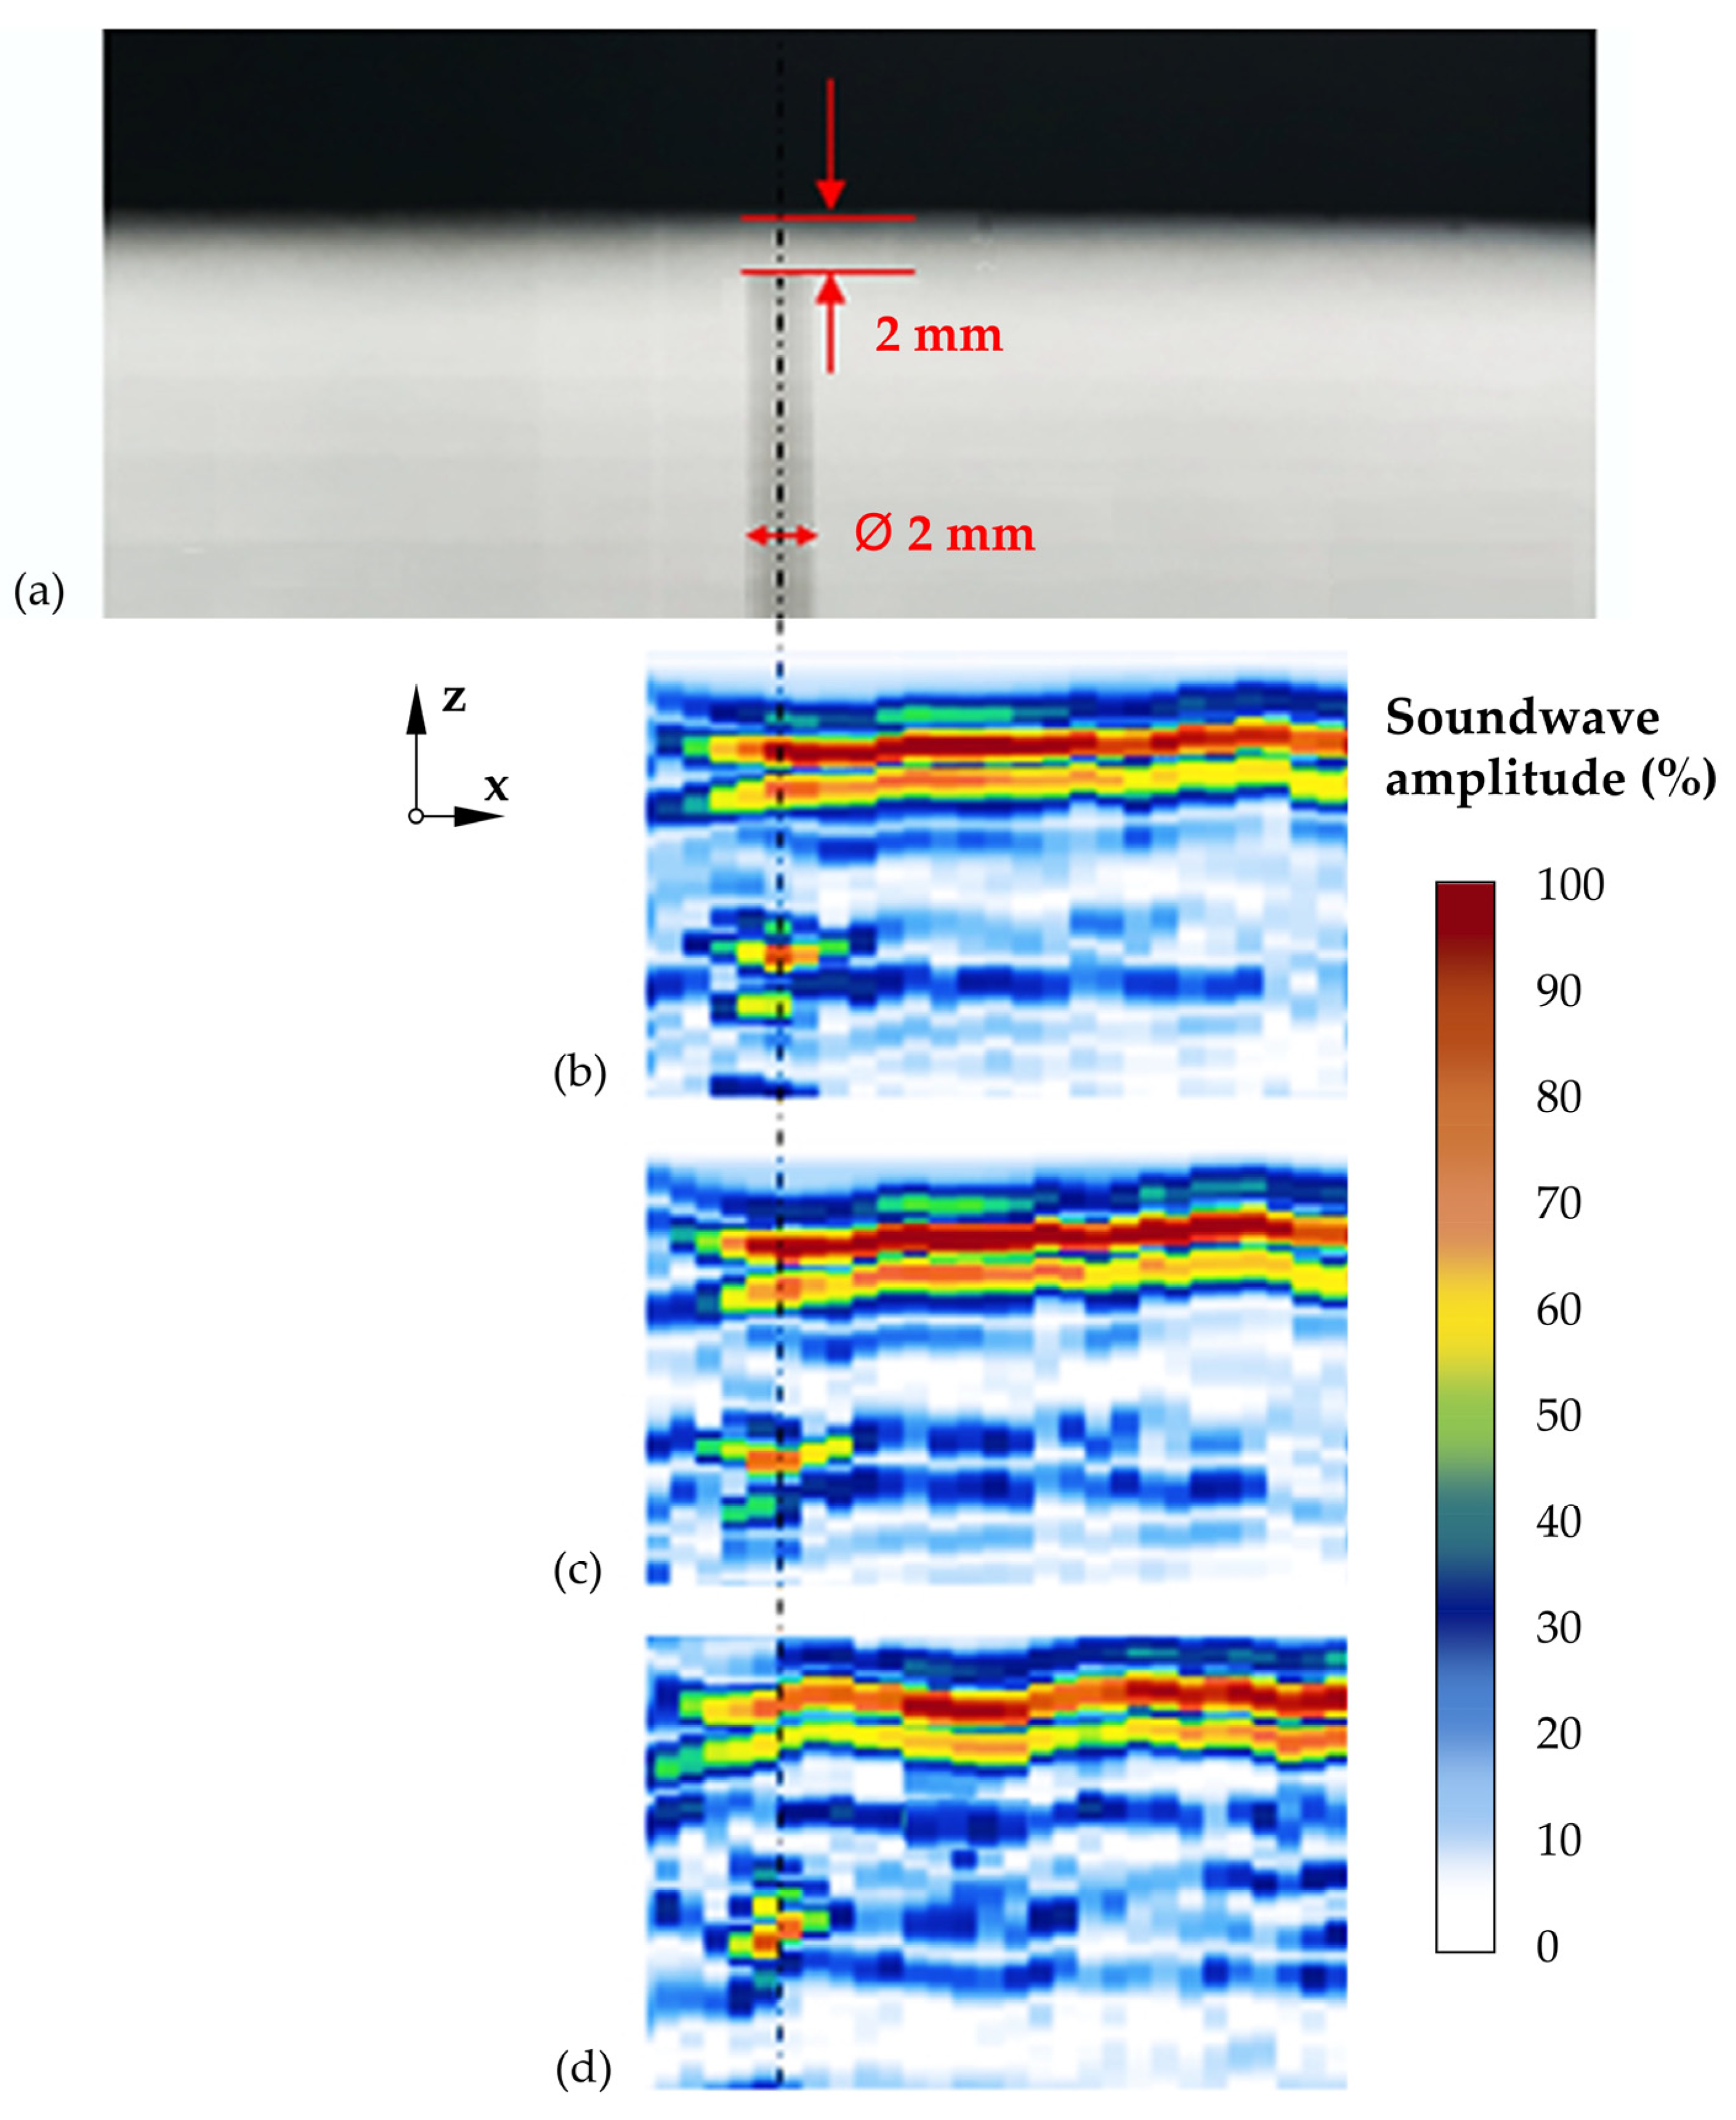
The performance of the FL50 solder flux as a coupling medium for UT was further tested for different temperatures in the range of 50 to 100 °C using the same experimental setup. Reference results are presented in Figure 9a,b for the detection of the 2 mm depth defects using DR and immersion UT in a water-filled tank (i.e., unaffected by temperature), followed by the results obtained using the proposed UT technique shown in Figure 9c,d. For the last two figures, UT was implemented using solder flux as a coupling medium with deposited ER5356 aluminum walls at room temperature (Figure 9c) and at 100 °C (Figure 9d) on the onset of the measurements.
Results show that no relevant differences in terms of soundwave reflections were detected at room temperature. Some noise in the UT results was detected when the temperature of the aluminum walls was close to 100 °C, which is characteristic of UT carried out at high temperatures [27]. Nevertheless, the detected noise did not comprise the detection of the same defects, as proven by the similarities in amplitude distribution between Figure 9b,c.
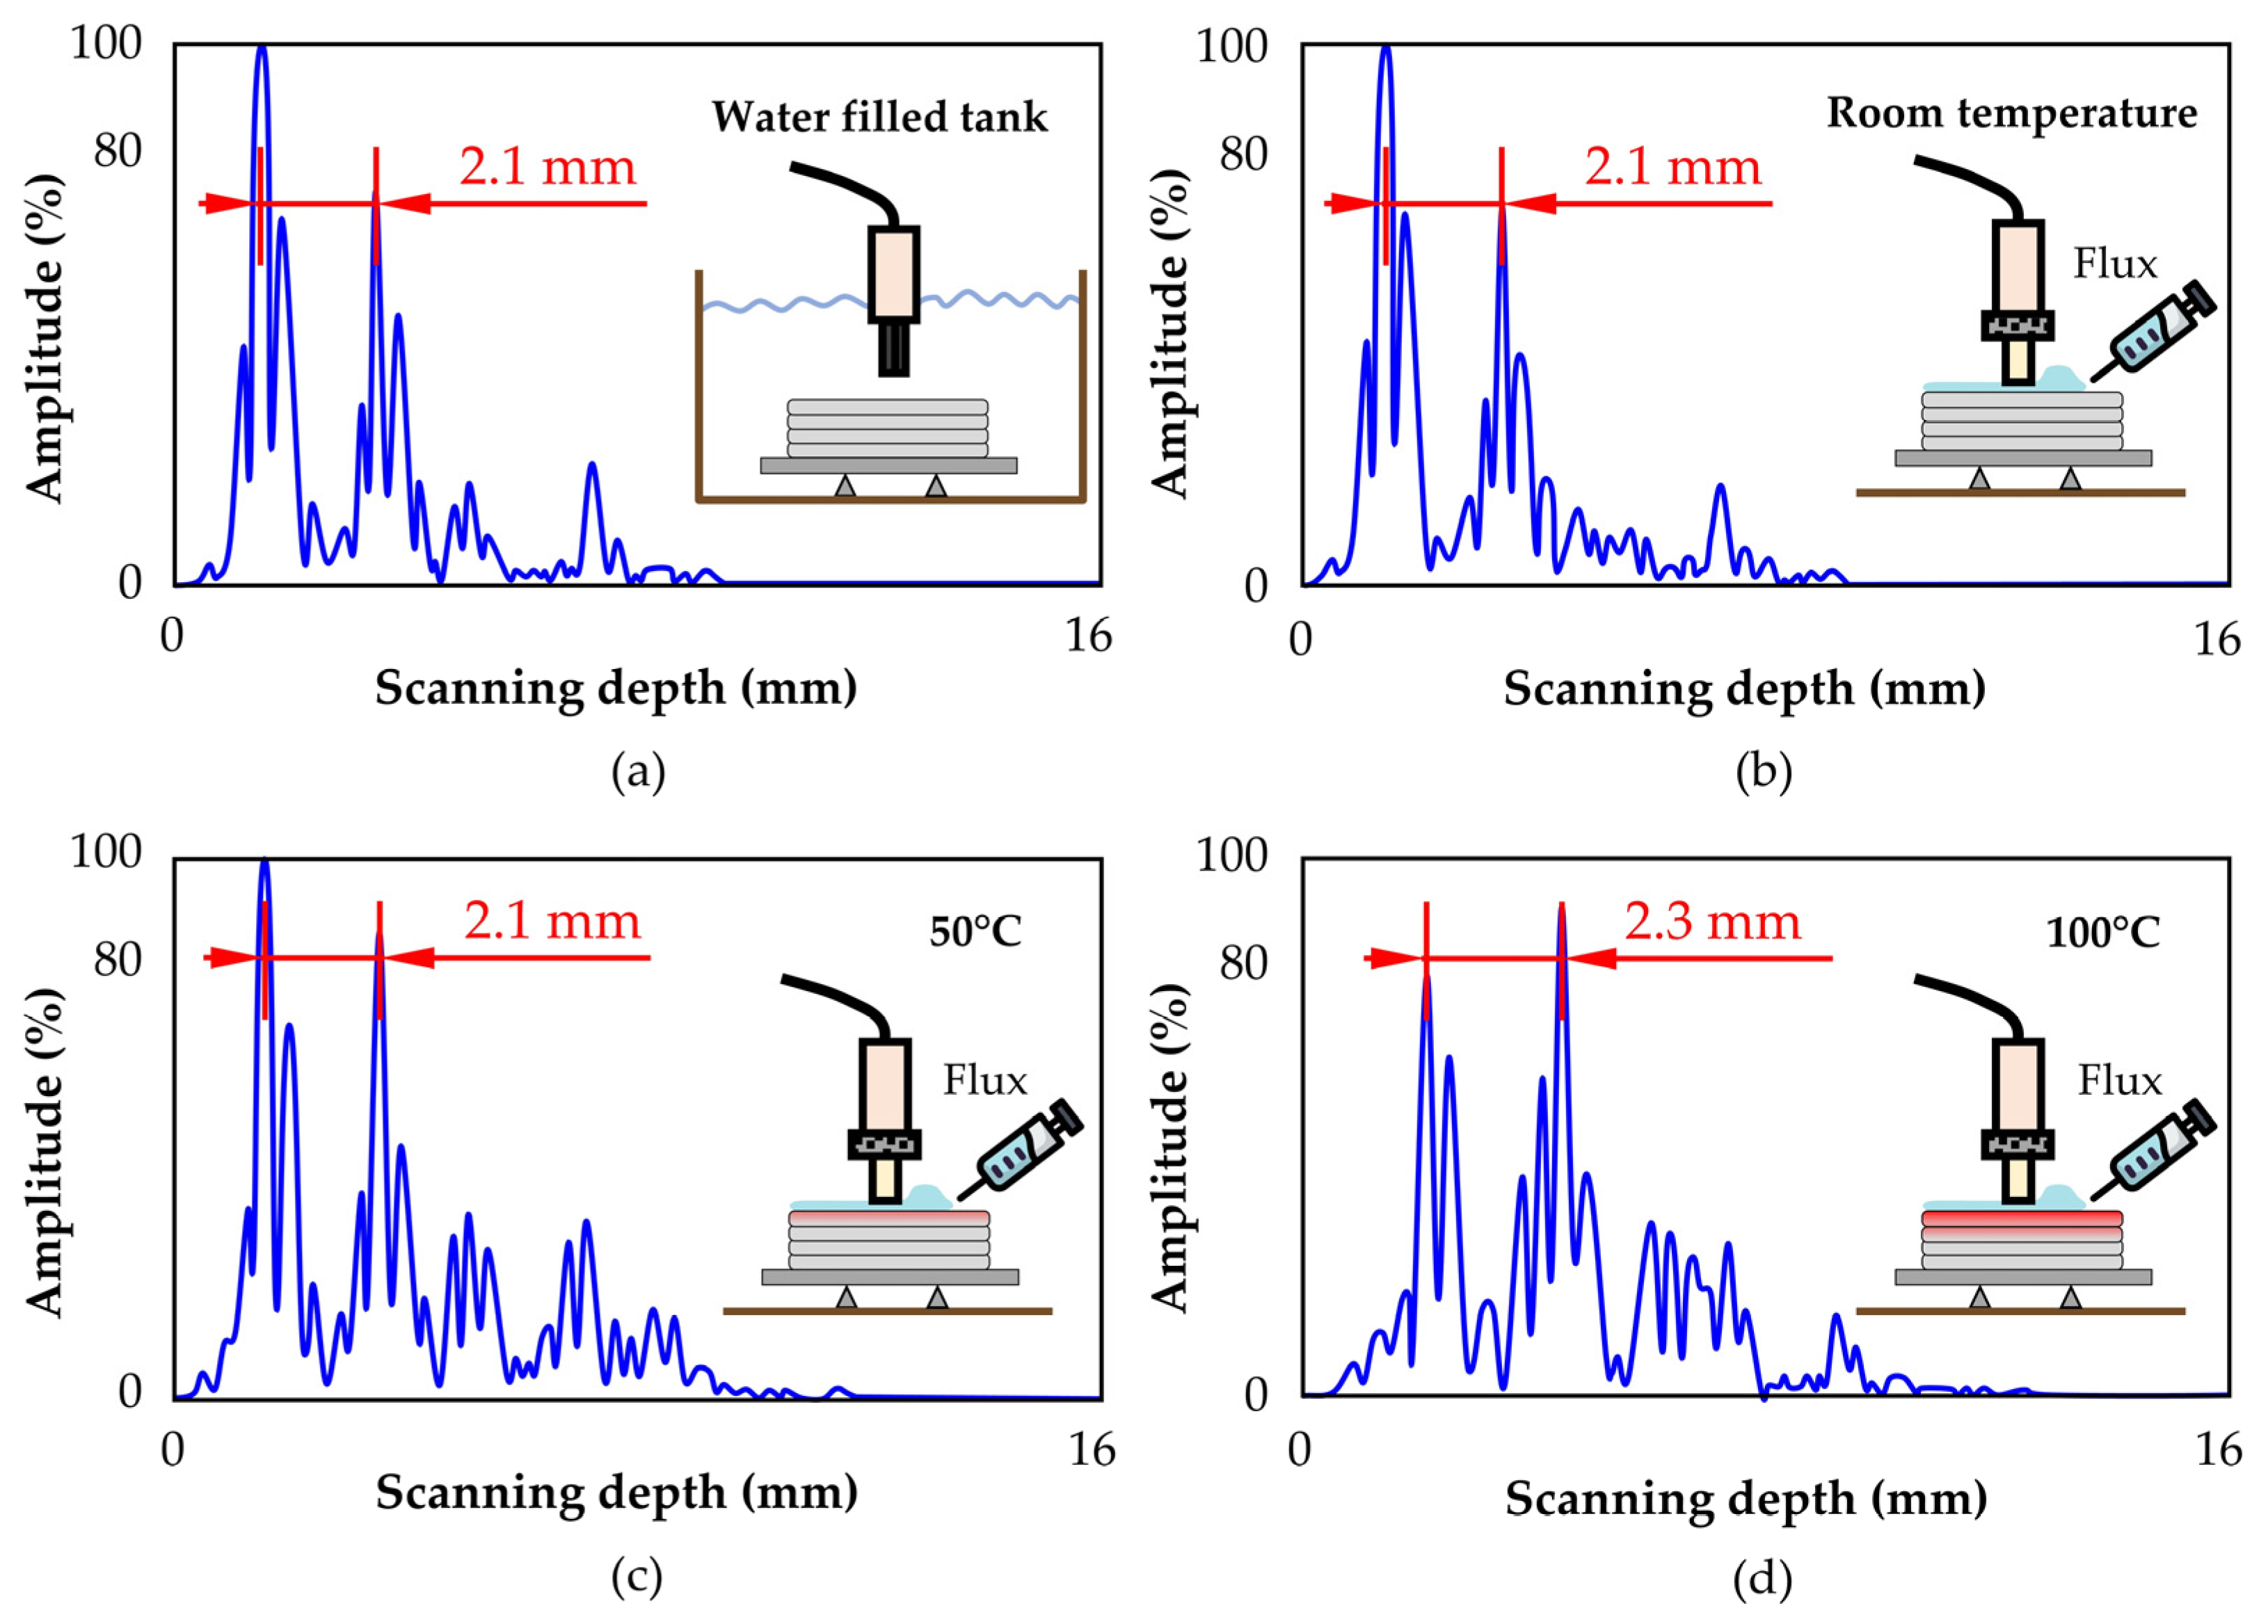
Soundwave amplitudes scans (A-scans) for the UT detections are plotted in Figure 10 as a function of the scanning depth. The acquisitions made at room temperature corresponding to Figure 10a with immersion UT and 10b with UT using solder flux as a coupling medium reveal reflection peaks of nearly 2 mm from the first echo. The corresponding soundwave amplitudes suffered a slight decrease from 75% to 73%, demonstrating the accurate performance of the FL50 solder flux as a coupling medium for UT at room temperature.
The soundwave amplitudes for temperatures of 50 °C and 100 °C in the region where the wedge contacts the deposited ER5356 aluminum walls are shown in Figure 10c,d, respectively. In these scenarios, the amplitude of noise is more significant (up to 35% amplitude), and the reflection peak may be slightly wider due to decreases in soundwave velocity (promoted by temperature increases) [28]. Still, the reflected soundwave amplitude can be clearly distinguished from the remaining noises, meaning that the proposed technique allows for scanning of the defect depth with the required accuracy.
3.3. Solder Flux vs. Water as a Coupling Medium
Ultrasonic testing is highly dependent on how the acoustic energy from the soundwaves is transmitted from the medium. For instance, energy losses in soundwaves through heterogenous media are expected to occur due to acoustic attenuation. Moreover, the acoustic impedances of all media involved in UT have a clear impact on the effectiveness of the acoustic flow through the system. Differences in the acoustic impedance of each medium can give rise to considerable reflection percentages of energy at the media interfaces, compromising UT performance [24]. Therefore, in this subsection, we present comparisons of the acoustic characteristics of the FL50 solder flux as a coupling medium for in situ UT compared to those of a water-based medium typically used in offline UT.
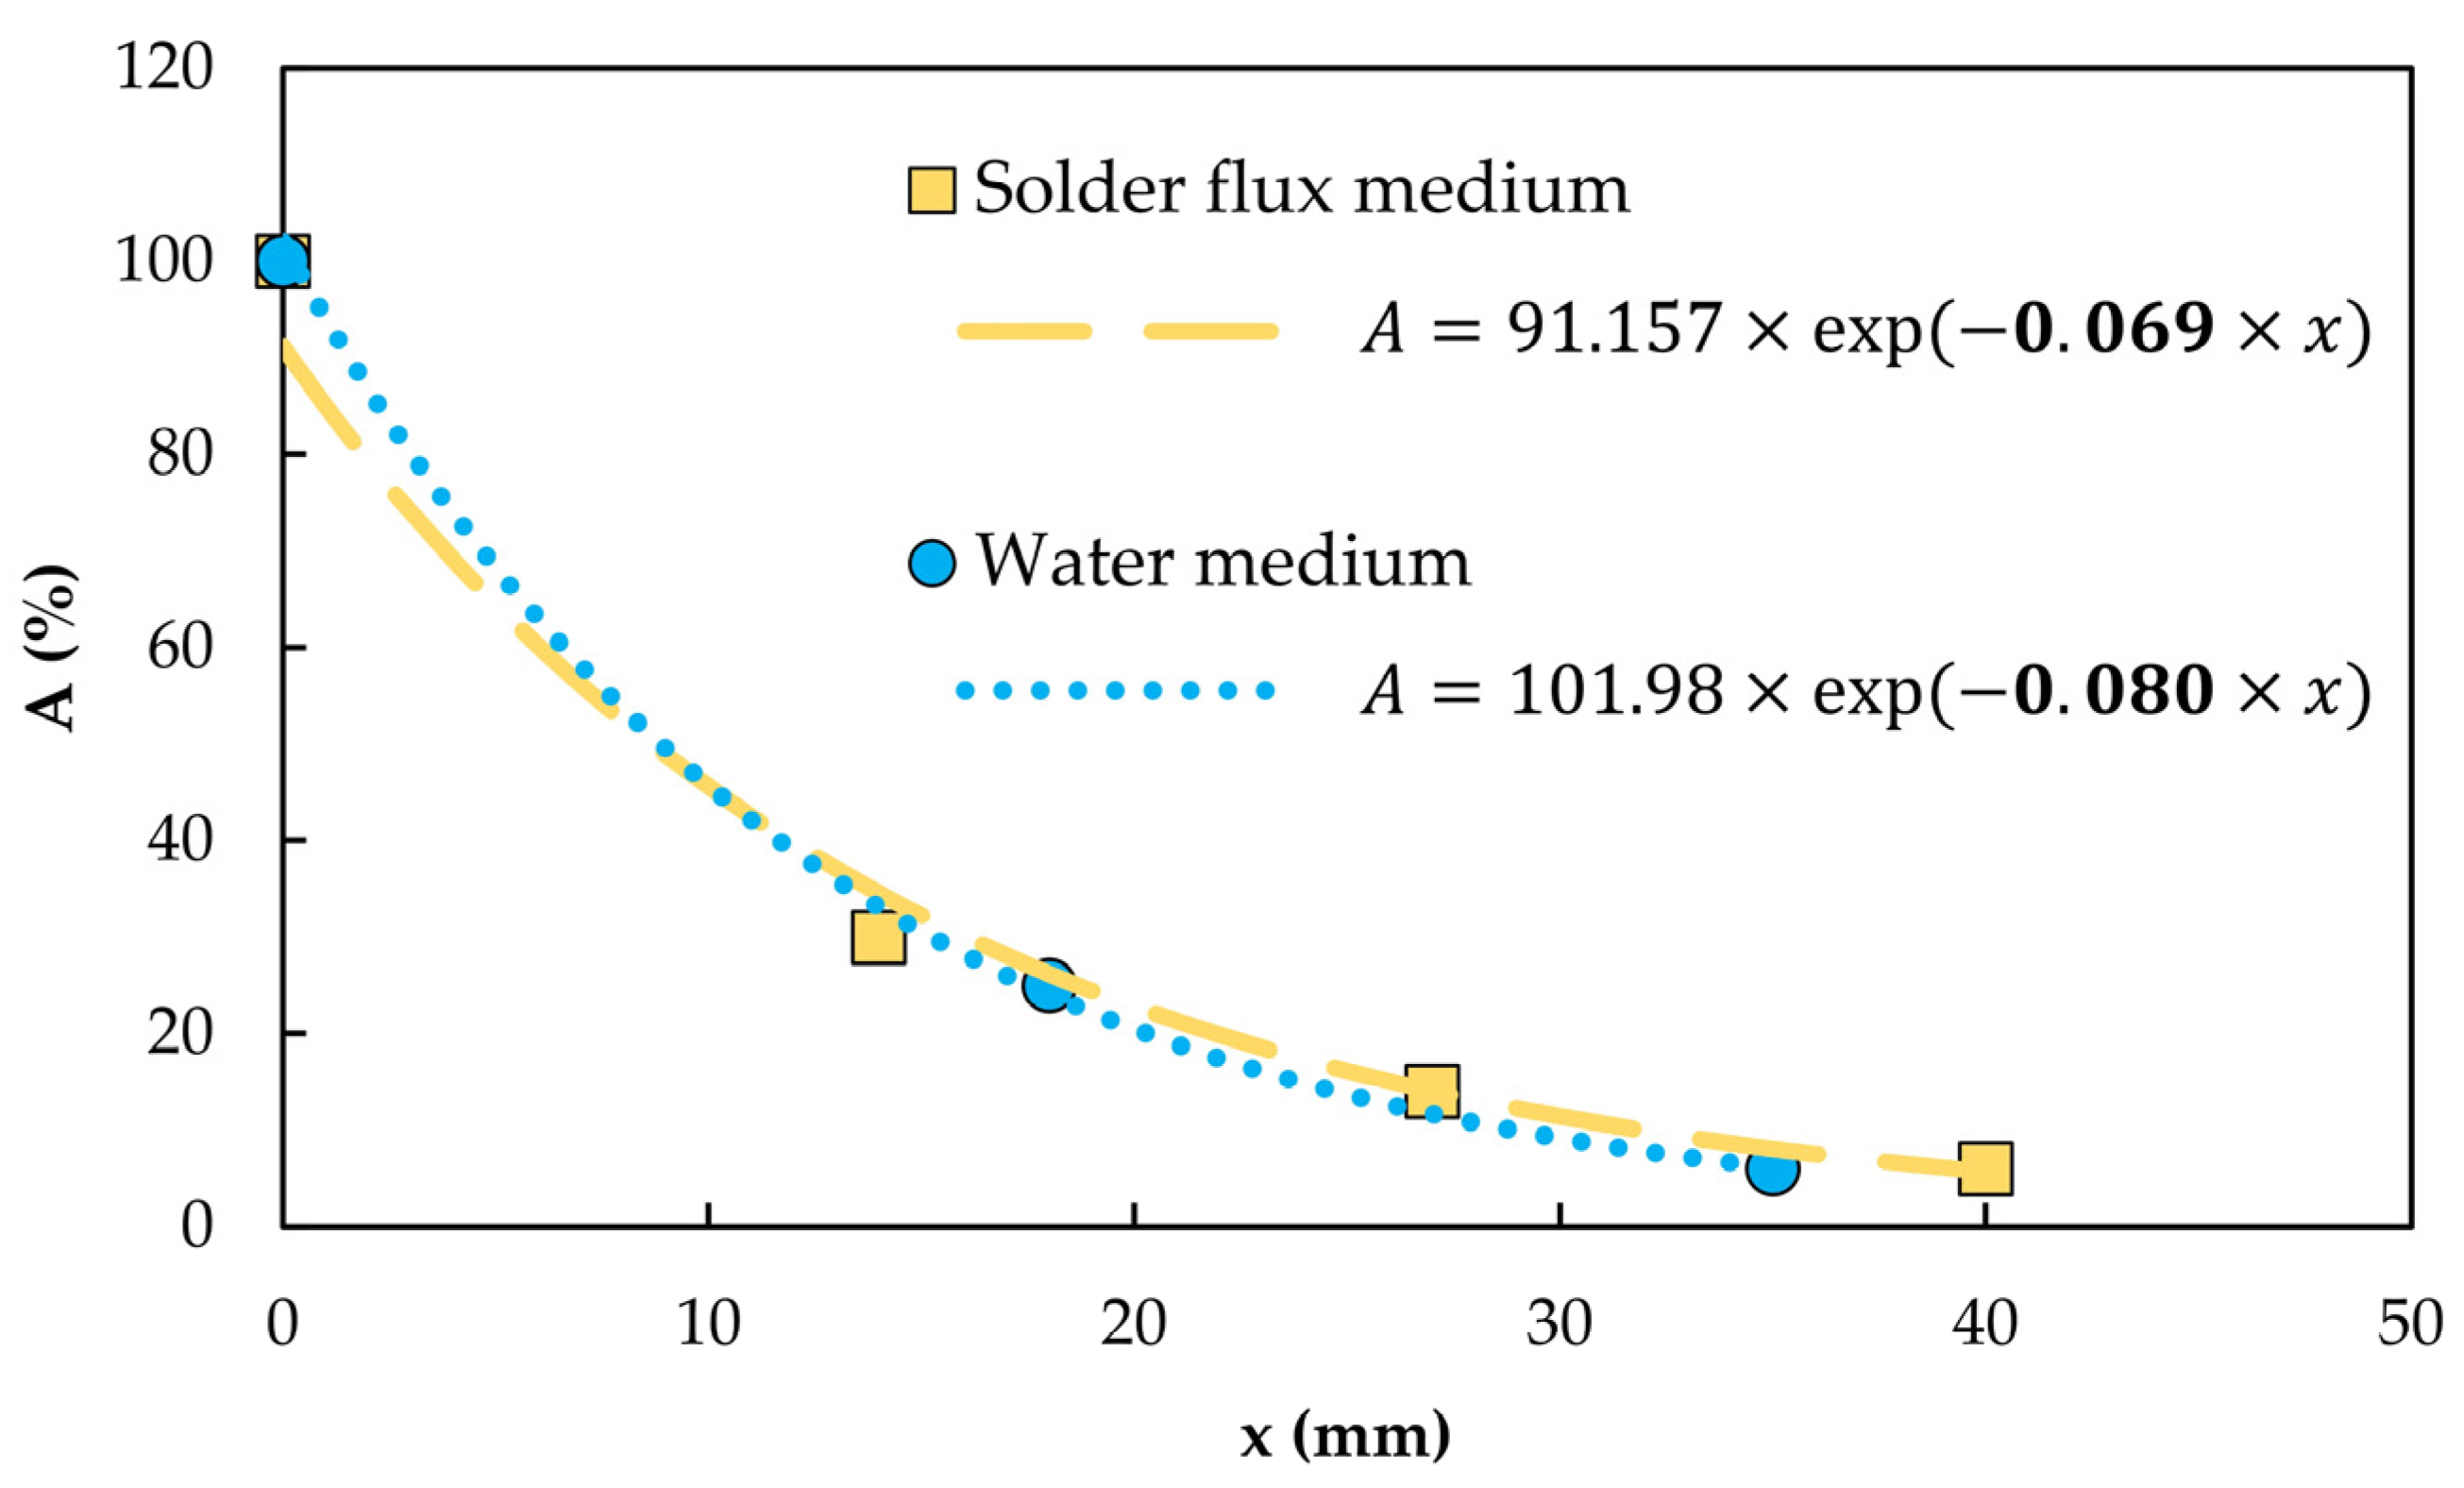
First, the acoustic attenuation of the solder flux and water coupling was characterized by conducting a set of sound measurements on controlled media volumes using a conventional 20 MHz UT probe. To this end, the decay of soundwave amplitudes observed in the signal echoes were measured and plotted as a function of the scanning depth, as shown in Figure 11. These data enable the computation of the linear attenuation coefficient ( ) as a function of the initial ) and depth-dependent () amplitude and the depth () as follows:
Fitting Equation (3) with the experimental data shown in Figure 11 for both media enables estimation of linear attenuation coefficients () of 0.069 mm−1 and 0.080 mm−1 for the solder flux and water media, respectively. The similarity between the two coefficients demonstrates that the performance of the FL50 solder flux as a coupling medium for UT is, at the very least, similar (if not superior) to that of water in terms of acoustic attenuation.
Estimations of the acoustic impedance can be assessed with respect to the physical and acoustic properties of the investigated water, aluminum and Rexolite media at room (Table 5). The acoustic properties of the FL50 solder flux are also included in Table 5 and were obtained from the A-scans with controlled coupling thickness. Based on these properties, it is possible to estimate the specific acoustic impedance () (assuming nondispersive linear acoustics in one dimension) for each material according to their density () and soundwave velocity () as follows:
Estimations of the specific acoustic impedance () for each medium enable computation of the soundwave energy reflection and transmission coefficients () along the interface between two media [24]:
where the subscripts correspond to the media through which UT soundwaves flow. Because the amplitude of soundwaves is affected by three rather than two media, Equation (6) must be rewritten to obtain the complete soundwave transmission () occurring at two interfaces as follows:
By combining Equation (7) with Equation (5), the complete soundwave transmission coefficient () can be expressed as a function of all acoustic impedances ():
where subscripts correspond to the Rexolite, coupling medium and aluminum, respectively. Using the acoustic impedance values previously disclosed in Table 5, the complete transmission coefficients are equal to 0.18 or 0.20 when water or solder flux is used as coupling medium, respectively. These results highlight that a coupling medium composed of solder flux can slightly improve the effectiveness of the soundwave flow when compared to water used for the same purpose, meaning that a smaller percentage is reflected at both interfaces.
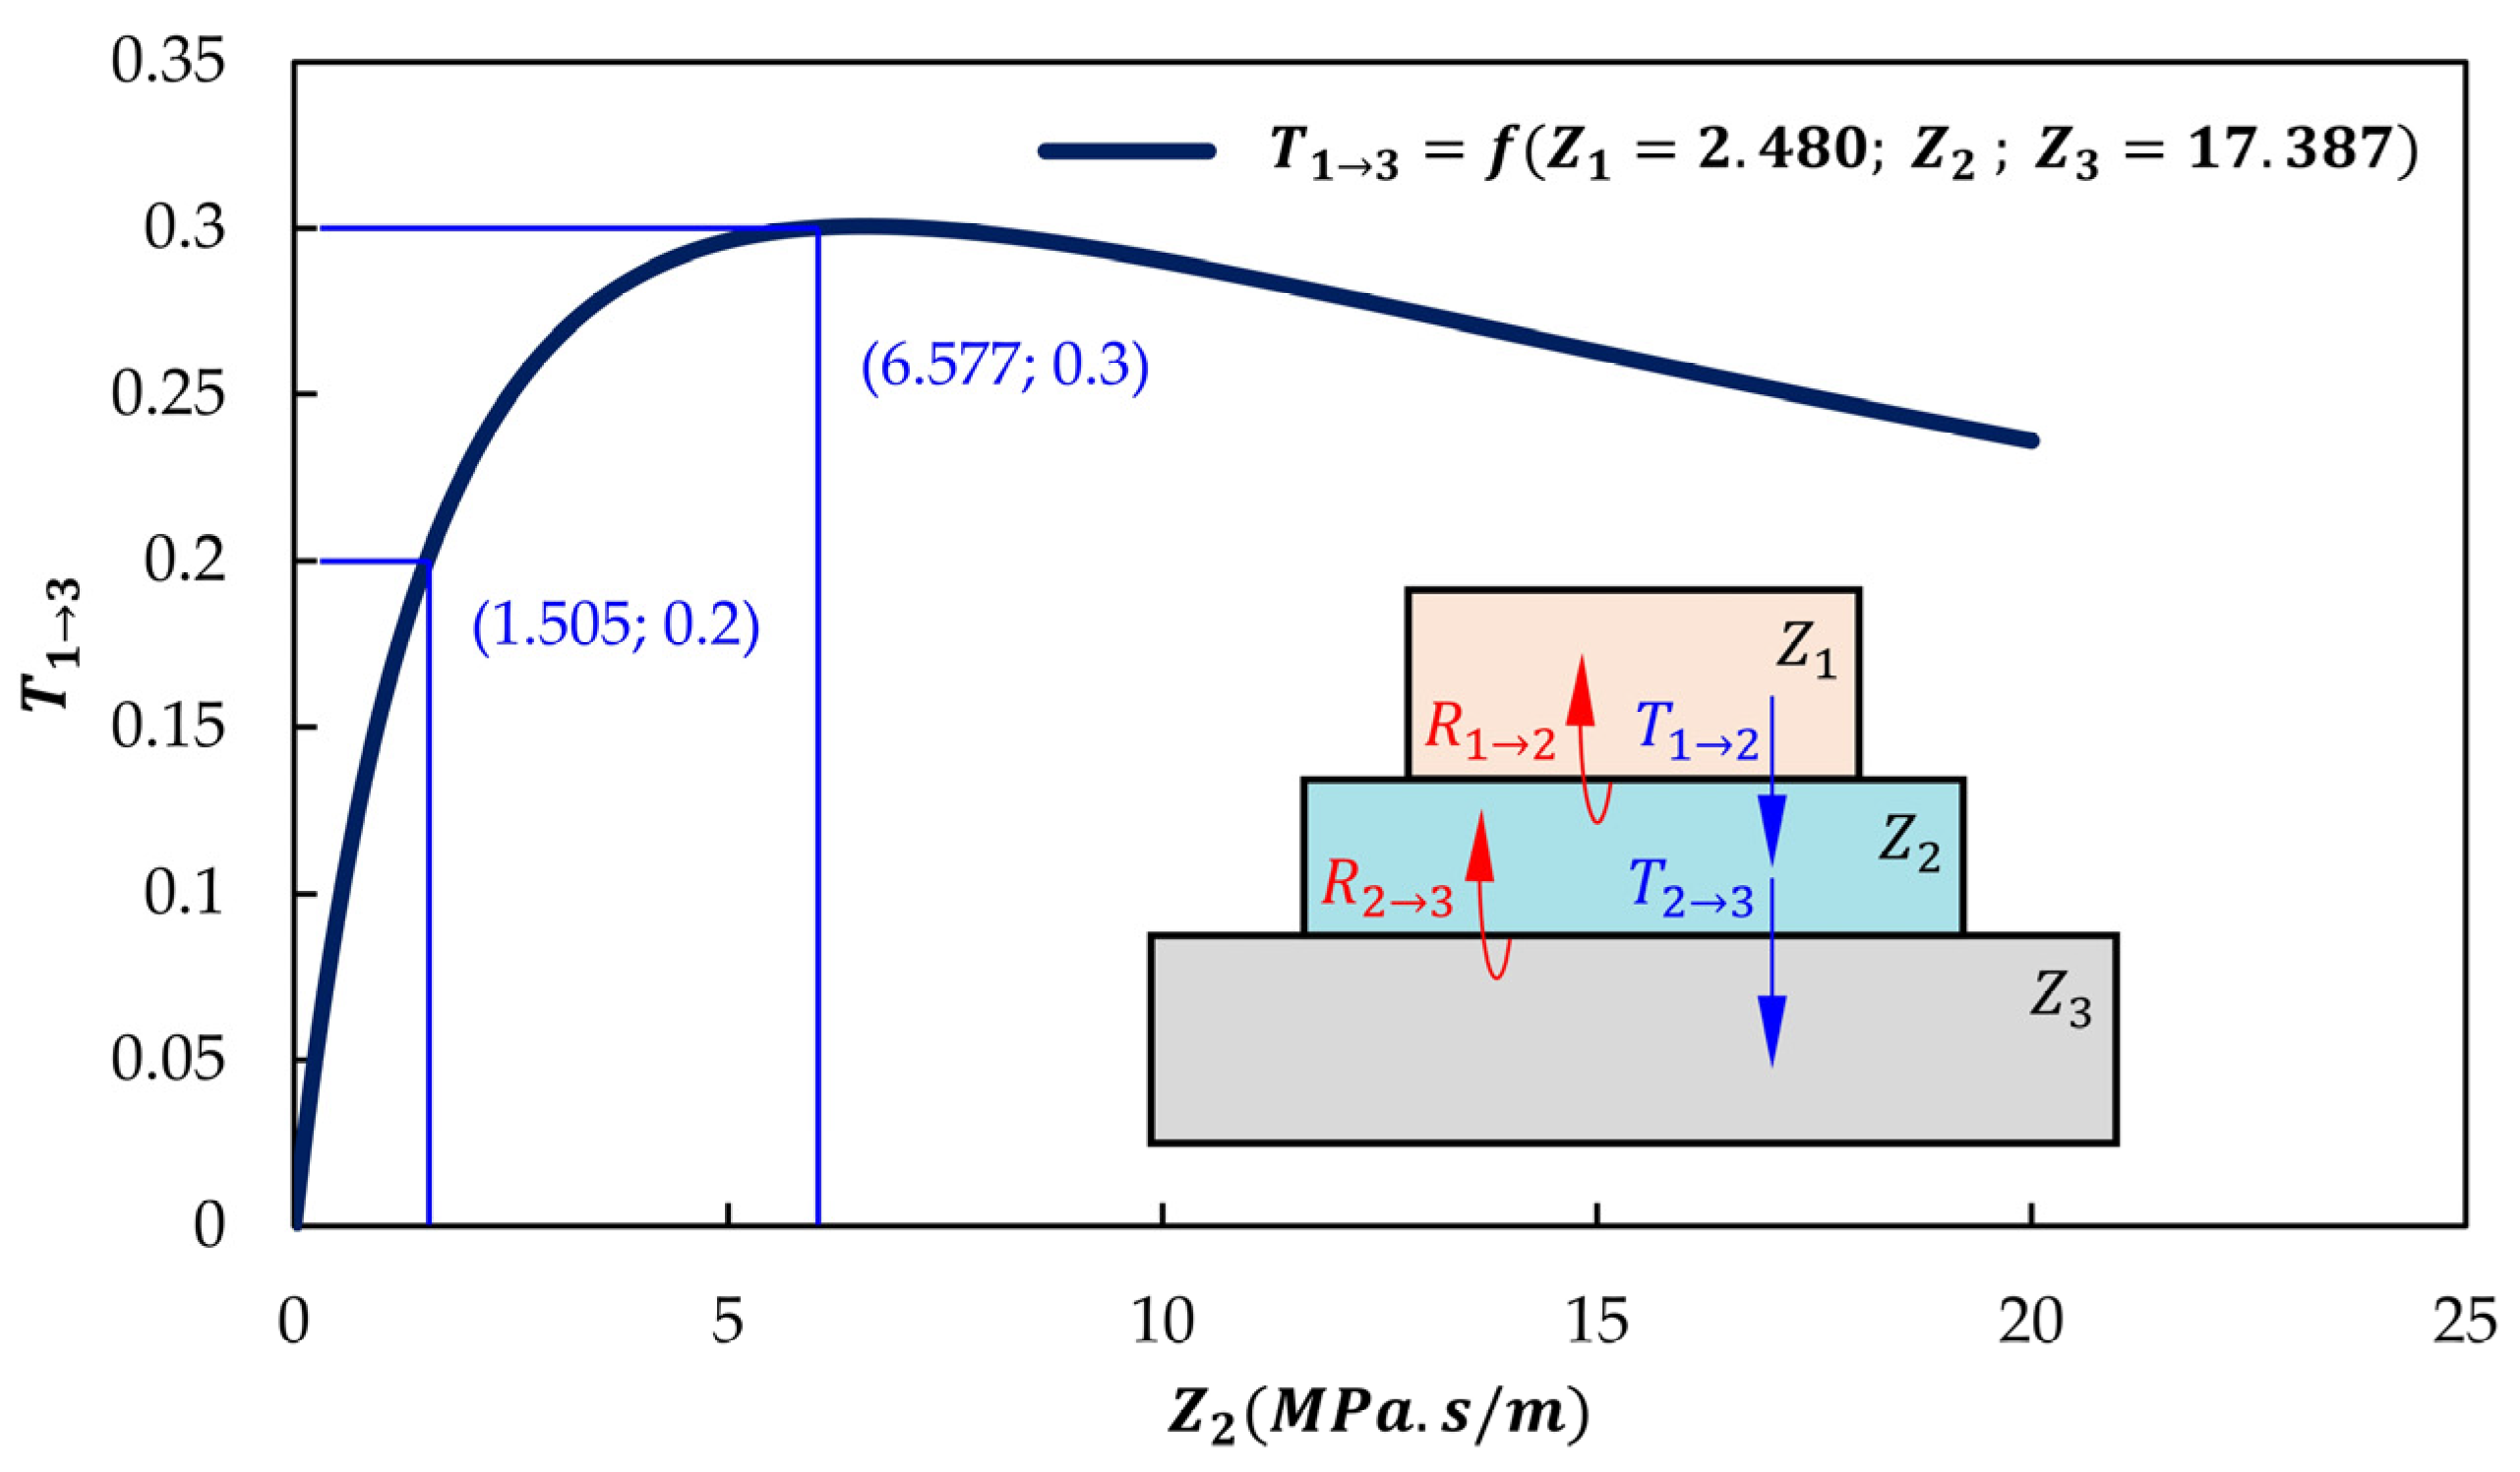
However, the transmission coefficient () does not meet the maximum value of Equation (8) for the materials under analysis, meaning that the selection of the coupling medium for in situ UT can be further optimized. For instance, if Rexolite and aluminum are used as wedge and sample materials, the transmission coefficient can be estimated as a function of only the acoustic impedance of the coupling medium ():
where the maximum value of is expressed as:
Equation (10) enables computation of an acoustic impedance of ≈6.577 for the coupling medium, as shown in Figure 12, which is about 3.4 times higher than that of the FL50 solder flux used in this work. However, introducing the new acoustic impedance in Equation (9) gives rise to a transmission coefficient of 0.3, which corresponds to a 50% increase relative to that obtained with the FL50 solder, which leads to the conclusion that other solder fluxes with higher acoustic impedance may lead to additional improvement with respect to the effectiveness of the overall UT technique.
4. Conclusions
In this paper, we investigated the in situ inspection of parts fabricated by WAAM through UT using solder flux as a coupling medium. Defects such as porosities, overlaps and cracking, among others, can be detected and analyzed at intermedium stages of metal deposition using an accessible, low-cost and easy-to-implement UT-based technique.
This strategy allows for task planning in advance to safely correct such defects in a rapid and economic manner, preventing a defective final WAAM part that would have to be sold as scrap. The following main conclusions can be drawn from this work:
- The FL50 solder flux used in the experiments behaved as a neutral agent in terms of material characteristics of the deposited ER5356 aluminum walls when applied between layers, indicating that the deposited material induced no reaction whatsoever with the solder flux, even when UT was to be applied after deposition of each wall layer.
- Detection of defects with the proposed UT technique using solder flux as a coupling medium is compatible with reference results obtained by conventional immersion UT and DR.
- The performance of the solder flux as a coupling medium was shown to be slightly affected by high temperatures in terms of reflection delays and noise amplitude. Still, it achieved satisfactory accuracy in detecting the reflected soundwave amplitude at temperatures around 100 °C, indicating that the proposed UT technique can be implemented without having to wait for the deposited material to cool down to room temperature.
- The acoustic characteristics of the solder flux were shown to be slightly superior to those of commercial water-based coupling media in terms of acoustic attenuation and transmission.
- Estimations on the transmission coefficient for the experimental setup show that other coupling media with higher acoustic impedances may further increase the transmitted pressure energy from the UT probe up to 50%. Therefore, although the utilized solder flux is suitable for in situ UT during WAAM, other coupling media may alternatively be used to achieve further improvements in the accuracy and detection scale of defects.
Author Contributions
Conceptualization, I.M.F.B., C.M.A.S. and T.G.S.; methodology, I.M.F.B. and C.M.A.S.; software, A.B.L. and J.P.S.; validation, A.B.L. and J.P.S.; formal analysis, A.B.L., J.P.S., J.P.M.P., I.M.F.B., T.G.S. and C.M.A.S.; investigation, A.B.L., J.P.S., J.P.M.P., I.M.F.B., C.M.A.S. and T.G.S.; resources, T.G.S. and C.M.A.S.; data curation, A.B.L., J.P.S. and J.P.M.P.; writing—original draft preparation, A.B.L. and J.P.M.P.; writing—review and editing, J.P.S., I.M.F.B., T.G.S. and C.M.A.S.; visualization, A.B.L. and J.P.S.; supervision, I.M.F.B., T.G.S. and C.M.A.S.; project administration, C.M.A.S.; funding acquisition, C.M.A.S. All authors have read and agreed to the published version of the manuscript.
Funding
This research was funded by Fundação para a Ciência e a Tecnologia of Portugal and IDMEC under LAETA-UIDB/50022/2020.
Institutional Review Board Statement
Not applicable.
Data Availability Statement
All data supporting the reported results are available in the paper.
Acknowledgments
The authors acknowledge the supported provided by Fundação para a Ciência e a Tecnologia of Portugal and IDMEC under LAETA-UIDB/50022/2020. T.G.S. acknowledges Fundação para a Ciência e a Tecnologia (FCT-MCTES) for its financial support via the project UIDB/00667/2020 (UNIDEMI).
Conflicts of Interest
The authors declare no conflict of interest.
References
- Rodrigues, T.A.; Duarte, V.; Miranda, R.M.; Santos, T.G.; Oliveira, J.P. Current Status and Perspectives on Wire and Arc Additive Manufacturing (WAAM). Materials 2019, 12, 1121. [Google Scholar] [CrossRef] [PubMed] [Green Version]
- Dias, M.; Pragana, J.P.M.; Ferreira, B.; Ribeiro, I.; Silva, C.M.A. Economic and Environmental Potential of Wire-Arc Additive Manufacturing. Sustainability 2022, 14, 5197. [Google Scholar] [CrossRef]
- Derekar, K.S. A review of wire arc additive manufacturing and advances in wire arc additive manufacturing of aluminium. Mater. Sci. Technol. 2018, 34, 895–916. [Google Scholar] [CrossRef]
- Pragana, J.P.M.; Sampaio, R.F.V.; Bragança, I.M.F.; Silva, C.M.A.; Martins, P.A.F. Hybrid metal additive manufacturing: A state–of–the-art review. Adv. Ind. Manuf. Eng. 2021, 2, 100032. [Google Scholar] [CrossRef]
- Pragana, J.P.; Bragança, I.M.; Silva, C.M.; Martins, P.A. Integration of tube end forming in wire arc additive manufacturing: An experimental and numerical investigation. Int. J. Adv. Manuf. Technol. 2021, 117, 2715–2726. [Google Scholar] [CrossRef]
- Cunningham, C.R.; Flynn, J.M.; Shokrani, A.; Dhokia, V.; Newman, S.T. Invited review article: Strategies and processes for high quality wire arc additive manufacturing. Addit. Manuf. 2018, 22, 672–686. [Google Scholar] [CrossRef]
- Seifi, M.; Salem, A.; Beuth, J.; Harrysson, O.; Lewandowski, J.J. Overview of Materials Qualification Needs for Metal Additive Manufacturing. JOM 2016, 68, 747–764. [Google Scholar] [CrossRef] [Green Version]
- Pragana, J.P.; Bragança, I.M.; Reis, L.; Silva, C.M.; Martins, P.A. Formability of wire-arc deposited AISI 316L sheets for hybrid additive manufacturing applications. Proc. Inst. Mech. Eng. Part L J. Mater. Des. Appl. 2021, 235, 2839–2850. [Google Scholar] [CrossRef]
- Wu, B.; Pan, Z.; Ding, D.; Cuiuri, D.; Li, H.; Xu, J.; Norrish, J. A review of the wire arc additive manufacturing of metals: Properties, defects and quality improvement. J. Manuf. Process. 2018, 35, 127–139. [Google Scholar] [CrossRef]
- Duarte, V.R.; Rodrigues, T.A.; Machado, M.A.; Pragana, J.P.M.; Pombinha, P.; Coutinho, L.; Silva, C.M.A.; Miranda, R.M.; Goodwin, C.; Huber, D.E.; et al. Benchmarking of Nondestructive Testing for Additive Manufacturing. 3D Print. Addit. Manuf. 2021, 8, 263–270. [Google Scholar] [CrossRef]
- Lopez, A.; Bacelar, R.; Pires, I.; Santos, T.G.; Sousa, J.P.; Quintino, L. Non-destructive testing application of radiography and ultrasound for wire and arc additive manufacturing. Addit. Manuf. 2018, 21, 298–306. [Google Scholar] [CrossRef]
- Javadi, Y.; MacLeod, C.N.; Pierce, S.G.; Gachagan, A.; Lines, D.; Mineo, C.; Ding, J.; Williams, S.; Vasilev, M.; Mohseni, E.; et al. Ultrasonic phased array inspection of a Wire + Arc Additive Manufactured (WAAM) sample with intentionally embedded defects. Addit. Manuf. 2019, 29, 100806. [Google Scholar] [CrossRef]
- Drinkwater, B.W.; Wilcox, P.D. Ultrasonic arrays for non-destructive evaluation: A review. NDT E Int. 2006, 39, 525–541. [Google Scholar] [CrossRef]
- Elmer, J.W.; Fisher, K.; Gibbs, G.; Sengthay, J.; Urabe, D. Post-build thermomechanical processing of wire arc additively manufactured stainless steel for improved mechanical properties and reduction of crystallographic texture. Addit. Manuf. 2022, 50, 102573. [Google Scholar] [CrossRef]
- Lopez, A.B.; Santos, J.; Sousa, J.P.; Santos, T.G.; Quintino, L. Phased Array Ultrasonic Inspection of Metal Additive Manufacturing Parts. J. Nondestruct. Eval. 2019, 38, 62. [Google Scholar] [CrossRef]
- Yehorov, Y.; da Silva, L.J.; Scotti, A. Balancing WAAM Production Costs and Wall Surface Quality through Parameter Selection: A Case Study of an Al-Mg5 Alloy Multilayer-Non-Oscillated Single Pass Wall. J. Manuf. Mater. Process. 2019, 3, 32. [Google Scholar] [CrossRef] [Green Version]
- Zhou, Z.; Li, W.; Li, W.; Li, S. Research on Ultrasonic Array Testing Method for Additive-Manufactured Titanium Alloy. In Proceedings of the International Symposium on Structural Health Monitoring and Nondestructive Testing, Saarbruecken, Germany, 4–5 October 2018. [Google Scholar]
- Guo, J.; Huang, A.; Hu, R.; Xu, H.; Yang, G.; Pang, S. An in-situ monitoring system for electron beam wire-feed additive manufacturing. Sens. Actuators A Phys. 2020, 307, 111983. [Google Scholar] [CrossRef]
- Hehr, A.; Dapino, M.J. Dynamics of ultrasonic additive manufacturing. Ultrasonics 2017, 73, 49–66. [Google Scholar] [CrossRef] [Green Version]
- Geng, H.; Li, J.; Xiong, J.; Lin, X. Optimisation of interpass temperature and heat input for wire and arc additive manufacturing 5A06 aluminium alloy. Sci. Technol. Weld. Join. 2017, 22, 472–483. [Google Scholar] [CrossRef]
- ASTM E8/E8M; Standard Test Methods for Tension Testing of Metallic Materials. ASTM: West Conshohocken, PA, USA, 2010; pp. 1–27. [CrossRef]
- Bento, J.B.; Lopez, A.; Pires, I.; Quintino, L.; Santos, T.G. Non-destructive testing for wire + arc additive manufacturing of aluminium parts. Addit. Manuf. 2019, 29, 100782. [Google Scholar] [CrossRef]
- Cadot, C.; Saillant, J.-F.; Dulmet, V. Method for Acoustic Characterization of Materials in Temperature. In Proceedings of the 19th World Conference on Non-Destructive Testing, Munich, Germany, 13–17 June 2016. [Google Scholar]
- Birks, A.S.; Green, R.E.; McIntire, P. Nondestructive Testing Handbook. Volume 7, Ultrasonic Testing, 2nd ed.; The American Society For Nondestructive Testing: Columbus, OH, USA, 1991. [Google Scholar]
- Langelandsvik, G.; Akselsen, O.M.; Furu, T.; Roven, H.J. Review of Aluminum Alloy Development for Wire Arc Additive Manufacturing. Materials 2021, 14, 5370. [Google Scholar] [CrossRef] [PubMed]
- Pragana, J.P.M.; Rosa, L.G.; Bragança, I.M.F.; Silva, C.M.A.; Martins, P.A.F. Expansion of Additive-Manufactured Tubes: Deformation and Metallurgical Analysis. Steel Res. Int. 2022, 93, 2100362. [Google Scholar] [CrossRef]
- Oh, S.; Cheong, Y.; Kim, D.; Kim, K. On-Line Monitoring of Pipe Wall Thinning by a High Temperature Ultrasonic Waveguide System at the Flow Accelerated Corrosion Proof Facility. Sensors 2019, 19, 1762. [Google Scholar] [CrossRef] [PubMed] [Green Version]
- Slongo, J.S.; Gund, J.; Passarin, T.A.R.; Pipa, D.R.; Ramos, J.E.; Arruda, L.V.; Junior, F.N. Effects of Thermal Gradients in High-Temperature Ultrasonic Non-Destructive Tests. Sensors 2022, 22, 2799. [Google Scholar] [CrossRef]
Figure 1.
Schematic representation of in situ ultrasonic testing (UT) in wire arc additive manufacturing (WAAM).
Figure 1.
Schematic representation of in situ ultrasonic testing (UT) in wire arc additive manufacturing (WAAM).

Figure 2.
Schematic representation of the tensile test specimens extracted from the deposited ER5356 aluminum straight walls.
Figure 2.
Schematic representation of the tensile test specimens extracted from the deposited ER5356 aluminum straight walls.

Figure 3.
Design guidelines and photograph of the UT probe + wedge setup used for UT.

Figure 4.
True stress–strain curves of deposited ER5356 aluminum wall sets #1 and #2 in parallel and perpendicular orientations to the building direction.
Figure 4.
True stress–strain curves of deposited ER5356 aluminum wall sets #1 and #2 in parallel and perpendicular orientations to the building direction.

Figure 5.
Microstructure of the metallographic samples extracted from deposited ER5356 aluminum: (a) wall set #1 and (b) wall set #2.
Figure 5.
Microstructure of the metallographic samples extracted from deposited ER5356 aluminum: (a) wall set #1 and (b) wall set #2.

Figure 6.
Fracture surfaces obtained by scanning electron microscopy (SEM) from deposited ER5356 aluminum tensile specimens cut from (a) wall set #1 and (b) wall set #2.
Figure 6.
Fracture surfaces obtained by scanning electron microscopy (SEM) from deposited ER5356 aluminum tensile specimens cut from (a) wall set #1 and (b) wall set #2.

Figure 7.
Chemical composition obtained by energy dispersive spectrometry (EDS) from deposited ER5356 aluminum metallographic samples cut from (a) wall set #1 and (b) wall set #2.
Figure 7.
Chemical composition obtained by energy dispersive spectrometry (EDS) from deposited ER5356 aluminum metallographic samples cut from (a) wall set #1 and (b) wall set #2.

Figure 8.
Detection of Ø 2 mm defects at varying depths on deposited ER5356 aluminum walls using (a) ultrasonic testing (UT) with the developed setup and (b) digital radiography (DR). The tests were carried out at room temperature.
Figure 8.
Detection of Ø 2 mm defects at varying depths on deposited ER5356 aluminum walls using (a) ultrasonic testing (UT) with the developed setup and (b) digital radiography (DR). The tests were carried out at room temperature.

Figure 9.
Detection of Ø 2 mm defects at 2 mm depth on deposited ER5356 aluminum walls using (a) digital radiography (DR) at room temperature, (b) ultrasonic testing (UT) by immersion in a water-filled tank, (c) the proposed UT technique at room temperature and (d) the proposed UT technique at 100 °C.

Figure 10.
A-scans obtained by ultrasonic testing (UT) of 2 mm depth defects on deposited ER5356 aluminum walls using (a) UT by immersion in a water-filled tank and the proposed UT technique at (b) room temperature, (c) 50 °C and (d) 100 °C in the measuring regions.
Figure 10.
A-scans obtained by ultrasonic testing (UT) of 2 mm depth defects on deposited ER5356 aluminum walls using (a) UT by immersion in a water-filled tank and the proposed UT technique at (b) room temperature, (c) 50 °C and (d) 100 °C in the measuring regions.

Figure 11.
Soundwave amplitude (A) as a function of scanning depth (x) based on UT measurements with a 20 MHz conventional probe for solder flux and water media. The dashed lines represent the exponential fitting of the experimental data using the equations included in the figure.
Figure 11.
Soundwave amplitude (A) as a function of scanning depth (x) based on UT measurements with a 20 MHz conventional probe for solder flux and water media. The dashed lines represent the exponential fitting of the experimental data using the equations included in the figure.

Figure 12.
Transmission coefficient () as a function of acoustic impedance () residing in the coupling medium with and equal to 2.48 and 17.377 MPa.s/m, respectively.
Figure 12.
Transmission coefficient () as a function of acoustic impedance () residing in the coupling medium with and equal to 2.48 and 17.377 MPa.s/m, respectively.


Table 1.
Chemical composition of the ER5356 aluminum wire (in weight percentage).
| Composition (%wt) | ||||||||
|---|---|---|---|---|---|---|---|---|
| Si | Cu | Fe | Zn | Mg | Mn | Cr | Ti | Al |
| 0.03 | 0.01 | 0.15 | 0.01 | 4.83 | 0.14 | 0.11 | 0.09 | Balance |
Table 2.
Summary of the main processing parameters used for metal deposition by WAAM.
| Current (A) | Voltage(V) | Wire Feed Speed (m/min) | Travel Speed (m/min) | Gas Flow Rate(l/min) |
|---|---|---|---|---|
| 100 | 16 | 8 | 0.8 | 20 |
Table 3.
Construction procedures for the three different sets of WAAM aluminum straight walls used in the experimental tests.
Table 3.
Construction procedures for the three different sets of WAAM aluminum straight walls used in the experimental tests.
| Wall Set ID | Construction Procedure |  |
| #1 | Metal deposition without solder flux | |
| #2 | Metal deposition with interlayer application of solder flux | |
| #3 | Metal deposition combined with drilled artificial defects |
Table 4.
Mechanical properties of deposited ER5356 aluminum wall sets #1 and #2 in parallel and perpendicular orientations to the building direction.
Table 4.
Mechanical properties of deposited ER5356 aluminum wall sets #1 and #2 in parallel and perpendicular orientations to the building direction.
| Orientation | Wall Set ID | ||||
|---|---|---|---|---|---|
| Parallel | #1 | 70 | 104 | 249 | 0.27 |
| #2 | 69 | 105 | 250 | 0.27 | |
| Perpendicular | #1 | 64 | 103 | 240 | 0.19 |
| #2 | 68 | 103 | 241 | 0.20 |
Table 5.
Physical and acoustic properties of the media used in the experimental ultrasonic tests at room temperature.
Table 5.
Physical and acoustic properties of the media used in the experimental ultrasonic tests at room temperature.
| Medium | Rexolite | Water | Solder flux | Aluminum |
|---|---|---|---|---|
| 1050 | 1000 | 1043 | 2840 | |
| 2362 | 1483 | 1443 | 6122 | |
| 2.480 | 1.483 | 1.505 | 17.387 |
Publisher’s Note: MDPI stays neutral with regard to jurisdictional claims in published maps and institutional affiliations. |
© 2022 by the authors. Licensee MDPI, Basel, Switzerland. This article is an open access article distributed under the terms and conditions of the Creative Commons Attribution (CC BY) license (https://creativecommons.org/licenses/by/4.0/).
Share and Cite
MDPI and ACS Style
Lopez, A.B.; Sousa, J.P.; Pragana, J.P.M.; Bragança, I.M.F.; Santos, T.G.; Silva, C.M.A. In Situ Ultrasonic Testing for Wire Arc Additive Manufacturing Applications. Machines 2022, 10, 1069. https://doi.org/10.3390/machines10111069
AMA Style
Lopez AB, Sousa JP, Pragana JPM, Bragança IMF, Santos TG, Silva CMA. In Situ Ultrasonic Testing for Wire Arc Additive Manufacturing Applications. Machines. 2022; 10(11):1069. https://doi.org/10.3390/machines10111069
Chicago/Turabian StyleLopez, Ana Beatriz, José Pedro Sousa, João P. M. Pragana, Ivo M. F. Bragança, Telmo G. Santos, and Carlos M. A. Silva. 2022. "In Situ Ultrasonic Testing for Wire Arc Additive Manufacturing Applications" Machines 10, no. 11: 1069. https://doi.org/10.3390/machines10111069
Note that from the first issue of 2016, this journal uses article numbers instead of page numbers. See further details here.