α-Fe2O3 Nanoparticles/Vermiculite Clay Material: Structural, Optical and Photocatalytic Properties
by
 ,
,
Marta Valášková
1,* ,
,
Jonáš Tokarský
1,2,
Jiří Pavlovský
3,
Tomáš Prostějovský
1,3 and
Kamila Kočí
1 1
Institute of Environmental Technology, VŠB-Technical University of Ostrava, 17. listopadu 2172/15, 708 00 Ostrava—Poruba, Czech Republic
2
Nanotechnology Centre, VŠB-Technical University of Ostrava, 17. listopadu 2172/15, 708 00 Ostrava—Poruba, Czech Republic
3
Department of Chemistry, Faculty of Materials Science and Technology, VŠB-Technical University of Ostrava, 17. listopadu 2172/15, 708 00 Ostrava—Poruba, Czech Republic
*
Author to whom correspondence should be addressed.
Materials 2019, 12(11), 1880; https://doi.org/10.3390/ma12111880
Submission received: 16 May 2019
/
Revised: 29 May 2019
/
Accepted: 5 June 2019
/
Published: 11 June 2019
(This article belongs to the Special Issue Photocatalysts for Environmental Applications)
Abstract
:Photocatalysis is increasingly becoming a center of interest due to its wide use in environmental remediation. Hematite (α-Fe2O3) is one promising candidate for photocatalytic applications. Clay materials as vermiculite (Ver) can be used as a carrier to accommodate and stabilize photocatalysts. Two different temperatures (500 °C and 700 °C) were used for preparation of α-Fe2O3 nanoparticles/vermiculite clay materials. The experimental methods used for determination of structural, optical and photocatalytic properties were X-ray fluorescence (ED-XRF), X-ray diffraction (XRD), scanning electron microscopy (SEM) with energy dispersive X-ray spectrometry (EDS), N2 adsorption method (BET), diffuse reflectance UV-Vis spectroscopy (DRS), photoluminescence spectroscopy (PL) and photocatalytic reduction of CO2, respectively. The data from XRD were confronted with molecular modeling of the material arrangement in the interlayer space of vermiculite structure and the possibility of anchoring the α-Fe2O3 nanoparticles to the surface and edge of vermiculite. Correlations between structural, textural, optical and electrical properties and photocatalytic activity have been studied in detail. The α-Fe2O3 and α-Fe2O3/Ver materials with higher specific surface areas, a smaller crystallite size and structural defects (oxygen vacancies) that a play crucial role in photocatalytic activity, were prepared at a lower calcination temperature of 500 °C.
1. Introduction
In recent years, many researchers have focused on catalysts employing supports composed of natural clay minerals, which are abundant, easily obtainable and inexpensive materials. Clay minerals are hydrous phyllosilicates [1]. The clay minerals belonging to the smectites group are used frequently. Each 2:1 layer of such clay mineral is of the (TOT) type consisting of two tetrahedral (T) Si-O sheets and an octahedral (O) Al-O/Al-OH sheet between them. The tetrahedral Si atoms are substituted by Al and/or a position of the octahedral atoms (Al or Mg) are substituted by atoms of lower oxidation number, generating the negative charges of the layers which are compensated by interlayer cations [2,3]. Most clay minerals contain iron in the amounts varying from traces to up to 30% mass [4]. Iron can substitute for Si in tetrahedral or for Al in octahedral sites. Structural iron in the octahedral site can exist in either Fe2+ or Fe3+ state. Experimental studies have indicated that electron transfer to/from clay mineral structure takes place through either edge sites, or through the basal surface [5]. Conversely, the computational atomistic models constructed using density functional theory supported electron transfer into octahedral Fe3+ sheets predominantly at the clay edges [6]. The structural iron content can be used to examine the extent of reduction and oxidation of Fe-bearing mineral clay [7]). The interlayer space, surface and edges of clay minerals provide sites to accommodate and stabilize Fe2O3 nanoparticles, thereby leading to the formation of a class of functional nanoparticle/clay minerals such as γ-Fe2O3/montmorillonite [8], α-Fe2O3/Na-montmorillonite [9]), Fe2O3/Fe3O4/vermiculite [10] and γ-Fe2O3/kaolinite [11]. The two-dimensional expandable layers of clay minerals provide useful hosts, which facilitate the introduction of catalytically active metal complexes [12]. Clay mineral, as supports of iron and iron oxide minerals, can also serve as heterogeneous catalysts in the Fenton-like reaction, which is propagated by the reduction of Fe3+ oxides to Fe2+ oxides under ultraviolet radiation [13].
Iron oxide is a transitional metal oxide crystallizing at different stoichiometric and crystalline structures, including wüstite (FeO), hematite (α-Fe2O3), maghemite (γ-Fe2O3) and magnetite (Fe3O4). Hematite is an n-type semiconductor (Eg = 2.1 eV) and has an advantage over the other conventional materials such as TiO2, ZnO, etc., for photocatalytic applications due to its narrow band gap of approximately 2.0–2.2 eV. Furthermore, hematite absorbs light up to 600 nm, collects up to 40% of the solar spectrum energy, is stable in most aqueous solutions (pH > 3), and is one of the cheapest semiconductor materials [14,15,16,17]. Hematite crystallizes in the hexagonal close-packed planes of oxygen anions arranged along the (001) plane with iron cations in the octahedral (001) basal plane. The arrangement of Fe3+ cations generates pairs of FeO6 octahedrons with two different Fe–O bond lengths [18]. The photocatalytic activity of the α- and γ-Fe2O3 nanoparticles of 25–55 nm in size was tested on the photocatalytic decomposition of H2S under visible light irradiation [19]. Similarly, α-Fe2O3 powder was tested on decomposition of aqueous solution of Rose Bengal dye [20] and Congo red dye [21]. The photocatalytic performance of α-Fe2O3 is limited by high recombination rate of electrons and holes, low diffusion lengths of holes (2–4 nm), and poor conductivity. The factors are influenced by the size and morphology of nanocrystals, their surface area, porosity, pH of the reaction medium, calcination temperature, reaction temperature, light intensity, and presence of oxidizing agents [17,19,22]. For example, the ammonia precipitant (NH4OH) provides spherical hematite particles whereas sodium hydroxide (NaOH) produces acicular hematite particles [23]. Calcination temperature of precipitates influences surface area of calcined material. α-Fe2O3 powders calcined at the 500 °C show a higher surface area and better photocatalytic activity than powders prepared at 600 °C [20]. The thermal evolution of the crystalline α-Fe2O3 by the chemical precipitation method is particularly attractive because of its low cost, high purity, short preparation time, high homogeneity, well-crystallized product and relatively low reaction temperature [24]. Most of Fe ions of photocatalysts were in fully oxidized states (Fe3+) detected by XPS analysis after annealing at temperature above 450 °C [25].
CO2 is a major component of the greenhouse gases contributing to global warming, and atmospheric pollution is the most serious of environmental problems. Nanocrystalline Fe2O3 can decompose CO2 at 400–600 °C to carbon nanotubes [15] and has been proven as a new visible photocatalyst towards the decontamination of NOX gases [26] under UV-Vis light irradiation. An electron in the valence band acquires the energy of a photon to become a photogenerated electron (e−), which migrates to the conduction band and simultaneously leaves behind a photogenerated hole (h+), see Equation (1):
Fe2O3 + hν ⇒ e− + h+
The pair of mobile charges initiate the redox process on the surface of Fe2O3 particle. The H2O molecule reacts with h+ to produce a hydroxyl radical, see Equation (2):
H2O + h+ ⇒ H+ + OH•
Photocatalytic reduction of CO2 is one of the environmentally friendly methods that can be used to decrease CO2 emissions in the air using sunlight as the source of radiation. Photocatalytic hydrogenation of carbon dioxide is a promising technology that can convert carbon dioxide under ambient condition to sustainable fuels, such as methane or methanol. Among various proposed photocatalysts, TiO2 has been extensively studied over the past several decades for CO2 photocatalytic reduction because of its low cost and environmental friendliness [27,28,29,30,31].
This work presents a new type of photocatalyst on the clay mineral carrier. The structural, optical and photocatalytic properties of α-Fe2O3 nanoparticles/vermiculite clay materials, synthesized by the precipitation procedure from the FeCl3∙6H2O and NaOH precursors were studied after annealing samples at 500 °C and 700 °C for 4 h.
2. Materials and Methods
2.1. Materials and Sample Preparation
Raw vermiculite (layer charge −0.66, denoted as Ver) from Palabora mine, South Africa (supplied by Grena Co., Veselí nad Lužnicí, Czech Republic) was ball-milled in a cylindrical agate container (7 cm inner diameter) using 9 balls (10 mm diameter), 3 balls (20 mm diameter) and 2 balls (30 mm diameter) for 15 min at 550 rpm (agate planetary mill Fritsch Pulverisette 5). The size of the fraction ˂40 µm of the Ver was obtained by sieving and was used as a carrier of the nanoparticles. Pure α-Fe2O3 nanoparticles were synthesized with the chemical precipitation method from the FeCl3∙6H2O (iron chloride hexahydrate) precursor (supplied by Lach-Ner Co., Neratovice, Czech Republic). In this procedure, aqueous solution (c = 0.05 M) was prepared by dissolving 4 g of FeCl3∙6H2O in 100 mL of distilled water under magnetic stirring for 30 min at 70 °C. The precipitating agent (50 mL of NaOH aqueous solution, c = 2 M) was added gradually to maintain a pH value of 11 under magnetic stirring for 3 h at 70 °C. The resulting precipitates were collected and centrifuged at 6000 rpm and then washed several times with distilled water to free chlorides. The samples denoted as α-Fe2O3_500 and α-Fe2O3_700 were finally dried in air at 80 °C and calcined at 500 °C and 700 °C, respectively, for 4 h. Samples α-Fe2O3_500/Ver and α-Fe2O3_700/Ver were obtained using the identical procedure starting from the solution of FeCl3∙6H2O precursor (100 mL) and Ver (4 g) dispersed in precipitating agent NaOH aqueous solution (100 mL) under magnetic stirring for 3 h at 70 °C. Samples for analysis were then manually pulverized with an agate mortar and pestle.
2.2. Methods
The X-ray diffraction (XRD) analyses were carried out on the X-ray diffractometer Rigaku SmartLab (RIGAKU Corporation, Tokyo, Japan). The XRD patterns of powder samples on the Si-holder were recorded at the rotation speed of 15 rpm/min−1 in symmetrical Bragg–Brentano diffraction geometry in the 5–80° 2θ range with a step size of 0.01° and speed 0.5 deg/min−1. For the XRD measurement, CoKα radiation (λ1 = 0.178892 nm, λ2 = 0.179278 nm) at 40 kV and 40 mA, a detector D/teX Ultra 250 were used. The divergence of the primary X-ray beam was limited by 10 mm × 10 mm automatic divergence slits. Slits on the diffracted beam were set up to fixed values of 8 mm and 14 mm.
Scanning electron microscopy (SEM) Quanta FEG 450 (FEI Company, Hillsboro, OR, USA) with energy dispersive X-ray spectrometry (EDS) were used to characterize the morphology of hematite particles and the distribution of elements using EDS maps in samples. The samples were coated with a gold/palladium film to avoid an electrical charging. Backscatter electron (BSE) images were obtained using secondary and backscattered electron detectors.
Chemical elemental analysis was performed using the energy dispersive X-ray fluorescence (ED-XRF) spectrometer SPECTRO XEPOS (Spectro Analytical Instruments GmbH, Kleve, Germany) to determine amount of α-Fe2O3 anchored on vermiculite substrate. Each sample (4 g) in duplicate was mixed with the wax (0.9 g) and prepared in pellets using hydraulic pressing at 10 tons.
The specific surface area (SBET) was measured using the Sorptomatic 1990 instrument (Thermo Finnigan, Rodano, Italy). The Brunauer–Emmett–Teller (BET) N2 physisorption method was determined by employing the Advance Data Processing software according to the BET isotherm.
The diffuse reflectance UV–Vis spectra (DRS) were recorded using a UV-2600 spectrophotometer with an ISR-2600 integrating sphere attachment (Shimadzu Scientific Co., Tokyo, Japan) from 220 to 800 nm. The interval of sampling was set to 1 nm and the width of the slit to 2 nm at the integration sphere diameter of 60 nm, the external 2D detector and barium sulphate (BaSO4) powder pressed into the powder sample holder were used as reference material.
The PL spectra were recorded by a spectrometer FLSP920 Series (Edinburgh Instruments, Ltd., Livingston, UK) from 350 to 620 nm. The spectrometer was equipped with a 450 W Xenon lamp (Xe900) and a R928P type PMT detector. Spectrometer configuration was of the Czerny–Turner type: the excitation wavelength of 325 nm; the width 3.0 nm of the excitation slit, and 8.0 nm of the emission slit; dwell time was 0.5 s.
2.3. Molecular Simulation
Interlayer space arrangement of the Palabora vermiculite, as well as mutual α-Fe2O3/vermiculite interaction, was investigated by molecular modeling using a force field in the Biovia Materials Studio modeling environment (MS). The initial model of the Palabora vermiculite structure was prepared based on the crystal structure data a = 5.349 Å, b = 9.255 Å, c = 14.445 Å, α = 90°, β = 97.07°, γ = 90°, published by Shirozu and Bailey [32] and the crystallochemical formula (K+0.46Na+0.03Ca2+0.09) (Si3.18Al0.79Fe3+0.03) (Mg2.7Fe3+0.2Fe2+0.08) O10 (OH)2 (layer charge −0.66 e−) calculated from the chemical analysis of metal oxides concentrations, assuming that the trioctahedral structure of vermiculite is based on 22 negative layers resulting from O10(OH)2, cpfu. Periodic models of the vermiculite, having a corresponding crystallochemical formula (K+11Na+Ca2+2) (Si76Al19Fe3+) (Mg66Fe3+4Fe2+2) O240 (OH)48 (layer charge −16 e−), were prepared as a 6a × 4b × 1c supercell requiring rigid layers with fixed cell parameters a, b, γ [33]. These models were used to study the space arrangement of the interlayer material containing various amounts of interlayer cations and water molecules.
The strategy used to build models of vermiculite with α-Fe2O3 nanoparticles on its surface is based on the nonperiodic structure prepared from the 12a × 6b × 7c supercell of the Palabora vermiculite, having the crystallochemical formula of (K+462Na+42Ca2+84) (Si3188Fe3+42Al798) (Mg2772Fe3+168Fe2+84) O10072 (OH)2016 with a corresponding layer charge −672 e− compensated by K+, Na+, and Ca2+ interlayer cations. The crystal structure of α-Fe2O3 was taken from the MS library (unit cell Fe12O18; a = b = 5.035 Å, c = 13.72 Å, α = β = 90°, γ = 120°). Two models of α-Fe2O3 nanoparticles (Fe318O477, their size about 3 nm) with crystallographic orientations (104) and (012) were built and then subsequently placed on the (001) surface and on the (100) surface (i.e., edge) of the vermiculite superstructure to study the nanoparticle–vermiculite interaction. The shape of nanoparticles in the models has no significant influence on the interaction with the clay mineral surface [34]. Although the atomistic models of the nanoparticles/phyllosilicate nanocomposites are always simplified real samples, they exhibit good agreement with experimental data, e.g., [33,34,35,36].
Atomic charges were calculated via charge equilibration method [37] in MS/Forcite module. The Universal force field (UFF) [38] was used to parameterize a wide variety of different atoms and atomic types present in the models. Smart algorithm (i.e., the cascade of Steepest descent, Conjugate gradient and Quasi-Newton algorithms as implemented in the MS/Forcite module) was used for the geometry optimization procedure with 50,000 iteration steps. Convergence criteria 1 × 10⁻³ kcal/mol and 5 × 10⁻² kcal/mol/nm for energy and force, respectively, were used.
The basal distances in the optimized periodic models of the vermiculite interlayer space were obtained from the XRD patterns simulated in an MS/Reflex module. Conditions similar to the experimental measurements were used: Bragg–Brentano geometry, step size 0.05, CuKα source (λ = 1.540562 Å).
Interaction energy (Eint; kcal/mol) for vermiculite/nanoparticle models were calculated according to Formula (3):
where Etot is a total potential energy of the optimized vermiculite/nanoparticle model, Etot,NP is a total potential energy of the nanoparticle in the optimized model, and Etot,VER is a total potential energy of the vermiculite in the optimized model.
Eint = Etot − (Etot,NP + Etot,VER),
2.4. Photocatalytic Test
Photocatalytic tests were performed in a batch mixed photoreactor (stainless steel, volume 348 mL). Reaction mixture contained 100 mL of NaOH (0.2 M) with a photocatalyst (0.1 g) and was saturated by helium or CO2, to purge the air and to saturate the solution. The reaction suspension was investigated for each photocatalyst behavior for water splitting and thereafter for the CO2 photocatalytic reduction, respectively. An 8W Hg lamp (Ultra-Violet Products Inc., USA, 11SC-1, λmax = 254 nm, average light intensity = 4.5 mW/cm2, see Figure S1) was used as the irradiation source and was placed on a quartz glass window in the top of the photoreactor. The reactor was tightly closed (the pressure was maintained at 110 kPa) and before the start of the reaction (switching on the UV lamp), a gaseous sample was taken (at time 0 h) through septum by syringe. The all gaseous samples were analyzed by a gas chromatograph equipped with a barrier discharge ionization detector (Tracera GC—2010 plus, Shimadzu). The reaction mixture was irradiated at certain time intervals (0–14 h) and samples were taken at 8, 10, 12 and 14 h for analysis. All of the measurements were reproducibly measured.
Blank reactions tests (in the dark with the photocatalyst and UV-illuminated without the photocatalyst) were performed to ensure that the hydrogen and carbon monoxide production was due to the presence of a photocatalyst.
3. Results and Discussion
The development of Fe2O3 nanoparticles can be explained by the chemical reactions concerned and the crystal growth behaviors of iron oxide. The synthesis of Fe2O3 NPs was performed using ferric chloride (FeCl3) and NaOH under continuous stirring at 70 °C. NaOH maintains the pH value as well as bringing hydroxyl ions to the solution. The FeCl3 reacts with NaOH and forms FeO(OH) according to the chemical reactions (4)–(6).
NaOH(aq) → Na+(aq) + OH−(aq)
FeCl3(s) → Fe3+(aq) + 3Cl−(aq)
Fe3+(aq) + 2OH−(aq) → FeO(OH)(aq) + H+
The FeO(OH) dissociates to the formation of Fe2O3 nuclei according to the reactions (7)–(8):
FeCl3(aq) + 2NaOH(aq) → FeO(OH)(aq) + 2Na+(aq) + H+(aq) + 3Cl−(aq)
2FeO(OH)(aq) → Fe2O3(s) + H2O
The reaction under the appropriate heating conditions increases the concentration of Fe2O3 nuclei, which are the basis of the construction of the desired nanoparticles.
3.1. X-ray Diffraction Analysis (XRD)
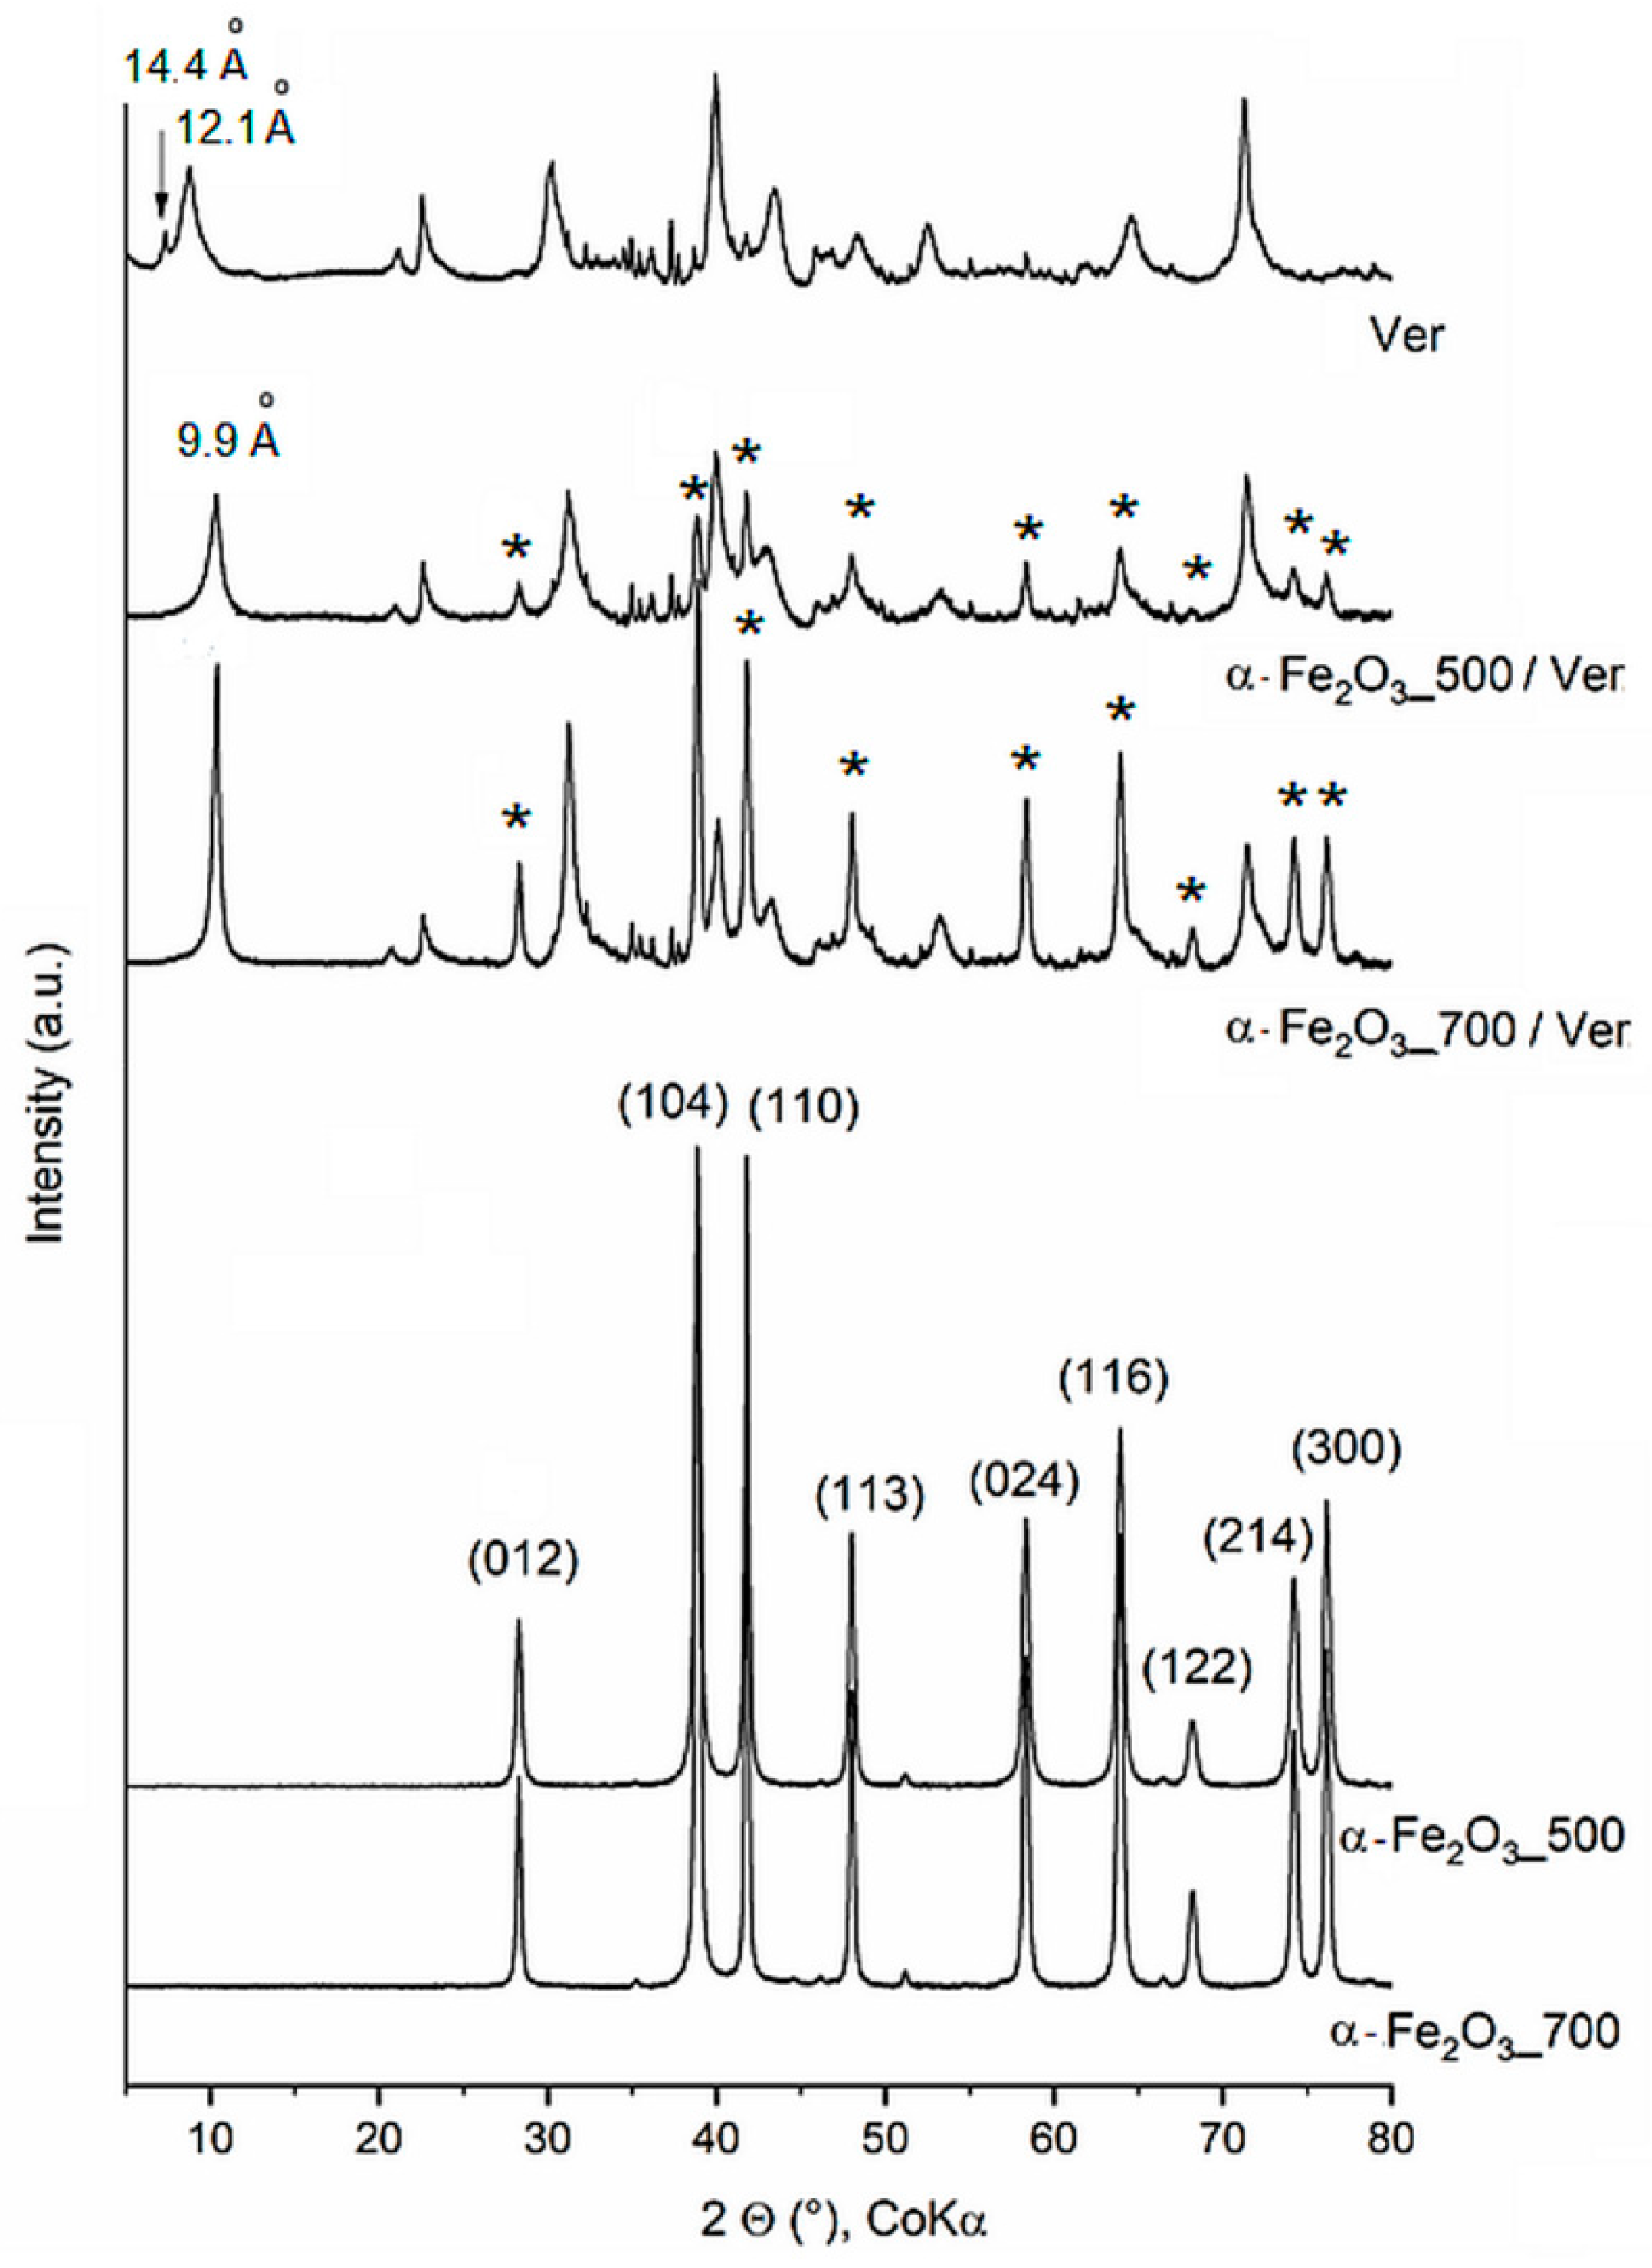
The irrational basal peak series in the XRD pattern of raw vermiculite (Ver) (Figure 1) suggest mixed layering of vermiculite-mica-like layers, having interlayer cations at different water hydration states. The d-values of 14.4 Å and 12.1 Å are consistent with the mixture of vermiculite water bilayers and interstratified dehydrated phase, respectively [39]. The change in intensity and the position of basal reflections at d = 9.9 Å of vermiculite in α-Fe2O3_500/Ver and α-Fe2O3_700/Ver agree with the interlayer space containing non-hydrated cations. All peaks of the iron oxide precipitated and annealing at 500 °C and 700 °C were assigned according to PDF card No. 01-076-4579 to pure hematite, α-Fe2O3 (Figure 1).
The peaks of α-Fe2O3_700 are more intense and narrower in comparison with the peaks of α-Fe2O3_500, indicating higher crystallinity due to the formation of larger nanoparticles and due to agglomeration of the smaller ones. The mean size of α-Fe2O3 crystallites (Table 1) was calculated from the broadening of the diffraction lines (012) and (104). The Scherrer equation [40] explains the physical broadening of XRD lines in terms of a limited size of coherently diffracting domains (crystallites), which leads to a line broadening that is identical for all reciprocal lattice points throughout the reciprocal space. This means that the mean crystallite size D can be calculated from the physical part of the reciprocal line width expressed in the units of the reciprocal space, β, as D = K/β, or as D = K λ/(B cos θ) if the peak breadth (B) is expressed in the angular scale (in radians) [41]. In these equations, K is a constant, depending on the shape of the crystallites, λ is the wavelength of the X-rays and θ is a half of the diffraction angle. For the spherical shape of the crystallites, the factor K is equal to 0.9 [42]. The mean crystallite sizes (D in Table 1) of nanoparticles α-Fe2O3 were calculated as approximately D = 24 nm and 31 nm for α-Fe2O3_500 and α-Fe2O3_700, respectively, which are comparable with reported D = 19 nm for α-Fe2O3 at 500 °C and D = 27 nm for α-Fe2O3 at 650 °C [20].
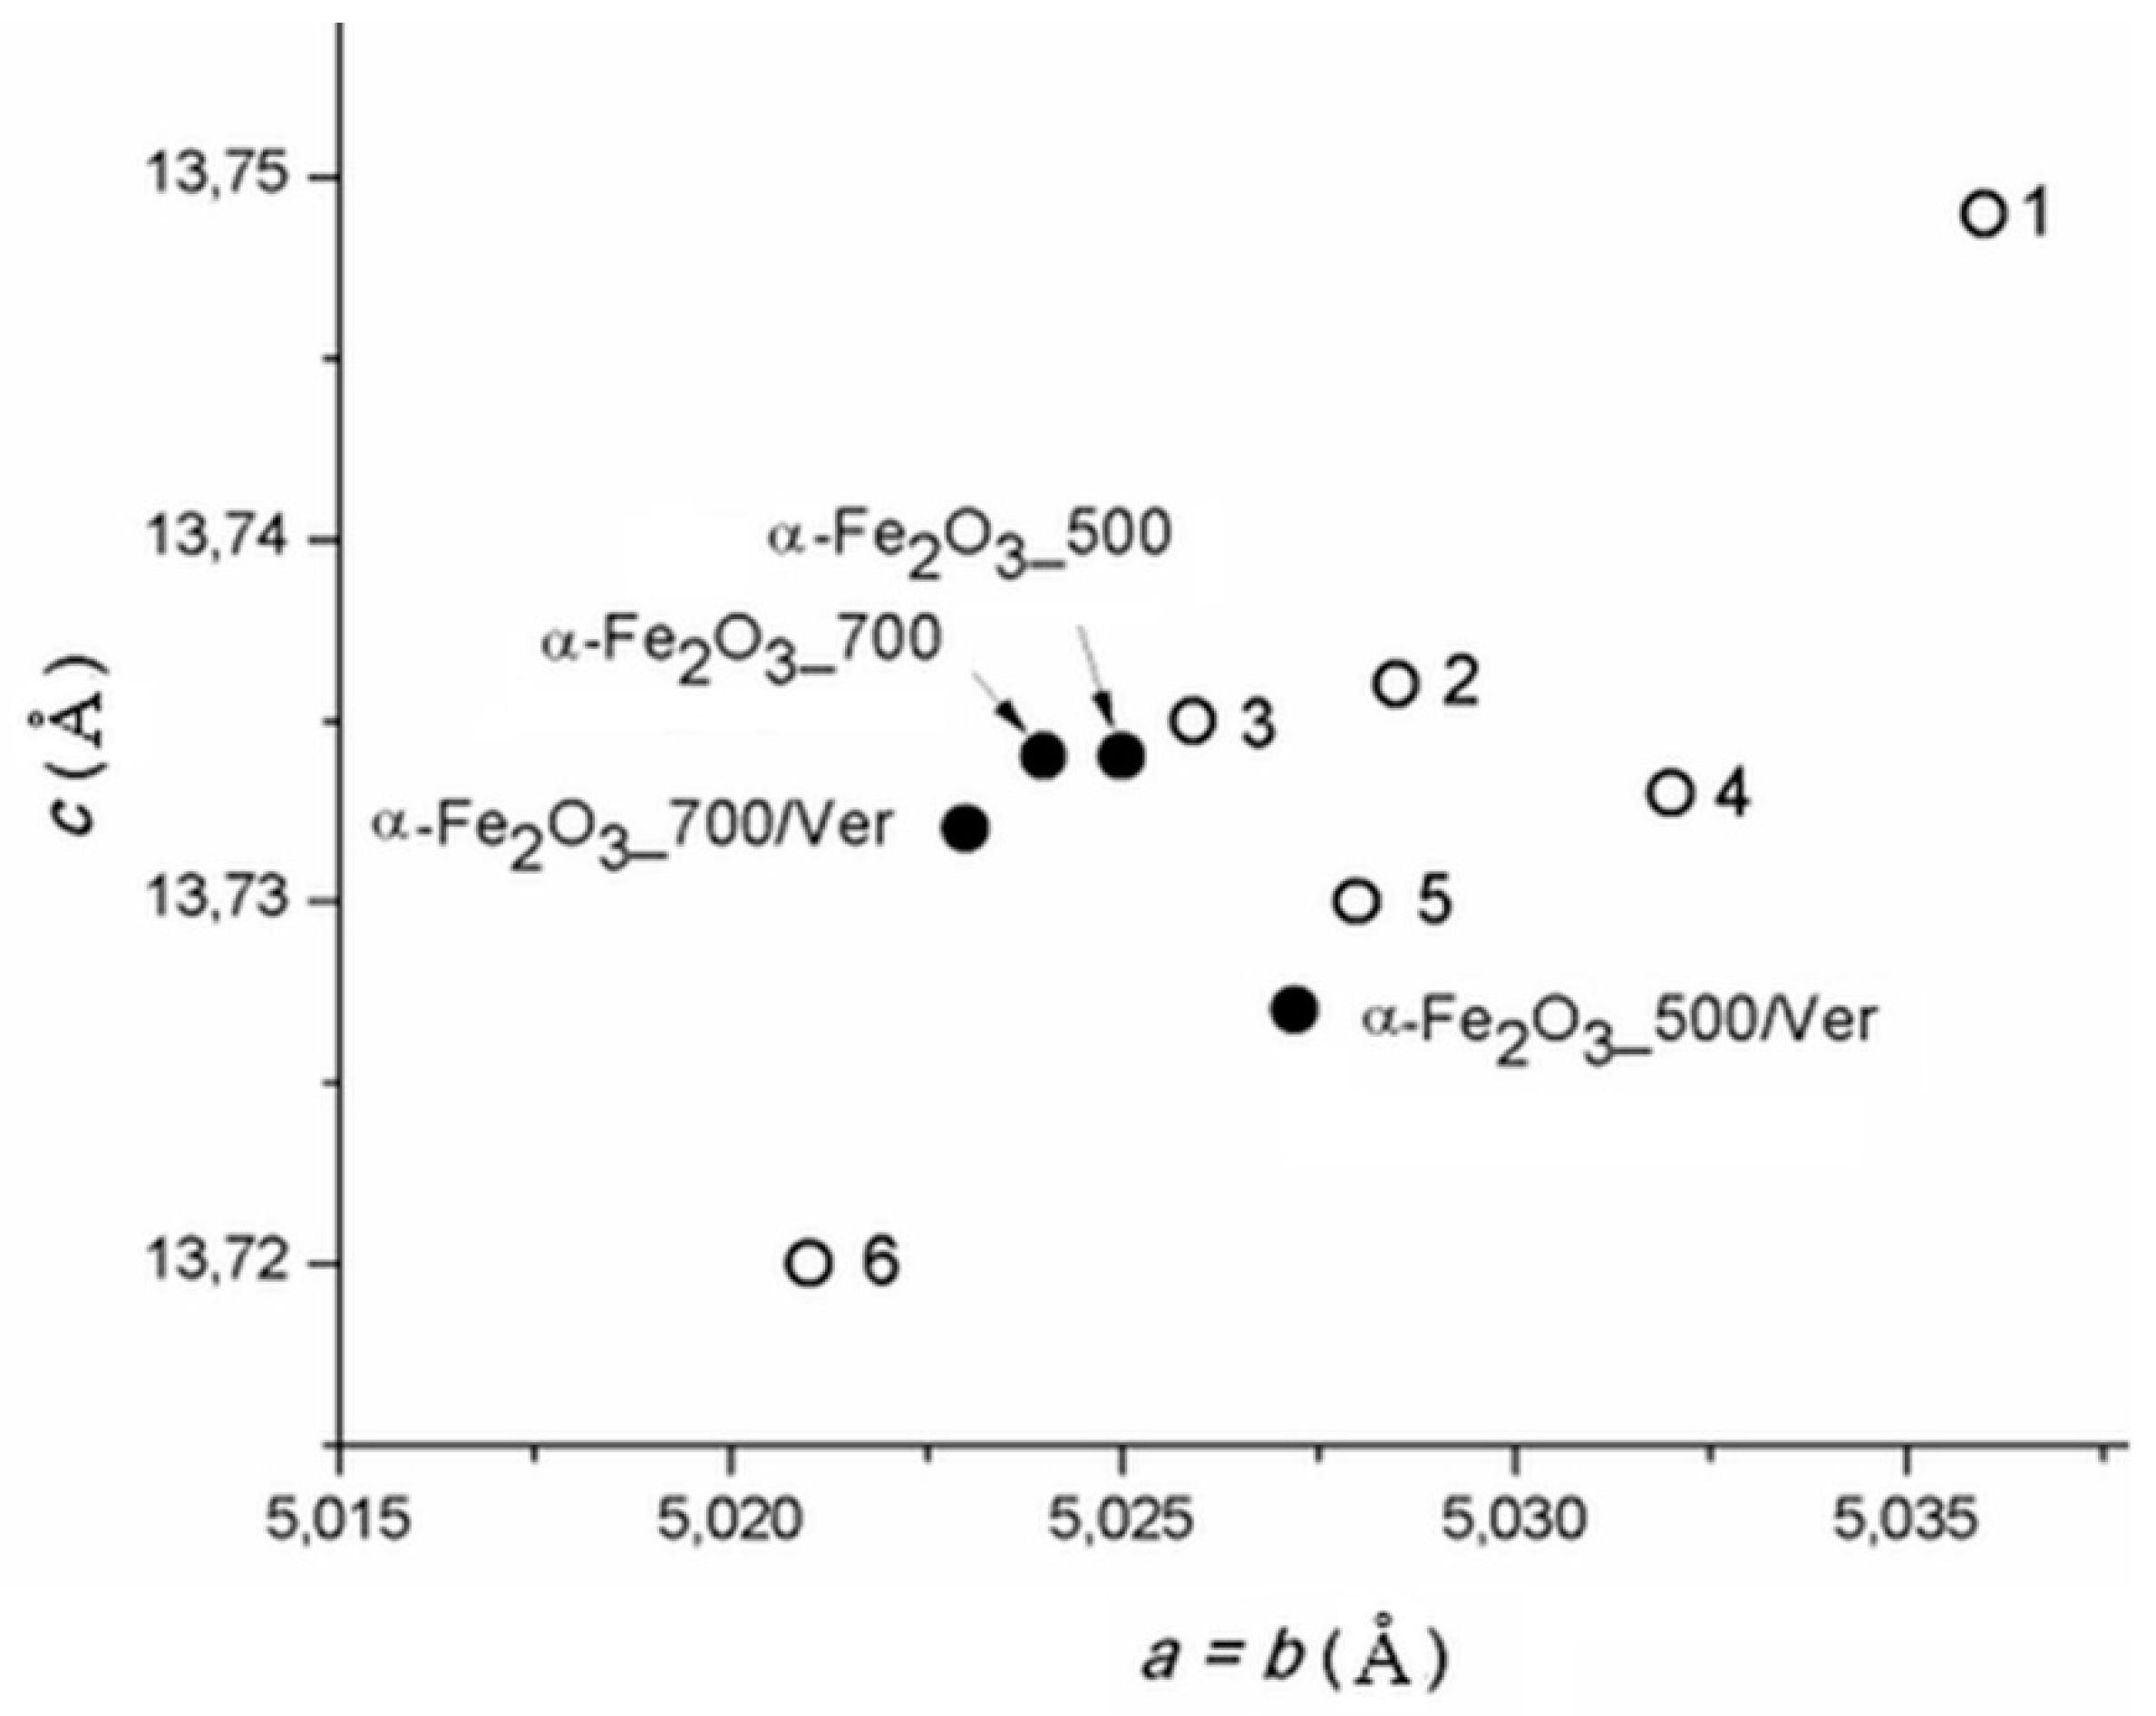
The calculated lattice parameters a vs. c of pure α-Fe2O3 nanoparticles and bounded in/on α-Fe2O3/vermiculite clay materials ((Figure 2, Table 1) are supplemented by the parameters of α-Fe2O3 in the PDF cards: No. 00-033-0664 (marked as 1), No. 01-079-0007 (marked as 2), No. 01-076-4579 (marked as 3), No.01-089-0599 (marked as 4), No. 00-001-1053 (marked as 5) and No. 01-089-8103 (marked as 6). Although the calculated cell dimensions vary in the range of their deviations by approximately 0.01 Å, the parameters of pure α-Fe2O3 and α-Fe2O3 anchored on the vermiculite are not the same, and the influence of vermiculite carrier on the symmetry of the cell parameters during crystallization of hematite can be assumed.
3.2. Scanning Electron Microscopy (SEM)
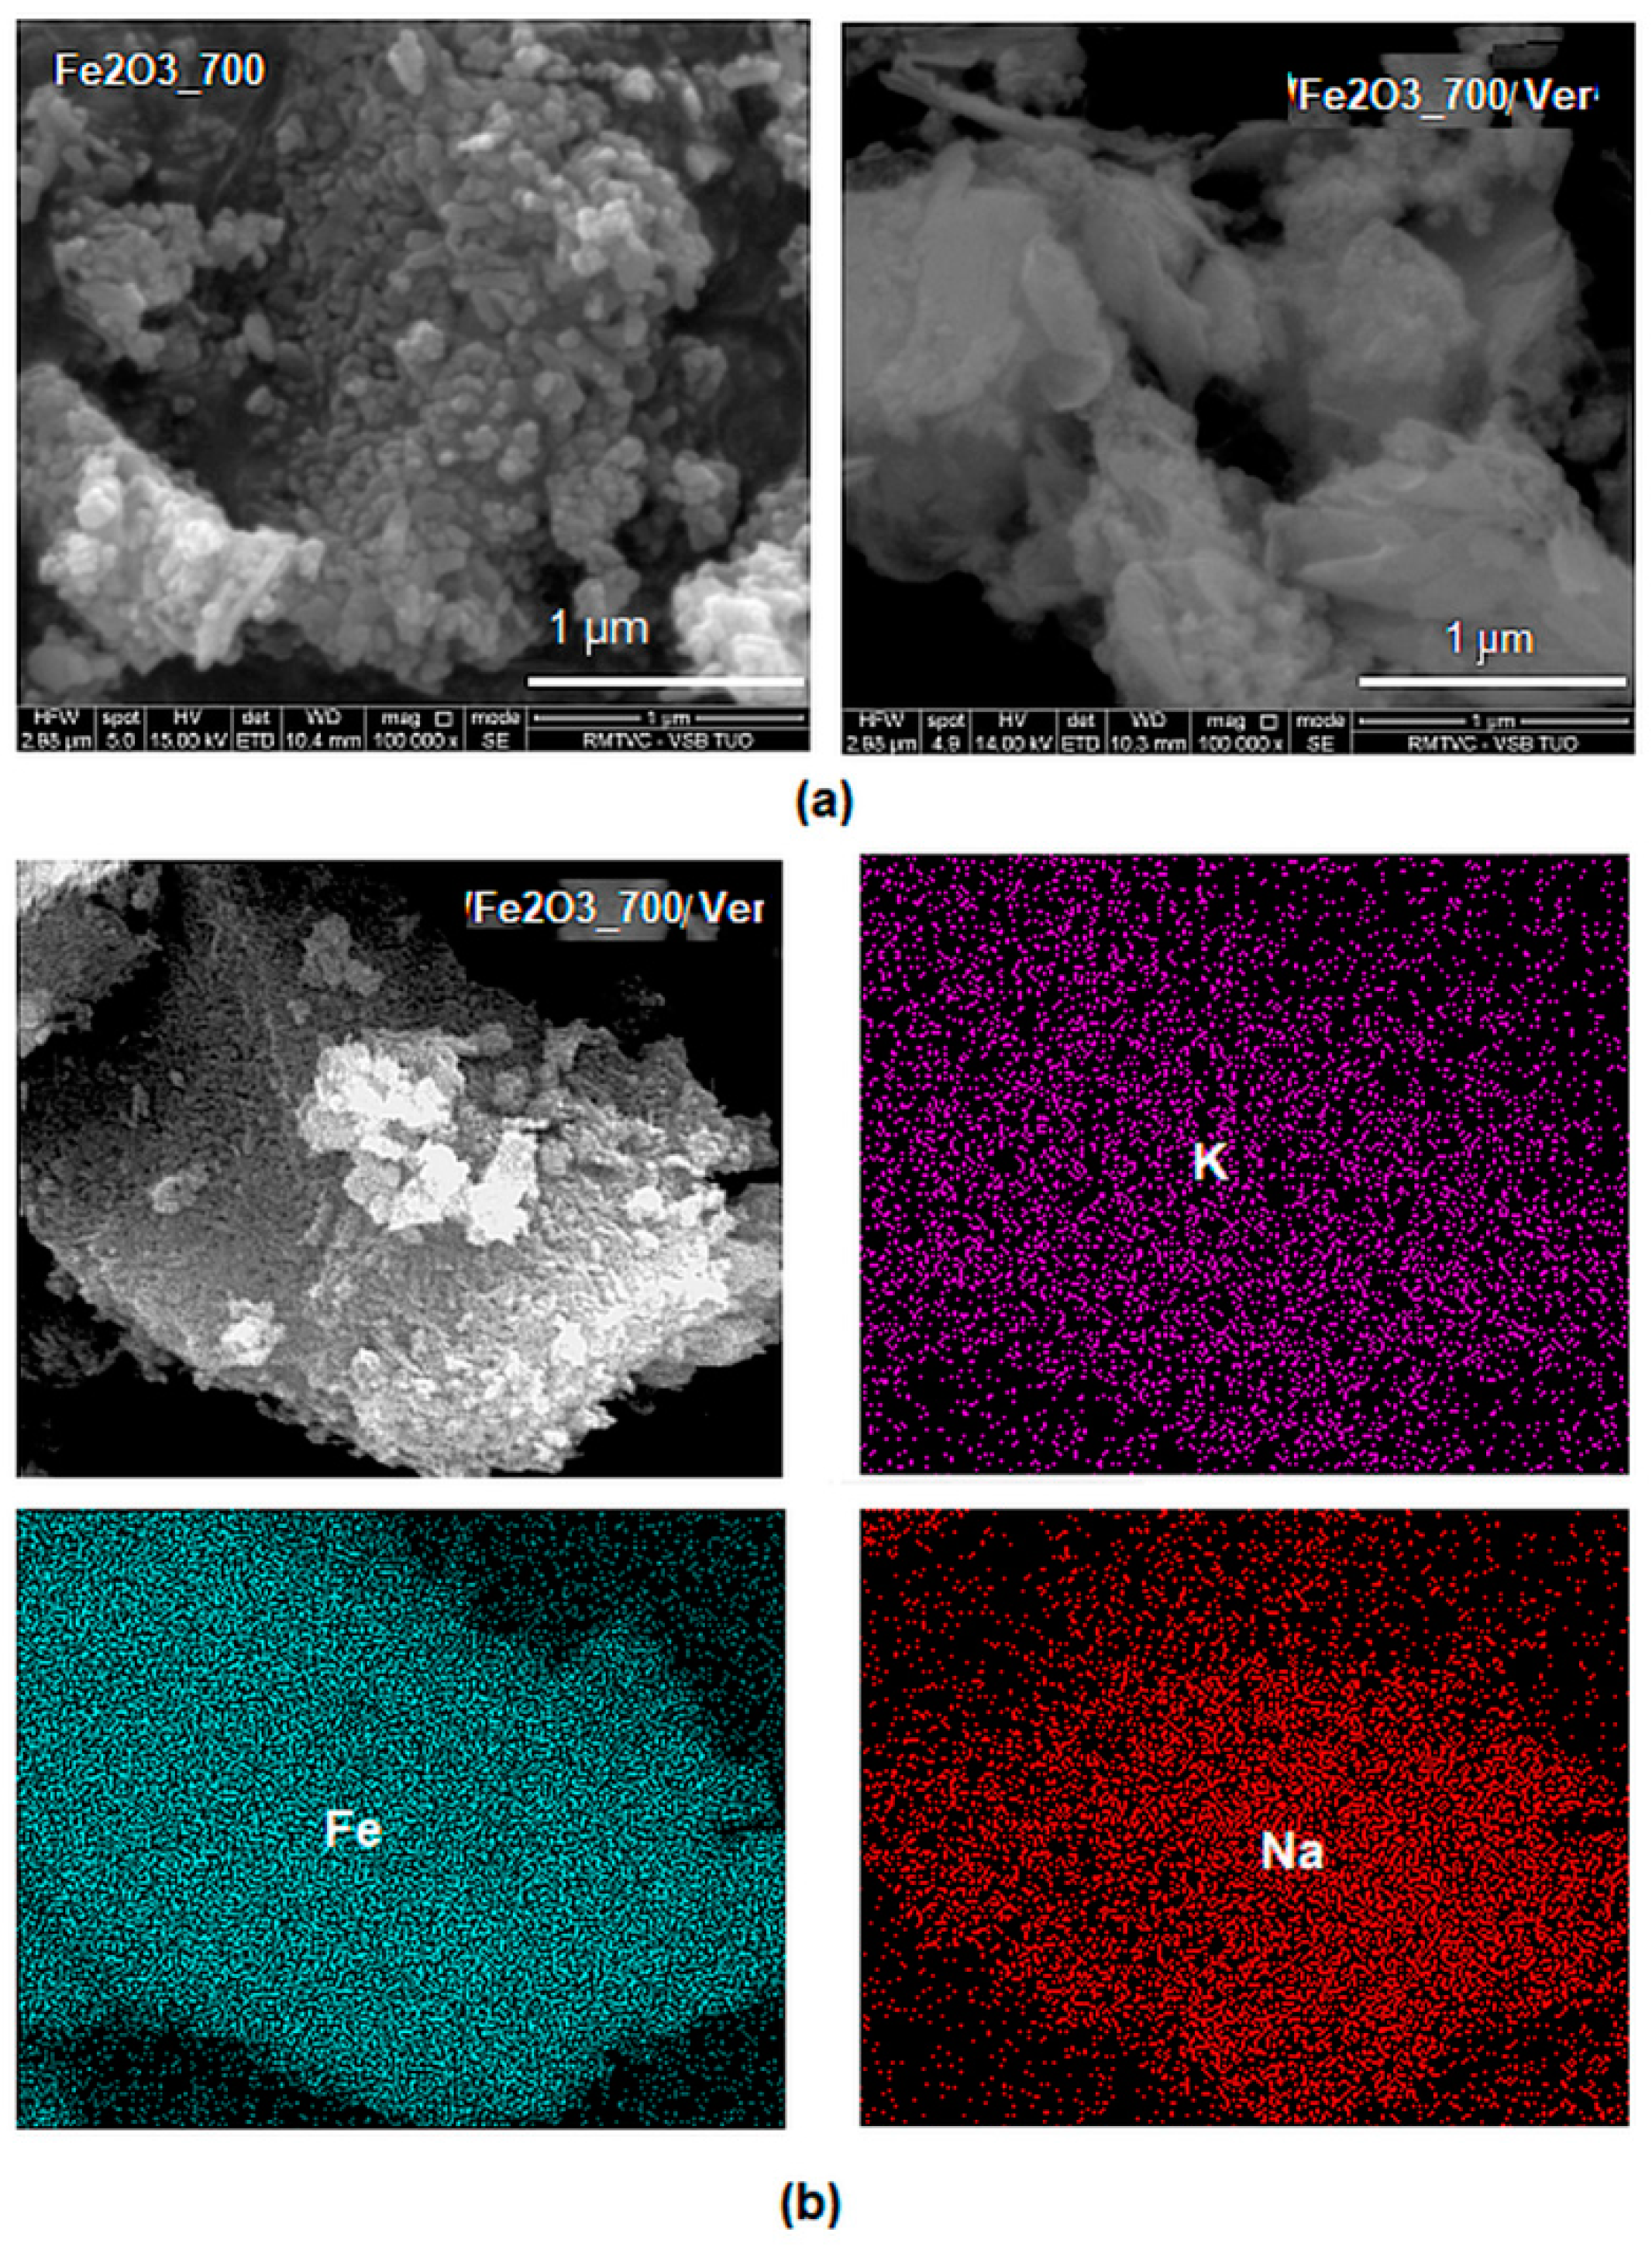
The ED-XRF analysis of sample α-Fe2O3/Ver determined a Fe2O3 27.5% mass. The BSE images of α-Fe2O3 nanoparticles (Figure 3) showed acicular morphology provided by the NaOH precipitant after calcination (Figure 3a), as already described in the literature, e.g., [23]. The distributions of nanocrystals were irregular, and their size ranged from sole nanoparticles up to nanoparticles clusters. EDS maps of elements Fe and Na (originating from the precipitation precursors) and K bound in the vermiculite structure (Figure 3b) revealed their homogeneous distribution on the surface of vermiculite flake.
3.3. Molecular Simulations
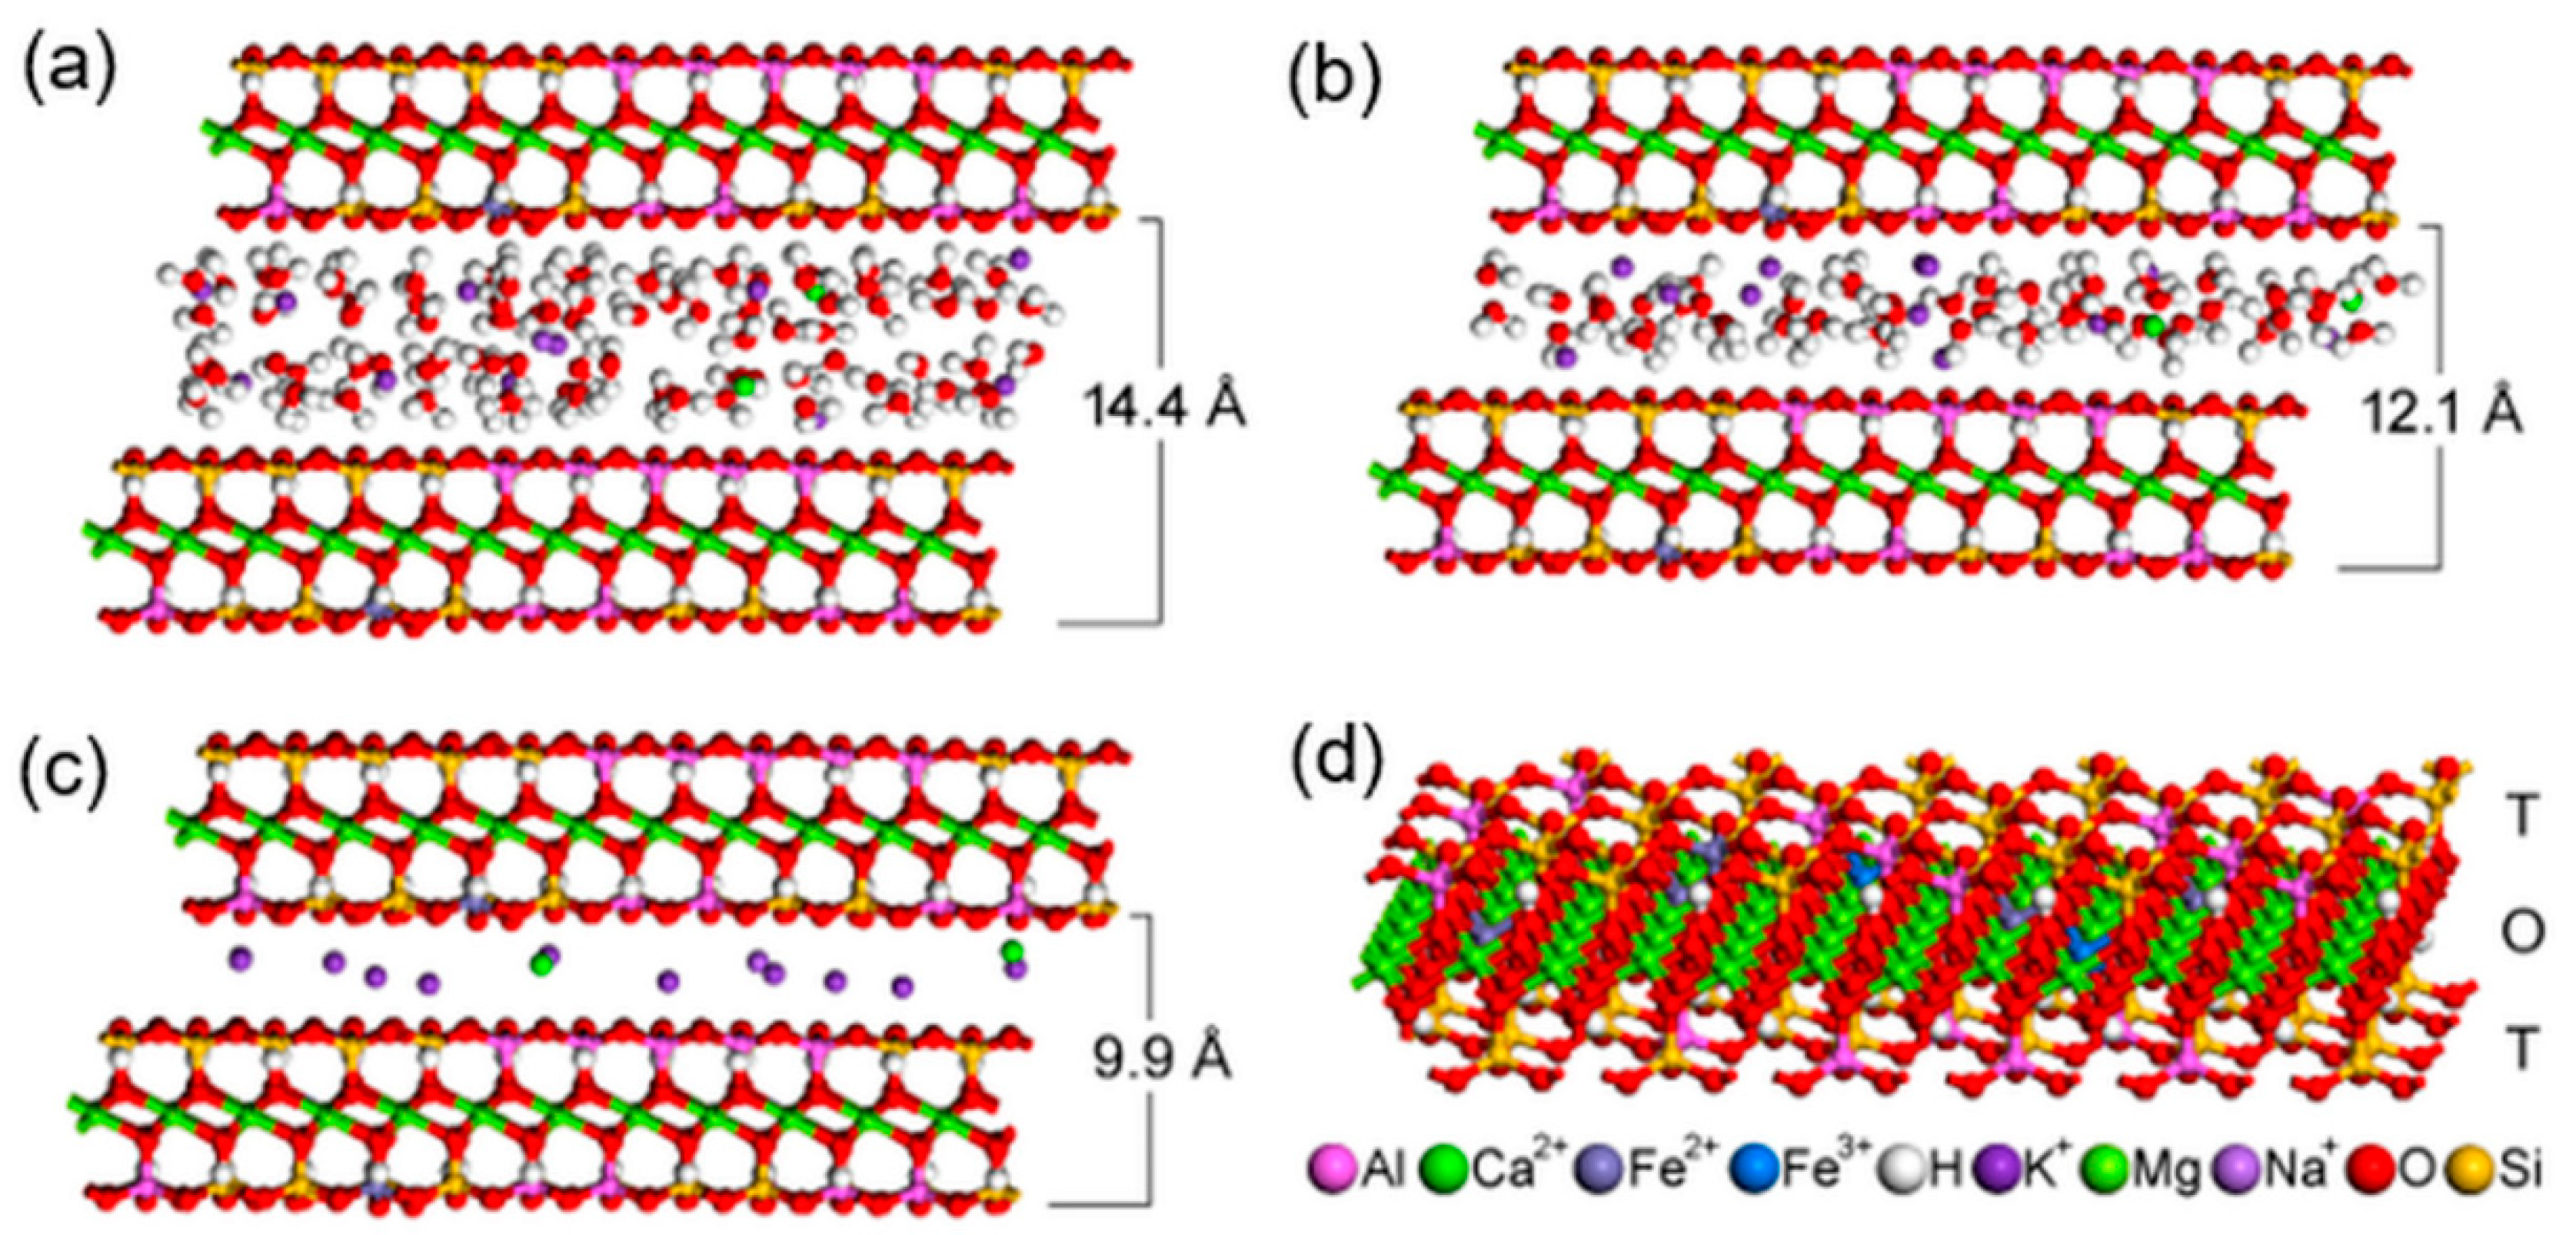
The space arrangement of the interlayer content in the optimized vermiculite models, the basal distances of which are calculated from simulated diffractograms, are in best agreement with the experimental data (Figure 4a–c). The two basal reflections of the original natural vermiculite with the interlayer values of 14.4 Å and 12.1 Å (Figure 1) correspond to the two water layers and one water layer around interlayer cations, respectively (compare Figure 4a,b). The stability of the optimized structures is almost the same, the total potential energy is −71,009 kcal/mol (Figure 4a) and −70,900 kcal/mol (Figure 4b). The decrease in basal distance to 9.9 Å after thermal treatment (Figure 1) is the result of the loss of interlayer water molecules (Figure 4c). Only a negligible decrease in stability of this anhydrous model to −70,355 kcal/mol (Figure 4c) can be explained by the intrinsic property of the interlayer cations to attract water molecules and to form hydration shells.
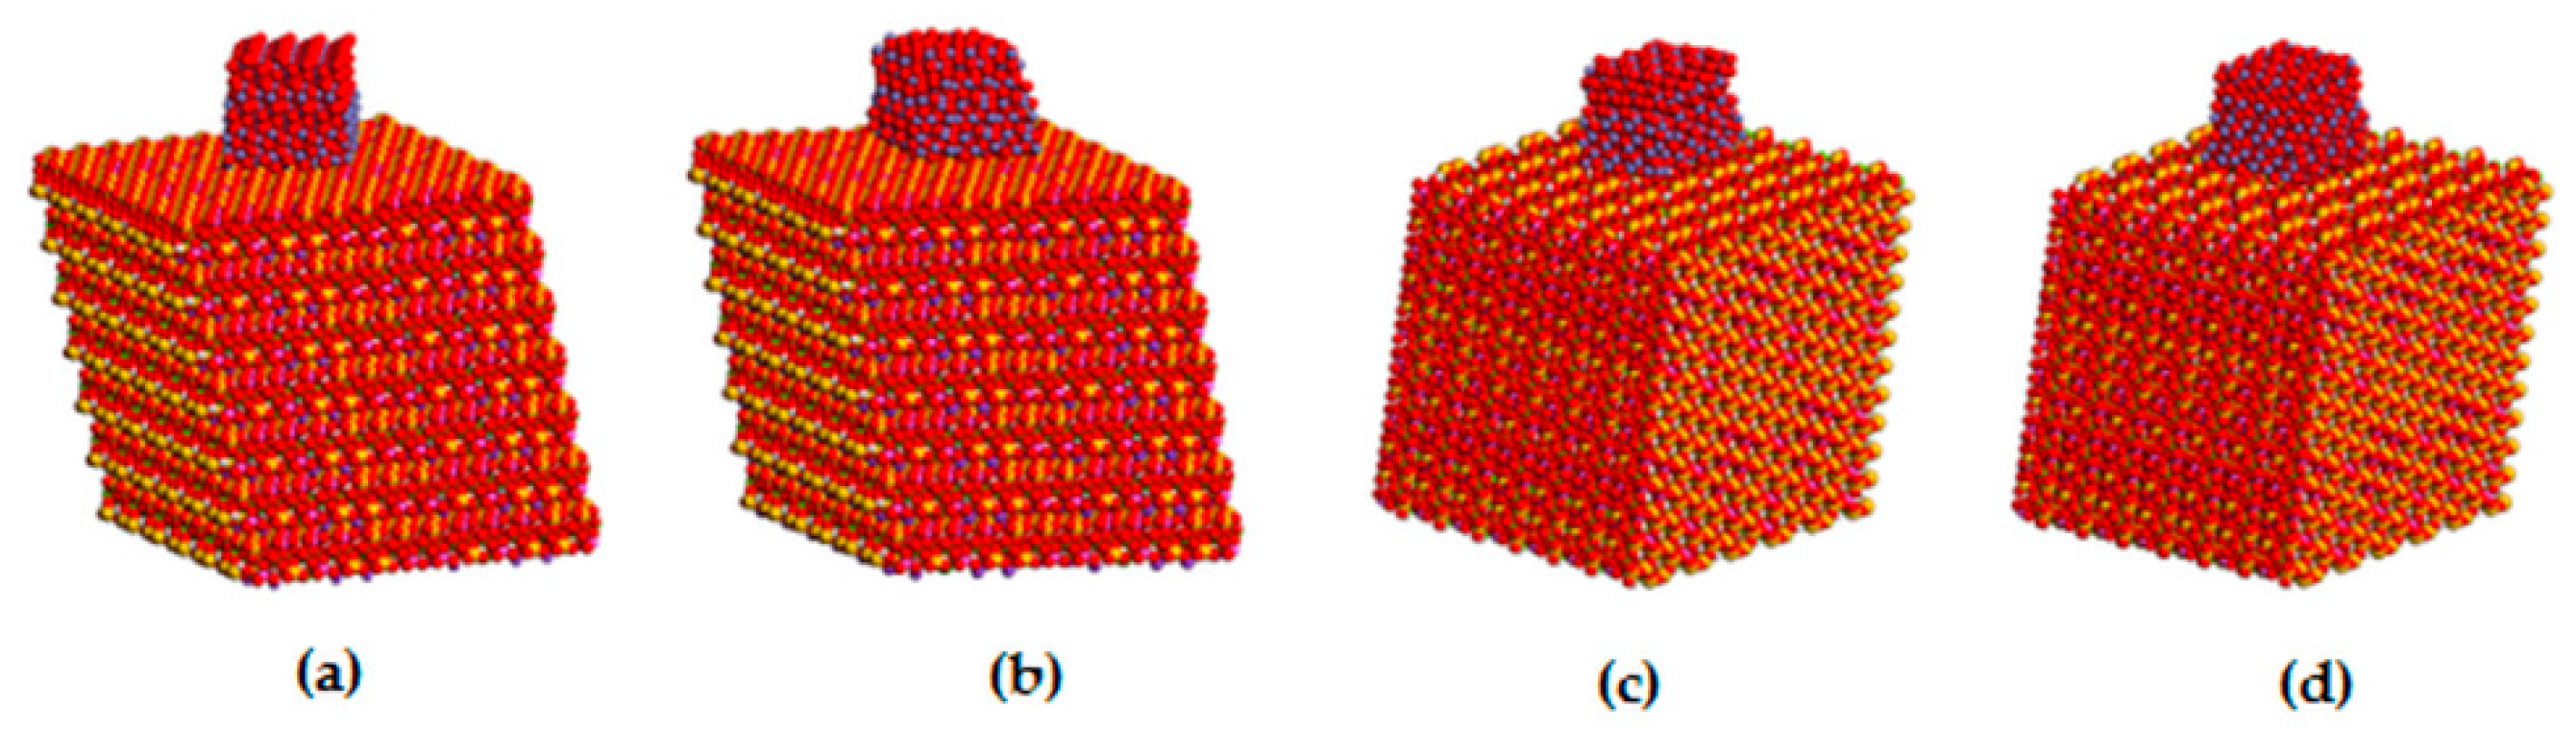
The structure of a single vermiculite layer with tetrahedral and octahedral substitutions, which are the source of a negative layer charge, is demonstrated in Figure 4d. Molecular modeling of α-Fe2O3 nanoparticles adjacent via selected crystallographic planes (012) and (104) to the surface and the edge of vermiculite showed the possibility of anchoring the nanoparticles to the Palabora vermiculite (Table 2). Stability of all four models is very similar, with the total potential energy on average being −210,987 kcal/mol, while the interaction energy shows that (012) orientation of α-Fe2O3 is preferred, both on the surface and the edge of the vermiculite (Table 2). Higher interaction energies for models containing α-Fe2O3 nanoparticles at the vermiculite edge are caused by a higher roughness of the edge compared to the surface. This result does not necessarily mean a lower occurrence of α-Fe2O3 nanoparticles at the vermiculite edges in the real sample, because nanoparticles on the edges tend to be smaller than on the surface, so the contact area between nanoparticle and edge increases. This problem was discussed in our earlier study focused on a similar nanocomposite system of metal oxide/phyllosilicate-type TiO2/kaolinite [43]. The optimized structures of all four models, the energies of which are listed in Table 2, are displayed in Figure 5.
3.4. UV-Vis DRS
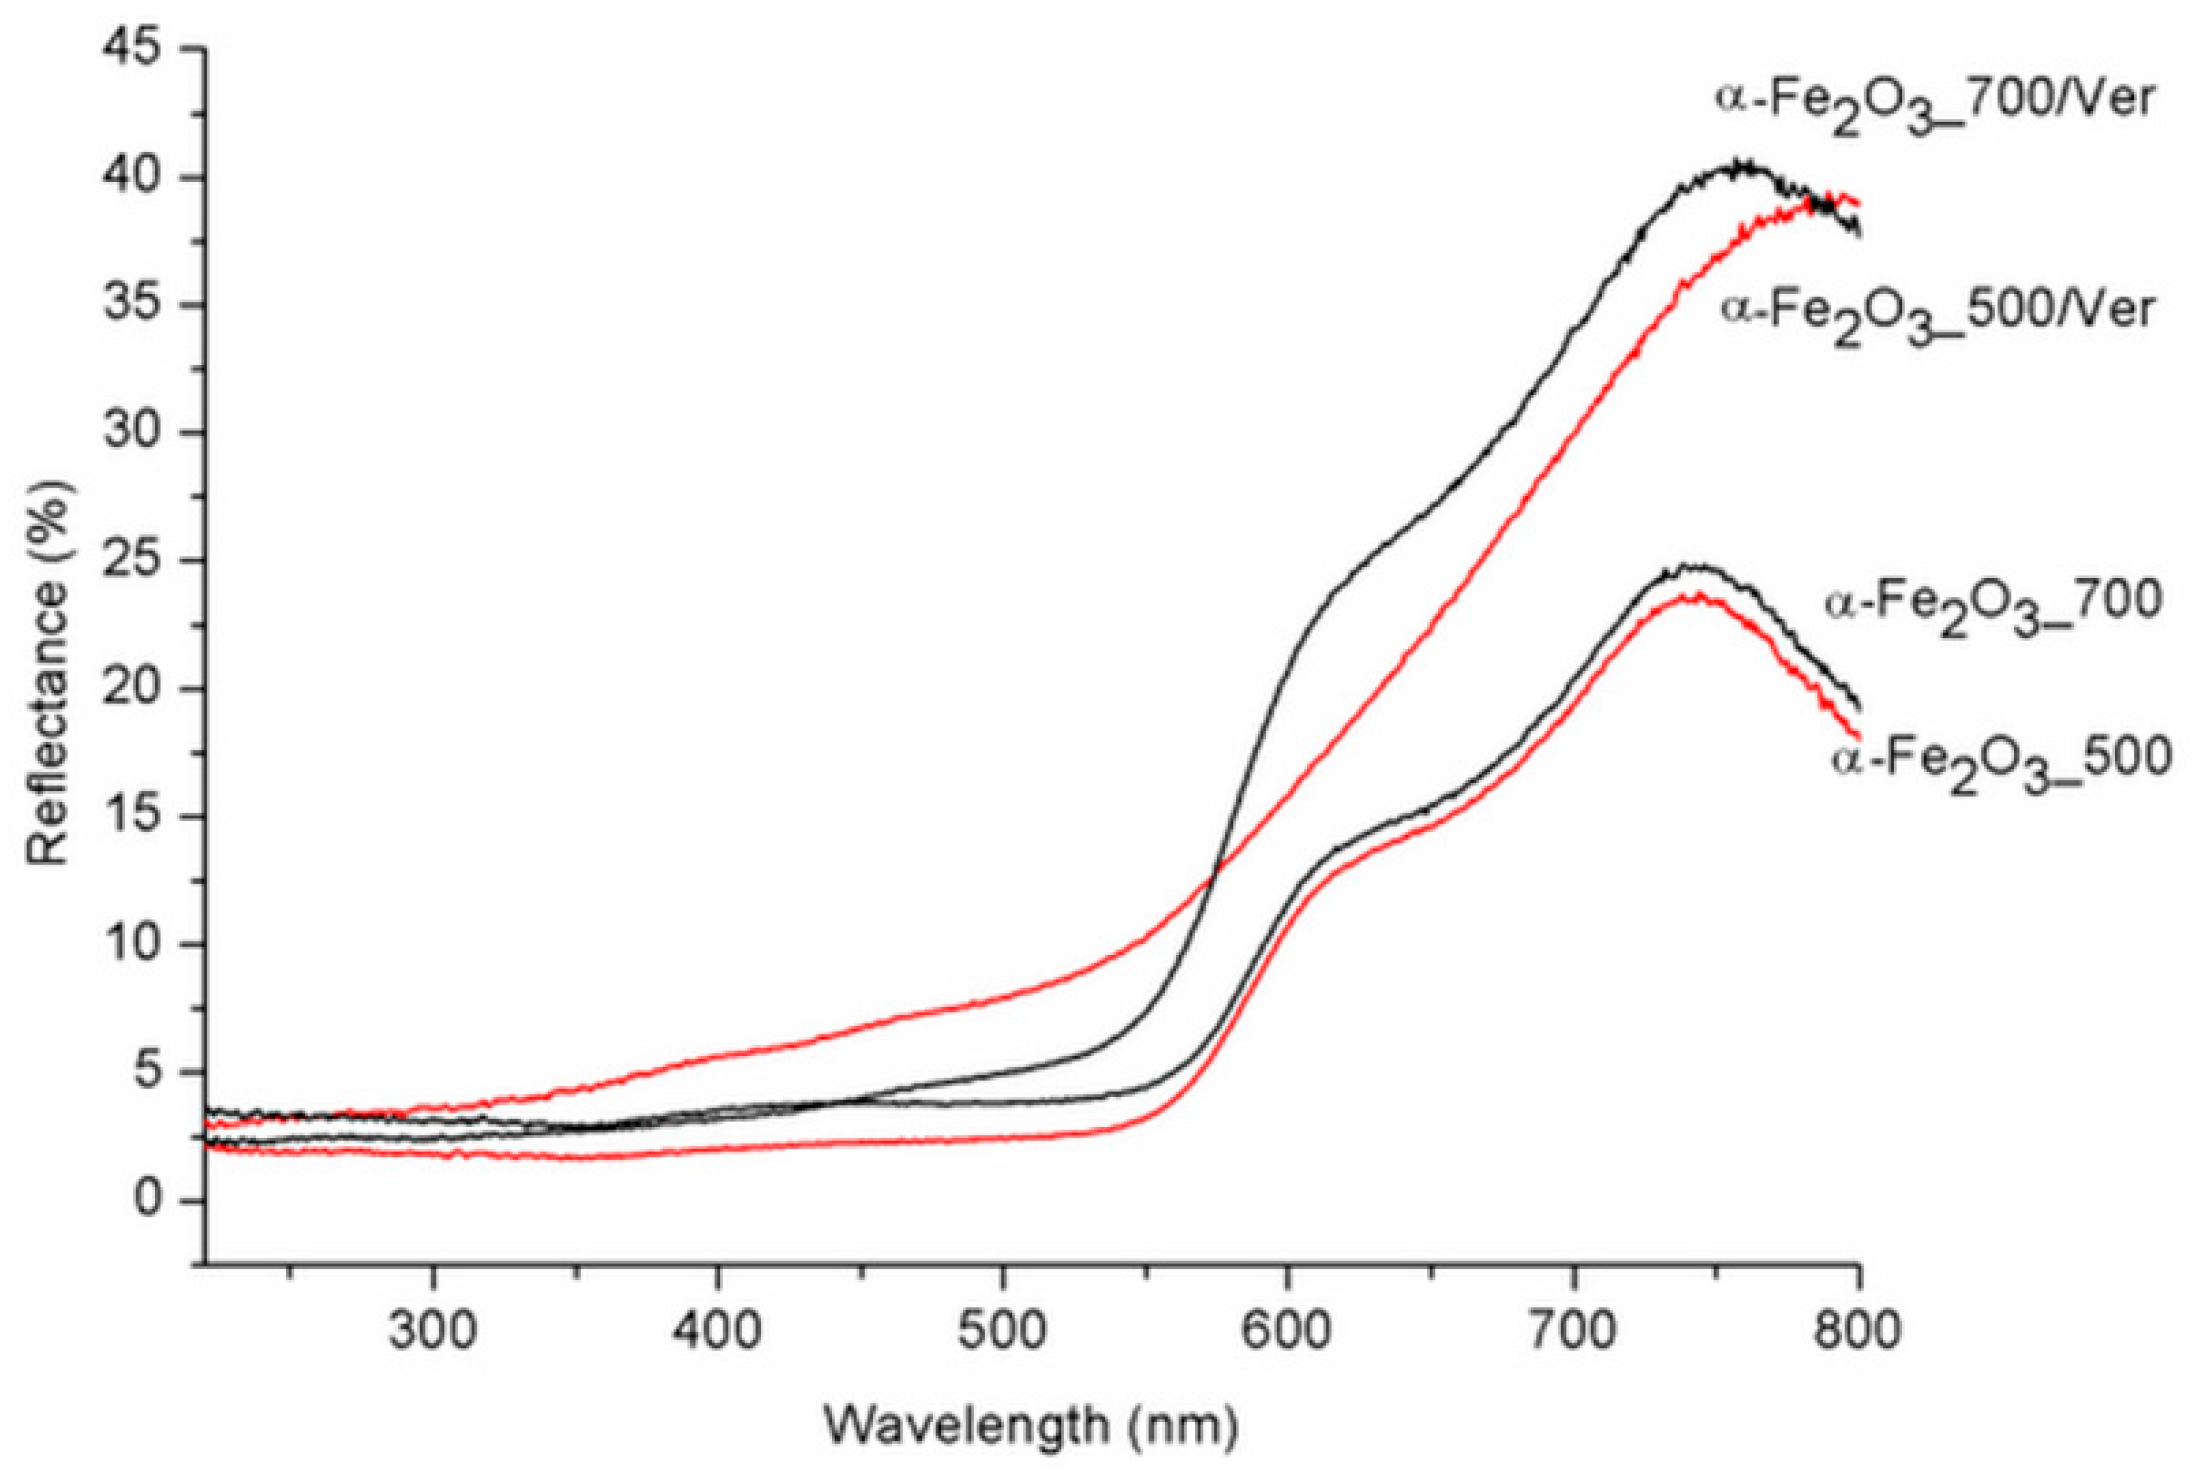
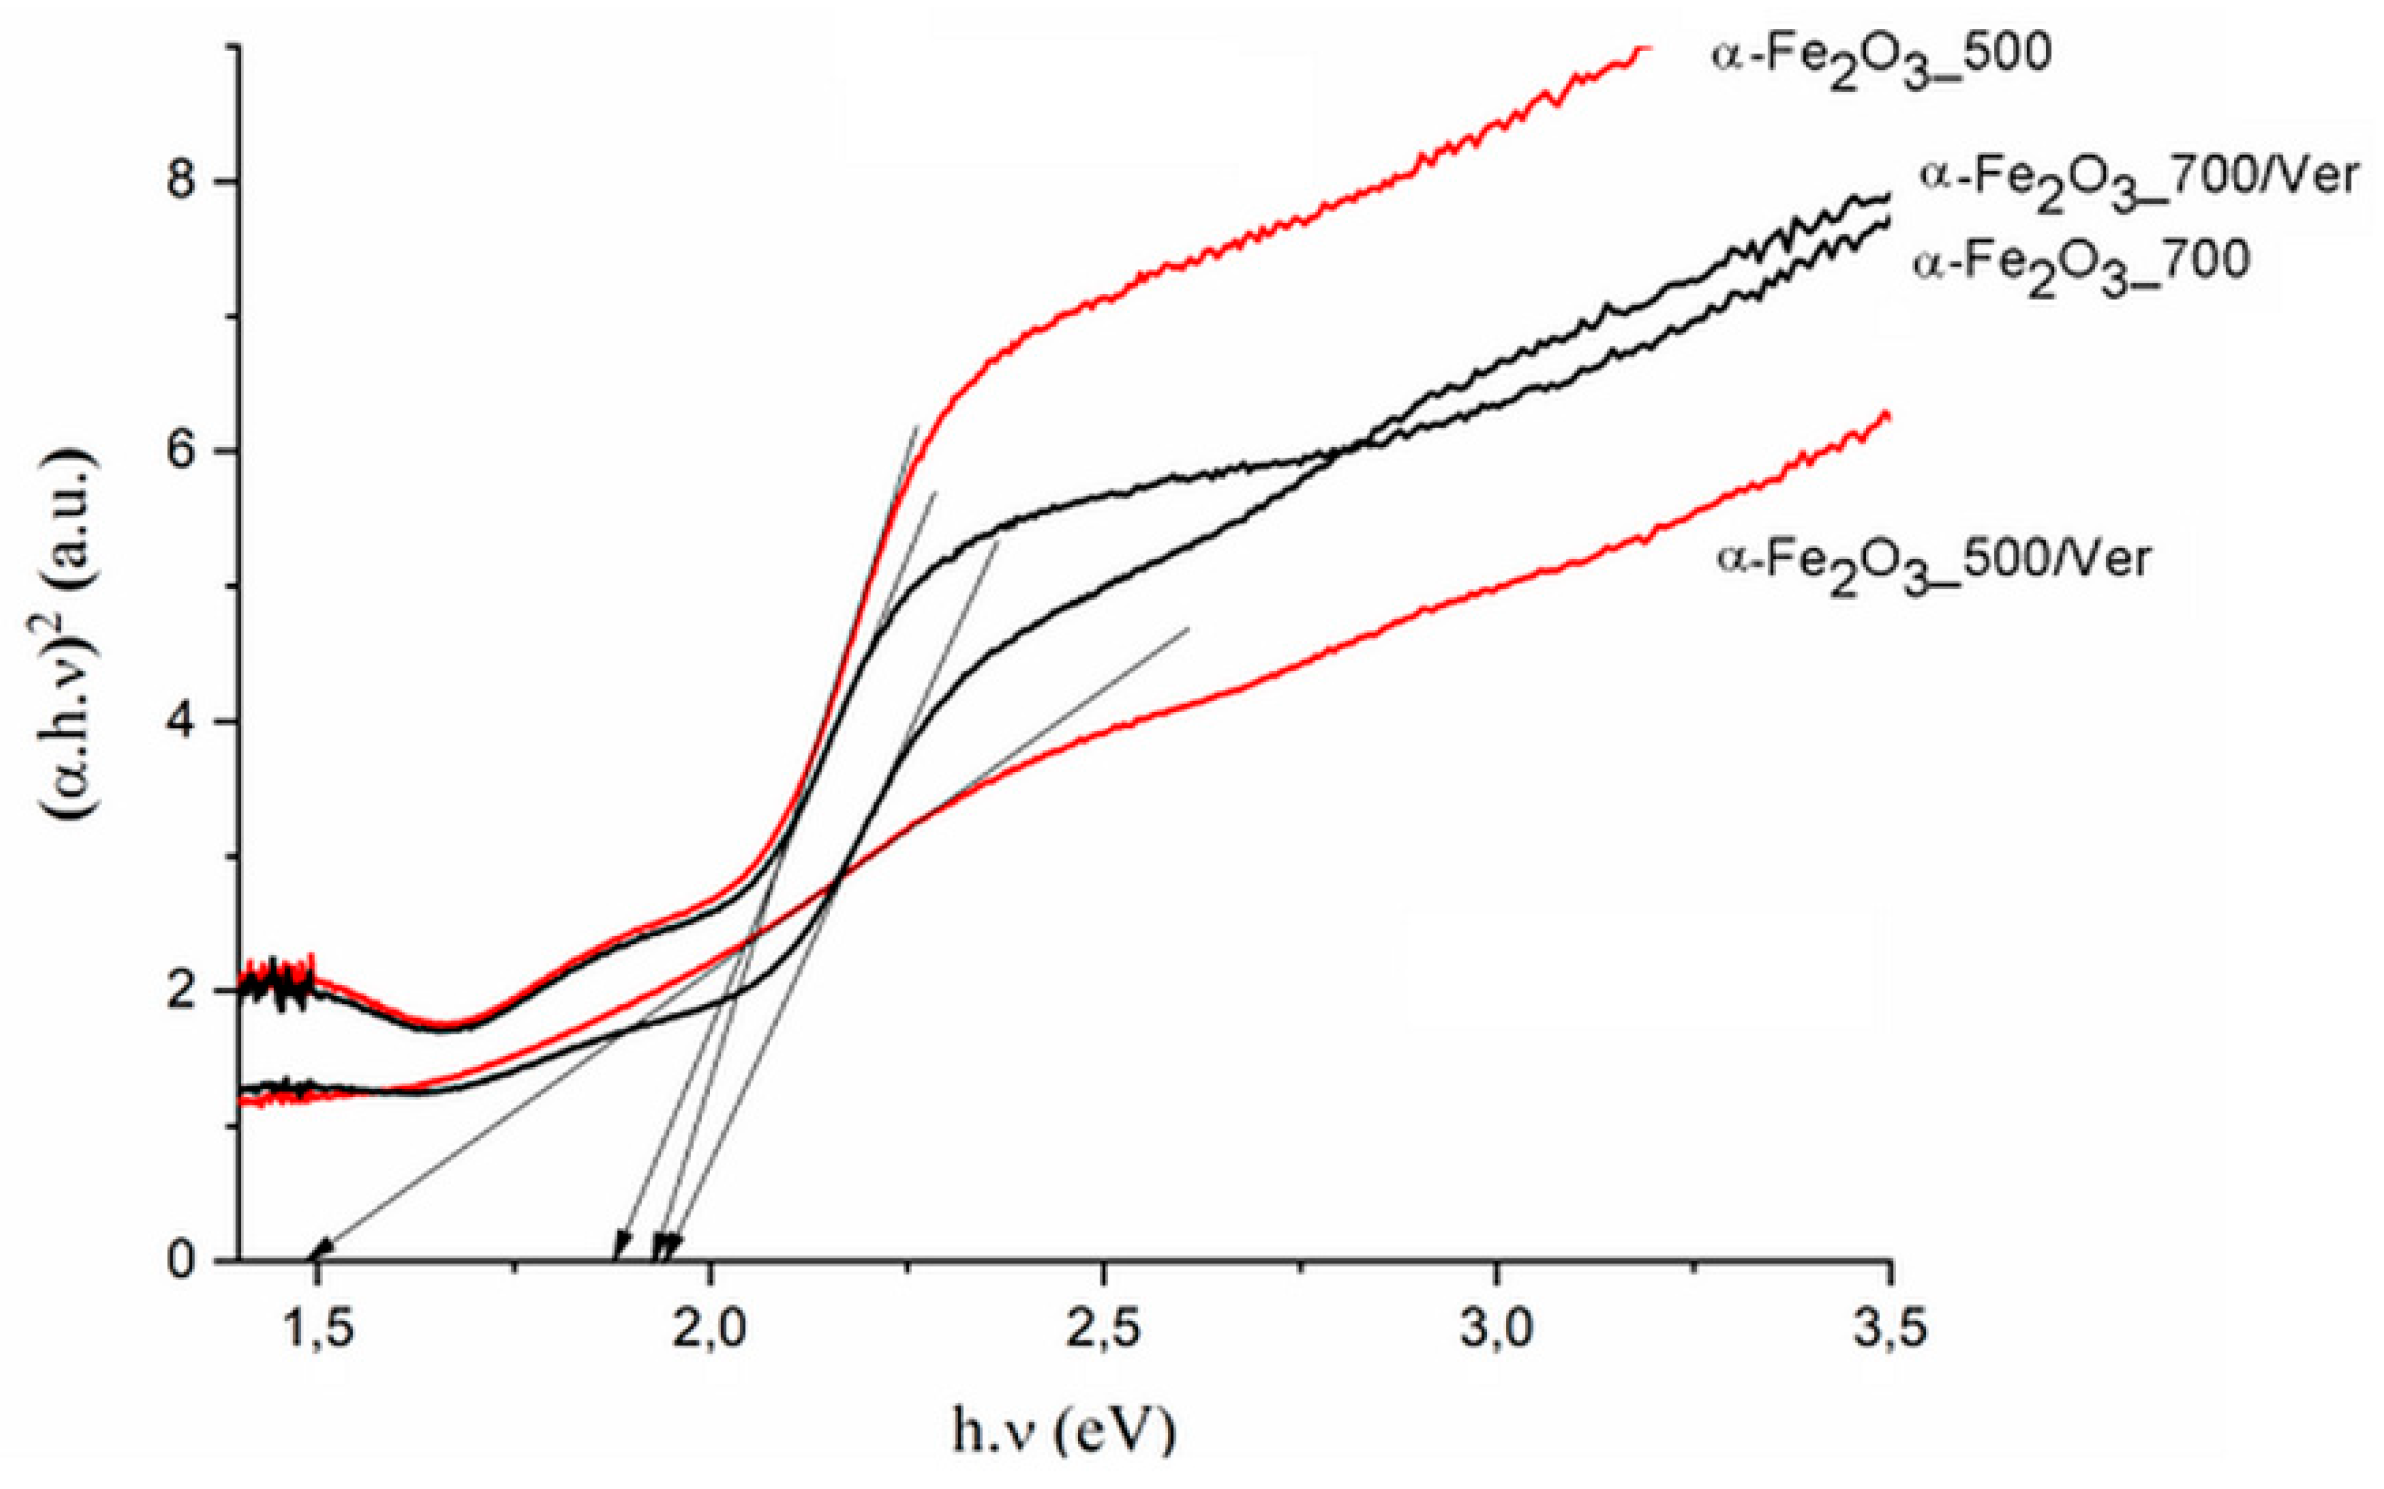
UV-Vis diffuse reflectance spectroscopy is useful for identifying diverse types of iron oxides and to obtain information about the optical properties. As a rule, colored Fe oxides show a strong absorption in the ultraviolet and blue spectral regions, except for strong reflection in the red and infrared region [44]. The DRS spectra of α-Fe2O3_500 and α-Fe2O3_700 are in good agreement with the spectrum of room-temperature hematite powder characterized by Yamanoi et al. [45]. The spectra in Figure 6 show a nearly constant reflectivity in the range 400–550 nm, a shoulder near 620 nm, and a reflectivity maximum near 750 nm. The region between 700 nm and 800 nm with low absorption shows very high reflectance. These bands shift to longer wavelengths (red shift) as the temperature increases with increasing particle size. While the DRS spectra of α-Fe2O3_700/Ver and α-Fe2O3_700 are similar, DRS spectrum of α-Fe2O3_500/Ver is different and corresponds with the deflection of unit cell parameters calculated for α-Fe2O3 in α-Fe2O3_500/Ver sample (Table 1, Figure 2). The calculated absorption intensities (Kubelka–Munk functions [46]) suggest that this temperature dependence of the hematite reflectance spectra can mainly be explained by a change in band gap absorption edges for a semiconductor. To determine the values of the direct/indirect bands gap energy (Eg), reflectance was recalculated into the dependence of Kubelka–Munk function (F(R∞)) on the absorption energy using the Equation F(R∞) = (1 − R∞)2/(2·R∞), where R∞ is the diffuse reflectance (R∞ = Rsample/Rstandard) from a semi-infinite layer. The band gap energies were calculated using the Tauc’s relation αhν = A (hν − Eg)n, where α is adsorption coefficient, hν is the incident photon energy, A is constant and n = 2 for direct band gap energy for these materials [47].
The direct band gap energy (Bg values) for pure α-Fe2O3 were reported in the range from 1.88 to 1.93 eV, depending on its crystalline state and methods of preparation (e.g., [48]). The Bg values for α-Fe2O3 nanoparticles (Table 3, Figure 7) and the reduced gap energy Bg of about 0.05 eV at calcination temperature 700 °C in comparison with 500 °C are caused by crystallites larger than approximately 7 nm at α-Fe2O3_700 (Table 1). These characteristics are similar to the α-Fe2O3 crystallite size of 33 nm and 21 nm influencing the Bg values of 1.94 and 2.1 eV, respectively, as reported by Maji et al. [20].
In spite that the crystallite size of α-Fe2O3 nanoparticles on vermiculite not changing fundamentally in comparison to their parent free samples (Table 1), the maximum difference of the band gap energy value Bg of about 0.45 eV was determined between α-Fe2O3_700/Ver (Bg = 1.94 eV) and α-Fe2O3_500/Ver (Bg = 1.49 eV) (Table 3).
The variation of the band gap energies observed in the hematite were explained by the defect states, cation/anion vacancies, and interstitials with energy located within the band gap energy (e.g., Mathevula et al. [47]). In our samples, Bg values were affected by vermiculite more intensively than by the calcination temperatures 500 °C and 700 °C. During calcination, heating from about 500 °C to 850 °C, when hematite nanoparticles were crystallized, vermiculite exfoliation was associated with a sudden release of water molecules between the silicate layers and the hydroxyl water gradually releasing [49]. At 500 °C and 700 °C, interlayer water molecules no longer existed, and vermiculite structure changed to a 1 Å mica-like structure (Figure 1 and Figure 4c). Crystallization of large particles at higher temperature was accompanied by the SBET value (Table 3), and reduced about 68% in α-Fe2O3_700 in comparison with α-Fe2O3_500 and about 50% in α-Fe2O3_700/Ver in comparison with α-Fe2O3_500/Ver.
3.5. Photoluminiscence (PL)
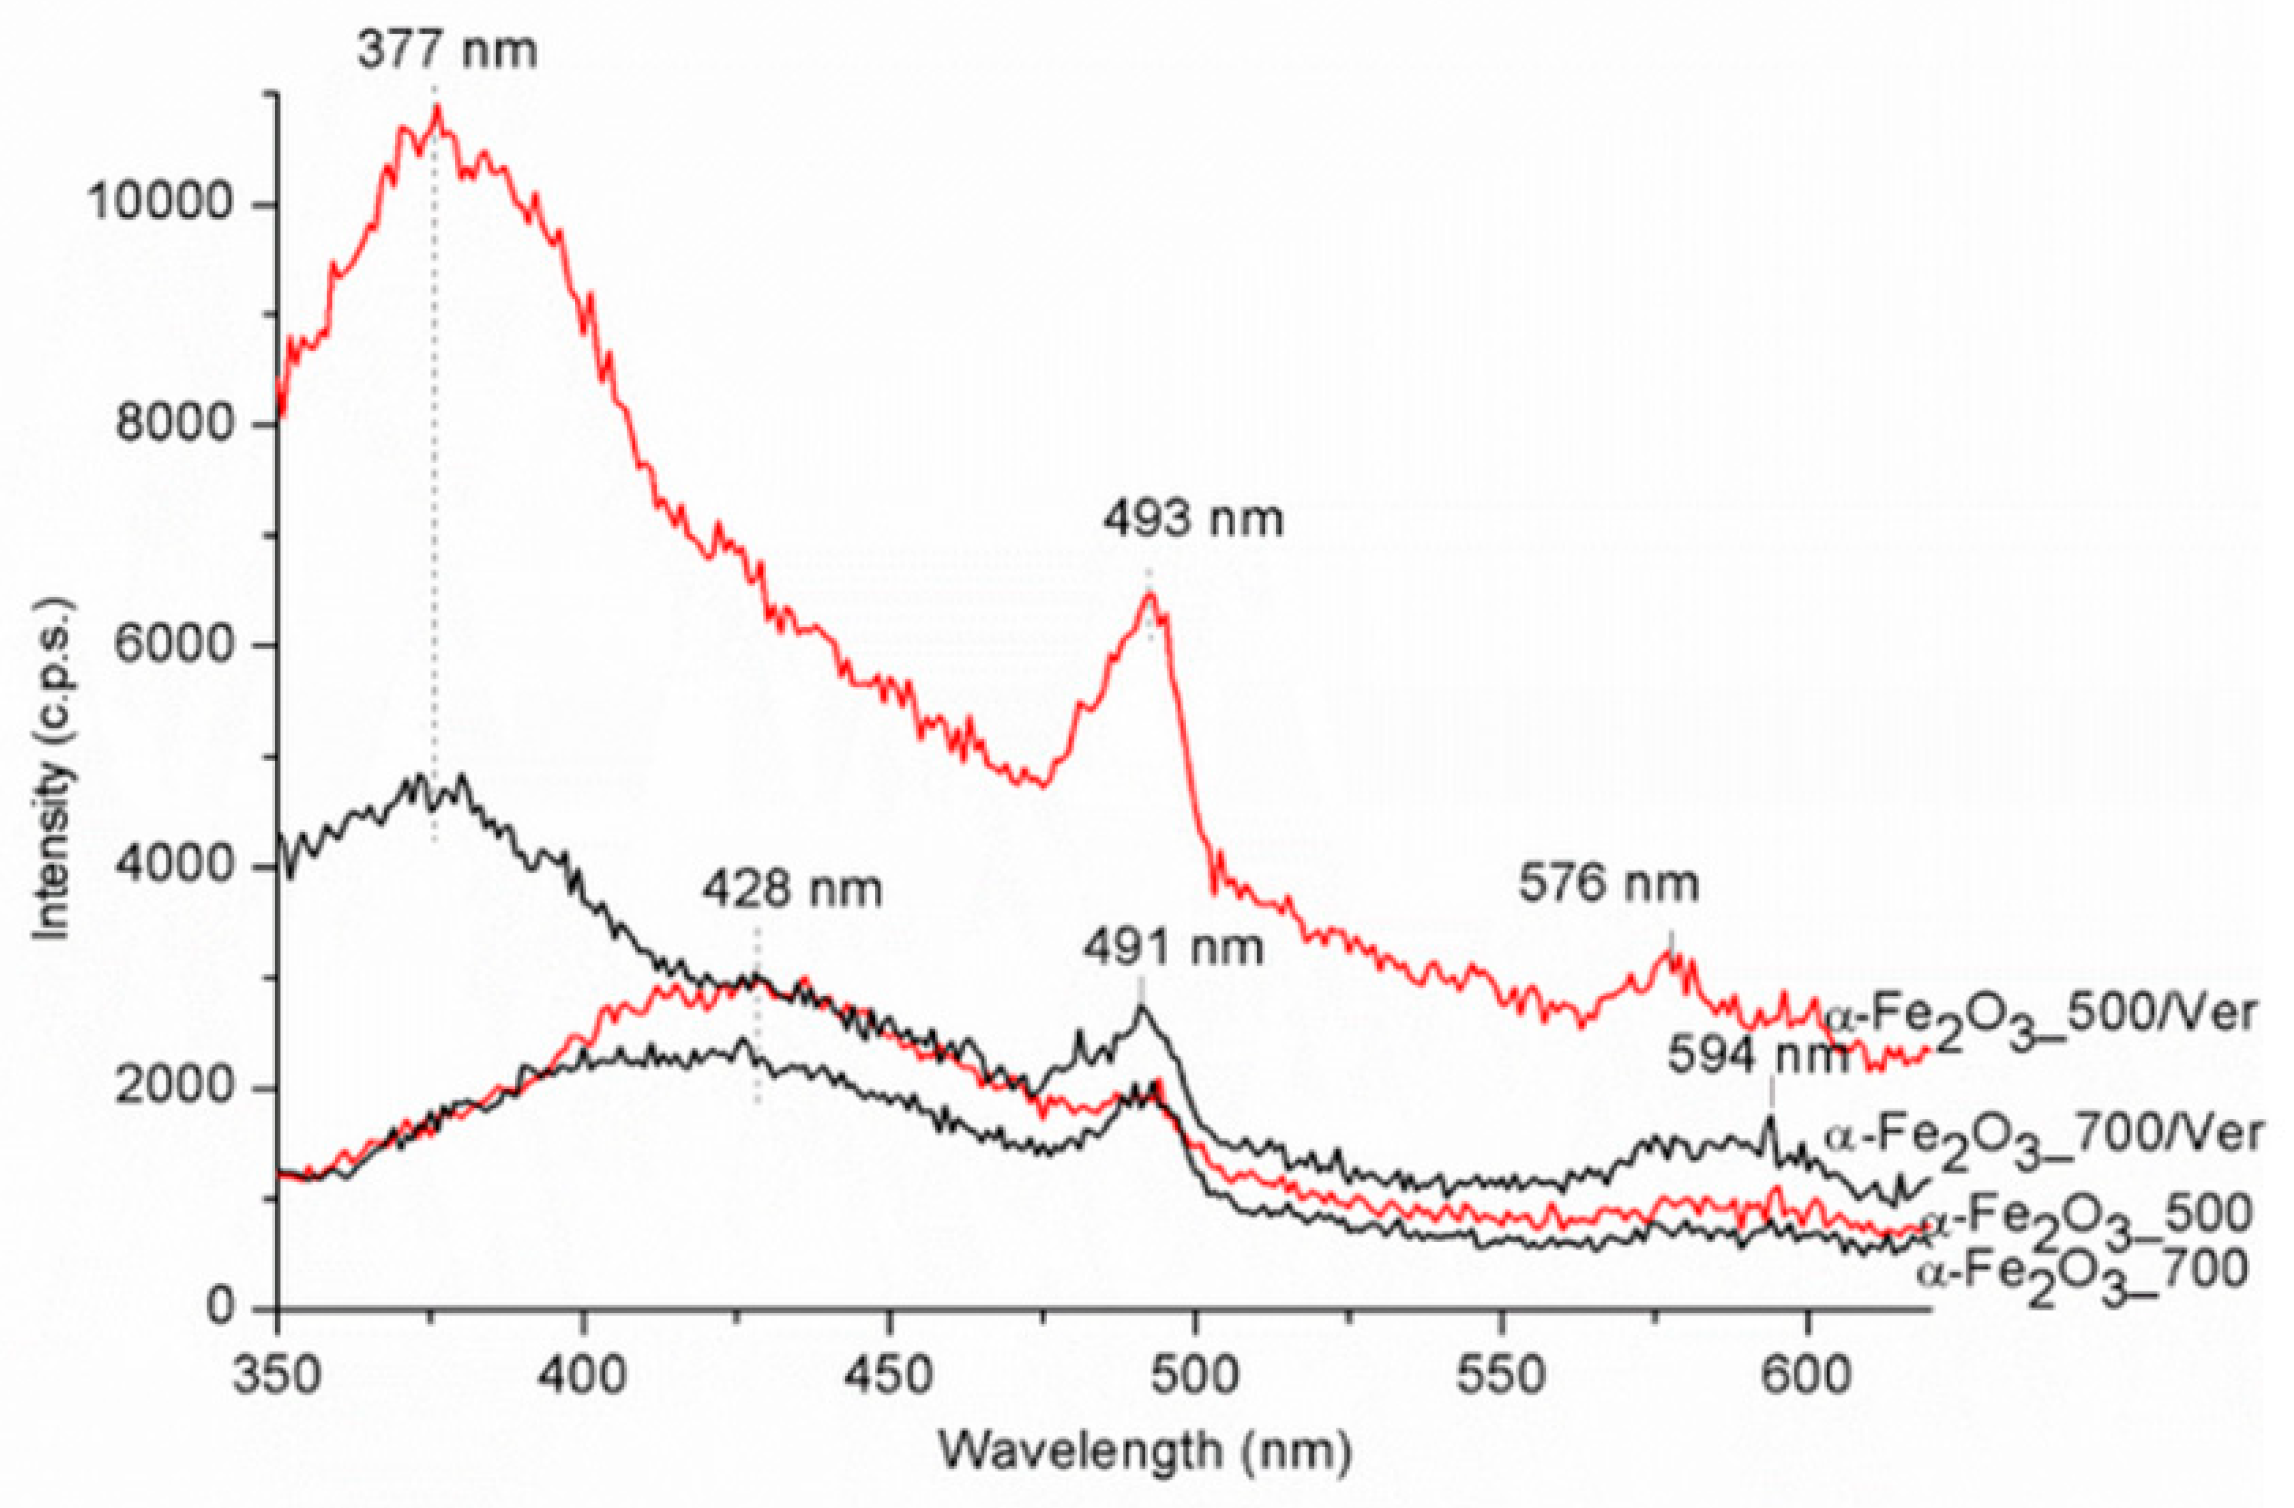
The PL spectra were carried out in the range of 350–700 nm (Figure 8). The maximum emission band for samples α-Fe2O3_700 and α-Fe2O3_500 centered around 428 nm is red shifted to about 377 nm for samples α-Fe2O3_500/Ver and α-Fe2O3_700/Ver. The strong photoluminescence was attributed to the electron transition, from the donor level formed by oxygen vacancies to the acceptor level [50,51]. The band centered around 493 nm was ascribed to the charge transfer transition between the iron ions [52]. A weak band at about 594 nm for samples α-Fe2O3_700 and α-Fe2O3_500 is red shifted to about 576 nm for samples α-Fe2O3_500/Ver and α-Fe2O3_700/Ver. This emission band can be attributed to the Fe3+ ligand field transition [47].
3.6. Photocatalytic Test
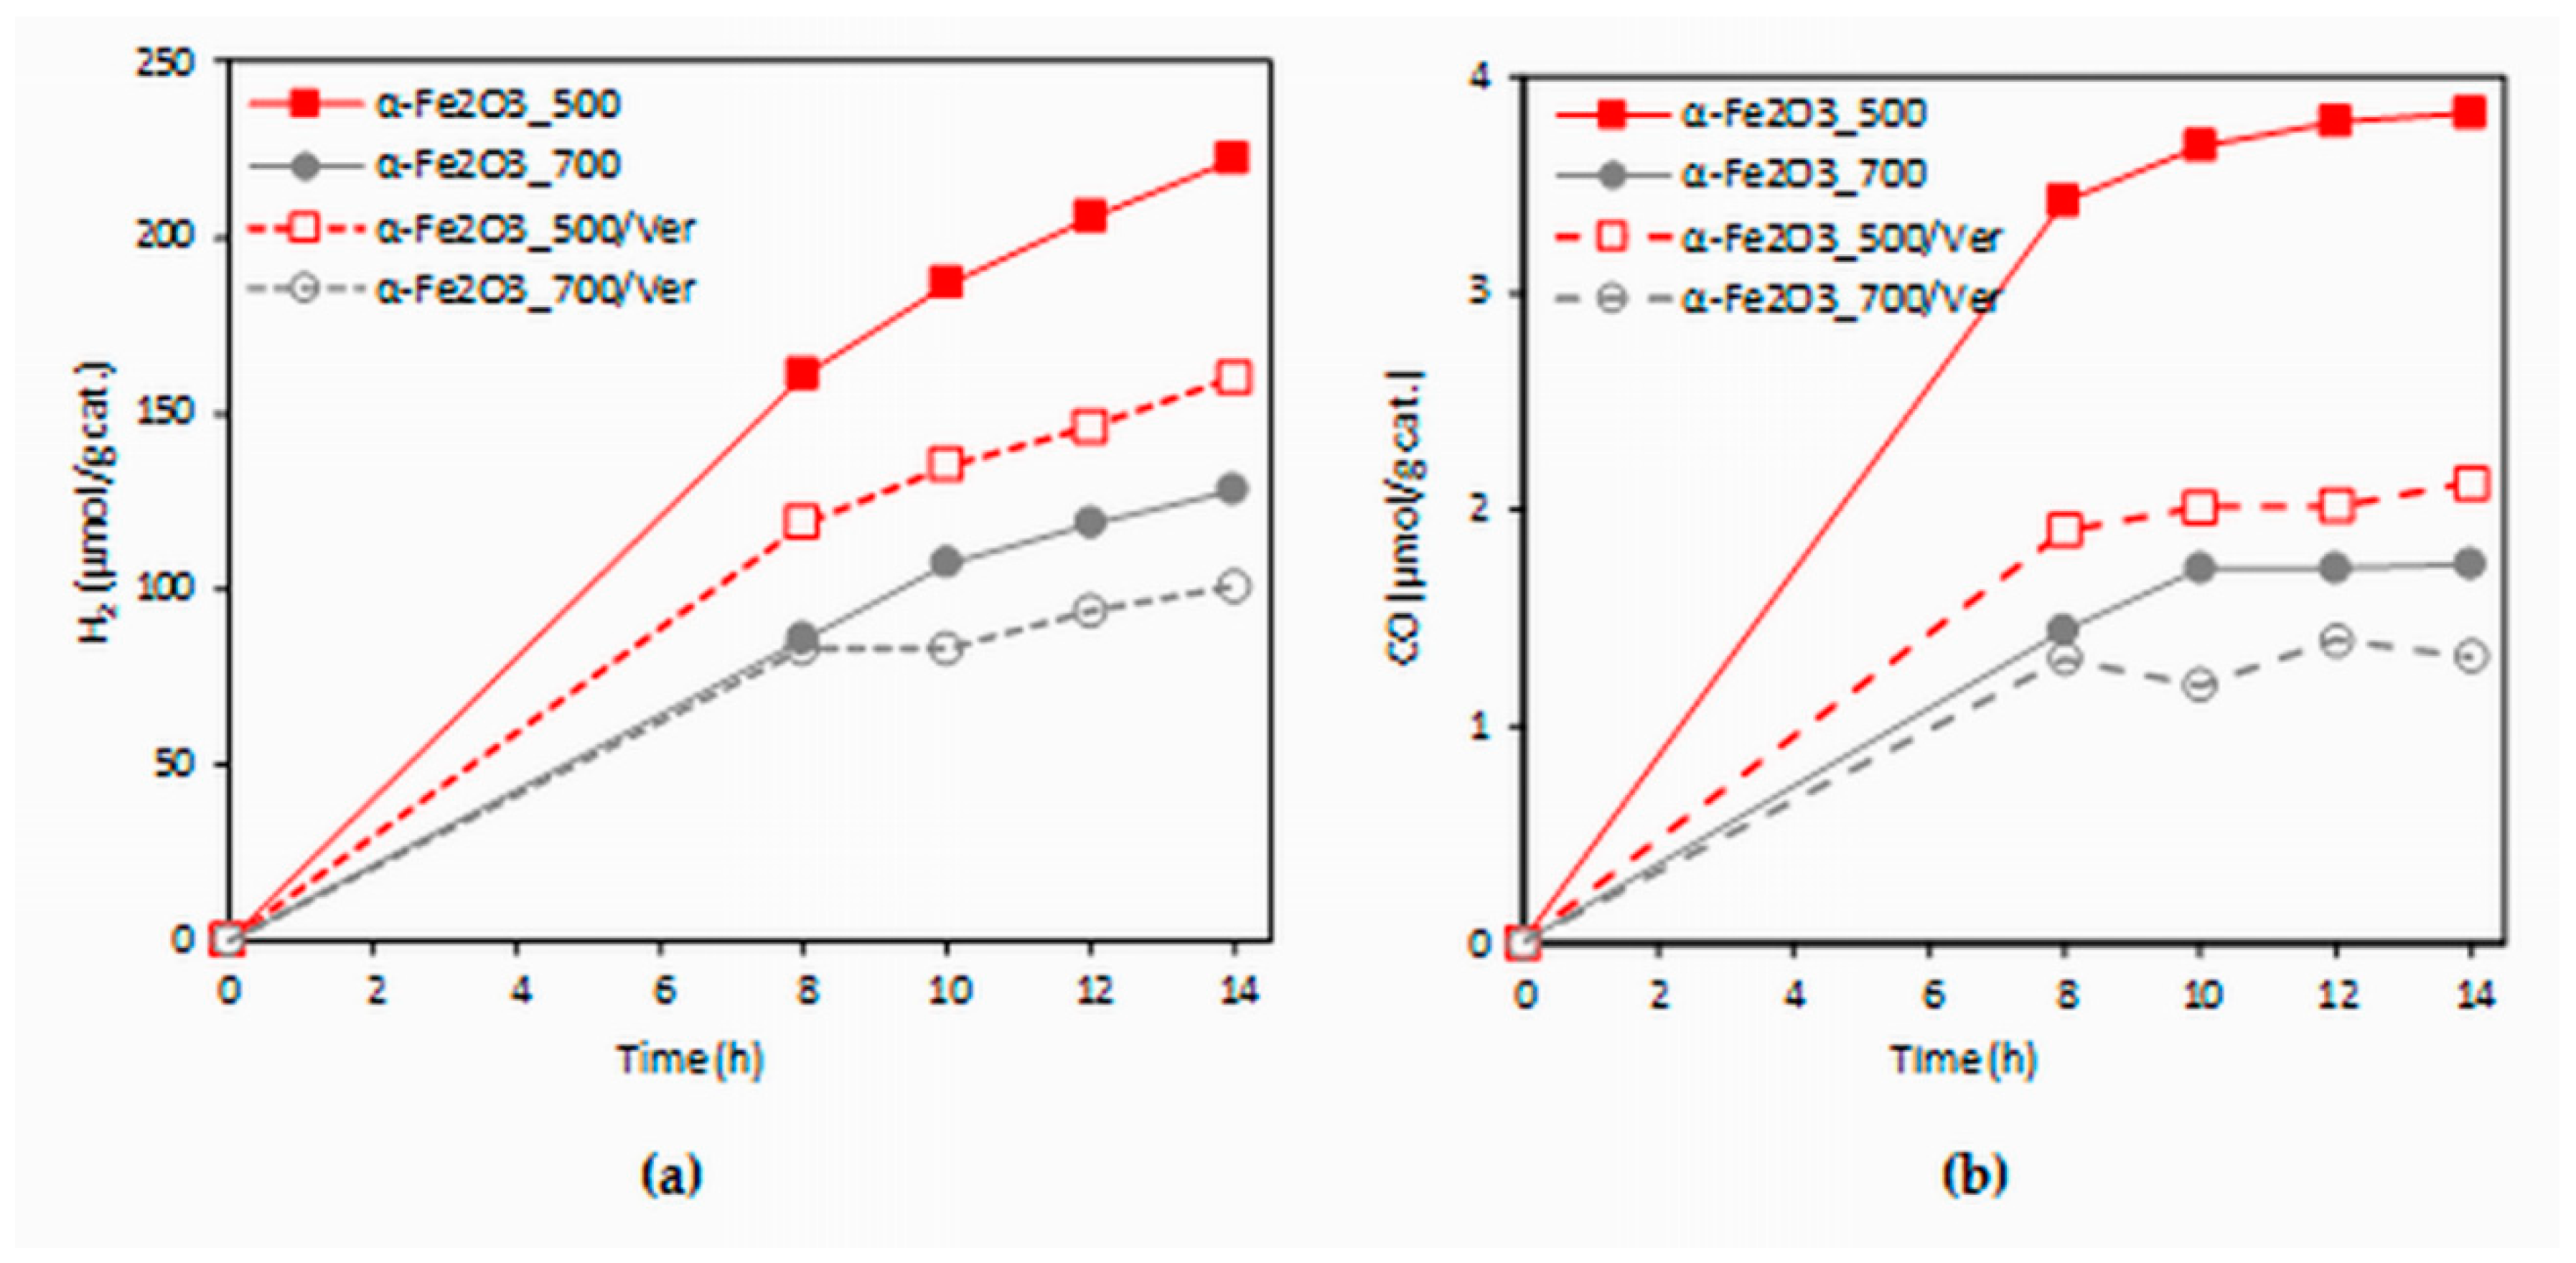
The dependence of hydrogen and carbon monoxide yields of the CO2 photocatalytic reduction on the irradiation time (0–14 h) in the present investigation is shown in Figure 9. The formation of hydrogen ranged in the order of 100 and carbon monoxide in the order of units of µmol/g. The yields of products increased with irradiation time. The photocatalysts were measured repeatedly and all photocatalysts proved the photocatalytic stability (changes in photocatalytic activity did not occur in repeated use, see Figure S2).
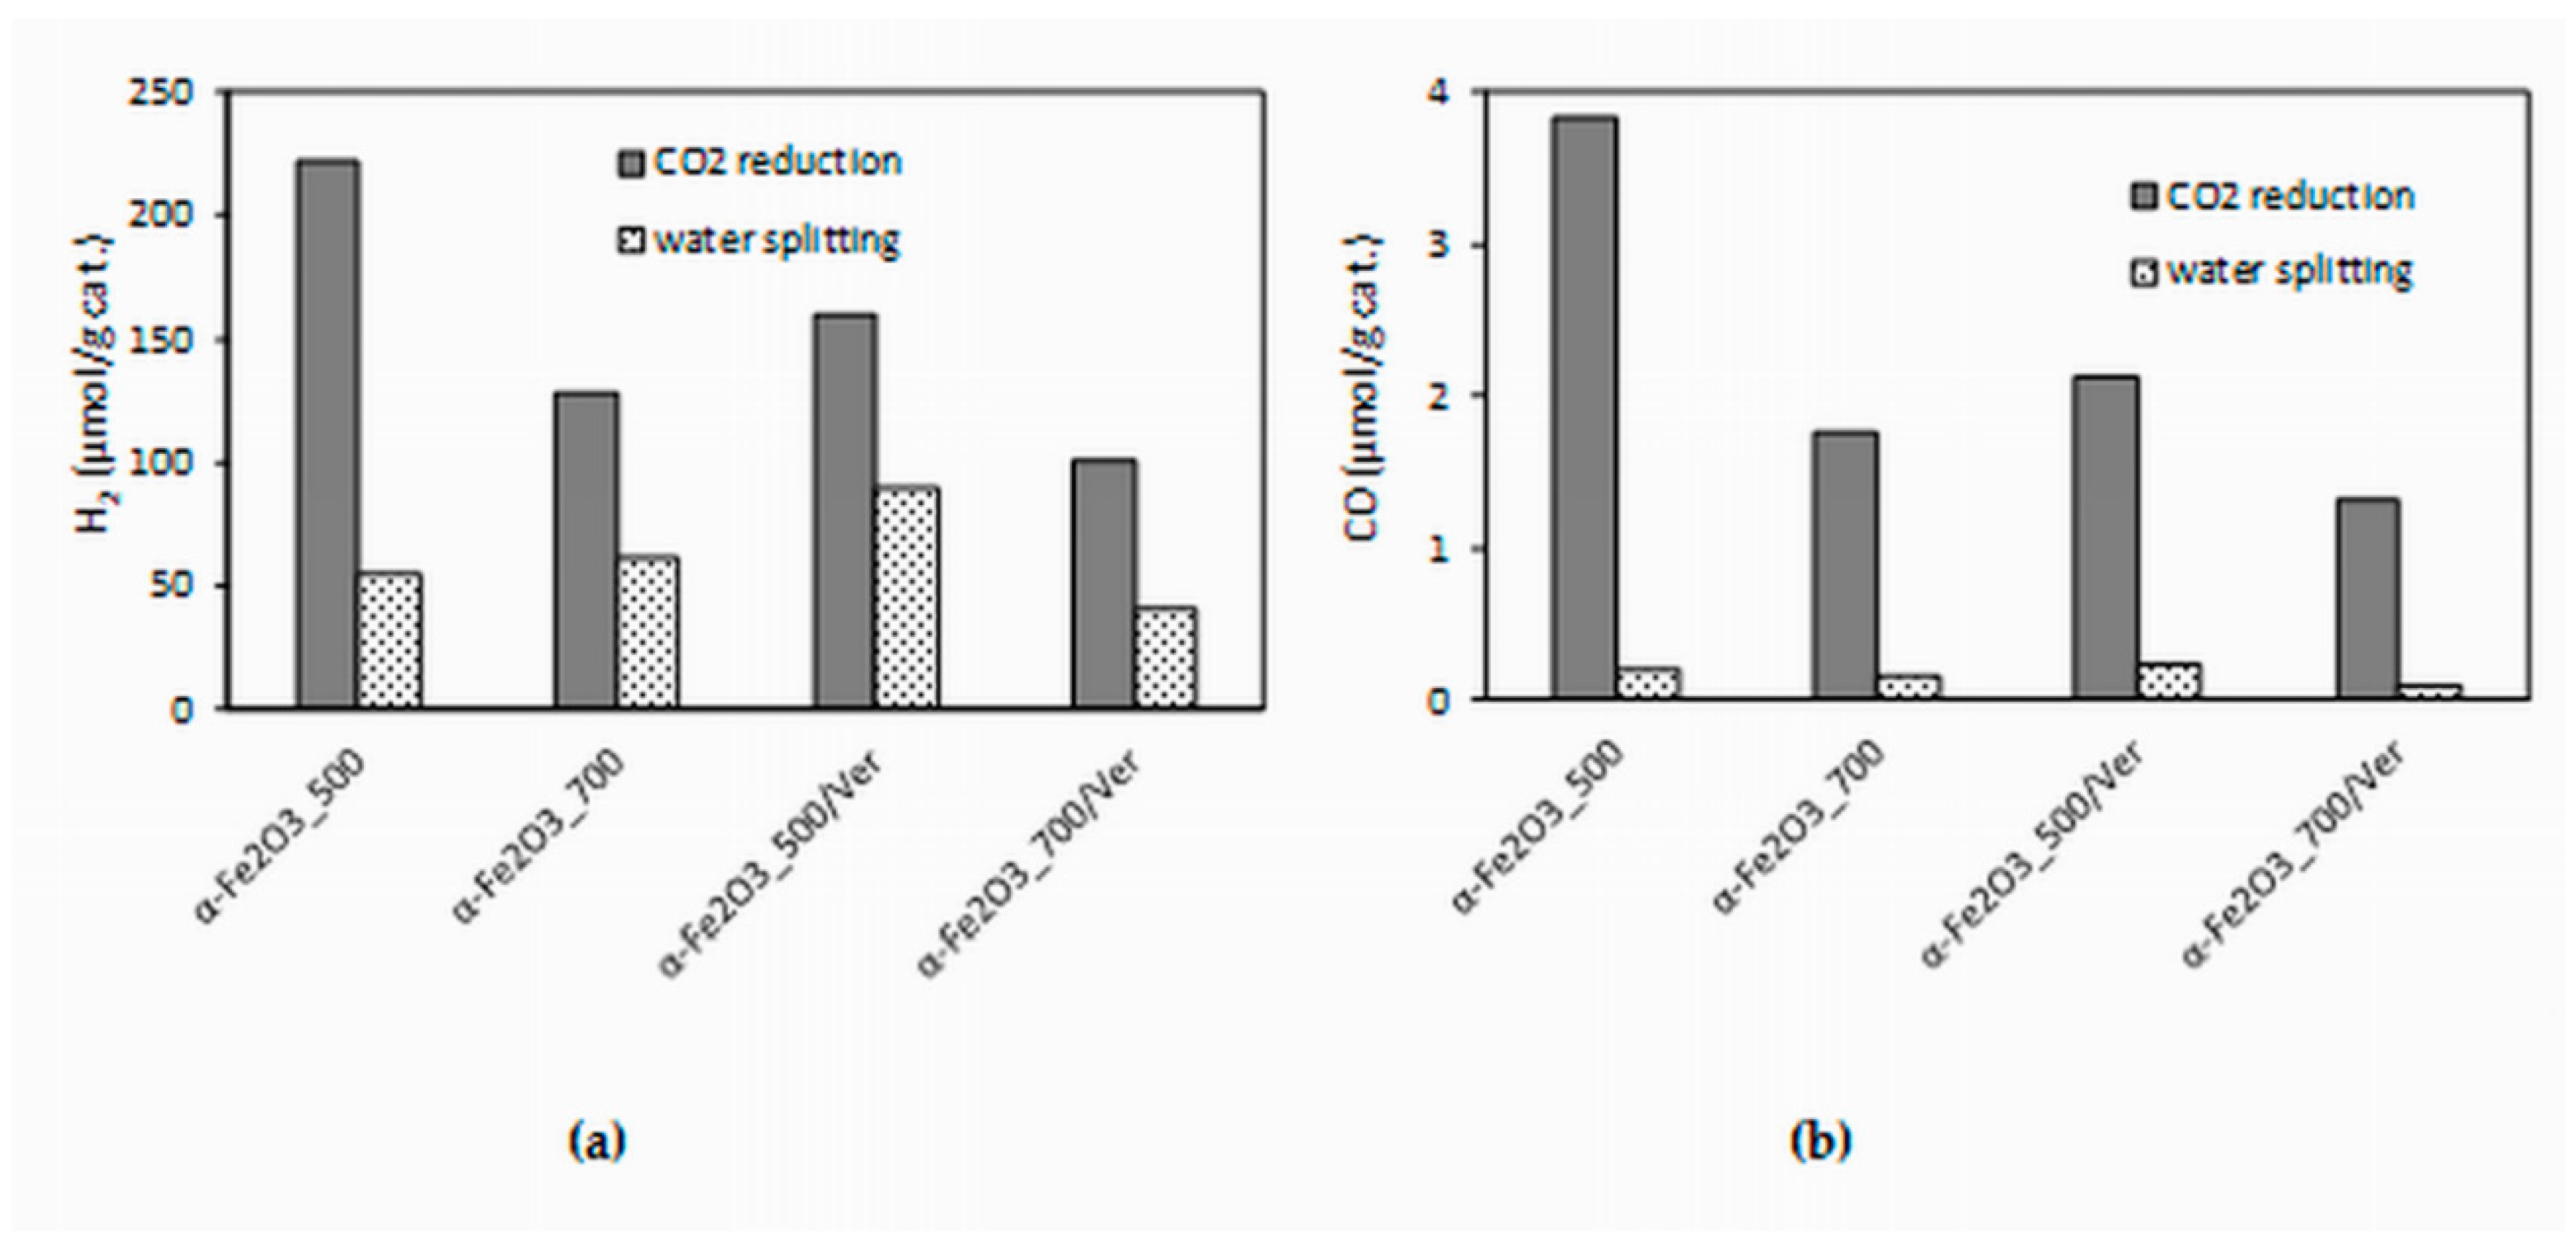
The experimental data from the longest irradiation time (14 h) were chosen for comparison, because all of the formed products yields were the most accurate. The effect of different photocatalysts on the yields of all products (hydrogen and carbon monoxide) is depicted in Figure 10. Both hydrogen yields and carbon monoxide yields in the presence of the α-Fe2O3_500 photocatalyst were almost twice as high as that of the α-Fe2O3_700 photocatalyst. Decrease of yields of products H2 and CO in the presence of α-Fe2O3_500/Ver was 28% and 44%, respectively. However, it is necessary to note that α-Fe2O3_500/Ver contained only 27.5% mass of α-Fe2O3. In view of this fact, the obtained results are promising.
The higher photocatalytic activity of α-Fe2O3_500 photocatalyst in comparison with α-Fe2O3_700 photocatalyst can be caused by a slightly higher specific surface area (25 m2/g and 17 m2/g, respectively) and smaller crystallite size (24 nm and 31 nm, respectively). Also, the amount of oxygen vacancies, which was higher in α-Fe2O3_500 photocatalyst, played a significant role (Figure 8).
The photocatalysis is based on the formation of generated electrons and holes under light irradiation. The generated electron can migrate from the valence band (VB) of the semiconductor to the conduction band (CB), leaving behind a hole in the VB. If these charges are separated, they can migrate to the surface of the semiconductor and participate in redox reaction with adsorbed species. For this reason, it is important to perceive the role of oxygen vacancies as electron acceptors during the photocatalytic reaction and temporary traps of electrons to decrease the recombination of electrons and holes [53].
4. Conclusions
In this study, α-Fe2O3 nanoparticles/vermiculite clay photocatalysts were prepared and characterized. The molecular simulation showed the space arrangement of the interlayer content in the optimized vermiculite models to be in good agreement with the experimental data. The photocatalytic activity of prepared photocatalysts decreased in the order α-Fe2O3_500 ˃ α-Fe2O3_500/Ver ˃ α-Fe2O3_700 ˃ α-Fe2O3_700/Ver. Higher photocatalytic activity was associated with smaller crystallite size, higher specific surface area and a higher amount of oxygen vacancies, promoting better separation of electrons and holes. Based on the correlation between physicochemical properties and the photocatalytic activity of the investigated photocatalysts, it can be concluded that calcination at 500 °C in comparison with calcining at 700 °C provides structural and optical properties of α-Fe2O3_500 and α-Fe2O3_500/Ver more suitable for photocatalytic applications.
Supplementary Materials
The following are available online at https://www.mdpi.com/1996-1944/12/11/1880/s1, Figure S1: Spectrum of the Hg lamp; Figure S2: Production of hydrogen during the photocatalytic reduction of CO2 in presence α-Fe2O3_500 in the three cycles.
Author Contributions
Conceptualization, M.V. and K.K.; methodology, M.V., K.K. and J.P.; software, J.T.; validation, M.V., K.K. and J.T.; formal analysis, M.V., K.K. and J.P.; investigation, T.P. (photocatalytic experiment), J.P. (PL and DRS UV-Vis analysis); resources, M.V.; data curation, M.V., K.K.; writing—original draft preparation, M.V.; writing—review and editing, M.V., K.K. and J.T.; supervision, M.V.; funding acquisition, K.K.
Funding
The work was supported from ERDF Institute of Environmental Technology—Excellent Research (No. CZ.02.1.01/0.0/0.0/16_019/0000853).
Acknowledgments
The authors thank Alexander Martaus for XRD data, Soňa Študentová for measuring specific surface area and Vladimír Tomášek for chemical analysis.
Conflicts of Interest
The authors declare no conflict of interest. The funders had no role in the design of the study; in the collection, analyses, or interpretation of data; in the writing of the manuscript, or in the decision to publish the results.
References
- Guggenheim, S.; Adams, J.M.; Bain, D.C.; Bergaya, F.; Brigatti, M.F.; Drits, V.A.; Formoso, M.L.L.; Galán, E.; Kogure, T.; Stanjek, H. Summary of recommendations of nomenclature committees relevant to clay mineralogy: Report of the association Internationale pour l’etude des argiles (AIPEA) nomenclature committee for 2006. Clay Clay Miner. 2006, 54, 761–772. [Google Scholar] [CrossRef]
- Brigatti, M.F.; Galan, E.; Theng, B.K.G. Structures and Mineralogy of Clay minerals. In Handbook of Clay Science; Bergaya, F., Theng, B.K.G., Lagaly, G., Eds.; Developments in Clay Science; Elsevier Ltd.: Amsterdam, The Netherlands, 2006; Volume 1, pp. 19–86. [Google Scholar]
- Zhou, C.H.; Keeling, J. Fundamental and applied research on clay minerals: From climate and environment to nanotechnology. Appl. Clay Sci. 2013, 274, 3–9. [Google Scholar] [CrossRef]
- Stucki, J. Properties and behaviour of iron in clay minerals. In Handbook of Clay Science; Bergaya, F., Theng, B.K.G., Lagaly, G., Eds.; Developments in Clay Science; Elsevier Ltd.: Amsterdam, The Netherlands, 2006; Volume 1, pp. 423–475. [Google Scholar]
- Neumann, A.; Olson, T.L.; Scherer, M.M. Spectroscopic evidence for Fe (II)–Fe (III) electron transfer at clay mineral edge and basal sites. Environ. Sci. Technol. 2013, 47, 6969–6977. [Google Scholar] [CrossRef] [PubMed]
- Alexandrov, V.; Rosso, K.M. Insights into the mechanism of Fe (II) adsorption and oxidation at Fe–clay mineral surfaces from first-principles calculations. J. Phys. Chem. C 2013, 117, 22880–22886. [Google Scholar] [CrossRef]
- Gorski, C.A.; Klüpfel, L.E.; Voegelin, A.; Sander, M.; Hofstetter, T.B. Redox properties of structural Fe in clay minerals: 3. Relationships between smectite redox and structural properties. Environ. Sci. Technol. 2013, 47, 13477–13485. [Google Scholar] [CrossRef] [PubMed]
- Oliveira, L.C.A.; Rios, R.V.R.A.; Fabris, J.D.; Sapag, K.; Garg, V.K.; Lago, R.M. Clay-iron oxide magnetic composites for the adsorption of contaminants in water. Appl. Clay Sci. 2003, 22, 169–177. [Google Scholar] [CrossRef]
- Son, Y.-H.; Lee, J.-K.; Soong, Y.; Martello, D.; Chyu, M. Structure–property correlation in iron oxide nanoparticle−clay hybrid materials. Chem. Mater. 2010, 22, 2226–2232. [Google Scholar] [CrossRef]
- Da Silva, D.C.; Skeff Neto, K.; Coaquira, J.A.H.; Araujo, P.P.; Cintra, D.O.S.; Lima, E.C.D.; Guilherme, L.R.; Mosiniewicz-Szablewska, E.; Morais, P.C. Magnetic characterization of vermiculite-based magnetic nanocomposites. J. Non Cryst. Solids 2010, 356, 2574–2577. [Google Scholar] [CrossRef]
- Gao, Z.; Lia, X.; Wu, H.; Zhao, S.; Deligeer, W.; Asuha, S. Magnetic modification of acid-activated kaolin: Synthesis, characterization, and adsorptive properties. Micropor. Mesopor. Mater. 2015, 202, 1–7. [Google Scholar] [CrossRef]
- Tao, L.X.; Zou, D.X. Clay-intercalated metal complex catalysts and their molecular recognition catalysis. Prog. Chem. 2002, 14, 200–206. [Google Scholar]
- Garrido-Ramírez, E.G.; Theng, B.K.G.; Moram, M.L. Clays and oxide minerals as catalysts and nanocatalysts in Fenton-like reactions—A review. Appl. Clay Sci. 2010, 47, 182–192. [Google Scholar] [CrossRef]
- Chen, J.; Xu, L.; Li, W.; Gou, X. α-Fe2O3 nanotubes in gas sensor and lithium-ion battery applications. Adv. Mater. 2005, 17, 582–586. [Google Scholar] [CrossRef]
- Khedr, M.H.; Bahgat, M.; Nasr, M.I.; Sedeek, E.K. CO2 decomposition over freshly reduced nanocrystalline Fe2O3. Colloid Surf. A Physicochem. Eng. Asp. 2007, 302, 517–524. [Google Scholar] [CrossRef]
- Nasibulin, A.G.; Rackauskas, S.; Jiang, H.; Tian, Y.; Mudimela, P.R.; Shandakov, S.D.; Nasibulina, L.I.; Sainio, J.; Kauppinen, E.I. Simple and rapid synthesis of α-Fe2O3 nanowires under ambient conditions. Nano Res. 2009, 2, 373–379. [Google Scholar] [CrossRef]
- Mishra, M.; Chun, D.-M. α-Fe2O3 as a photocatalytic material: A review. Appl. Catal. A Gen. 2015, 498, 126–141. [Google Scholar] [CrossRef]
- Cornell, R.M.; Schwertmann, U. The Iron Oxides: Structure, Properties, Reactions, Occurrences and Uses, 2nd ed.; Wiley-VCH: Weinheim, Germany, 2003. [Google Scholar]
- Apte, S.K.; Naik, S.D.; Sonawane, R.S.; Kale, B.B. Synthesis of nanosize-necked structure α- and γ-Fe2O3 and its photocatalytic activity. J. Am. Ceram. Soc. 2007, 90, 412–414. [Google Scholar] [CrossRef]
- Maji, S.K.; Mukherjee, N.; Mondal, A.; Adhikary, B. Synthesis, characterization and photocatalytic activity of α-Fe2O3 nanoparticles. Polyhedron 2012, 33, 145–149. [Google Scholar] [CrossRef]
- Sundaramurthy, J.; Kumar, P.S.; Kalaivani, M.; Thavasi, V.; Mhaisalkar, S.G.; Ramakrishna, S. Superior pohotocatalytic behavior of novel 1D nanobraid and nanoporous α-Fe2O3 structures. RSC Adv. 2012, 2, 8201–8208. [Google Scholar] [CrossRef]
- Fang, X.L.; Chen, C.H.; Jin, M.S.; Kuang, Q.; Xie, Z.X.; Xie, S.Y.; Huang, R.B.; Zheng, L.S. Single-crystal-like hematite colloidal nanocrystal clusters: Synthesis and applications in gas sensors, photocatalysis and water treatment. J. Mater. Chem. 2009, 19, 6154–6160. [Google Scholar] [CrossRef]
- Hosseini-Zori, M.; Taheri-Nassaj, E.; Mirhabibi, A.R. Effective factors on synthesis of the hematite-silica red inclusion pigment. Ceram. Int. 2008, 34, 491–496. [Google Scholar] [CrossRef]
- Lassoued, A.; Dkhil, B.; Gardi, A.; Ammar, S. Control of the shape and size of iron oxide (α-Fe2O3) nanoparticles synthesized through the chemical precipitation method. Results Phys. 2017, 7, 3007–3015. [Google Scholar] [CrossRef]
- Kim, I.H.; Seo, H.O.; Park, E.J.; Han, S.W.; Kim, Y.D. Low temperature CO oxidation over iron oxide nanoparticles decorating internal structures of a mesoporous alumina. Sci. Rep. 2017, 7, 40497. [Google Scholar] [CrossRef] [PubMed]
- Sugrañez, R.; Balbuena, J.; Cruz-Yusta, M.; Martín, F.; Morales, J.; Sánchez, L. Efficient behaviour of hematite towards the photocatalytic degradation of NOx gases. Appl. Catal. B Environ. 2015, 165, 529–536. [Google Scholar] [CrossRef]
- Low, J.; Cheng, B.; Yu, J. Surface modification and enhanced photocatalytic CO2 reduction performance of TiO2: A review. Appl. Surf. Sci. 2017, 392, 658–686. [Google Scholar] [CrossRef]
- Habisreutinger, S.N.; Schmidt-Mende, L.; Stolarczyk, J.K. Photocatalytic reduction of CO2 on TiO2 and other semiconductors. Angew. Chem. Int. Ed. 2013, 52, 7372–7408. [Google Scholar] [CrossRef] [PubMed]
- Li, K.; An, X.; Park, K.H.; Khraisheh, M.; Tang, J. A critical review of CO2 photoconversion: Catalysts and reactors. Catal. Today 2014, 224, 3–12. [Google Scholar] [CrossRef]
- Yuan, L.; Xu, Y.-J. Photocatalytic conversion of CO2 into value-added and renewable fuels. Appl. Surf. Sci. 2015, 342, 154–167. [Google Scholar] [CrossRef]
- Ola, O.; Maroto-Valer, M.M. Review of material design and reactor engineering on TiO2 photocatalysis for CO2 reduction. J. Photochem. Photobiol. C Photochem. Rev. 2015, 24, 16–42. [Google Scholar] [CrossRef]
- Shirozu, H.; Bailey, S.W. Crystal structure of a two-layer Mg-vermiculite. Am. Miner. 1966, 51, 1124–1143. [Google Scholar]
- Valášková, M.; Tokarský, J.; Hundáková, M.; Smetana, B. Role of vermiculite and zirconium–vermiculite on the formation of zircon–cordierite nanocomposites. Appl. Clay Sci. 2013, 75–76, 100–108. [Google Scholar] [CrossRef]
- Tokarský, J.; Čapková, P.; Rafaja, D.; Klemm, V.; Valášková, M.; Kukutschová, J.; Tomášek, V. Adhesion of silver nanoparticles on the clay substrates; modeling and experiment. Appl. Surf. Sci. 2010, 256, 2841–2848. [Google Scholar] [CrossRef]
- Mamulová Kutláková, K.; Tokarský, J.; Kovář, P.; Vojtěšková, S.; Kovářová, A.; Smetana, B.; Kukutschová, J.; Čapková, P.; Matějka, V. Preparation and characterization of photoactive composite kaolinite/TiO2. J. Hazard. Mater. 2011, 188, 212–220. [Google Scholar] [CrossRef] [PubMed]
- Mamulová Kutláková, K.; Tokarský, J.; Peikertová, P. Functional and eco-friendly nanocomposite kaolinite/ZnO with high photocatalytic activity. Appl. Catal. B Environ. 2015, 162, 392–400. [Google Scholar] [CrossRef]
- Rappé, A.K.; Goddard, W.A., III. Charge equilibration for molecular dynamics simulations. J. Phys. Chem. 1991, 95, 3358–3363. [Google Scholar] [CrossRef]
- Rappé, A.K.; Casewit, C.J.; Colwell, K.S.; Goddard, W.A., III; Skiff, W.M. UFF, a full periodic table force field for molecular mechanics and molecular dynamics simulations. J. Am. Chem. Soc. 1992, 114, 10024–10035. [Google Scholar] [CrossRef]
- Valášková, M.; Simha Martynková, G.; Kupková, J.; Seidlerová, J.; Tomášek, V.; Kočí, K.; Ritz, M.; Klemm, V.; Rafaja, D. Comparable study of vermiculites from four selected commercial deposits prepared with fixed ceria nanoparticles. Appl. Clay Sci. 2018, 151, 164–174. [Google Scholar] [CrossRef]
- Scherrer, P. Bestimmung der Grösse und der inneren Struktur von Kolloidteilchen mittels Röntgenstrahlen. Gött. Nachr. 1918, 2, 98–100. [Google Scholar]
- Klug, H.P.; Alexander, L.E. X-ray Diffraction Procedures for Polycrystalline and Amorphous Materials, 2nd ed.; Wiley & Sons: New York, NY, USA, 1974; pp. 618–708. [Google Scholar]
- Brindley, G.W. Order-disorder in clay mineral structures. In Crystal Structures of Clay Minerals and Their X-ray Identification; Brindley, G.W., Brown, G., Eds.; Mineral Society: London, UK, 1980; Volume 2, pp. 125–195. [Google Scholar]
- Tokarský, J.; Čapková, P.; Burda, J. Structure and stability of kaolinite/TiO2 nanocomposite: DFT and MM computations. J. Mol. Model. 2012, 18, 2689–2698. [Google Scholar] [CrossRef] [PubMed]
- Torrent, J.; Barrón, V. Diffuse reflectance spectroscopy of iron oxides. Encycl. Surf. Colloid Sci. 2002, 1, 1438–1446. [Google Scholar]
- Yamanoi, Y.; Nakashima, S.; Katsura, M. Temperature dependence of reflectance spectra and color values of hematite by in situ, high-temperature visible micro-spectroscopy. Am. Miner. 2009, 94, 90–97. [Google Scholar] [CrossRef]
- Kubelka, P.; Munk, F. Ein Beitrag zur Optik der Farbanstriche. Zeitschrift für Technische Physik 1931, 12, 593–601. [Google Scholar]
- Mathevula, L.E.; Noto, L.L.; Mothudi, B.M.; Chithambo, M.; Dhlamini, M.S. Structural and optical properties of sol-gel derived α-Fe2O3 nanoparticles. J. Lumin. 2017, 192, 879–887. [Google Scholar] [CrossRef]
- Vayssieres, L.; Sathe, C.; Butorin, S.M.; Shuh, D.K.; Nordgren, J.; Guo, J. One-dimensional quantum-confinement effect in α-Fe2O3 ultrafine nanorod arrays. Adv. Mater. 2005, 17, 2320–2323. [Google Scholar] [CrossRef]
- Valášková, M.; Martynková, G.S. Vermiculite: Structural properties and examples of the use. In Clay Minerals in Nature—Their Characterization, Modification and Application; Valášková, M., Martynková, G.S., Eds.; InTech: Rijeka, Croatia, 2012; pp. 209–238. [Google Scholar]
- Wheeler, D.A.; Wang, G.; Ling, Y.; Li, Y.; Zhang, J.Z. Nanostructured hematite: Synthesis, characterization, charge carrier dynamics, and photoelectrochemical properties. Energy Environ. Sci. 2012, 5, 6682–6702. [Google Scholar] [CrossRef]
- Mahadik, M.A.; Shinde, S.S.; Mohite, V.S.; Kumbhar, S.S.; Rajpure, K.Y.; Moholkar, A.V.; Bhosale, C.H. Photoelectrocatalytic activity of ferric oxide nanocatalyst: A synergestic effect of thickness. Ceram. Int. 2014, 40, 9463–9471. [Google Scholar] [CrossRef]
- Zhu, J.; Zheng, W.; He, B.; Zhang, J.; Anpo, M. Characterization of Fe–TiO2 photocatalysts synthesized by hydrothermal method and their photocatalytic reactivity for photodegradation of XRG dye diluted in water. J. Mol. Catal. A Chem. 2004, 216, 35–43. [Google Scholar] [CrossRef]
- Ansari, S.A.; Khan, M.M.; Kalathil, S.; Nisar, A.; Lee, J.; Cho, M.H. Oxygen vacancy induced band gap narrowing of ZnO nanostructures by an electrochemically active biofilm. Nanoscale 2013, 5, 9238–9246. [Google Scholar] [CrossRef] [PubMed]
Figure 1.
XRD patterns of α-Fe2O3 and α-Fe2O3/Ver samples calcined at 500 °C and 700 °C (peaks of α-Fe2O3 are marked by asterisk).
Figure 1.
XRD patterns of α-Fe2O3 and α-Fe2O3/Ver samples calcined at 500 °C and 700 °C (peaks of α-Fe2O3 are marked by asterisk).

Figure 2.
Lattice parameters a vs. c of α-Fe2O3 calculated for studied samples and in PDF cards: No. 00-033-0664 (1), No. 01-079-0007 (2), No. 01-076-4579 (3), No.01-089-0599 (4), No. 00-001-1053 (5) and No. 01-089-8103 (6).
Figure 2.
Lattice parameters a vs. c of α-Fe2O3 calculated for studied samples and in PDF cards: No. 00-033-0664 (1), No. 01-079-0007 (2), No. 01-076-4579 (3), No.01-089-0599 (4), No. 00-001-1053 (5) and No. 01-089-8103 (6).

Figure 3.
Backscattered electron (BSE) images: (a) α-Fe2O3 nanoparticles after precipitation in water solution and an aqueous dispersion of vermiculite (sample α-Fe2O3_700/Ver) calcined at 700 °C; (b) EDS maps of elements Fe, K and Na on the surface of vermiculite flake α-Fe2O3_700/Ver.
Figure 3.
Backscattered electron (BSE) images: (a) α-Fe2O3 nanoparticles after precipitation in water solution and an aqueous dispersion of vermiculite (sample α-Fe2O3_700/Ver) calcined at 700 °C; (b) EDS maps of elements Fe, K and Na on the surface of vermiculite flake α-Fe2O3_700/Ver.

Figure 4.
Four models of vermiculite interlayer space arrangement: (a) corresponding to the basal distance c = 14.4 Å; (b) corresponding to the basal distance c = 12.1 Å; (c) corresponding to the basal distance c = 9.9 Å in vermiculite thermally treated at 500 °C and 700 °C; (d) Model of a single 2:1 layer showing the positions of atoms in the tetrahedral (T) and octahedral (O) sheets. The color legend for all atoms occurring in the models is below the image.

Figure 5.
Optimized structure models of: (a) α-Fe2O3(012)/VER(001), (b) α-Fe2O3(104)/VER(001), (c) α-Fe2O3(012)/VER(100), and (d) α-Fe2O3(104)/VER(100).
Figure 5.
Optimized structure models of: (a) α-Fe2O3(012)/VER(001), (b) α-Fe2O3(104)/VER(001), (c) α-Fe2O3(012)/VER(100), and (d) α-Fe2O3(104)/VER(100).

Figure 6.
Diffuse reflectance spectra of pure α-Fe2O3 nanoparticles and α-Fe2O3 nanoparticles/Ver samples for different temperatures.
Figure 6.
Diffuse reflectance spectra of pure α-Fe2O3 nanoparticles and α-Fe2O3 nanoparticles/Ver samples for different temperatures.

Figure 7.
Tauc plot of (αhν)2 versus photon energy (hν) for pure α-Fe2O3 nanoparticles and α-Fe2O3 nanoparticles/Ver samples at 500 °C and 700 °C.
Figure 7.
Tauc plot of (αhν)2 versus photon energy (hν) for pure α-Fe2O3 nanoparticles and α-Fe2O3 nanoparticles/Ver samples at 500 °C and 700 °C.

Figure 8.
Photoluminescence spectra for α-Fe2O3 nanoparticles pure and attached on vermiculite annealed at 500 °C and 700 °C.
Figure 8.
Photoluminescence spectra for α-Fe2O3 nanoparticles pure and attached on vermiculite annealed at 500 °C and 700 °C.

Figure 9.
Time dependence of yields of: (a) H2 and (b) CO during the CO2 photocatalytic reduction in the presence of investigated photocatalysts.
Figure 9.
Time dependence of yields of: (a) H2 and (b) CO during the CO2 photocatalytic reduction in the presence of investigated photocatalysts.

Figure 10.
Dependence of yields of: (a) H2 and (b) CO (after 14 h of irradiation) during CO2 photocatalytic reduction and water splitting in the presence of investigated photocatalysts.
Figure 10.
Dependence of yields of: (a) H2 and (b) CO (after 14 h of irradiation) during CO2 photocatalytic reduction and water splitting in the presence of investigated photocatalysts.


Table 1.
α-Fe2O3 nanoparticles: the mean coherent crystallite size and lattice parameters.
| Sample | Crystallite Size D (nm) | Lattice a (Å) | Parameters c (Å) |
|---|---|---|---|
| α-Fe2O3_500 | 24 ± 2 | 5.025 ± 0.008 | 13.734 ± 0.040 |
| α-Fe2O3_700 | 31 ± 3 | 5.024 ± 0.008 | 13.732 ± 0.038 |
| α-Fe2O3_500/Ver | 23 ± 1 | 5.027 ± 0.009 | 13.727 ± 0.046 |
| α-Fe2O3_700/Ver | 30 ± 1 | 5.023 ± 0.008 | 13.733 ± 0.043 |
Table 2.
Total potential energies (Etot) and binding energies (Eb) for optimized α-Fe2O3/vermiculite models. Energies are expressed in kcal/mol.
Table 2.
Total potential energies (Etot) and binding energies (Eb) for optimized α-Fe2O3/vermiculite models. Energies are expressed in kcal/mol.
| Model | Etot | Eb |
|---|---|---|
| α-Fe2O3(012)/VER(001) | −212,431 | −10,996 |
| α-Fe2O3(104)/VER(001) | −210,605 | −8202 |
| α-Fe2O3(012)/VER(100) | −209,979 | −7779 |
| α-Fe2O3(104)/VER(100) | −210,931 | −6928 |
Table 3.
Band gap energies (Bg) and specific surface area (SBET) of the studied samples.
| Sample | Bg (eV) | SBET (m2g−1) |
|---|---|---|
| α-Fe2O3_500 | 1.93 | 25 |
| α-Fe2O3_700 | 1.88 | 17 |
| α-Fe2O3_500/Ver | 1.49 | 59 |
| α-Fe2O3_700/Ver | 1.94 | 30 |
© 2019 by the authors. Licensee MDPI, Basel, Switzerland. This article is an open access article distributed under the terms and conditions of the Creative Commons Attribution (CC BY) license (http://creativecommons.org/licenses/by/4.0/).
Share and Cite
MDPI and ACS Style
Valášková, M.; Tokarský, J.; Pavlovský, J.; Prostějovský, T.; Kočí, K. α-Fe2O3 Nanoparticles/Vermiculite Clay Material: Structural, Optical and Photocatalytic Properties. Materials 2019, 12, 1880. https://doi.org/10.3390/ma12111880
AMA Style
Valášková M, Tokarský J, Pavlovský J, Prostějovský T, Kočí K. α-Fe2O3 Nanoparticles/Vermiculite Clay Material: Structural, Optical and Photocatalytic Properties. Materials. 2019; 12(11):1880. https://doi.org/10.3390/ma12111880
Chicago/Turabian StyleValášková, Marta, Jonáš Tokarský, Jiří Pavlovský, Tomáš Prostějovský, and Kamila Kočí. 2019. "α-Fe2O3 Nanoparticles/Vermiculite Clay Material: Structural, Optical and Photocatalytic Properties" Materials 12, no. 11: 1880. https://doi.org/10.3390/ma12111880
Note that from the first issue of 2016, this journal uses article numbers instead of page numbers. See further details here.