Article

Social Valuation of Mediterranean Cultural Landscapes: Exploring Landscape Preferences and Ecosystem Services Perceptions through a Visual Approach

by
Íñigo Bidegain
1,2,3,
César A. López-Santiago
1,4,*,
José A. González
1,4,
Rodrigo Martínez-Sastre
1,
Federica Ravera
5,6 and
Claudia Cerda
2
1
Social-Ecological Systems Laboratory, Department of Ecology, Universidad Autónoma de Madrid, c. Darwin 2, Edificio de Biología, 28049 Madrid, Spain
2
Faculty of Forest Sciences and Conservation of Nature, Universidad de Chile, Av. Santa Rosa 11315, La Pintana, Santiago 8820808, Chile
3
Instituto de Ciencias Naturales, Universidad de las Américas, Av. 5 de abril 0620, Maipú, Santiago 9251454, Chile
4
Centro de Investigación en Biodiversidad y Cambio Global (CIBC-UAM), Universidad Autónoma de Madrid, c. Darwin 2, 28049 Madrid, Spain
5
Departament de Geografía, Universitat de Girona, Edifici Sant Domènec II, Pl. Ferrater i Mora 1, Campus Barri Vell, 17004 Girona, Spain
6
Càtedra en Agroecologia i Sistemes agroalimentaris, Universitat de Vic—Universitat Central de Catalunya, C/de la Laura, 13, Vic, 08500 Girona, Spain
*
Author to whom correspondence should be addressed.
Land 2020, 9(10), 390; https://doi.org/10.3390/land9100390
Submission received: 19 September 2020 / Revised: 9 October 2020 / Accepted: 11 October 2020 / Published: 14 October 2020
(This article belongs to the Special Issue Landscape Transformation and Changes in Land Use Intensity)

Abstract

:
Mediterranean cultural landscapes have been recognized as multifunctional landscapes that are currently threatened by two opposing trends: rural abandonment and agricultural intensification. Uncovering people’s perceptions of different landscape configurations, and how inhabitants value the contributions of nature to human wellbeing, is essential to understanding current landscape trends. In this study, we analyze the social perception of the cultural landscapes of Sierra Morena (Andalusia, Spain) based on 389 face-to-face visual questionnaires in an attempt to understand individuals’ landscape preferences, the reasons behind those preferences and how those landscapes are perceived as suppliers of ecosystem services by different groups of stakeholders. Four groups of stakeholders were identified that differed in how they perceive and value the cultural landscape. An urban-related group was characterized by their preferences for pine plantations and “green” landscapes, guided mostly by aesthetic criteria. A livestock-related group showed a clear preference for wood–pasture landscapes (dehesas) due to their ability to supply multiple ecosystem services. An environmentally aware group showed preferences for dehesas and Mediterranean forests, mainly guided by ecological criteria. Finally, an olive-related group showed a clear preference for olive grove landscapes as key for the regional economy and their cultural identity. Overall, the local inhabitants of Sierra Morena perceived a higher supply of ecosystem services in moderately disturbed landscapes, such as dehesas and mosaic landscapes, than in highly disturbed ones, such as conventional olive groves and pine plantations, or in less used landscapes, such as the Mediterranean forest. Understanding the differences in valuation/demand for ecosystem services among groups of stakeholders, characterized by their landscape preferences, provides important information with which to identify potential trade-offs and conflicts, thereby providing insights into the improvement of landscape planning and decision making.

Graphical Abstract

1. Introduction

Cultural landscapes worldwide are considered as complex social-ecological systems resulting from a millennial interplay between people and nature. The connections built over time between humans and the environment are physical, cultural and mental and occur among the body, mind, emotions, action and ecosystem functions [1]. These links have been particularly critical in Mediterranean cultural landscapes, where local people have managed to maintain productive activities balanced with ecosystem functions and biodiversity conservation [2] across millennia [3]. In search of a sustainable balance, feedback loops of mutual adaptation have been shaped [4,5], giving these systems social and ecological resilience. However, this degree of interdependence requires an ongoing review of the social-ecological interactions that have emerged from local people’s experience, because such interactions shape cultural identities and drive land management choices to maximize human wellbeing [6]. Failure to recognize these interrelations could lead to conflicts between local stakeholders and land managers.
Mediterranean cultural landscapes have been recognized as multifunctional landscapes [7], i.e., landscapes that integrate ecological functioning and human production activities while maintaining ecosystem services supply and biodiversity [8]. Currently, two opposing trends threaten the integrity and historical multifunctionality of former Mediterranean cultural landscape mosaics: rural abandonment and agricultural intensification [9]. Since the second half of the 20th century, the globalization of food markets and prices has forced an industrialized intensification of traditional farming, fostered by European agricultural policies, with a tendency to exclude the values, attitudes and meanings underlying farmers’ land use practices from the decision making on landscape management [10]. Additionally, in the last decades of the 20th century, a rural exodus to the big cities took place that has increased the abandonment of traditional activities. As a result, traditional agro-ecosystems such as extensive wood–pasture landscapes (dehesas) have been progressively abandoned because of a lack of management, while olive groves or vineyards have become agrochemically intensified and mechanized. Such prevailing transformations of Mediterranean cultural landscapes endanger their multifunctionality, eroding the contributions of nature to human wellbeing—i.e., ecosystem services—particularly those related to ecosystem regulating and cultural services [11,12,13]. Furthermore, the Common Agricultural Policy (CAP) of the European Union has driven the intensification of agriculture towards agribusiness models, promoting the simplification and specialization of agroecosystems through the decline in landscape heterogeneity, the increased use of chemicals per unit area, and the abandonment of less fertile areas. In combination, these processes have eroded the quantity and quality of habitats and thus decreased biodiversity and the abundance of species [14,15].
As a response, recent EU policies have been designed to build management strategies focused on the conservation and maintenance of European landscapes as a means to support sustainability. Thus, current environmental policies are increasingly recognizing the diverse contributions of biodiversity and ecosystems to human wellbeing [16]. For this purpose, it is important to mention the mainstreaming of two conceptual approaches: (1) the European Landscape Convention [17], which defined landscape as “an area as perceived by people, whose character is the result of the action and interaction of natural and human factors”; and (2) the conceptual framework of ecosystem services [18,19,20,21]. For two decades, robust approaches to the valuation of ecosystem services have been applied worldwide (e.g., Millennium ecosystem assessment (MEA) and The Economics of Ecosystems and Biodiversity (TEEB), increasing social awareness of the contributions of nature to human wellbeing. Ecosystem services assessment experienced an important systematization and actualization after the creation of the Intergovernmental Science-Policy Platform on Biodiversity and Ecosystem Services (IPBES) [21,22]. Both conceptual frameworks converge in considering landscape as a joint system of culture and environment vital to human wellbeing, as do many other approaches that mainstream the social-ecological systems perspective on sustainability [23]. The usefulness of joining the cultural landscapes paradigm with ecosystem services approaches to improve the sustainability of environmental decision making has been fully recognized [24,25,26]. Therefore, cultural landscape conservation policy should include an assessment of human perceptions and cultural contributions to sustainability to guarantee the commitment of local land owners and to motivate community engagement [27].
Initial research on ecosystem services was dominated by economic and biophysical perspectives that focused predominantly on those services that were easy to measure and under the lens of single research disciplines [28], usually linked to instrumental values. Sometimes, that meant overlooking people’s values and worldviews, thereby neglecting important cultural and psycho-social processes in human–environment relationships [29,30,31]. Research has highlighted the importance of considering the values, perceptions and preferences of local stakeholders to incorporate them into decision-making processes [32]. A current challenge of research on ecosystem services is to respond to local communities that demand inclusive research that incorporates meaningful information about values and preferences beyond monetary estimations. Recognizing the multiple value dimensions of an ecosystem has motivated the emergence of several methodologies and frameworks highlighting the importance of so-called “relational values”, defined as “preferences, principles, and virtues associated with relationships, both interpersonal and as articulated by policies and social norms” [33]. In cultural landscapes, the local stakeholders are not just users of the ecosystem services but also “sculptors” and keepers, and therefore, identifying how they perceive the landscape functioning and their preferences regarding landscape management should be considered [34]. These types of information are critical to understanding the social dynamics behind landscape management and could be used to identify winners and losers in different landscape management scenarios [35].
To address such challenges, in this study, we focus on the Mediterranean cultural landscape of Sierra Morena (Andalusia, Spain) to conduct a visual enquiry of local people’s preferences regarding their cultural landscape and their own appraisal of the ecosystem services delivered by different land uses and landscape configurations. This approach is based on the assumption that visual processes are key and predominant in connecting humans and ecosystems, as image-based methods are a universally understandable language that is thus useful to elicit landscape social perception [36,37,38]. To uncover the environmental values of local stakeholders, we choose visual methods as a recognized tool for landscape perception research [39] to communicate experiences that are difficult to verbalize and to promote participants’ self-awareness, as such methods are already used in Mediterranean cultural landscapes [38,40,41]. Visual methods are an effective way to evoke local people’s affordances, based on the assumption that images are strongly involved in embodied relations among mind, body, culture and environment [42,43].
Specifically, our study focuses on (1) the motivations behind the landscape preferences of local people and experts that reveal different embodied relations with the environment; (2) the sociocultural variables explaining those different landscape preferences, which could define groups of stakeholders by their perceptions; (3) understanding how stakeholders appraise the ecosystem services delivered by current local land uses with different degrees of transformation; and (4) identifying the potential trade-offs and synergies among stakeholders’ affinities for ecosystem services.

2. Materials and Methods

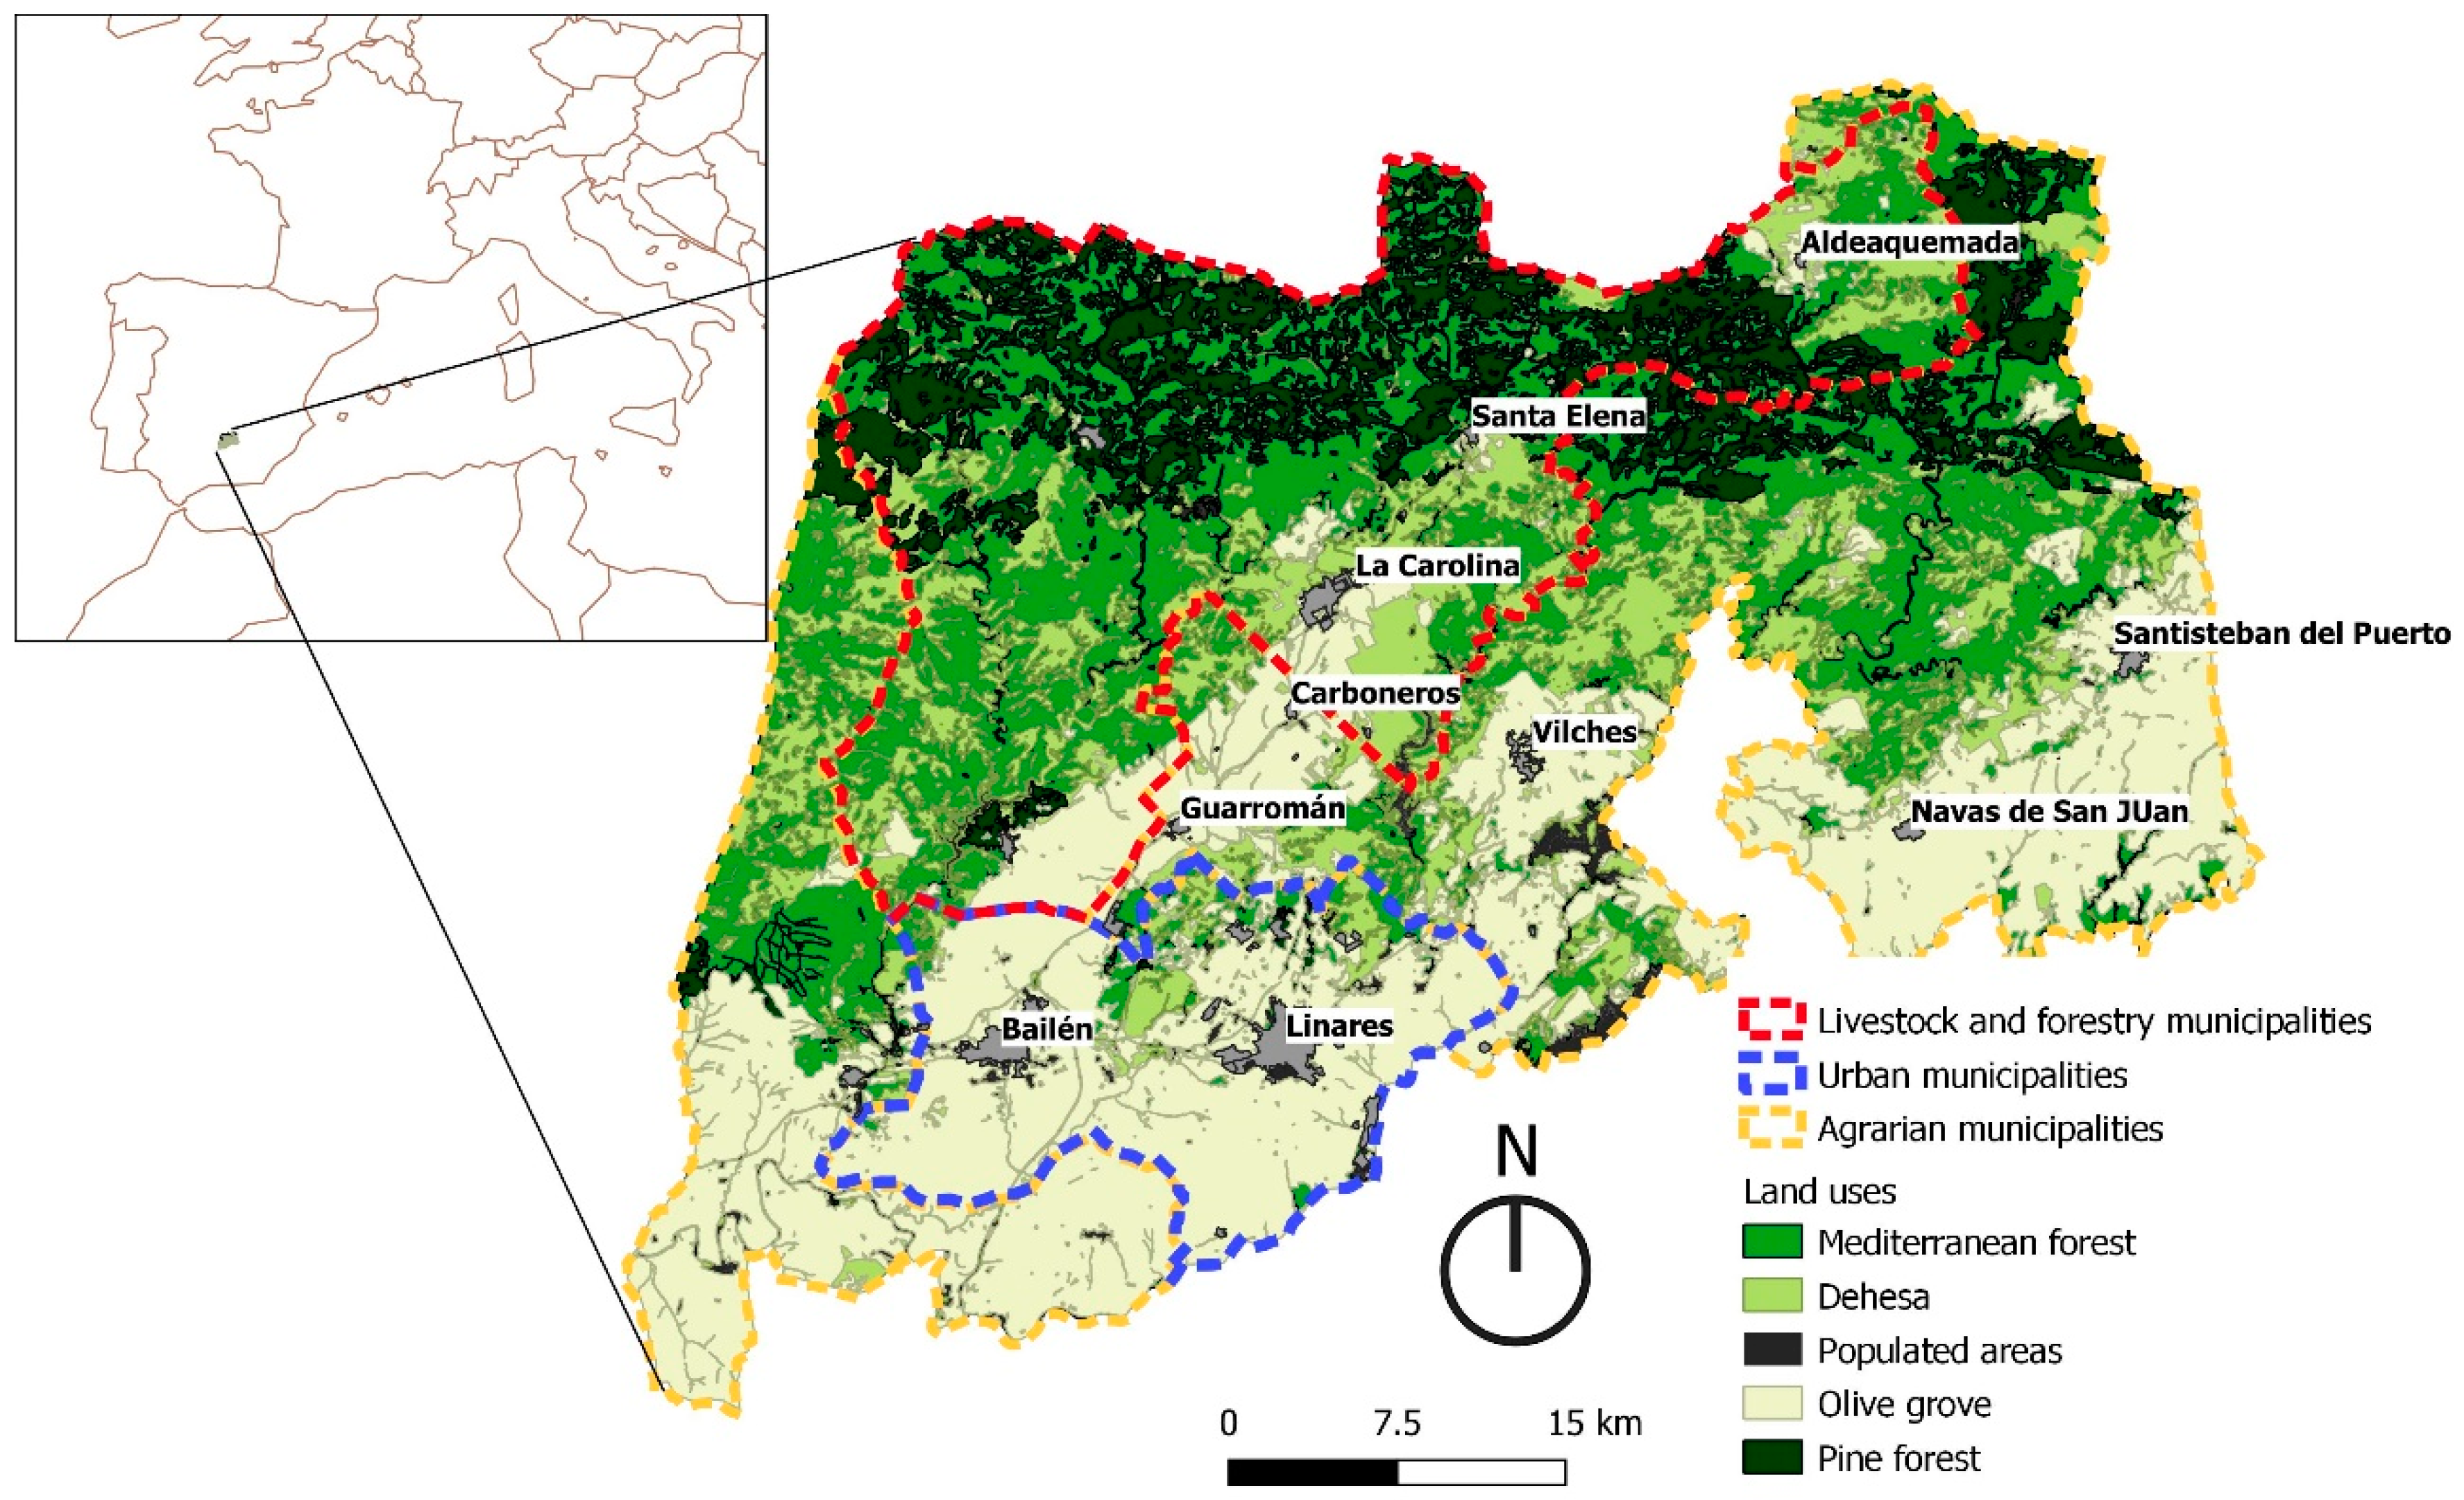
2.1. Study Area and Social-Ecological Sectorization

Sierra Morena is a mountain range formed by the rocky steppe that limits the Spanish central plateau (Castilla-La Mancha), with the valley of the Guadalquivir River (Andalusia) to the south. It is a unique region for its exceptional cultural landscape that remained largely inaccessible until the second half of the 20th century. The area is characterized by a great variety of agrarian, livestock and forestry uses that comprise a multifunctional landscape mosaic. The case study is located at the eastern part of the mountain range, known as Sierra Morena Oriental.
Three river basins, the Rumblar, Guarrizas and Guadiel Rivers (all tributaries of the Guadalquivir River), delimit the biophysical subsystem zonification. The limits of the socioeconomic subsystem comprise 14 municipalities (124,804 inhabitants) as the basic units of landscape management and sociodemographic data in Spain. Based on several social, economic and ecological data (Tables S1–S3 and Figure S1), we identified three socioecological sectors for the sampling design of different landscape types associated with socioeconomic conditions and daily experience in terms of perception and action (Figure 1):
  • Social-ecological sector 1 (hereafter, “livestock and forestry municipalities”), including municipalities characterized by hilly landscapes with forest, meadows and dehesas. This sector has more surface included in protected areas.
  • Social-ecological sector 2 (hereafter, “urban municipalities”), characterized by a larger population density linked to small-medium cities, located in an olive-grove landscape matrix and with population mostly involved in the service sector.
  • Social-ecological sector 3 (hereafter, “agrarian municipalities”), including municipalities characterized by agricultural activities linked to olive groves.

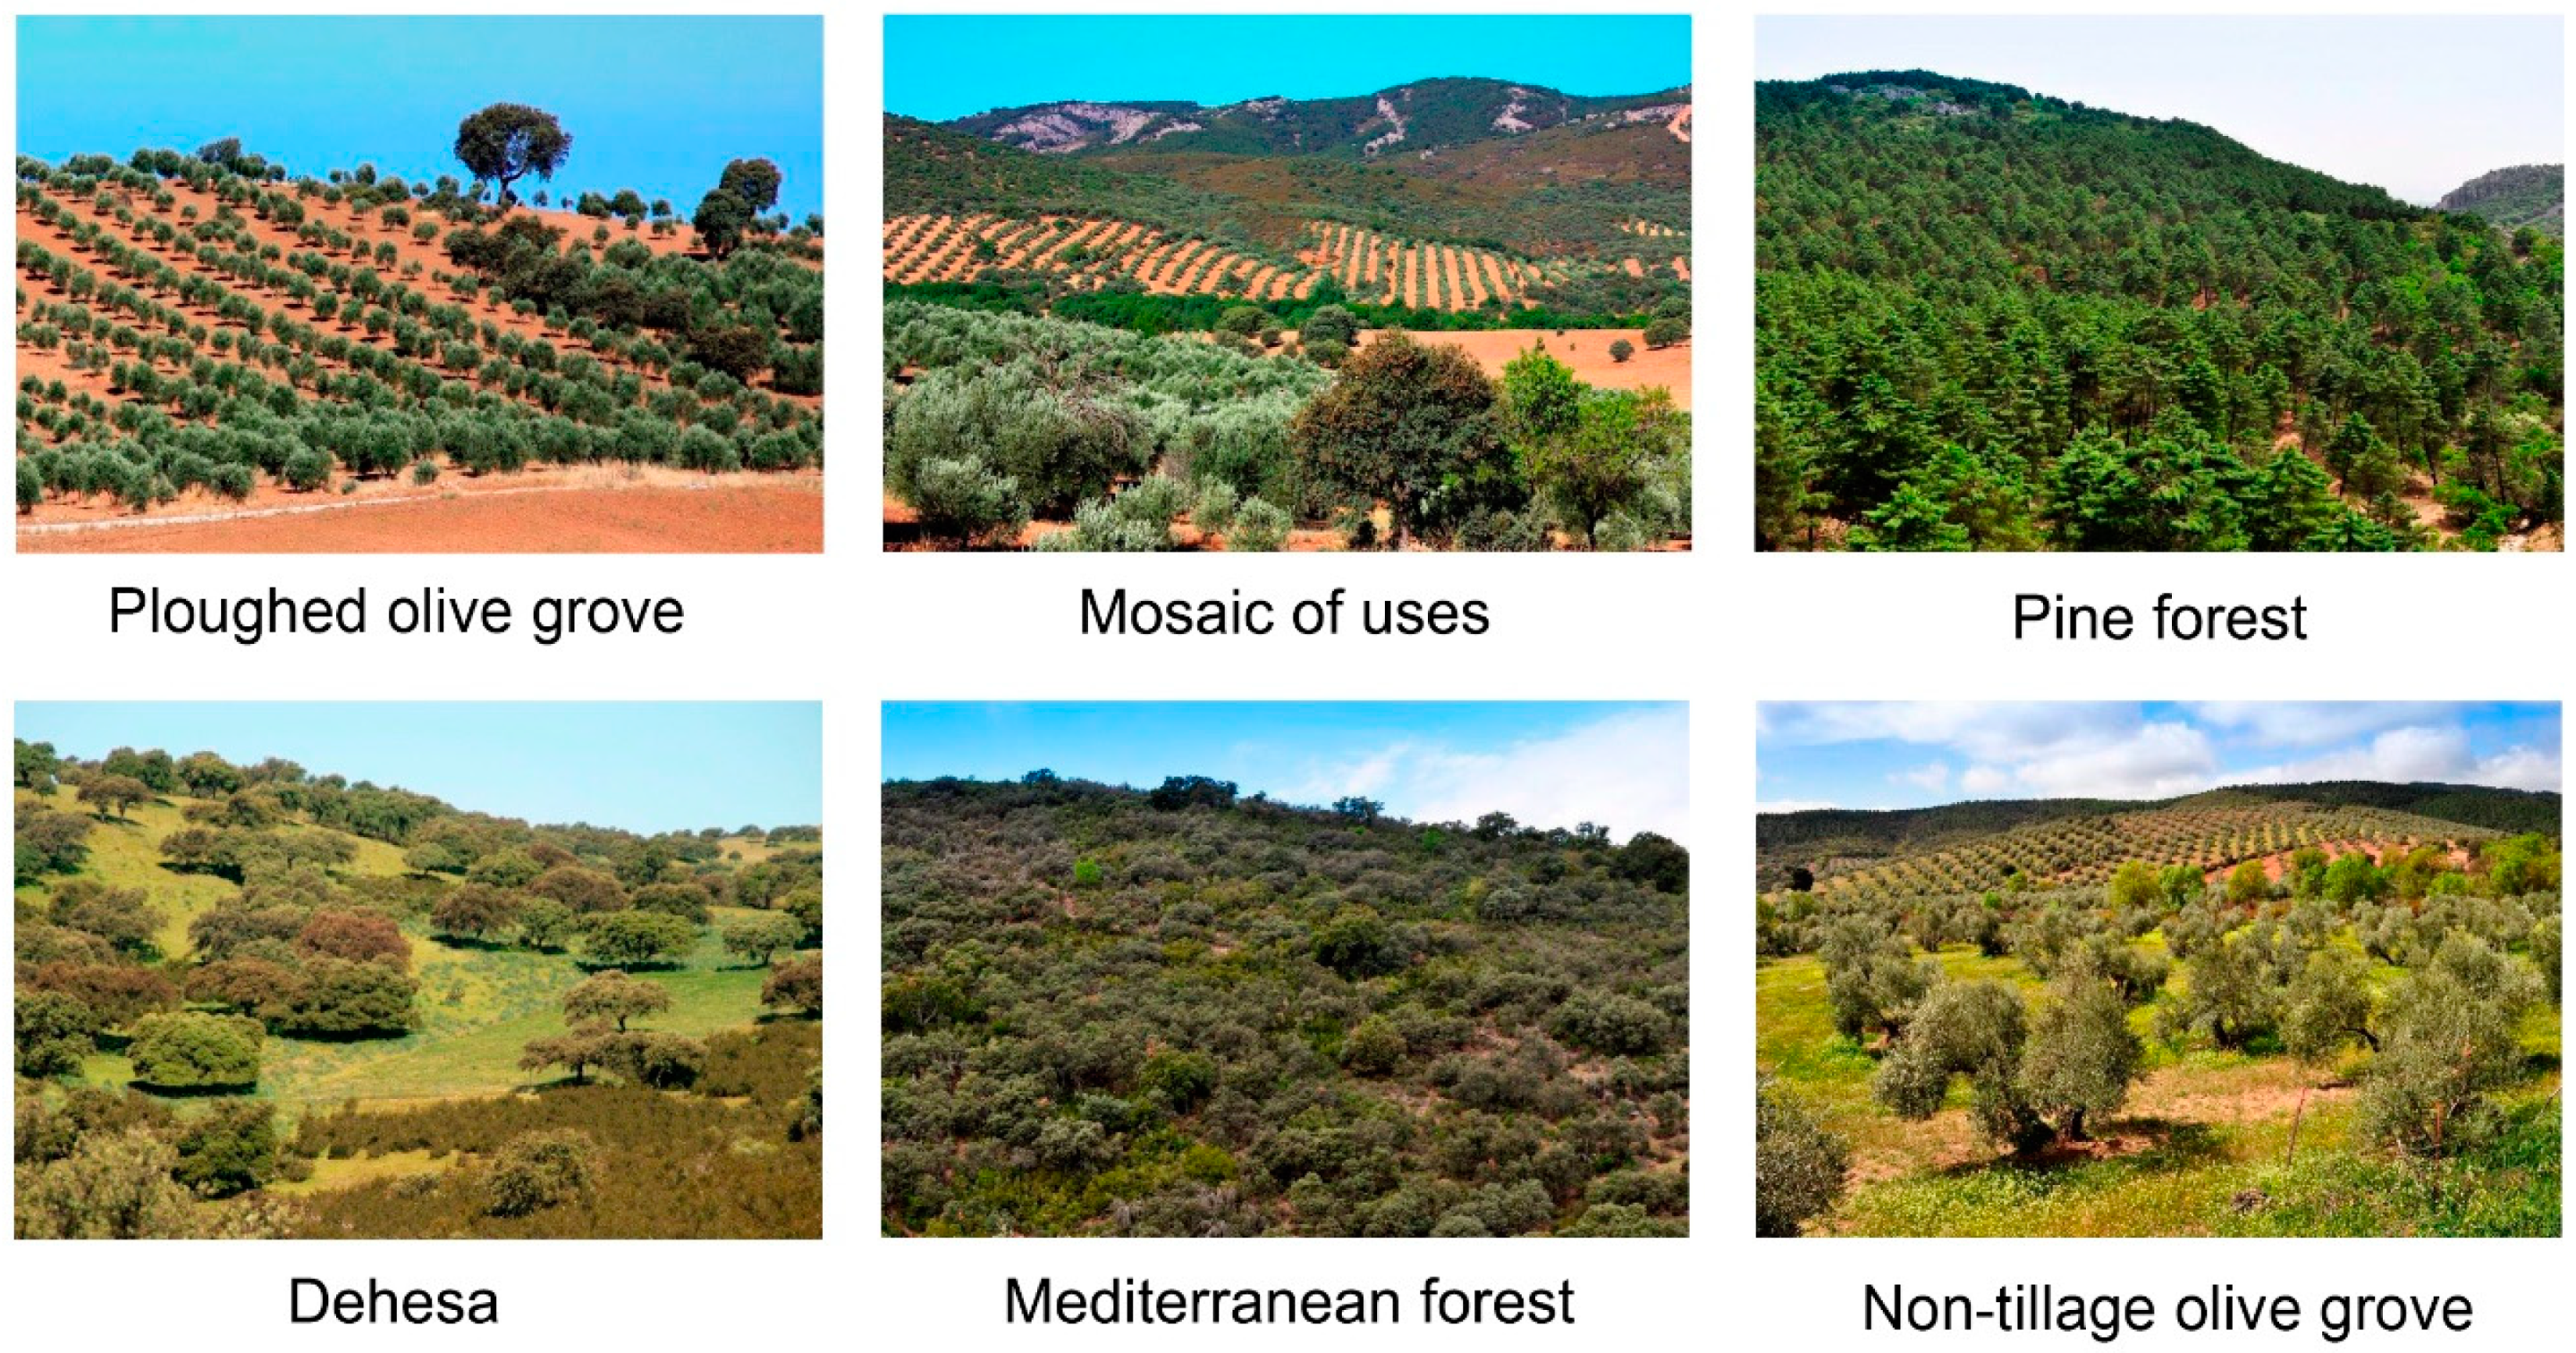
2.2. The Visual Enquiry: Survey of Local People and Semi-Structured Interviews to Key Experts

To analyze individuals’ landscape preference and perception of ecosystem services, we used a two-step methodology [38]: (1) a test of landscape preferences and (2) a test of ecosystem services assessment based on landscape photographs. We also included questions about the sociodemographic data of the interviewed people and information related to personal attitudes, e.g., degree of pro-environmental behavior, and professional links to the landscape, e.g., temporary olive gatherers (Table S4).
A statistically representative sampling was performed, consisting of 389 face-to-face surveys (95% confidence level, 5% sampling error), balanced for each socioecological sector and with an equitable representation of gender, age and key stakeholders identified by previous studies [34,38]. To compare the survey results with experts’ knowledge and explore the influence of different knowledge systems in landscape preferences and ecosystem services valuation, we also interviewed stakeholders with a higher degree of traditional ecological knowledge (N = 33), including 6 experts from the biodiversity/conservation area, 4 cattle raisers, 6 farmers, 6 foresters and hunters, 7 workers in the local development area and 6 public officers and managers (more details in Table S5). Furthermore, a semi-structured interview was also conducted with these key experts, taking their answers to the visual survey about preferences and perception as a starting point. The snow-ball sampling technique [44,45] was used to locate experts previously interviewed.

2.3. Landscape Preference Test

To elicit interviewees’ perceptions of local landscapes, we designed a visual panel of 16 photographs that show the most common landscape configurations in Sierra Morena for interviewees to rank by preference (Figure S2).
The visual test design was based on the combination of the six prevailing land use/land cover units identified in previous field work through interviewing local experts [34]: the dehesa landscape of grazed meadows with large holm oaks in low densities, managed to optimize livestock raising and other traditional uses; non-tillage olive groves with traditional management; conventional olive groves with dense planting frames of trees and use of agrochemicals and intense mechanization; pine plantations for logging and preventing erosion; Mediterranean forest composed of oak trees and scrub; mosaic of all land uses. Within each landscape unit, some variations of features, such as the presence of buildings for human use, degree of land use and intensification, presence of livestock, and degree of greenness, were considered, as were different levels of landscape diversity achieved by combining images to form different patchworks (Figure S2 and Table S6).
The photos were randomly presented to respondents. Before each survey, we reordered the images randomly. Then we requested respondents to look at all the images before start ranking them. As a piece of advice, we recommend surveyed to pick their preferred four images and rank them from the most preferred to the least or vice versa. We then asked respondents to pick their four least preferred and again to rank them. Finally, they ordered the last four images in the middle positions and rank them.
After scoring, we asked respondents to choose their main motivations for their selections from among the following options: scenic beauty, subsistence, affinity, cultural/patrimonial value, ecological value and sense of place.

2.4. Sociocultural Valuation of Ecosystem Services in Landscape Units

For the ecosystem services (ES) sociocultural assessment, we followed the conceptual framework of the Spanish National Ecosystem Assessment [46] adapted from MEA [47]. The respondents were asked to score (from nothing, 0, to very much, 4) the supply of 15 ES considered the most significant in the study area for each of the six main landscape units (Figure 2). We selected the most important ecosystem services (6 provisioning services, 4 cultural services and 6 regulating services) (Table S7) according to previous studies [34,38,48]. Before selection, the interviewers read to people the exact definition of each service (Table S7). This table was printed and available at any moment for respondents. Further, as surveys were conducted face-to-face, interviewers always explained the meaning of each service in plain language to respondents when necessary. The images shown for the respondents’ valuation was intended to be a representation of each landscape unit, so the respondent had to be clear that the task was not simply to identify the services seen in the photograph but also to use it as a representation of the landscape unit it depicted (Figure 2).

2.5. Statistical Analysis

To describe general landscape preferences, we calculated means and standard deviation for ranking scores, and to explore motivations, we calculated frequencies for selections. To study how sociocultural variables influence landscape preferences, we conducted a redundancy analysis (RDA) [49]. Redundancy analysis allows the researcher to relate a matrix of response variables (in this case, landscape preference scores) with a matrix of explanatory variables (in this case, sociocultural variables) [50]. A Monte Carlo permutation test (1000 permutations) was performed to determine the significance of the independent variables in explaining the landscape preference scores [51]. We then represented the results in a scatter plot.
The results of the visual ranking exercise were analyzed through a K-means clustering analysis, which allows the researcher to distinguish groups of respondents and classify them according to their landscape preferences. Then, we analyzed the characteristics of the groups according to sociocultural variables and environmental affinity, using chi-squared contingency tables, linking each respondent to one group. We named the groups according to their landscape preferences and the sociocultural variables.
To analyze the ecosystem services assessment, we calculated the mean score for each service in the six landscapes proposed. To elucidate differences in local people’s valuations and the associated variables, we conducted a K-means clustering to obtain groups of respondents that were analyzed through contingency chi-squared tables. Additionally, to explore differences among ecosystem service valuations for each group of respondents, we conducted Kruskal–Wallis analyses. To explore differences among landscapes in the perceived supply of ecosystem services, we carried out Kruskal–Wallis analysis and Dunn multiple comparisons among landscapes for the 15 ecosystem services studied.

3. Results

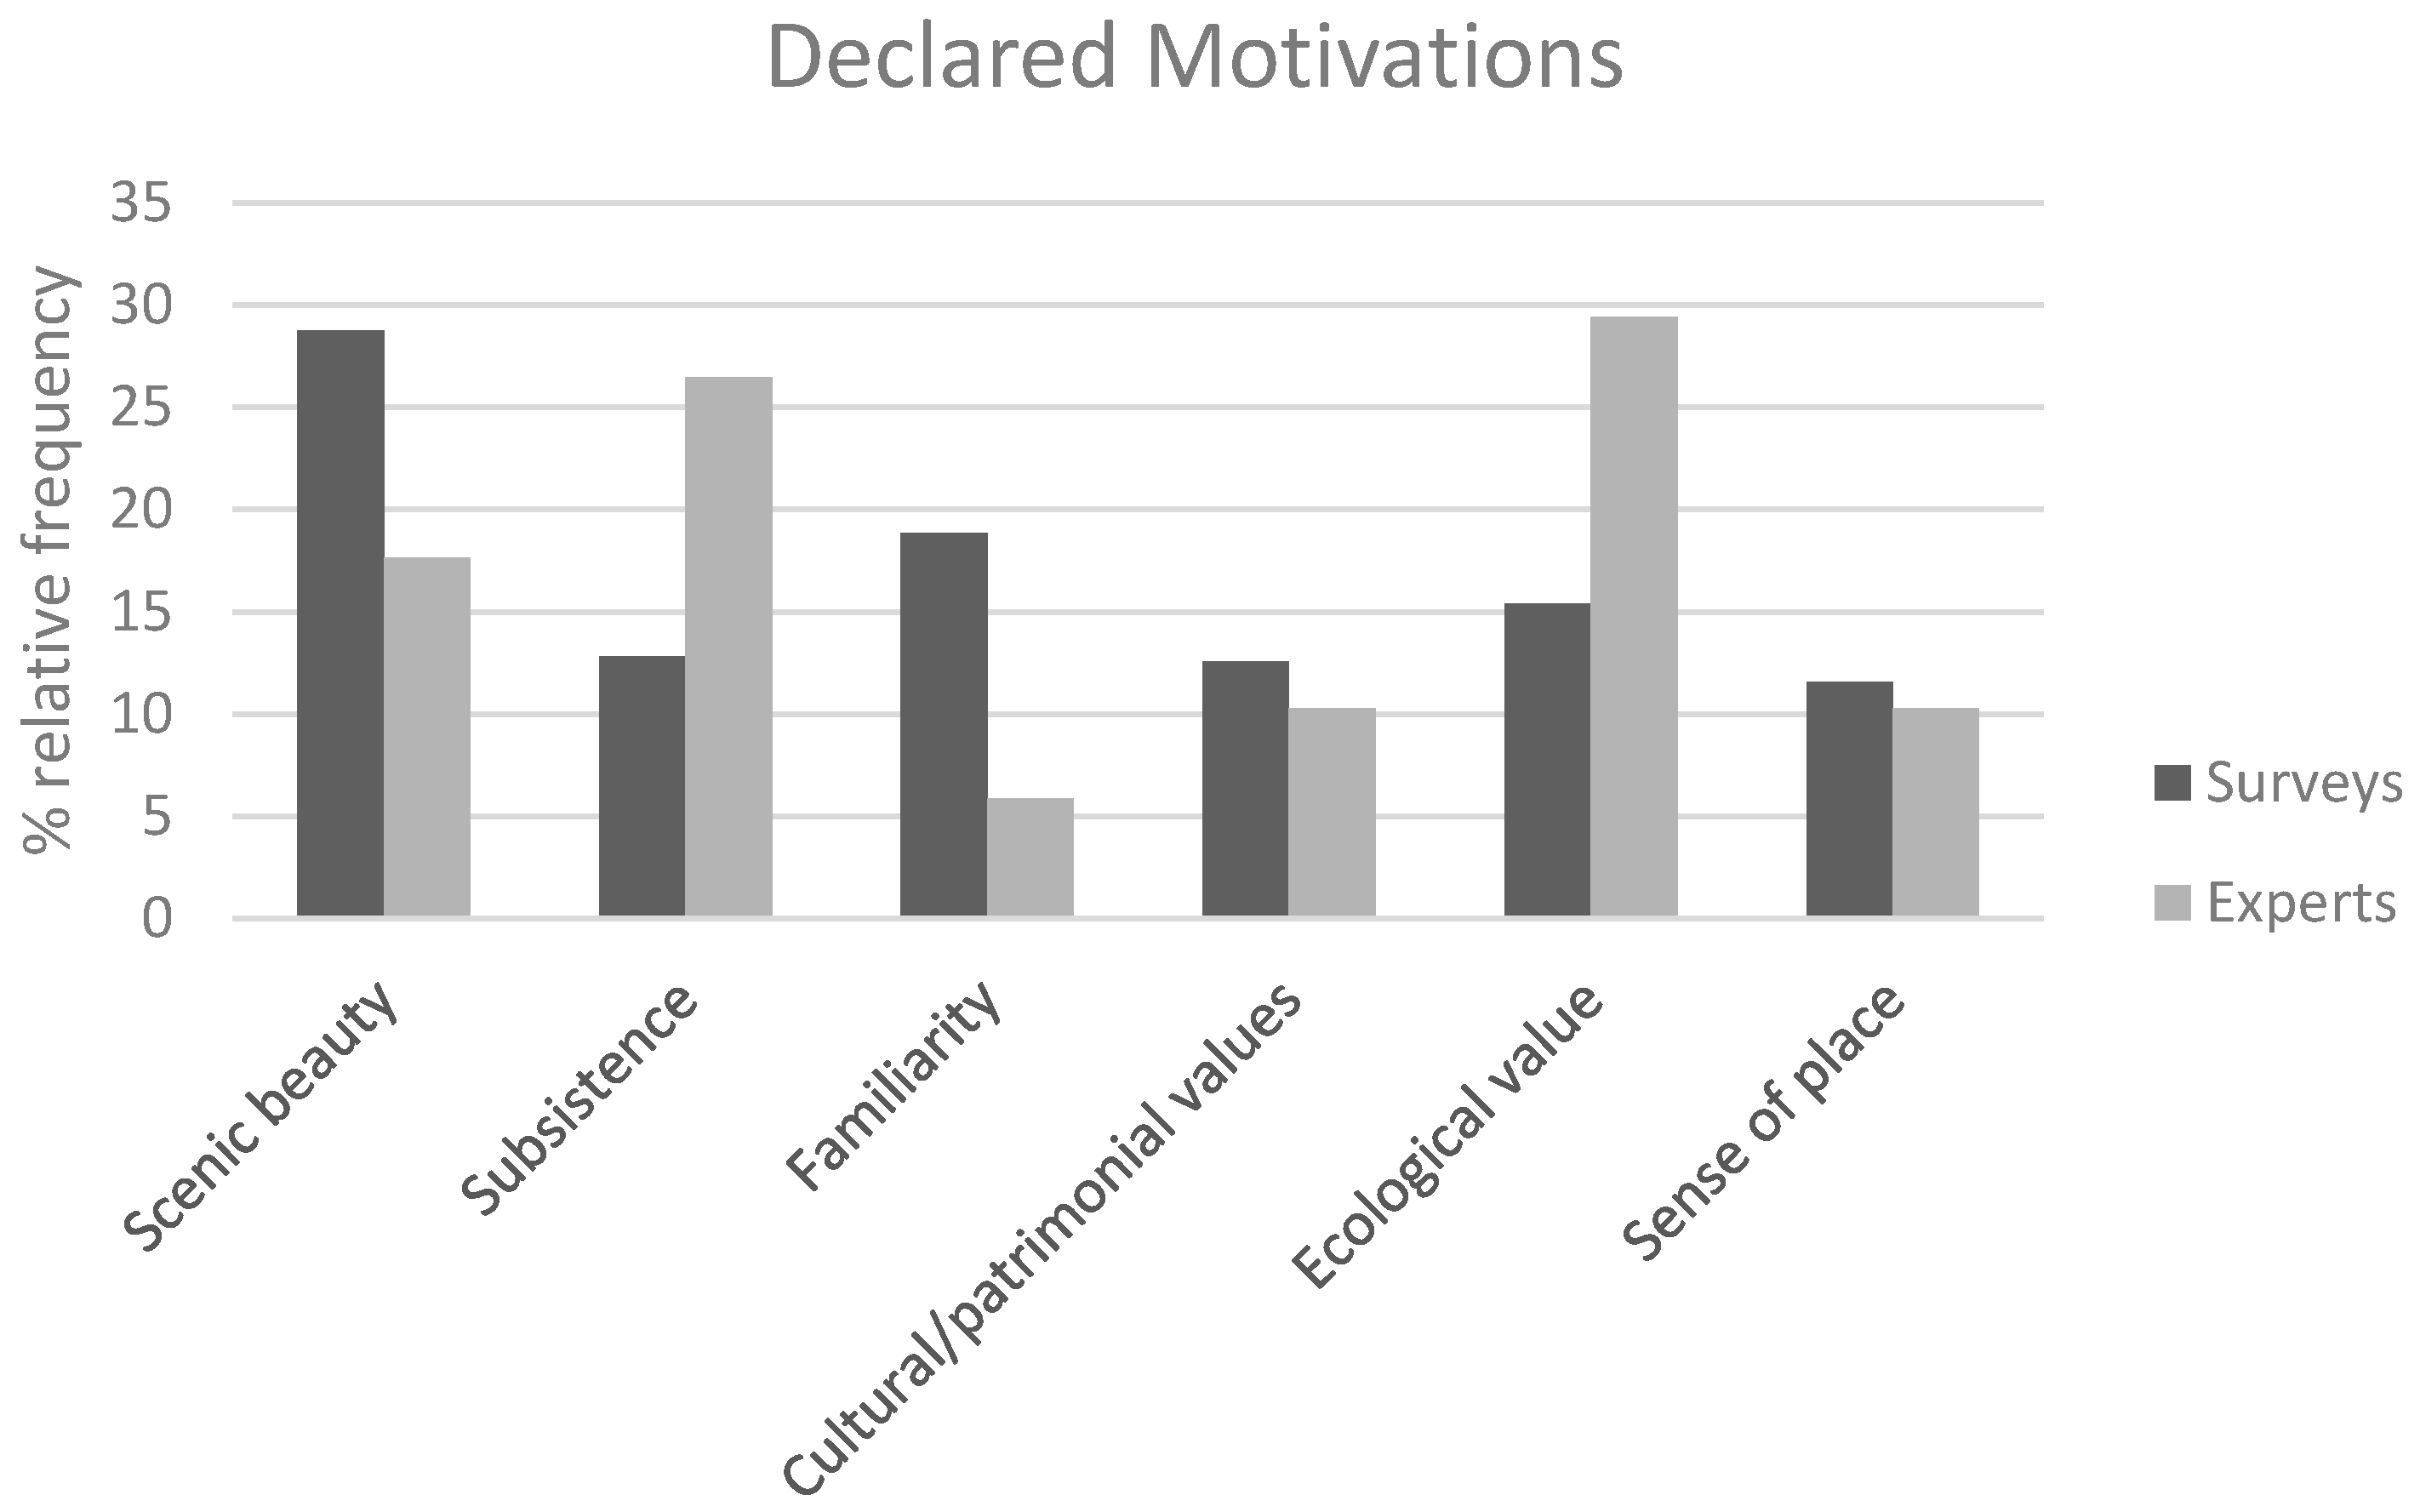
3.1. Landscape Preference Ranking and Declared Reasons for Choice

Results from the public surveys (Table 1) showed a prevalent affinity for images dominated by the “greening” of trees and grasslands. The two most highly valued images also contained livestock (photo 13) and local cultural heritage (the “El Centenillo” historical lead mine in photo 4).
The less-preferred images showed landscapes with dry grasslands (indicator of aridity), with dense oak scrub/forests, and with intensive olive cultures with bare soil (conventional).
Expert responses showed differences from the public surveys (Table 1). Although the most preferred image for experts was the same as for the public (photograph 13), experts preferred dehesas and Mediterranean forest over other land uses, regardless of the aridity effect (shown by the high score of photograph 1). The less-preferred image for the public was in the fifth position for experts, despite the presence of parched grass in the dehesa. Wild forest and scrub as well as olive groves without tilling were ranked more highly by experts than by the local people. Moreover, experts differed in their less-preferred images: Pine plantations, one of the favorite landscapes for public, was one of the less-preferred landscapes for experts. Illustrating this discrepancy, images 14 and 11 fell between the most rejected images. Stands out the high value of standard deviation in photo 8 due to differences in ranking scores given by respondents.
Analysis of the declared reasons of preference (Figure 3) showed that local people selected images mostly for their “scenic beauty” (64.7%), followed by “affinity” (42.5%), with sense of place being the least-chosen reason (26.1%). Experts mostly selected images based on their “ecological value” (74.1%), followed by “subsistence” (66.7%). The least-chosen reason was “affinity” (14.6%).

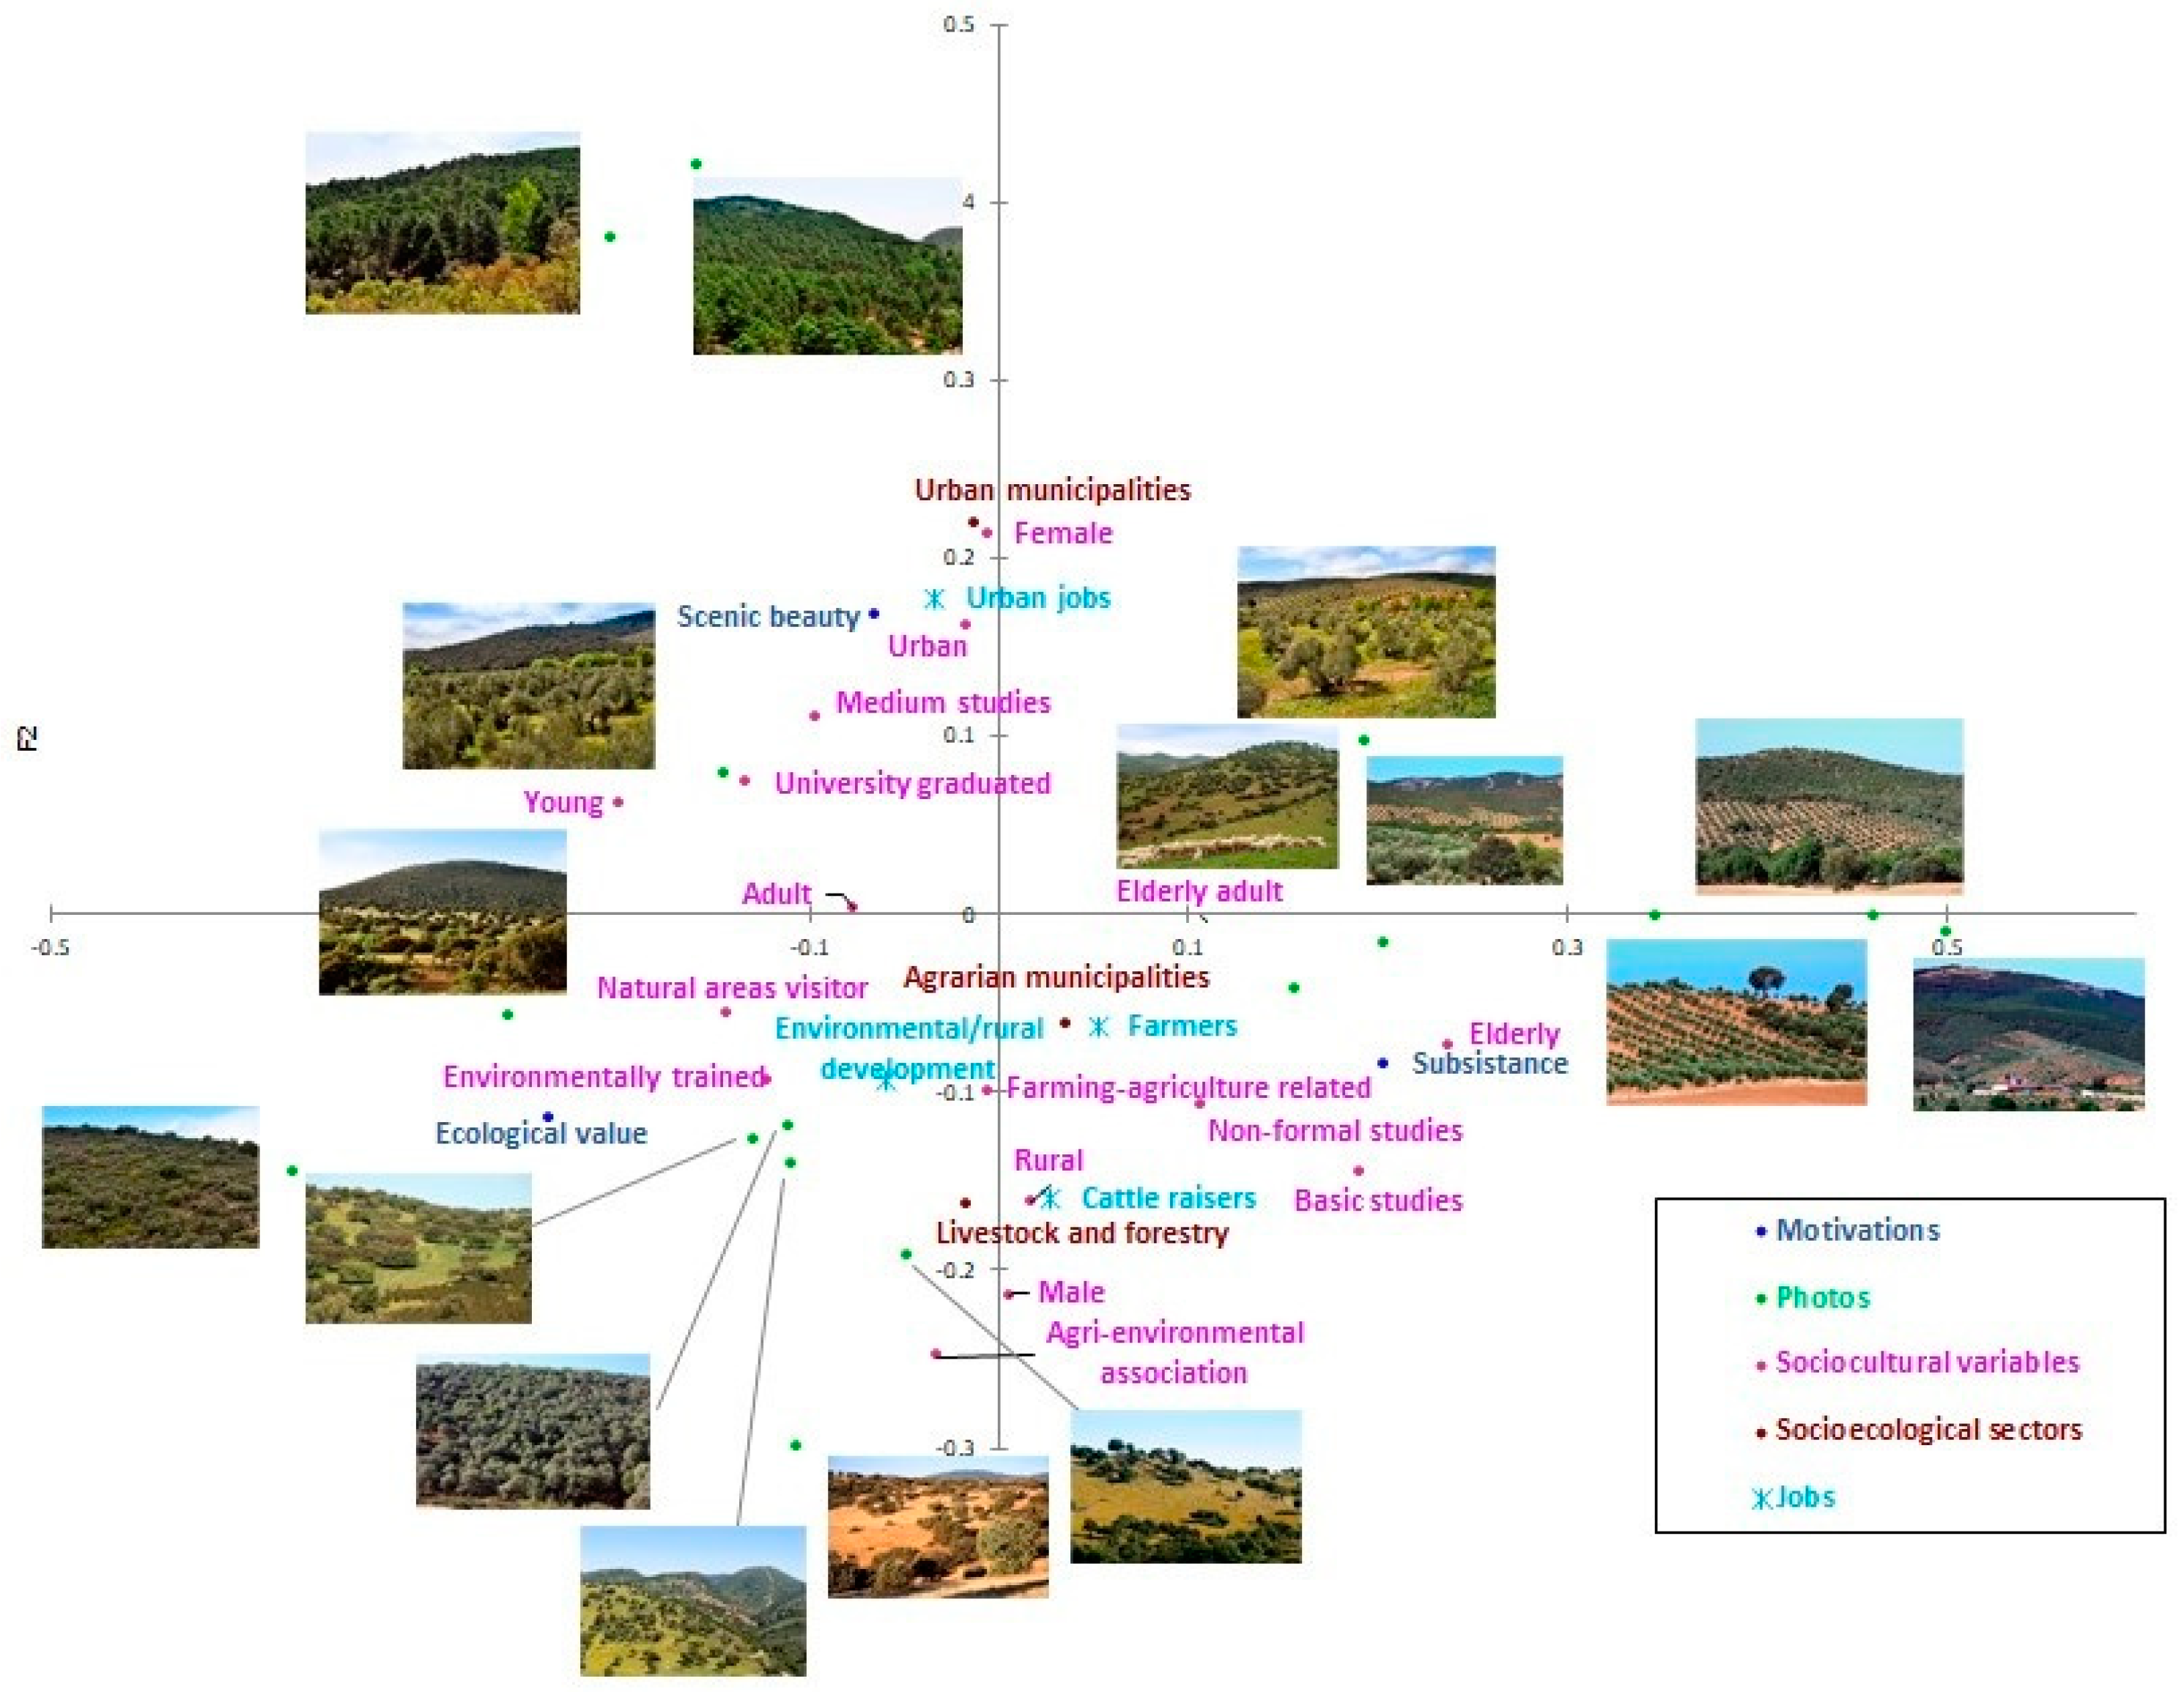
3.2. Sociocultural Factors behind Landscape Preferences

The first factor (axis 1) of the RDA (Figure 4) showed a clear dichotomy among landscape configurations, with olive groves in the positive side of the axis (photos 3, 8, 10 and 16), while views dominated by wooded landscapes of Mediterranean oak forest, dehesas (12, 6, 2, 9) and, in lower degree, pine plantations (14, 11) are associated to the negative side of the axis 1. The preference for olive groves is associated with being elderly, low education level and selection guided by a subsistence reason. Preferences for forests are associated with being younger, high educational level, frequent visits to protected natural areas, having environmental training and selection guided by ecological value reasons.
The second factor of the RDA (axis 2) seems to divide the preferences for pine plantations (photos 11 and 14) on the positive side versus dehesa landscapes, including very dry landscapes (1, 15, 7) and dense Mediterranean forests (9 and 12), on the negative side. People residing in the social-ecological urban sector with the biggest towns, those with urban jobs, women and those who feel urban preferred pine plantations, guided by scenic beauty reasons. People from the forestry and livestock sector, those belonging to agricultural and environmental associations, men, herders and those who feel rural were associated with a preference for Mediterranean forests and dehesa images. For more details on the results of RDA, see Table S8.

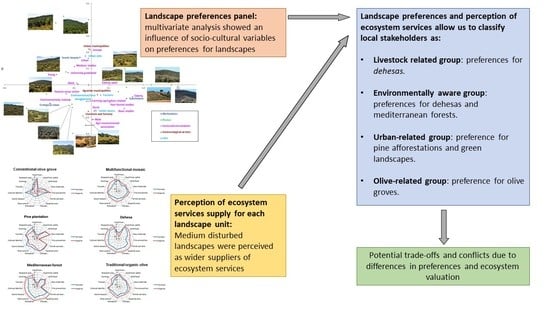
3.3. Stakeholder Classification

K-means clustering of stakeholders’ landscape preferences revealed the existence of four groups characterized by different sociocultural attributes (variance decomposition, between-classes = 79,498, within-class = 260,321). We named the stakeholder groups based on their affinities as follows, in numerical order (Table 2): livestock-related people, environmentally aware people, olive groves-related people and urban-minded people.

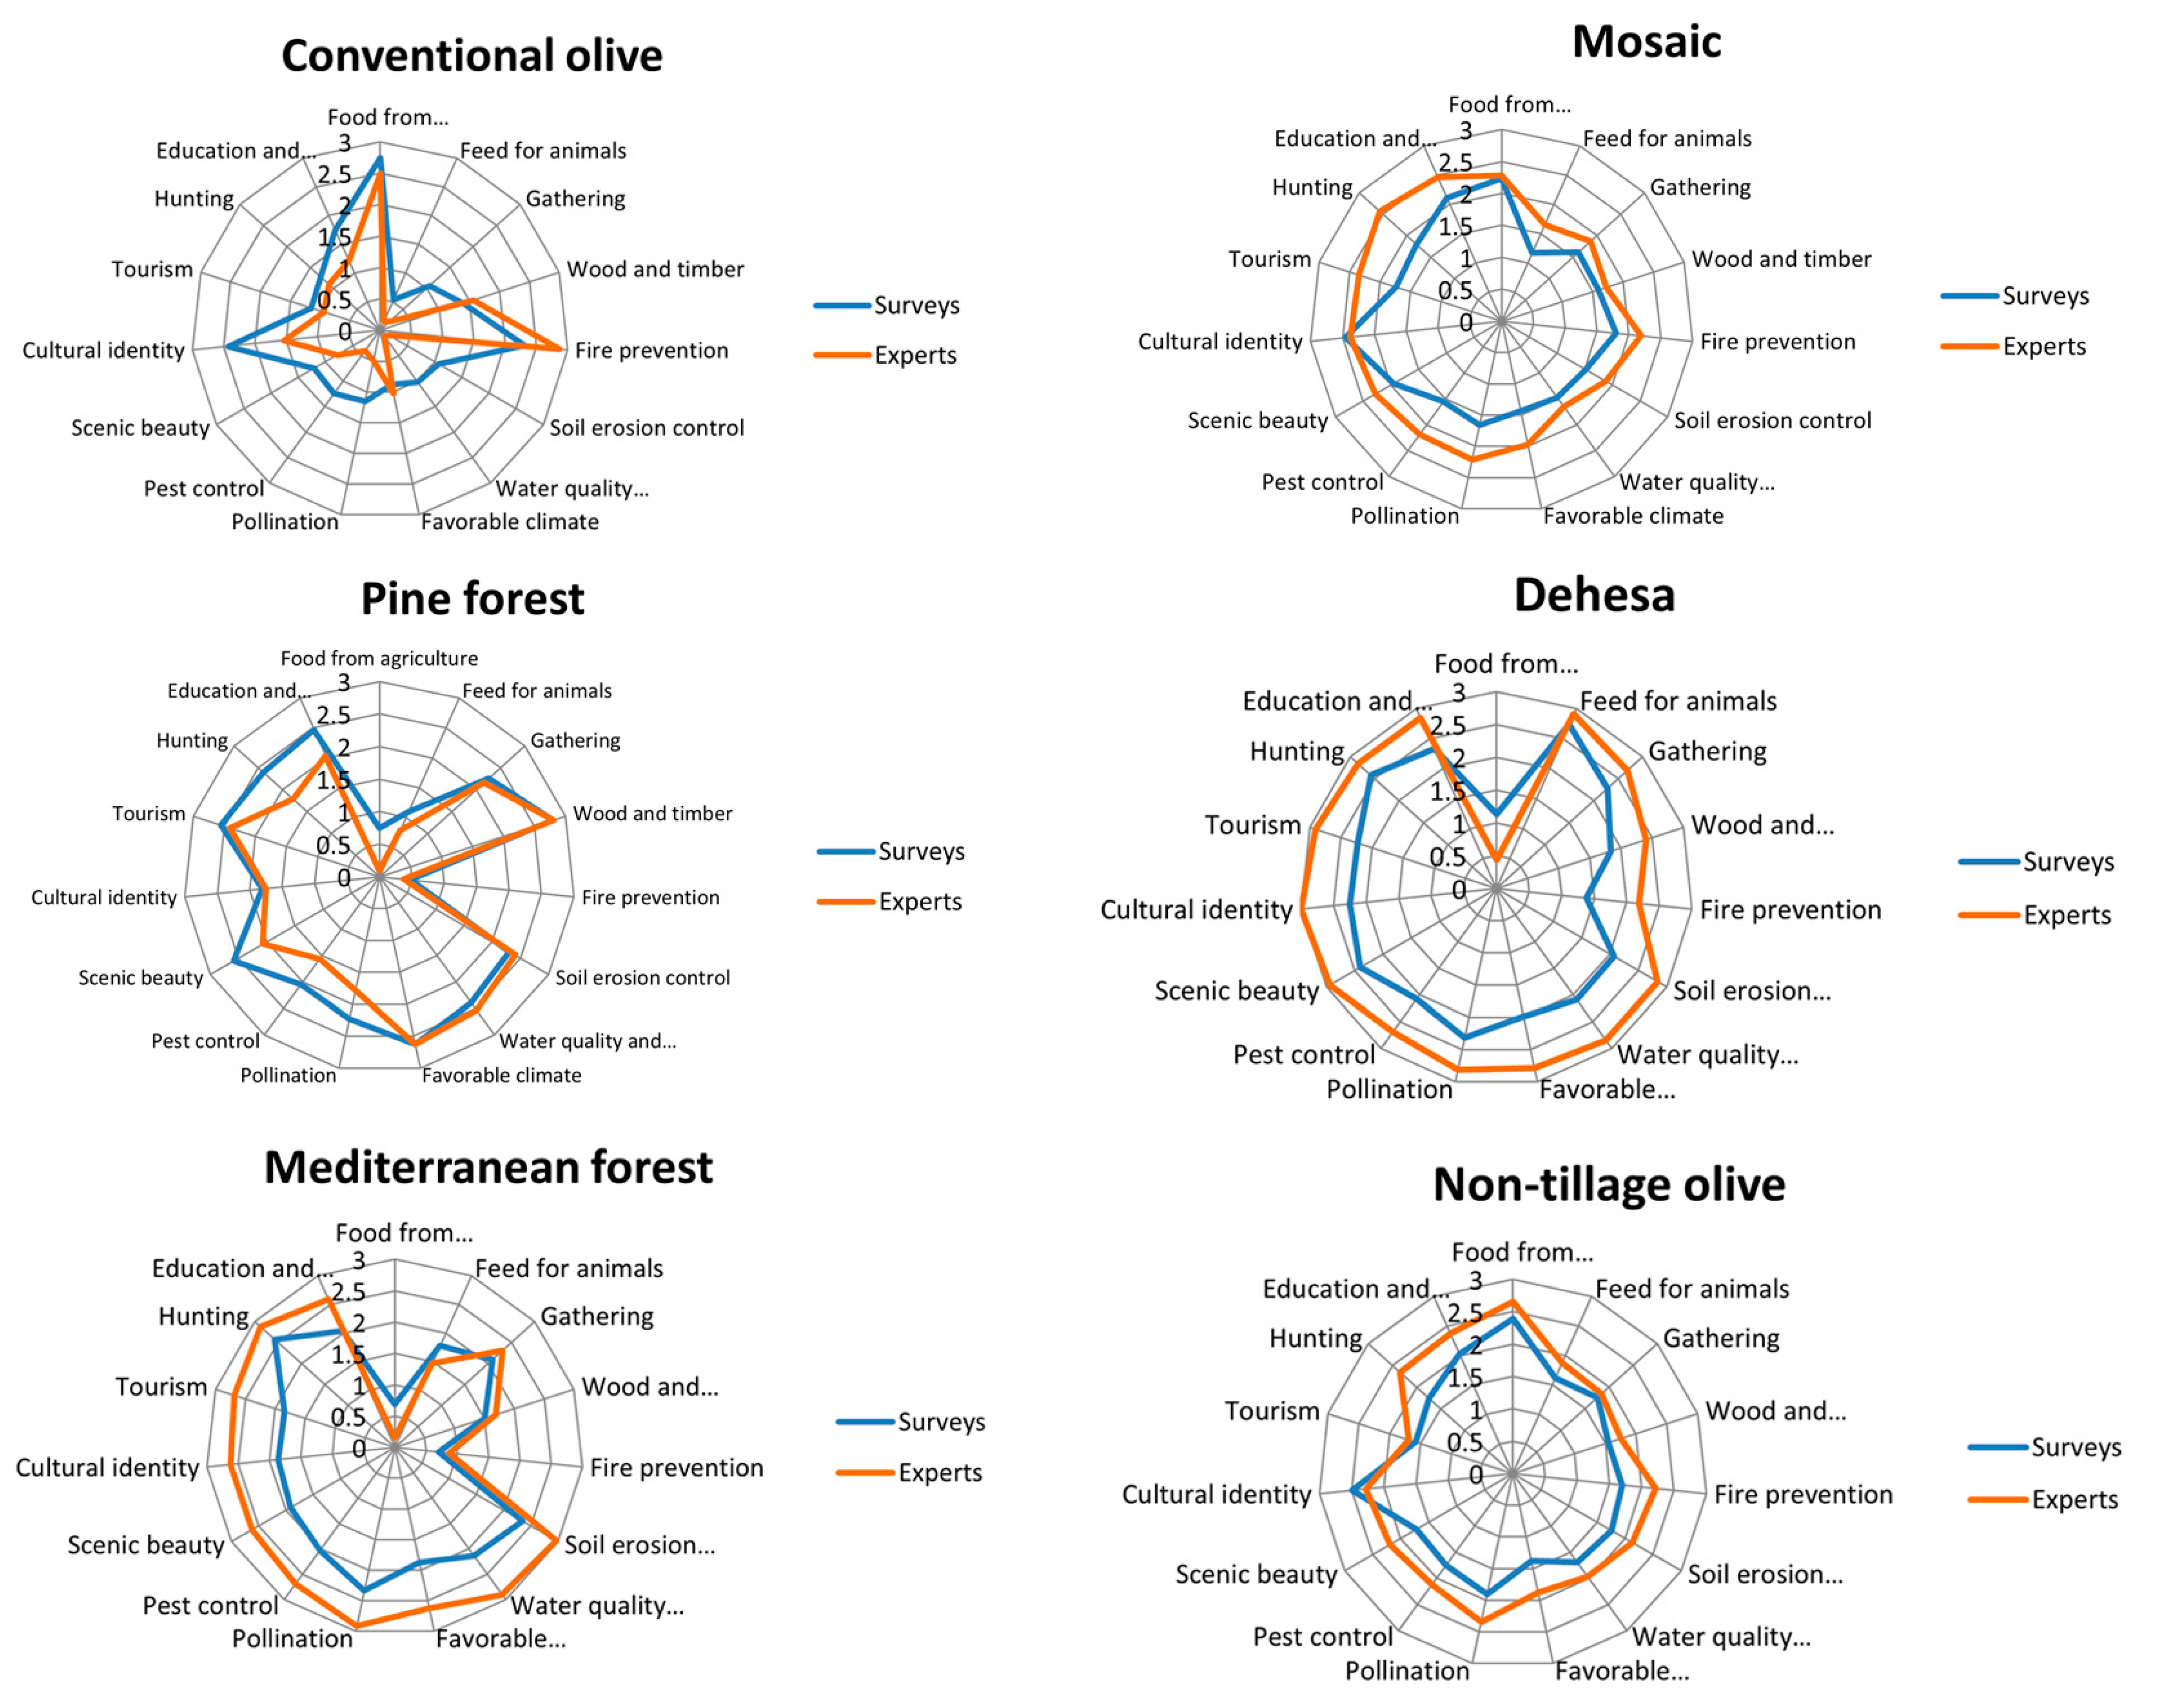
3.4. Sociocultural Valuation of Ecosystem Services Supplied by Land Uses

Results for the total scores of the ecosystem services supplied by each land use, as perceived by local people (Tables S9 and S10), allow us to visualize several comparisons through radar graphs (Figure 5). More rounded shapes reveal those landscapes that are perceived as providers of a wide range of ES, while sharper shapes indicate a supply focused on a few ecosystem services. Thus, the multifunctional landscapes such as dehesa, multifunctional mosaic and non-tillage olive groves showed a more homogeneous perception of ecosystem services delivery, resulting in more rounded radar graphs. We consider non-tillage olive groves as a multifunctional landscape because normally represents a wood-pasture ecosystem which is often used for sheep grazing. Conversely, monocultures such as pine plantations, conventional olive groves, and Mediterranean forests showed a less rounded shape, reflecting the perception of a more specialized ecosystem services delivery, although the focus of such specializations differs in each landscape. In the case of conventional olive groves, respondents especially valued their capacity to deliver food through agriculture, fire prevention capacity, and cultural identity, while both pine plantations and Mediterranean forest supplied fewer provision services and fire prevention and are perceived as medium suppliers of regulating and cultural services.

3.5. Differences among Stakeholders’ Perceptions of the Ecosystem Services Supplied by Land Uses

The differences among stakeholder groups in the scoring of ecosystem services for the six land uses valued allow the characterization of these groups of locals according to their relationship with each land use (Table 3).
The conventional olive groves, being the least valued of all land uses, are valued most highly by the olive-grove related group and second-most by dwellers of most urban municipalities. In contrast, this land use is assigned very low value by the environmentally aware group for most services. We found significant differences among groups of respondents in the scores for food from agriculture (K = 9.34; p-value = 0.025), food for cattle (K = 10.39; p-value = 0.015), wild food (K = 17.37; p-value = 0.0006) water supply and quality (K = 9.60; p-value = 0.0223), pollination (K = 9.26; p-value = 0.0223), pest control (K = 11.34; p-value = 0.010), and scenic beauty (K = 30.40; p-value < 0.0001).
The mosaic landscape service delivery is the most valued by the olive grove-related and livestock-related groups but less by the environmentally aware group. We found significant differences in scores for water regulation (K = 10.46; p-value = 0.0150), pollination (K = 10.40; p-value = 0.0155) and scenic beauty (K = 22.59; p-value < 0.0001).
Pine plantations are highly valued by the environmentally aware group for all services and by the urban-related group for most of them, with significantly higher scores for scenic beauty (K = 26.29; p-value < 0.0001) than both the livestock-related and olive-related groups, which gave this use very low scores for all services.
The dehesa landscape is valued more highly by the livestock-related group than the other groups for all services, and we found significant differences in scores for scenic beauty (K = 11.46; p = 0.0095) and climate regulation (K = 7.78; p = 0.0507). The environmentally aware group also highly values this use, with significant differences in wild food and scenic beauty.
The delivery of ecosystem services of the Mediterranean oak forest is valued the most by the livestock-related group for every service except livestock feeding, with environmentalists assigning the second-highest scores. We found significant differences in scores for pest control service (K = 19.96; p-value = 0.0002) and cultural identity (K = 13.80; p-value = 0.0032).
Non tillage olive groves are valued most highly by the livestock-related group and by the urban groups but are assigned low value by the environmentally aware group. We found significant differences among groups of respondents in scores for cultural services as scenic beauty (K = 9.40; p-value = 0.024), cultural identity (K = 10.31; p-value = 0.016) and tourism (K = 9.19; p-value = 0.026).

4. Discussion

Perception is a psychophysical function that is evolutionarily designed for adaptive purposes [52], and ecological psychology postulates that only the information that is directly perceived in the environment enables humans to guide adaptive behavior. This ability includes constructing meaning beyond the subject-object dichotomy [53] and acting accordingly (embodied cognition [54]). This phenomenon determines the local way of life, explaining how people living in cultural landscapes construct their relationship with nature through searching for adaptive possibilities and opportunities (affordances). Ecosystem services are merely a way to operationalize how local people work to optimize the contributions of nature to their wellbeing [28]. The result is coadaptation between ecosystem structures and function, and the local people’s management practices are guided by multiple forms of knowledge and the underlying relational values (coproduction) [29,55,56,57,58,59]. Therefore, scenic preferences reveal the deep ecocultural values that have emerged from these coevolved relationships with landscape, grounded in a multilevel, dynamic web of relations between nature and society [1]. Local people perceive and judge their environment in context-specific ways, confronting and overcoming the society/ecosystem duality that arises in other, more intensified, industrialized and urban landscapes. Local people build collective worldviews and hold consistent values systems that ground their decisions and drive landscape management and practices [60].
In this study, we analyze the social perception of the cultural landscapes of Sierra Morena in an attempt to understand landscape preferences, the reasons behind those preferences and how those landscapes are perceived as suppliers of ecosystem services by different stakeholders. Those results allow us to identify differences among types of stakeholders in their landscape preferences and their perception of ecosystem services supply. Multifunctional landscapes are clearly perceived as the main providers of ecosystem services by the local stakeholders, which is important to understand when designing and developing landscape management policies and plans.

4.1. Landscape Preferences

When local people were asked to choose pictures of their own landscape, scenic beauty was the most frequently declared motivation for preference, confirming the importance of aesthetic judgement for humans beyond merely a formal motivation. The question of aesthetic subjectivity is summarized in the legendary aphorism “beauty is in the eye of the beholder”, but this does not mean that human preferences are a question of random subjectivity. Conversely, multicultural landscape preference surveys [61] show a general consensus on scenic affinity, which is generally attributed both to evolutionary causes and to the deep ecological knowledge developed by local peoples through their cultural evolution with landscapes [36,62]. Such consensus is clearly shown in our visual test, as pictures with dense and green vegetation are generally preferred as indicators of fertility and freshwater availability. In contrast, brownish and yellowish colors, bare soil and dry vegetation are less preferred because of the lack of those attributes. This phenomenon is part of the global human attraction to life forms called biophilia [63], which our work corroborates, e.g., the most preferred picture (photo 16) shows a flock of sheep in a green dehesa pasture. In general, dehesas are highly valued (photos 4, 6, 7 and 15) but only when the pasture is green. In addition, evergreen landscapes such as the pine plantations (photo 14 and 11) tend to be well valued.
However, aesthetics is not simply a matter of user enjoyment. Landscapes perceived as beautiful are more likely to be protected and restored [36] (Gobster et al., 2007). Therefore, understanding the reasons why particular landscapes are perceived as beautiful could be crucial in achieving public support for landscape management [27]. In particular, the preference for dehesas may be explained by more than aesthetics, including deep cultural and ecological values as motivations. Dehesas are silvopastoral landscapes transformed from Mediterranean forests through a historic, traditional use of this ecosystem, which is why they are related to strong cultural attachments and represent iconic landscapes in the area, which is why they are related to strong cultural attachments and represent iconic landscapes in the area. Moreover, preferences for dehesas could be explained through their value as good providers of ecosystem services and as one of the most biodiverse ecosystems in Mediterranean regions [34,64].
Ecological and cultural value were not chosen as the first motivations for landscape preferences by most locals, but this does not necessarily mean that these are not important in determining public preferences for landscapes. Often, what people find aesthetically pleasing also sustains ecological functions and processes [36]. Moreover, experts and the environmentally aware group prioritize ecological value. Cultural values could create a contextual effect that influences landscape experiences, thereby modifying landscape attitudes and the practices of local stakeholders linked with aesthetic values but unconsciously rooted in pragmatic ground [27]. This background information shows that perception is not a dual process that separates mind and body but a relational value in which our sensory perceptions influence our more abstract categorizations and vice versa [54,65,66].

4.2. Ecosystem Services Valuation as a Robust Sociocultural Diagnosis of Landscape Functionality

The analysis of a visually based test of local inhabitants’ perception of ecosystem services supply in Sierra Morena cultural landscapes (Tables S10 and S11) has revealed a consistent, shared vision of land use functionality, with explainable differences among stakeholder typologies [60]. The first important finding is the strong consensus among different perception-based groups of stakeholders on ecosystem services supply from each land use, which was supported by the experts (Figure 5).
The conventional olive grove landscape received the lowest scores for all ecosystem services except for food from agriculture, fire prevention and cultural identity, making it the most unbalanced of all landscapes in ecosystem services delivery. Perceptions around this landscape showed a clear trade-off between the high values of provisioning services and the low values of regulating and cultural services. This pattern is consistent with the findings of other studies [38,67,68,69].
The dominance of cultural and regulating services is shared by both the pine and Mediterranean forests, which has been documented before in forest ecosystems [38,51,70,71]. Declared motivations characterize the perceptions of these forests differently. Pine plantations were scored more highly as scenic/recreational landscapes by the surveyed, while the Mediterranean forest is considered by experts as an important natural forest area due to its ecological value and higher levels of regulating and cultural services. Neither is considered as a good food provider.
Non-tillage olive groves and the mosaic landscape both constitute a similar rounded figure, which means that these uses are valued as balanced high-level suppliers of a wide range of ecosystem services. Similarly, the dehesa landscape showed a rounded shape but with even higher values in all ES than the mosaic landscape and the non-tillage olive groves, except for food from agriculture, which received slightly lower scores. These results suggest that landscapes with an intermediate level of disturbance (dehesas, multiuse mosaic and, at a lower level, non-tillage olive groves) are perceived as good suppliers of ecosystem services in Mediterranean areas [72]. These farming landscapes with high natural value are considered multifunctional by local stakeholders as a kind of “ecosystem services hotspot” [73].
The results show remarkable differences in ES delivery among landscapes with intermediate human disturbance (dehesa, mosaic and non-tillage olive groves), those with low-intervention or naturalized uses (Mediterranean forest and pine plantations) and those with high-intervention landscapes (conventional olive groves). Moreover, the results reveal quantitative valuation differences between experts and the general survey respondents. Both experts and the public perceived the intermediately disturbed landscapes as suppliers of multiple ecosystem services, resulting in rounded radar graphs, but experts assigned higher value to almost all services. Forest landscapes, either wild ones (Mediterranean forest) or artificial ones (pine plantations), reflect very similar patterns in ecosystem services supply, and the radar graphs of the public and experts are also very similar. In this case, experts perceive a higher degree of regulating and cultural services supply in Mediterranean forests, while the public values the supply of the same services in pine plantations more highly. We hypothesize that local people benefit equally from both types of forests, mostly as recreational and aesthetic scenarios, and ignore their important ecological differences.
The former strong tendency towards agricultural intensification in Sierra Morena has led to increasing use of agrochemicals and ploughs and even to the growth of foreign olive varieties in irrigated hedgerows, which local people, even the olive growers themselves, perceive as harmful to the landscape configuration. The group of local experts, selected for the high degree of ecological knowledge, whether traditional or scientific, associated with their professional roles and their engagement in direct landscape management have much higher awareness of such harm than the average surveyed local. This differentiation is consistent with experts’ strong visual preference for the Mediterranean forest, dehesas and traditional landscape mosaics, which is guided by their awareness of the high value of multifunctional landscapes and their rejection of the loss of land use and land cover diversity.
Similarly, in a participative scenario-planning workshop, [34] obtained the most balanced provision of ecosystem services from multifunctional landscape and dehesa scenarios, both in a biophysical valuation performed through quantitative indicators and in a social qualitative valuation performed by key stakeholders. We also found that those landscapes are clearly preferred by Sierra Morena local stakeholders over more intensive, agriculturally focused scenarios. Despite this preference, trends in agricultural policies are still focused on agricultural intensification, triggering the abandonment of dehesas and leading to an undesirable social scenario and an unbalanced provision of ecosystem services.

4.3. Uncovering Landscape Values Emerging from the Scenic Preferences of Stakeholder Groups

Scenic preferences highlight significant group-related differences among typologies of local people who share landscape perception affinities, while their perceptions of ecosystem services supply reveal the motivations and values behind their selections [74,75]. The combined results of scenic preferences and ecosystem services valuation made it possible to classify stakeholders by their background regarding their needs and aspirations as follows:
The livestock-related group comprised predominantly mature and older people, mostly ranchers and herders living in the upper social-ecological sector, and those related to forestry. They prefer the dehesa landscape above all (even in arid conditions) and olive groves under traditional/organic management, giving high values to the dehesa and Mediterranean forests, especially for their cultural and regulating services. Previous studies have found that rural stakeholders tend to prefer landscapes with medium levels of humanization, such as the dehesa, which is linked to the extensive livestock uses of the Mediterranean forests [10,38,76]. They also strongly prefer Mediterranean forests/scrub over intensively managed olive groves and pine plantations, assigning lower values to the services delivered by the latter. They declare subsistence, ecological value and sense of place as their main motives in selection.
The environmentally aware group were younger people, mostly living in urban municipalities, with high education levels and environmental information, as well as rural/environmental development workers; this group declared primarily ecological motivations. Like the livestock-related group, they preferred dehesas and Mediterranean forest and rejected intensive olive groves but, unlike them, assigned high points to their preference of pine plantations and very low scores to the presence of any human building. Their preference for natural, appealing forest ecosystems may be explained partly due to the emotional linkage of young people to the wild features of nature [77]. The preference for the dehesa may be explained due to its well-known high level of biodiversity [64] but also to its being a cultural ecosystem associated with low-impact uses of nature. This group assigned high scores for ecosystem services delivery to the three forest uses (pine plantations, Mediterranean forest and dehesa) and gave lower scores in all groups to both types of olive cultures, although they preferred the non-tillage olive groves over the conventional olive groves because of their regulating and cultural services.
Olive growers and older inhabitants of the agrarian social-ecological sector were grouped as olive grove-related because of their preference for conventional olive landscapes and mosaics with the presence of olive cultures; they declared subsistence as the main reason for that valuation. They consistently scored the services delivered by olive grove landscapes the most highly of all groups. This group preferred dehesa landscapes and also assigned high scores to the ecosystem services delivered by the mosaic landscape and the non-tillage olive groves, which are related to an abiding sense of place and traditional ecological knowledge; this group showed a lack of affinity for pine plantations. Therefore, although olive groves are the main economic resource for this group and offer a strong subsistence meaning, this group also recognizes the benefits of multifunctional landscapes in terms of ecosystem services supply. This fact could be read as a critique of the domination of olive monoculture at the regional scale, which is driven by former Community Agrarian Policies of the European Union and global market prices.
The people living in the urban social-ecological sector, primarily women, younger people, those who are usually not environmentally trained nor working in agriculture, share an aesthetic motivation that is very common in urban-related people. This group more highly valued the pine plantations and all pictures of mosaic landscapes and olive groves, assigning lower value to dehesas and native oak holm forests and reflecting a lower cultural identification with these uses. This group declared itself to be guided by scenic beauty alone, with preferences for forest and luxuriant vegetation (called phitophilia) [78,79] and for wild landscapes, particularly for young people [61]. This group differed in the valuation of ecosystems services, assigning a higher value to the regulating and cultural services in the intensive olive grove landscape than the other groups and ranking most services delivered by Mediterranean forests as the lowest. Those results are consistent with other studies that describe urban stakeholders as commonly associated with a lack of ecological knowledge and usually giving low values to provisioning services [11,38,47,80,81]. It is a very common tendency in urban people to develop some kind of “nature deficit” [82,83], which stimulates their need and demand for recreational or contemplative experiences in landscapes that they mistakenly consider natural or wild.
Beyond these sharp differences among stakeholder groups in scenic tastes and their quantitative scoring of ecosystem services, there was consensus on the basic supply profile of all landscapes. Both the profile of landscapes and the characterizations by local stakeholders were consistent with previous research in the area [38,48], but new insights emerged when comparing experts’ appraisals with those of local stakeholders. The first is that experts strongly preferred the dehesa landscape and Mediterranean forest and tolerated dryness much more than local people, thereby rejecting anthropic elements. They assigned very low values to the landscapes dominated by olive groves or pine plantations, declaring ecological value and subsistence as their reasons of choice. The livestock-related stakeholder group most strongly resemble the experts in their preferences and motivations, which is an important finding because it strongly links the landscape affinities of traditional stakeholders, whose knowledge system is basically traditional and local, with the scientifically minded experts linked to the management of the study area.

4.4. Tradeoffs and Synergies among Landscape Visions

Different preferences for landscape are associated with different demands on the services delivered and different perceptions of land uses and practices. This differentiation may provoke conflicts among groups of stakeholders [51] because the rising demand for some services could compromise the delivery of others. The sociocultural analysis of landscape perceptions and ecosystem services valuation allows us to identify the potential trade-offs among stakeholders regarding their demands for use. It is worth identifying groups with opposing environmental interests [38] to address the underlying social dynamics that drive potential conflicts between the winners and losers in land management [56]. Furthermore, any change in the demands for ecosystem services will provoke new conflicts in management that should be quickly identified to aid decision-making processes [84]. We believe that considering the points of view, interests and aspirations of local people should be a key topic to address before any landscape intervention, as they are the day-to-day sculptors and keepers of cultural landscapes.
A notable case emerging from our results is that of urban people living in small villages in the study area, namely, Bailén, Baeza and Úbeda (from 15,000 to 30,000 inhabitants), who appeared as a clearly different perception-driven group. Despite living surrounded by the same landscapes as the rest, their responses were more typical of people living in larger cities [85] and were characterized by low values for subsistence as a choice motivation and a high demand for recreative and aesthetic services from wild-appeal and depopulated/abandoned landscapes, evidencing a strong rural-urban dichotomy and the loss of ecological knowledge. In contrast, rural stakeholders, environmentally aware people and local experts prioritize land uses in which the ecosystem services delivery is more balanced, such as dehesas, mosaics and non-tillage olive groves. This important synergy between eco-minded people and local productivity-centered stakeholders must be considered as a shared preference for ecosystem services hotspots that is related to a traditional management culture that prioritizes important regulating services such as soil formation, hydrological regulation and fire prevention [51]. This conflict may be exacerbated if decision making on local landscape management is carried out with an urban-related vision and objectives, thereby underestimating the value of multifunctional landscapes.
Another relevant conflict arose between rural people’s affinities for intensive olive monoculture intensification and the defense of a traditional-like extensive pastoralism from other groups. This conflict is critical because of the growing presence of olive monocultures [86] at the expense of declining dehesa surface area [87]. The livestock raisers and environmentally aware groups, together with local experts, agree in rejecting such monoculture, which has become the main source of income and livelihood in the area, driven by national and European agrarian policies.

5. Conclusions

The inhabitants of Sierra Morena showed a shared preference for traditional agricultural landscapes, such as dehesas and multiuse mosaics, mostly guided by aesthetic criteria, as a reflection of a mixture of ecological values and cultural identity. Local inhabitants of Sierra Morena perceived the supply of ecosystem services as higher in landscapes with medium levels of disturbance, such as dehesas and mosaic landscapes, than in highly disturbed ones, such as conventional olive groves and pine plantations, or less-used landscapes, such as the Mediterranean forest.
Landscape preferences and individuals’ perception of the ecosystem services they provide were directly influenced by stakeholders’ ecological knowledge, environmental behavior, rural or urban affinity, and their dedication to agricultural activities. Those variables allowed us to identify four groups of stakeholders that differ in their demands for landscape management. We found an urban-related group characterized by their preferences for pine plantations and “green” landscapes, guided by aesthetic criteria and low valuation of traditional ecological knowledge; a livestock-related group that expressed preferences for dehesas due to their ability to supply multiple ecosystem services; an environmentally aware group that showed preferences for dehesas and Mediterranean forests, mainly guided by ecological criteria; and an olive-related group that showed clear preference for the olive groves as key for the regional economy and for the strong cultural identity attached to them.
The landscape mosaics of dehesas, Mediterranean oak forests and non-tillage olive groves are suffering important changes that threaten their future existence and functioning. The uncertain future of these landscapes places their contribution to the wellbeing of local populations at risk. Addressing the differences in valuation/demand for ecosystem services among groups of stakeholders, characterized by their landscape preferences, provides important information to identify potential trade-offs and conflicts among them. Further research is needed to prevent potential conflicts and to identify winners and losers in regional and local landscape management plans.

Supplementary Materials

The following are available online at https://www.mdpi.com/2073-445X/9/10/390/s1, Figure S1: Dendrogram of the Hierarchical Clustering Analysis to classify municipalities into social-ecological sectors; Figure S2: Photographs used for the preference ranking; Table S1: Variables used to classify municipalities in social-ecological sectors. To develop a socioecological characterization of the study area, socioeconomic data together with land use/land cover data of the municipalities (Table S1) were analyzed. A Principal Component Analysis (PCA) (Table S2) and an agglomerative Hierarchical Clustering Analysis (Euclidean distance, Ward method) (Figure S1) allowed the identification of three homogeneous groups of municipalities (level of confidence 95%) regarding the association of their relevant socioeconomic and natural capital features. We called this three group of municipalities: Socioecological Sectors (Table S3), Table S2: Loadings of the 9 first axis of the PCA performed to the socioecological descriptors in order to classify the municipalities into socioecological sectors; Table S3: Characterization of social-ecological sectors: relevant biophysical and social descriptors with high levels in each sector; Table S4: variables used to define stakeholder clusters; Table S5: Descriptors of the experts interviewed; Table S6: Visual characteristics of the photographs used in preference ranking; Table S7: Description of the ecosystem services analyzed in the study; Table S8: coordinates of RDA response variables (ranking values) and explanatory variables; Table S9: Means of ecosystem services delivery scores for each landscape unit; Table S10: Results of Kruskal-Wallis test performed for ecosystem services between landscape types; Table S11: Results of Kruskal-Wallis test performed for each stakeholder group.

Author Contributions

Conceptualization, C.A.L.-S. and J.A.G.; methodology, C.A.L.-S., J.A.G., F.R. and Í.B.; formal analysis, Í.B. and C.A.L.-S.; writing—original draft preparation, Í.B. and C.A.L.-S.; writing—review and editing, Í.B., C.A.L.-S., J.A.G., R.M.-S., F.R. and C.C.; supervision, C.A.L.-S. and J.A.G.; project administration, C.A.L.-S. and J.A.G.; funding acquisition, C.A.L.-S. and J.A.G. All authors have read and agreed to the published version of the manuscript.

Funding

This research was supported by the project ECOGRADIENTES, funded by the Spanish Ministry of Economy and Competitiveness (CGL2014-53782-P).

Acknowledgments

We thank Javiera Pantoja, Víctor Pascual, Ainhoa Bustamante for data collecting and Ignacio Albizu for English corrections.

Conflicts of Interest

The authors declare no conflict of interest.

References

  1. Raymond, C.M.; Giusti, M.; Barthel, S. An embodied perspective on the co-production of cultural ecosystem services: Toward embodied ecosystems. J. Environ. Plan. Manag. 2018, 61, 778–799. [Google Scholar] [CrossRef]
  2. Raymond, C.M.; Kenter, J.O. Transcendental values and the valuation and management of ecosystem services. Ecosyst. Serv. 2016, 21, 241–257. [Google Scholar] [CrossRef]
  3. Blondel, J. The ‘Design’ of Mediterranean Landscapes: A Millennial Story of Humans and Ecological Systems during the Historic Period. Hum. Ecol. 2006, 34, 713–729. [Google Scholar] [CrossRef]
  4. Farina, A. The Cultural Landscape as a Model for the Integration of Ecology and Economics. BioScience 2000, 50, 313. [Google Scholar] [CrossRef] [Green Version]
  5. Blondel, J.; Aronson, J.; Bodiou, J.Y.; Boeuf, G. The Mediterranean Region: Biological Diversity in Space and Time; Oxford University Press: Oxford, UK, 2010. [Google Scholar]
  6. Plieninger, T.; Bieling, C. Resilience-Based Perspectives to Guiding High-Nature-Value Farmland through Socioeconomic Change. Ecol. Soc. 2013, 18. [Google Scholar] [CrossRef] [Green Version]
  7. Garrido, P.; Elbakidze, M.; Angelstam, P.; Plieninger, T.; Pulido, F.J.; Moreno, G. Stakeholder perspectives of wood-pasture ecosystem services: A case study from Iberian dehesas. Land Use Policy 2017, 60, 324–333. [Google Scholar] [CrossRef]
  8. O’Farrell, P.J.; Anderson, P.M. Sustainable multifunctional landscapes: A review to implementation. Curr. Opin. Environ. Sustain. 2010, 2, 59–65. [Google Scholar] [CrossRef]
  9. Pinto-Correia, T. Future development in Portuguese rural areas: How to manage agricultural support for landscape conservation? Landsc. Urban Plan. 2000, 50, 95–106. [Google Scholar] [CrossRef]
  10. Lamarque, P.; Tappeiner, U.; Turner, C.; Steinbacher, M.; Bardgett, R.D.; Szukics, U.; Schermer, M.; Lavorel, S. Stakeholder perceptions of grassland ecosystem services in relation to knowledge on soil fertility and biodiversity. Reg. Environ. Chang. 2011, 11, 791–804. [Google Scholar] [CrossRef]
  11. Gordon, L.J.; Finlayson, C.M.; Falkenmark, M. Managing water in agriculture for food production and other ecosystem services. Agric. Water Manag. 2010, 97, 512–519. [Google Scholar] [CrossRef]
  12. Rescia, A.J.; Willaarts, B.A.; Schmitz, M.F.; Aguilera, P.A. Changes in land uses and management in two Nature Reserves in Spain: Evaluating the social–ecological resilience of cultural landscapes. Landsc. Urban Plan. 2010, 98, 26–35. [Google Scholar] [CrossRef]
  13. Razeto, J.; Skewes, J.C.; Catalán, E. Prácticas de conservación, sistemas naturales y procesos culturales: Apuntes para una reflexión crítica desde la etnografía. Nat. Soc. Mirada Dimens. Hum. Conserv. Biodivers. Santiago Ocho Libros Editores 2019, 1, 75–106. [Google Scholar]
  14. Emmerson, M.; Morales, M.; Oñate, J.; Batáry, P.; Berendse, F.; Liira, J.; Aavik, T.; Guerrero, I.; Bommarco, R.; Eggers, S.; et al. How Agricultural Intensification Affects Biodiversity and Ecosystem Services. Adv. Ecol. Res. 2016, 55, 43–97. [Google Scholar] [CrossRef]
  15. Martín-López, B.; Oteros-Rozas, E.; Cohen-Shacham, E.; Santos-Martín, F.; Nieto-Romero, M.; Carvalho-Santos, C.; González, J.A.; García-Llorente, M.; Klass, K.; Geijzendorffer, I.; et al. Ecosystem Services Supplied by Mediterranean Basin Ecosystems; Routledge: Abingdon, UK, 2016. [Google Scholar] [CrossRef]
  16. European Commission. Our Natural Capital: An EU Biodiversity Strategy to 2020; European Commission: Brussels, Belgium, 2011. [Google Scholar]
  17. Council of European. European landscape convention. US/ICOMOS Sci. J. 2000, 2, 88–92. [Google Scholar]
  18. Costanza, R.; De Groot, R.; Sutton, P.; Van Der Ploeg, S.; Anderson, S.J.; Kubiszewski, I.; Farber, S.; Turner, R.K. Changes in the global value of ecosystem services. Glob. Environ. Chang. 2014, 26, 152–158. [Google Scholar] [CrossRef]
  19. Daily, G.C. Nature’s Services; Island Press: Washington, DC, USA, 1997; Volume 3. [Google Scholar]
  20. De Groot, R.S.; Alkemade, R.; Braat, L.; Hein, L.; Willemen, L. Challenges in integrating the concept of ecosystem services and values in landscape planning, management and decision making. Ecol. Complex. 2010, 7, 260–272. [Google Scholar] [CrossRef]
  21. Díaz, S.; Demissew, S.; Carabias, J.; Joly, C.; Lonsdale, M.; Ash, N.; Larigauderie, A.; Adhikari, J.R.; Arico, S.; Báldi, A. The IPBES Conceptual Framework—Connecting nature and people. Curr. Opin. Environ. Sustain. 2015, 14, 1–16. [Google Scholar] [CrossRef] [Green Version]
  22. Report of the Second Session of the Plenary of the Intergovernmental Science-Policy Platform on Biodiversity and Ecosystem Services. Available online: https://ipbes.net/sites/default/files/downloads/IPBES_2_17_en_0.pdf (accessed on 15 July 2020).
  23. Fischer, J.; Gardner, T.A.; Bennett, E.M.; Balvanera, P.; Biggs, R.; Carpenter, S.; Daw, T.; Folke, C.; Hill, R.; Hughes, T.P.; et al. Advancing sustainability through mainstreaming a social–ecological systems perspective. Curr. Opin. Environ. Sustain. 2015, 14, 144–149. [Google Scholar] [CrossRef]
  24. Schaich, H.; Bieling, C.; Plieninger, T. Linking Ecosystem Services with Cultural Landscape Research. GAIA Ecol. Perspect. Sci. Soc. 2010, 19, 269–277. [Google Scholar] [CrossRef]
  25. Moore, T.; Tully, G. Connecting landscapes: Examining and enhancing the relationship between stakeholder values and cultural landscape management in England. Landsc. Res. 2018, 43, 769–783. [Google Scholar] [CrossRef] [Green Version]
  26. Rewitzer, S.; Huber, R.; Grêt-Regamey, A.; Barkmann, J. Economic valuation of cultural ecosystem service changes to a landscape in the Swiss Alps. Ecosyst. Serv. 2017, 26, 197–208. [Google Scholar] [CrossRef]
  27. Plieninger, T.; Bieling, C.; Fagerholm, N.; Byg, A.; Hartel, T.; Hurley, P.; López, C.A.; Nagabhatla, N.; Oteros-Rozas, E.; Raymond, C.M.; et al. The role of cultural ecosystem services in landscape management and planning. Curr. Opin. Environ. Sustain. 2015, 14, 28–33. [Google Scholar] [CrossRef] [Green Version]
  28. Pascual, U.; Balvanera, P.; Díaz, S.; Pataki, G.; Roth, E.; Stenseke, M.; Watson, R.T.; Dessane, E.B.; Islar, M.; Kelemen, E.; et al. Valuing nature’s contributions to people: The IPBES approach. Curr. Opin. Environ. Sustain. 2017, 26–27, 7–16. [Google Scholar] [CrossRef] [Green Version]
  29. Raymond, C.M.; Singh, G.G.; Benessaiah, K.; Bernhardt, J.R.; Levine, J.; Nelson, H.; Turner, N.J.; Norton, B.; Tam, J.; Chan, K.M.A. Ecosystem Services and Beyond: Using Multiple Metaphors to Understand Human-Environment Relationships. BioScience 2013, 63, 536–546. [Google Scholar] [CrossRef] [Green Version]
  30. Chan, K.M.; Satterfield, T.; Goldstein, J. Rethinking ecosystem services to better address and navigate cultural values. Ecol. Econ. 2012, 74, 8–18. [Google Scholar] [CrossRef] [Green Version]
  31. Daniel, T.C.; Muhar, A.; Arnberger, A.; Aznar, O.; Boyd, J.W.; Chan, K.M.A.; Costanza, R.; Elmqvist, T.; Flint, C.G.; Gobster, P.H.; et al. Contributions of cultural services to the ecosystem services agenda. Proc. Natl. Acad. Sci. USA 2012, 109, 8812–8819. [Google Scholar] [CrossRef] [Green Version]
  32. Cowling, R.M.; Egoh, B.; Knight, A.T.; O’Farrell, P.J.; Reyers, B.; Rouget, M.; Roux, D.J.; Welz, A.; Wilhelm-Rechman, A. An operational model for mainstreaming ecosystem services for implementation. Proc. Natl. Acad. Sci. USA 2008, 105, 9483–9488. [Google Scholar] [CrossRef] [Green Version]
  33. Chan, K.M.A.; Balvanera, P.; Benessaiah, K.; Chapman, M.; Díaz, S.; Gómez-Baggethun, E.; Gould, R.; Hannahs, N.; Jax, K.; Klain, S.; et al. Why protect nature? Rethinking values and the environment. Proc. Natl. Acad. Sci. USA 2016, 113, 1462–1465. [Google Scholar] [CrossRef] [Green Version]
  34. Martínez-Sastre, R.; Ravera, F.; González, J.; López, C.A.; Bidegain, I.; Munda, G. Mediterranean landscapes under change: Combining social multicriteria evaluation and the ecosystem services framework for land use planning. Land Use Policy 2017, 67, 472–486. [Google Scholar] [CrossRef]
  35. Beymer-Farris, B.A.; Bassett, T.J.; Bryceson, I. Promises and pitfalls of adaptive management in resilience thinking: The lens of political ecology. In Resilience and the Cultural Landscape: Understanding and Managing Change in Human-Shaped Environments; Bieling, C., Plieninger, T., Eds.; Cambridge University Press: Cambridge, UK, 2012; pp. 283–300. [Google Scholar] [CrossRef]
  36. Gobster, P.H.; Nassauer, J.I.; Daniel, T.C.; Fry, G. The shared landscape: What does aesthetics have to do with ecology? Landsc. Ecol. 2007, 22, 959–972. [Google Scholar] [CrossRef]
  37. Fry, G.; Tveit, M.; Ode, Å.; Velarde, M. The ecology of visual landscapes: Exploring the conceptual common ground of visual and ecological landscape indicators. Ecol. Indic. 2009, 9, 933–947. [Google Scholar] [CrossRef]
  38. López, C.A.; Oteros-Rozas, E.; Martín-López, B.; Plieninger, T.; Martín, E.G.; González, J.A. Using visual stimuli to explore the social perceptions of ecosystem services in cultural landscapes: The case of transhumance in Mediterranean Spain. Ecol. Soc. 2014, 19. [Google Scholar] [CrossRef]
  39. Daniel, T.C. Whither scenic beauty? Visual landscape quality assessment in the 21st century. Landsc. Urban Plan. 2001, 54, 267–281. [Google Scholar] [CrossRef]
  40. Arriaza, M.; Cañas-Ortega, J.; Cañas-Madueño, J.; Ruiz-Aviles, P. Assessing the visual quality of rural landscapes. Landsc. Urban Plan. 2004, 69, 115–125. [Google Scholar] [CrossRef]
  41. Surová, D.; Pinto-Correia, T. Landscape preferences in the cork oak Montado region of Alentejo, southern Portugal: Searching for valuable landscape characteristics for different user groups. Landsc. Res. 2008, 33, 311–330. [Google Scholar] [CrossRef]
  42. Harper, D. Talking about pictures: A case for photo elicitation. Vis. Stud. 2002, 17, 13–26. [Google Scholar] [CrossRef]
  43. Shannon-Baker, P.; Edwards, C. The Affordances and Challenges to Incorporating Visual Methods in Mixed Methods Research. Am. Behav. Sci. 2018, 62, 935–955. [Google Scholar] [CrossRef]
  44. Bernard, H.R. Research Methods in Anthropology. Qualitative and Quantitative Approaches; Altamira Press: Lanham, MD, USA, 2005. [Google Scholar]
  45. Bryman, A. Social Research Methods, 3rd ed.; Oxfor University Press Inc.: Oxford, UK, 2012. [Google Scholar]
  46. Spanish National Ecosystem Assessment. Ecosystem and Biodiversity for Human Wellbeing. Synthesis of the Key Findings; Biodiversity Foundation of the Spanish Ministry of Agriculture Food and Environment: Madrid, Spain, 2013; p. 90. [Google Scholar]
  47. Millennium Ecosystem Assessment. Ecosystems and Human Well-Being; Island Press: Washington DC, USA, 2005; Volume 5. [Google Scholar]
  48. Oteros-Rozas, E.; González, J.; Martín-López, B.; López, C.A.; Zorrilla-Miras, P.; Montes, C. Evaluating Ecosystem Services in Transhumance Cultural LandscapesAn Interdisciplinary and Participatory Framework. GAIA Ecol. Perspect. Sci. Soc. 2012, 21, 185–193. [Google Scholar] [CrossRef]
  49. Van den Wollenberg, A.L. Redundancy analysis an alternative for canonical correlation analysis. Psychometrika 1977, 42, 207–219. [Google Scholar] [CrossRef]
  50. Borcard, D.; Gillet, F.; Legendre, P. Numerical Ecology with R; Springer: Cham, Switzerland, 2011. [Google Scholar] [CrossRef]
  51. Martín-López, B.; Iniesta-Arandia, I.; García-Llorente, M.; Palomo, I.; Casado-Arzuaga, I.; Del Amo, D.G.; Gómez-Baggethun, E.; Oteros-Rozas, E.; Palacios-Agundez, I.; Willaarts, B.; et al. Uncovering ecosystem service bundles through social preferences. PLoS ONE 2012, 7, e38970. [Google Scholar] [CrossRef] [Green Version]
  52. Gibson, J.J. The Ecological Approach to the Visual Perception of Pictures. Leonardo 1978, 11, 227. [Google Scholar] [CrossRef]
  53. Maturana, H.R.; Varela, F.J. The Tree of Knowledge: The Biological Roots of Human Understanding; Shambhala: Boulder, CO, USA, 1987. [Google Scholar]
  54. Chemero, A. Radical Embodied Cognitive Science; Institute of Technology Press: Cambridge, MA, USA, 2009; p. 252. [Google Scholar]
  55. Bennett, E.; Cramer, W.; Begossi, A.; Cundill, G.; Diaz, S.; Egoh, B.; Geijzendorffer, I.R.; Krug, C.; Lavorel, S.; Lazos, E.; et al. Linking biodiversity, ecosystem services, and human well-being:three challenges for designing research for sustainability. Curr. Opin. Environ. Sustain. 2015, 14, 76–85. [Google Scholar] [CrossRef]
  56. Tengö, M.; Brondizio, E.S.; Elmqvist, T.; Malmer, P.; Spierenburg, M. Connecting Diverse Knowledge Systems for Enhanced Ecosystem Governance: The Multiple Evidence Base Approach. Ambio 2014, 43, 579–591. [Google Scholar] [CrossRef] [Green Version]
  57. Russell, R.; Guerry, A.D.; Balvanera, P.; Gould, R.K.; Basurto, X.; Chan, K.M.; Klain, S.; Levine, J.; Tam, J. Humans and Nature: How Knowing and Experiencing Nature Affect Well-Being. Annu. Rev. Environ. Resour. 2013, 38, 473–502. [Google Scholar] [CrossRef]
  58. Liu, J.; Dietz, T.; Carpenter, S.; Folke, C.; Alberti, M.; Redman, C.; Schneider, S.; Ostrom, E.; Pell, A.; Lubchenco, J.; et al. Coupled human and natural systems. Ambio 2007, 36, 639–649. [Google Scholar] [CrossRef]
  59. Chan, K.M.A.; Gould, R.K.; Pascual, U. Editorial overview: Relational values: What are they, and what’s the fuss about? Curr. Opin. Environ. Sustain. 2018, 35, A1–A7. [Google Scholar] [CrossRef]
  60. Orenstein, D.E.; Katz-Gerro, T.; Dick, J. Environmental tastes as predictors of environmental opinions and behaviors. Landsc. Urban Plan. 2017, 161, 59–71. [Google Scholar] [CrossRef]
  61. López-Santiago, C.A. Lo Universal y lo Cultural en la Estética del Paisaje: Experimento Transcultural de Percepción del Paisaje. Ph.D. Thesis, Universidad Autónoma de Madrid, Madrid, Spain, 1994. [Google Scholar]
  62. Falk, J.H.; Balling, J.D. Evolutionary Influence on Human Landscape Preference. Environ. Behav. 2009, 42, 479–493. [Google Scholar] [CrossRef]
  63. Wilson, E.O. Biophilia; Harvard University Press: Cambridge, MA, USA, 1986. [Google Scholar]
  64. Díaz, M.; Tietje, W.D.; Barrett, R.H. Effects of Management on Biological Diversity and Endangered Species. In Mediterranean Oak Woodland Working Landscapes: Dehesas of Spain and Ranchlands of California; Campos, P., Huntsinger, L., Oviedo Pro, J.L., Starrs, P.F., Diaz, M., Standiford, R.B., Montero, G., Eds.; Springer: Dordrecht, The Netherlands, 2013; pp. 213–243. [Google Scholar] [CrossRef]
  65. Ingold, T. Being Alive: Essays on Movement, Knowledge and Description; Taylor and Francis: Abingdon, UK, 2011; pp. 1–270. [Google Scholar] [CrossRef] [Green Version]
  66. Menatti, L.; Da Rocha, A.C. Landscape and Health: Connecting Psychology, Aesthetics, and Philosophy through the Concept of Affordance. Front. Psychol. 2016, 7. [Google Scholar] [CrossRef] [Green Version]
  67. Iftekhar, M.S.; Takama, T. Perceptions of biodiversity, environmental services, and conservation of planted mangroves: A case study on Nijhum Dwip Island, Bangladesh. Wetl. Ecol. Manag. 2007, 16, 119–137. [Google Scholar] [CrossRef]
  68. Agbenyega, O.; Burgess, P.J.; Cook, M.; Morris, J. Application of an ecosystem function framework to perceptions of community woodlands. Land Use Policy 2009, 26, 551–557. [Google Scholar] [CrossRef] [Green Version]
  69. Hartter, J. Resource Use and Ecosystem Services in a Forest Park Landscape. Soc. Nat. Resour. 2010, 23, 207–223. [Google Scholar] [CrossRef]
  70. Harrison, P.A.; Vandewalle, M.; Sykes, M.T.; Berry, P.M.; Bugter, R.; De Bello, F.; Feld, C.K.; Grandin, U.; Harrington, R.; Haslett, J.R.; et al. Identifying and prioritising services in European terrestrial and freshwater ecosystems. Biodivers. Conserv. 2010, 19, 2791–2821. [Google Scholar] [CrossRef] [Green Version]
  71. García-Nieto, A.P.; Quintas-Soriano, C.; García-Llorente, M.; Palomo, I.; Montes, C.; Martín-López, B. Collaborative mapping of ecosystem services: The role of stakeholders’ profiles. Ecosyst. Serv. 2015, 13, 141–152. [Google Scholar] [CrossRef]
  72. García-Llorente, M.; Martín-López, B.; Nunes, P.; Castro, A.J.; Montes, C. A choice experiment study for land-use scenarios in semi-arid watershed environments. J. Arid. Environ. 2012, 87, 219–230. [Google Scholar] [CrossRef]
  73. Plieninger, T.; Torralba, M.; Hartel, T.; Fagerholm, N. Perceived ecosystem services synergies, trade-offs, and bundles in European high nature value farming landscapes. Landsc. Ecol. 2019, 34, 1565–1581. [Google Scholar] [CrossRef]
  74. Spangenberg, J.H.; Görg, C.; Truong, D.T.; Tekken, V.; Bustamante, J.V.; Settele, J. Provision of ecosystem services is determined by human agency, not ecosystem functions. Four case studies. Int. J. Biodivers. Sci. Ecosyst. Serv. Manag. 2014, 10, 40–53. [Google Scholar] [CrossRef] [Green Version]
  75. Orenstein, D.E.; Groner, E. In the eye of the stakeholder: Changes in perceptions of ecosystem services across an international border. Ecosyst. Serv. 2014, 8, 185–196. [Google Scholar] [CrossRef]
  76. Bernaldez, F.; Parra, F. Dimensions of Landscape Preferences from Pairwise Comparisons1. In Proceedings of Our National Landscape: A Conference on Applied Techniques for Analysis and Management of the Visual Resource; United States Department of Agriculture: Washington, DC, USA, 1979. [Google Scholar]
  77. Kaltenborn, B.P.; Bjerke, T. Associations between environmental value orientations and landscape preferences. Landsc. Urban Plan. 2002, 59, 1–11. [Google Scholar] [CrossRef]
  78. Ulrich, R.S. Human responses to vegetation and landscapes. Landsc. Urban Plan. 1986, 13, 29–44. [Google Scholar] [CrossRef]
  79. Ulrich, R.S. The role of trees in human well-being and health. In Proceedings from Fourth Urban Forestry Conference; American Forestry Association: Chicago, IL, USA, 1990; pp. 25–30. [Google Scholar]
  80. Metzger, M.J.; Rounsevell, M.; Acosta-Michlik, L.; Leemans, R.; Schröter, D. The vulnerability of ecosystem services to land use change. Agric. Ecosyst. Environ. 2006, 114, 69–85. [Google Scholar] [CrossRef]
  81. Ericksen, P.J. What Is the Vulnerability of a Food System to Global Environmental Change? Ecol. Soc. 2008, 13. [Google Scholar] [CrossRef] [Green Version]
  82. Louv, R. Last Child in the Woods: Saving Our Children from Nature-Deficit Disorder; Algonquin Books of Chapel Hill: Chapel Hill, NC, USA, 2005; p. 323. [Google Scholar]
  83. Zoderer, B.M.; Tasser, E.; Carver, S.; Tappeiner, U. Stakeholder perspectives on ecosystem service supply and ecosystem service demand bundles. Ecosyst. Serv. 2019, 37, 100938. [Google Scholar] [CrossRef]
  84. Foley, J.A.; DeFries, R.; Asner, G.P.; Barford, C.; Bonan, G.; Carpenter, S.R.; Chapin, F.S.; Coe, M.T.; Daily, G.C.; Gibbs, H.K.; et al. Global Consequences of Land Use. Science 2005, 309, 570–574. [Google Scholar] [CrossRef] [PubMed] [Green Version]
  85. Antrop, M. Landscape change and the urbanization process in Europe. Landsc. Urban Plan. 2004, 67, 9–26. [Google Scholar] [CrossRef]
  86. Sánchez Martínez, J.D.; Paniza Cabrera, A. The olive monoculture in the south of Spain. Eur. J. Geogr. 2015, 6, 16–29. [Google Scholar]
  87. Plieninger, T. Habitat loss, fragmentation, and alteration—Quantifying the impact of land-use changes on a Spanish dehesa landscape by use of aerial photography and GIS. Landsc. Ecol. 2006, 21, 91–105. [Google Scholar] [CrossRef]
Publisher’s Note: MDPI stays neutral with regard to jurisdictional claims in published maps and institutional affiliations.
Figure 1. Social-ecological sectorization of the study area and land uses. Source: Information network of Andalucía (www.juntadeandalucia.es).
Land 09 00390 g001
Figure 2. Images of landscapes units used in the ecosystem services valuation.
Land 09 00390 g002
Figure 3. Relative frequencies of declared motivations in landscape preferences.
Land 09 00390 g003
Figure 4. Biplot of redundancy analysis (RDA) results, including the images of the landscapes analyzed.
Land 09 00390 g004
Figure 5. Radar graphs of ecosystem services delivery perceptions for each landscape.
Land 09 00390 g005
Table 1. Ranking of landscape preferences for general public and experts (see photographs in Figure S4).
General Public (n = 389)Experts (n = 33)
PhotoMeanStandard DeviationPhotoMeanStandard Deviation
1310.944.061311.383.90
49.374.05611.313.22
118.974.77710.933.69
68.703.9299.413.81
148.634.5718.973.62
77.974.13158.553.53
157.474.4728.073.74
107.164.1847.697.65
96.694.48127.174.12
56.624.26107.143.58
26.573.9256.834.12
86.477.04146.484.38
36.195.4985.313.29
166.114.64114.214.10
126.064.4333.554.88
15.934.33161.592.57
Table 2. Stakeholder classification.
Stakeholder ClustersDefining VariablesDeclared MotivationsLandscape Preferences
Sociocultural AttributesSocial-Ecological SectorHigherLowerHigher ValueLower Value
Livestock-related people (75)agro-environmental association member *, herder, menlivestock and forestry *subsistence, ecological value, sense of place 9, 15, 1, 7, 123, 14, 11, 10, 16
Environmentally aware people (94)university graduate *, young *, environment and rural development jobs; protected area visitorsurban municipalitiesecological value *subsistence 11, 14, 6, 128, 3, 16, 5, 10
Olive groves-related people (96)lower levels of education *, farmer, elderlyagrarian municipalities *subsistence, heritageecological value *16, 3, 10, 812, 9, 11, 14
Urban-minded people (86)urban feeling *, women *, urban jobsurban municipalities *scenic beauty 11, 14, 8, 10, 31, 15, 12, 7, 4
Each row represents sociocultural variables, declared motivations and landscape preferences that best represent each stakeholder group. Variables marked with an * were statistically significant in chi-squared tests (p-value < 0.05).
Table 3. Significant results from Kruskal–Wallis analysis among stakeholder clusters for ecosystem services valuation. Only services that showed significant differences among groups (p-value < 0.05) are included (the complete results of the analysis are provided in Table S8).
LandscapeEcosystem ServicesCattle-RelatedUrban RelatedOlive-RelatedEnviron. AwareStatistics
Conventional olive groveFood from agriculture2.40 A2.68 B2.75 B2.76 BK = 9.34 p = 0.025
Food for cattle0.69 B0.66 B0.70 B0.35 AK = 10.39 p = 0.015
Wild food1.10 A B1.47 B1.03 A0.76 AK = 17.37 p = 0.0006
Water supply and quality1.05 A B1.26 B1.36 B0.80 AK = 9.60 p = 0.0223
Pollination1.10 A B1.32 B1.36 B0.93 AK = 9.26 p = 0.0223
Pest control1.07 A1.57 B1.67 B1.24 ABK = 11.34 p = 0.010
Scenic beauty1.17 A1.57 B1.76 B0.83 AK = 30.40 p < 0.0001
MosaicWater supply and quality1.71 B1.68 B1.76 B1,37 AK = 10.46 p = 0.0150
Pollination1.88 B1.85 B1.85 B1.52 AK = 10.40 p = 0.0155
Scenic beauty2.17 B2.22 B2.15 B1.87 AK = 22.59 p < 0.0001
Cultural identity2.60 B2.54 B2.55 AB2.28 AK = 9.09 p = 0.0281
Pine plantationsFavorable climate2.67 AB2.31 A2.45 B2.77 BK = 26.29 p < 0.0001
Scenic beauty2.14 A2.85 B2.36 A2.79 BK = 26.29 p < 0.0001
DehesaScenic beauty2.60 B2.31 A2.54 B2.65 BK = 11.46 p = 0.0095
Cultural identity2.45 B1.88 A1.82 A2.15 ABK = 7.78 p = 0.0507
Mediterranean forestPest control2.60 B2.07 A2.01 A1.96 AK = 12.49 p = 0.059
Cultural identity2.33 B2.73 A2.54 A2.32 AK = 16.89 p = 0.0007
Non-tillage olive grovesCultural identity2.33 A2.72 B2.53 AB2.32 AK = 10.89 p = 0.0123
Tourism1.86 B1.66 B1.64 B1.33 AK = 9.71 p = 0.0212
Scenic beauty1.71 AB1.93 B1.81 B1.46 AK = 10.43 p < 0.0152

