Effects of Marine Exhaust Gas Scrubbers on Gas and Particle Emissions


IVL Swedish Environmental Research Institute, 400 14 Gothenburg, Sweden
*
Author to whom correspondence should be addressed.
J. Mar. Sci. Eng. 2020, 8(4), 299; https://doi.org/10.3390/jmse8040299
Submission received: 24 March 2020
/
Revised: 15 April 2020
/
Accepted: 21 April 2020
/
Published: 24 April 2020
(This article belongs to the Special Issue Marine Engines Performance and Emissions)
Abstract
:There is an increase in installations of exhaust gas scrubbers on ships following international regulations on sulphur content in marine fuel from 2020. We have conducted emission measurements on a four-stroke marine engine using low sulphur fuel oil (LSFO) and heavy fuel oil (HFO) at different steady state engine loads. For the HFO the exhaust was probed upstream and downstream of an exhaust gas scrubber. While sulphur dioxide was removed with high efficiency in the scrubber, the measurements of particle emissions indicate lower emissions at the use of LSFO than downstream of the scrubber. The scrubber removes between 32% and 43% of the particle mass from the exhaust at the HFO tests upstream and downstream of the scrubber, but levels equivalent to those in LSFO exhaust are not reached. Decreases in the emissions of polycyclic aromatic hydrocarbons (PAH-16) and particulate matter as black carbon, organic carbon and elemental carbon, over the scrubber were observed for a majority of the trials, although emissions at LSFO use were consistently lower at comparable engine power.
1. Introduction
Regulations ban the use of marine residual fuels with sulphur mass content above 0.5% from 2020, in all ocean areas. The sulphur limits in emission control areas (SECAs) at 0.1% m/m will remain. The regulation further permits the use of exhaust gas cleaning systems (EGCS) that reduce the SO2 concentration in the exhaust to levels equivalent to those from the regulated fuel sulphur limits [1]. The same regulation that limits the marine fuel sulphur content also aims at reducing particle emissions. A fundamental difference compared to the sulphur limit is that the permitted particle emission levels are not quantified but relies on the decrease of particle emissions with fuel sulphur content [2]. The emissions of particles after the exhaust gas scrubbing are accordingly neither regulated to a standard level nor is a specific measurement standard decided. The installation and operation of exhaust gas scrubbers on ships is often an attractive choice compared to operating a ship on refined fuel such as marine gasoil (MGO), from an economic perspective, see for example reference [3]. The classification society DNV GL estimates that approximately 4100 ships will be equipped with one or more EGCSs in 2021, based on statistics from a number of scrubber manufacturers [4]. Dry and liquid bulk carriers, container ships, cruise ships and roll-on/roll-off (RoRo) ships are the ship types most represented in the statistics. The engine power and fuel consumption of these ships are more important aspects than number of ships from an environmental perspective. A complete inventory on these parameters is not available. It seems though that large ships and high power engines are fitted with scrubbers to a larger extent than is the case for smaller ships.
Different scrubber designs exist. Open sea water scrubbers utilize the natural alkalinity of sea water and keep a high flow of process water in order to reduce SO2 in the exhaust. The wash water is discharged to sea, most often without substantial treatment. In closed-loop scrubber designs, the process water is fresh- or seawater with an added alkaline chemical, often sodium hydroxide. The water is recirculated in the system and the sodium hydroxide neutralizes the sulphuric acid, see [5] for chemical reactions. Small portions of the process water are extracted from the process and passed through a water treatment unit before being discharged to the sea. This is often referred to as bleed-off water. The treatment produces a residue sludge that is brought ashore to a port reception facility. Open systems can use over 100 times more scrubber fluid per kWh output of the engine than a closed loop system. Washwater discharge criteria set minimum pH, maximum polycyclic aromatic hydrocarbons (PAH) level, maximum nitrate level, and maximum turbidity level with guidelines given in Resolution 259(68) of the Marine Environmental Protection Committee of the International Maritime Organization (IMO). The same criteria are valid for effluents from closed-loop systems as for the open systems. An important aspect for all types of exhaust gas scrubbers is the relocation of substances in the exhaust gas from air to the marine environment when scrubber systems are employed [6].
Quantification and characterization of particle emissions from marine engines fitted with exhaust gas scrubbers are interesting from environmental and health perspectives. The effects of an extensive use of scrubbers could significantly impact particulate air emissions from shipping. A limited number of previous studies have been published with the purpose to quantify and communicate the potential to reduce harmful exhaust gases and particles by using marine exhaust gas scrubbers; in total, specific emissions from six marine engines equipped with scrubbers have been found in scientific literature [7,8,9,10,11]. The ability of scrubbers to efficiently abate SO2 is unchallenged while the effect of the exhaust gas scrubbing process on particle mass concentration varies significantly between the studies. Some measurements have indicated 75% reduction and more [7,9] and other studies conclude on more moderate particle reductions or even increases in particles over the scrubber [8,11]. A measured increase in particle mass over a wet scrubber has been explained as an increase in salt particles originating from salt in the process water and as an increase in sulphate particles due to low temperatures and high humidity after the scrubber [8]. Two peer reviewed studies comprise results from four engines in total and indicate between 7% and 75% particulate matter mass (PM) reduction over the scrubber of which one study presents the higher extreme, and the other find reductions below 45% from all tests [7,11]. The engine types, fuel oil, exhaust gas systems, and scrubber design differ between the two studies and could explain the differences in results.
Factors that influence particle removal in the scrubber include the design of the scrubber and scrubber process, and the composition of the exhaust gas particles [10]. The occurrence of semi-volatile species in the exhaust can be an important parameter since the temperatures in the scrubber process and during sampling will influence whether these species are solid or in gas phase. The sampling system setup could potentially be an important contributor to the large differences in results in different studies.
Only few studies have reported on the effects of scrubbers on specific particle contents and the variations are high. Elemental carbon (EC) concentration reductions range from 50% to 81% and reductions of condensable organic carbon (OC) concentrations of 13%–41% and 73%, in [7] and [8] respectively, and the reductions presented in [11] appear to be within this range however not quantified. Particulate sulphate increased over the scrubber in [8]. PAH contents were analysed by [7] who observed a significant reduction of the tested PAHs over the scrubber. There is a need for more measurement data on particle emissions in order to assess the potential environmental and health impacts of the increased use of scrubbers in shipping.
This paper presents the emission reduction potential of a closed-loop scrubber and compares emissions with those from combustion of low sulphur fuel oil (LSFO). LSFO is sometimes referred to as ultra-low sulphur fuel oil (ULSFO) or hybrid oil. There is no standard specifying density or viscosity for the LSFO fuels, and the name can be collectively used for marine fuels that do not fulfil the marine distillate specifications for e.g. viscosity and density in the ISO 8217 standard, but that are below the regulated limit for sulphur content in fuel. In this case the limit is 0.1%, and the LSFOs became available on the market shortly after the sulphur SECA regulations became effective. It costs less than MGO and is, therefore, the preferable choice among some ship operators. With the 0.5% global sulphur limit it is likely that hybrid fuels will be common also outside SECAs.
Our measurements cover both gases and particulate matter. Particle contents have been analysed for organic and elemental carbon, elements, and sulphur. The PAH content in particle and gas phase was analysed, and the SO3/H2SO4 content in gas phase was sampled. Furthermore, online instruments were used to measure gas concentrations, black carbon concentrations and particle number concentrations (PN). Analyses of the scrubber water and ecotoxicology tests were part of the same campaign but are reported separately [6].
2. Materials and Methods
The test ship is a RoPax ferry taking rolling goods and passengers, on a scheduled timetable between the ports and is one of the largest in its category. The engine used for the trials is of model 8LMAN48/60. It is a 9600 kW, four-stroke engine with common rail assisted fuel injection. The scrubber system tested uses seawater, with added sodium hydroxide for increased alkalinity, as process water. Tests on LSFO were conducted in February 2017 and tests on HFO in September 2017.
All sampling is performed through sampling holes cut in the exhaust pipe for the probes. One set of holes are cut on deck 11, upstream of the scrubber and another set on deck 15, downstream of the scrubber. During the measurements at LSFO operations, the set of holes on deck 11 are used for sampling, while both decks are used during the tests with HFO.
Tests with similar scopes are made at multiple steady state engine loads close to these load points:
85%, 75%, 50%, and 34% of maximum continuous rating (MCR), for measurements on LSFO.
76%, 49%, and 32% MCR, for measurements on heavy fuel oil upstream of the scrubber.
76%, 48%, and 41% MCR, for measurements on heavy fuel oil downstream of the scrubber.
The engine loads are equally relevant to everyday operations, although long periods on loads below 35% MCR are avoided.
A number of gases and metrics of particles are included in the measurement scheme. The gas phase pollutants are sampled without dilution, extracting the hot exhaust sample through a heated probe directly to online instruments and adsorbent tubes. A Horiba PG 350 measures sulphur dioxide (SO2), carbon monoxide (CO) and carbon dioxide (CO2) by non-dispersive infrared (NDIR), and nitrogen oxide (NOX) by chemiluminiscence. Raw gas is prior to the instrument conducted through a heated tube with Teflon lining via a ceramic filter to a preparation unit. The tube is heated to 190°C. The gas preparation unit cools the gas to 4°C and removes particles by filtration. The dry and particle free gas is used for continuous concentration measurements in the instruments with the interval 1 second. Hydrocarbons are measured with a flame ionisation detector instrument of model Graphite 52M-D. The instrument monitors total hydrocarbon, non-methane hydrocarbon and methane simultaneously. Hydrocarbons are measured as total carbon in unit ppb(V) of CH4 equivalents.
Gaseous SO3/H2SO4 concentrations are sampled in adsorbent glass tubes containing NaCl placed directly inside the exhaust channel. A flow is pumped through the NaCl tube and gas-phase H2SO4 reacts to form sodium sulphate and sodium bisulphate. Any gas-phase SO3 is converted to H2SO4 in the flue gas at temperatures below 500°C, and is not present at temperatures below 200°C due to the presence of water vapour in the exhaust [12]. Subsequent analysis of the salt columns by ion chromatography for sulphates is made at the IVL Swedish Environmental Research Institute laboratory in Gothenburg.
Two different devices for exhaust gas dilution are used prior to particle sampling and measurements. The first system is a dilution tunnel designed to comply with ISO standard 8178:2/8178:1 for partial dilution systems. Filtered ambient air is used as dilution gas. The dilution tunnel dilutes the exhaust gas sample to a ratio of ~1:5-20 and allows for minor adjustments of flow through the system. The exact dilution rate is checked by CO2 measurements using a sensor from Servomex in the diluted sample and comparing with the readings from the Horiba PG 350 in the raw exhaust gas. The second system is a Dekati Fine Particle Sampler (FPS) model 4000, using pressurized and optionally heated air in a two-stage dilution, with an adjustable dilution to a ratio of up to 1:500. A heated probe is used in all measurements with the FPS. The primary diffusion dilution stage dilutes the extracted exhaust sample with preheated air (set to ~250°C). The secondary ejector dilution step uses pressurized air of ambient temperature. The dilution ratios are determined from the ratio of CO2 in raw and diluted exhaust gas using a CO2 analyser from LiCor in the diluted sample.
The dilution tunnel is used prior to filter sampling for determination of PM mass and composition at LSFO operations and at HFO operations upstream of the scrubber while filter sampling downstream of the scrubber is conducted using dilution with the FPS. The choice not to use the dilution tunnel downstream of the scrubber is mainly due to space restrictions and inaccessibility of that measurement point; the dimensions of the dilution tunnel are approximately 1.5 × 1 × 0.3 m and the sampling point downstream of the scrubber is located on deck 15 and accessible only via ladders from six decks below. In order to assure comparability of the two dilution alternatives, filter sampling was conducted at similar engine loads both with the dilution tunnel and FPS at operations on LSFO and on HFO upstream of the scrubber. For particle measurements performed with the online particle instruments, the FPS is always used for the dilution.
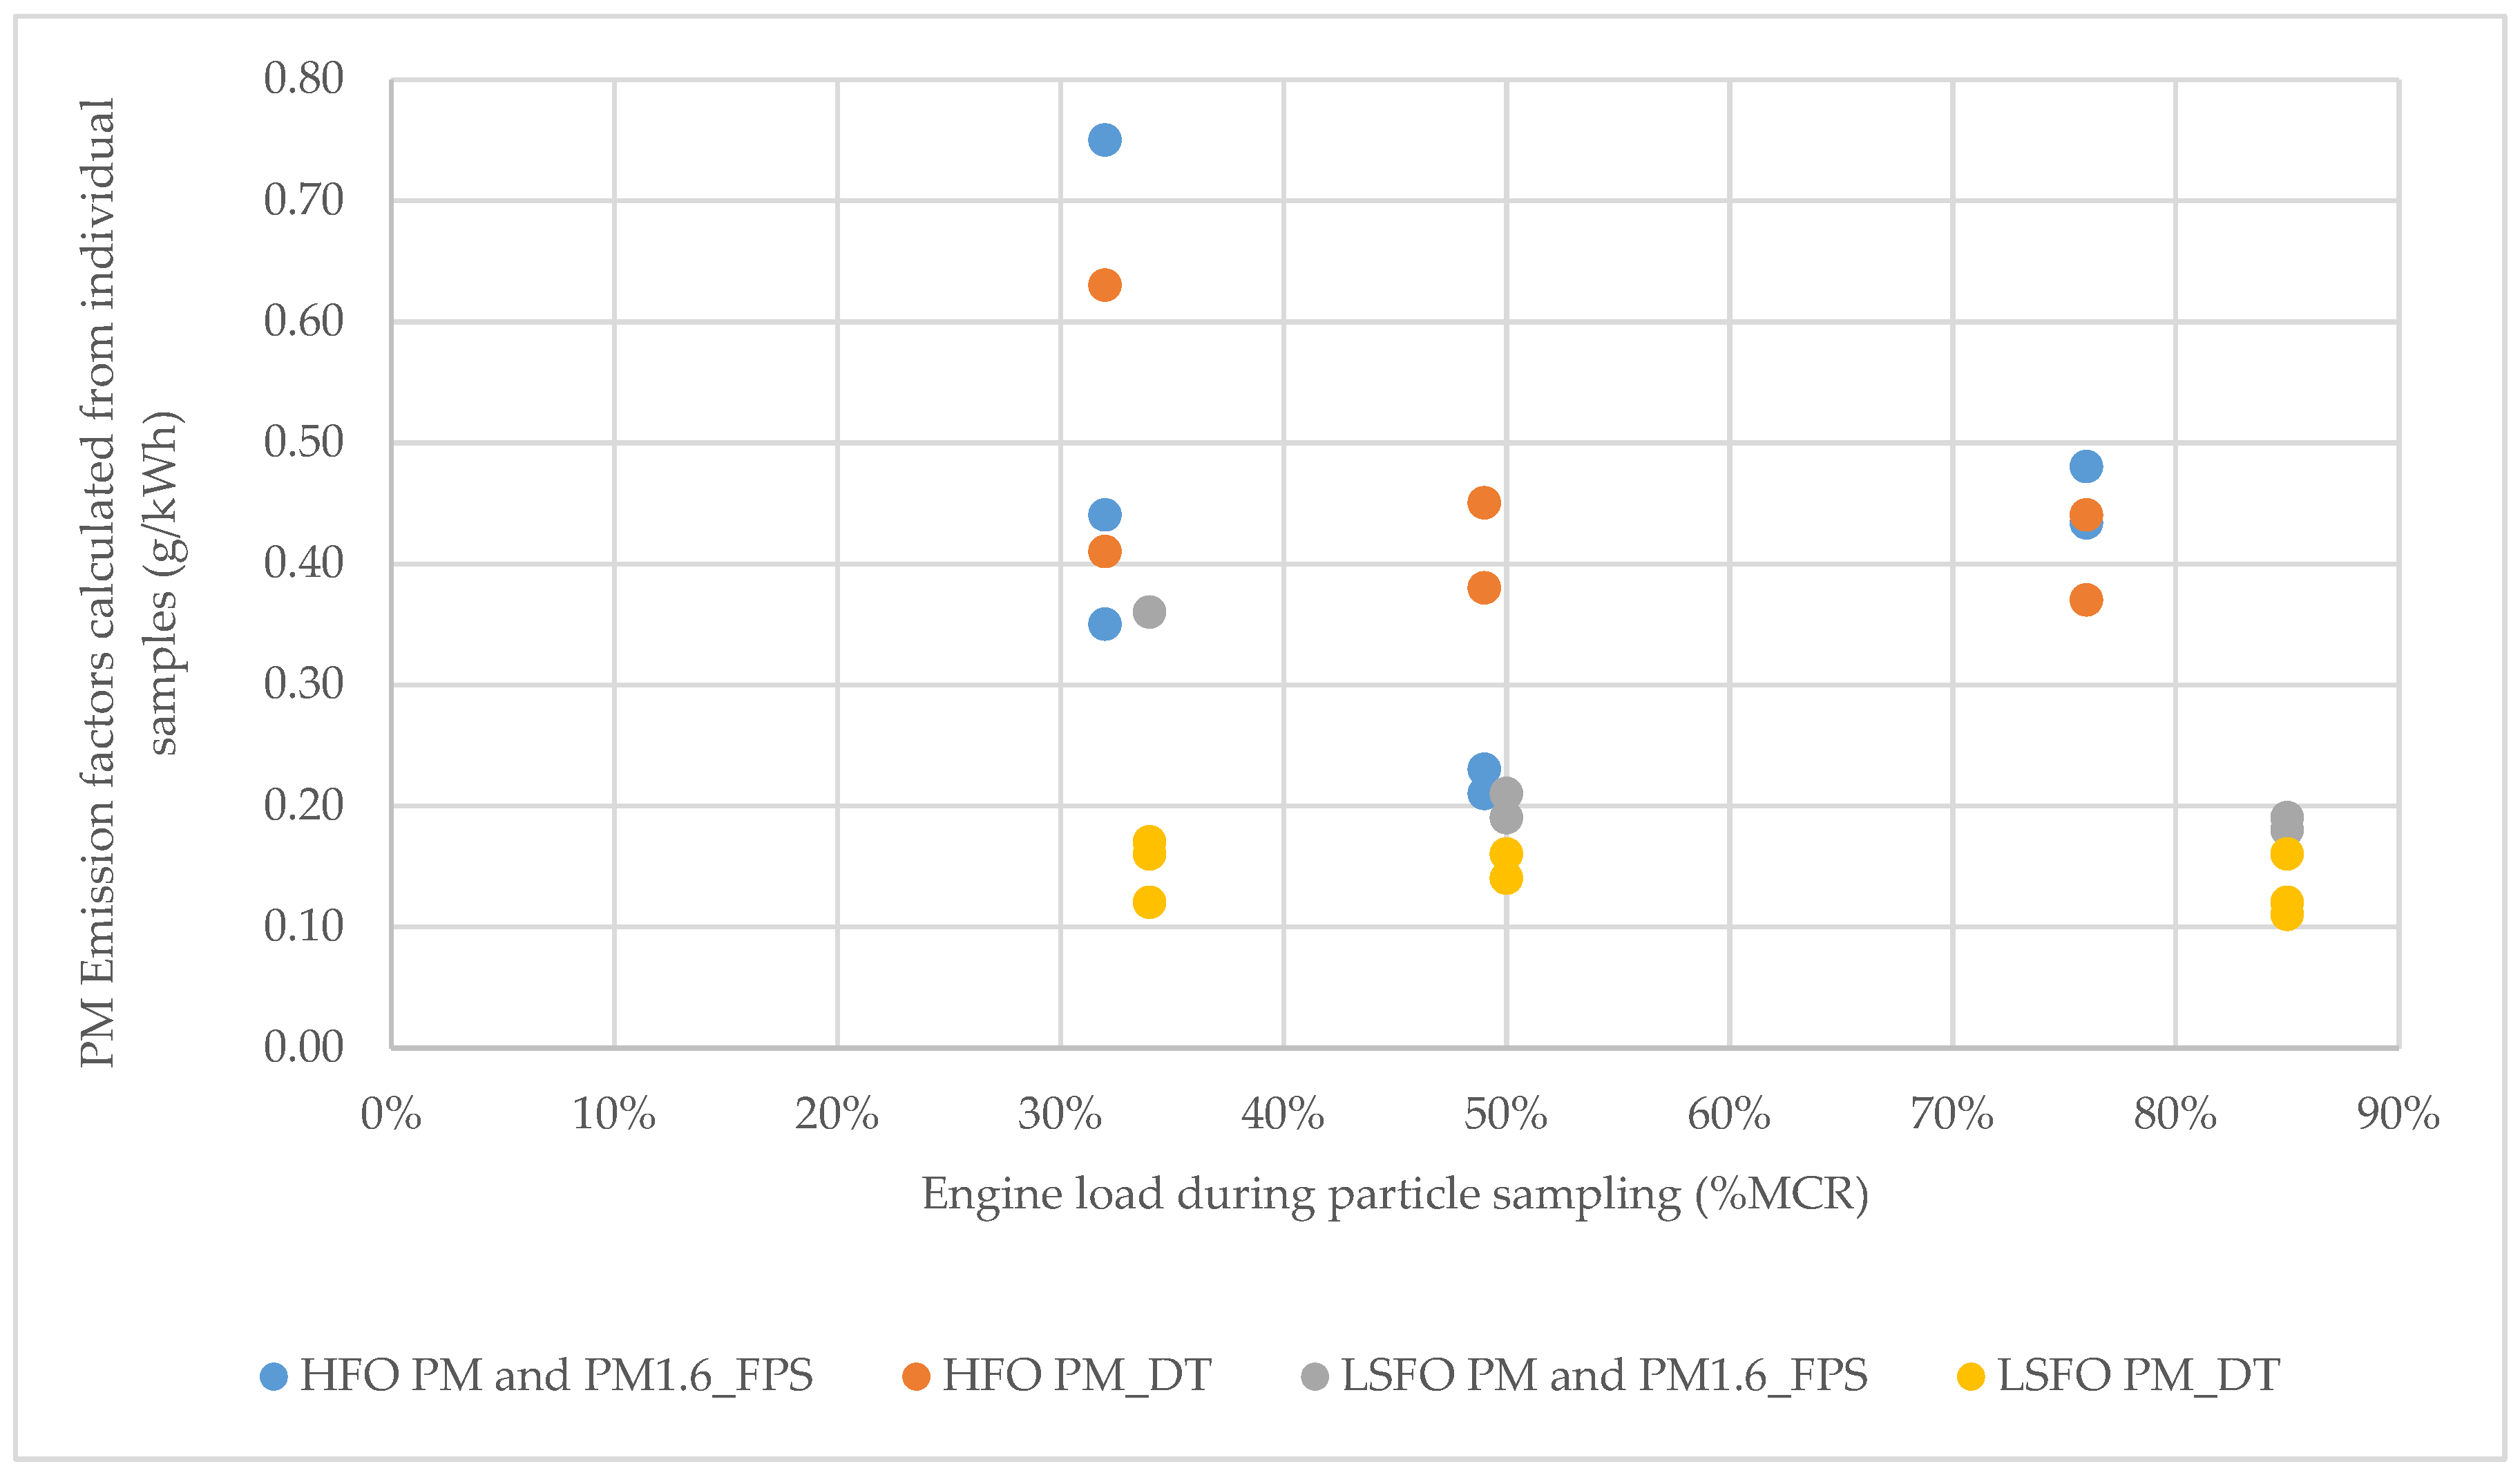
Sampling and dilution procedures bring uncertainties to the particle measurements. The first group of uncertainties relates to the representativeness of the extracted partial flow exhaust sample. Both dilution devices use isokinetic probes with adjustable inlet nozzle sizes to achieve near-isokinetic sampling. However, deviations can occur especially for the FPS device as the sample flux changes with the dilution ratio and the set-up does not allow for changes of the nozzle during the experiments. For particles in the typical size-range of the diesel exhaust particles, i.e., with a large part of the particle mass in sizes with particle diameter below 100 nm [13,14], deviation from the isokinetic sampling has only a small impact, and the isokinetic conditions are not required by ISO 8178 standard. Hence, potential influence of parameters that relates to particles’ kinetics is not investigated further. Secondly, uncertainties are related to the dilution process affecting both condensation and nucleation of semi-volatile species and hence the measured PM mass and number. Achieving ISO 8178 standard sampling downstream of the scrubber is not possible as the exhaust temperature at this point is too low. Our filter sampling experienced deviations from the standard, including a stack temperature downstream of the scrubber that was too low and often lower filter sampling temperatures than prescribed. The FPS device is not designed to fulfil the ISO 8178. We see that sampling with FPS at LSFO combustion results in higher particle emission estimates than when using the dilution tunnel. Contrary to this, the particle emissions at HFO combustion upstream of the scrubber are often indicated to be lower for measurements with the FPS than for measurements with the dilution tunnel. A large variability of the measured emission factors, also when only samples taken with the dilution tunnel are considered, reveals large uncertainties, especially at low engine loads. An analysis of all individual filter samples still indicates agreement between the sampling systems at the tests with high engine loads. For the low engine load, the individual samples vary more and there is less agreement between the two sampling systems, see Table A1 in the Appendix A and Figure 1.
At the tests with LSFO and the dilution tunnel, the temperatures at the filters were between 29 °C and 33 °C, which is close to the dilution air temperature. This is lower than prescribed by ISO 8178. Filter temperatures are not recorded for the other tests. The raw gas transfer line is a 5 meter long tube with Teflon lining, heated to 190 °C. Dilution ratios were between 15.9 and 23.8. The ambient temperature was approximately 35 °C at tests on HFO at the location upstream of the scrubber and approximately 50 °C at the location downstream of the scrubber. We can assume similar temperatures also at the filters. The FPS gives a record of the temperature of the sample leaving the device, and the PM sample temperature was indicated to be between 32 and 50 °C during the tests (see the table in the Appendix A for details). The automatic logging of temperature data during the tests were performed in high surrounding temperature and it is probable that the high temperature cause problems with the dilution system signals. The dilution ratios were however confirmed, also when logging failed, by the CO2 instruments. The transfer lines include approximately 1 meter insulated metal tubing prior to the FPS and 0.5 meter conductive tubing for the diluted sample. Table A1 in the Appendix A includes details on temperatures during sampling.
Particulate matter mass is sampled as PMtot and PM1.6 on polytetrafluoroethylene (PTFE) filters. Cyclones are used for the PM1.6 sampling, assuring that large particles are removed from the sampling stream before the filter. The cyclones used are primarily designed for a cutoff at particle diameter of 2.5 µm, however, the flow through the cyclone during the tests was higher than the design flow, resulting in a lower cutoff diameter. The size cutoff at particle diameter 1.6 µm is calculated from the actual flow through the system. The gravimetrical analysis of the filter samples was performed at the certified laboratory of IVL. The filters are weighed in a controlled environment before and after sampling. A Mettler Toledo model MT5 balance is used. The balance is calibrated to an uncertainty limit of ±3 μg in the range 0–10 000 μg and ±7 μg in the range 10 000–100 000 μg, our sample weights are in the range 15 000–100 000 µg (Table A1 in the Appendix A).
Elemental and organic carbon (EC/OC) content on particles are determined by sampling using filter holders with pre-heated double quartz filters (Pall, Tissuequarz). Backup filters are used to correct for the positive sampling artefact from condensation of volatile organics on the filter. A filter section with a total area of 2.01 cm2 is cut out of the filter for the analysis of OC and EC by a thermal–optical method (EC/OC analyser Model 4, Sunset Laboratory, USA) using the EUSAAR_2 temperature protocol [15]. The analyses of filters are conducted by Laboratory of Aerosols Chemistry and Physics; Institute of Chemical Process Fundamentals, in Prague. Reported uncertainties by the laboratory for their analyses are 10% for OC and 20% for EC.
An on-line electromobility-based instrument (TSI EEPS 3090) measures the number concentrations of particles between 5.6 nm and 560 nm in diameter in 32 size channels at 10 Hz. The instrument is used at HFO operations, upstream and downstream of the scrubber. There are no EEPS results for the LSFO fuel due to EEPS instrument failure during this fuel testing. A thermodenuder of model Dekati ELA 423 is used to vaporize volatile particles from the sample. We can thereby identify total number concentrations and size distributions of solid particles. The thermodenuder is heated to 300 °C in order to vaporize the volatile fraction of particles including many organics and sulphate. The use of a thermodenuder has been shown to also cause a loss of solid particles in the denuder through thermophoresis and diffusion depends on particle size, temperature, and velocity through the thermodenuder. Size dependent particle losses in the thermodenuder are calculated according to the manufacturer’s instructions.
Magee Scientific’s Aethalometer AE33, with continuous measurement of the attenuation of transmitted light at eight wavelengths is used for the detection of black carbon (BC) content. Measurement of absorption at 880 nm is interpreted as concentration of BC; in this context the BC refer to equivalent black carbon (eBC) as recommended in [16].
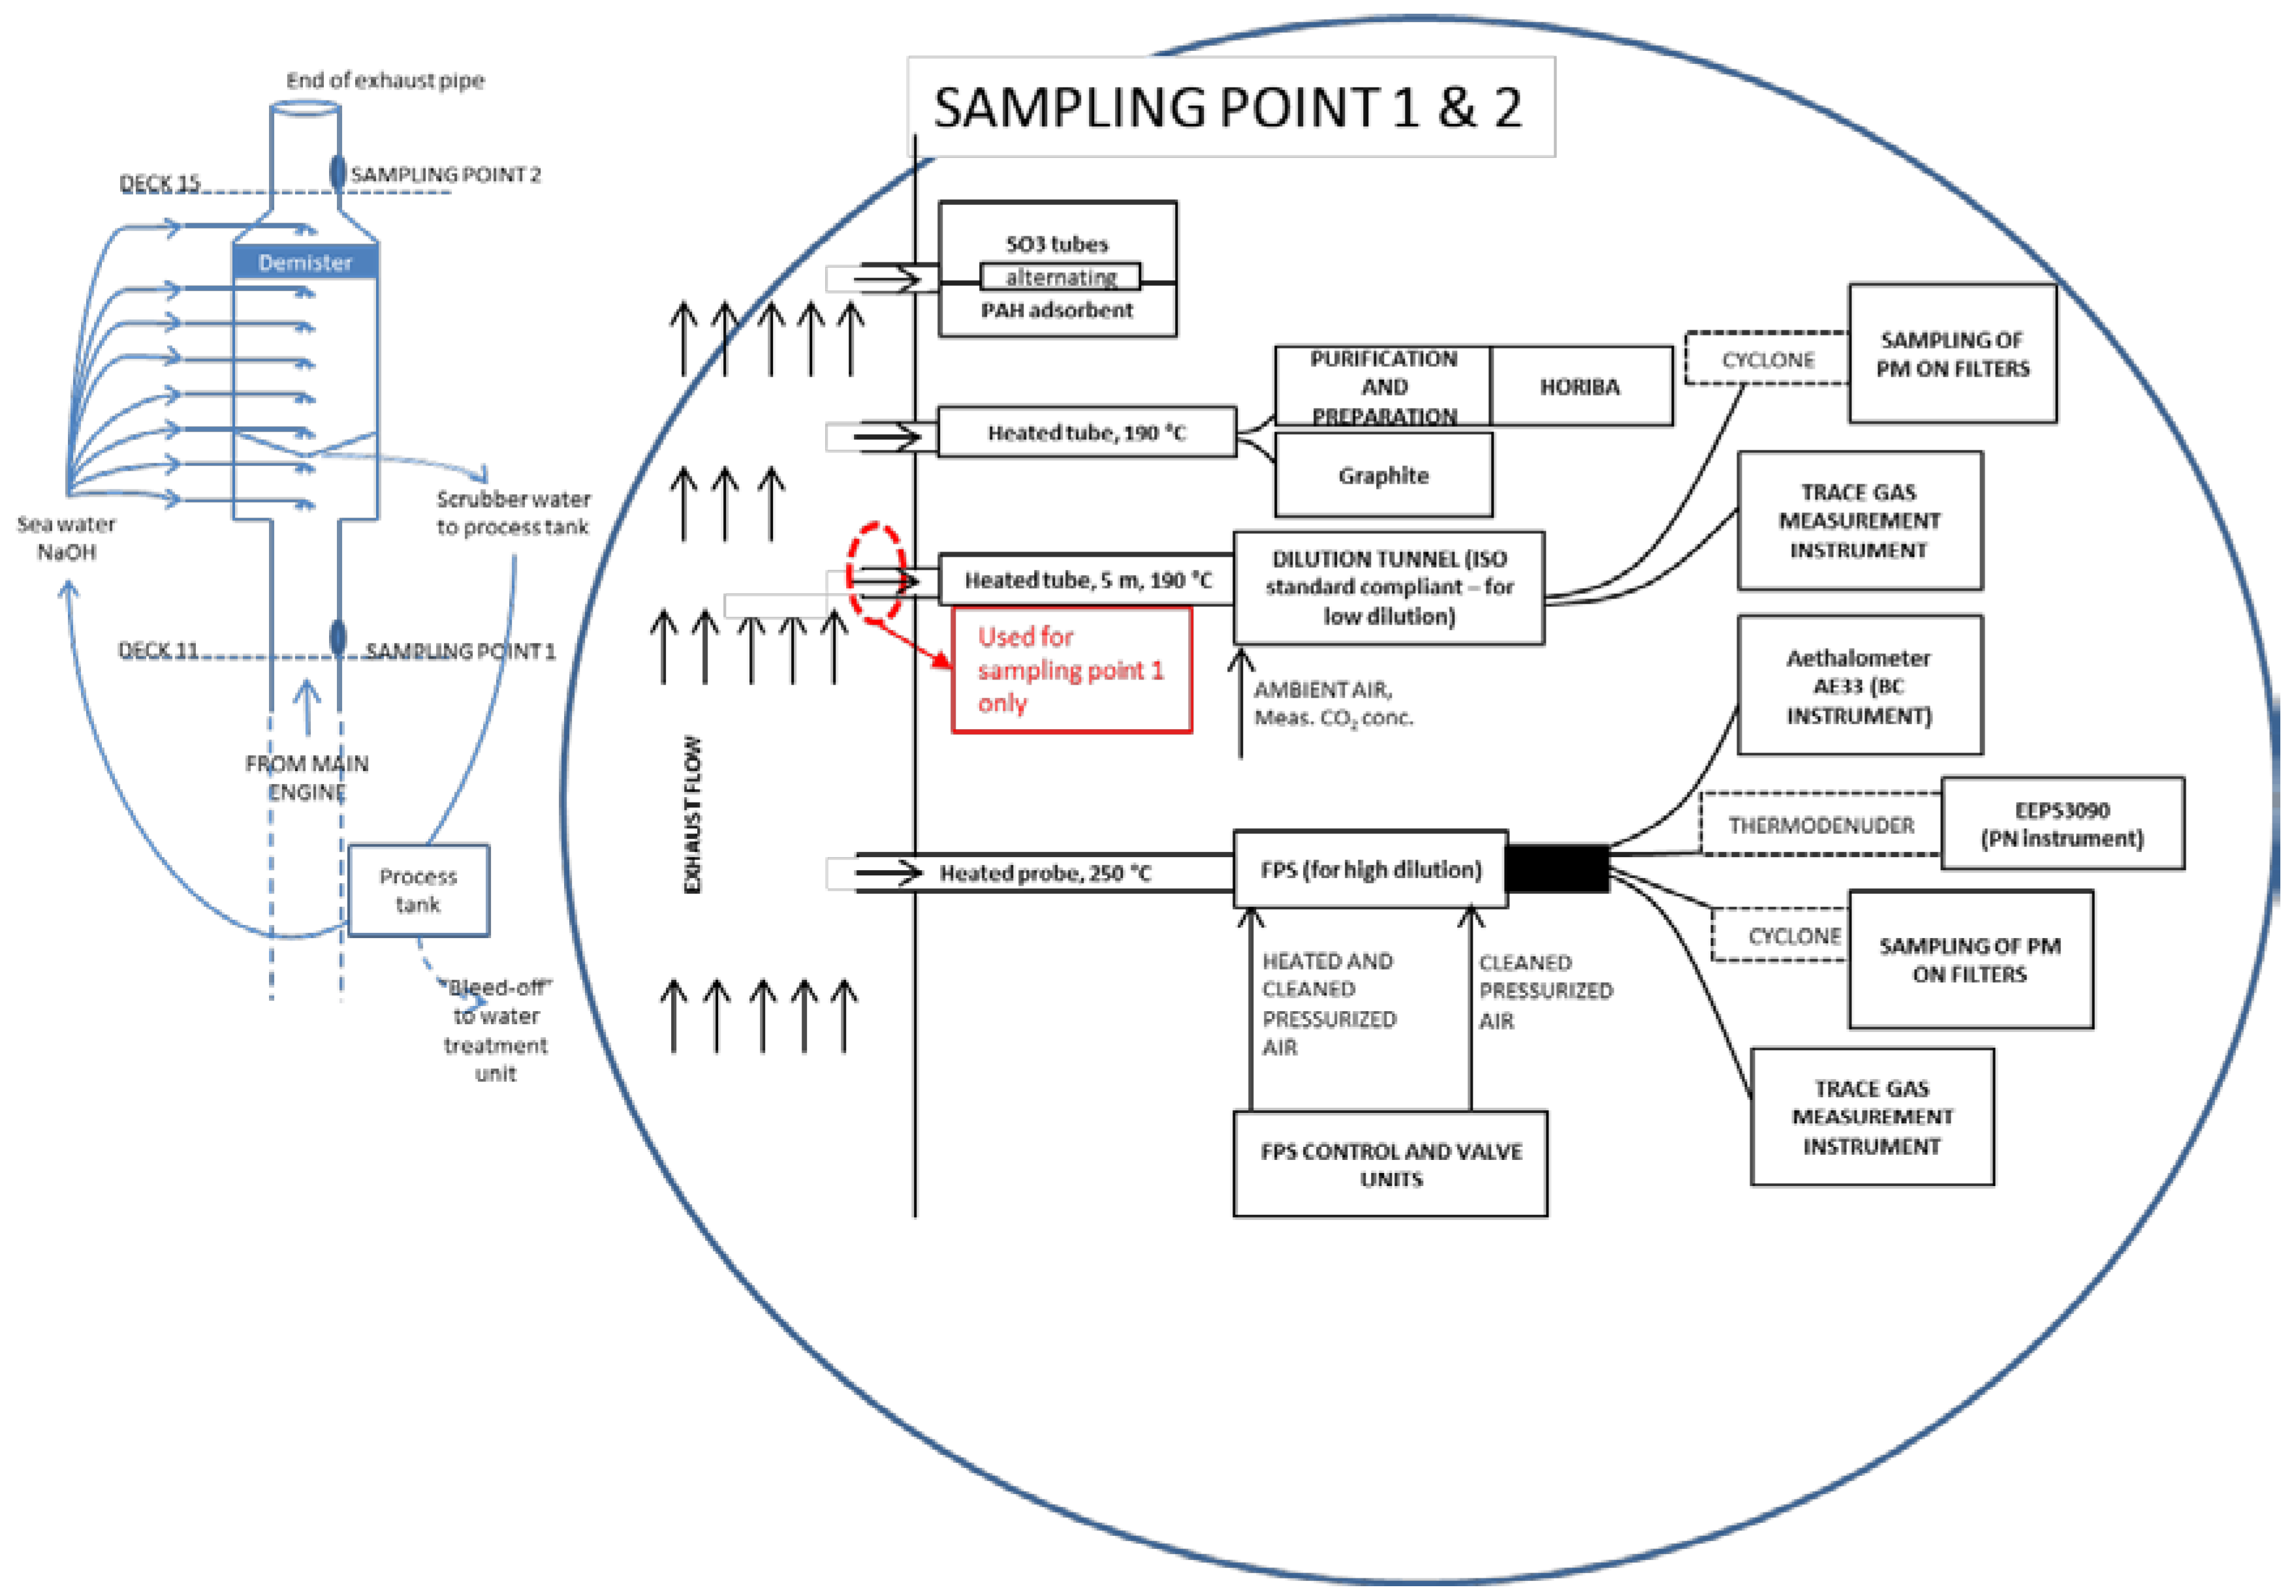
A schematic of the scrubber system and the instrument and sampling setup is presented in Figure 2.
Uncertainties in the on-line instruments are expressed as coefficients of variance of average values. The variations in dilution ratios are assumed to add more uncertainty to these results.
PAHs are sampled from the undiluted exhaust by an adsorbent for subsequent Soxhlet extraction and analysis by high-performance liquid chromatography (HPLC) in the IVL laboratory in Gothenburg. Particle-bound PAHs are collected on filters coupled in series to glass columns with XAD7 and polyurethane foam (PUF) absorbent for capture of gas phase PAH. This method gives an analysis of combined content of PAHs in gaseous and particulate form. Contents of USEPA’s PAH-16 priority pollutants are analysed. These include naphthalene, acenaphthylene, acenaphthene, fluorene, phenantrene, anthracene, fluoranthene, pyrene, benz[a]anthracene, chrysene, benzo[b]fluoranthene, benzo[k]fluoranthene, benzo[a]pyrene, dibenz[a, h]anthracene, benzo[ghi]perylene, and indeno[1,2,3-cd]pyrene.
Exhaust gas flow and emission factors of gases are calculated based on the carbon balance method as specified in ISO 8178:4. Fuel oil samples were sent for analysis of density, viscosity, calorific value and elemental content to the Saybolt Laboratory in Gothenburg. Analyses of the lubrication oil were also made. The density and viscosity of the HFO were significantly higher than those of the LSFO. The LSFO was still too viscous and dense to qualify as marine distillate oil (DMX-DFB) according to ISO 8217:2017 standard for marine fuels. The results from the analyses of the LSFO, the HFO, and the lube oil are presented in Table 1. Sulphur dioxide emissions are calculated from the sulphur content of fuel except for measurement downstream of the scrubber, since this presents a more reliable value than SO2 measurements with the gas analyser.
3. Results
We present results from two viewpoints. One aspect is the reduction of different pollutants over the scrubber at tests on HFO. This is interesting from the viewpoint of which substances in the exhaust gas that can be expected to be removed in the scrubbing process, and to what extent. We also compare emissions downstream of the scrubber with emissions from LSFO combustion. This is an interesting comparison to make from an environmental point of view since both solutions are alternatives to comply with existing regulation on sulphur in marine fuel and corresponding emissions. In addition, the composition of particles is presented and discussed separately.
The summary of results for specific fuel oil consumption and emissions are presented in Table 2, and further elaborated upon in the following text.
Uncertainties in the results cannot be described by the coefficient of variation alone. In addition, uncertainty is added from difficulties in determining the fuel flow. We estimate a load-dependent uncertainty of the specific fuel oil consumption (SFOC) which of approximately ±10% at 50% engine load and lower, and ±5% at more than 50% engine load for this engine and measurement. Determination of the dilution ratios is another source for uncertainties as well as the handling of samples in the rough environment in the funnel. Uncertainties in the PM sampling system setup further includes a loss of particles in the system that increases with the length of the transfer line from the exhaust gas channel to the dilutor.
3.1. Scrubber emission reduction efficiency
The scrubber efficiently reduces emissions of sulphur dioxide in the exhaust gases. The SO2 emission factor at HFO tests is reduced >99% over the scrubber, at all engine loads.
Around 1%–8% of the sulphur oxides that form during the combustion in a diesel engine are sulphur trioxide SO3 [17]. SO3 will react rapidly with water in the exhaust gas to form gaseous H2SO4. Condensed H2SO4 can cause corrosive damage in locations with low temperatures in the cylinder and the exhaust channel and levels are preferably kept at a minimum. The temperature at which the H2SO4 condenses depends on the concentration of SO3 and H2O in the gas. In a wet scrubber, the exhaust is rapidly cooled to below the acid dew point; the hot exhaust in our measurements were approximately 250 °C and reduced to 20 °C, over the scrubber. Since the rate of cooling exceeds that of H2SO4 gas absorption in the scrubber fluid, it has been suggested that sub-micron H2SO4 particles are formed [18]. A reduction of these particles in the scrubber is dependent on mass-transfer through Brownian diffusion. As a removal mechanism, it is not efficient enough to remove all H2SO4 from the exhaust gas [18].
The concentrations of gas phase sulphuric acid and sulphur trioxide (H2SO4/SO3) in our tests were significantly reduced over the scrubber. At 76% engine load there is a removal of 78% of the H2SO4/SO3. At the two lower engine loads the reduction is less, 61%–63%. The observed reduction efficiency for SO2 of over 99% for all loads indicates that the scrubber is less efficient in removing H2SO4/SO3 than in removing SO2. The measured H2SO4/SO3 concentrations are higher than the SO2 concentrations in the tests downstream of the scrubber. Metals such as V and Ni, present in the exhaust, can act as catalysts for the oxidation of SO2 to SO3, which can be a reason for the higher SO3 levels at combustion of HFO [19].
There is also a reduction of the CO concentration over the scrubber. At lower engine loads this is more pronounced. We saw minor differences in the emissions of NOX upstream and downstream of the scrubber at low engine loads. These differences are, however, most likely more related to the different engine loads than to scrubbing of NOX. The engine load is around 32% at tests upstream of the scrubber and 41% at tests downstream of the scrubber.
Furthermore, specific PM emissions at HFO combustion are reduced over the scrubber. Reductions are approximately 34% at 76% engine load, and 42% at 48%–49% engine load. These reductions are in line with a central value of PM reductions in a joint analysis of previous studies, although values to compare with are few and results vary significantly.
As presented in Table 2, both BC and EC measurement indicate that there are reductions over the scrubber. BC results are not as consistent as EC results, although also these indicate a removal rate that increase at low engine loads.
Particle number (PN) concentrations were measured only at tests on HFO. Measurements were conducted using a thermodenuder (TD) to remove volatile species. By removing a majority of the volatiles with the TD (some organic matter can still remain at 300 °C), the large uncertainties coupled to the nucleation of volatile particles during the sampling dilution process is eliminated. The fraction of the solid particles that remains downstream of the exhaust gas scrubber can therefore be argued to give a more reliable value on cleaning efficiency than total particles. No clear reducing effect on solid PN concentration by the scrubber is seen, see Table 2, although the size distribution is changed. Size distributions of solid particle number concentration are presented in Figure 3.
Recalculating particle numbers in the different size channels to particle mass indicates higher specific emissions downstream than upstream of the scrubber at 75-76% engine load. This can possibly be explained as salt formation during the scrubber process. The increase in mass despite the loss in EC over the scrubber further emphasizes that there might be an addition of solids during the process. There is no indication of increases in solid particle mass at tests at the lower engine loads, see Table 3.
While upstream of the scrubber the thermodenuder tests indicate large part of particles being volatile (50–85% by number), measurements downstream of the scrubber give comparable number concentrations of particles with and without the thermodenuder. This could be due to a high hydrophilic content of the particles, which would cause them to react with, and be removed by, the scrubber liquid during the scrubbing process to a large extent. Additional explanations include that as the exhaust temperature decreases in the scrubber stack, the volatile compounds condensate on any available surface, such as water droplets and solid particles, and the effect of the reheating of the cold sample in the dilution system.
There was a significant decrease of total particle number over the scrubber (Table 2). At the highest engine loads tested (75% and 76% MCR) the reduction was 79% and at the medium engine loads tested (48% and 49% MCR) the reduction was 82%. The lowest engine loads are not fully comparable since one test is run on 32% MCR and the other on 41% MCR, but the measurements indicate a significant reduction also at low loads.
3.2. From an environmental perspective
The measured SO2 emission factors with a scrubber and HFO fuel are lower than when the engine use LSFO, 84% to 96% lower from high to low engine load. Significant differences in emissions between the use of HFO combined with a scrubber, and LSFO, are observed for a number of gases (Table 2). There is a significant reduction of the total hydrocarbon (THC) concentration over the scrubber and specific emissions downstream of the scrubber are lower than at LSFO combustion for all engine loads tested. Emissions of CO and NOX are however lower for LSFO combustion than for HFO combustion combined with the scrubber.
Average specific PM mass emissions at combustion of LSFO with 0.1% sulphur are lower than PM emissions downstream of the scrubber when using HFO. Comparisons at 75% (LSFO) and 76% (downstream) engine loads indicate emissions are 59% lower at LSFO combustion. At engine loads of 50% (LSFO) and 48% (downstream) the specific PM mass emission is 36% lower.
Compared to previous studies on particle emissions from low sulphur fuels, our results are in the lower end. PM emissions increase with sulphur content of fuel due to the sulphate content of particles. However, the correlation between particle emissions and sulphur content in fuel is weak for fuels with sulphur content below <0.5%. Emission factors derived for fuels with sulphur contents in the interval 0–0.5% give a mean value for the PMtot emission factor of 0.2 g/kWh [2,8,11,14,20,21,22,23,24,25,26,27], compared to 0.12–0.17 g/kWh in our study. Other characteristics of fuel that impact particle formations include density, since a high density will increase combustion thermal efficiency, and viscosity, due to its impact on atomization during combustion. The low sulphur fuel oils will have higher density, increasing combustion efficiencies and oxidation of particles, and higher viscosity, which cause higher particle formation compared to distillate oils (Gysel et al). It is further difficult to relate how differences between engines and measurement setups influence the results. In two published studies, emissions from low-sulphur fuel oil and distillate oils have been tested on the same engine; Gysel et al., tested an MGO and a low sulphur (≤0.5%) fuel oil in the same engine and observed three times higher PM emissions from the latter [27]. Sulphur contents were 0.005% in the MGO and 0.009% in the LSFO. Winnes et al. observed similar differences in particle emissions when testing an MGO with 0.1% fuel sulphur content and a LSFO with 0.5% sulphur in two engines [20].
Specific emissions of both BC and EC downstream of the scrubber seem little influenced by engine load. Although some BC is removed by the scrubber, the specific emissions are higher than those from LSFO combustion by approximately 1.5 to 4 times.
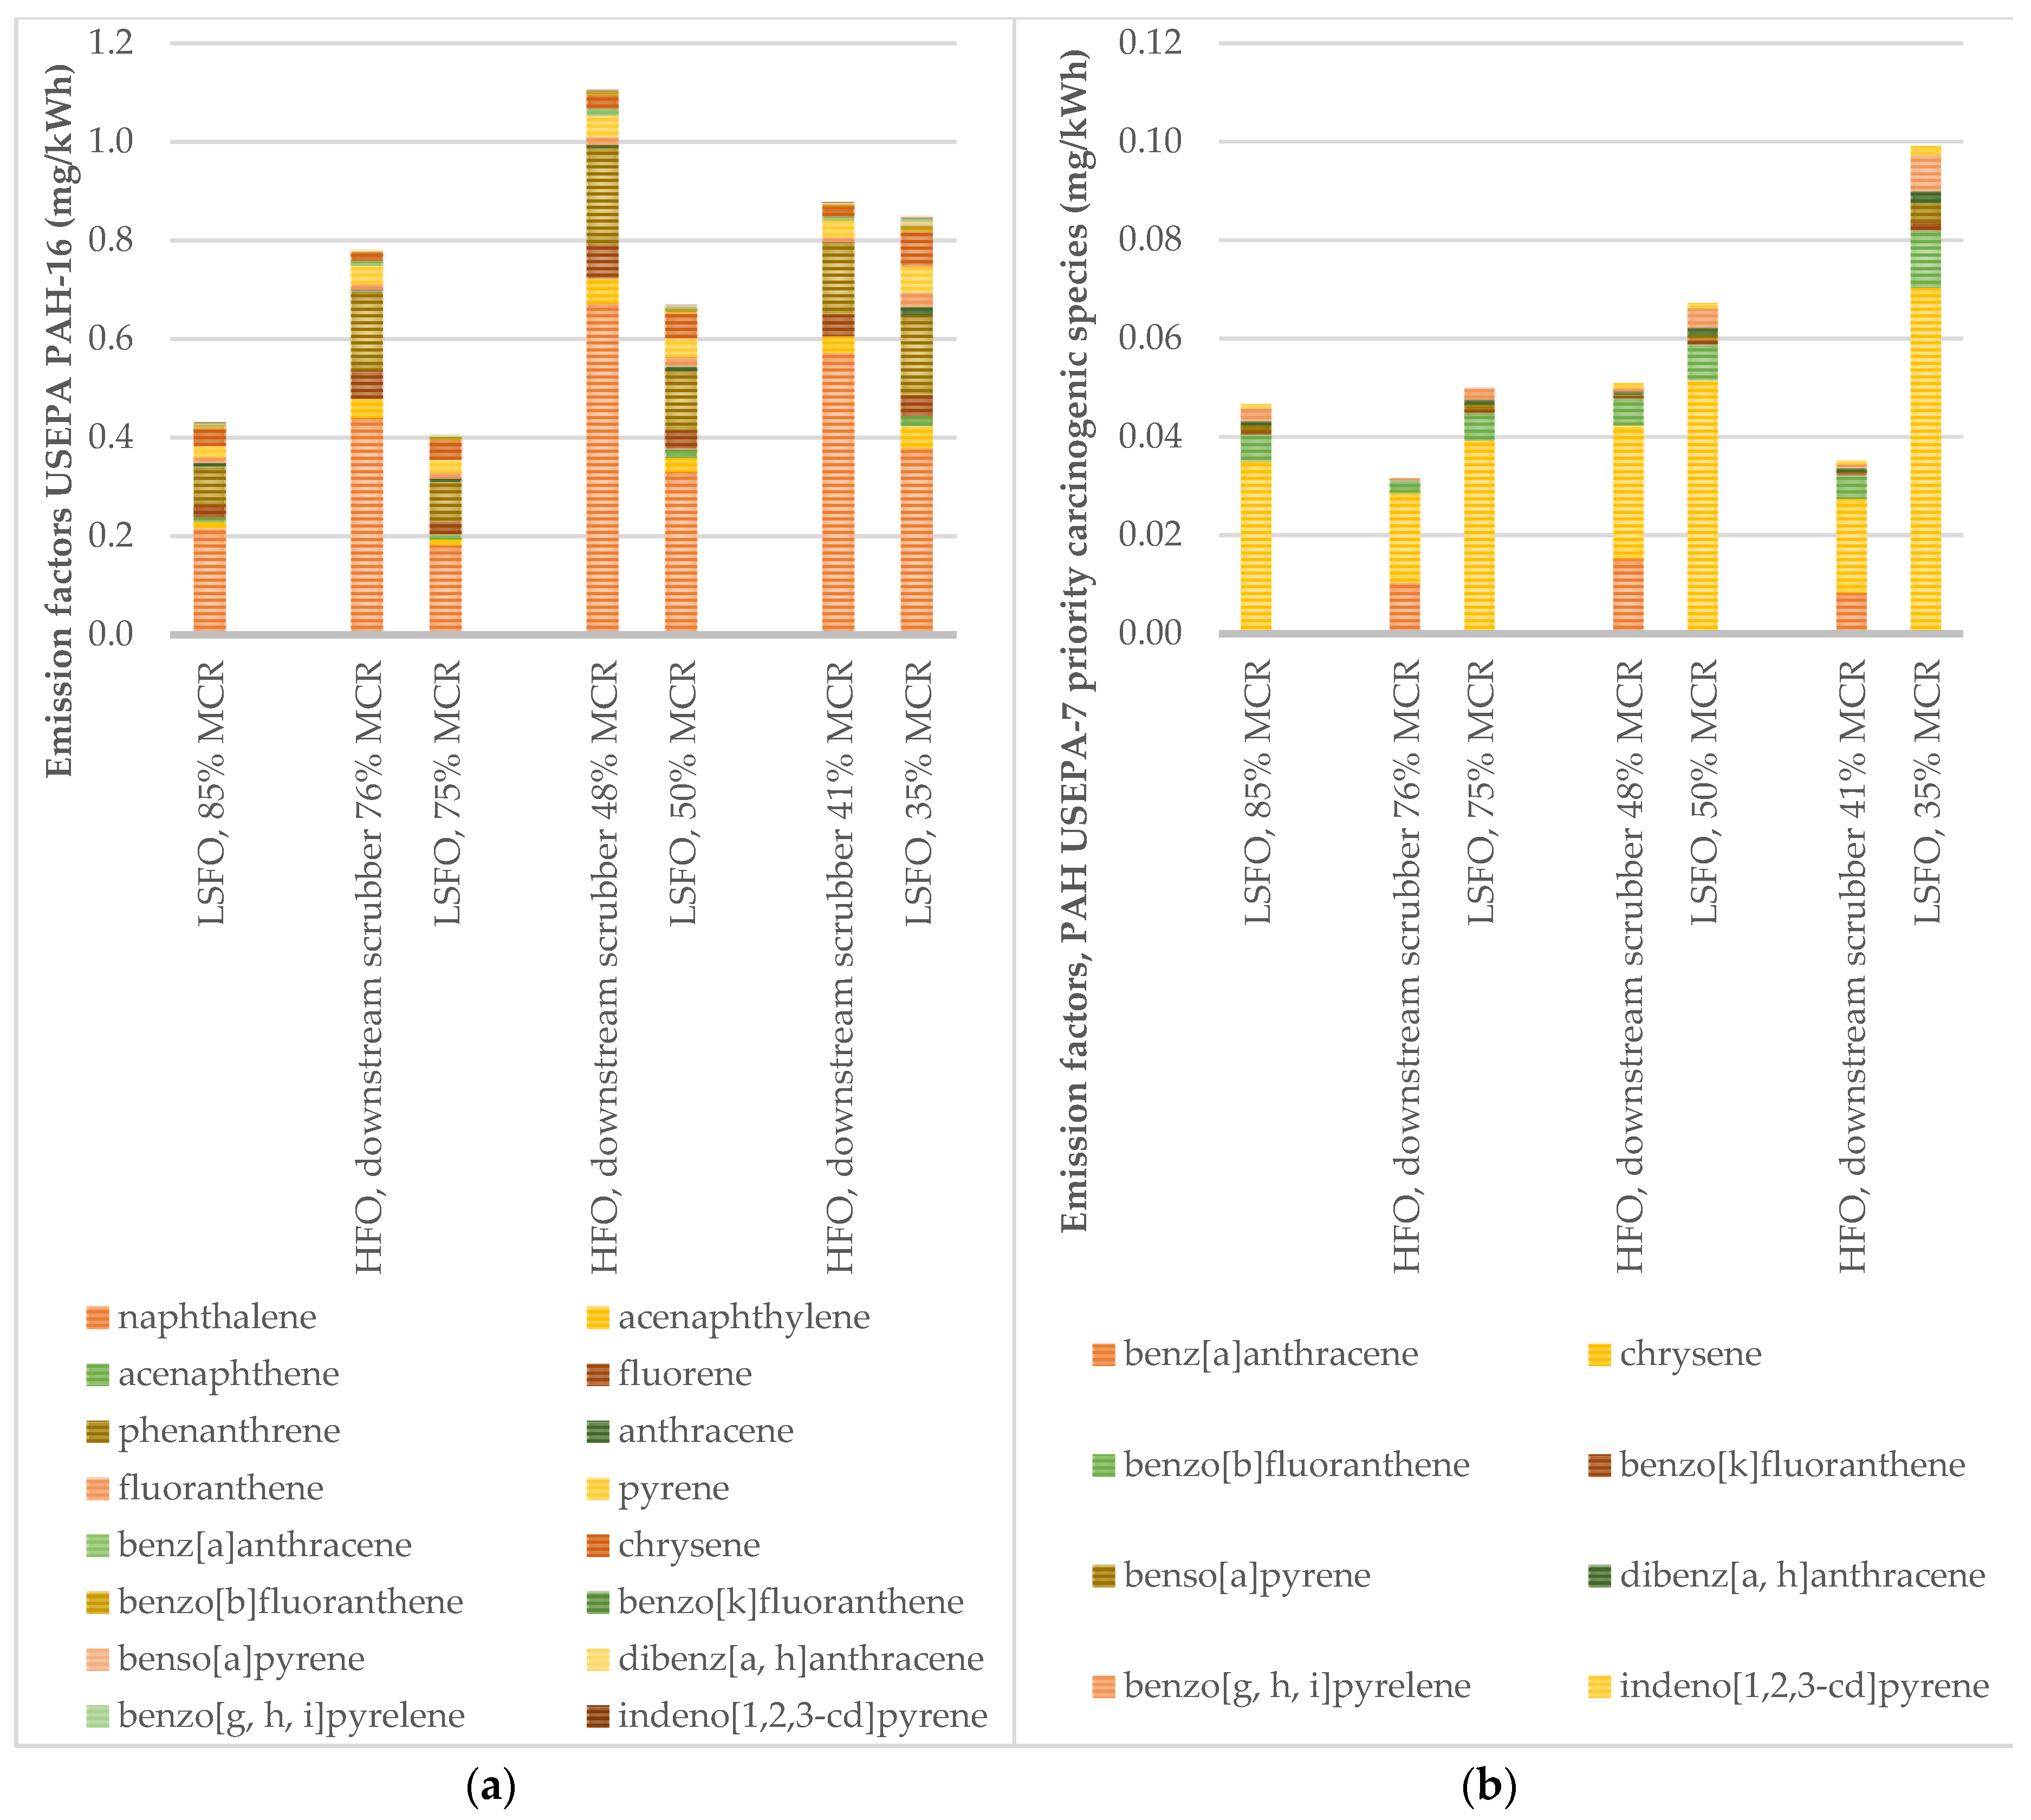
PAH emissions are in our tests lower at LSFO combustion than at HFO combustion downstream of the scrubber, at each comparable engine load. The share of different PAH species is similar for all loads. Naphthalene is the most abundant and accounts for around 50% or more at all trials. The two- and three ring PAHs constitute between 78% and 91% of total PAHs, which is close to, but higher than, the 76% concluded as a typical value for diesel engine exhausts reported by [28]. The emissions of heavier PAHs, which can be represented by the EPA PAH-7 priority carcinogenic species, are at all occasions higher for LSFO than downstream of the scrubber. For the PAH-7 species an increase in emissions with decreasing engine load is observed at the LSFO tests. Specific emissions of US Environmental Protection Agency’s PAH-16 and PAH-7 for tests at LSFO combustion and HFO combustion downstream of the scrubber are compared in Figure 5a,b, respectively.
3.3. Particle composition
Filter samples of particles from two of the tested engine load points are analysed for composition. Our results indicate that also solid particles are removed during the scrubber process. An efficient removal of EC is seen at the high engine load. The removal of EC at the tests at low engine loads appear to be higher still, although tests upstream were made at 32% and tests downstream at 41% engine load, which could possibly exaggerate the effect seen. At LSFO combustion, the organic carbon dominates particle mass at both engine loads. Sulphates are not significantly contributing to particle mass and constitute 1.2% and 2.7% of total mass at 34% and 75% engine load, respectively. The particles from HFO downstream of the scrubber are similar in composition at the two loads tested. Upstream of the scrubber both organic and elemental carbon contribute significantly to particle mass, especially at the lower engine load. Sulphur is more abundant in particles at the higher load in the upstream tests. The absolute and relative contributions of components are presented in Table 4 and Figure 6. The undefined mass of particles at the respective test conditions varies between 1% and 25%.
3.4. Effects of sampling system parameters
Sampled particles (PM) include all solid and condensed material present in the diluted and cooled diesel exhaust. The composition can be expected to change throughout their passage in the exhaust duct and during the sampling due to changing conditions. The PM, both in terms of mass and number concentration, are sensitive to variations in temperature and humidity in the exhaust and during the sample conditioning (dilution). In the scrubber, the gases are cooled from around 300 °C to around 20 °C using water that is added to the exhaust as part of the scrubber design. Water that remains in the exhaust is removed with a demister system as part of the scrubber design. In the hot exhaust tests on HFO, upstream of the scrubber, we followed the ISO 8178 for dilution and sampling with a few exceptions. The standard is not applicable for cold exhaust gas sampling and an alternative sampling system was used downstream of the scrubber. Downstream of the scrubber, the sample line is heated, and the dilution is first made with hot and then ambient-temperature air. The temperature influences the volatile content of particles to a great extent. Detailed analysis of emission factors for PM mass sampled with the dilution tunnel and with FPS shows a great deal of variability, especially for the low engine load emission factors. The variability is, however, not only between the two dilution devices, but also within the samples taken with the same device. The variability is larger for HFO tests upstream the scrubber where a large influence of condensable sulphate is expected. Development of a robust sampling methodology for testing of emissions of particulate matter in the exhaust of widely varying physical and chemical properties is an important subject for further research.
4. Conclusions
This study suggests that the reduction of particle mass over an exhaust gas treatment system is not efficient enough to accomplish particle emission levels equal to those from combustion of low sulphur fuel oil. With a traditional marine gasoil or other low sulphur fuel oil as marine fuel, the particle emissions can be expected to be significantly lower than at the use of HFO and a scrubber. The results from our measurement and previous studies suggest particle mass reductions of on average around 40% over exhaust gas scrubbers. Results of measurement studies on particle emission spread largely. This likely reflects the influence of sampling systems on the results. Particularly challenging are measurements in the cold exhaust gas downstream of the exhaust gas scrubber which are not covered by any standard.
The measurements also showed lower specific emissions of BC, EC, PAH-16 at operations on low sulphur fuel oil than downstream of the scrubber at heavy fuel oil operations. The scrubber efficiently reduced concentrations of gaseous SO2, SO3, total hydrocarbons and the heavier fraction of the measured PAHs.
The internationally agreed sulphur regulations for ships aim at reducing emissions to air of particles as well as sulphur oxides. In a wider context, the results from this study indicate that an extensive use of scrubbers may partly cancel the aimed for effect of reduced particle emissions to air that would be achieved by only using fuels with low sulphur content.
Further research on the amount of fuel used in the engines on ships equipped with scrubbers is important to draw conclusions on environmental and health effects of the technology.
Author Contributions
Conceptualization, H.W, E.F. and J.M.; investigation, H.W, E.F. and J.M.; writing—original draft preparation, H.W.; writing—review and editing, E.F and J.M. All authors have read and agreed to the published version of the manuscript. Authorship must be limited to those who have contributed substantially to the work reported.
Funding
This research was funded by the EU via Connecting Europe Facility and the IVL foundation.
Acknowledgments
The captains, chief engineers and crew are gratefully acknowledged for their support during emission measurements. The efforts on board by Håkan Salberg and Kjell Peterson were essential for the work.
Conflicts of Interest
The authors declare no conflict of interest.
Appendix A
Table A1 presents information on individual filters. Backup filters, background filters and blanks are excluded from the table. Fuel and engine load identify the test. EGCS indicates that samples are taken downstream of the scrubber. Filter type is indicated, the quartz filters are used for OC/EC analysis as indicated in the table. The OC/EC filters are also gravimetrically analysed although it is not recommended to use these results in further analyses. We have not included these results for calculating specific emissions. The dilution systems used are either a dilution tunnel (DT) or a fine particulate sampler from Dekati (FPS). The FPS gives temperatures at different locations in the dilutor. T1 is measured after primary dilution with heated air, T2 is measured upstream of the second dilution step and T4 is the temperature of the sample leaving the dilutor. The flows of the two dilution steps is also indicated. At measurements downstream of the scrubber (EGCS) the surrounding temperature was reaching above 50 (°C). It is likely that this was a cause of logging failure of the FPS. DR was continuously checked with trace gas measurements and the Horiba to make sure the dilutor worked though communication and logging suffered. Plausible ranges of sample temperatures are estimated when no log was retrieved from the FPS. These are based on logged values during tests that are adjacent in time. Filter temperatures during dilution tunnel experiments are given as a range based on dilution air temperature when measurements were not logged.
It is indicated in the table which filters that were used for analysis of PMtot, PM1.6, elements, sulphur and OC/EC. The table also presents PM mass concentrations and PM EF calculated from individual filters if applicable

Table A1.
Details on temperatures, flows dilution ratios, analyses and results from individual filter samples at different test settings.
Table A1.
Details on temperatures, flows dilution ratios, analyses and results from individual filter samples at different test settings.
| Fuel | Filter Type | Engine Load | Dilution System (DT = Dilution Tunnel) | Dilution T, Primary Dilutor (°C) (T1) | T Up-Stream Ejector Dilutor (°C) (T3) | T Down-Stream Ejector Dilutor = Sample T (°C) (T4) | Flow Primary Dilutor (l/min) | Flow Ejector Dilutor (l/min) | Dilution Ratio | Filter T (°C) | PMtot | PM1.6 | Elemetnts | S | OC/EC | PM Mass Conc (g/m3) | PM EF (g/kWh) |
|---|---|---|---|---|---|---|---|---|---|---|---|---|---|---|---|---|---|
| LSFO | Teflon | 85% | DT | n.a. | n.a. | n.a. | n.a. | n.a. | 15.9 | 33 | X | 0.026 | 0.16 | ||||
| LSFO | Teflon | 85% | DT | n.a. | n.a. | n.a. | n.a. | n.a. | 15.9 | 33 | X | X | 0.026 | 0.16 | |||
| LSFO | Teflon | 85% | DT | n.a. | n.a. | n.a. | n.a. | n.a. | 16.4 | 32.5 | X | 0.021 | 0.12 | ||||
| LSFO | Teflon | 85% | DT | n.a. | n.a. | n.a. | n.a. | n.a. | 16.4 | 32.5 | X | 0.018 | 0.11 | ||||
| LSFO | Teflon | 75% | DT | n.a. | n.a. | n.a. | n.a. | n.a. | 15.9 | 29 | X | 0.018 | 0.10 | ||||
| LSFO | Teflon | 75% | DT | n.a. | n.a. | n.a. | n.a. | n.a. | 15.9 | 29 | X | 0.019 | 0.11 | ||||
| LSFO | Teflon | 75% | DT | n.a. | n.a. | n.a. | n.a. | n.a. | 16.3 | 25–35 * | X | X | 0.021 | 0.12 | |||
| LSFO | Teflon | 75% | DT | n.a. | n.a. | n.a. | n.a. | n.a. | 16.3 | 25–35 * | X | 0.022 | 0.13 | ||||
| LSFO | Teflon | 50% | DT | n.a. | n.a. | n.a. | n.a. | n.a. | 16.7 | 33 | X | X | 0.027 | 0.16 | |||
| LSFO | Teflon | 50% | DT | n.a. | n.a. | n.a. | n.a. | n.a. | 16.7 | 33 | X | 0.026 | 0.16 | ||||
| LSFO | Teflon | 50% | DT | n.a. | n.a. | n.a. | n.a. | n.a. | 16.8 | 33 | X | 0.024 | 0.14 | ||||
| LSFO | Teflon | 50% | DT | n.a. | n.a. | n.a. | n.a. | n.a. | 16.8 | 33 | X | 0.023 | 0.14 | ||||
| LSFO | Teflon | 34% | DT | n.a. | n.a. | n.a. | n.a. | n.a. | 20.2 | 29 | X | 0.017 | 0.12 | ||||
| LSFO | Teflon | 34% | DT | n.a. | n.a. | n.a. | n.a. | n.a. | 20.2 | 29 | X | 0.016 | 0.12 | ||||
| LSFO | Teflon | 34% | DT | n.a. | n.a. | n.a. | n.a. | n.a. | 23.8 | 31 | X | X | 0.021 | 0.16 | |||
| LSFO | Teflon | 34% | DT | n.a. | n.a. | n.a. | n.a. | n.a. | 23.8 | 31 | X | X | 0.023 | 0.17 | |||
| LSFO | Teflon | 50% | FPS | 34.7 ± 0.6 | 39.1 ± 0.5 | 36.3 ± 0.6 | 9.3 ± 0.2 | 78.2 ± 0.7 | 40 | n.d. | X | 0.034 | 0.21 | ||||
| LSFO | Teflon | 50% | FPS | 34.7 ± 0.6 | 39.1 ± 0.5 | 36.3 ± 0.6 | 9.3 ± 0.2 | 78.2 ± 0.7 | 40 | n.d. | X | 0.031 | 0.19 | ||||
| LSFO | Teflon | 34% | FPS | 95.7 ± 1.3 | 71.7 ± 0.7 | 40.8 ± 0.4 | 9.6 ± 0.2 | 80.8 ± 1.0 | 80 | n.d. | X | 0.049 | 0.36 | ||||
| LSFO | Teflon | 85% | FPS | 147.9 ± 1.8 | 106.2 ± 1.1 | 49.8 ± 0.8 | 9.5 ± 0.1 | 81.3 ± 1.0 | 92 | n.d. | X | 0.033 | 0.18 | ||||
| LSFO | Teflon | 85% | FPS | 147.9 ± 1.7 | 105.9 ± 0.9 | 50.3 ± 0.4 | 9.4 ± 0.1 | 81.3 ± 1.1 | 82 | n.d. | X | 0.032 | 0.19 | ||||
| LSFO | Quartz | 75% | DT | n.a. | n.a. | n.a. | n.a. | n.a. | 15.7 | 25–35 * | (X) | X | 0.025 | n.a. | |||
| LSFO | Quartz | 75% | DT | n.a. | n.a. | n.a. | n.a. | n.a. | 15.7 | 25–35 * | (X) | X | 0.026 | n.a. | |||
| LSFO | Quartz | 50% | DT | n.a. | n.a. | n.a. | n.a. | n.a. | 16.6 | 25–35 * | (X) | X | 0.024 | n.a. | |||
| LSFO | Quartz | 50% | DT | n.a. | n.a. | n.a. | n.a. | n.a. | 16.6 | 25–35 * | (X) | X | 0.024 | n.a. | |||
| LSFO | Quartz | 34% | DT | n.a. | n.a. | n.a. | n.a. | n.a. | 20.1 | 25–35 * | (X) | X | 0.032 | n.a. | |||
| LSFO | Quartz | 34% | DT | n.a. | n.a. | n.a. | n.a. | n.a. | 20.1 | 25–35 * | (X) | X | 0.041 | n.a. | |||
| LSFO | Quartz | 34% | FPS | 95.6 ± 1.3 | 71.7 ± 0.7 | 40.1 ± 0.5 | 9.6 ± 0.2 | 80.8 ± 1.0 | 71.9 | n.d. | (X) | X | 0.059 | n.a. | |||
| LSFO | Quartz | 85% | DT | n.a. | n.a. | n.a. | n.a. | n.a. | 22.8 | 25–35 * | (X) | X | 0.027 | n.a. | |||
| LSFO | Quartz | 85% | DT | n.a. | n.a. | n.a. | n.a. | n.a. | 22.8 | 25–35 * | (X) | X | 0.021 | n.a. | |||
| LSFO | Quartz | 85% | FPS | 149 ± 1.7 | 106.5 ± 0.9 | 49.6 ± 0.6 | 9.4 ± 0.3 | 80.5 ± 1.1 | 83.9 | n.d. | (X) | X | 0.034 | n.a. | |||
| EGCS | Teflon | 41% | FPS | 148.7 ± 14.1 | n.d. | 49.2 ± 0.9 | 5.1 ± 0.3 | 101.1 ± 4.6 | 131 | n.d. | X | X | 0.0367 | 0.23 | |||
| EGCS | Teflon | 41% | FPS | 148.7 ± 14.1 | n.d. | 49.2 ± 0.9 | 5.1 ± 0.3 | 101.1 ± 4.6 | 131 | n.d. | X | 0.0342 | 0.22 | ||||
| EGCS | Teflon | 41% | FPS | 163.8 ± 0.9 * | n.d. | 53.2 ± 0.9 | 3.6 ± 1.1 | 40.9 ± 8.0 | 55 | n.d. | X | 0.0416 | 0.26 | ||||
| EGCS | Teflon | 41% | FPS | 163.8 ± 0.9 * | n.d. | 53.2 ± 0.9 | 3.6 ± 1.1 | 40.9 ± 8.0 | 55 | n.d. | X | X | 0.0428 | 0.27 | |||
| EGCS | Teflon | 48% | FPS | n.d. | n.d. | 40-55 * | n.d. | n.d. | 55 | n.d. | X | 0.0444 | 0.28 | ||||
| EGCS | Teflon | 48% | FPS | n.d. | n.d. | 40-55 * | n.d. | n.d. | 55 | n.d. | X | 0.0399 | 0.25 | ||||
| EGCS | Teflon | 48% | FPS | 165.5 ± 0.7 | n.d. | 46.8 ± 1.1 | 5.1 ± 0.03 | 98.9 ± 1.2 | 165 | n.d. | X | 0.031 | 0.19 | ||||
| EGCS | Teflon | 48% | FPS | 165.5 ± 0.7 | n.d. | 46.8 ± 1.1 | 5.1 ± 0.03 | 98.9 ± 1.2 | 165 | n.d. | X | 0.040 | 0.25 | ||||
| EGCS | Teflon | 48% | FPS | n.d. | n.d. | 40-55 * | n.d. | n.d. | 53 | n.d. | X | 0.0401 | 0.16 | ||||
| EGCS | Teflon | 48% | FPS | n.d. | n.d. | 40-55 * | n.d. | n.d. | 53 | n.d. | X | 0.0341 | 0.21 | ||||
| EGCS | Teflon | 76% | FPS | 104.8 ± 19.0 | n.d. | 33.7 ± 0.8 | 5.2 ± 0.1 | 99.2 ± 1.0 | 348 | n.d. | X | 0.0595 | 0.54 | ||||
| EGCS | Teflon | 76% | FPS | 104.8 ± 19.0 | n.d. | 33.7 ± 0.8 | 5.2 ± 0.1 | 99.2 ± 1.0 | 348 | n.d. | X | 0.0467 | 0.27 | ||||
| EGCS | Teflon | 76% | FPS | n.d. | n.d. | 30-45 * | n.d. | n.d. | 69 | n.d. | X | 0.0412 | 0.24 | ||||
| EGCS | Teflon | 76% | FPS | n.d. | n.d. | 30-45 * | n.d. | n.d. | 69 | n.d. | X | X | 0.0469 | 0.24 | |||
| EGCS | Teflon | 76% | FPS | n.d. | n.d. | 30-45 * | n.d. | n.d. | 74 | n.d. | X | 0.0388 | 0.22 | ||||
| EGCS | Teflon | 76% | FPS | n.d. | n.d. | 30-45 * | n.d. | n.d. | 74 | n.d. | X | X | 0.0465 | 0.27 | |||
| HFO | Teflon | 32% | FPS | 89.5 ± 2.0 | 78.9 ± 1.9 | 34.5 ± 1.1 | 13.1 ± 0.4 | 99.6 ± 0.9 | 151 | n.d. | X | 0.1011 | 0.75 | ||||
| HFO | Teflon | 32% | DT | n.a. | n.a. | n.a. | n.a. | n.a. | 14 | 30–45 * | X | X | 0.0816 | 0.63 | |||
| HFO | Teflon | 32% | FPS | 93.4 ± 1.5 | 82.3 ± 1.1 | 36.9 ± 0.7 | 13.4 ± 0.2 | 99.7 ± 1.0 | 246 | n.d. | X | X | 0.0596 | 0.44 | |||
| HFO | Teflon | 32% | FPS | 93.4 ± 1.5 | 82.3 ± 1.1 | 36.9 ± 0.7 | 13.4 ± 0.2 | 99.7 ± 1.0 | 246 | n.d. | X | X | 0.0465 | 0.35 | |||
| HFO | Teflon | 32% | DT | n.a. | n.a. | n.a. | n.a. | n.a. | 14 | 30–45 * | X | 0.0713 | 0.41 | ||||
| HFO | Teflon | 49% | DT | n.a. | n.a. | n.a. | n.a. | n.a. | 16 | 30–45 * | X | 0.0708 | 0.45 | ||||
| HFO | Teflon | 49% | DT | n.a. | n.a. | n.a. | n.a. | n.a. | 16 | 30–45 * | X | 0.0597 | 0.38 | ||||
| HFO | Teflon | 49% | FPS | 88.0 ± 1.2 | 75.7 ± 1.0 | 35.9 ± 0.5 | 11.0 ± 0.0.5 | 98.8 ± 1.0 | 190 | n.d. | X | 0.0581 | 0.23 | ||||
| HFO | Teflon | 49% | FPS | 88.0 ± 1.2 | 75.7 ± 1.0 | 35.9 ± 0.5 | 11.0 ± 0.0.5 | 98.8 ± 1.0 | 190 | n.d. | X | 0.0598 | 0.36 | ||||
| HFO | Teflon | 49% | FPS | 86.6 ± 3.3 | 75.0 ± 3.2 | 35.1 ± 1.3 | 10.9 ± 0.2 | 98.2 ± 1.0 | 162 | n.d. | X | 0.0534 | 0.21 | ||||
| HFO | Teflon | 49% | FPS | 86.6 ± 3.3 | 75.0 ± 3.2 | 35.1 ± 1.3 | 10.9 ± 0.2 | 98.2 ± 1.0 | 162 | n.d. | X | 0.0588 | 0.36 | ||||
| HFO | Teflon | 76% | FPS | 96.3 ± 1.7 | 75.9 ± 1.4 | 37.7 ± 0.7 | 13.4 ± 0.09 | 99.0 ± 1.1 | 174 | n.d. | X | X | 0.0755 | 0.43 | |||
| HFO | Teflon | 76% | FPS | 96.3 ± 1.7 | 75.9 ± 1.4 | 37.7 ± 0.7 | 13.4 ± 0.09 | 99.0 ± 1.1 | 174 | n.d. | X | 0.048 | 0.28 | ||||
| HFO | Teflon | 76% | DT | n.a. | n.a. | n.a. | n.a. | n.a. | 14 | 30–40 * | X | X | 0.0645 | 0.37 | |||
| HFO | Teflon | 76% | DT | n.a. | n.a. | n.a. | n.a. | n.a. | 14 | 30–40 * | X | X | 0.077 | 0.44 | |||
| HFO | Teflon | 76% | FPS | 97.5 ± 2.3 | 77.6 ± 2.3 | 41.4 ± 2.6 | 13.3 ± 0.2 | 99.0 ± 1.0 | 154 | n.d. | X | 0.084 | 0.48 | ||||
| HFO | Teflon | 76% | FPS | 97.5 ± 2.3 | 77.6 ± 2.3 | 41.4 ± 2.6 | 13.3 ± 0.2 | 99.0 ± 1.0 | 154 | n.d. | X | X | 0.0623 | 0.36 | |||
| EGCS | Quartz | 41% | FPS | n.d. | n.d. | 40-55 * | n.d. | n.d. | 44 | n.d. | (X) | X | 0.0209 | n.a | |||
| EGCS | Quartz | 48% | FPS | n.d. | n.d. | 40-55 * | n.d. | n.d. | 54 | n.d. | (X) | X | 0.055 | n.a | |||
| EGCS | Quartz | 48% | FPS | n.d. | n.d. | 40-55 * | n.d. | n.d. | 54 | n.d. | (X) | X | 0.0357 | n.a | |||
| EGCS | Quartz | 76% | FPS | n.d. | n.d. | 30-45 * | n.d. | n.d. | 71 | n.d. | (X) | X | 0.0477 | n.a | |||
| EGCS | Quartz | 76% | FPS | n.d. | n.d. | 30-45 * | n.d. | n.d. | 71 | n.d. | (X) | X | 0.0491 | n.a | |||
| HFO | Quartz | 32% | FPS | 92.9 ± 1.4 | 82.3 ± 1.2 | 37.4 ± 1.0 | 13.4 ± 0.06 | 99.6 ± 1.0 | 230 | n.d. | (X) | X | 0.0795 | n.a | |||
| HFO | Quartz | 49% | FPS | 88.9 ± 1.3 | 75.0 ± 3.2 | 36.4 ± 0.9 | 11.2 ± 0.05 | 99.8 ± 1.0 | 255 | n.d. | (X) | X | 0.0864 | n.a | |||
| HFO | Quartz | 49% | FPS | 88.9 ± 1.3 | 75.0 ± 3.2 | 36.4 ± 0.9 | 11.2 ± 0.05 | 99.8 ± 1.0 | 255 | n.d. | (X) | X | 0.1189 | n.a | |||
| HFO | Quartz | 76% | FPS | 42.0 ± 1.0 | 44.2 ± 1.0 | 40.3 ± 1.8 | 12.3 ± 0.3 | 96.1 ± 1.0 | 60 | n.d. | (X) | X | 0.0769 | n.a | |||
| HFO | Quartz | 76% | FPS | 42.0 ± 1.0 | 44.2 ± 1.0 | 40.3 ± 1.8 | 12.3 ± 0.3 | 96.1 ± 1.0 | 60 | n.d. | (X) | X | n.d. | n.a |
* Missing temperature readings in sample gas and filter. The range is an estimate based on temperatures of dilution air. n.a. = not applicable, n.d. = no data.
References
- Marine Environmental Protection Committee, Resolution MEPC. Guidelines for Exhaust Gas Cleaning Systems; IMO: London, UK, 2015. [Google Scholar]
- Winnes, H.; Moldanová, J.; Anderson, M.; Fridell, E. On-board measurements of particle emissions from marine engines using fuels with different sulphur content. Proc. Inst. Mech. Eng. Part M J. Eng. Marit. Environ. 2014, 230, 45–54. [Google Scholar] [CrossRef]
- Jiang, L.; Kronbak, J.; Christensen, L.P. The costs and benefits of sulphur reduction measures: Sulphur scrubbers versus marine gas oil. Transp. Res. Part D Transp. Environ. 2014, 28, 19–27. [Google Scholar] [CrossRef]
- DNVGL, Alternative Fuel Insight Scrubber Statistics. Available online: www.https://afi.dnvgl.com/Statistics?repId=2 (accessed on 13 April 2020).
- Caiazzo, G.; Di Nardo, A.; Langella, G.; Scala, F. Seawater scrubbing desulfurization: A model for SO2 absorption in fall-down droplets. Environ. Prog. Sustain. Energy 2011, 31, 277–287. [Google Scholar] [CrossRef]
- Magnusson, K.; Thor, P.; Granberg, M. Scrubbers: Closing the loop Activity 3: Task 2. In Risk Assessment of Marine Exhaust Gas Scrubber Water; 2018; Available online: https://www.researchgate.net/publication/333973881_Scrubbers_Closing_the_loop_Activity_3_Task_2_Risk_Assessment_of_marine_exhaust_gas_scrubber_water (accessed on 20 April 2020).
- Fridell, E.; Salo, K. Measurements of abatement of particles and exhaust gases in a marine gas scrubber. Proc. Inst. Mech. Eng. Part M J. Eng. Marit. Environ. 2014, 230, 154–162. [Google Scholar] [CrossRef]
- Johnson, K.; Miller, W.; Durbin, T.; Jiang, Y.; Yang, J.; Karavelakis, G.; Cocker, D. Black Carbon Measurement Methods and Emission Factors from Ships. International Council on Clean Transportation (ICCT), 2016. Available online: https://www.ccacoalition.org/en/resources/black-carbon-measurement-methods-and-emission-factors-ships (accessed on 20 April 2020).
- Wärtsilä, Exhaust Gas Scrubber Installed Onboard MT “Suula”. Public Test Report. 2010. Available online: http://203.187.160.133:9011/www.annualreport2010.wartsila.com/c3pr90ntc0td/files/wartsila_2010/Docs/Scrubber_Test_Report_onboard_Suula.pdf (accessed on 20 April 2020).
- Hansen, J.-P. Exhaust Gas Scrubber Installed Onboard MV Ficaria Seaways—Public Test Report; Miljöstyrelsen DK, 2012; Available online: https://www2.mst.dk/Udgiv/publications/2012/06/978-87-92903-28-0.pdf (accessed on 20 April 2020).
- Lehtoranta, K.; Aakko-Saksa, P.T.; Murtonen, T.; Vesala, H.; Ntziachristos, L.; Rönkkö, T.; Karjalainen, P.; Kuittinen, N.; Timonen, H. Particulate Mass and Nonvolatile Particle Number Emissions from Marine Engines Using Low-Sulfur Fuels, Natural Gas, or Scrubbers. Environ. Sci. Technol. 2019, 53, 3315–3322. [Google Scholar] [CrossRef] [PubMed]
- Cooper, D.; Ferm, M. Jämförelse av mätmetoder för bestämning av SO3- koncentrationer i rökgaser. In IVL for ”Stiftelsen för Värmeteknisk Forskning”; 1994. (in Swedish) [Google Scholar]
- Jonsson, Å.M.; Westerlund, J.; Hallquist, M. Size-resolved particle emission factors for individual ships. Geophys. Res. Lett. 2011, 38, 13809. [Google Scholar] [CrossRef]
- Moldanová, J.; Fridell, E.; Winnes, H.; Holmin-Fridell Boman, J.; Jedynska, A.; Tishkova, V.; Demirdijan, B.; Joulie, S.; Bladt, H.; Ivleva, N.P.; et al. Physical and chemical characterisation of PM emissions from two ships operating in European Emission Control Areas. Atmos. Meas. Tech. Discuss. 2013, 6, 3931–3982. [Google Scholar] [CrossRef]
- Cavalli, F.; Viana, M.; Yttri, K.E.; Genberg, J.; Putaud, J.-P. Toward a standardised thermal-optical protocol for measuring atmospheric organic and elemental carbon: The EUSAAR protocol. Atmos. Meas. Tech. 2010, 3, 79–89. [Google Scholar] [CrossRef] [Green Version]
- Petzold, A.; Ogren, J.; Fiebig, M.; Laj, P.; Li, S.-M.; Baltensperger, U.; Popp, T.; Kinne, S.; Pappalardo, G.; Sugimoto, N.; et al. Recommendations for reporting “black carbon” measurements. Atmospheric Chem. Phys. Discuss. 2013, 13, 8365–8379. [Google Scholar] [CrossRef] [Green Version]
- Cordtz, R.; Schramm, J.; Andreasen, A.; Eskildsen, S.; Mayer, S. Modeling the distribution of sulphur compounds in a large two stroke diesel engine. Energy Fuels 2013, 27, 1652–1660. [Google Scholar] [CrossRef]
- Srivastava, R.; Miller, C.; Erickson, C.; Jambhekar, R. Emissions of sulfur trioxide from coal-fired power plants. J. Air Waste Manag. Assoc. 2004, 54, 750–762. [Google Scholar] [CrossRef] [PubMed]
- Popovicheva, O.; Kireeva, E.; Shonija, N.; Zubareva, N.; Persiantseva, N.; Tishkova, V.; Demirdjian, B.; Moldanová, J.; Mogilnikov, V. Ship particulate pollutants: Characterization in terms of environmental implication. J. Environ. Monit. 2009, 11, 2077. [Google Scholar] [CrossRef] [PubMed]
- Winnes, H.; Fridell, E. Particle emissions from ships: Dependence on fuel type. J. Air Waste Manag. Assoc. 2009, 59, 1391–1398. [Google Scholar] [CrossRef] [PubMed]
- Agrawal, H.; Welch, W.A.; Miller, J.W.; Cocker, D.R. Emission Measurements from a Crude Oil Tanker at Sea. Environ. Sci. Technol. 2008, 42, 7098–7103. [Google Scholar] [CrossRef] [Green Version]
- Cooper, D. Exhaust emissions from high speed passenger ferries. Atmos. Environ. 2001, 35, 4189–4200. [Google Scholar] [CrossRef]
- Cooper, D. Exhaust emissions from ships at berth. Atmos. Environ. 2003, 37, 3817–3830. [Google Scholar] [CrossRef]
- Zetterdahl, M.; Moldanová, J.; Pei, X.; Pathak, R.K.; Demirdjian, B. Impact of the 0.1% fuel sulfur content limit in SECA on particle and gaseous emissions from marine vessels. Atmos. Environ. 2016, 145, 338–345. [Google Scholar] [CrossRef]
- Kasper, A.; Aufdenblatten, S.; Forss, A.; Mohr, M.; Burtscher, H. Particulate Emissions from a Low-Speed Marine Diesel Engine. Aerosol Sci. Technol. 2007, 41, 24–32. [Google Scholar] [CrossRef] [Green Version]
- Fridell, E.; Steen, E.; Peterson, K. Primary particles in ship emissions. Atmos. Environ. 2008, 42, 1160–1168. [Google Scholar] [CrossRef]
- Gysel, N.R.; Welch, W.A.; Johnson, K.; Miller, W.; Cocker, D.R. Detailed Analysis of Criteria and Particle Emissions from a Very Large Crude Carrier Using a Novel ECA Fuel. Environ. Sci. Technol. 2017, 51, 1868–1875. [Google Scholar] [CrossRef] [Green Version]
- Khalili, N.R.; Scheff, P.A.; Holsen, T.M. PAH source fingerprints for coke ovens, diesel and, gasoline engines, highway tunnels, and wood combustion emissions. Atmos. Environ. 1995, 29, 533–542. [Google Scholar] [CrossRef]
Figure 1.
Particulate matter (PM) emission factors calculated from individual filter samples in a comparison between the two sampling systems used for exhaust gas dilution.
Figure 1.
Particulate matter (PM) emission factors calculated from individual filter samples in a comparison between the two sampling systems used for exhaust gas dilution.

Figure 2.
Schematic of the scrubber system and the instrument and sampling setup.

Figure 3.
Particle number concentrations of solid particles measured in diluted exhaust gas upstream and downstream of the scrubber at different engine loads. A thermodenuder is used to remove volatile particles; DR = dilution ratio.
Figure 3.
Particle number concentrations of solid particles measured in diluted exhaust gas upstream and downstream of the scrubber at different engine loads. A thermodenuder is used to remove volatile particles; DR = dilution ratio.

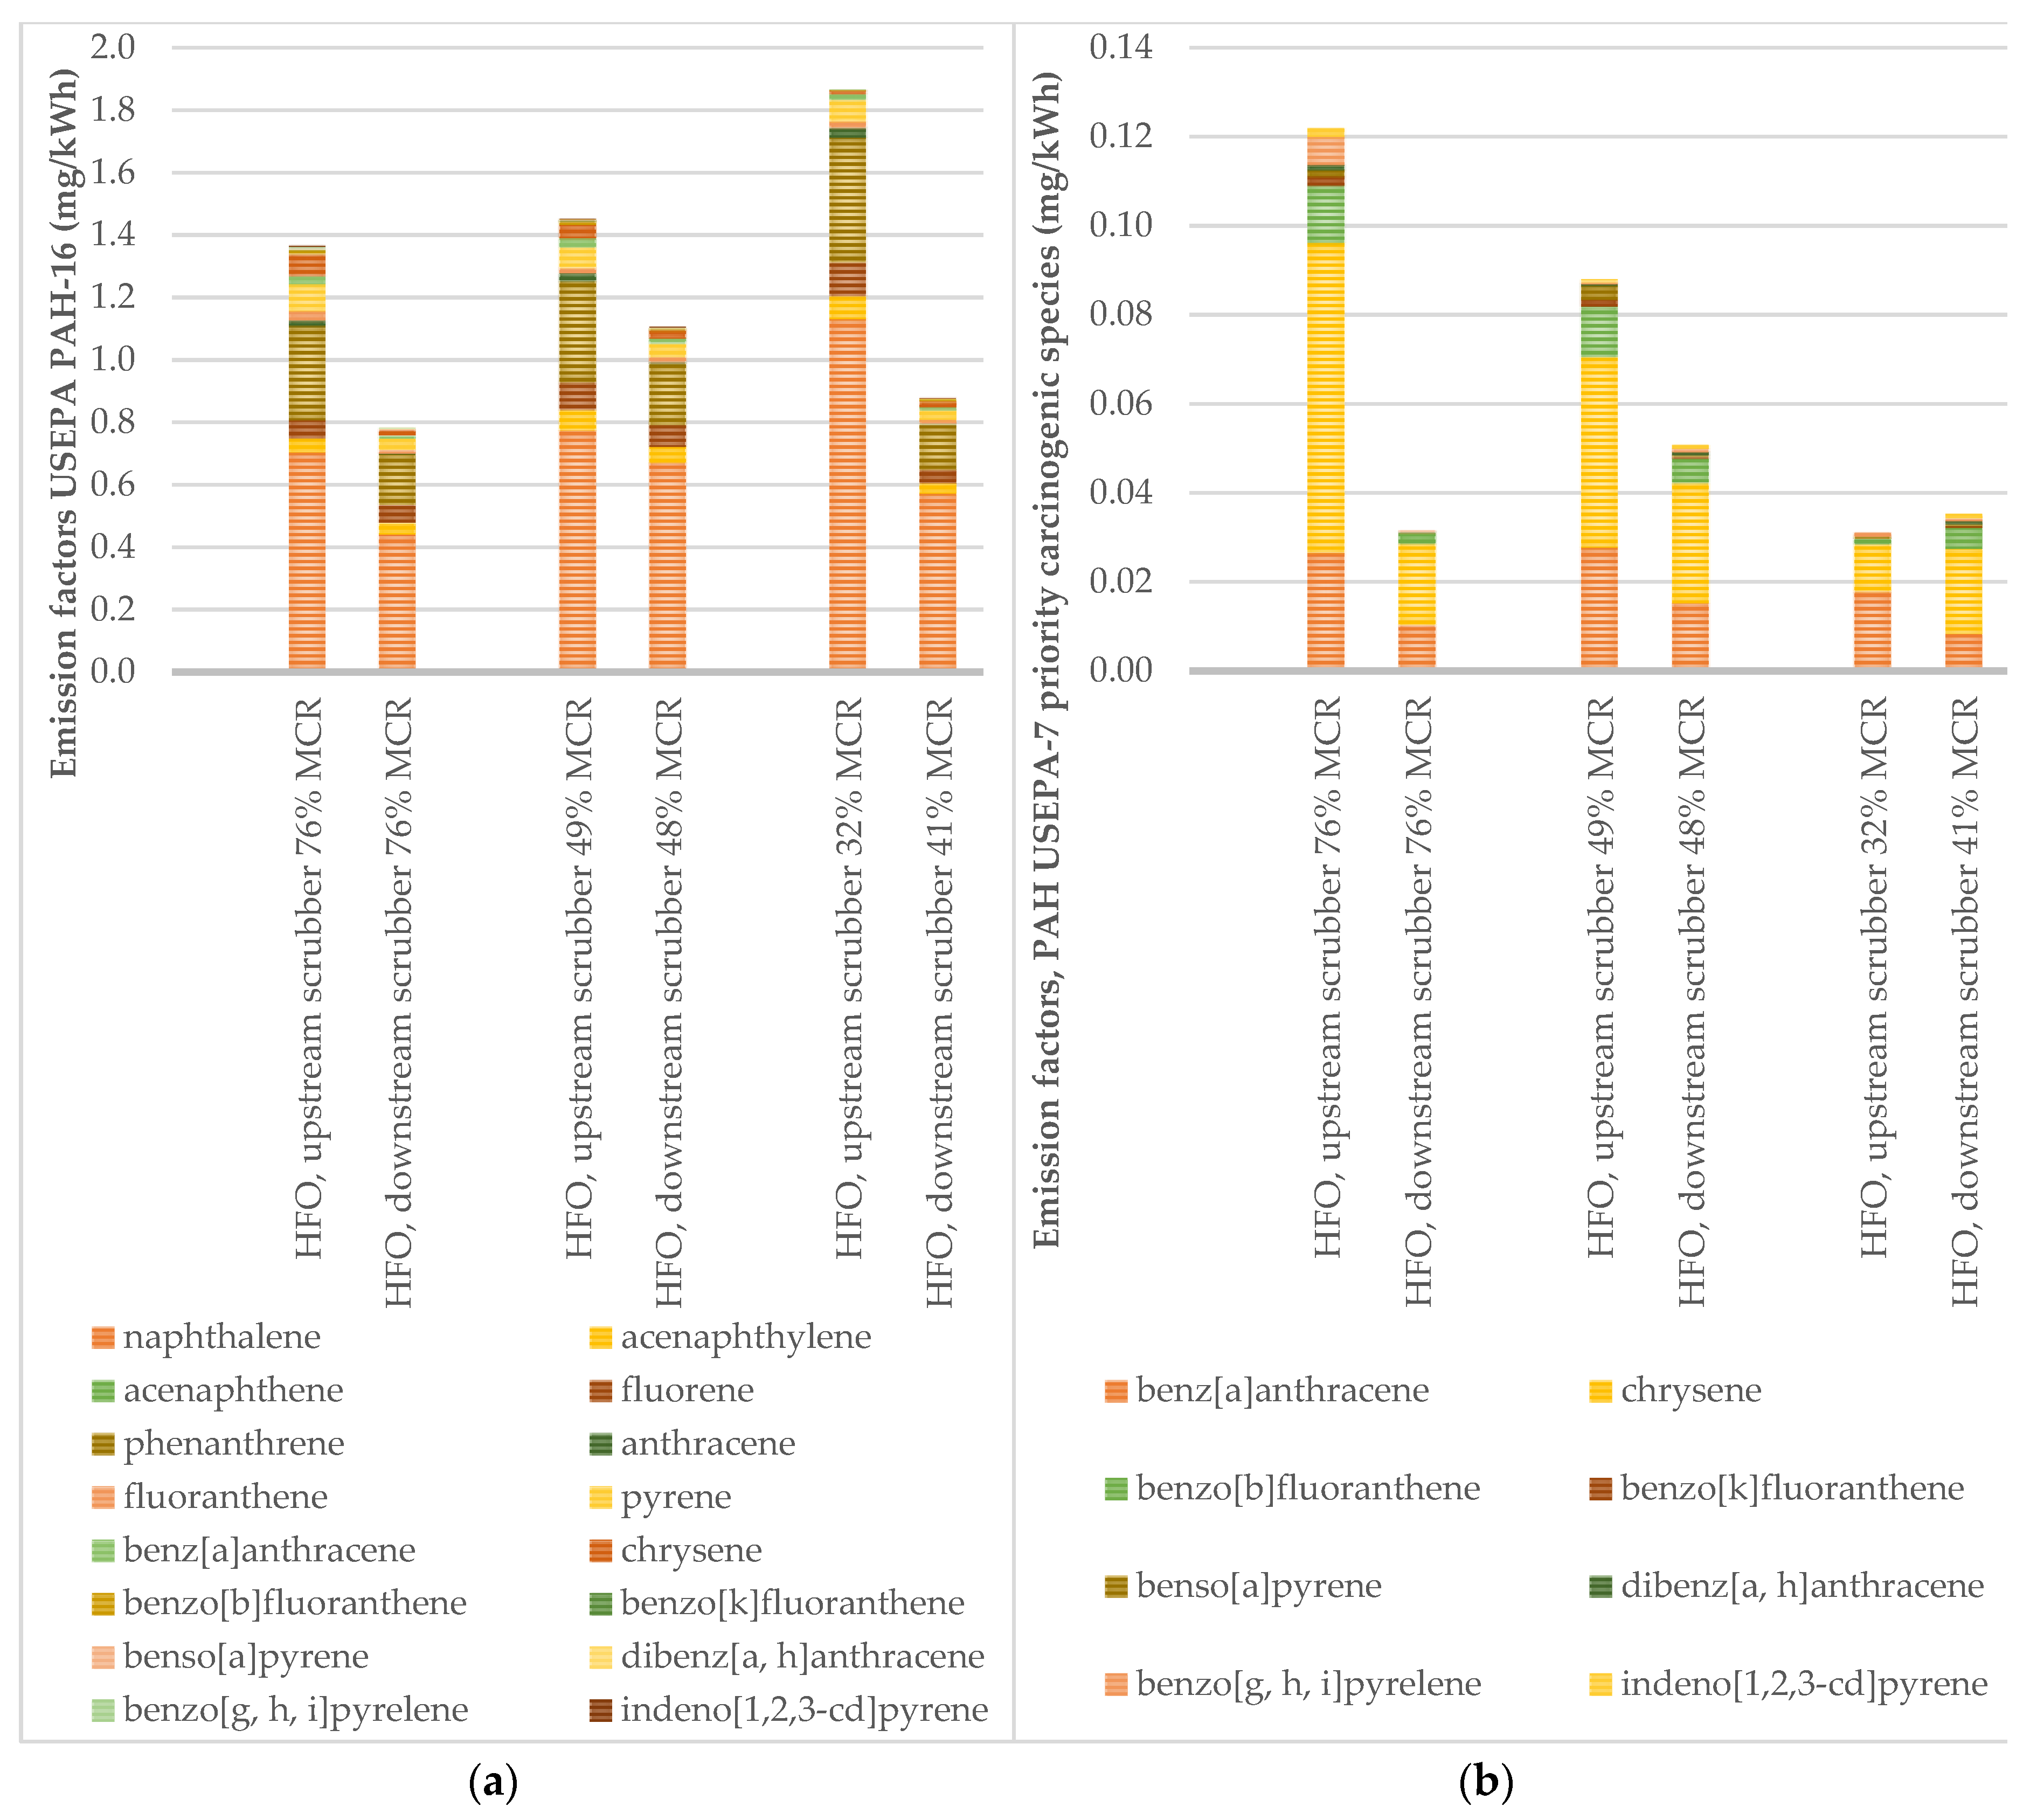
Figure 4.
Specific emissions of US Environmental Protection Agency’s (EPA) PAH-16 (a) and PAH-7 (b) at HFO combustion upstream and downstream of the scrubber.
Figure 4.
Specific emissions of US Environmental Protection Agency’s (EPA) PAH-16 (a) and PAH-7 (b) at HFO combustion upstream and downstream of the scrubber.

Figure 5.
Specific emissions of US EPA’s PAH-16 (a) and PAH-7 (b) at HFO and downstream of the scrubber and at LSFO combustion.
Figure 5.
Specific emissions of US EPA’s PAH-16 (a) and PAH-7 (b) at HFO and downstream of the scrubber and at LSFO combustion.

Figure 6.
Absolute and relative contributions of particulate components to particle mass at different tests. N.B. analysis of filters from similar sampling and dilution conditions are considered, and total PM values may differ from the average values given in Table 2.
Figure 6.
Absolute and relative contributions of particulate components to particle mass at different tests. N.B. analysis of filters from similar sampling and dilution conditions are considered, and total PM values may differ from the average values given in Table 2.

Table 1.
Fuel and lube oil analyses.
| Unit | Low Sulphur Fuel Oil (LSFO) | Lube Oil (at LSFO Tests) | Heavy Fuel Oil (HFO) | Lube Oil (at HFO Tests) | |
|---|---|---|---|---|---|
| Date of Analysis | 2017-03-15 | 2017-03-15 | 2017-10-13 | 2017-10-13 | |
| Density (at 15°C) | kg/m3 | 908.5 | 909.1 | 989.5 | 919.9 |
| Viscosity (at 50° C) | mm2/s | 81.49 | n.a. | 420.0 | n.a. |
| Gross heat of combustion | MJ/kg | 44.25 | n.a. | 42.19 | n.a. |
| Net heat of combustion | MJ/kg | 41.52 | n.a. | 39.97 | n.a. |
| Sulphur | Mass % | 0.10 | 0.43 | 2.77 | 0.55 |
| Carbon | Mass % | 86.8 | 84.3 | 85.4 | 83.4 |
| Hydrogen | Mass % | 12.9 | 13.2 | 10.5 | 12.7 |
| Nitrogen | mg/kg | 1800 | 520 | 4300 | 1200 |
| Oxygen (calculated) | Mass % | <0.1 | 0.4 | 0.9 | <0.1 |
| Vanadium | mg/kg | <1 | 3 | 122 | 72 |
| Nickel | mg/kg | 21 | 7 | 32 | 33 |
| Iron | mg/kg | 11 | 7 | 22 | 40 |
| Ash content | Mass % | 0.041 | 1.636 | 0.035 | >0.180 |
| Total aromatic hydrocarbons | Mass % | 15.5 | 25.5 | 23.5 | 24.9 |
| Asphaltenes | Mass % | <0.50 | n.a. | 8.9 | n.a. |
Table 2.
Specific emissions at the different tests. Coefficients of variation (cov) at continuous measurements are presented in italics. MCR = Maximum continuous rating; SFOC = specific fuel oil consumption.
Table 2.
Specific emissions at the different tests. Coefficients of variation (cov) at continuous measurements are presented in italics. MCR = Maximum continuous rating; SFOC = specific fuel oil consumption.
| Low Sulphur Fuel Oil (LSFO) | Heavy Fuel Oil (HFO) Upstr. of Scrubber | Heavy Fuel Oil (HFO) Downstr. of Scrubber | |||||||||
|---|---|---|---|---|---|---|---|---|---|---|---|
| Engine Load (%MCR) | Engine Load (%MCR) | Engine Load (%MCR) | |||||||||
| Parameter | Unit | 85% | 75% | 50% | 34% | 76% | 49% | 32% | 76% | 48% | 41% |
| SFOC | g/kWh | 181 | 180 | 198 | 239 | 187 | 208 | 253 | 187 | 211 | 239 |
| CO2 | g/kWh | 601 | 598 | 659 | 793 | 617 | 687 | 739 | 618 | 690 | 847 |
| cov | 2.4 | 3.0 | 4.0 | 8.7 | 3.7 | 9.6 | 11.8 | 4.9 | 9.0 | 17.8 | |
| SO2 | g/kWh | 0.36 1 | 0.36 1 | 0.40 1 | 0.48 1 | 10.4 1 | 11.6 1 | 14.1 1 | 0.06 | 0.03 | 0.02 |
| cov | n.d. | n.d. | n.d. | n.d. | n.d. | n.d. | n.d. | 92.1% | 64.1% | 41.0% | |
| SO3 | g/kWh | b.d.l. | b.d.l. | b.d.l. | b.d.l. | 0.37 | 0.13 | 0.16 | 0.08 | 0.05 | 0.06 |
| NOX | g/kWh | 11.84 | 9.73 | 11.85 | 15.38 | 11.0 | 12.6 | 16.3 | 10.9 | 12.4 | 14.6 |
| cov | 5.2% | 0.5% | 0.5% | 1.8% | 0.7% | 4.2% | 4.3% | 1.4% | 5.9% | 5.1% | |
| nmHC | g/kWh | 0.24 | n.d. | 0.30 | 0.45 | 0.36 | 0.30 | 0.40 | 0.16 | 0.24 | n.d. |
| cov | 6.9% | n.d. | 4.1% | 4.2% | 12.6% | 2.7% | 4.1% | 1.5% | 1.6% | n.d | |
| CH4 | g/kWh | 0.002 | n.d. | 0.002 | 0.004 | 0.001 | 0.004 | 0.005 | 0.004 | 0.002 | n.d. |
| cov | 9.6% | n.d. | 7.4% | 17.4% | 29.8% | 4.9% | 4.1% | 4.3% | 6.3% | n.d | |
| CO | g/kWh | 0.42 | 0.53 | 0.88 | 0.96 | 0.93 | 1.72 | 1.87 | 0.79 | 1.40 | 1.50 |
| cov | 2.6% | 4.2% | 5.0% | 5.8% | 6.9% | 8.6% | 8.5% | 6.5% | 16.6% | 12.3% | |
| PMtot | g/kWh | 0.17 | 0.12 | 0.16 | 0.17 | 0.44 | 0.30 | 0.41 | 0.27 | 0.19 | 0.25 |
| Number of filter samples | 4 | 2 | 3 | 3 | 4 | 4 | 4 | 3 | 3 | 2 | |
| PM1.6 | g/kWh | 0.14 | 0.11 | 0.16 | 0.14 | 0.32 | 0.36 | 0.60 | 0.24 | 0.25 | 0.24 |
| Number of filter samples | 2 | 2 | 3 | 2 | 2 | 2 | 2 | 3 | 3 | 2 | |
| PMall 2 | g/kWh | 0.16 | 0.11 | 0.16 | 0.16 | 0.40 | 0.36 | 0.44 | 0.27 | 0.23 | 0.25 |
| PN | #/kWh | n.d. | n.d. | n.d. | n.d. | 6 × 10¹⁵ | 5 × 10¹⁵ | 7 × 10¹⁵ | 1 × 10¹⁵ | 9 × 10¹⁴ | 2 × 10¹⁵ |
| cov | n.d. | n.d. | n.d. | n.d. | 9.7% | 24.9% | 15% | 8.9% | 4.0% | 25.0% | |
| PN (non-volatile) | #/kWh | n.d. | n.d. | n.d. | n.d. | 9 × 10¹⁴ | 2 × 10¹⁵ | 9 × 10¹⁵ | 1 × 10¹⁵ | 9 × 10¹⁴ | 8 × 10¹⁴ |
| cov | n.d. | n.d. | n.d. | n.d. | 0.7% | 7.7% | 8.8% | 2.2% | 1.4% | 1.1% | |
| BC | g/kWh | 0.006 | 0.004 | 0.01 | 0.012 | 0.022 | 0.035 | 0.065 | 0.022 | 0.022 | 0.028 |
| cov | 7.3% | 7.5% | 6.0% | 4.5% | 4.9% | 8.5% | 4.9% | 5.1% | 3.4% | 5.3% | |
| EC | g/kWh | 0.0030 | 0.0091 | 0.0043 | 0.0052 | 0.022 | 0.052 | 0.096 | 0.015 | 0.017 | 0.018 |
| Number of filter samples | 3 | 2 | 2 | 3 | 1 | 2 | 1 | 2 | 2 | 1 | |
| OC | g/kWh | 0.066 | 0.076 | 0.092 | 0.16 | 0.084 | 0.13 | 0.26 | 0.084 | 0.11 | 0.086 |
| Number of filter samples | 3 | 2 | 2 | 3 | 1 | 2 | 1 | 2 | 2 | 1 | |
| PAH-16 3 | mg/kWh | 0.43 | 0.40 | 0.68 | 0.85 | 1.4 | 1.5 | 1.9 | 0.77 | 1.1 | 0.92 |
1 Calculated from fuel sulphur content; 2 Median values from all samples of PMtot and PM1.6; 3 Analysis includes both particulate phase and gas phase polycyclic aromatic hydrocarbons (PAHs); n.d. = no data; b.d.l. = below detection limit.
Table 3.
Particle mass calculated from particle number size distribution for the size range 5.6–532 nm. Engine loads during trials are indicated. Cov of emission factors (EF) in parenthesis.
Table 3.
Particle mass calculated from particle number size distribution for the size range 5.6–532 nm. Engine loads during trials are indicated. Cov of emission factors (EF) in parenthesis.
| Trial | EF PM 1 (g/kWh) |  | |
| Upstream scrubber; 76% | TD ON | 0.050 (8%) | |
| Downstream scrubber; 76% | 0.084 (3%) | ||
| Upstream scrubber; 49% | 0.071 (7%) | ||
| Downstream scrubber; 48% | 0.067 (3%) | ||
| Upstream scrubber; 32% | 0.11 (7%) | ||
| Downstream scrubber; 41% | 0.066 (4%) | ||
| Upstream scrubber; 76% | TD OFF | 0.18 (6%) | |
| Downstream scrubber; 76% | 0.084 (7%) | ||
| Upstream scrubber; 49% | 0.15 (7%) | ||
| Downstream scrubber; 48% | 0.075 (5%) | ||
| Upstream scrubber; 32% | 0.22 (7%) | ||
| Downstream scrubber; 41% | 0.10 (5%) |
1 Calculated from measured PN concentration in different size channels of the EEPS.
Table 4.
Absolute and relative contributions of particulate components to particle mass at different tests. Relative values in brackets.
Table 4.
Absolute and relative contributions of particulate components to particle mass at different tests. Relative values in brackets.
| Engine Load (%MCR) | OC mg/kWh | EC mg/kWh | Sulphate + Associated Water 1 mg/kWh | Elements mg/kWh | Undefined mg/kWh | PM 2 mg/kWh | |
|---|---|---|---|---|---|---|---|
| Upstream scrubber | 76% | 77 (20%) | 41 (11%) | 150 (39%) | 21 (5.3%) | 95 (25%) | 380 |
| Downstream scrubber | 76% | 84 (34%) | 15 (5.9%) | 110 (46%) | 24 (9.5%) | 11 (5%) | 250 |
| LSFO | 75% | 78 (67%) | 9.4 (8.0%) | 3.2 (2.7%) | 7.6 (6.4%) | 19 (16%) | 120 |
| Upstream scrubber | 32% | 250 (49%) | 94 (18%) | 53 (10%) | 36 (7.0%) | 80 (16%) | 510 |
| Downstream scrubber | 41% | 87 (38%) | 18 (8%) | 89 (39%) | 30 (13%) | 2.4 (1.0%) | 230 |
| LSFO | 34% | 130 (91%) | 4.9 (3.4%) | 1.7 (1.2%) | 2.3 (1.7%) | 3.8 (2.7%) | 140 |
1 sulphate calculated from analyses of S on filters, H2O calculated as SO42−*0.8, see [14]; 2 average at test conditions (considering dilution ratio) from gravimetric analysis on filter.
© 2020 by the authors. Licensee MDPI, Basel, Switzerland. This article is an open access article distributed under the terms and conditions of the Creative Commons Attribution (CC BY) license (http://creativecommons.org/licenses/by/4.0/).
Share and Cite
MDPI and ACS Style
Winnes, H.; Fridell, E.; Moldanová, J. Effects of Marine Exhaust Gas Scrubbers on Gas and Particle Emissions. J. Mar. Sci. Eng. 2020, 8, 299. https://doi.org/10.3390/jmse8040299
AMA Style
Winnes H, Fridell E, Moldanová J. Effects of Marine Exhaust Gas Scrubbers on Gas and Particle Emissions. Journal of Marine Science and Engineering. 2020; 8(4):299. https://doi.org/10.3390/jmse8040299
Chicago/Turabian StyleWinnes, Hulda, Erik Fridell, and Jana Moldanová. 2020. "Effects of Marine Exhaust Gas Scrubbers on Gas and Particle Emissions" Journal of Marine Science and Engineering 8, no. 4: 299. https://doi.org/10.3390/jmse8040299
Note that from the first issue of 2016, this journal uses article numbers instead of page numbers. See further details here.