Article

Impact of Acetate versus Citrate Dialysates on Intermediary Metabolism—A Targeted Metabolomics Approach

by
José Jesús Broseta
1,*,
Marta Roca
2,
Diana Rodríguez-Espinosa
1,
Luis Carlos López-Romero
3,
Aina Gómez-Bori
3,
Elena Cuadrado-Payán
1,
Ramón Devesa-Such
3,
Amparo Soldevila
3,
Sergio Bea-Granell
4,
Pilar Sánchez-Pérez
3 and
Julio Hernández-Jaras
3
1
Department of Nephrology and Renal Transplantation, Hospital Clínic of Barcelona, 08036 Barcelona, Spain
2
Analytical Unit Platform, Medical Research Institute Hospital La Fe (IIS La Fe), 46026 Valencia, Spain
3
Department of Nephrology, Hospital Universitari i Politècnic La Fe, 46026 Valencia, Spain
4
Department of Nephrology, Consorci Hospital General Universitari de València, 46014 Valencia, Spain
*
Author to whom correspondence should be addressed.
Int. J. Mol. Sci. 2022, 23(19), 11693; https://doi.org/10.3390/ijms231911693
Submission received: 30 August 2022 / Revised: 23 September 2022 / Accepted: 30 September 2022 / Published: 2 October 2022
(This article belongs to the Special Issue Cellular and Molecular Research of Kidney Diseases)

Abstract

:
Acetate is widely used as a dialysate buffer to avoid the precipitation of bicarbonate salts. However, even at low concentrations that wouldn’t surpass the metabolic capacity of the Krebs tricarboxylic acid (TCA) cycle, other metabolic routes are activated, leading to undesirable clinical consequences by poorly understood mechanisms. This study aims to add information that could biologically explain the clinical improvements found in patients using citrate dialysate. A unicentric, cross-over, prospective targeted metabolomics study was designed to analyze the differences between two dialysates, one containing 4 mmol/L of acetate (AD) and the other 1 mmol/L of citrate (CD). Fifteen metabolites were studied to investigate changes induced in the TCA cycle, glycolysis, anaerobic metabolism, ketone bodies, and triglyceride and aminoacidic metabolism. Twenty-one patients completed the study. Citrate increased during the dialysis sessions when CD was used, without surpassing normal values. Other differences found in the next TCA cycle steps showed an increased substrate accumulation when using AD. While lactate decreased, pyruvate remained stable, and ketogenesis was boosted during dialysis. Acetylcarnitine and myo-inositol were reduced during dialysis, while glycerol remained constant. Lastly, glutamate and glutarate decreased due to the inhibition of amino acidic degradation. This study raises new hypotheses that need further investigation to understand better the biochemical processes that dialysis and the different dialysate buffers induce in the patient’s metabolism.

1. Introduction

Chronic kidney disease (CKD) leads to the dysfunction of various metabolic systems and the accumulation of the so-called uremic toxins [1]. In dialysis-dependent CKD (DD-CKD) patients, several metabolites have been correlated with cardiovascular disease, inflammatory parameters, disease progression, nutritional status, cognitive function, hypoxia and oxidative stress, body mass wasting, and even sleep cycle disturbance [2,3,4,5,6]. Dialysis by itself may worsen several metabolic functions [1].
One of the most challenging aspects of dialysate production is allowing the coexistence of a solution of divalent cations and bicarbonate without precipitation [7]. Acetate is widely used as a weak acid acting as a dialysate buffer, thus avoiding this precipitation. Even at the low concentrations (3–4 mmol/L) used, it reaches blood levels higher than physiological [8], leading to undesirable outcomes by poorly understood mechanisms.
Among the several compounds proposed as alternatives to acetate, citrate is important [7], as it has been associated with improved hemodynamic tolerance and inflammatory biomarkers in DD-CKD patients [9,10,11,12,13]. Even though the concentration in the dialysate is five times lower than that needed for anticoagulation, citrate also allows patients to receive a reduced heparin dose without increasing the risk of filter coagulation [14,15,16,17]. Using acetate and citrate as dialysate buffers seems logical, since they would be later mainly transformed into bicarbonate through the TCA cycle. While citrate would enter directly, acetate would rapidly enter the cell, bind to coenzyme A to form acetyl-CoA, and then be oxidized in the TCA cycle, acting both as potentially safe and cheap bicarbonate precursors [18].
In this paper, we analyzed the inter-dialysis and intra-dialysis changes in the metabolomic profile of hemodialysis patients after being exposed to either citrate or acetate dialysates using a targeted metabolomics approach. Thus, we aim to add information that could help biologically explain the clinical improvements found in patients using citrate dialysate [11,19,20,21].

2. Results

2.1. Participants

Twenty-one patients with a mean age of 62.25 ± 13.77 years were included. Ten (48%) were male. Two (9.5%) were on high-flux hemodialysis and nineteen (90.5%) on post-dilution online hemodiafiltration. Twelve (57.1%) were dialyzed through an arteriovenous fistula and nine (42.9%) through a tunneled catheter.

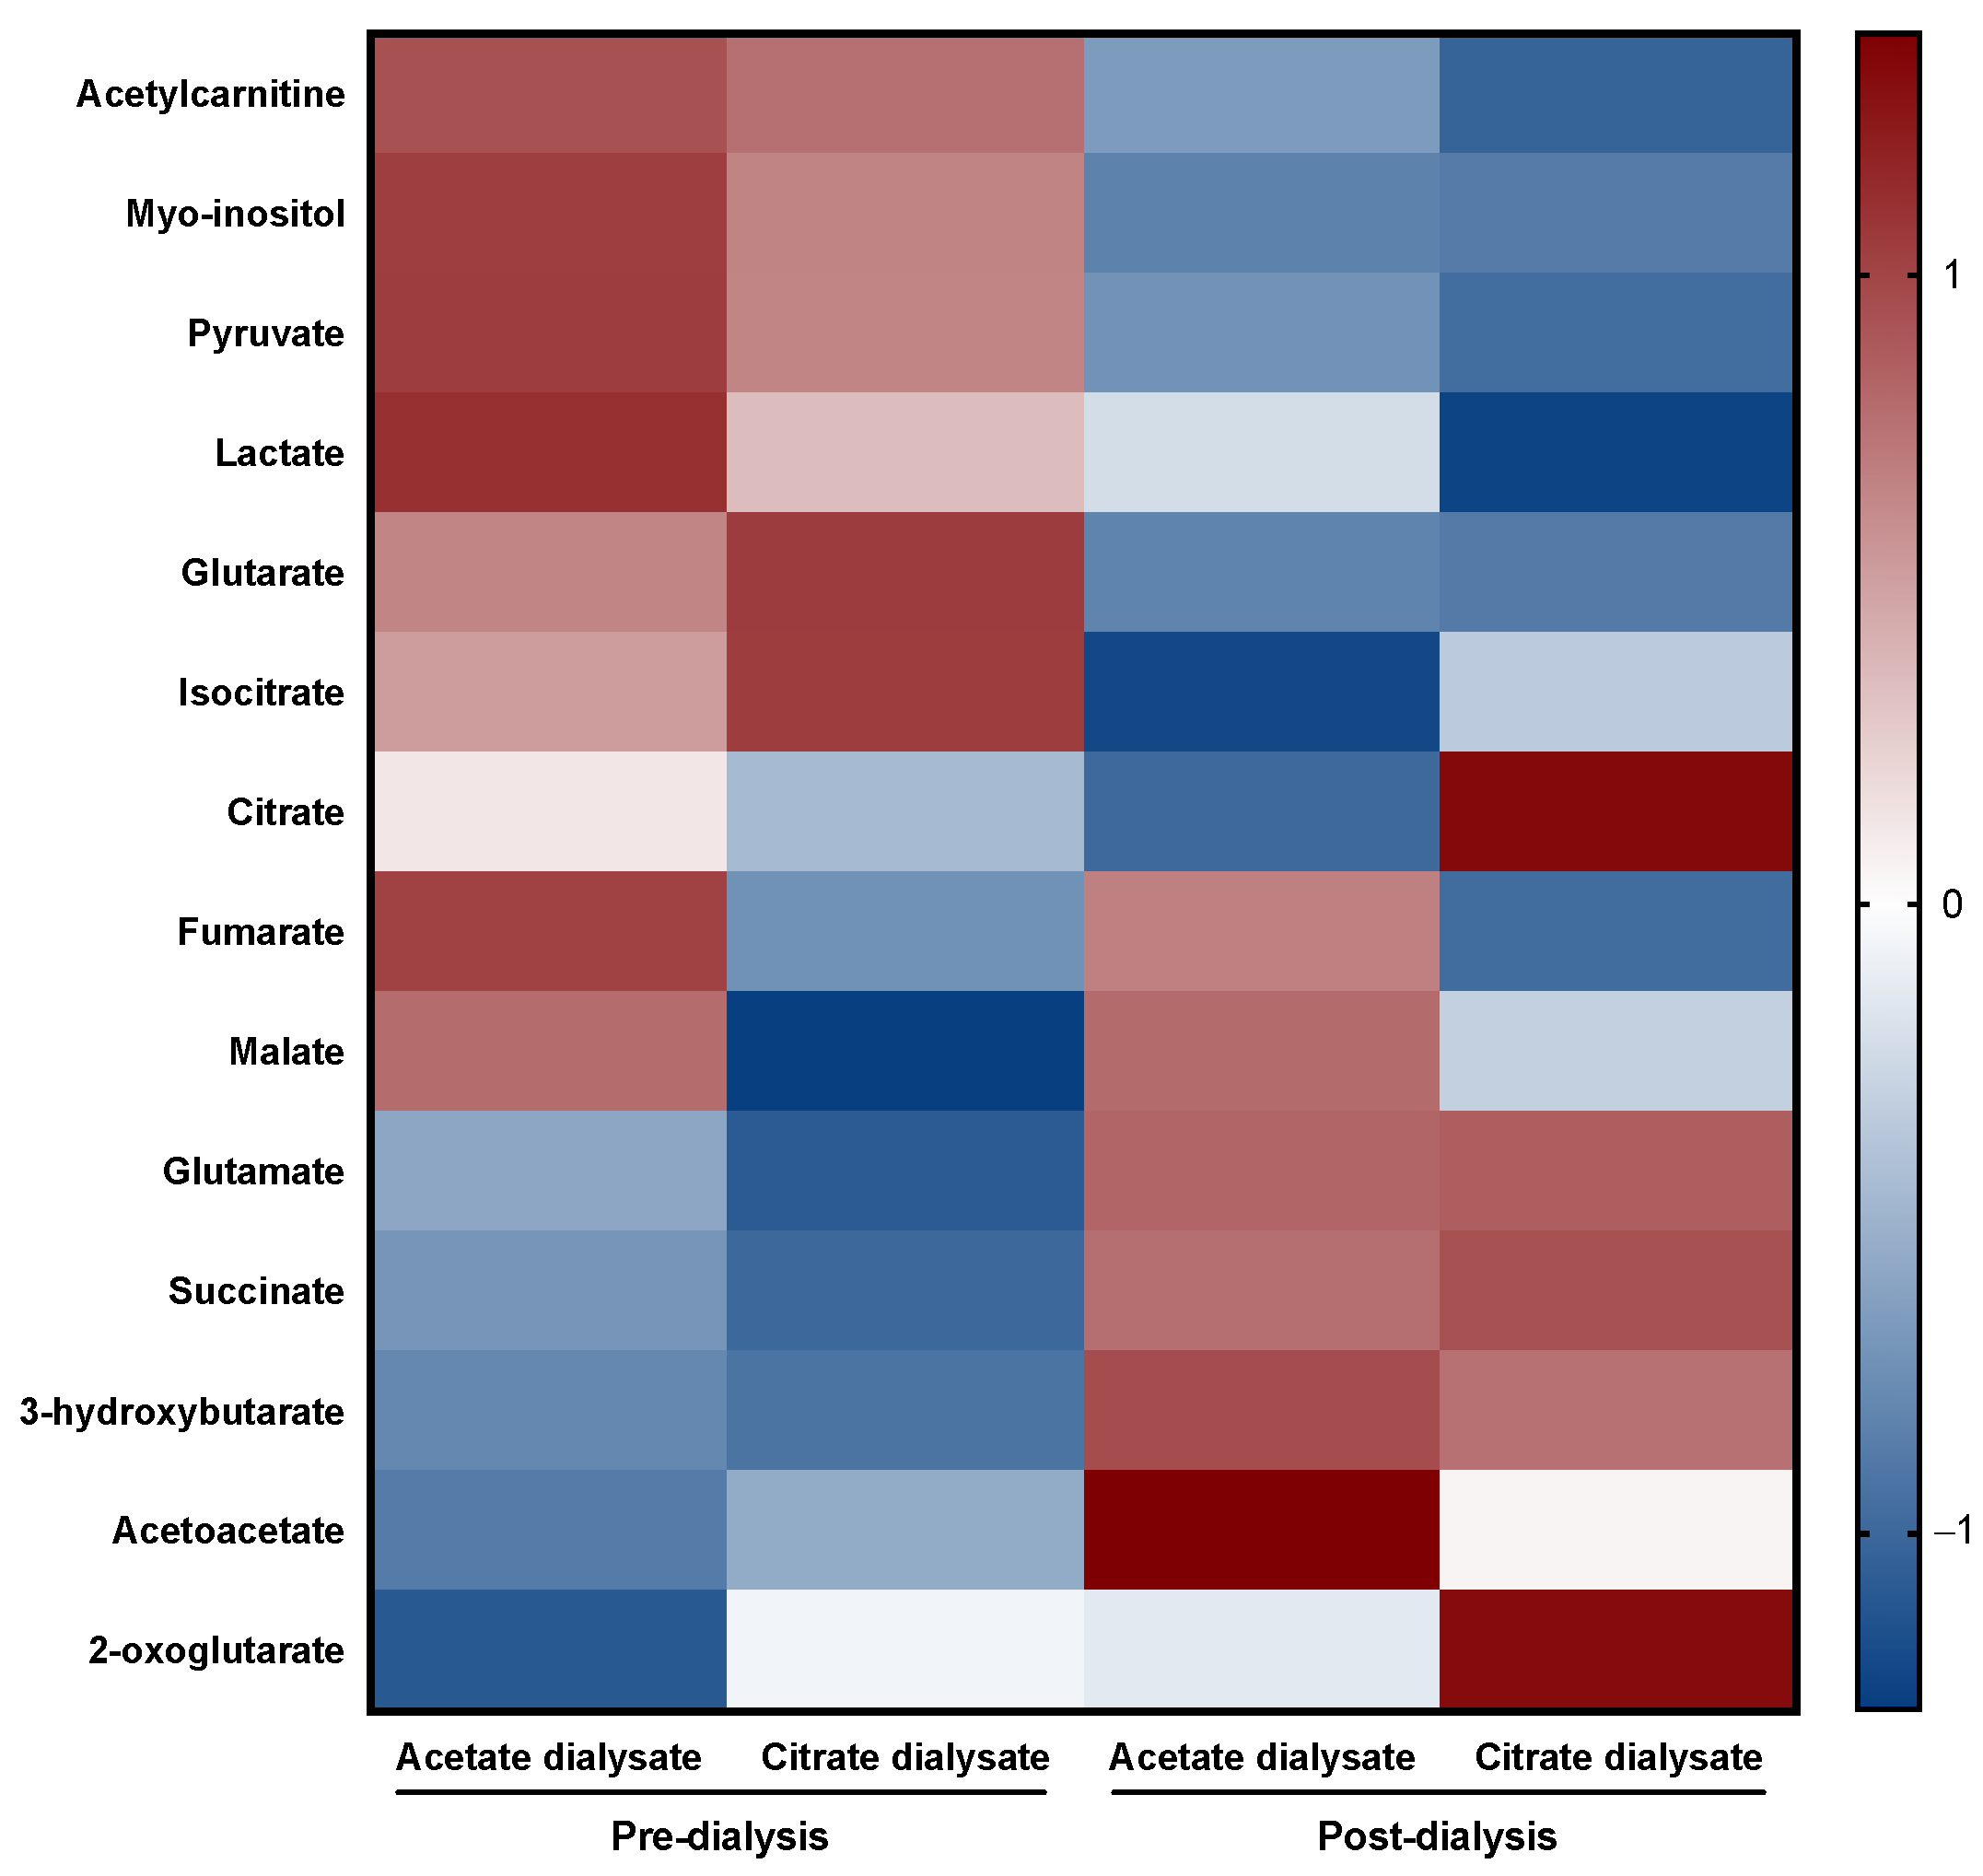
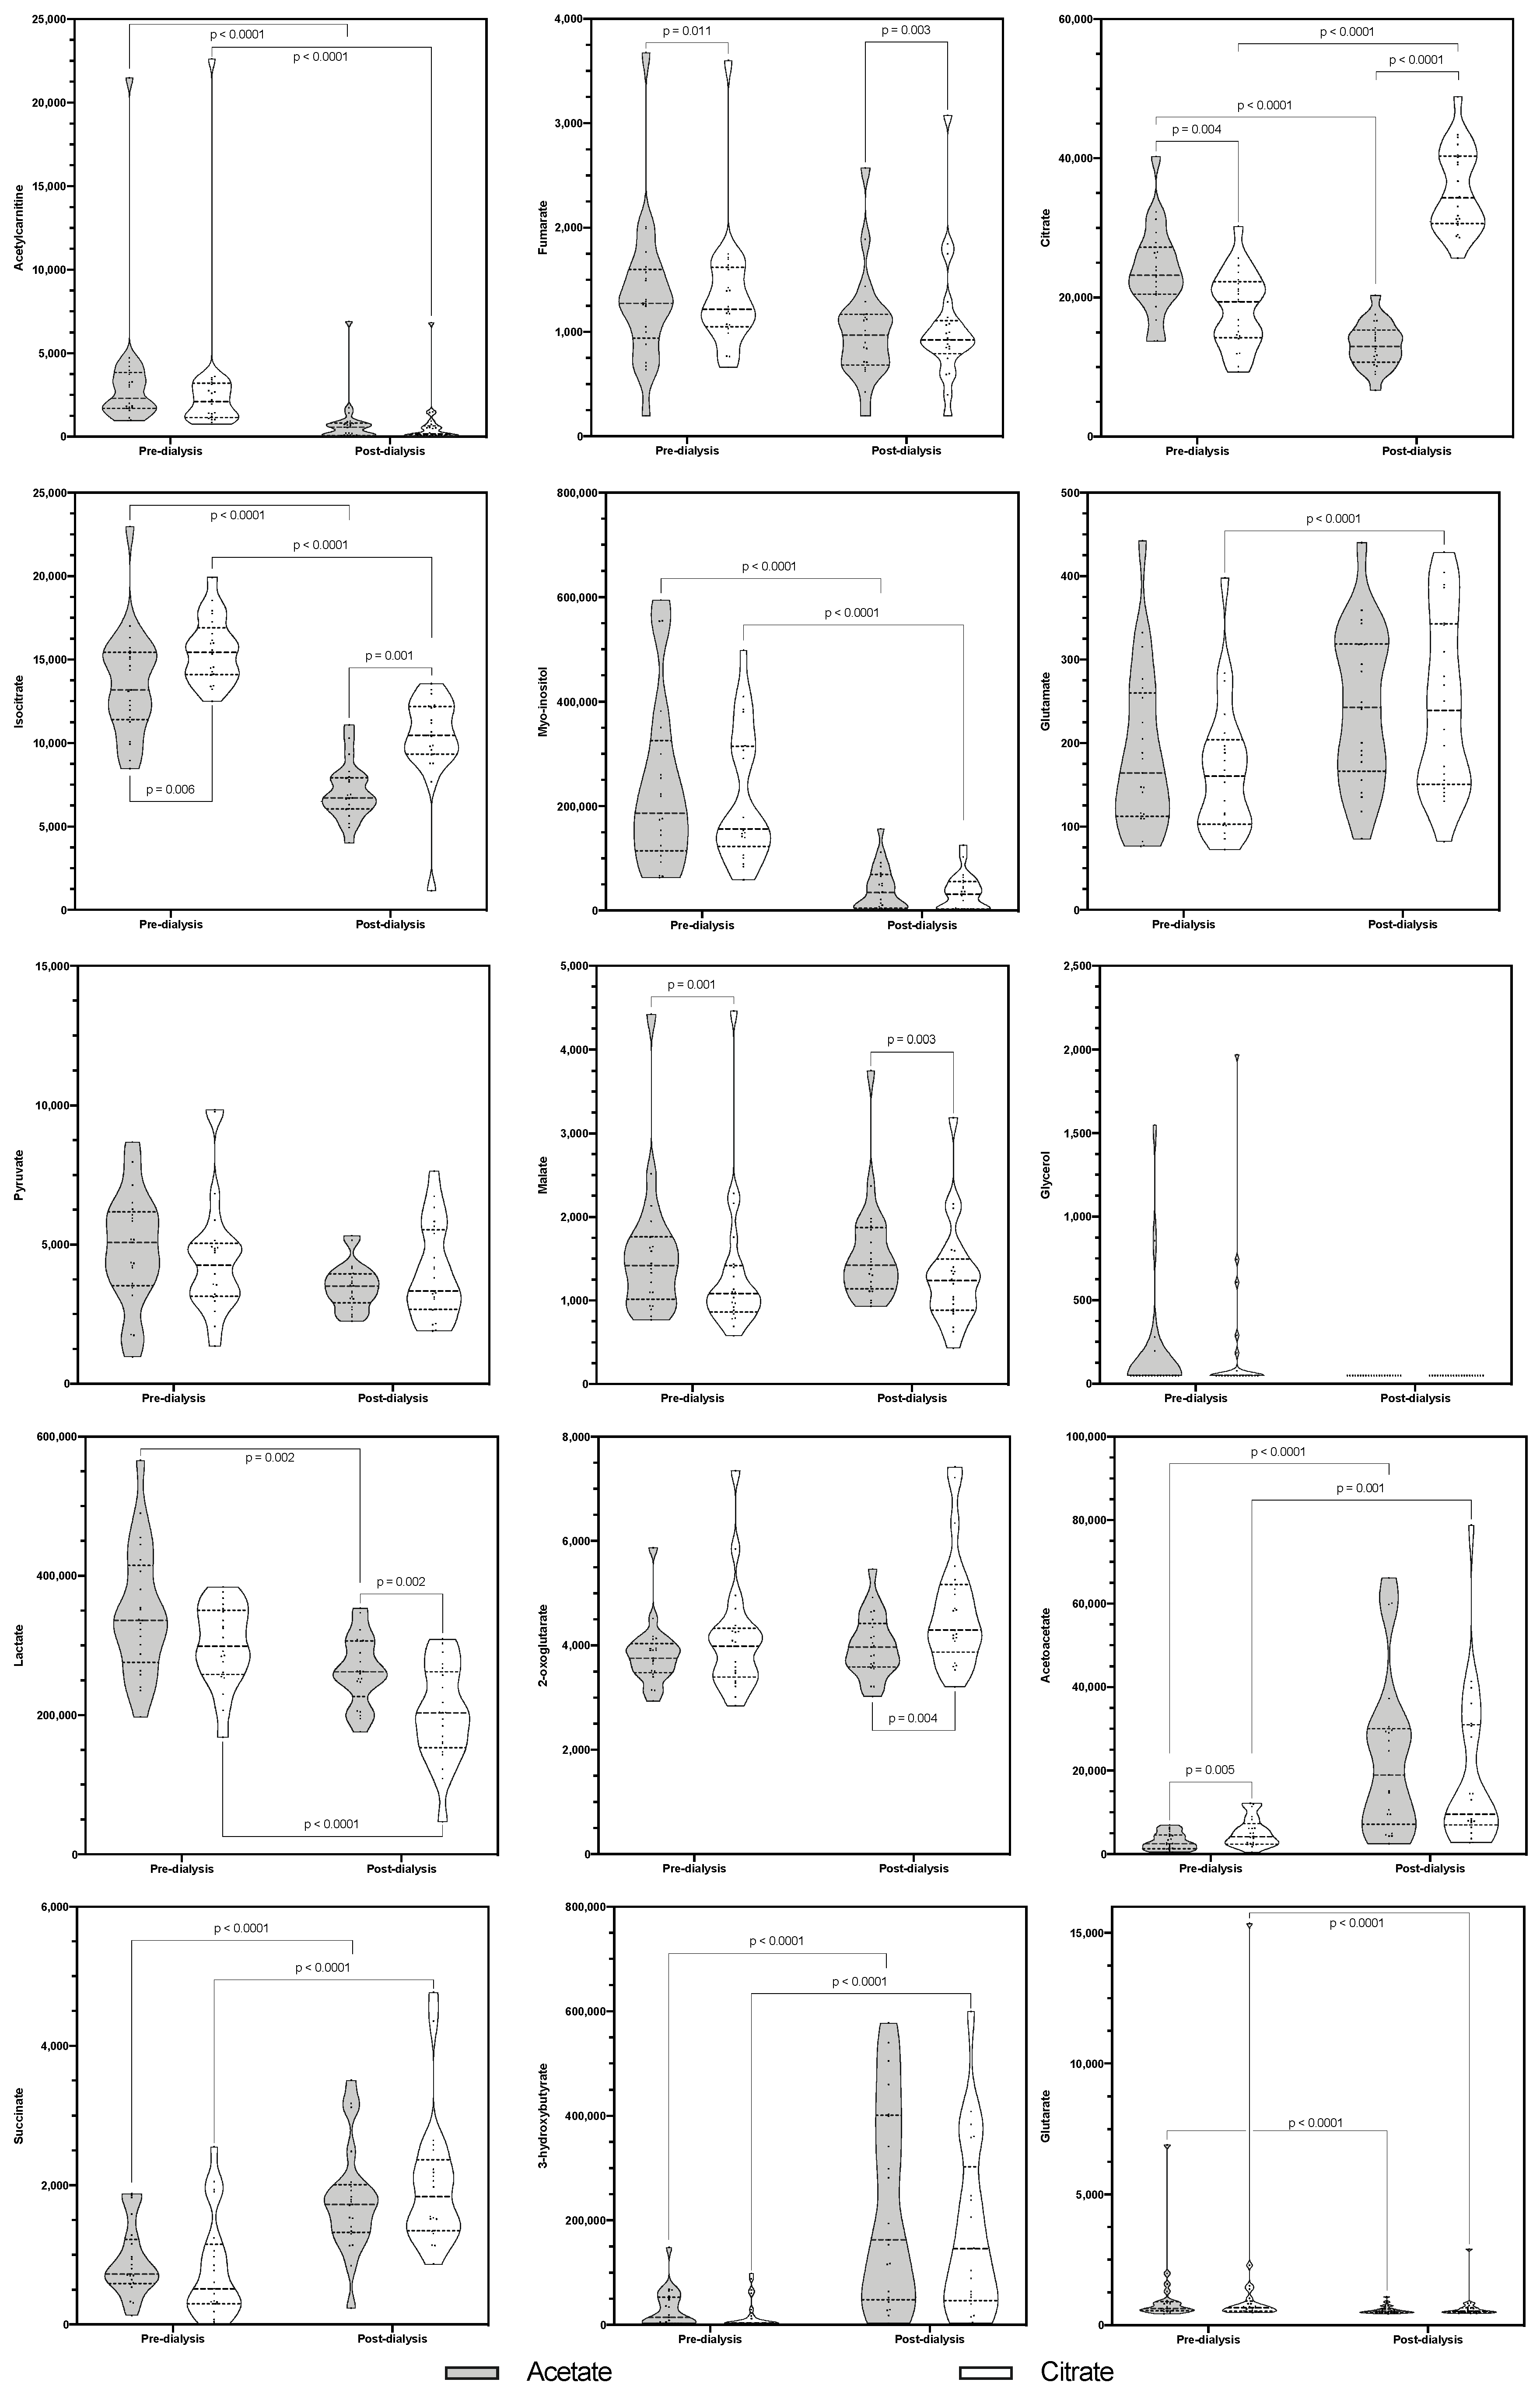
2.2. Metabolomic Analysis

The concentrations of each metabolite in the four measured times are represented in Table 1. Normalized data by Z-scoring are also illustrated in a heat map (Figure 1).

2.2.1. Acetylcarnitine

There was a statistically significant difference in acetylcarnitine concentrations among the four measurements, χ2(3) = 49.96, p < 0.0001 (Figure 2). A decrease appeared between pre- and post-dialysis levels using AD (Z = −4.015, p < 0.0001) and CD (Z = −3.98, p < 0.0001); however, there was no significant difference between AD and CD either in pre- (Z = −1.303, p = 0.192) or post-dialysis (Z = −2.461, p = 0.014).

2.2.2. Fumarate

There was a statistically significant difference in fumarate concentrations among the four measurements, χ2(3) = 12.714, p = 0.005 (Figure 2). Its levels remained stable during the dialysis session with both AD (Z = −0.434, p = 0.664) and CD (Z = −0.017, p = 0.986). Pre- (Z = −2.555, p = 0.011) and post-dialysis (Z = −3.007, p = 0.003) levels were significantly different.

2.2.3. Citrate

Mean citrate concentrations significantly differed between the four measurements [F(2.816, 56.326) = 119.533, p < 0.0001] and consistently in the pairwise comparisons (Figure 2). During the sessions, citrate decreased [10,778.19 (95% CI, 7147.642–14,408.738), p < 0.0001] with AD and increased with CD [−17,038.96 (95% CI, −20,739.052–−13,338.871), p < 0.0001]. Pre- [5617.231 (95% CI, 1538.828–9695.635), p = 0.004] and post-dialysis [−22,199.92 (95% CI, −25,691.342–−18,708.499), p < 0.0001] levels significantly differed, being higher in the pre-dialysis AD measurement but higher in the post-dialysis treatment after one session using CD.

2.2.4. Isocitrate

There was a statistically significant difference in isocitrate concentrations among the four measurements, χ2(3) = 52.029, p < 0.0001. Its levels were significantly reduced during dialysis with both AD (Z = −4.015, p < 0.0001) and CD (Z = −4.015, p < 0.0001). Moreover, the pre- (Z = −2.763, p = 0.006) and post-dialysis (Z = −3.285, p = 0.001) significantly differed.

2.2.5. Myo-Inositol

There was a statistically significant difference in myo-inositol concentrations among the four measurements, χ2(3) = 51.641, p < 0.0001. Its levels were significantly reduced during dialysis with both AD (Z = −4.015, p < 0.0001) and CD (Z = −4.015, p < 0.0001). However, there were no pre- (Z = −1.13, p = 0.259) or post-dialysis (Z = −1.207, p = 0.027) significant differences.

2.2.6. Glutamate

There was a statistically significant difference in glutamate concentrations among the four measurements, χ2(3) = 14.257, p = 0.003. During the sessions, its levels increased. These differences were statistically significant when using CD (Z = −3.493, p < 0.0001) but not when using AD (Z = −2.068, p = 0.039). Neither, pre- (Z = −1.199, p = 0.23), nor post-dialysis (Z = −0.643, p = 0.52) results significantly differed (Figure 2).

2.2.7. Pyruvate

There were no statistically significant differences in pyruvate concentrations among measurements, χ2(3) = 4.429, p = 0.219 (Figure 2).

2.2.8. Malate

There was a statistically significant difference in malate concentrations among the four measurements, χ2(3) = 17.857, p < 0.0001 (Figure 2). Its levels did not change because of the dialysis session with AD (Z = −0.713, p = 0.476) or CD (Z = −0.713, p = 0.476). Pre- (Z = −3.285, p = 0.001) and post-dialysis (Z = −3.007, p = 0.003) levels were significantly higher with AD.

2.2.9. Glycerol

There was a statistically significant difference in glycerol concentrations among the four measurements, χ2(3) = 11.842, p = 0.008 (Figure 2); however, in pairwise comparison, there was neither a significant change during dialysis with AD (Z = −1.826, p = 0.068) or CD (Z = −2.201, p = 0.028), nor between pre- (Z = −0.77, p = 0.441) or post-dialysis (Z = 0, p = 1) results.

2.2.10. Lactate

Mean lactate concentrations differed between the four measurements (F(2.478, 49.568) = 22.063, p < 0.0001) (Figure 2). Lactate levels decreased after dialysis both with AD (83633.688 (95% CI, 26,068.803–141,198.572), p = 0.002) and CD (99,583.827 (95% CI, 51,404.704–147,762.949), p < 0.0001). Pre-dialysis levels did not differ (47,432.131 (95% CI, −17,205.387–112,069.648), p = 0.265) but post-dialysis levels did (63,382.270 (95% CI, 20,177.688–106,586.852), p = 0.002), with lower levels after a dialysis with CD.

2.2.11. 2-Oxoglutarate

There was a statistically significant difference in 2-oxoglutarate concentrations among the four measurements, χ2(3) = 16.371, p = 0.001 (Figure 2). Its levels did not significantly change during the dialysis session with AD (Z = −1.79, p = 0.073) or CD (Z = −2.242, p = 0.025). No differences occurred between pre-dialysis levels (Z = −1.721, p = 0.085), but post-dialysis (Z = −2.902, p = 0.004) values were found to be higher after a session with CD.

2.2.12. Acetoacetate

There was a statistically significant difference in acetoacetate concentrations among the four measurements, χ2(3) = 37.057, p < 0.0001 (Figure 2). During the sessions, both AD (Z = −3.91, p < 0.0001) and CD (Z = −3.18, p = 0.001) induced significant increases. Pre- (Z = −2.833, p = 0.005), but not post-dialysis (Z = −1.581, p = 0.114) levels differed between dialysates, being higher in the CD measurement.

2.2.13. Succinate

There was a statistically significant difference in succinate concentrations among the four measurements, χ2(3) = 34.314, p < 0.0001 (Figure 2). During the dialysis sessions, succinate levels increased both with AD (Z = −3.771, p < 0.0001) and CD (Z = 3.806, p < 0.0001), but there were no pre- (Z = −1.06, p = 0.289) or post-dialysis (Z = −1.581, p = 0.114) differences.

2.2.14. 3-hydroxybutyrate

There was a statistically significant difference in 3-hydroxybutyrate concentrations among the four measurements, χ2(3) = 33.089, p < 0.0001 (Figure 2). Its levels significantly increased during the sessions with AD (Z = −3.509, p < 0.0001) and CD (Z = −3.733, p < 0.0001), but there were no differences between pre- (Z = −1.761, p = 0.078) or post-dialysis (Z = −1.408, p = 0.159) levels.

2.2.15. Glutarate

There was a statistically significant difference in glutarate concentrations among the four measurements, χ2(3) = 33.857, p < 0.0001 (Figure 2). During the session, glutarate levels were reduced with both AD (Z = −3.91, p < 0.0001) and CD (Z = −3.632, p < 0.0001), but no significant differences were found between pre- (Z = −0.122, p = 0.903) and post-dialysis (Z = −1.025, p = 0.305) levels.

3. Discussion

Metabolomics opens the door to studying human metabolism in response to dialysis-induced changes in intermediary metabolism. This study, performed by a targeted metabolomic approach, found noteworthy differences between dialysates that raise new hypotheses that should be further investigated to explain the deleterious acetate effects on dialysis patients [9,10,11,12,13]. Acetyl-CoA levels exceeded by 20–70 times the physiological level despite the apparently small concentrations of acetate in the AD [8,22,23,24]. Although they do not seem to surpass the TCA cycle maximum acetyl-CoA rate of metabolism (diminished from 300 mmol/h in healthy adults to 150 mmol/h in DD-CKD patients [23,25]), acetyl-CoA enters other metabolic routes triggering metabolism disturbances [7,24].

3.1. First Carbon Oxidation Pathway of the TCA Cycle-Related Metabolites

It is noteworthy that after twelve sessions under AD but not under CD, patients had elevated pre-dialysis citrate levels linked to chronic accumulation of acetyl-CoA. This difference reverted during dialysis since citrate rose in blood when CD was used, whereas it decreased when AD was used. Nonetheless, this is inconsistent with other published papers in which it remained stable [8,18,24]. Citrate physiological levels are reasonably similar to our four measurements [26,27], and even after one dialysis with CD did not surpass the upper limit of the proposed normal range. Hence, a supraphysiological accumulation of citrate would not occur due to an improved balance between citrate generation and loss by the dialyzer than with acetate [22,24], in contrast to the 20 to 70 times higher acetate levels observed with AD.
Citrate is isomerized to isocitrate, whose levels decreased more intensely during the sessions with AD. Moreover, pre-dialysis levels differed, so this difference was maintained in the long term. The results observed in all study conditions were considerably lower than physiological [26].
The next step was measurement of 2-oxoglutarate, a rate-determining intermediate in the TCA cycle [28]. 2-oxoglutarate levels were 3–4 times supraphysiological in all study situations [26], with a non-significant increase during dialysis sessions, though post-dialysis levels became significantly higher with CD. This finding, not found in previous reports [18], would have short-term impact.

3.2. Second Carbon Oxidation Pathway of the TCA-Cycle Related Metabolites

Succinate levels rise during the dialysis sessions, which was due to the treatment itself, as no differences between dialysates were found; however, they were lower than physiological levels in all study situations. Fumarate, a metabolite that also takes part in several other pathways, was not modified during the dialysis sessions but had higher pre- and post-dialysis levels when patients were under AD, reaching levels 10 times higher than those seen in healthy adults. Consistent with previously published data, malate remained stable during the dialysis sessions and close to physiological levels [18,26,29].
These changes in the TCA cycle metabolites should not be considered trivial. Acetyl-CoA, succinate, and fumarate can alter immune system responses [28]. Succinate, malate, and fumarate promote tumorigenesis due to their ability to inhibit prolyl hydroxylase-containing enzymes [30]. Lymphangiogenesis and the maintenance of stem cells pluripotency have been associated with acetyl-CoA and 2-oxoglutarate, respectively. The latter is also related to decreased protein catabolism, increased protein synthesis, and increased circulating plasma levels of hormones such as insulin, growth hormone, and IGF−1 [28]. Furthermore, it plays a role in CD4+ T-cell differentiation [31].

3.3. Glycolysis and Anaerobic Metabolism-Related Metabolites

Glycolysis has three irreversible steps mediated by phosphofructokinase, hexokinase, and pyruvate kinase enzymes. Citrate inhibits phosphofructokinase and hexokinase, while the pyruvate kinase is hampered both by citrate and acetyl-CoA. Therefore, both dialysates may play a role in glycolysis inhibition. We found no differences in pyruvate levels during the dialysis session nor between dialysates, as previously reported [8,18]. Pyruvate represents the sole metabolic pathway of lactate, with a bidirectional conversion between the two anions activated by lactate dehydrogenase. During dialysis, acetate displaces pyruvate as a precursor of acetyl-CoA, which, coupled with its generation by glycolysis and the degradation of oxalacetate by the action of pyruvate carboxylase into pyruvate (accumulated by increased acetyl-CoA metabolism in the TCA cycle), may increase its levels [24]. Lactate is the predominant organic acid produced during dialysis, resulting in inefficient use of metabolic substrates for energy production and an irreversible loss of alkali, contributing to the increase of pCO2 [32]. Moreover, the carbonization and decarboxylation of an acetyl-CoA molecule in the TCA cycle is favorable to oxidation and displaces the oxide-reductant pairs increasing pyruvate levels at the expense of lactate [24]. Even with this overproduction, its levels were reduced during dialysis, particularly when using CD, but were higher than the physiological range in all study situations. Therefore, comparing the lactate/pyruvate ratio is interesting. It was higher in AD pre-dialysis measurements and increased with AD while decreasing with CD during the session. These results are consistent with prior reports [8,24]. Myo-inositol levels decreased during dialysis, but as a uremic toxin dialyzed by the membranes, the absence of differences does not provide information of interest.

3.4. Lipidic Metabolism-Related Metabolites

The decline of Acetylcarnitine levels during dialysis may not be due to activation of β-oxidation of fatty acids but losses through membranes. The lack of acetylcarnitine in DD-CKD patients has been related to cardiac complications, impaired functional capacities, symptomatic intradialytic hypotension, and erythropoietin-resistant anemia [33]. Its role in various neurodegenerative processes has also been hypothesized [34]. However, pre-dialysis levels in this study were higher than that of healthy adults [29]. Glycerol levels did not change, so no fatty acid release seemed to occur; however, some measurements were under the LQ, representing a potential bias for interpretation. Glycerol levels were far below physiological levels, despite enormous heterogeneity [29,35].
High levels of acetyl-CoA can combine into acetoacetyl-CoA, essential for synthesizing cholesterol and ketone bodies. 3-hydroxybutyrate levels increased during the dialysis treatment irrespective of the dialysate, indicating dialysis-induced lipolysis [32] and consistent with previous reports stating that it is the second predominant organic acid produced during dialysis [8,24,32]. AD pre-dialysis measurements were higher, but CD levels were lower than physiological values [36]. Pre-dialysis CD acetoacetate levels were higher, but AD resulted in higher post-dialysis levels, as previously reported [8]. Acetoacetate levels were supraphysiological in all measurements [26]. This increase in ketone bodies is meaningful, as it was related to cardiovascular events and all-cause death in a Japanese population study [37].

3.5. Amionoacidic Metabolism-Related Metabolites

Glutarate and glutamate decreased during dialysis, although only glutamate reduction when using CD was statistically significant. Pre-dialysis levels of glutarate were higher than physiological levels [26], but glutamate levels were lower [38], reflecting inhibition of the metabolism of amino acids in addition to their high losses seen during sessions [39,40]. Glutamate can also be converted to 2-oxoglutarate by glutamate dehydrogenase, which increased during sessions.

3.6. Limitations

One limitation of this study is that we did not measure the effluent metabolome, which could have offered a more accurate approach to the real balance of metabolites as they are cleared with a sieving coefficient of approximately 1 [18]. In addition, we included patients with different vascular access, dialysis modalities, and comorbidities, that together with the non-identical electrolytes of both dialysates, may have biased the analysis. The number of metabolites measured was limited; thus, we may have missed other changes in important metabolic pathways. Finally, the study lacked a wash-out period, as patients had to continue their treatments.

4. Materials and Methods

4.1. Study Design and Participants

A unicentric, cross-over, prospective study was conducted at the hemodialysis unit of Hospital Universitari i Politècnic La Fe of Valencia, Spain, to analyze the inter-individual pre- and post-dialysis metabolic profile differences between the use of two dialysate acidifiers: Fresenius® ACF 3A5 acting as the acetate dialysate (AD), that contains 4 mmol/L of acetate, and Fresenius® SmartBag CA 211.5 as the citrate one (CD), with 1 mmol/L of citrate (Table 2).
Each DD-CKD patient over 18 years old, prevalent (i.e., for at least three months), with a treatment scheme of four-hour sessions three times per week, was considered for inclusion. Patients were excluded if they had been admitted to the hospital within the previous month, refused to give written informed consent, or were on treatment with a low calcium dialysate (i.e., 1.25 mmol/L).
Every included patient received twelve dialysis sessions with each dialysate. We could not perform a wash-out period, given that dialysis is a life-sustaining treatment. Four blood samples were taken, pre- and post-dialysis on a midweek session after being exposed to each dialysate acidifier for four weeks. Dialysis parameters, medical treatment, and dialysate components, other than the acidifier, remained unchanged during the study to avoid potential confounders. In that sense, and to make the treatment parameters as similar as possible, bicarbonate and sodium concentration in both dialysates were adjusted in the monitor to 32 and 138 mmol/L, respectively. More details on the parameters of the dialysis treatments have been published previously [9].

4.2. Variables

Quantitative data from a group of fifteen predetermined intermediate metabolites were collected (Table 2): 3-hydroxybutyrate and acetoacetate to evaluate ketogenesis; citrate, isocitrate, and 2-oxoglutarate to evaluate the first carbon oxidation pathway of the TCA cycle, and succinate, fumarate, and malate to evaluate the second pathway; pyruvate to evaluate glycolysis; lactate to evaluate anaerobic metabolism; acetylcarnitine to evaluate oxidation of fatty acids; glycerol, to evaluate triglyceride metabolism; myo-inositol to evaluate inositol phosphate metabolism; and glutamate and glutarate to evaluate aminoacidic metabolism (Table 3). Demographics and past medical history data were collected from electronic health records.

4.3. Sample Preparation and Metabolomic Analysis

Metabolomic analysis of the processed samples was carried out in the Analytical Unit of the Medical Research Institute Hospital La Fe. Blood samples were drawn in ethylenediaminetetraacetic acid (EDTA) tubes, which were processed within 30 min of collection to avoid platelet activation and protein production, as well as the decomposition of thermolabile compounds. Subsequently, they were centrifuged at 1500 g for 10 min at a temperature of 4 °C to separate the cellular fraction from the plasma. The upper phase, corresponding to the latter, was recovered and centrifuged again at 2500 g for another 15 min at 4 °C to eliminate platelets. The upper phase was recovered and aliquoted into cryo-freezing vials in volumes of 100–200 µL for freezing at −80 °C.
For analysis, 50 µL of the plasma samples were extracted, 150 µL of cold methanol was added, and the mixture was allowed to stand for 20 min at 20 °C to facilitate protein precipitation. The samples were centrifuged at 13,000 rpm for 10 min at 4 °C, and the supernatant was recovered in Eppendorf tubes for evaporation in a SpeedVac. The dried sediment was reconstituted in water: methanol (98:2) 0.2% formic acid solution, to which phenylalanine-d5 was added as an internal calibrator.
An Agilent® 6460 triple-quadruple mass spectrometer, using a liquid chromatography-mass spectrometry-based multiple reactions monitoring metabolomics platform optimized for detecting TCA cycle metabolites, was used to analyze the processed samples. A calibration curve was prepared, and the concentrations (ppb or µg/L) were calculated with internal calibration using the internal standard phe-d5. All reagents and chemicals were purchased from Sigma Aldrich.

4.4. Statistical Analysis

Quantitative variables are reported with mean and standard deviation when normally distributed, or median and interquartile range when non-normally distributed, according to the Shapiro-Wilk test, while qualitative data are reported as absolute and relative frequencies. Results below the limit of quantification (LQ), only occurring within glycerol, were replaced by LQ/2. Data with no signal, or whose value was zero, were set as non-detected. A repeated-measures ANOVA was conducted to compare the normally distributed studied metabolites. A Greenhouse-Geisser correction was selected if data failed to meet Mauchly’s test of sphericity. Post-hoc analysis with a Bonferroni adjustment was performed to make pairwise comparisons. If data had significant outliers or marked deviations from normality, the Friedman test was chosen as the non-parametric alternative. Post hoc analyses with Wilcoxon signed-rank tests were conducted with a Bonferroni correction applied to make the pairwise comparisons. A 2-sided p < 0.05 was considered statistically significant; thus, after the Bonferroni adjustment, the new significance level was stated as 0.0125. Analyses were performed with IBM SPSS® Statistics 26th version and graphics with GraphPad Prism® 8th.

5. Conclusions

In conclusion, dialysis has a catabolic effect, and both dialysates modify the major pathways of intermediary metabolism. Still, this study provides some striking data comparing CD against AD that need further study to better understand the biochemical processes that dialysis and the different dialysate options induce in the patient’s metabolism, leading to more personalized treatment prescriptions.

Author Contributions

Conceptualization, J.J.B., M.R. and J.H.-J.; data curation, J.J.B., L.C.L.-R. and A.G.-B.; formal analysis, J.J.B. and M.R.; funding acquisition, J.H.-J.; investigation, J.J.B., D.R.-E. and E.C.-P.; methodology, J.J.B., M.R., R.D.-S., A.S., S.B.-G., P.S.-P. and J.H.-J.; project administration, J.J.B. and J.H.-J.; resources, J.H.-J.; supervision, M.R. and J.H.-J.; validation, M.R. and J.H.-J.; writing—original draft, J.J.B., D.R.-E. and E.C.-P.; writing—review & editing, J.J.B., M.R., D.R.-E., L.C.L.-R., A.G.-B., E.C.-P., R.D.-S., A.S., S.B.-G., P.S.-P. and J.H.-J. All authors have read and agreed to the published version of the manuscript.

Funding

Part of the equipment used in this work was co-funded by the Generalitat Valenciana and European Regional Development Fund (FEDER) funds (PO FEDER of Comunitat Valenciana 2014–2020).

Institutional Review Board Statement

The Clinical Research Ethics Committee of Hospital Universitari i Politècnic La Fe reviewed and approved this study protocol. All study subjects gave their written informed consent. Data collection followed Regulation (EU) 2016/679 (General Data Protection Regulation), its subordinate national and regional laws, and the Declaration of Helsinki principles.

Informed Consent Statement

Written informed consent has been obtained from the patients to publish this paper.

Data Availability Statement

The data supporting the findings of this study are available on GitHub (https://github.com/Broseta/Citrate-dialysate.git, (accessed 29 July 2022)).

Acknowledgments

We would like to publicly thank all participating patients and the nursing staff of the Dialysis and Investigation Units of the Department of Nephrology of Hospital Universitari i Politècnic La Fe for their selfless and enthusiastic collaboration in this study.

Conflicts of Interest

The authors declare no conflict of interest.

References

  1. Stegmayr, B. Dialysis Procedures Alter Metabolic Conditions. Nutrients 2017, 9, 548. [Google Scholar] [CrossRef] [PubMed]
  2. Hocher, B.; Adamski, J. Metabolomics for clinical use and research in chronic kidney disease. Nat. Rev. Nephrol. 2017, 13, 269–284. Available online: https://pubmed.ncbi.nlm.nih.gov/28262773/ (accessed on 7 August 2021). [CrossRef] [PubMed]
  3. Zhu, S.; Zhang, F.; Shen, A.-W.; Sun, B.; Xia, T.-Y.; Chen, W.-S.; Tao, X.; Yu, S.-Q. Metabolomics Evaluation of Patients with Stage 5 Chronic Kidney Disease before Dialysis, Maintenance Hemodialysis, and Peritoneal Dialysis. Front. Physiol. 2021, 11, 630646. Available online: https://pubmed.ncbi.nlm.nih.gov/33551851/ (accessed on 7 August 2021). [CrossRef] [PubMed]
  4. Kalantari, S.; Nafar, M. An update of urine and blood metabolomics in chronic kidney disease. Biomark. Med. 2019, 13, 577–597. Available online: https://pubmed.ncbi.nlm.nih.gov/31140832/ (accessed on 7 August 2021). [CrossRef]
  5. Tamura, M.K.; Chertow, G.M.; Depner, T.A.; Nissenson, A.R.; Schiller, B.; Mehta, R.L.; Liu, S.; Sirich, T.L. Metabolic Profiling of Impaired Cognitive Function in Patients Receiving Dialysis. J. Am. Soc. Nephrol. 2016, 27, 3780–3787. Available online: https://pubmed.ncbi.nlm.nih.gov/27444566/ (accessed on 7 August 2021). [CrossRef] [Green Version]
  6. Hu, J.-R.; Grams, M.E.; Coresh, J.; Hwang, S.; Kovesdy, C.P.; Guallar, E.; Rhee, E.P.; Shafi, T. Serum Metabolites and Cardiac Death in Patients on Hemodialysis. Clin. J. Am. Soc. Nephrol. 2019, 14, 747–749. Available online: https://pubmed.ncbi.nlm.nih.gov/30962187/ (accessed on 7 August 2021). [CrossRef]
  7. Petitclerc, T.; Diab, R.; le Roy, F.; Mercadal, L.; Hmida, J. Hémodialyse sans acétate: Qu’est-ce vraiment? Néphrologie Thérapeutique 2011, 7, 92–98. [Google Scholar] [CrossRef]
  8. Sánchez-Canel, J.J.; Hernández-Jaras, J.; Pons-Prades, R. A Randomized Controlled Study on the Effects of Acetate-Free Biofiltration on Organic Anions and Acid-Base Balance in Hemodialysis Patients. Ther. Apher. Dial. 2015, 19, 63–72. [Google Scholar] [CrossRef]
  9. Broseta, J.J.; López-Romero, L.C.; Cerveró, A.; Devesa-Such, R.; Soldevila, A.; Bea-Granell, S.; Sánchez-Pérez, P.; Hernández-Jaras, J. Improvements in Inflammation and Calcium Balance of Citrate versus Acetate as Dialysate Buffer in Maintenance Hemodialysis: A Unicentric, Cross-Over, Prospective Study. Blood Purif. 2021, 50, 914–920. [Google Scholar] [CrossRef]
  10. Dellepiane, S.; Medica, D.; Guarena, C.; Musso, T.; Quercia, A.D.; Leonardi, G.; Marengo, M.; Migliori, M.; Panichi, V.; Biancone, L.; et al. Citrate anion improves chronic dialysis efficacy, reduces systemic inflammation and prevents Chemerin-mediated microvascular injury. Sci. Rep. 2019, 9, 10622. [Google Scholar] [CrossRef]
  11. Gabutti, L.; Lucchini, B.; Marone, C.; Alberio, L.; Burnier, M. Citrate- vs. acetate-based dialysate in bicarbonate haemodialysis: Consequences on haemodynamics, coagulation, acid-base status, and electrolytes. BMC Nephrol. 2009, 10, 7. [Google Scholar] [CrossRef] [PubMed] [Green Version]
  12. Pérez-García, R.; Chamond, R.R.; Ortiz, P.D.S.; Albalate, M.; Carretero, M.P.; Ortega, M.; Caro, M.C.R.; Arroyo, R.A. Citrate dialysate does not induce oxidative stress or inflammation in vitro as compared to acetate dialysate. Nefrologia 2017, 37, 630–637. [Google Scholar] [CrossRef] [PubMed]
  13. Grundström, G.; Christensson, A.; Alquist, M.; Nilsson, L.G.; Segelmark, M. Replacement of acetate with citrate in dialysis fluid: A randomized clinical trial of short term safety and fluid biocompatibility. BMC Nephrol. 2013, 14, 216. [Google Scholar] [CrossRef] [PubMed] [Green Version]
  14. Sands, J.J.; Kotanko, P.; Segal, J.H.; Ho, C.-H.; Usvat, L.; Young, A.; Carter, M.; Sergeyeva, O.; Korth, L.; Maunsell, E.; et al. Effects of citrate acid concentrate (Citrasate®) on heparin N requirements and hemodialysis adequacy: A multicenter, prospective noninferiority trial. Blood Purif. 2012, 33, 199–204. [Google Scholar] [CrossRef]
  15. Trakarnvanich, T.; Thirathanakul, S.; Sriphueng, N.; Thumrongthongjaroon, P.; Kurathong, S.; Ngamvichchukorn, T. The effect of citrate on clot formation, dialyzer reuse, and anemia in hemodialysis patients. Blood Purif. 2019, 47, 361–368. [Google Scholar] [CrossRef]
  16. Rocha, A.D.; Padua, V.C.; Oliveira, E.; Guimaraes, M.M.; Lugon, J.R.; Strogoff de Matos, J.P. Effects of citrate-enriched bicarbonate based dialysate on anticoagulation and dialyzer reuse in maintenance hemodialysis patients. Hemodial. Int. 2014, 18, 467–472. [Google Scholar] [CrossRef]
  17. Zarbock, A.; Küllmar, M.; Kindgen-Milles, D.; Wempe, C.; Gerss, J.; Brandenburger, T.; Dimski, T.; Tyczynski, B.; Jahn, M.; Mülling, N.; et al. Effect of Regional Citrate Anticoagulation vs Systemic Heparin Anticoagulation during Continuous Kidney Replacement Therapy on Dialysis Filter Life Span and Mortality among Critically Ill Patients with Acute Kidney Injury: A Randomized Clinical Trial. JAMA—J. Am. Med. Assoc. 2020, 324, 1629–1639. Available online: https://pubmed.ncbi.nlm.nih.gov/33095849/ (accessed on 7 August 2021). [CrossRef]
  18. Yamakawa, M.; Yamamoto, T.; Kishimoto, T.; Mizutani, Y.; Yatsuboshi, M.; Nishitani, H.; Hirata, S.; Horiuchi, N.; Maekawa, M. Serum levels of acetate and TCA cycle intermediates during hemodialysis in relation to symptoms. Nephron 1982, 32, 155–161. Available online: https://pubmed.ncbi.nlm.nih.gov/7177293/ (accessed on 29 December 2021). [CrossRef]
  19. Kuragano, T.; Kida, A.; Furuta, M.; Yahiro, M.; Kitamura, R.; Otaki, Y.; Nonoguchi, H.; Matsumoto, A.; Nakanishi, T. Effects of Acetate-Free Citrate-Containing Dialysate on Metabolic Acidosis, Anemia, and Malnutrition in Hemodialysis Patients. Artif. Organs 2012, 36, 282–290. [Google Scholar] [CrossRef]
  20. Lorenz, G.; Mayer, C.C.; Bachmann, Q.; Stryeck, S.; Braunisch, M.C.; Haller, B.; Carbajo-Lozoya, J.; Schmidt, A.; Witthauer, S.; Abuzahu, J.; et al. Acetate-free, citrate-acidified bicarbonate dialysis improves serum calcification propensity—A preliminary study. Nephrol. Dial. Transplant. 2018, 33, 2043–2051. Available online: https://academic.oup.com/ndt/advance-article/doi/10.1093/ndt/gfy134/5025720 (accessed on 20 June 2018). [CrossRef]
  21. Bryland, A.; Wieslander, A.; Carlsson, O.; Hellmark, T.; Godaly, G. Citrate treatment reduces endothelial death and inflammation under hyperglycaemic conditions. Diabetes Vasc. Dis. Res. 2012, 9, 42–51. [Google Scholar] [CrossRef] [PubMed] [Green Version]
  22. Fournier, G.; Potier, J.; Thébaud, H.E.; Majdalani, G.; Ton-That, H.; Man, N.K. Substitution of acetic acid for hydrochloric acid in the bicarbonate buffered dialysate. Artif. Organs 1998, 22, 608–613. Available online: https://pubmed.ncbi.nlm.nih.gov/9684700/ (accessed on 7 July 2022). [CrossRef] [PubMed]
  23. Kishimoto, T.; Yamamoto, T.; Yamamoto, K.; Yamagami, S.; Nishitani, H.; Mizutani, Y.; Yamakawa, M.; Maekawa, M. Acetate Kinetics during Hemodialysis and Hemofiltration. Blood Purif. 1984, 2, 81–87. Available online: https://www.karger.com/Article/FullText/169316 (accessed on 7 July 2022). [CrossRef]
  24. Hernández-Jaras, J.; Estrada, A.; García-Cantón, C.; Traver, J. Equilibrio ácido-base y aniones orgánicos: Diferencias en biofiltración con acetato (bf) y hemodiálisis con bicarbonato. Nefrología 1994, 14, 591–597. Available online: https://www.revistanefrologia.com/es-equilibrio-acido-base-aniones-organicos-diferencias-articulo-X0211699594006762 (accessed on 11 July 2022).
  25. Lundquist, F. Production and utilization of free acetate in man. Nature 1962, 193, 579–580. Available online: https://pubmed.ncbi.nlm.nih.gov/14467396/ (accessed on 29 December 2021). [CrossRef]
  26. Hoffmann, G.F.; Meier-Augenstein, W.; Stöckler, S.; Surtees, R.; Rating, D.; Nyhan, W.L. Physiology and pathophysiology of organic acids in cerebrospinal fluid. J. Inherit. Metab. Dis. 1993, 16, 648–669. Available online: https://pubmed.ncbi.nlm.nih.gov/8412012/ (accessed on 6 July 2022). [CrossRef]
  27. Zordoky, B.; Sung, M.M.; Ezekowitz, J.; Mandal, R.; Han, B.; Bjorndahl, T.C.; Bouatra, S.; Anderson, T.; Oudit, G.Y.; Wishart, D.S.; et al. Metabolomic fingerprint of heart failure with preserved ejection fraction. PLoS ONE 2015, 10, e0124844. Available online: https://pubmed.ncbi.nlm.nih.gov/26010610/ (accessed on 6 July 2022).
  28. Wu, N.; Yang, M.; Gaur, U.; Xu, H.; Yao, Y.; Li, D. Alpha-Ketoglutarate: Physiological Functions and Applications. Biomol Ther 2016, 24, 1–8. Available online: https://pubmed.ncbi.nlm.nih.gov/26759695/ (accessed on 6 July 2022). [CrossRef] [Green Version]
  29. Psychogios, N.; Hau, D.D.; Peng, J.; Guo, A.C.; Mandal, R.; Bouatra, S.; Sinelnikov, I.; Krishnamurthy, R.; Eisner, R.; Gautam, B.; et al. The human serum metabolome. PLoS ONE 2011, 6, e16957. Available online: https://pubmed.ncbi.nlm.nih.gov/21359215/ (accessed on 6 July 2022). [CrossRef] [Green Version]
  30. Martínez-Reyes, I.; Chandel, N.S. Mitochondrial TCA cycle metabolites control physiology and disease. Nat. Commun. 2020, 11, 102. Available online: https://www.nature.com/articles/s41467-019-13668-3 (accessed on 6 July 2022). [CrossRef] [Green Version]
  31. Klysz, D.; Tai, X.; Robert, P.A.; Craveiro, M.; Cretenet, G.; Oburoglu, L.; Mongellaz, C.; Floess, S.; Fritz, V.; Matias, M.I.; et al. Glutamine-dependent α-ketoglutarate production regulates the balance between T helper 1 cell and regulatory T cell generation. Sci. Signal. 2015, 8, ra97. Available online: https://pubmed.ncbi.nlm.nih.gov/26420908/ (accessed on 6 July 2022). [CrossRef] [PubMed] [Green Version]
  32. Sargent, J.A.; Marano, M.; Marano, S.; Gennari, F.J. Acid-base homeostasis during hemodialysis: New insights into the mystery of bicarbonate disappearance during treatment. Semin. Dial. 2018, 31, 468–478. [Google Scholar] [CrossRef] [PubMed]
  33. Bellinghieri, G.; Santoro, D.; Calvani, M.; Mallamace, A.; Savica, V. Carnitine and hemodialysis. Am. J. Kidney Dis. 2003, 41, S116–S122. Available online: https://pubmed.ncbi.nlm.nih.gov/12612967/ (accessed on 6 July 2022). [CrossRef] [PubMed] [Green Version]
  34. Virmani, A.; Binienda, Z. Role of carnitine esters in brain neuropathology. Mol. Aspects Med. 2004, 25, 533–549. Available online: https://pubmed.ncbi.nlm.nih.gov/15363640/ (accessed on 6 July 2022). [CrossRef]
  35. Blomqvist, G.; Alvarsson, M.; Grill, V.; Von Heijne, G.; Ingvar, M.; Thorell, J.O.; Stone-Elander, S.; Widén, L.; Ekberg, K. Effect of acute hyperketonemia on the cerebral uptake of ketone bodies in nondiabetic subjects and IDDM patients. Am. J. Physiol. Endocrinol. Metab. 2002, 283, E20–E28. Available online: https://pubmed.ncbi.nlm.nih.gov/12067838/ (accessed on 6 July 2022). [CrossRef] [Green Version]
  36. Burns, S.F.; Broom, D.R.; Miyashita, M.; Ueda, C.; Stensel, D.J. Increased postprandial triacylglycerol concentrations following resistance exercise. Med. Sci. Sports Exerc. 2006, 38, 527–533. Available online: https://pubmed.ncbi.nlm.nih.gov/16540841/ (accessed on 6 July 2022). [CrossRef]
  37. Obokata, M.; Negishi, K.; Sunaga, H.; Ishida, H.; Ito, K.; Ogawa, T.; Iso, T.; Ando, Y.; Kurabayashi, M. Association between circulating ketone bodies and worse outcomes in hemodialysis patients. J. Am. Heart Assoc. 2017, 6, e006885. [Google Scholar] [CrossRef] [Green Version]
  38. Trabado, S.; Al-Salameh, A.; Croixmarie, V.; Masson, P.; Corruble, E.; Fève, B.; Colle, R.; Ripoll, L.; Walther, B.; Boursier-Neyret, C.; et al. The human plasma-metabolome: Reference values in 800 French healthy volunteers; impact of cholesterol, gender and age. PLoS ONE 2017, 12, e0173615. Available online: https://pubmed.ncbi.nlm.nih.gov/28278231/ (accessed on 6 July 2022). [CrossRef] [Green Version]
  39. Hendriks, F.K.; Smeets, J.S.J.; Broers, N.J.H.; van Kranenburg, J.M.X.; van der Sande, F.M.; Kooman, J.P.; van Loon, L.J.C. End-Stage Renal Disease Patients Lose a Substantial Amount of Amino Acids during Hemodialysis. J. Nutr. 2020, 150, 1160–1166. Available online: https://academic.oup.com/jn/article/150/5/1160/5719508 (accessed on 8 July 2022). [CrossRef] [Green Version]
  40. Lim, V.S.; Bier, D.M.; Flanigan, M.J.; Sum-Ping, S.T. The effect of hemodialysis on protein metabolism. A leucine kinetic study. J. Clin. Investig. 1993, 91, 2429–2436. Available online: https://pubmed.ncbi.nlm.nih.gov/8514855/ (accessed on 8 July 2022). [CrossRef]
Figure 1. Heat map representing the normalized data by Z-scoring of each metabolite in the four measurement times. It is clear that dialysis per se has a catabolic effect and that most of the differences are produced by the treatment; however, it is visible that, in some cases, the metabolite concentrations are very disparate between dialysates.
Ijms 23 11693 g001
Figure 2. Violin plot representing the pre- and post-dialysis measured concentrations of the fifteen studied metabolites with each dialysate. Statistically significant differences are marked.
Ijms 23 11693 g002
Table 1. Differences in measured metabolites concentrations expressed in µg/L as mean ± standard deviation or median (interquartile range).
Metabolite
(µg/L)
Acetate DialysateCitrate Dialysate
Pre-DialysisPost-DialysisPre-DialysisPost-Dialysis
Acetylcarnitine2292.83 (1698.3–3835.64)565.12 (75–814.56)2108.21 (1138.39–3206.01)164.52 (75–643.1)
Fumarate1275.33 (940.83–1597.34)1215.87 (1050.27–1617.92)968.72 (682.95–1169.75)924.19 (790.46–1109.45)
Citrate23,930.01 ± 6243.6313,151.82 ± 3245.2518,312.77 ± 5534.1135,351.74 ± 6126.8
Isocitrate13,181.79 (11,407.72–15,441.07)6717.97 (6051.02–7927.15)15,438.28 (14,109.91–16,918.49)10,463.95 (9330.3–12,195.79)
Myo-inositol186,825.86 (115,033.27–325,459.59)34,635.77 (4328.17–69,297.23)156,509.77 (123,131.02–315,150.31)31,586.57 (3125–55,889.43)
Glutamate164.33 (112.36–260.19)242.62 (166.44–318.71)160.35 (102.76–204.39)239.09 (150.69–342.67)
Pyruvate5075.38 (3526.28–6168.7)3509.35 (2905.18–3952.23)4253.1 (3135.06–5031.68)3322.45 (2664.53–5529.55)
Malate1418.21 (1015.39–1760.36)1418.82 (1138.72–1869.07)1080.15 (860.11–1416.11)1238.32 (879.48–1496.05)
Glycerol48.5 (48.5–48.5)48.5 (48.5–48.5)48.5 (48.5–129.6)48.5 (48.5–48.5)
Lactate347,331.76 ± 91,933.58263,698.08 ± 49,573.01299,899.63 ± 57,695.8200,315.81 ± 68,510.44
2-oxoglutarate3755.05 (3476.57–4032.21)3968.36 (3587–4421.18)3984.51 (3393.35–4323.3)4290.49 (3868.34–5168.94)
Acetoacetate2473.04 (1277.63–4600.98)18,926.55 (7189.31–30,038.77)4166.43 (2374.53–7277.45)9580.02 (6992.68–30,978.53)
Succinate722.6 (588.57–1221.9)1725.48 (1325.02–2012.26)515.06 (297.41–1150.89)1838.29 (1344.81–2370.32)
3-hydroxybutyrate14,338.64 (3125–53,089.27)162,982.81 (48,176.41–401,805.24)3125 (3125–23,132.58)146,012.84 (46,441.35–303,043.91)
Glutarate636.45 (548.76–906.39)530.86 (480.5–618.66)664.43 (528.85–922.1)526.83 (479.83–668.31)
Table 2. Dialysate characteristics and compounds.
Fresenius ACF 3A5Fresenius Smartbag CA 211.5
Sodium (mmol/L)140138
Potassium (mmol/L)22
Calcium (mmol/mL)1.51.5
Magnesium (mmol/mL)0.50.5
Chloride (mmol/mL)106109
Acetate (mmol/L)4-
Citrate (mmol/L)-1
Glucose (g/L)11
Bicarbonate (mmol/L)3532
In-use dilution1 + 441 + 44
Table 3. Analyzed metabolites and their biochemical characteristics.
MetaboliteChemical FormulaMolecular Mass (g/mol)Biochemical ClassMain Metabolic Pathways
AcetylcarnitineC9H17NO4203.236Fatty acid estersOxidation of fatty acids
FumarateC4H4O4116.072Dicarboxylic acids and derivativesTCA cycle (2nd carbon oxidation), electron transport chain
CitrateC6H8O7189.1Tricarboxylic acids and derivativesTCA cycle (1st carbon oxidation), transfer of acetyl groups into mitochondria
IsocitrateC6H8O7189.1Tricarboxylic acids and derivativesTCA cycle (1st carbon oxidation)
Myo-inositolC6H12O6180.16Alcohols and polyolsInositol phosphate metabolism, secondary messenger in signal transduction pathways
GlutamateC5H9NO4147.13Amino acids, peptides, and analoguesAminoacidic metabolism
PyruvateC3H4O388.06Alpha-keto acids and derivativesGlycolysis, gluconeogenesis, lipogenesis
MalateC4H6O5134.08Beta hydroxy acids and derivativesTCA cycle (2nd carbon oxidation), gluconeogenesis, pyruvate metabolism
GlycerolC3H8O392.09Carbohydrates and carbohydrate conjugatesTriglyceride metabolism
LactateC3H6O390.08Alpha hydroxy acids and derivativesGluconeogenesis, pyruvate metabolism
2-oxoglutarateC5H6O5146.11Gamma-keto acids and derivativesTCA cycle (1st carbon oxidation), aminoacidic metabolism
AcetoacetateC4H6O3101.08Short-chain keto acids and derivativesKetone body metabolism, fatty acid biosynthesis
SuccinateC4H6O4118.09Dicarboxylic acids and derivativesTCA cycle (2nd carbon oxidation), electron transport chain
3-hydroxybutyrateC4H8O3103.1Beta hydroxy acids and derivativesKetone body metabolism, fatty acid biosynthesis
GlutarateC5H8O4147.13Dicarboxylic acids and derivativesAminoacidic metabolism
TCA: Krebs tricarboxylic acid.
Publisher’s Note: MDPI stays neutral with regard to jurisdictional claims in published maps and institutional affiliations.

