
INSIDIA 2.0 High-Throughput Analysis of 3D Cancer Models: Multiparametric Quantification of Graphene Quantum Dots Photothermal Therapy for Glioblastoma and Pancreatic Cancer

 , , ,
, , ,  , ,
, ,  and
and 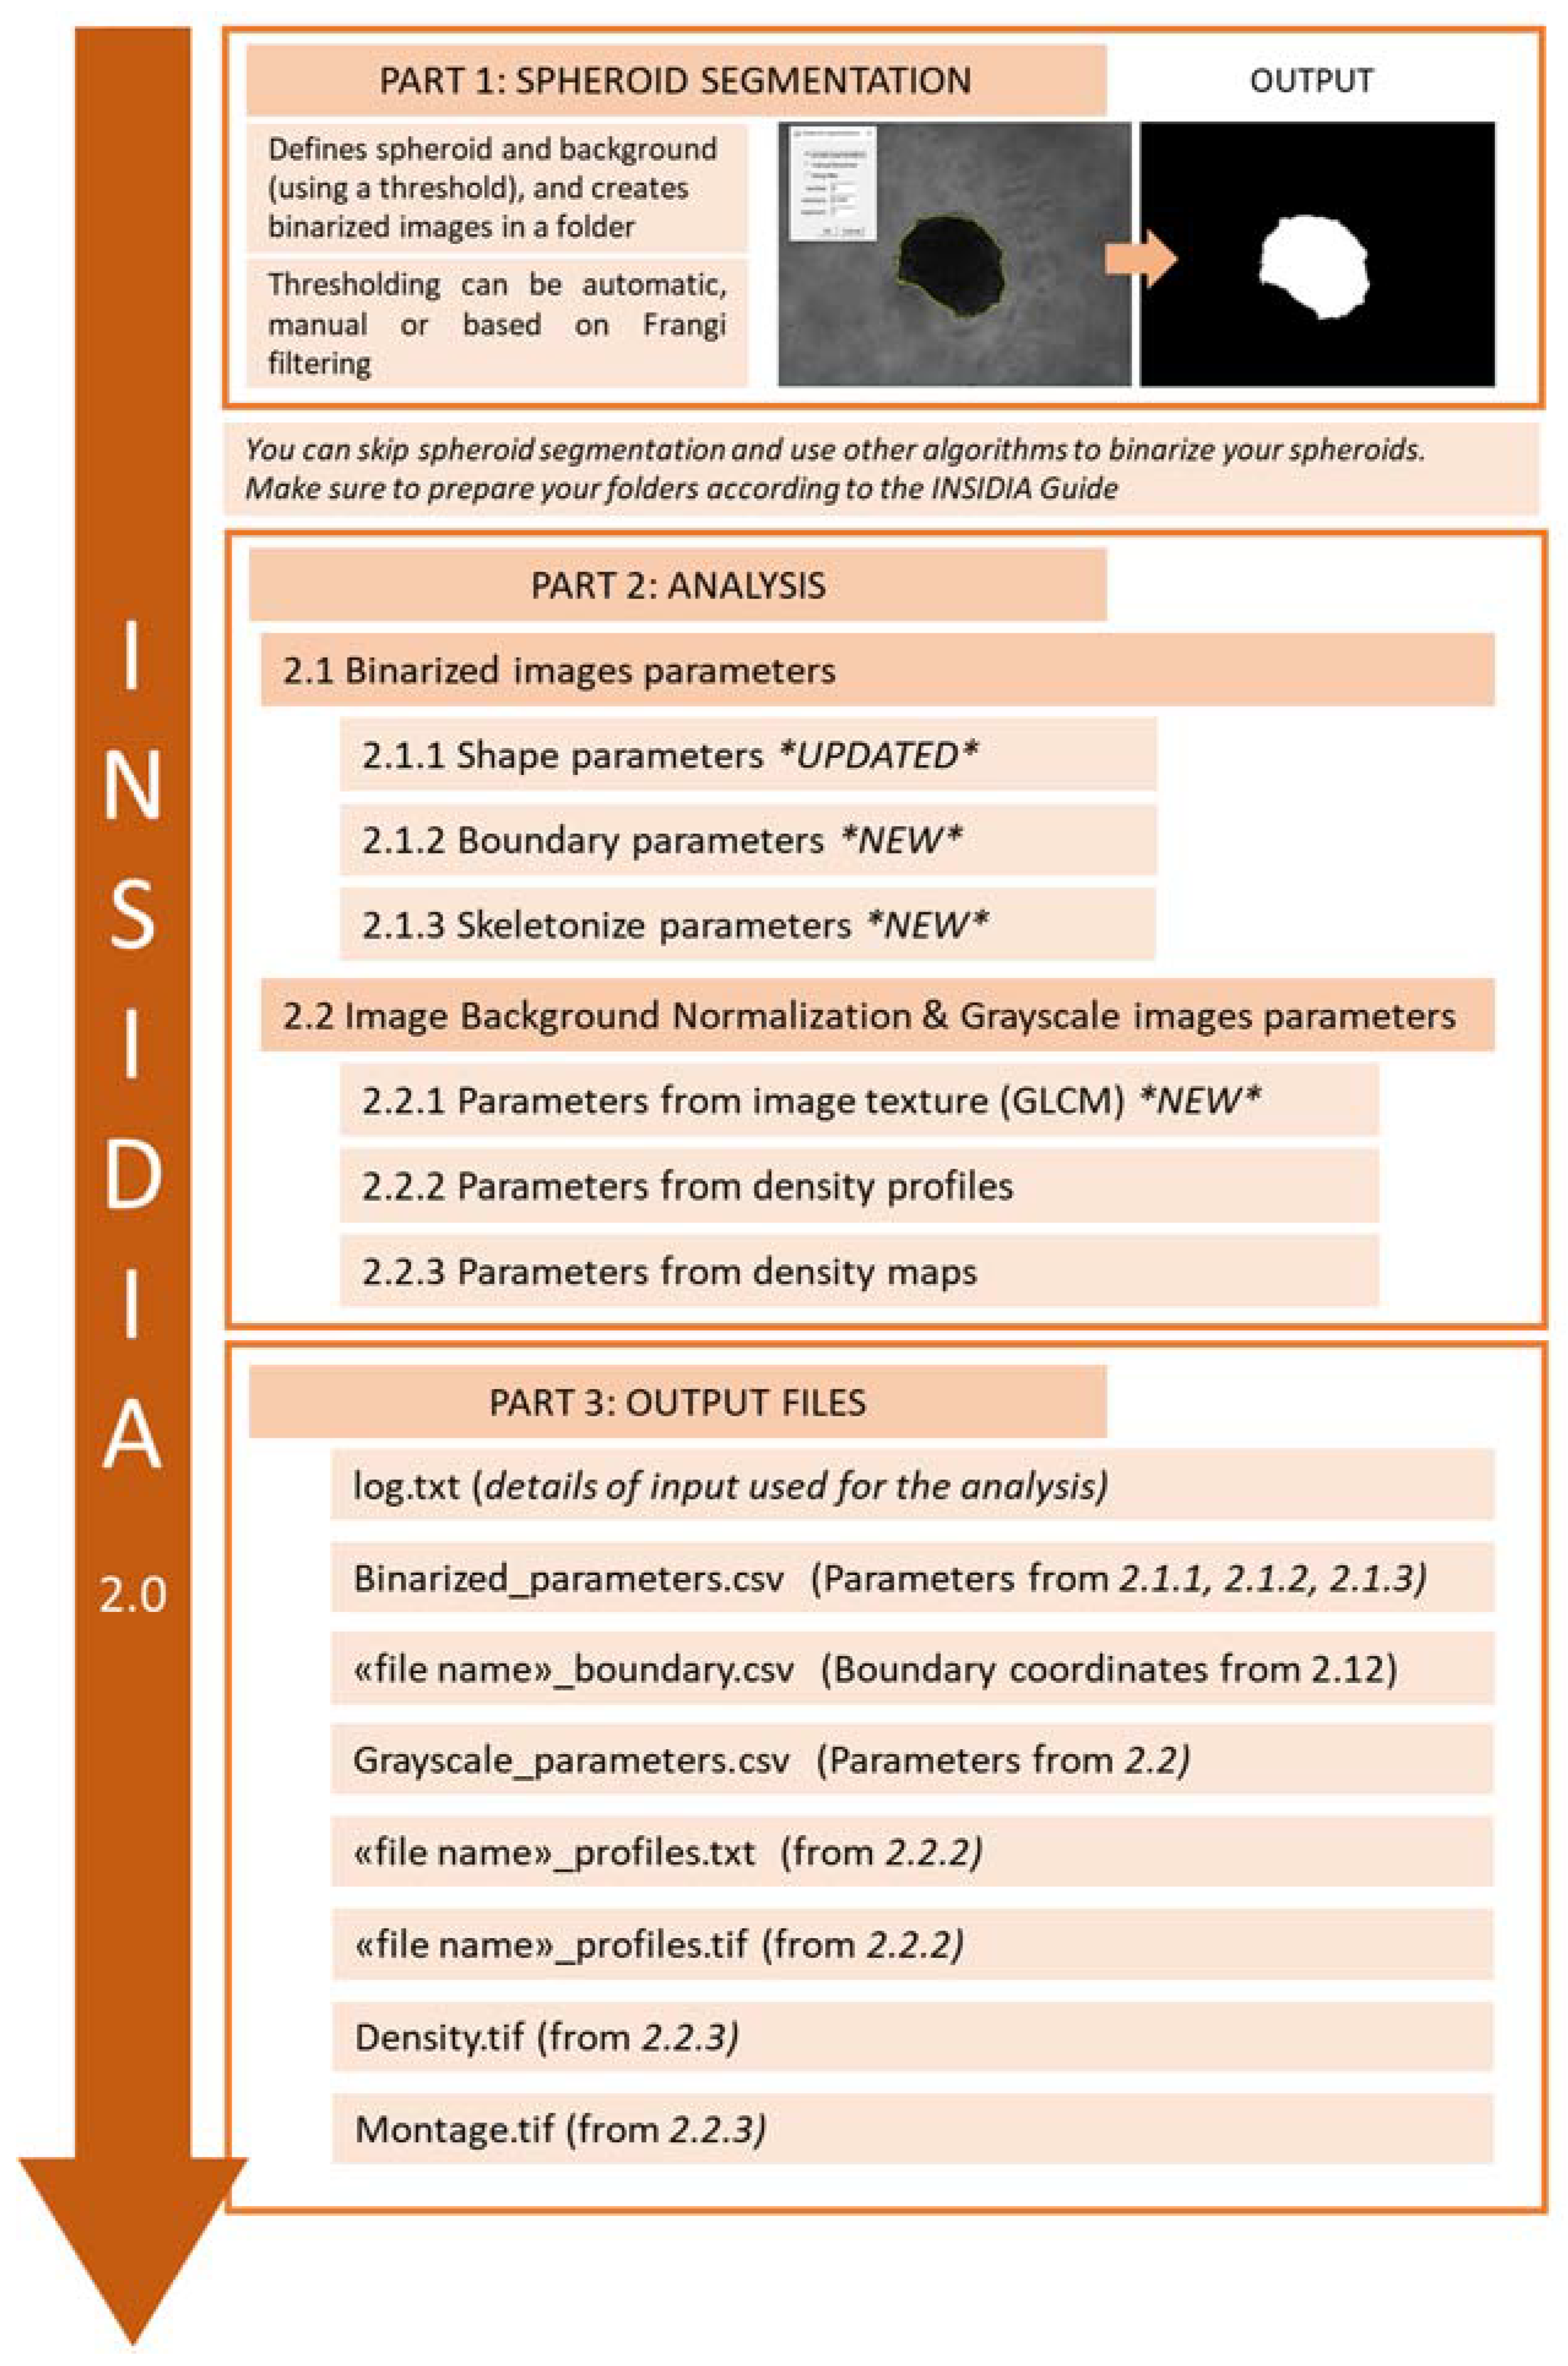
Abstract
:1. Introduction
2. Material and Methods
2.1. Cell Culture
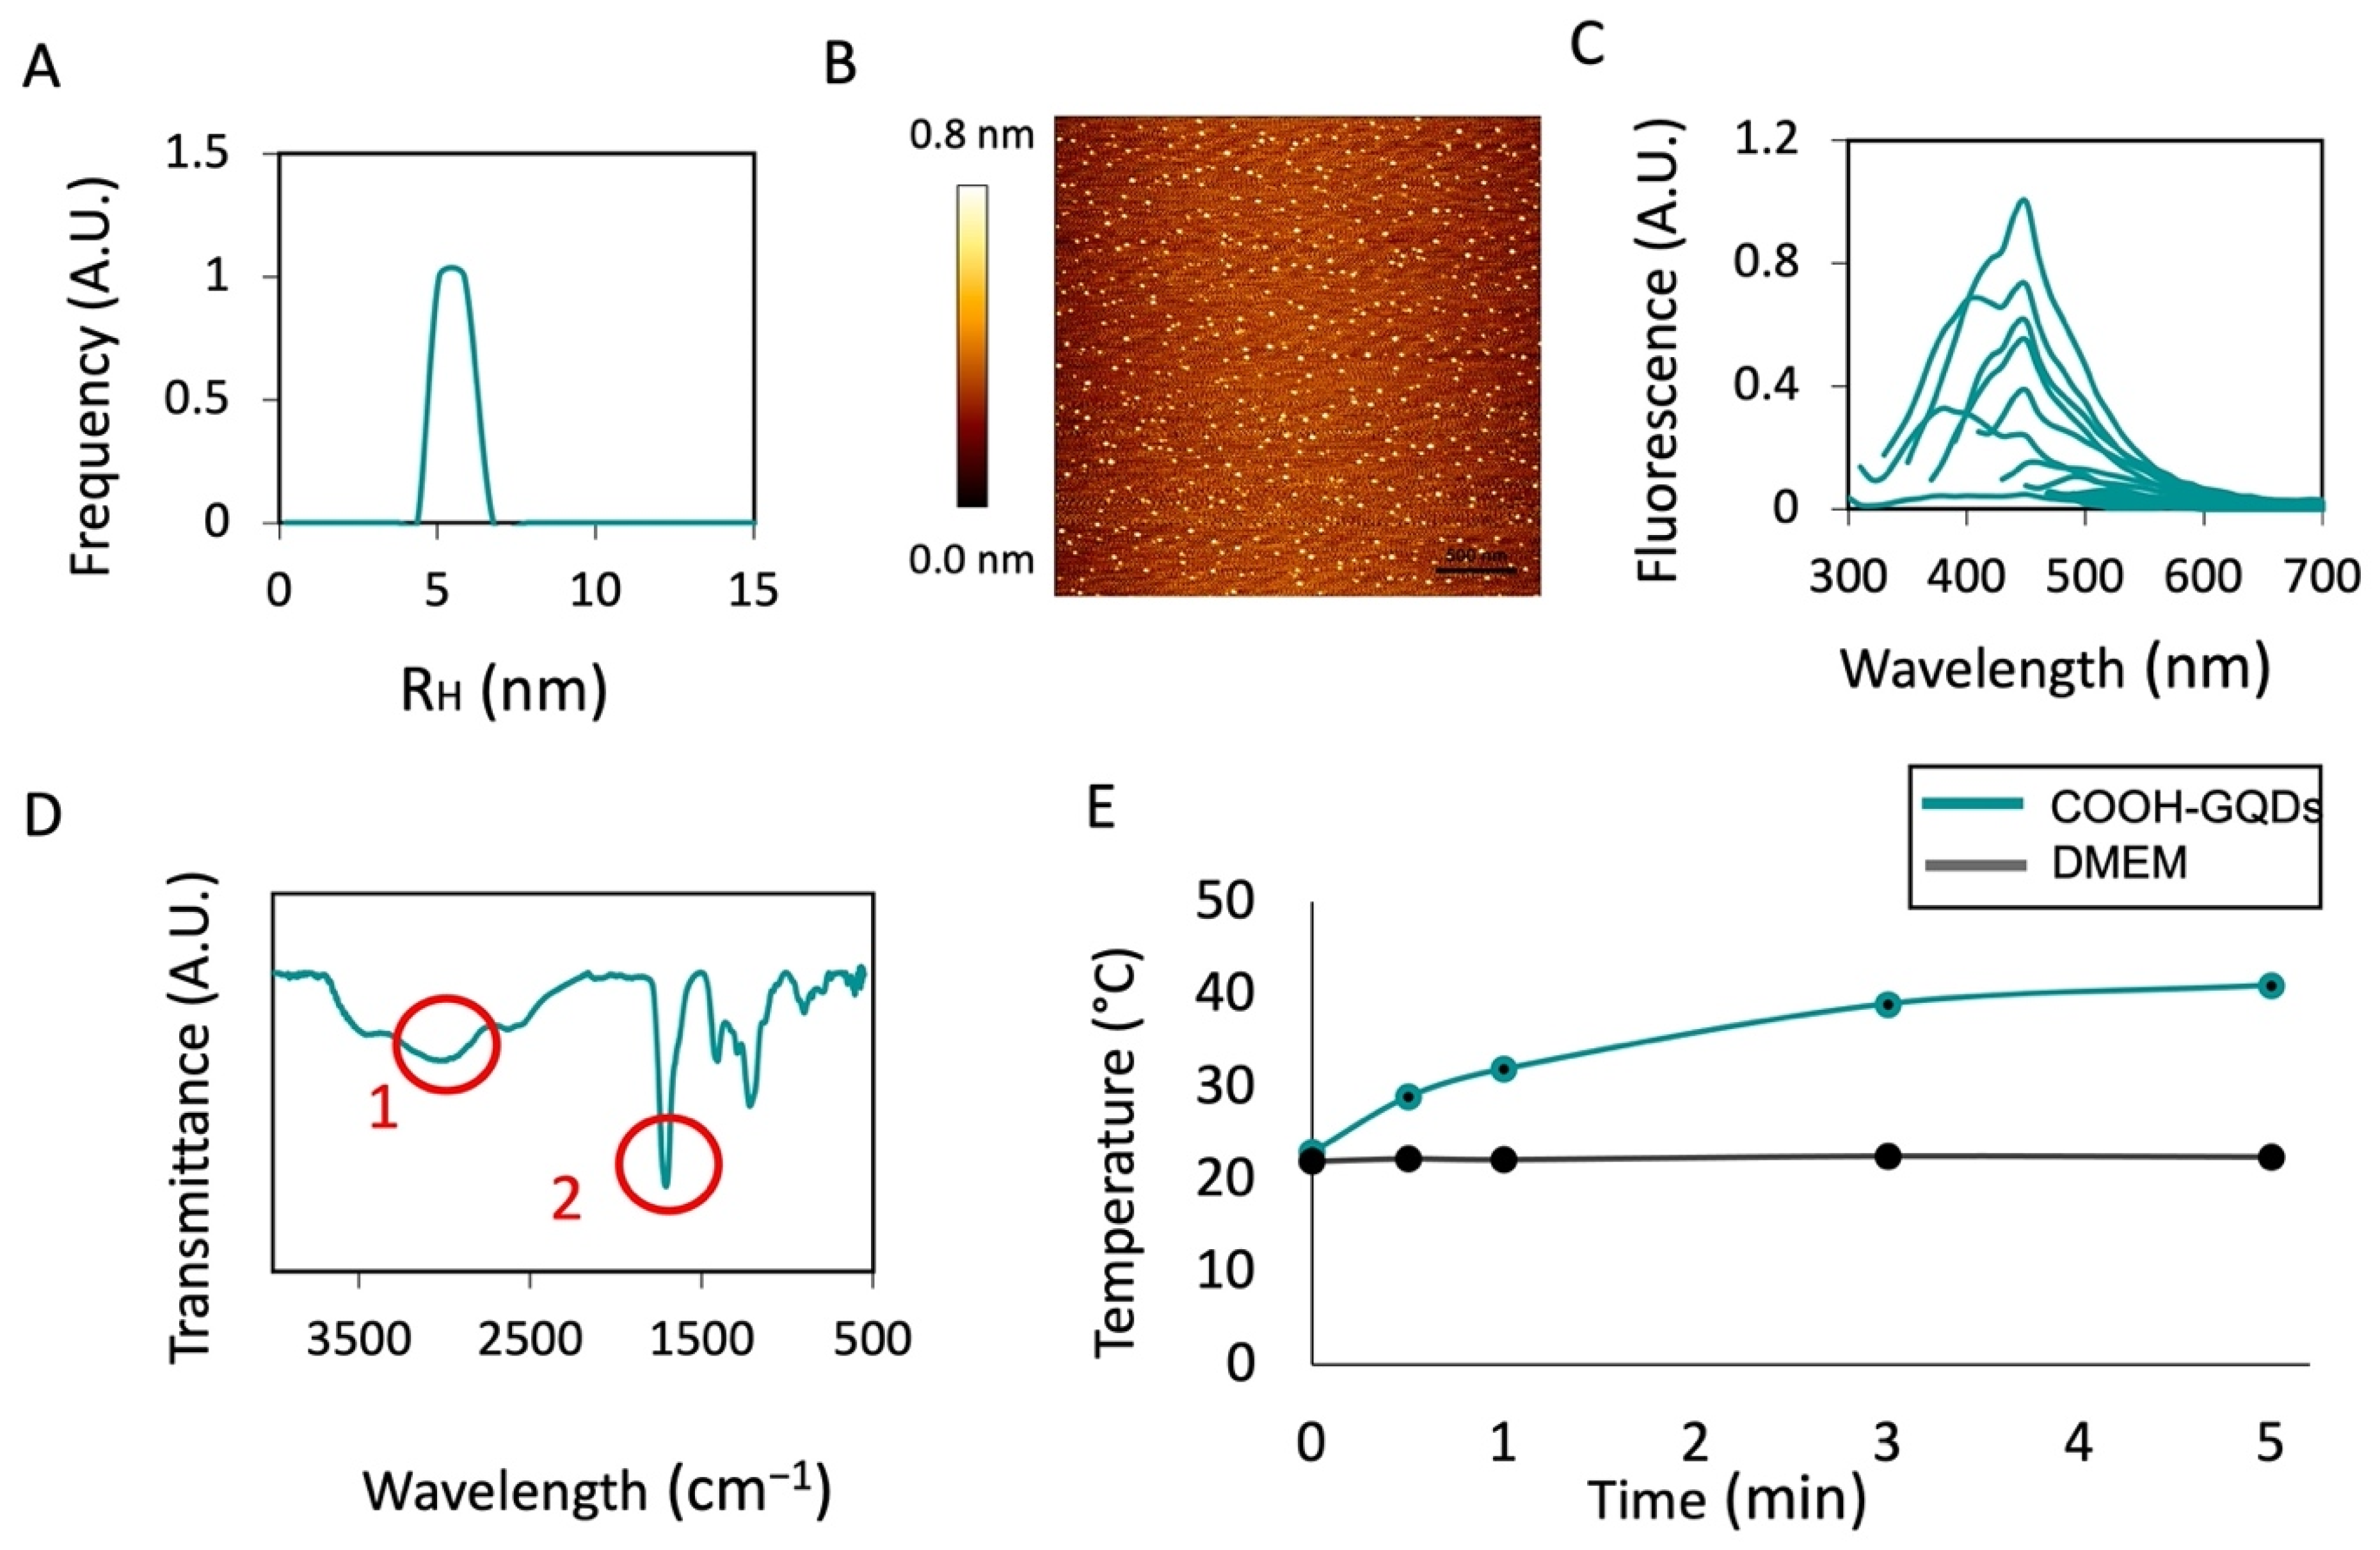
2.2. Characterization of Graphene Quantum Dots
2.3. Spheroid Preparation and Viability Tests
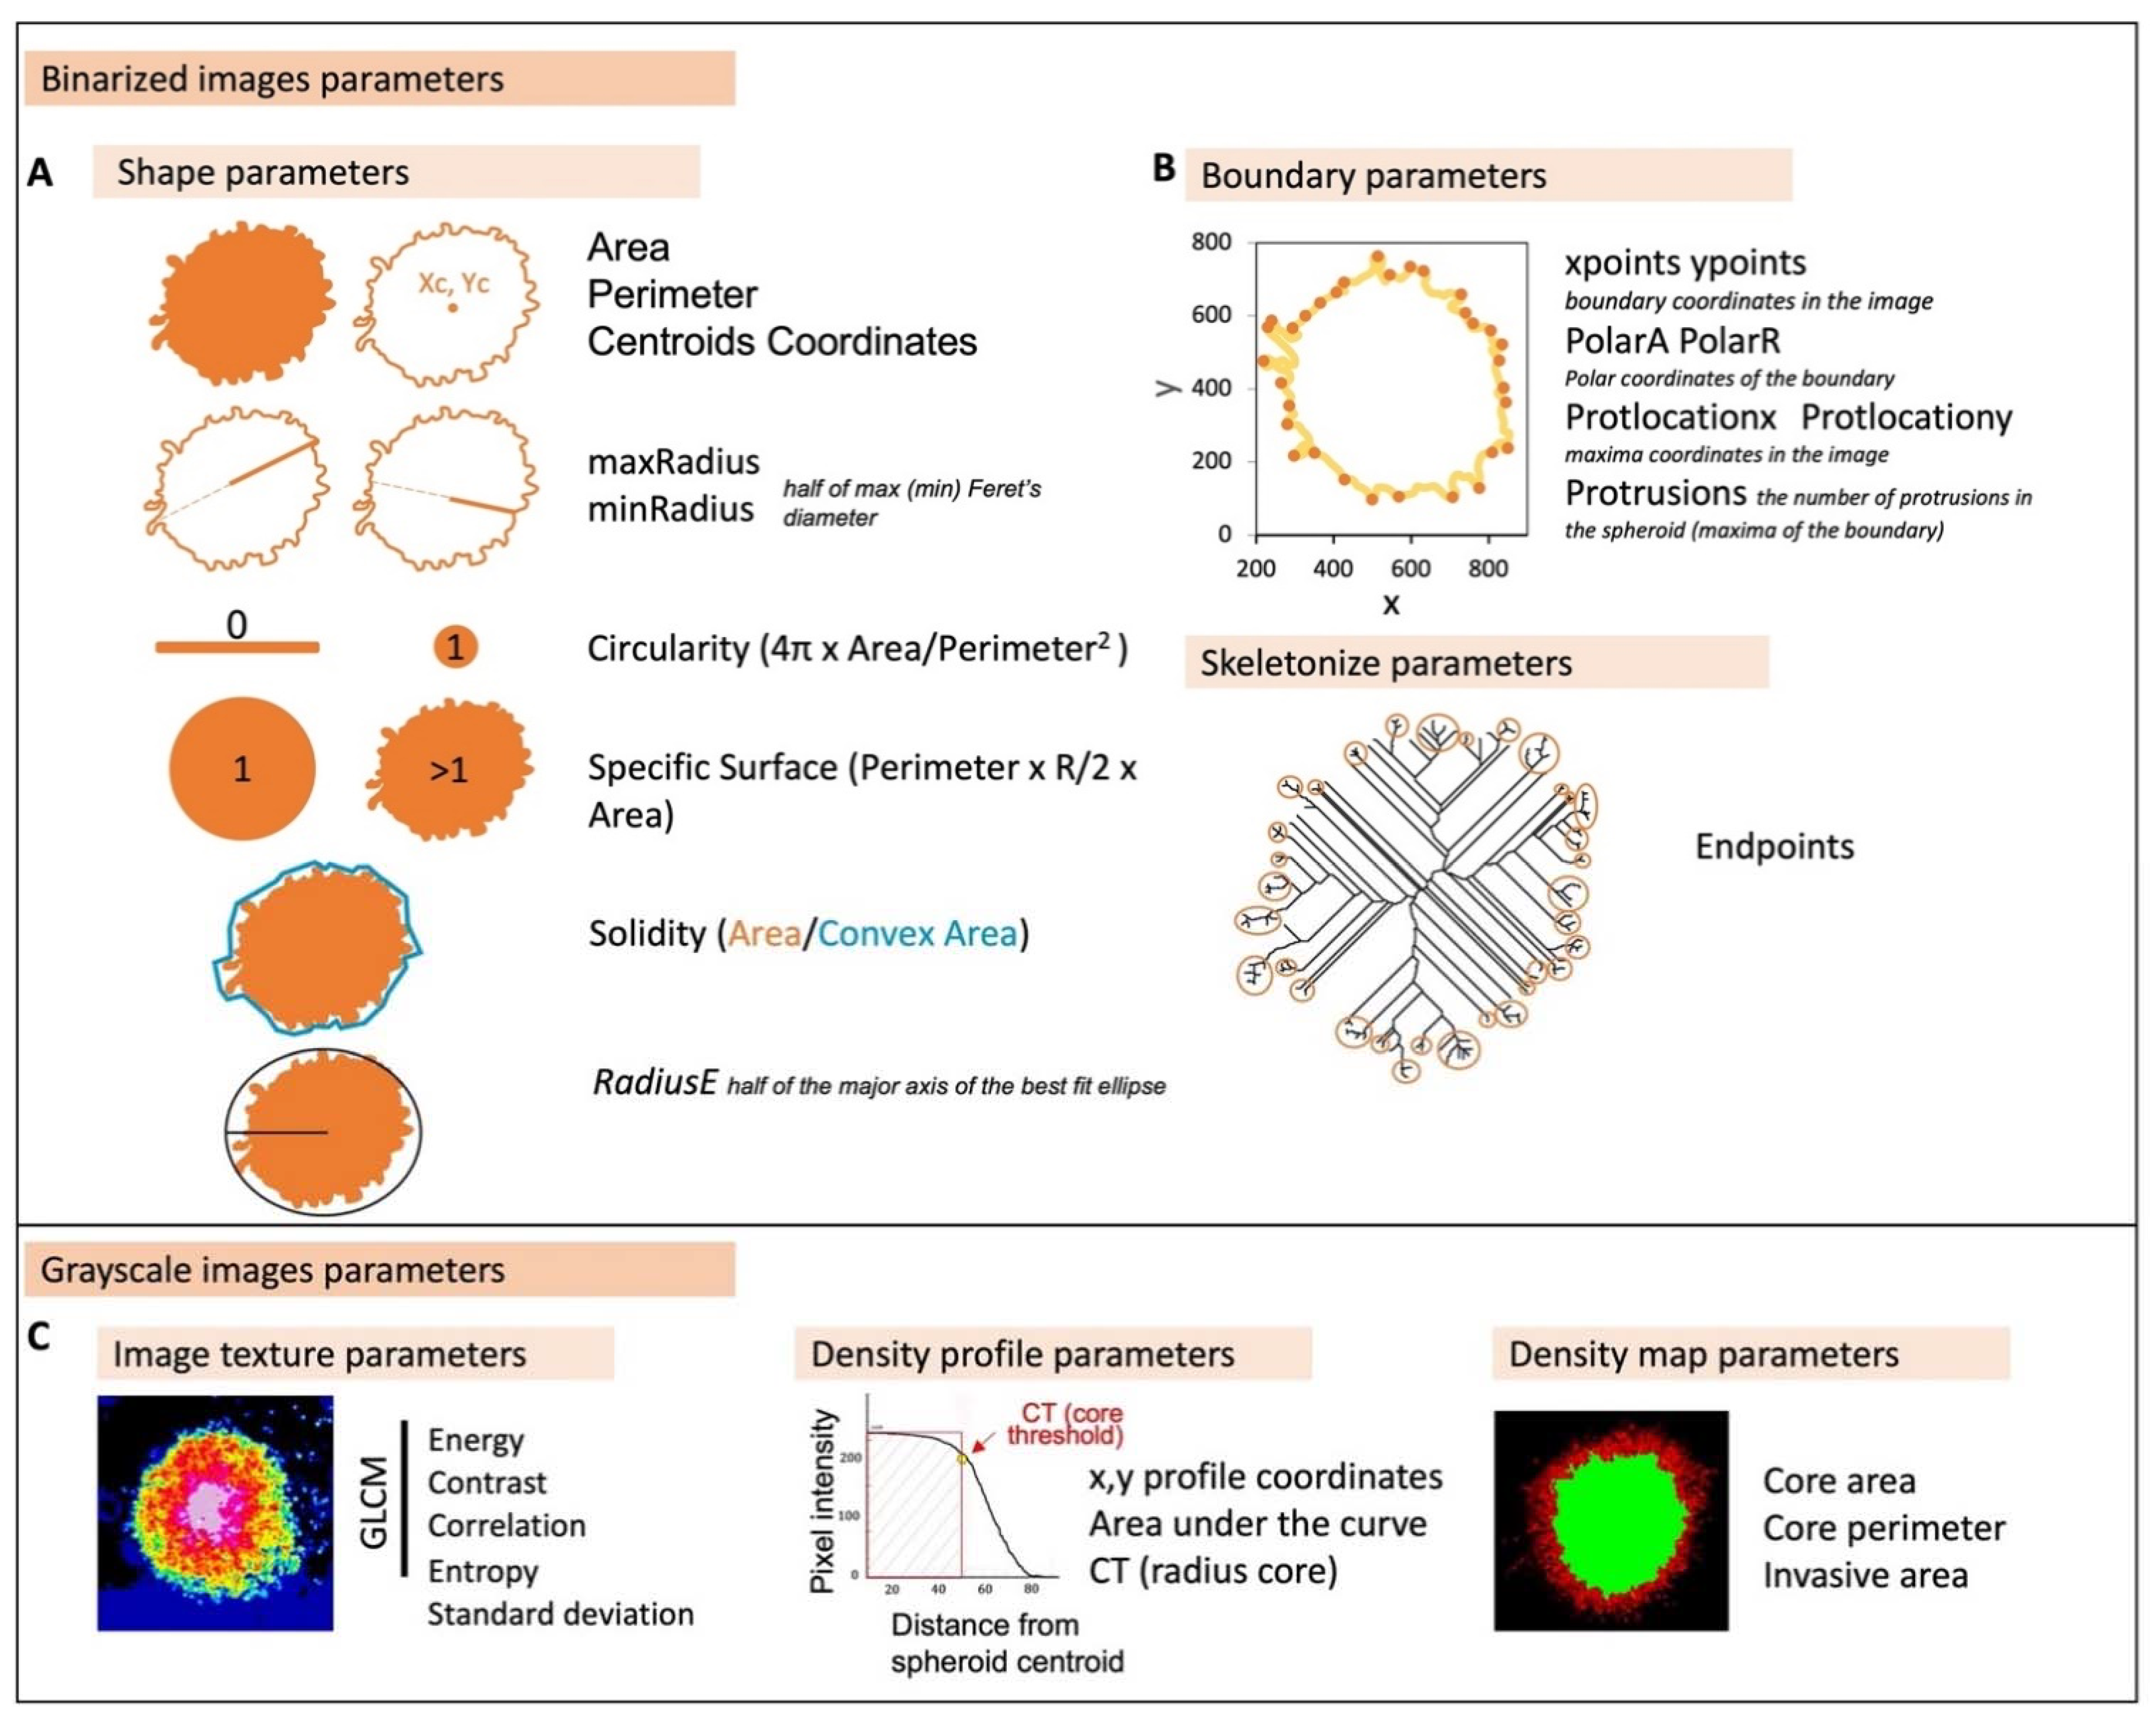
2.4. Image Analysis with INSIDIA 2.0
3. Results and Discussion
3.1. Characterization of GQDs
3.2. INSIDIA 2.0 Analysis of Treatments on U87 Glioblastoma Spheroids
3.3. Analysis of Pancreatic Spheroids: The Texture of Spheroids
4. Conclusions
Supplementary Materials
Author Contributions
Funding
Institutional Review Board Statement
Data Availability Statement
Conflicts of Interest
References
- Yao, Y.; Zhou, Y.; Liu, L.; Xu, Y.; Chen, Q.; Wang, Y.; Wu, S.; Deng, Y.; Zhang, J.; Shao, A. Nanoparticle-based drug delivery in cancer therapy and its role in overcoming drug resistance. Front. Mol. Biosci. 2020, 7, 193. [Google Scholar] [CrossRef] [PubMed]
- Ma, H.L.; Jiang, Q.; Han, S.; Wu, Y.; Tomshine, J.C.; Wang, D.; Gan, Y.; Zou, G.; Liang, X.J. Multicellular tumor spheroids as an in vivo-like tumor model for three-dimensional imaging of chemotherapeutic and nano material cellular penetration. Mol. Imaging 2012, 11, 487–498. [Google Scholar] [CrossRef] [PubMed]
- Fan, Y.; Avci, N.G.; Nguyen, D.T.; Dragomir, A.; Akay, Y.M.; Xu, F.; Akay, M. Engineering a high-throughput 3-D In vitro glioblastoma model. IEEE J. Transl. Eng. Health Med. 2015, 3, 4300108. [Google Scholar] [CrossRef]
- Pickl, M.; Ries, C.H. Comparison of 3D and 2D tumor models reveals enhanced HER2 activation in 3D associated with an increased response to trastuzumab. Oncogene 2009, 28, 461–468. [Google Scholar] [CrossRef] [PubMed] [Green Version]
- Jauković, A.; Abadjieva, D.; Trivanović, D.; Stoyanova, E.; Kostadinova, M.; Pashova, S.; Kestendjieva, S.; Kukolj, T.; Jeseta, M.; Kistanova, E.; et al. Specificity of 3D MSC Spheroids Microenvironment: Impact on MSC Behavior and Properties. Stem Cell Rev. Rep. 2020, 16, 853–875. [Google Scholar] [CrossRef] [PubMed]
- Sant, S.; Johnston, P.A. The production of 3D tumor spheroids for cancer drug discovery. Drug Discov. Today Technol. 2017, 23, 27–36. [Google Scholar] [CrossRef] [PubMed] [Green Version]
- Costa, E.C.; Moreira, A.F.; de Melo-Diogo, D.; Gaspar, V.M.; Carvalho, M.P.; Correia, I.J. 3D tumor spheroids: An overview on the tools and techniques used for their analysis. Biotechnol. Adv. 2016, 34, 1427–1441. [Google Scholar] [CrossRef] [PubMed]
- Boutin, M.E.; Voss, T.C.; Titus, S.A.; Cruz-Gutierrez, K.; Michael, S.; Ferrer, M. A high-throughput imaging and nuclear segmentation analysis protocol for cleared 3D culture models. Sci. Rep. 2018, 8, 11135. [Google Scholar] [CrossRef] [Green Version]
- Lacalle, D.; Castro-Abril, H.A.; Randelovic, T.; Domínguez, C.; Heras, J.; Mata, E.; Mata, G.; Méndez, Y.; Pascual, V.; Ochoa, I. Spheroidj: An open-source set of tools for spheroid segmentation. Comput. Methods Programs Biomed. 2021, 200, 105837. [Google Scholar] [CrossRef] [PubMed]
- Chen, W.; Wong, C.; Vosburgh, E.; Levine, A.J.; Foran, D.J.; Xu, E.Y. High-throughput Image Analysis of Tumor Spheroids: A User-friendly Software Application to Measure the Size of Spheroids Automatically and Accurately. J. Vis. Exp. 2014, 8, 51639. [Google Scholar] [CrossRef] [Green Version]
- Piccinini, F. AnaSP: A software suite for automatic image analysis of multicellular spheroids. Comput. Methods Programs Biomed. 2015, 119, 43–52. [Google Scholar] [CrossRef]
- Hou, Y.; Konen, J.; Brat, D.J.; Marcus, A.I.; Cooper, L.A.D. TASI: A software tool for spatial-temporal quantification of tumor spheroid dynamics. Sci. Rep. 2018, 8, 7248. [Google Scholar] [CrossRef] [PubMed]
- Yim, M.; Shaw, D. Achieving greater efficiency and higher confidence in single-cell cloning by combining cell printing and plate imaging technologies. Biotechnol. Prog. 2018, 34, 1454–1459. [Google Scholar] [CrossRef] [PubMed]
- He, Y.; Xiong, L.; Gao, X.; Hai, M.; Liu, Y.; Wang, G.; Chen, G.; Shuai, J.; Jiao, Y.; Zhang, X. Morphological quantification of proliferation-to-invasion transition in tumor spheroids. Biochim. Biophys. Acta (BBA)-Gen. Subj. 2020, 1864, 129460. [Google Scholar] [CrossRef] [PubMed]
- Perini, G.; Palmieri, V.; Ciasca, G.; D’Ascenzo, M.; Primiano, A.; Gervasoni, J.; De Maio, F.; De Spirito, M.; Papi, M. Enhanced Chemotherapy for Glioblastoma Multiforme Mediated by Functionalized Graphene Quantum Dots. Materials 2020, 13, 4139. [Google Scholar] [CrossRef] [PubMed]
- Perini, G.; Giulimondi, F.; Palmieri, V.; Augello, A.; Digiacomo, L.; Quagliarini, E.; Pozzi, D.; Papi, M.; Caracciolo, G. Inhibiting the Growth of 3D Brain Cancer Models with Bio-Coronated Liposomal Temozolomide. Pharmaceutics 2021, 13, 378. [Google Scholar] [CrossRef] [PubMed]
- Perini, G.; Palmieri, V.; Ciasca, G.; D’Ascenzo, M.; Gervasoni, J.; Primiano, A.; Rinaldi, M.; Fioretti, D.; Prampolini, C.; Tiberio, F. Graphene Quantum Dots’ Surface Chemistry Modulates the Sensitivity of Glioblastoma Cells to Chemotherapeutics. Int. J. Mol. Sci. 2020, 21, 6301. [Google Scholar] [CrossRef] [PubMed]
- Perini, G.; Palmieri, V.; Ciasca, G.; De Spirito, M.; Papi, M.; Cattolica, U.; Correspondence, V.P. Unravelling the Potential of Graphene Quantum Dots in Biomedicine and Neuroscience. Int. J. Mol. Sci. 2020, 21, 3712. [Google Scholar] [CrossRef]
- Moriconi, C.; Palmieri, V.; Di Santo, R.; Tornillo, G.; Papi, M.; Pilkington, G.; De Spirito, M.; Gumbleton, M. INSIDIA: A FIJI Macro Delivering High-Throughput and High-Content Spheroid Invasion Analysis. Biotechnol. J. 2017, 12, 1700268. [Google Scholar] [CrossRef]
- Huang, C.-L.; Lian, M.-J.; Wu, Y.-H.; Chen, W.-M.; Chiu, W.-T. Identification of Human Ovarian Adenocarcinoma Cells with Cisplatin-Resistance by Feature Extraction of Gray Level Co-Occurrence Matrix Using Optical Images. Diagnostics 2020, 10, 389. [Google Scholar] [CrossRef]
- Perini, G.; Palmieri, V.; Ciasca, G.; Primiano, A.; Gervasoni, J.; De Spirito, M.; Papi, M. Functionalized Graphene Quantum Dots Modulate Malignancy of Glioblastoma Multiforme by Downregulating Neurospheres Formation. J. Carbon Res. 2021, 7, 4. [Google Scholar] [CrossRef]
- Perini, G.; Ciasca, G.; Minelli, E.; Papi, M.; Palmieri, V.; Maulucci, G.; Nardini, M.; Latina, V.; Corsetti, V.; Florenzano, F.; et al. Dynamic structural determinants underlie the neurotoxicity of the N-terminal tau 26–44 peptide in Alzheimer’s disease and other human tauopathies. Int. J. Biol. Macromol. 2019, 141, 278–289. [Google Scholar] [CrossRef]
- Palmieri, V.; Niccolini, B.; Perini, G.; Augello, A.; De Maio, F.; Gervasoni, J.; Primiano, A.; Delogu, G.; De Spirito, M.; Papi, M. In situ N-acetylcysteine release from polyvinyl alcohol film for moisture-activated food packaging. Food Packag. Shelf Life 2021, 29, 100694. [Google Scholar] [CrossRef]
- Liu, H.; Li, C.; Qian, Y.; Hu, L.; Fang, J.; Tong, W.; Nie, R.; Chen, Q.; Wang, H. Magnetic-induced graphene quantum dots for imaging-guided photothermal therapy in the second near-infrared window. Biomaterials 2020, 232, 119700. [Google Scholar] [CrossRef]
- Pieragostino, D.; D’Alessandro, M.; di Ioia, M.; Di Ilio, C.; Sacchetta, P.; Del Boccio, P. Unraveling the molecular repertoire of tears as a source of biomarkers: Beyond ocular diseases. Proteom.–Clin. Appl. 2015, 9, 169–186. [Google Scholar] [CrossRef]
- Palmieri, V.; Perini, G.; De Spirito, M.; Papi, M. Graphene oxide touches blood: In vivo interactions of bio-coronated 2D materials. Nanoscale Horiz. 2019, 4, 464–471. [Google Scholar] [CrossRef]
- Wang, H.; Mu, Q.; Wang, K.; Revia, R.A.; Yen, C.; Gu, X.; Tian, B.; Liu, J.; Zhang, M. Nitrogen and boron dual-doped graphene quantum dots for near-infrared second window imaging and photothermal therapy. Appl. Mater. Today 2019, 14, 108–117. [Google Scholar] [CrossRef]
- Nurunnabi, M.; Khatun, Z.; Reeck, G.R.; Lee, D.Y.; Lee, Y.K. Photoluminescent graphene nanoparticles for cancer phototherapy and imaging. ACS Appl. Mater. Interfaces 2014, 6, 12413–12421. [Google Scholar] [CrossRef]
- Hladnik, A.; Krumpak, G.; Debeljak, M.; Svetec, D.G. Assessment of paper surface topography and print mottling by texture analysis. In Proceedings of the ImageJ User & Developer Conference, Luxembourg, 27–29 October 2010. [Google Scholar]
- Norouzi, M.; Yathindranath, V.; Thliveris, J.A.; Kopec, B.M.; Siahaan, T.J.; Miller, D.W. Doxorubicin-loaded iron oxide nanoparticles for glioblastoma therapy: A combinational approach for enhanced delivery of nanoparticles. Sci. Rep. 2020, 10, 11292. [Google Scholar] [CrossRef]
- Zhao, M.; van Straten, D.; Broekman, M.L.D.; Préat, V.; Schiffelers, R.M. Nanocarrier-based drug combination therapy for glioblastoma. Theranostics 2020, 10, 1355. [Google Scholar] [CrossRef]
- Wang, W.-B.; Yang, Y.; Zhao, Y.-P.; Zhang, T.-P.; Liao, Q.; Shu, H. Recent studies of 5-fluorouracil resistance in pancreatic cancer. World J. Gastroenterol. 2014, 20, 15682. [Google Scholar] [CrossRef]


Publisher’s Note: MDPI stays neutral with regard to jurisdictional claims in published maps and institutional affiliations. |
© 2022 by the authors. Licensee MDPI, Basel, Switzerland. This article is an open access article distributed under the terms and conditions of the Creative Commons Attribution (CC BY) license (https://creativecommons.org/licenses/by/4.0/).
Share and Cite
Perini, G.; Rosa, E.; Friggeri, G.; Di Pietro, L.; Barba, M.; Parolini, O.; Ciasca, G.; Moriconi, C.; Papi, M.; De Spirito, M.; et al. INSIDIA 2.0 High-Throughput Analysis of 3D Cancer Models: Multiparametric Quantification of Graphene Quantum Dots Photothermal Therapy for Glioblastoma and Pancreatic Cancer. Int. J. Mol. Sci. 2022, 23, 3217. https://doi.org/10.3390/ijms23063217
Perini G, Rosa E, Friggeri G, Di Pietro L, Barba M, Parolini O, Ciasca G, Moriconi C, Papi M, De Spirito M, et al. INSIDIA 2.0 High-Throughput Analysis of 3D Cancer Models: Multiparametric Quantification of Graphene Quantum Dots Photothermal Therapy for Glioblastoma and Pancreatic Cancer. International Journal of Molecular Sciences. 2022; 23(6):3217. https://doi.org/10.3390/ijms23063217
Chicago/Turabian StylePerini, Giordano, Enrico Rosa, Ginevra Friggeri, Lorena Di Pietro, Marta Barba, Ornella Parolini, Gabriele Ciasca, Chiara Moriconi, Massimiliano Papi, Marco De Spirito, and et al. 2022. "INSIDIA 2.0 High-Throughput Analysis of 3D Cancer Models: Multiparametric Quantification of Graphene Quantum Dots Photothermal Therapy for Glioblastoma and Pancreatic Cancer" International Journal of Molecular Sciences 23, no. 6: 3217. https://doi.org/10.3390/ijms23063217