
A Transcriptomic Approach to Understanding the Combined Impacts of Supra-Optimal Temperatures and CO2 Revealed Different Responses in the Polyploid Coffea arabica and Its Diploid Progenitor C. canephora

 ,
,  ,
,  , ,
, ,  and
and 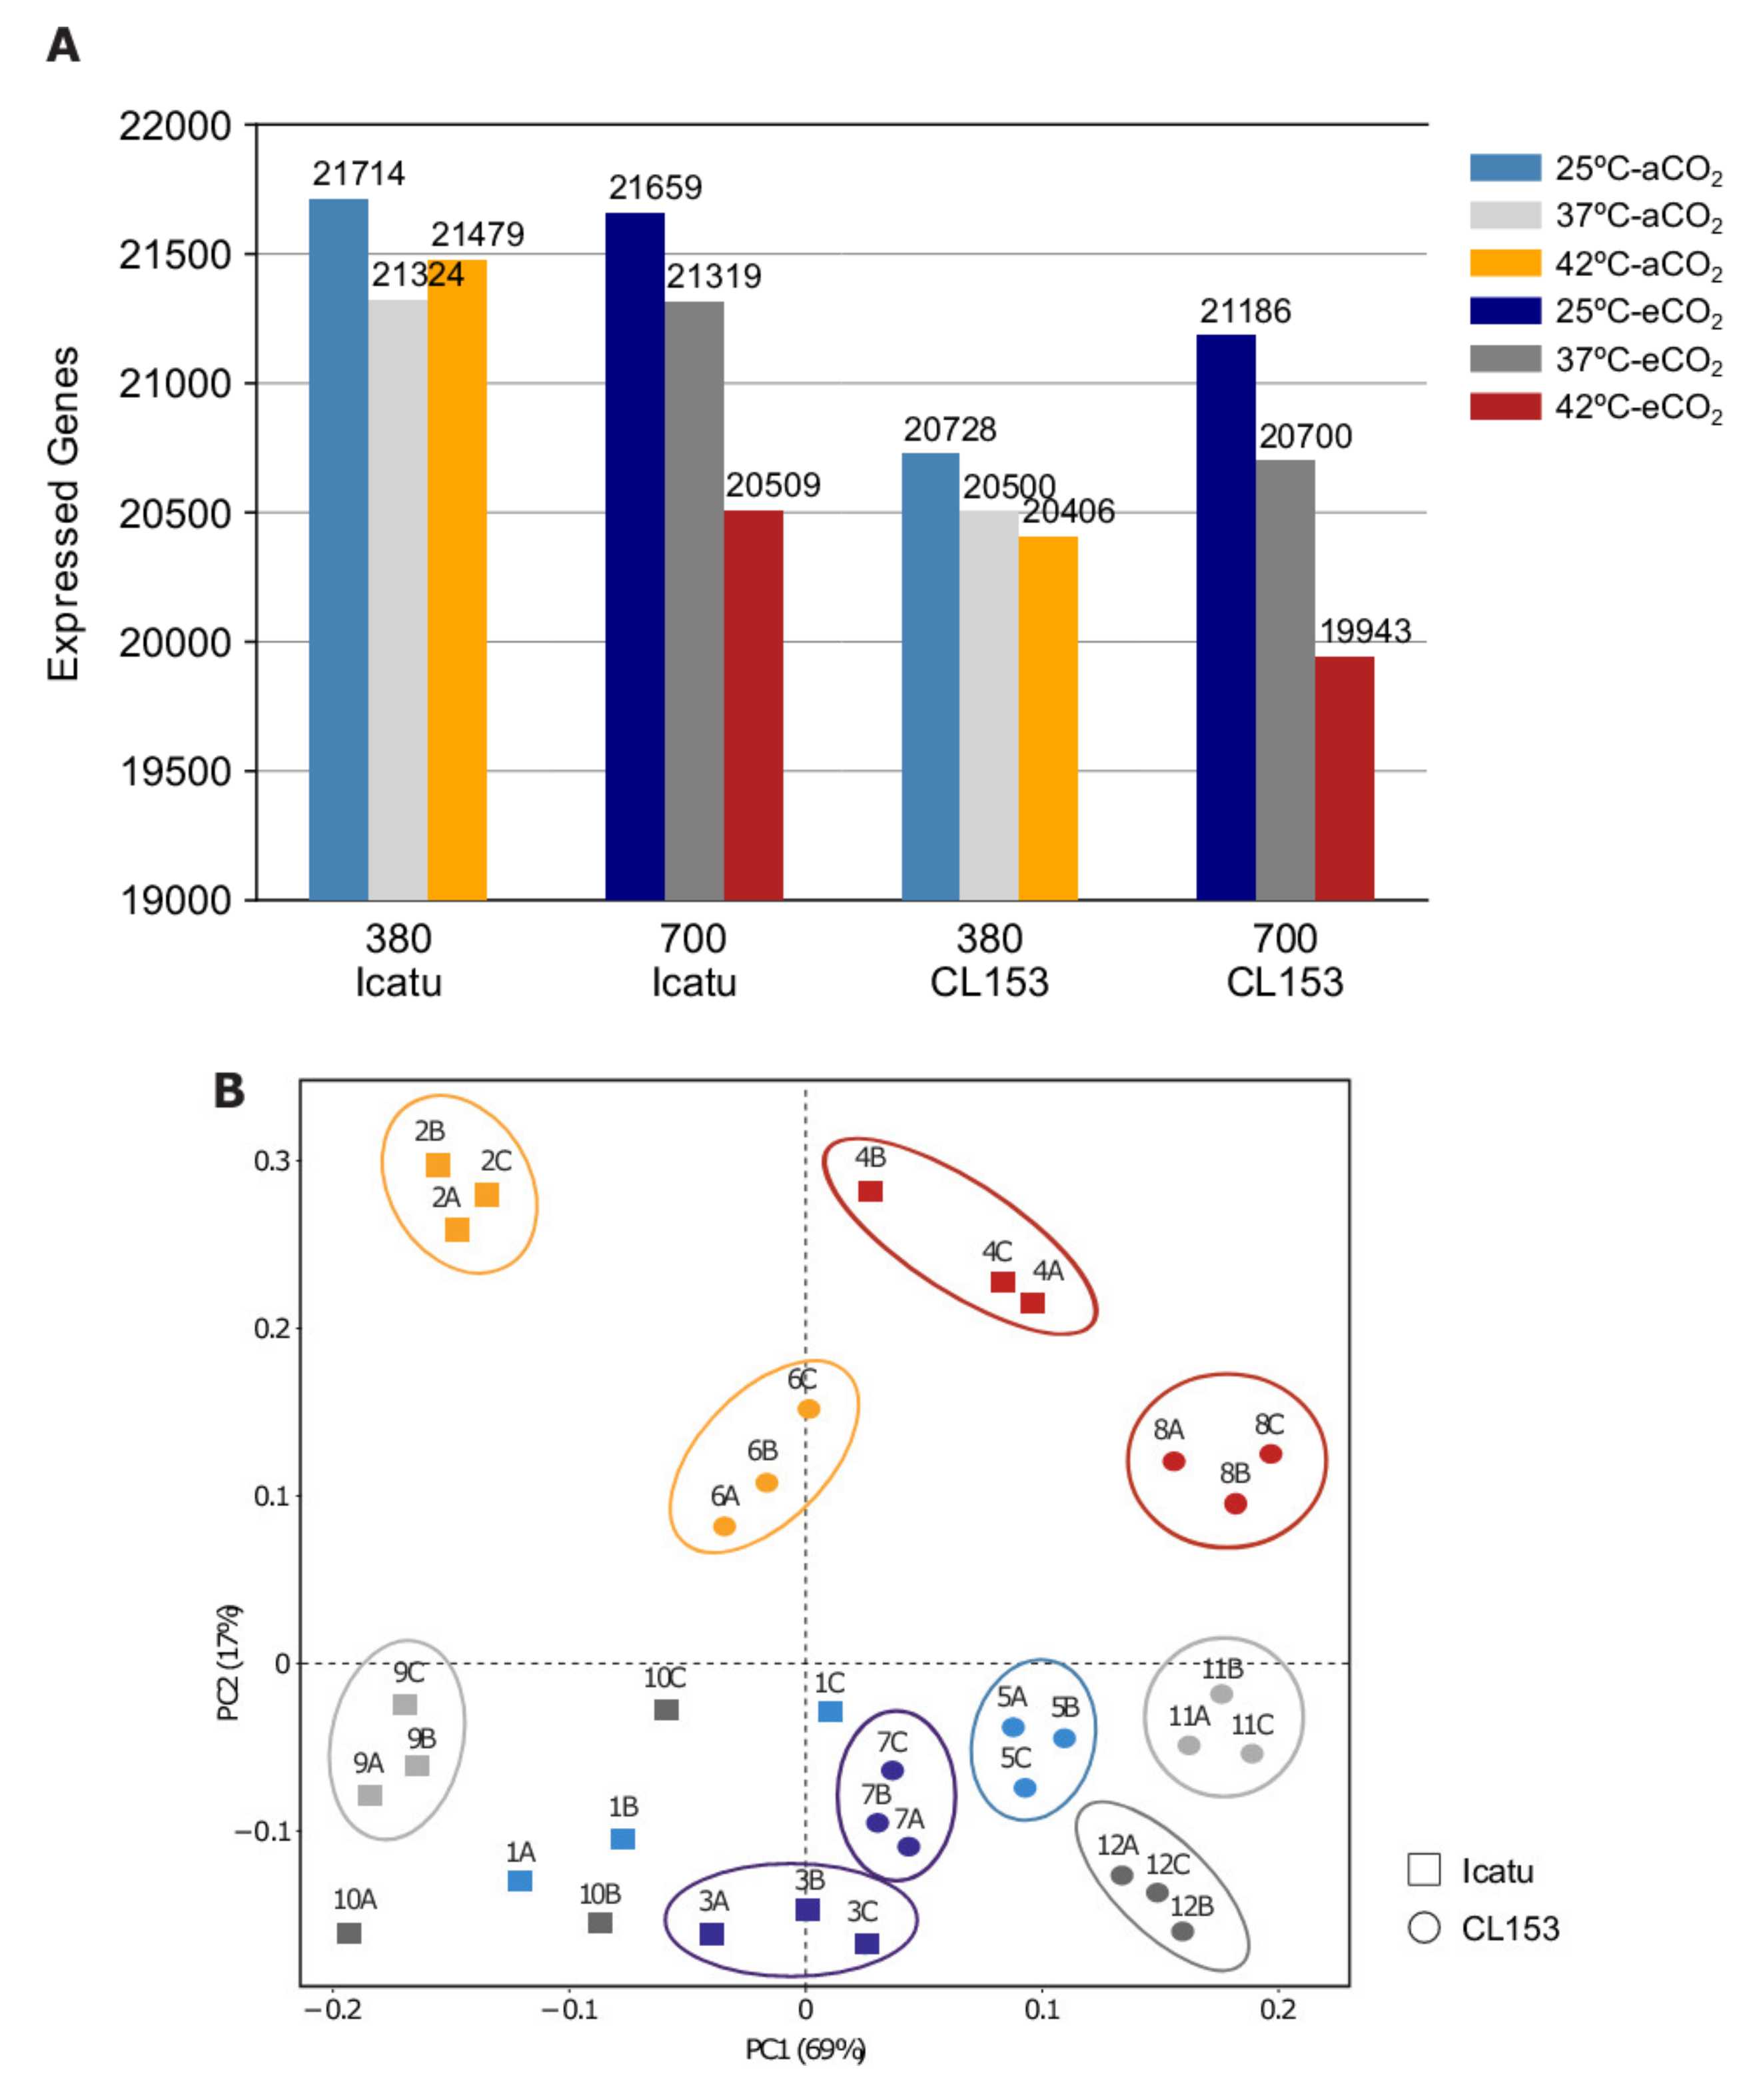
Abstract
:1. Introduction
2. Results
2.1. Overall Transcriptome Profiling and Mapping Statistics
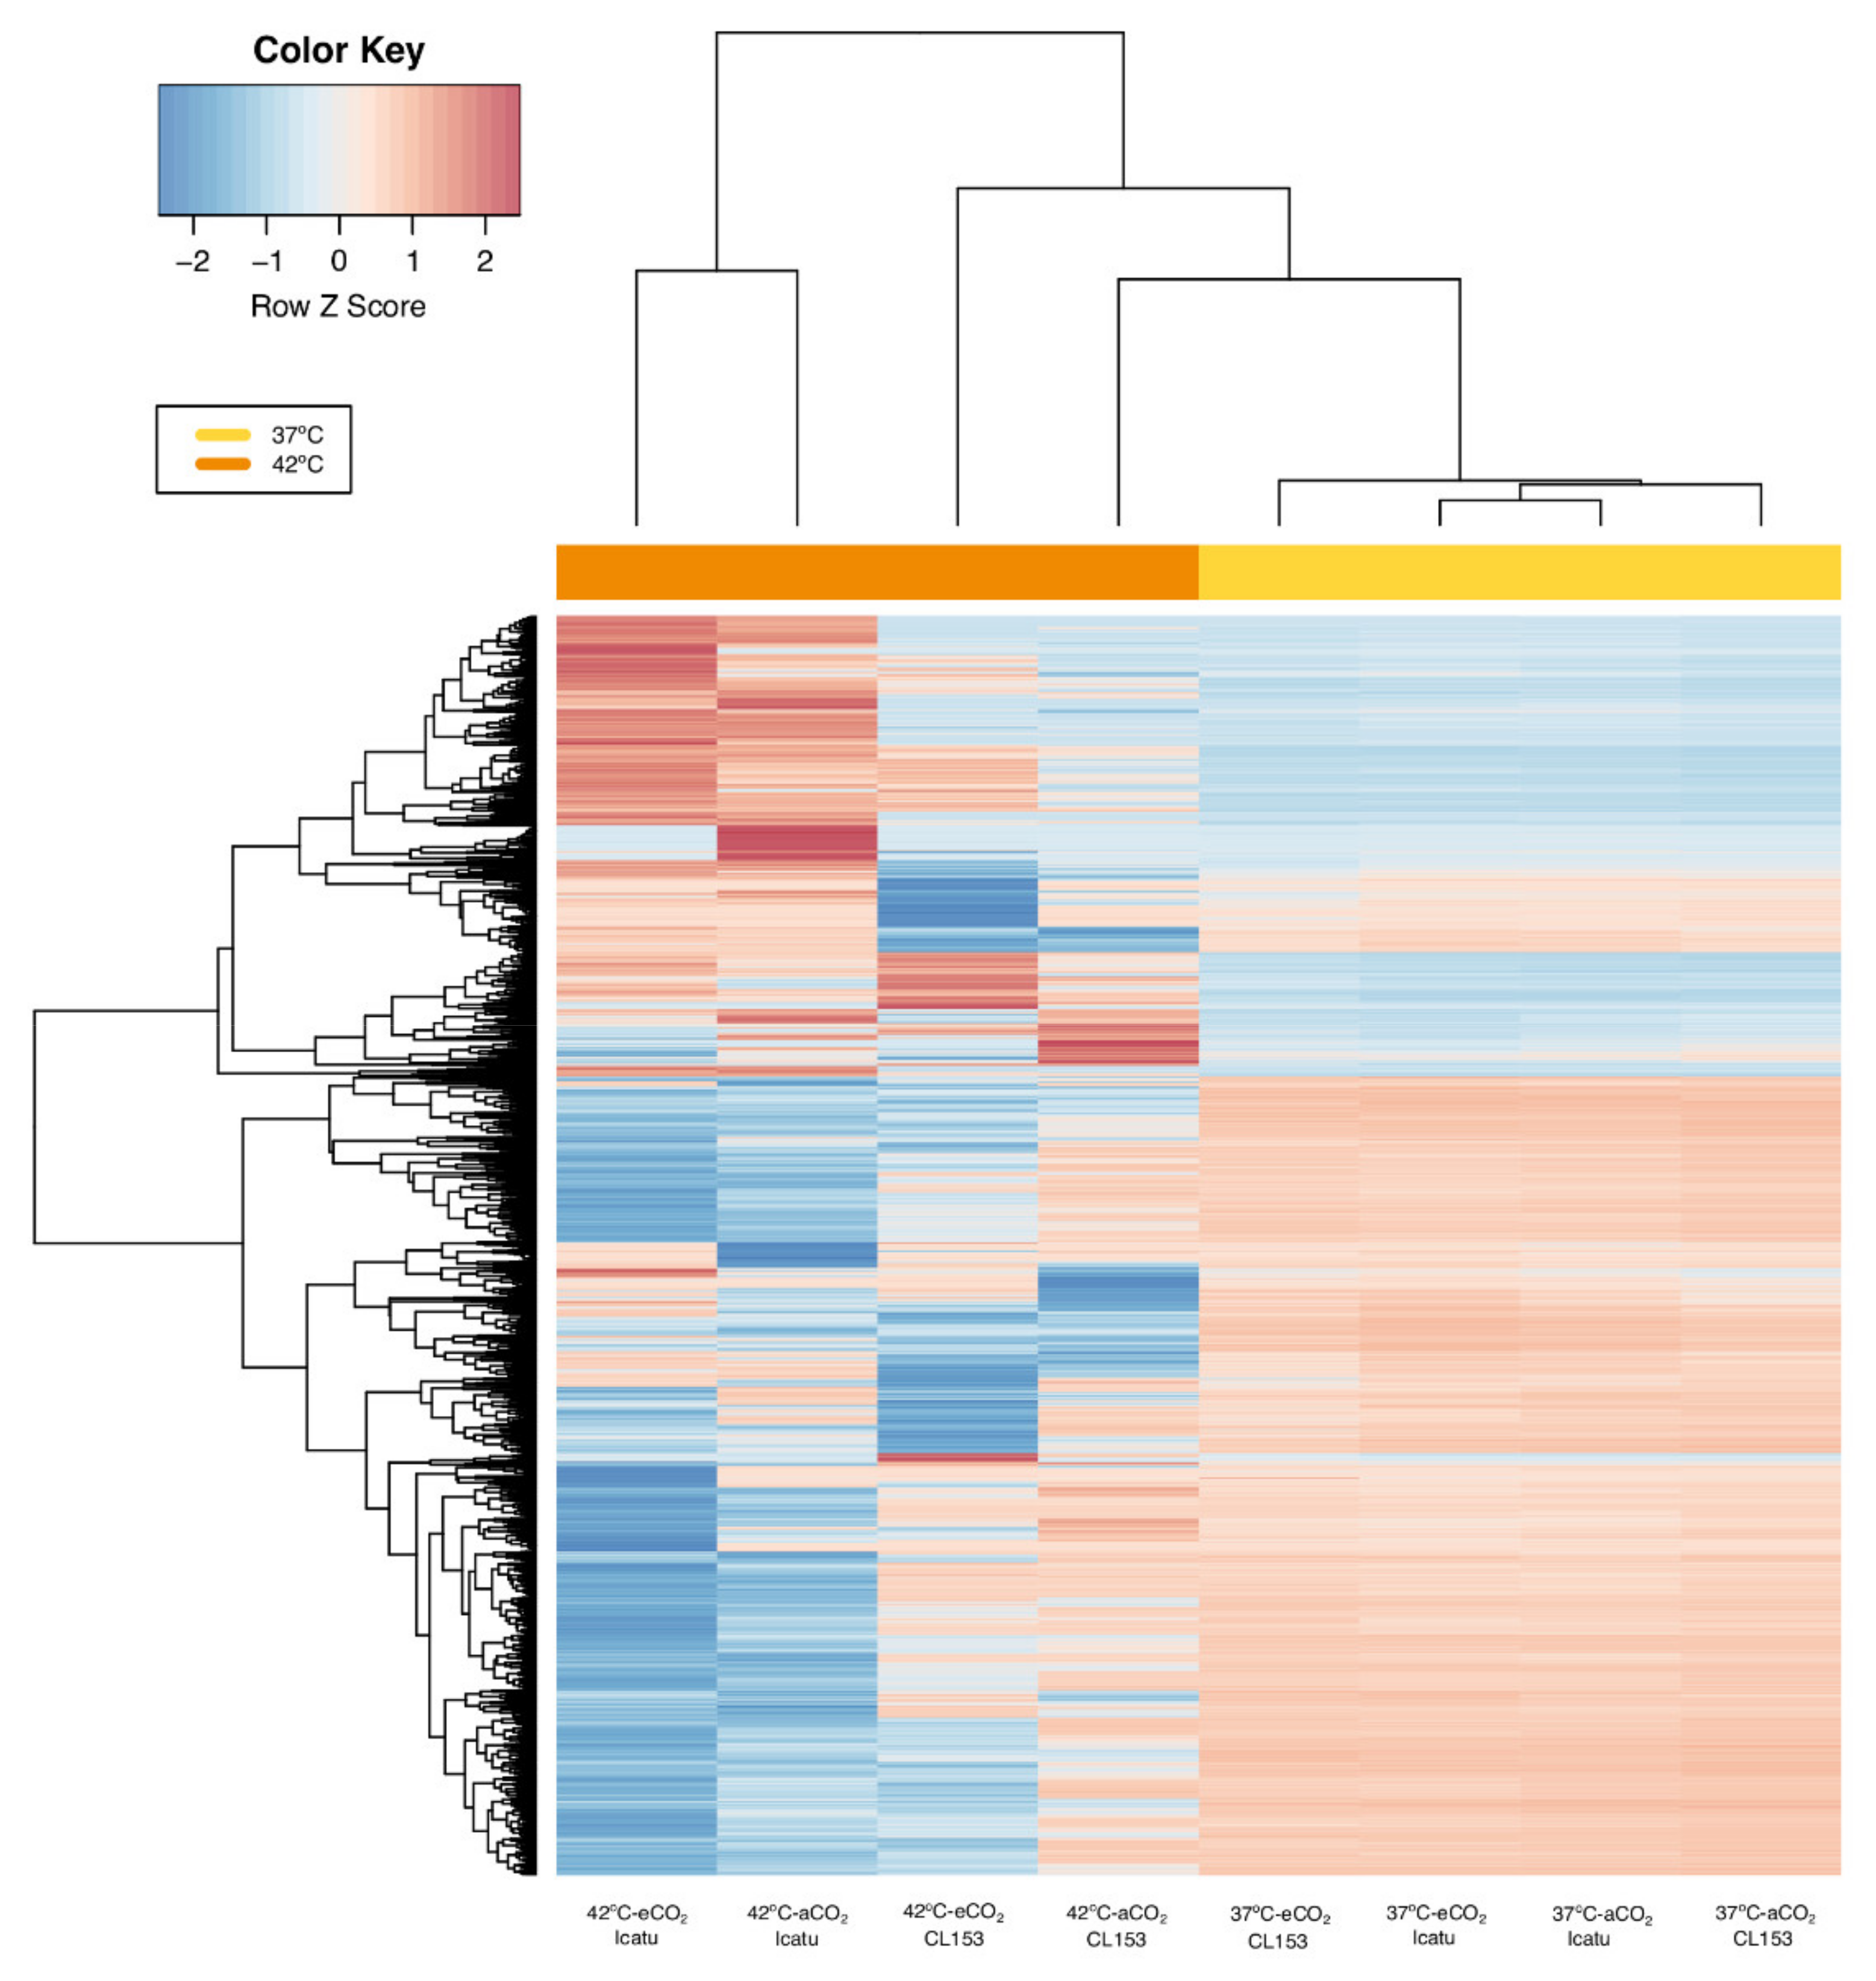
2.2. General Patterns of Gene Expression
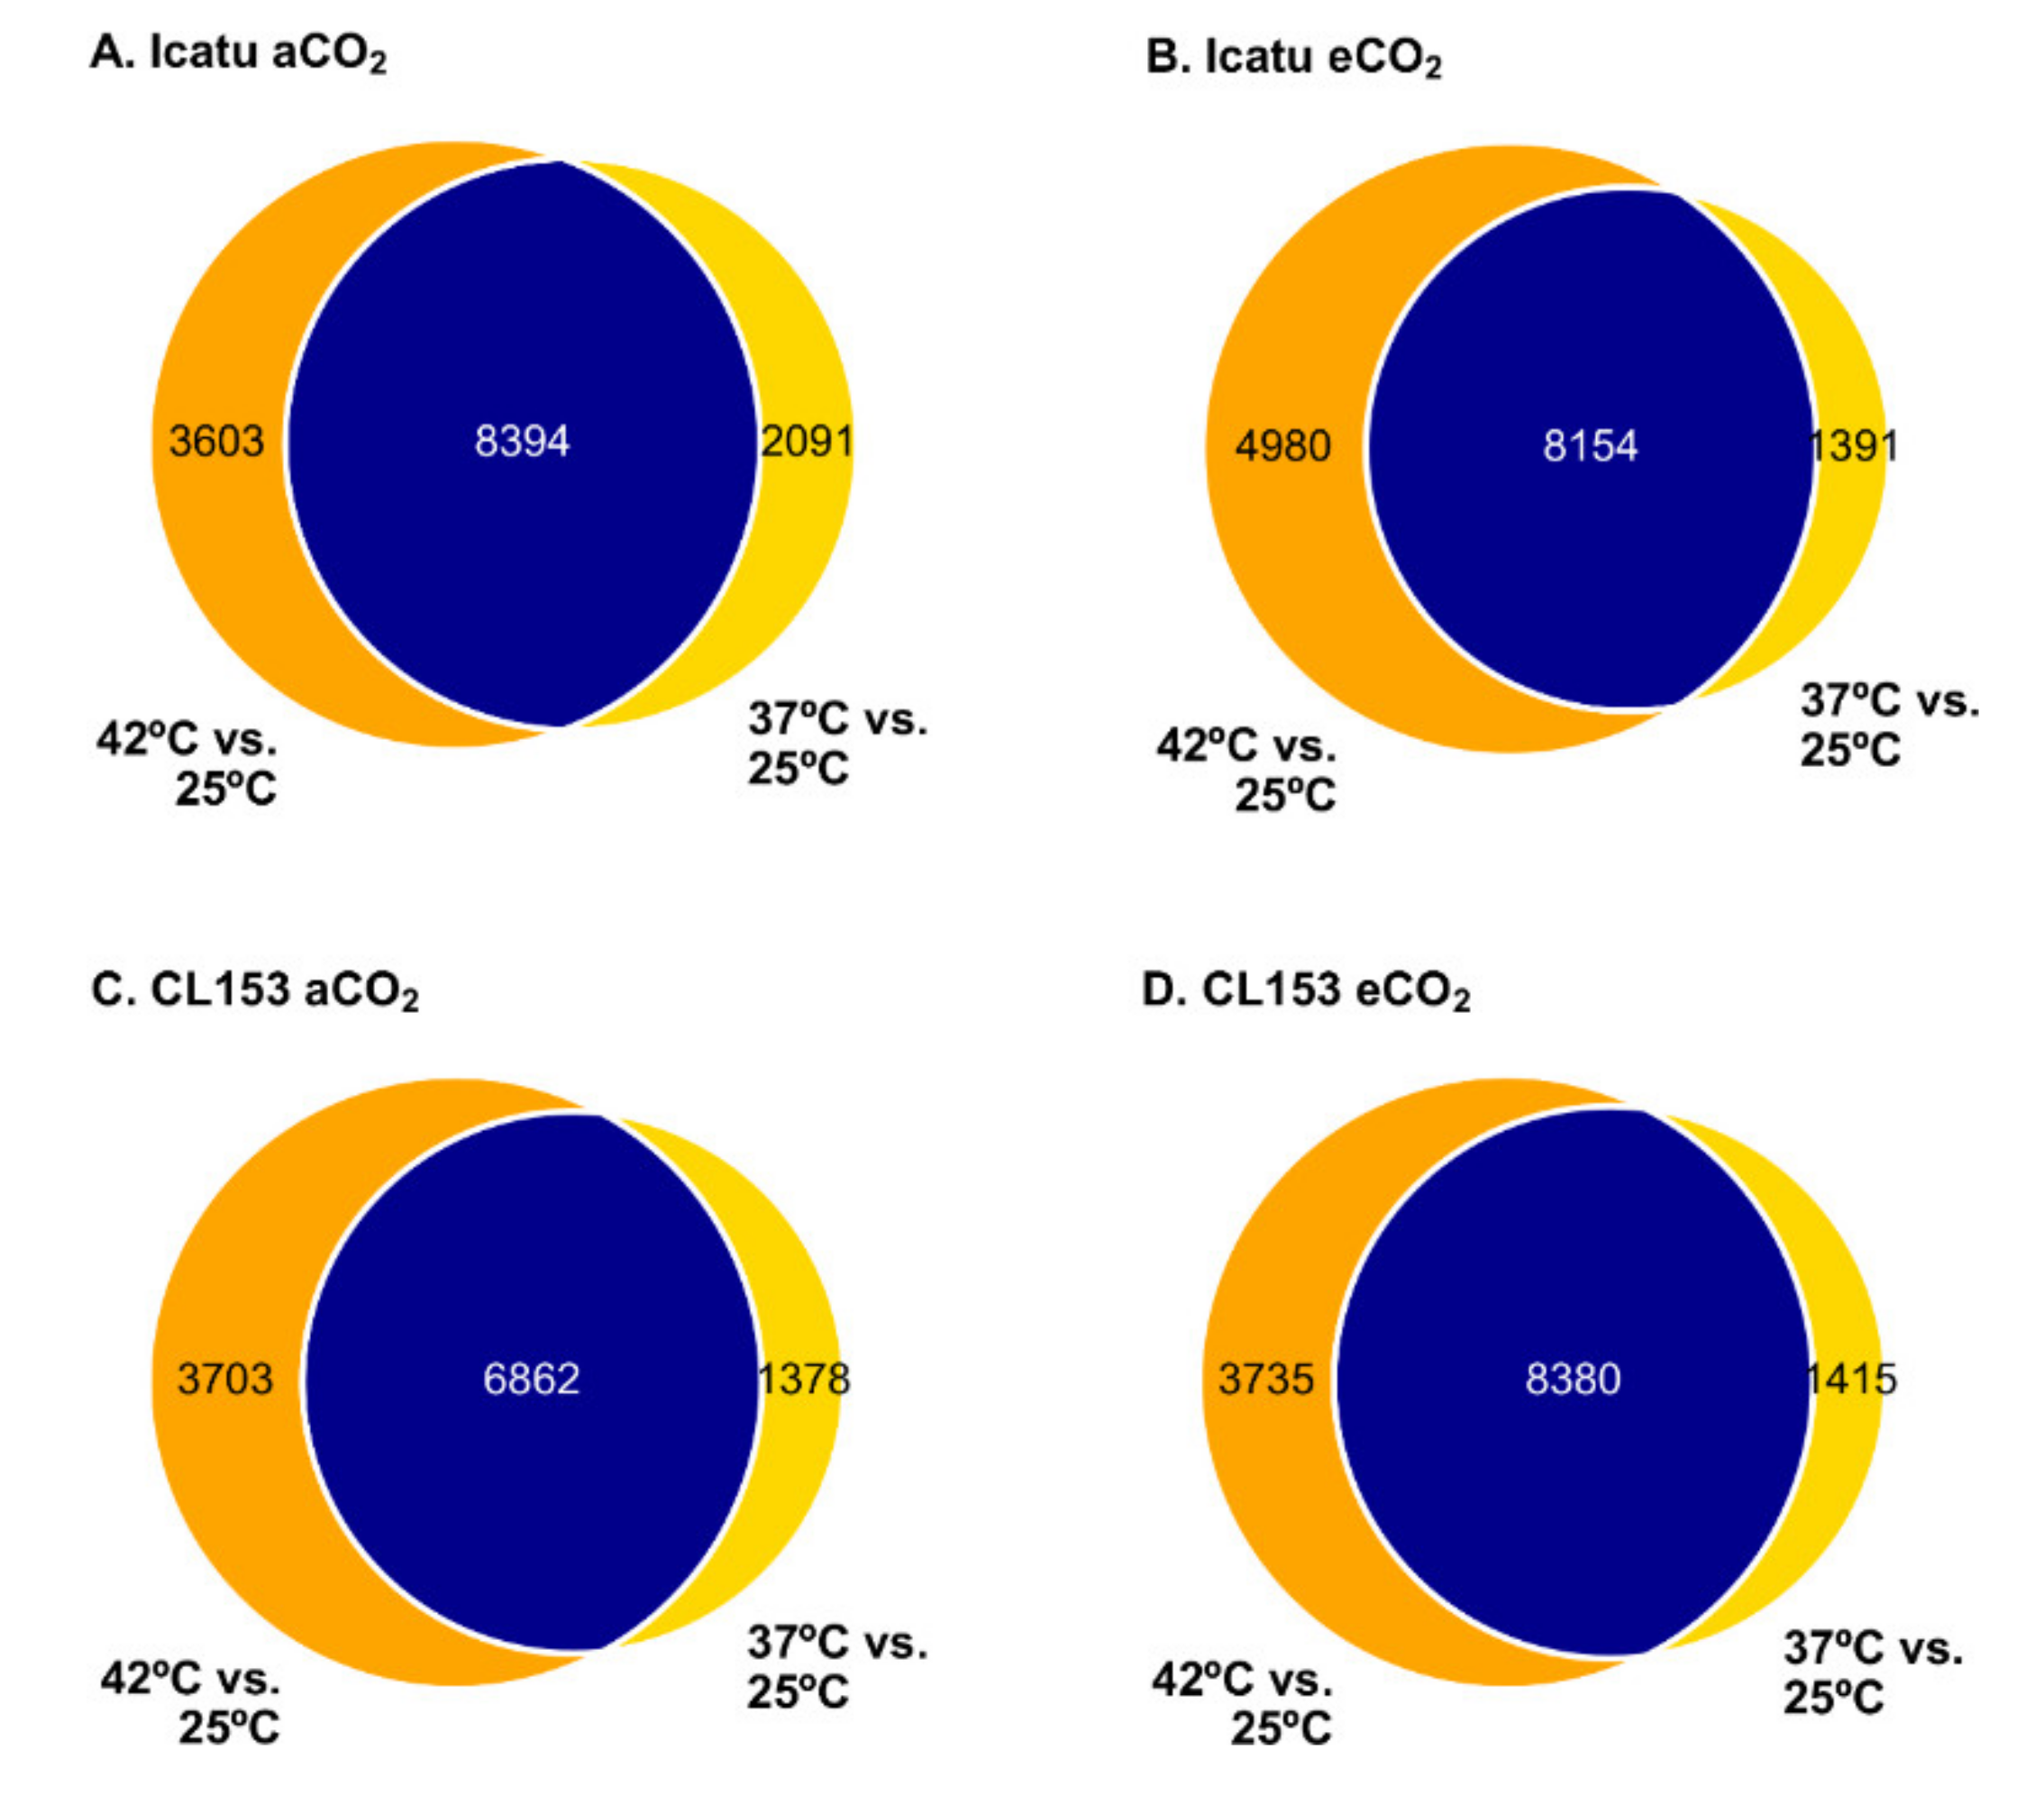
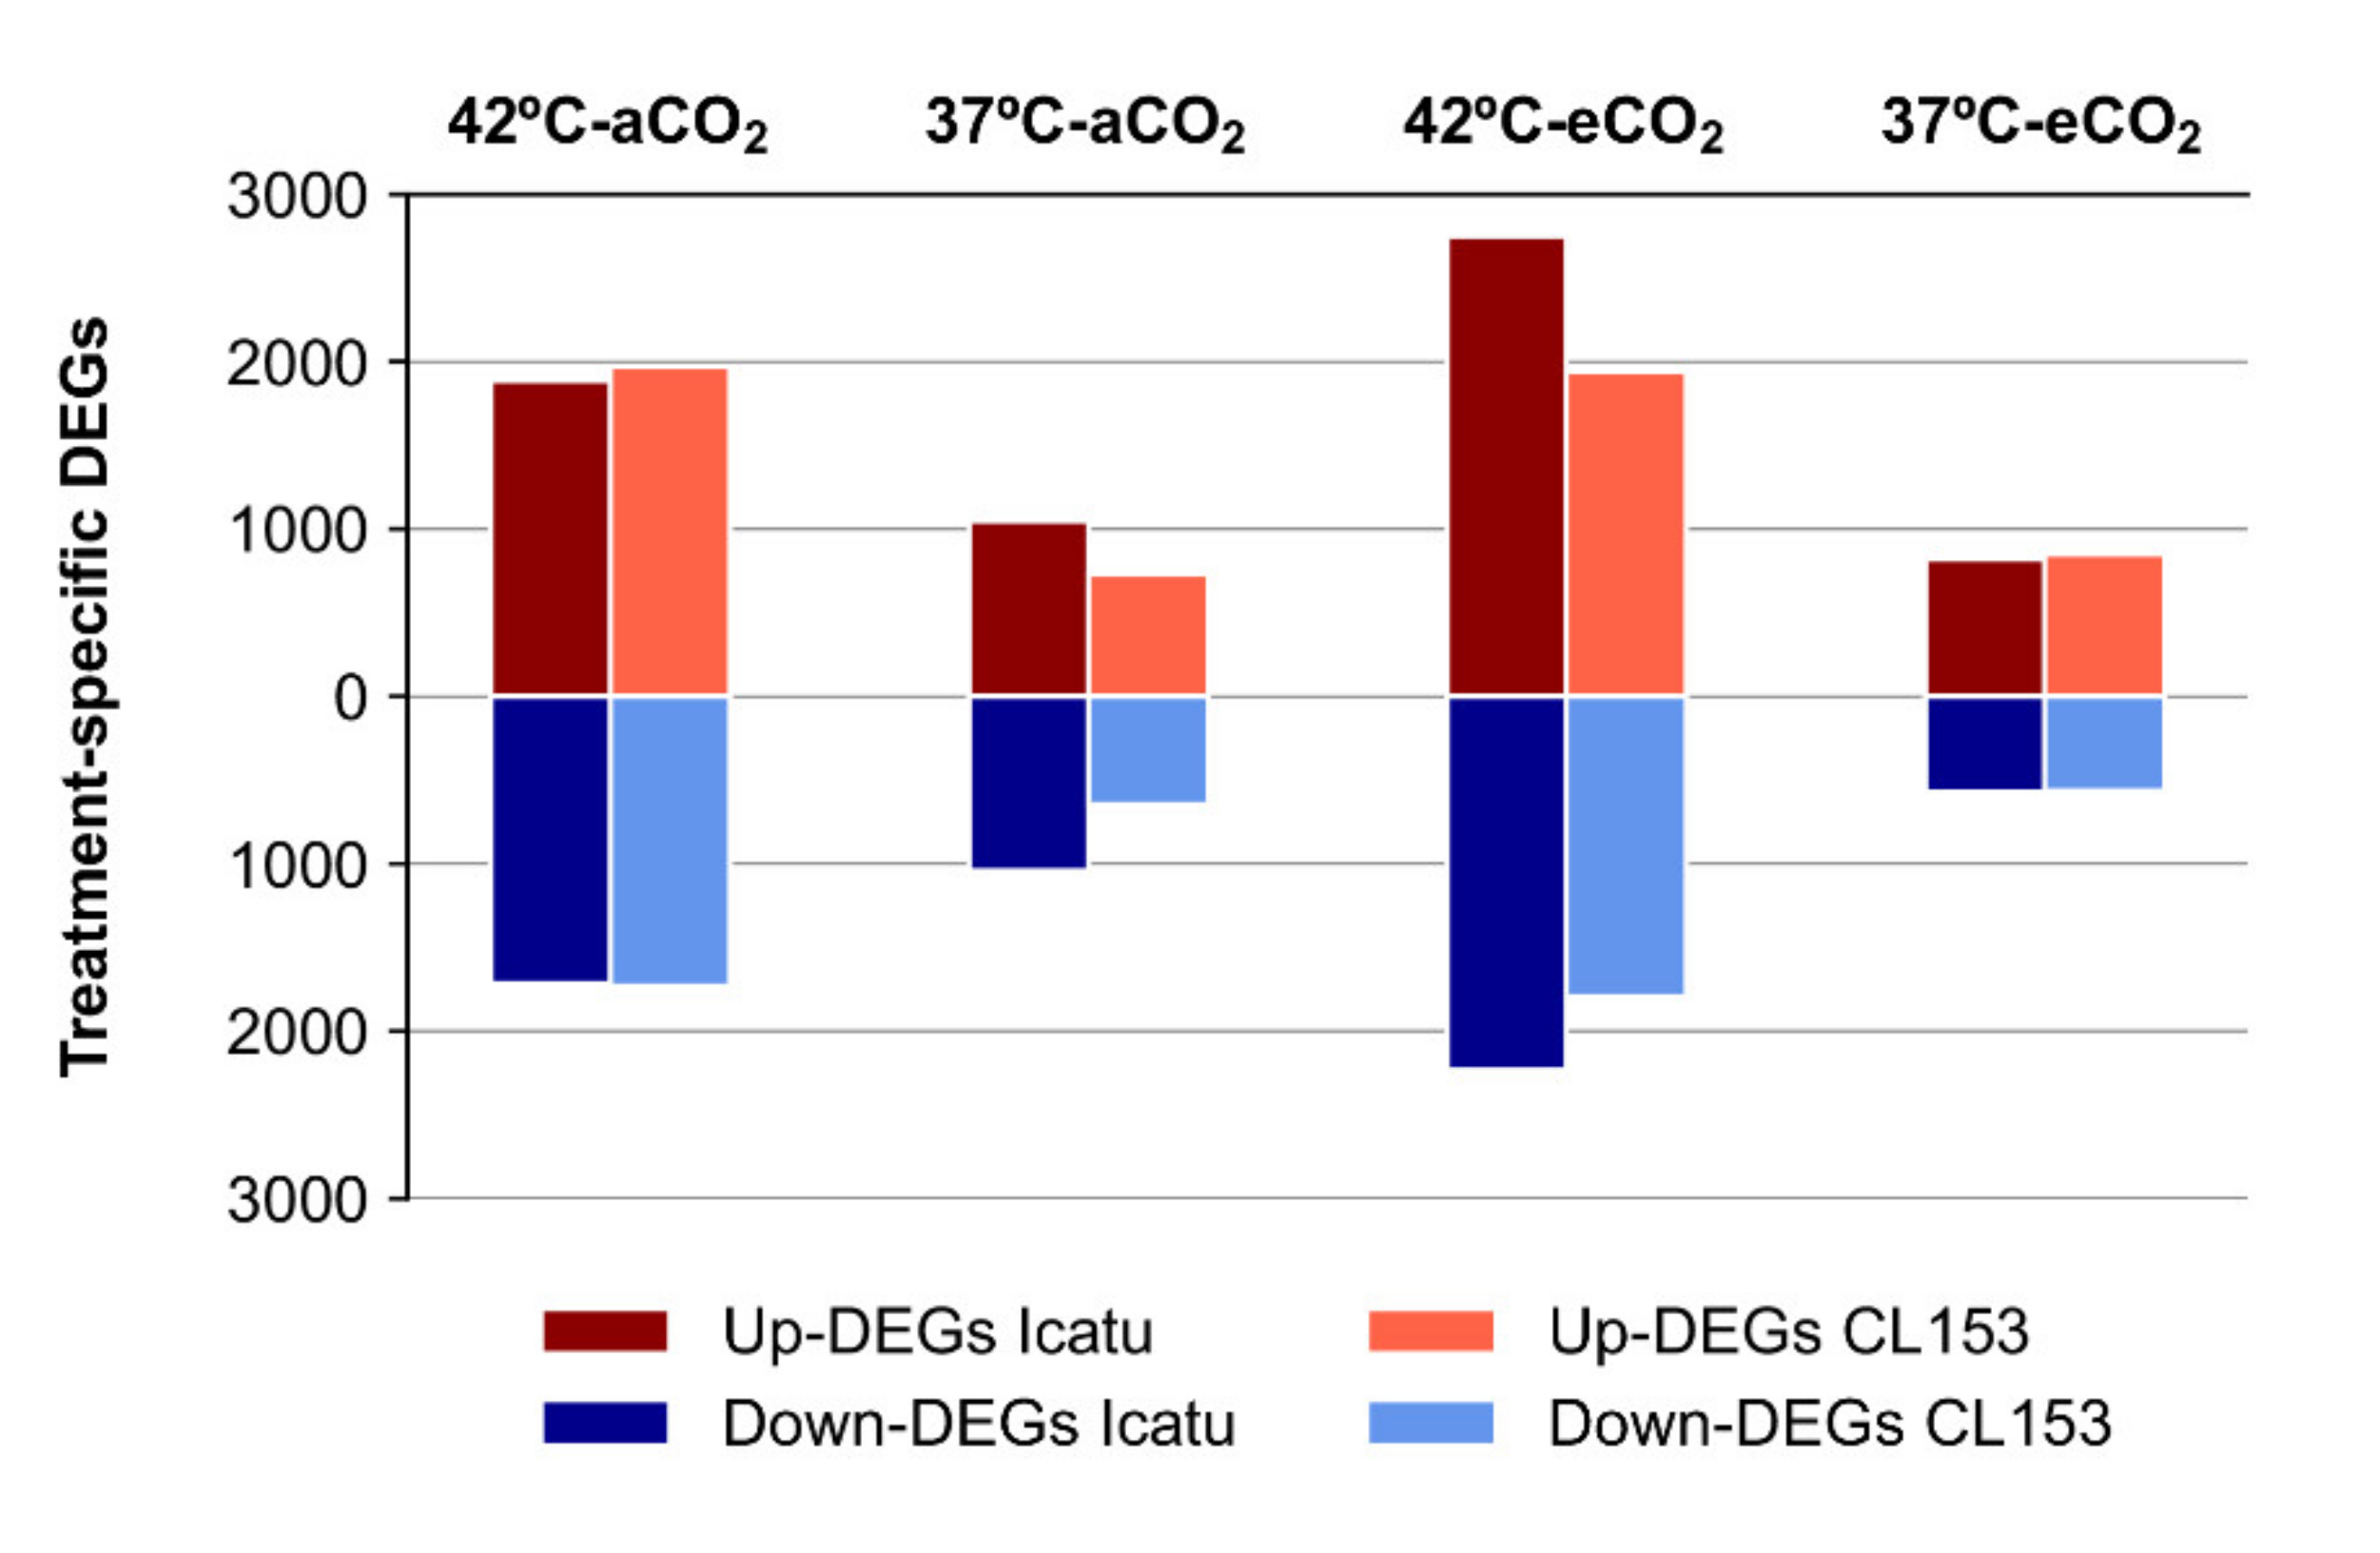
2.3. Differential Gene Expression Changes in Response to Supra-Optimal Temperatures
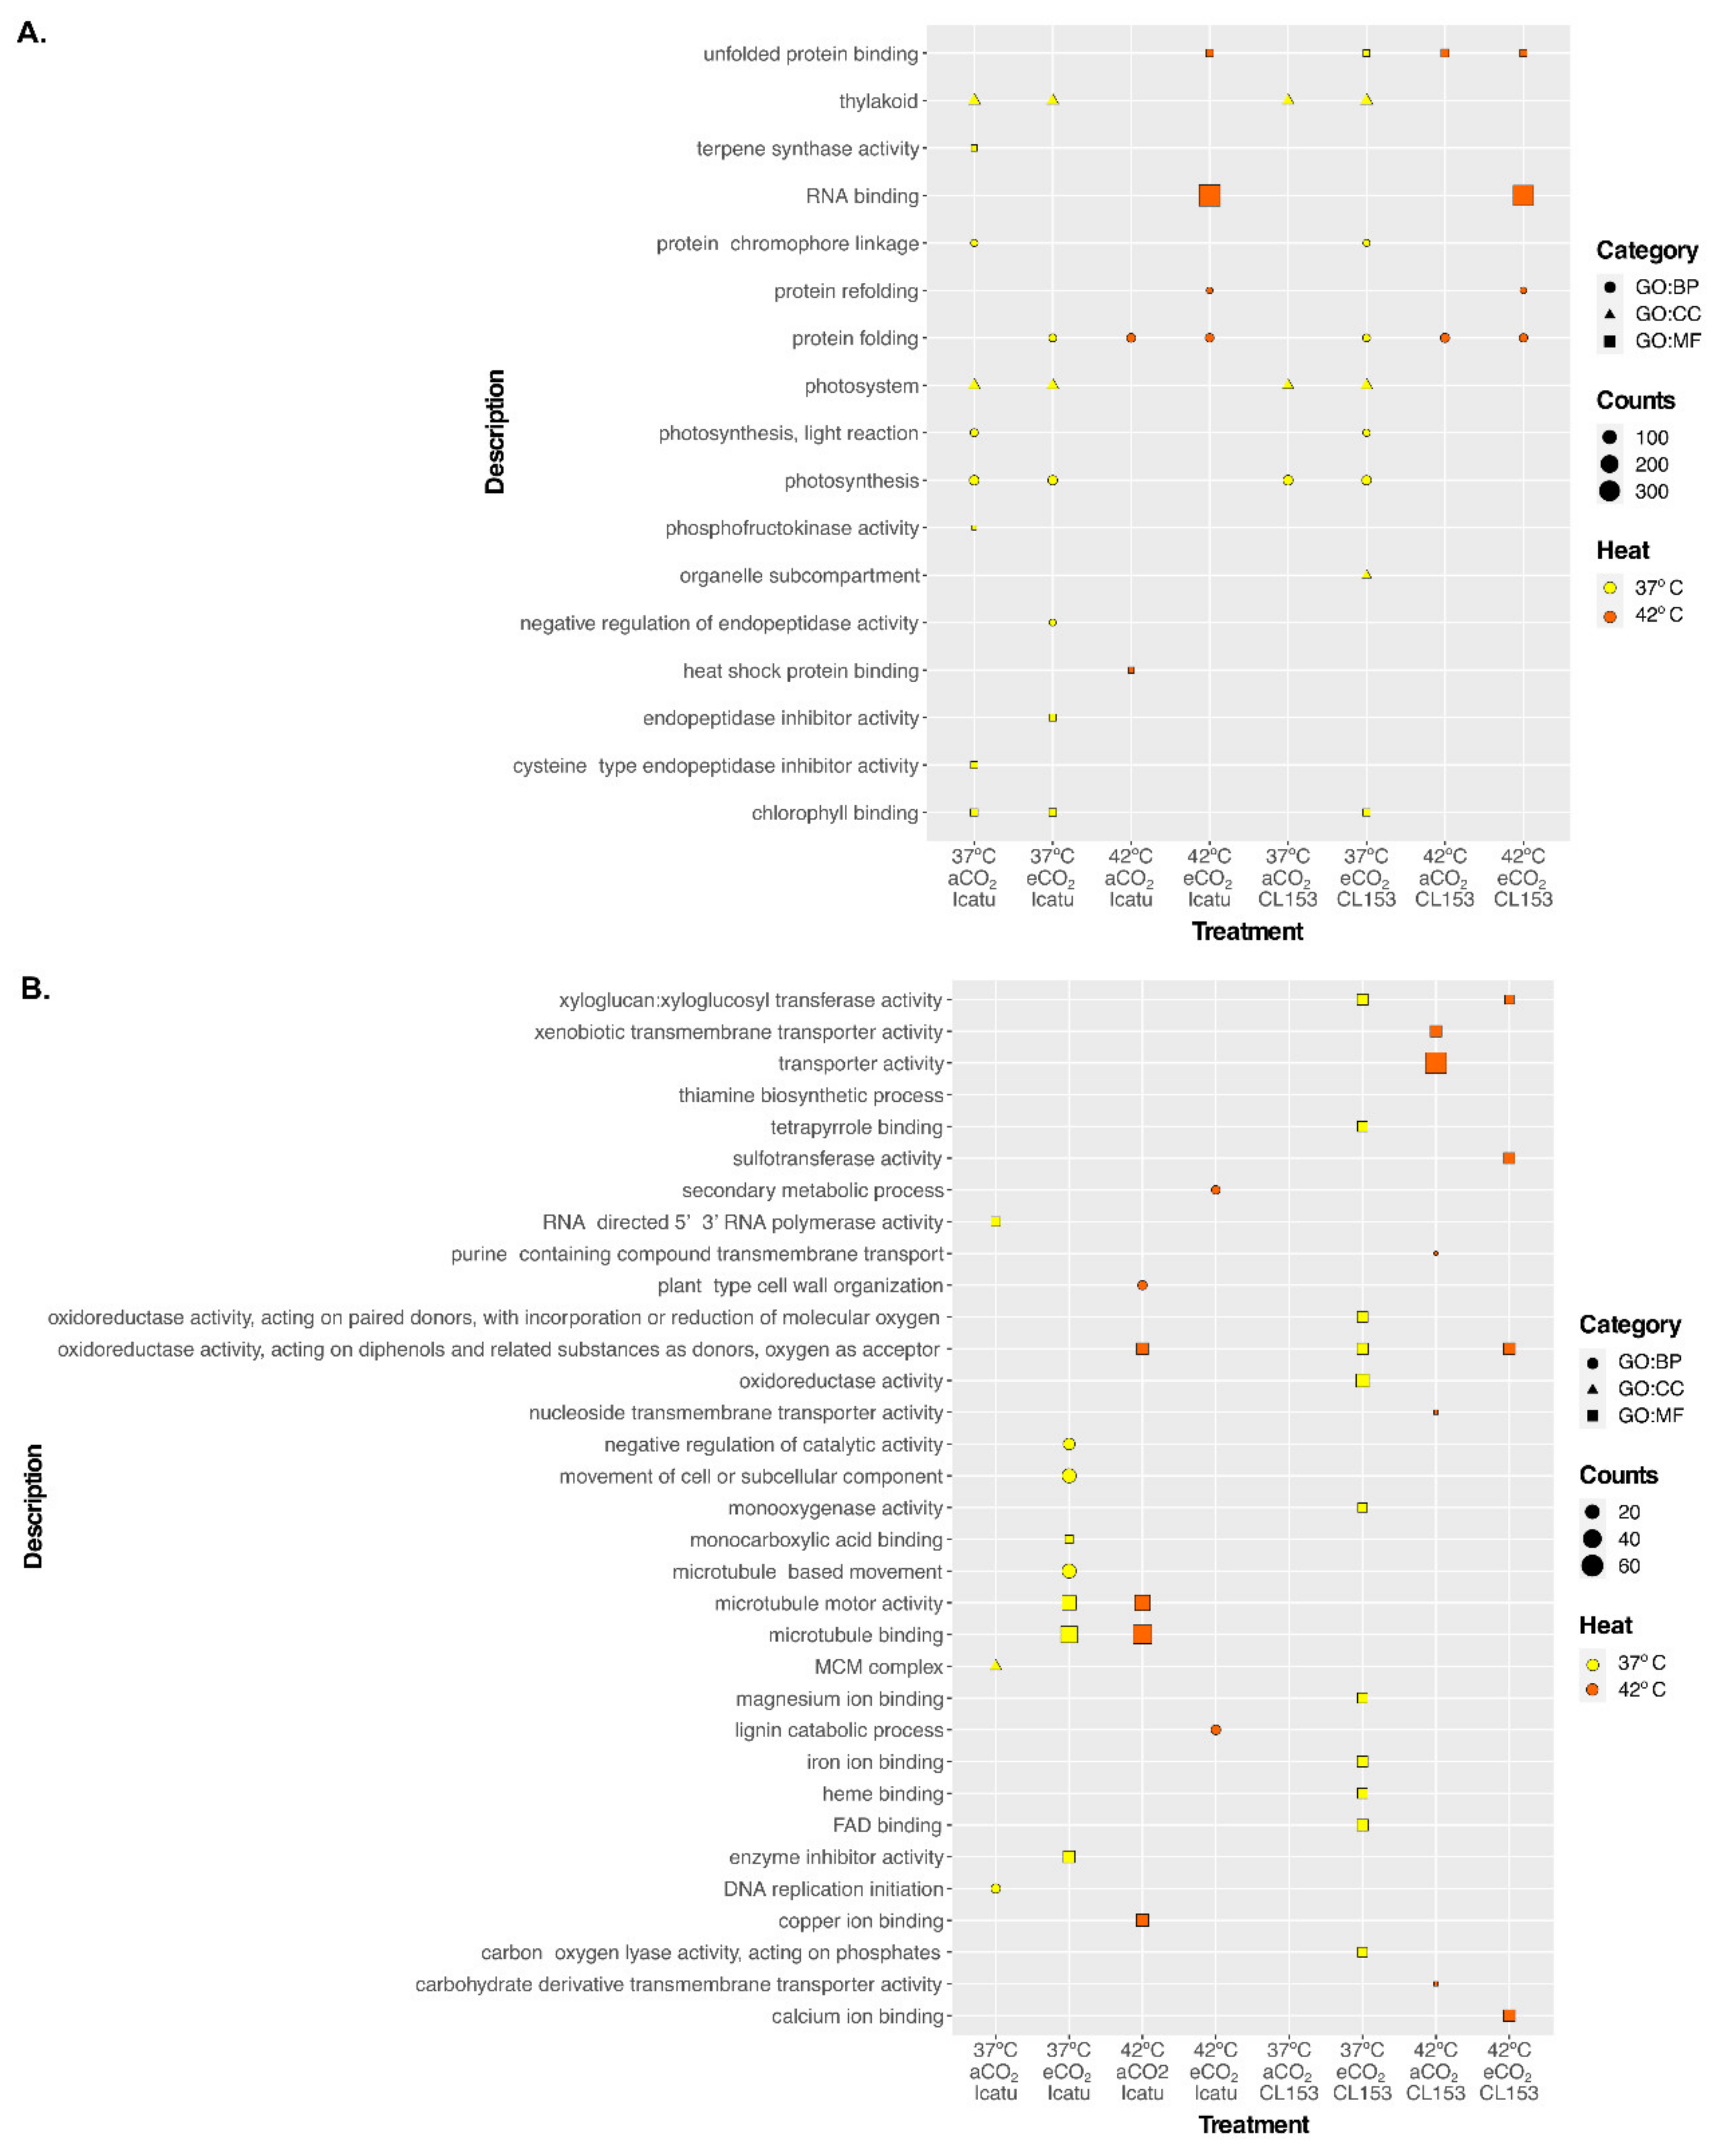
2.4. Significantly Enriched GO Terms of Responsive DEGs in the Two Genotypes
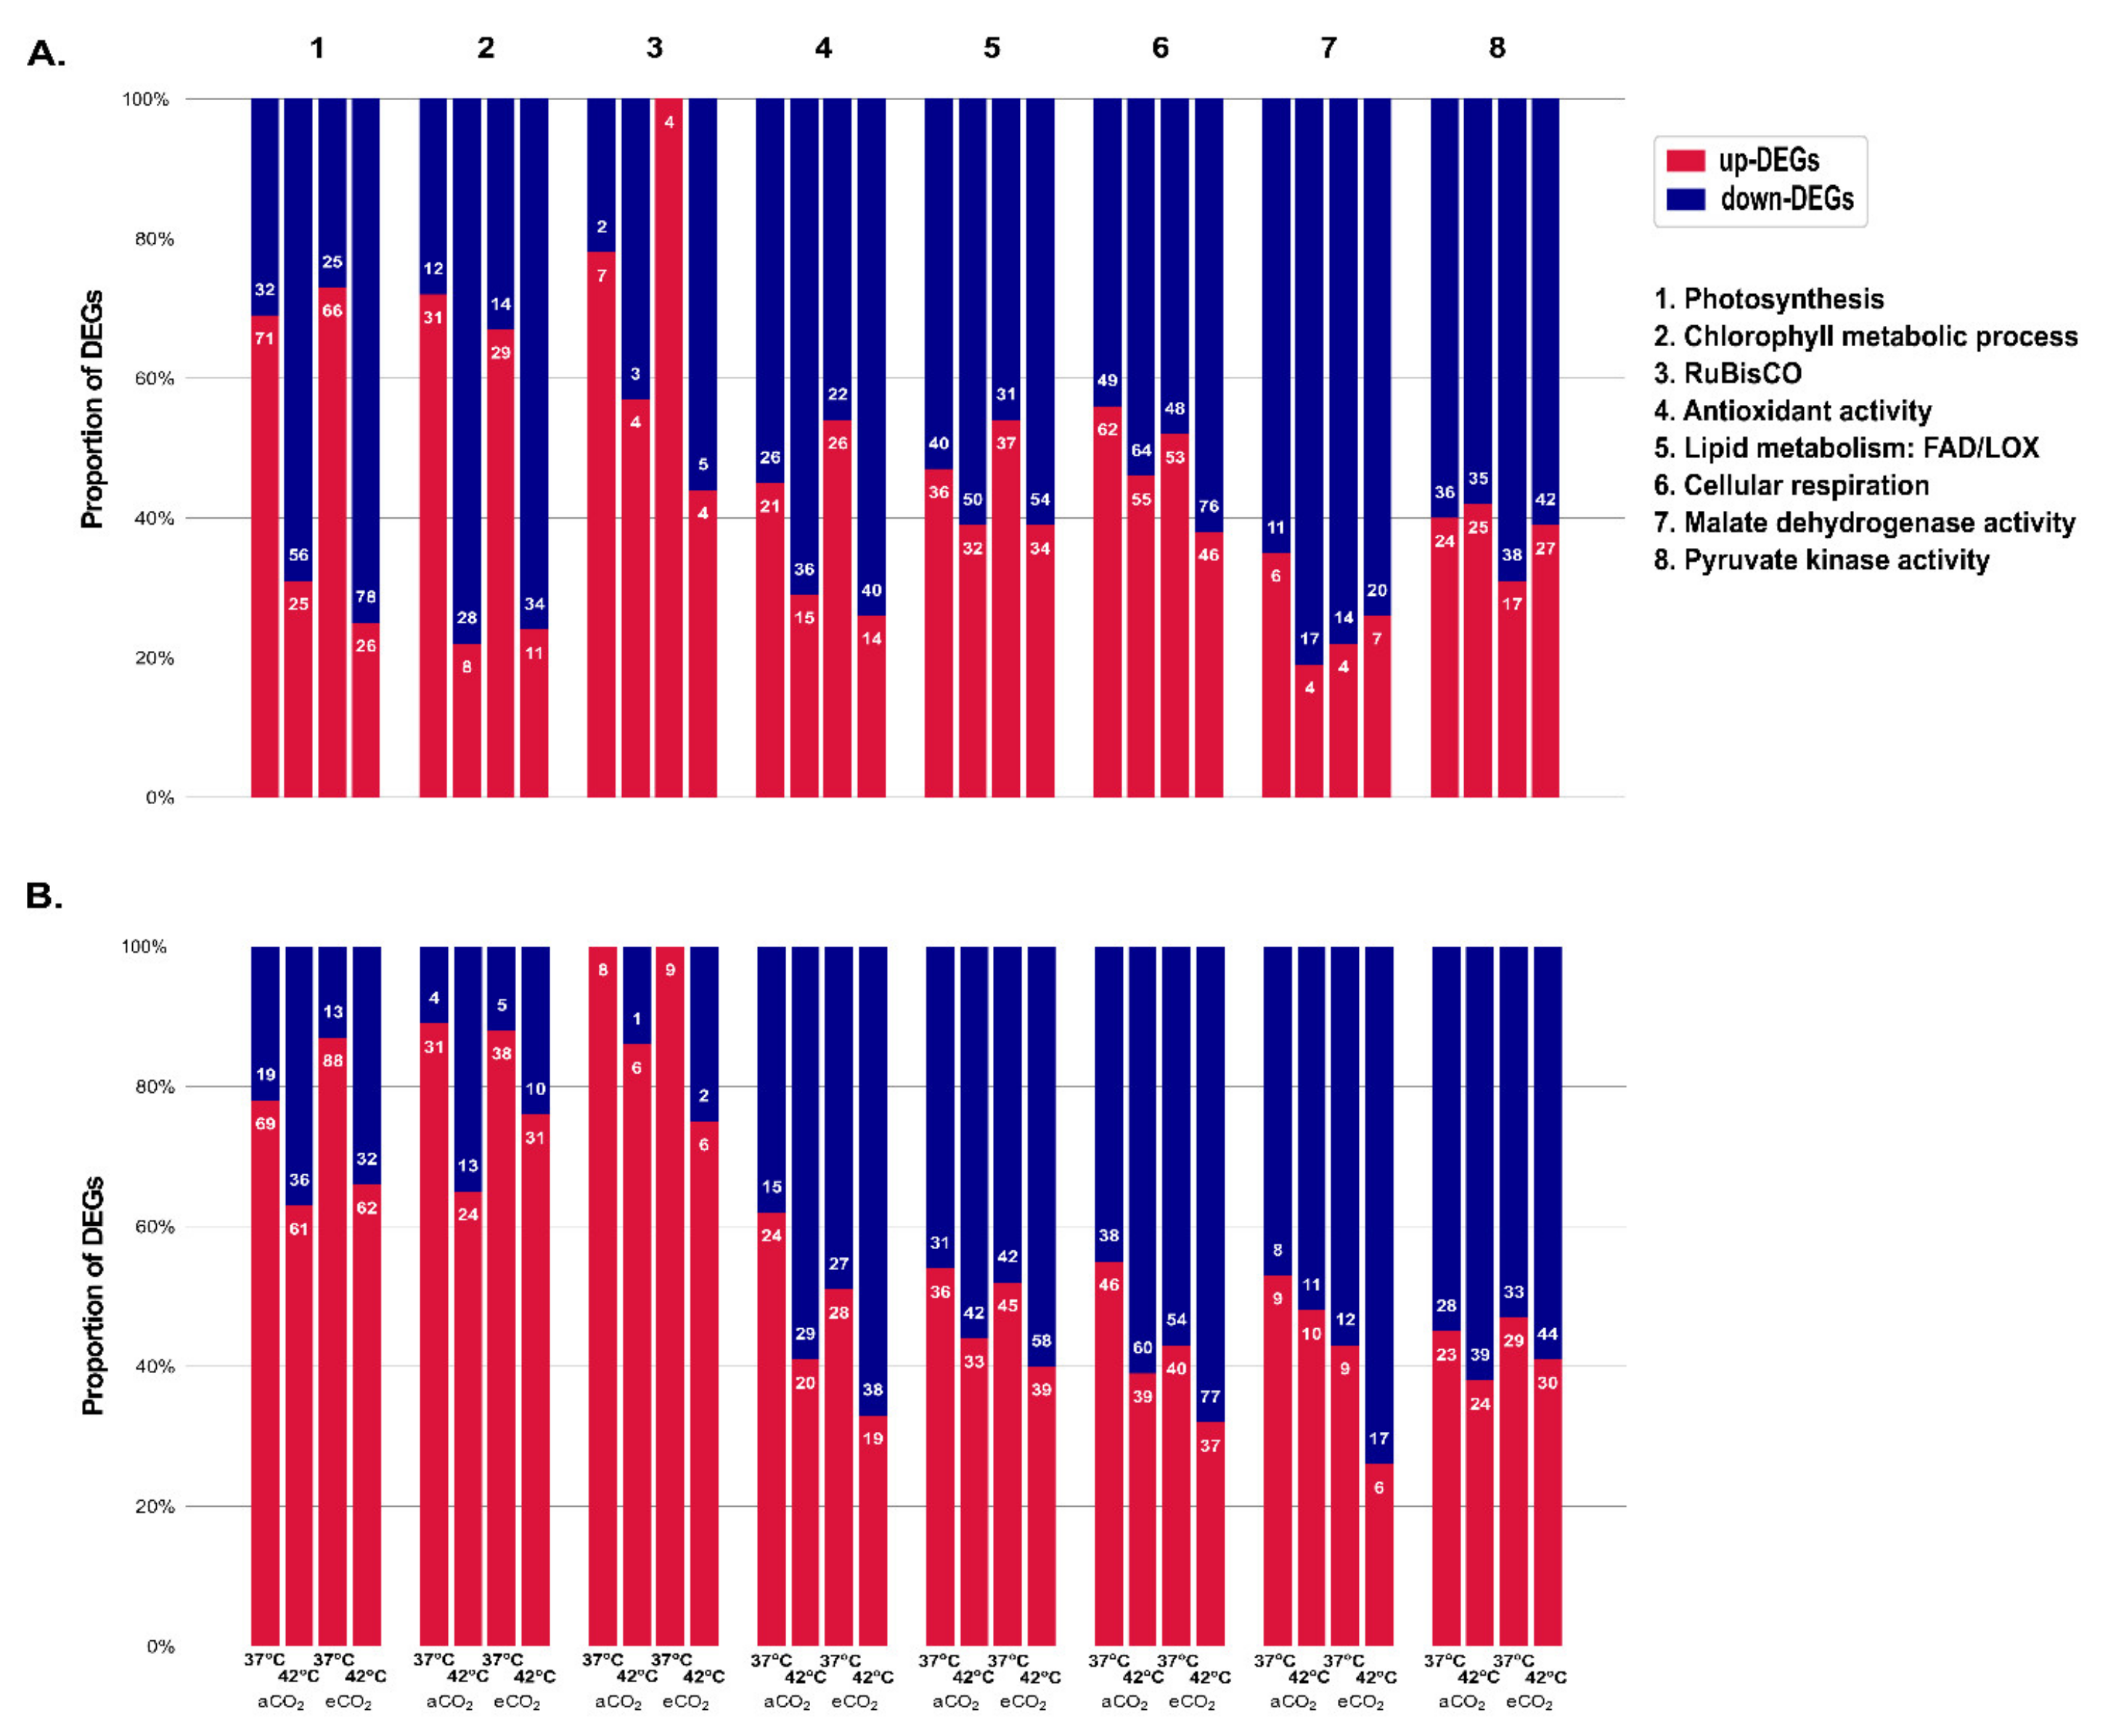
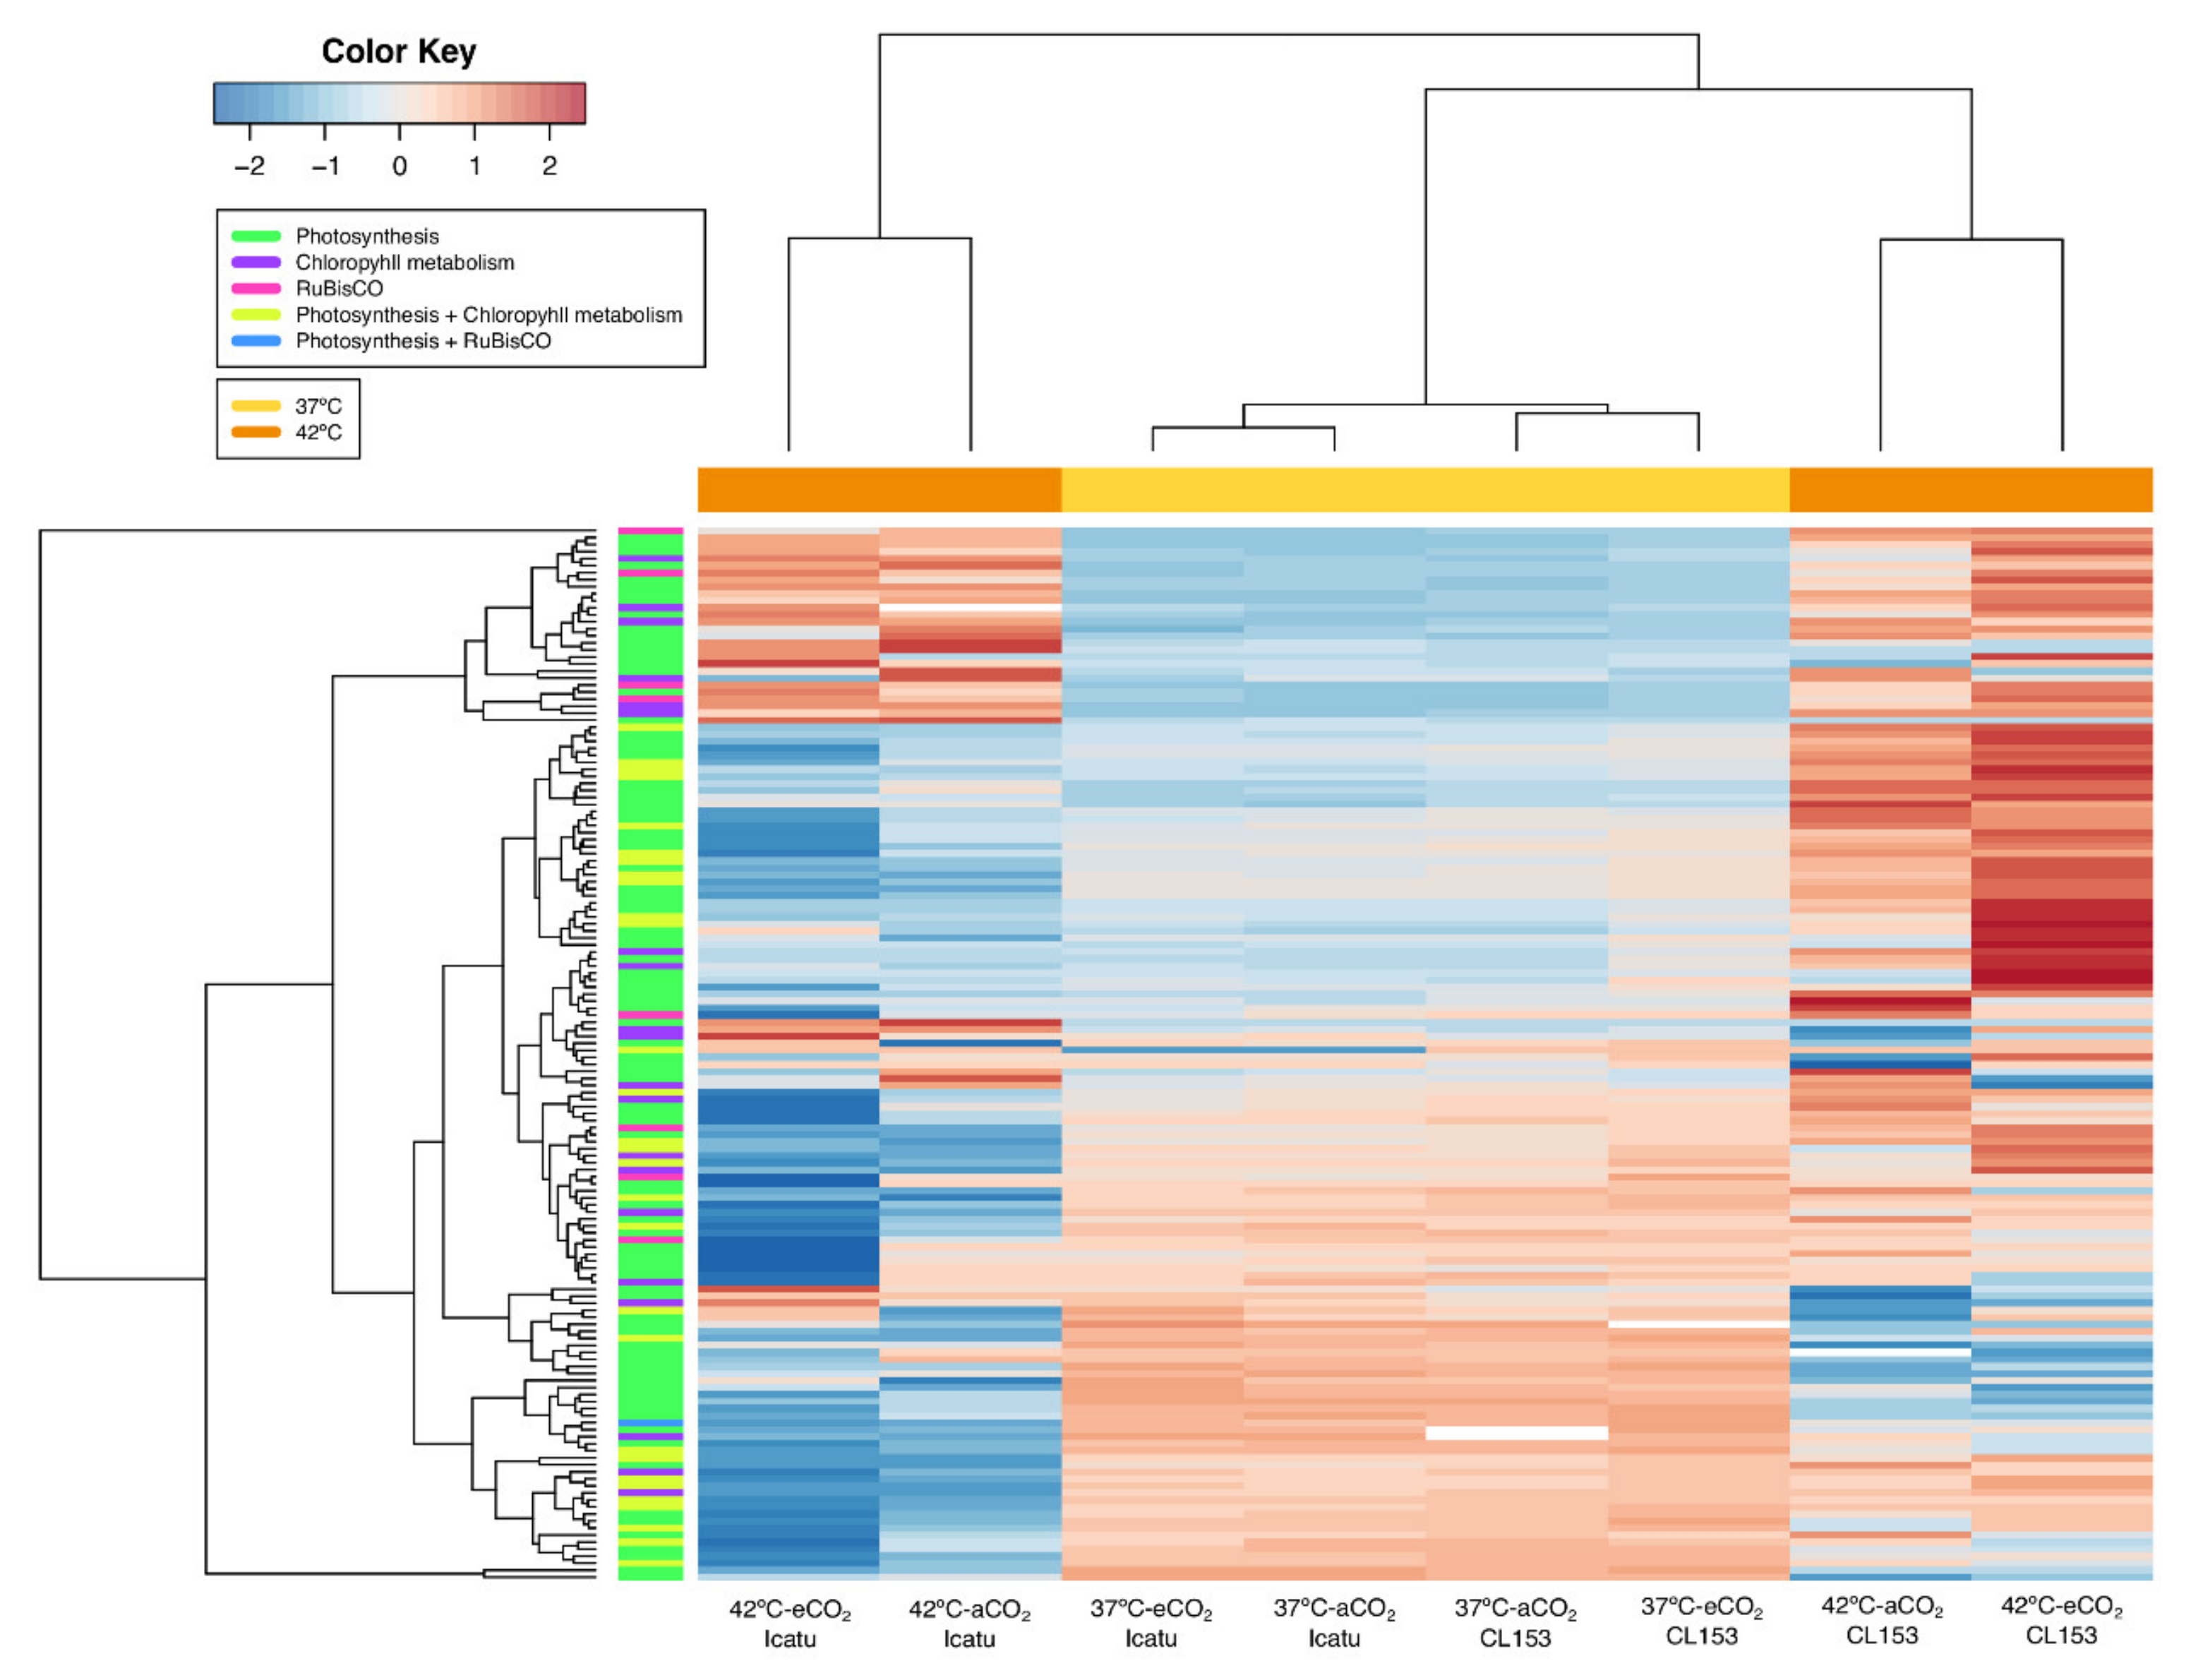
2.5. Effect of Supra-Optimal Temperatures and eCO2 on Photosynthetic and Other Biochemical-Related Responsive DEGs
3. Discussion
3.1. Unveiling the Transcriptomic Responses of Coffee to Supra-Optimal Temperatures and eCO2
3.2. Transcriptomic Impacts of Supra-Optimal Temperatures and eCO2 on Photosynthesis and Biochemical-Related Processes
3.3. Different Transcriptomic Responses: Potential Implications for the Coffee Industry
4. Materials and Methods
4.1. Plant Material and Experimental Design
4.2. RNA Extraction, Illumina Sequencing, and Data Quality Control
4.3. Reference-Based Mapping and Assembly
4.4. Identification of Differentially Expressed Genes (DEGs)
4.5. Functional Classification of Response DEGs
Supplementary Materials
Author Contributions
Funding
Institutional Review Board Statement
Informed Consent Statement
Data Availability Statement
Acknowledgments
Conflicts of Interest
References
- Taub, D.R.; Miller, B.; Allen, H. Effects of elevated CO2 on the protein concentration of food crops: A meta-analysis. Glob. Chang. Biol. 2007, 14, 565–575. [Google Scholar] [CrossRef]
- IPCC. Working Group III. Climate Change 2014. Mitigation of Climate Change. In Contributions to the Fifth Assessment Report of the Intergovernmental Panel on Climate Change; Edenhofer, O., Pichs-Madruga, R., Sokona, Y., Farahani, F., Kadner, S., Seyboth, K., Adler, A., Baum, I., Brunner, S., Eickemeier, P., et al., Eds.; Cambridge University Press: New York, NY, USA, 2014; p. 1435. [Google Scholar]
- Simpson, B.M. Preparing Smallholder Farm Families to Adapt to Climate Change. Pocket Guide 2: Managing Crop Resources; Catholic Relief Services: Baltimore, MD, USA, 2017. [Google Scholar]
- Wheeler, T.; Von Braun, J. Climate Change Impacts on Global Food Security. Nat. Clim. Chang. 2013, 341, 479–485. [Google Scholar] [CrossRef] [PubMed]
- Mittler, R. Abiotic stress, the field environment and stress combination. Trends Plant Sci. 2006, 11, 15–19. [Google Scholar] [CrossRef] [PubMed]
- Atkinson, N.J.; Urwin, P.E. The interaction of plant biotic and abiotic stresses: From genes to the field. J. Exp. Bot. 2012, 63, 3523–3543. [Google Scholar] [CrossRef] [PubMed] [Green Version]
- Kurek, I.; Chang, T.K.; Bertain, S.M.; Madrigal, A.; Liu, L.; Lassner, M.W.; Zhu, G. Enhanced Thermostability of Arabidopsis Rubisco Activase Improves Photosynthesis and Growth Rates under Moderate Heat Stress. Plant Cell 2007, 19, 3230–3241. [Google Scholar] [CrossRef] [Green Version]
- Sharkey, T.D.; Zhang, R. High Temperature Effects on Electron and Proton Circuits of Photosynthesis. J. Integr. Plant Biol. 2010, 52, 712–722. [Google Scholar] [CrossRef]
- Bita, C.E.; Gerats, T. Plant tolerance to high temperature in a changing environment: Scientific fundamentals and production of heat stress-tolerant crops. Front. Plant Sci. 2013, 4, 273. [Google Scholar] [CrossRef] [Green Version]
- Iii, E.W.H.; Heckathorn, S.A.; Joshi, P.; Wang, D.; Barua, D. Interactive Effects of Elevated CO2 and Growth Temperature on the Tolerance of Photosynthesis to Acute Heat Stress in C3 and C4 Species. J. Integr. Plant Biol. 2008, 50, 1375–1387. [Google Scholar] [CrossRef]
- Leakey, A.D.B.; Xu, F.; Gillespie, K.M.; McGrath, J.M.; Ainsworth, E.A.; Ort, D.R. Genomic basis for stimulated respiration by plants growing under elevated carbon dioxide. Proc. Natl. Acad. Sci. USA 2009, 106, 3597–3602. [Google Scholar] [CrossRef] [Green Version]
- Prasad, P.V.V.; Vu, J.C.V.; Boote, K.J.; Allen, L.H. Enhancement in leaf photosynthesis and upregulation of Rubisco in the C4 sorghum plant at elevated growth carbon dioxide and temperature occur at early stages of leaf ontogeny. Funct. Plant Biol. 2009, 36, 761–769. [Google Scholar] [CrossRef]
- Ramalho, J.C.; Rodrigues, A.P.; Semedo, J.N.; Pais, I.P.; Martins, L.D.; Simões-Costa, M.C.; Leitão, A.E.; Fortunato, A.S.; Batista-Santos, P.; Palos, I.M.; et al. Sustained Photosynthetic Performance of Coffea spp. under Long-Term Enhanced [CO2]. PLOS ONE 2013, 8, e82712. [Google Scholar] [CrossRef] [Green Version]
- Rodrigues, W.P.; Martins, M.Q.; Fortunato, A.S.; Rodrigues, A.P.; Semedo, J.N.; Simões-Costa, M.C.; Pais, I.P.; Leitao, A.E.; Colwell, F.; Goulão, L.; et al. Long-term elevated air [CO2 ] strengthens photosynthetic functioning and mitigates the impact of supra-optimal temperatures in tropical Coffea arabica and C. canephora species. Glob. Chang. Biol. 2015, 22, 415–431. [Google Scholar] [CrossRef]
- DaMatta, F.M.; Ramalho, J.D.C. Impacts of drought and temperature stress on coffee physiology and production: A review. Braz. J. Plant Physiol. 2006, 18, 55–81. [Google Scholar] [CrossRef]
- Osorio, N. The Global Coffee Crisis: A Threat to Sustainable Development. In Proceedings of the World Summit on Sustainable Development, Johannesburg, South Africa, 30 August 2002. [Google Scholar]
- Ramalho, J.C.; DaMatta, F.M.; Rodrigues, A.P.; Scotti-Campos, P.; Pais, I.; Batista-Santos, P.; Partelli, F.L.; Ribeiro, A.; Lidon, F.C.; Leitão, A.E. Cold impact and acclimation response of Coffea spp. plants. Theor. Exp. Plant Physiol. 2014, 26, 5–18. [Google Scholar] [CrossRef]
- Theory and Practice of Climate Adaptation. In Climate Change Management; Springer International Publishing: New York, NY, USA, 2018; pp. 465–477. ISBN 978-3-319-72874-2.
- International Coffee Organization. ICO Annual Review 2010; ICO: London, UK, 2010. [Google Scholar]
- Scalabrin, S.; Toniutti, L.; Di Gaspero, G.; Scaglione, D.; Magris, G.; Vidotto, M.; Pinosio, S.; Cattonaro, F.; Magni, F.; Jurman, I.; et al. A single polyploidization event at the origin of the tetraploid genome of Coffea arabica is responsible for the extremely low genetic variation in wild and cultivated germplasm. Sci. Rep. 2020, 10, 4642. [Google Scholar] [CrossRef] [Green Version]
- Van Der Vossen, H.; Bertrand, B.; Charrier, A. Next generation variety development for sustainable production of arabica coffee (Coffea arabica L.): A review. Euphytica 2015, 204, 243–256. [Google Scholar] [CrossRef]
- Venancio, L.P.; Filgueiras, R.; Mantovani, E.C.; Amaral, C.H.D.; Da Cunha, F.F.; Silva, F.C.D.S.; Althoff, D.; Dos Santos, R.A.; Cavatte, P.C. Impact of drought associated with high temperatures on Coffea canephora plantations: A case study in Espírito Santo State, Brazil. Sci. Rep. 2020, 10, 1–21. [Google Scholar] [CrossRef]
- Nunes, M.A.; Bierhuizen, J.F.; Ploegman, C. Studies on Productivity of Coffee: I. Effect of Light, Temperature and CO2 Concentration on Photosynthesis of Coffee Arabica. Acta Bot. Neerl. 1968, 17, 93–102. [Google Scholar] [CrossRef]
- Cannell, M.G. Crop physiological aspects of coffee bean yield: A review. Kenya Coffee 1976, 41, 245–253. [Google Scholar]
- Kumar, D.; Tieszen, L.L. Some aspects of photosynthesis and related processes in Coffea arabica L. Kenya Coffee 1976, 41, 309–315. [Google Scholar]
- Camargo, A.P. O clima e a cafeicultura no Brasil. Inf. Agropec. 1985, 11, 13–26. [Google Scholar]
- Franco, C.M. Influence of Temperature on Growth of Coffee Plant; Bulletin, No. 16; IBEC Research Institute: New York, NY, USA, 1958. [Google Scholar]
- DaMatta, F.M. Ecophysiological constraints on the production of shaded and unshaded coffee: A review. Field Crop. Res. 2004, 86, 99–114. [Google Scholar] [CrossRef]
- Marie, L.; Abdallah, C.; Campa, C.; Courtel, P.; Bordeaux, M.; Navarini, L.; Lonzarich, V.; Bosselmann, A.S.; Turreira-García, N.; Alpizar, E.; et al. G × E interactions on yield and quality in Coffea arabica: New F1 hybrids outperform American cultivars. Euphytica 2020, 216, 1–17. [Google Scholar] [CrossRef] [Green Version]
- Dubberstein, D.; Lidon, F.C.; Rodrigues, A.P.; Semedo, J.N.; Marques, I.; Rodrigues, W.P.; Gouveia, D.; Armengaud, J.; Semedo, M.C.; Martins, S.; et al. Resilient and Sensitive Key Points of the Photosynthetic Machinery of Coffea spp. to the Single and Superimposed Exposure to Severe Drought and Heat Stresses. Front. Plant Sci. 2020, 11, 1049. [Google Scholar] [CrossRef]
- Gascó, A.; Nardini, A.; Salleo, S. Resistance to water flow through leaves of Coffea arabica is dominated by extra-vascular tissues. Funct. Plant Biol. 2004, 31, 1161–1168. [Google Scholar] [CrossRef]
- Matiello, J.B. Café Conillon: Como Plantar, Tratar, Colher, Preparar e Vender; MM Produções Gráficas: Rio de Janeiro, Brazil, 1998. [Google Scholar]
- Willson, K.C. Coffee, Cocoa ant Tea; CAB International: Wallingford, UK, 1999. [Google Scholar]
- Coste, R. Coffee: The Plant and the Product; MacMillan Press: London, UK, 1992. [Google Scholar]
- De Oliveira, R.R.; Ribeiro, T.H.C.; Cardon, C.H.; Fedenia, L.; Maia, V.A.; Barbosa, B.C.F.; Caldeira, C.F.; Klein, P.E.; Chalfun-Junior, A. Elevated Temperatures Impose Transcriptional Constraints and Elicit Intraspecific Differences Between Coffee Genotypes. Front. Plant Sci. 2020, 11, 1113. [Google Scholar] [CrossRef]
- DaMatta, F.M.; Rahn, E.; Läderach, P.; Ghini, R.; Ramalho, J.C. Why could the coffee crop endure climate change and global warming to a greater extent than previously estimated? Clim. Chang. 2018, 152, 167–178. [Google Scholar] [CrossRef] [Green Version]
- DaMatta, F.M.; Avila, R.T.; Cardoso, A.A.; Martins, S.C.V.; Ramalho, J.C. Physiological and Agronomic Performance of the Coffee Crop in the Context of Climate Change and Global Warming: A Review. J. Agric. Food Chem. 2018, 66, 5264–5274. [Google Scholar] [CrossRef]
- Avila, R.T.; de Almeida, W.L.; Costa, L.C.; Machado, K.L.; Barbosa, M.L.; de Souza, R.P.; Martino, P.B.; Juárez, M.A.; Marçal, D.M.; Martins, S.C.; et al. Elevated air [CO2] improves photosynthetic performance and alters biomass accumulation and partitioning in drought-stressed coffee plants. Environ. Exp. Bot. 2020, 177, 104137. [Google Scholar] [CrossRef]
- Semedo, J.N.; Rodrigues, A.P.; Lidon, F.C.; Pais, I.P.; Marques, I.; Gouveia, D.; Armengaud, J.; Silva, M.J.; Martins, S.; Semedo, M.C.; et al. Intrinsic non-stomatal resilience to drought of the photosynthetic apparatus in Coffea spp. is strengthened by elevated air [CO2]. Tree Physiol. 2020, 2021. [Google Scholar] [CrossRef]
- Martins, L.D.; Tomaz, M.A.; Lidon, F.C.; DaMatta, F.M.; Ramalho, J.C. Combined effects of elevated [CO2] and high temperature on leaf mineral balance in Coffea spp. plants. Clim. Chang. 2014, 126, 365–379. [Google Scholar] [CrossRef]
- Martins, M.Q.; Rodrigues, W.P.; Fortunato, A.S.; Leitão, A.E.; Rodrigues, A.P.; Pais, I.P.; Martins, L.D.; Silva, M.J.; Reboredo, F.H.; Partelli, F.L.; et al. Protective Response Mechanisms to Heat Stress in Interaction with High [CO2] Conditions in Coffea spp. Front. Plant Sci. 2016, 7, 947. [Google Scholar] [CrossRef] [Green Version]
- Ramalho, J.C.; Pais, I.P.; Leitão, A.E.; Guerra, M.; Reboredo, F.H.; Máguas, C.M.; Carvalho, M.L.; Scotti-Campos, P.; Ribeiro-Barros, A.I.; Lidon, F.J.C.; et al. Can Elevated Air [CO2] Conditions Mitigate the Predicted Warming Impact on the Quality of Coffee Bean? Front. Plant Sci. 2018, 9, 287. [Google Scholar] [CrossRef] [Green Version]
- Marques, I.; Fernandes, I.; David, P.H.; Paulo, O.S.; Goulao, L.F.; Fortunato, A.S.; Lidon, F.C.; DaMatta, F.M.; Ramalho, J.C.; Ribeiro-Barros, A.I. Transcriptomic Leaf Profiling Reveals Differential Responses of the Two Most Traded Coffee Species to Elevated [CO2]. Int. J. Mol. Sci. 2020, 21, 9211. [Google Scholar] [CrossRef] [PubMed]
- Dusenge, M.E.; Duarte, A.G.; Way, D.A. Plant carbon metabolism and climate change: Elevated CO2 and temperature impacts on photosynthesis, photorespiration and respiration. New Phytol. 2018, 221, 32–49. [Google Scholar] [CrossRef] [PubMed] [Green Version]
- Vico, G.; Way, D.A.; Hurry, V.; Manzoni, S. Can leaf net photosynthesis acclimate to rising and more variable temperatures? Plant Cell Environ. 2019, 42, 1913–1928. [Google Scholar] [CrossRef]
- Prasch, C.M.; Sonnewald, U. Signaling events in plants: Stress factors in combination change the picture. Environ. Exp. Bot. 2015, 114, 4–14. [Google Scholar] [CrossRef]
- Bertrand, B.; Bardil, A.; Baraille, H.; Dussert, S.; Doulbeau, S.; Dubois, E.; Severac, D.; Dereeper, A.; Etienne, H. The Greater Phenotypic Homeostasis of the Allopolyploid Coffea arabica Improved the Transcriptional Homeostasis Over that of Both Diploid Parents. Plant Cell Physiol. 2015, 56, 2035–2051. [Google Scholar] [CrossRef] [Green Version]
- Zhang, X.; Rerksiri, W.; Liu, A.; Zhou, X.; Xiong, H.; Xiang, J.; Chen, X.; Xiong, X. Transcriptome profile reveals heat response mechanism at molecular and metabolic levels in rice flag leaf. Gene 2013, 530, 185–192. [Google Scholar] [CrossRef]
- Liu, Z.; Xin, M.; Qin, J.; Peng, H.; Ni, Z.; Yao, Y.; Sun, Q. Temporal transcriptome profiling reveals expression partitioning of homeologous genes contributing to heat and drought acclimation in wheat (Triticum Aestivum L.). BMC Plant Biol. 2015, 15, 1–20. [Google Scholar] [CrossRef] [Green Version]
- Fernandes, J.; Morrow, D.J.; Casati, P.; Walbot, V. Distinctive transcriptome responses to adverse environmental conditions inZea maysL. Plant Biotechnol. J. 2008, 6, 782–798. [Google Scholar] [CrossRef] [PubMed]
- Ma, H.; Liu, M. The microtubule cytoskeleton acts as a sensor for stress response signaling in plants. Mol. Biol. Rep. 2019, 46, 5603–5608. [Google Scholar] [CrossRef] [PubMed]
- Hasanuzzaman, M.; Nahar, K.; Alam, M.; Roychowdhury, R.; Fujita, M. Physiological, Biochemical, and Molecular Mechanisms of Heat Stress Tolerance in Plants. Int. J. Mol. Sci. 2013, 14, 9643–9684. [Google Scholar] [CrossRef] [PubMed]
- Stratilová, B.; Kozmon, S.; Stratilová, E.; Hrmova, M. Plant Xyloglucan Xyloglucosyl Transferases and the Cell Wall Structure: Subtle but Significant. Molecules 2020, 25, 5619. [Google Scholar] [CrossRef]
- Perruc, E.; Charpenteau, M.; Ramirez, B.C.; Jauneau, A.; Galaud, J.P.; Ranjeva, R.; Ranty, B. A novel calmodu-lin-binding protein functions as a negative regulator of osmotic stress tolerance in Arabidopsis thaliana seedlings. Plant J. 2014, 38, 410–420. [Google Scholar] [CrossRef]
- Hirschmann, F.; Krause, F.; Papenbrock, J. The multi-protein family of sulfotransferases in plants: Composition, occurrence, substrate specificity, and functions. Front. Plant Sci. 2014, 5, 556. [Google Scholar] [CrossRef] [Green Version]
- Agrawal, A.A.; Hastings, A.P.; Johnson, M.T.J.; Maron, J.L.; Salminen, J.-P. Insect Herbivores Drive Real-Time Ecological and Evolutionary Change in Plant Populations. Science 2012, 338, 113–116. [Google Scholar] [CrossRef]
- Züst, T.; Rasmann, S.; Agrawal, A.A. Growth-defense tradeoffs for two major anti-herbivore traits of the common milkweed Asclepias syriaca. Oikos 2015, 124, 1404–1415. [Google Scholar] [CrossRef]
- Xie, M.; Zhang, J.; Tschaplinski, T.J.; Tuskan, G.A.; Chen, J.G.; Muchero, W. Regulation of Lignin Biosynthesis and Its Role in Growth-Defense Tradeoffs. Front. Plant Sci. 2018, 9, 1427. [Google Scholar] [CrossRef] [Green Version]
- United Nations. Transforming our World: The 2030 Agenda for Sustainable Development. 2015. Available online: https://www.un.org/ga/search/view_doc.asp?symbol=A/RES/70/1&Lang=E (accessed on 17 July 2020).
- Pais, I.P.; Reboredo, F.H.; Ramalho, J.C.; Pessoa, M.F.; Lidon, F.C.; Silva, M.M. Potential Impacts of Climate Change on Agriculture: A Review. Emir. J. Food Agric. 2020, 32, 397–407. [Google Scholar] [CrossRef]
- Rivero, R.M.; Mestre, T.C.; Mittler, R.; Rubio, F.; Garcia-Sanchez, F.; Martinez, V. The combined effect of salinity and heat reveals a specific physiological, biochemical and molecular response in tomato plants. Plant Cell Environ. 2013, 37, 1059–1073. [Google Scholar] [CrossRef]
- Shaar-Moshe, L.; Blumwald, E.; Peleg, Z. Unique Physiological and Transcriptional Shifts under Combinations of Salinity, Drought, and Heat. Plant Physiol. 2017, 174, 421–434. [Google Scholar] [CrossRef] [Green Version]
- Sage, R.F.; Kubien, D.S. The temperature response of C3and C4photosynthesis. Plant Cell Environ. 2007, 30, 1086–1106. [Google Scholar] [CrossRef] [PubMed]
- Way, D.A.; Oren, R.; Kroner, Y. The space-time continuum: The effects of elevated CO2 and temperature on trees and the importance of scaling. Plant Cell Environ. 2015, 38, 991–1007. [Google Scholar] [CrossRef]
- Boisvenue, C.; Running, S.W. Impacts of climate change on natural forest productivity—evidence since the middle of the 20th century. Glob. Chang. Biol. 2006, 12, 862–882. [Google Scholar] [CrossRef]
- Chovancek, E.; Zivcak, M.; Botyanszka, L.; Hauptvogel, P.; Yang, X.; Misheva, S.; Hussain, S.; Brestic, M. Transient Heat Waves May Affect the Photosynthetic Capacity of Susceptible Wheat Genotypes Due to Insufficient Photosystem I Photoprotection. Plants 2019, 8, 282. [Google Scholar] [CrossRef] [PubMed] [Green Version]
- Nickelsen, J.; Rengstl, B. Photosystem II Assembly: From Cyanobacteria to Plants. Annu. Rev. Plant Biol. 2013, 64, 609–635. [Google Scholar] [CrossRef] [Green Version]
- Järvi, S.; Suorsa, M.; Aro, E.M. Photosystem II repair in plant chloroplasts: Regulation, assisting proteins and shared components with photosystem II biogenesis. Biochim. Biophys. Acta Bioenerg. 2015, 1847, 900–909. [Google Scholar] [CrossRef] [PubMed] [Green Version]
- Combes, M.C.; Cenci, A.; Baraille, H.; Bertrand, B.; Lashermes, P. Homeologous Gene Expression in Response to Growing Temperature in a Recent Allopolyploid (Coffea Arabica L.). J. Hered. 2011, 103, 36–46. [Google Scholar] [CrossRef] [PubMed] [Green Version]
- Ramalho, J.C.; Campos, P.S.; Teixeira, M.; Nunes, M. Nitrogen dependent changes in antioxidant system and in fatty acid composition of chloroplast membranes from Coffea arabica L. plants submitted to high irradiance. Plant Sci. 1998, 135, 115–124. [Google Scholar] [CrossRef]
- Fortunato, A.S.; Lidon, F.C.; Batista-Santos, P.; Leitão, A.E.; Pais, I.P.; Ribeiro, A.I.; Ramalho, J.C. Biochemical and molecular characterization of the antioxidative system of Coffea sp. under cold conditions in genotypes with contrasting tolerance. J. Plant Physiol. 2010, 167, 333–342. [Google Scholar] [CrossRef] [PubMed]
- Sdiri, S.; Rambla, J.L.; Besada, C.; Granell, A.; Salvador, A. Changes in the volatile profile of citrus fruit submitted to postharvest degreening treatment. Postharvest Biol. Technol. 2017, 133, 48–56. [Google Scholar] [CrossRef]
- Scotti-Campos, P.; Pais, I.P.; Ribeiro-Barros, A.I.; Martins, L.D.; Tomaz, M.A.; Rodrigues, W.P.; Campostrini, E.; Semedo, J.N.; Fortunato, A.S.; Martins, M.Q.; et al. Lipid profile adjustments may contribute to warming acclimation and to heat impact mitigation by elevated [CO2] in Coffea spp. Environ. Exp. Bot. 2019, 167, 103856. [Google Scholar] [CrossRef]
- Moat, J.; Gole, T.W.; Davis, A.P. Least concern to endangered: Applying climate change projections profoundly influences the extinction risk assessment for wild Arabica coffee. Glob. Chang. Biol. 2018, 25, 390–403. [Google Scholar] [CrossRef] [Green Version]
- Vieira, A.; Silva, D.N.; Várzea, V.; Paulo, O.S.; Batista, D. Genome-Wide Signatures of Selection in Colletotrichum kahawae Reveal Candidate Genes Potentially Involved in Pathogenicity and Aggressiveness. Front. Microbiol. 2019, 10, 1374. [Google Scholar] [CrossRef] [PubMed]
- Zullo, J., Jr.; Pinto, H.S.; Assad, E.D.; Ávila, A.M.H. Potential for growing Arabica coffee in the extreme south of Brazil in a warmer world. Clim. Chang. 2011, 109, 535–548. [Google Scholar] [CrossRef]
- Magrach, A.; Ghazoul, J. Climate and Pest-Driven Geographic Shifts in Global Coffee Production: Implications for Forest Cover, Biodiversity and Carbon Storage. PLoS ONE 2015, 10, e0133071. [Google Scholar] [CrossRef]
- Davis, A.P.; Chadburn, H.; Moat, J.; O’Sullivan, R.; Hargreaves, S.; Nic Lughadha, E. High extinction risk for wild coffee species and implications for coffee sector sustainability. Sci. Adv. 2019, 5, eaav3473. [Google Scholar] [CrossRef] [PubMed] [Green Version]
- Ramalho, J.C.; Fortunato, A.S.; Goulão, L.; Lidon, F.C. Cold-induced changes in mineral content in leaves of Coffea spp. Identification of descriptors for tolerance assessment. Biol. Plant. 2013, 57, 495–506. [Google Scholar] [CrossRef]
- Andrews, S. FastQC: A Quality Control Tool for High Throughput Sequence Data. 2010. Available online: http://www.bioinformatics.babraham.ac.uk/projects/fastqc (accessed on 15 June 2020).
- Bolger, A.M.; Lohse, M.; Usadel, B. Trimmomatic: A flexible trimmer for Illumina sequence data. Bioinformatics 2014, 30, 2114–2120. [Google Scholar] [CrossRef] [Green Version]
- Wingett, S.W.; Andrews, S. FastQ Screen: A tool for multi-genome mapping and quality control. F1000Research 2018, 7, 1338. [Google Scholar] [CrossRef]
- Denoeud, F.; Carretero-Paulet, L.; Dereeper, A.; Droc, G.; Guyot, R.; Pietrella, M.; Zheng, C.; Alberti, A.; Anthony, F.; Aprea, G.; et al. The coffee genome provides insight into the convergent evolution of caffeine biosynthesis. Science 2014, 345, 1181–1184. [Google Scholar] [CrossRef] [Green Version]
- Dobin, A.; Davis, C.A.; Schlesinger, F.; Drenkow, J.; Zaleski, C.; Jha, S.; Batut, P.; Chaisson, M.; Gingeras, T.R. STAR: Ultrafast universal RNA-seq aligner. Bioinformatics 2013, 29, 15–21. [Google Scholar] [CrossRef] [PubMed]
- Anders, S.; Pyl, P.T.; Huber, W. HTSeq: A Python framework to work with high-throughput sequencing data. Bioinformatics 2015, 31, 166–169. [Google Scholar] [CrossRef] [PubMed]
- Li, H.; Handsaker, B.; Wysoker, A.; Fennell, T.; Ruan, J.; Homer, N.; Marth, G.; Abecasis, G.; Durbin, R. 1000 genome project data processing subgroup. The sequence alignment/map (SAM) format and SAMtools. Bioinformatics 2009, 25, 2078–2079. [Google Scholar] [CrossRef] [Green Version]
- Pertea, G. GFF/GTF Utility Providing Format Conversions, Region Filtering, FASTA Sequence Extraction and more. 2015. Available online: https://github.com/gpertea/gffread (accessed on 24 November 2019).
- Love, M.I.; Huber, W.; Anders, S. Moderated estimation of fold change and dispersion for RNA-seq data with DESeq2. Genome Biol. 2014, 15, 550. [Google Scholar] [CrossRef] [PubMed] [Green Version]
- Robinson, M.D.; McCarthy, D.J.; Smyth, G.K. edgeR: A Bioconductor package for differential expression analysis of digital gene expression data. Bioinformatics 2009, 26, 139–140. [Google Scholar] [CrossRef] [Green Version]
- Benjamini, Y.; Hochberg, Y. On the Adaptive Control of the False Discovery Rate in Multiple Testing with Independent Statistics. J. Educ. Behav. Stat. 2000, 25, 60–83. [Google Scholar] [CrossRef] [Green Version]
- Hunter, J.D. Matplotlib: A 2D Graphics Environment. Comput. Sci. Eng. 2007, 9, 90–95. [Google Scholar] [CrossRef]
- R Core Team. R: A Language and Environment for Statistical Computing; R Foundation for Statistical Computing: Vienna, Austria, 2018. [Google Scholar]
- Raudvere, U.; Kolberg, L.; Kuzmin, I.; Arak, T.; Adler, P.; Peterson, H.; Vilo, J. g:Profiler: A web server for functional enrichment analysis and conversions of gene lists (2019 update). Nucleic Acids Res. 2019, 47, W191–W198. [Google Scholar] [CrossRef] [PubMed] [Green Version]
- Supek, F.; Bošnjak, M.; Škunca, N.; Šmuc, T. REVIGO Summarizes and Visualizes Long Lists of Gene Ontology Terms. PLOS ONE 2011, 6, e21800. [Google Scholar] [CrossRef] [PubMed] [Green Version]
- Wickham, H. Elegant Graphics for Data Analysis; Springer International Publishing: New York, NY, USA, 2016. [Google Scholar]


Publisher’s Note: MDPI stays neutral with regard to jurisdictional claims in published maps and institutional affiliations. |
© 2021 by the authors. Licensee MDPI, Basel, Switzerland. This article is an open access article distributed under the terms and conditions of the Creative Commons Attribution (CC BY) license (http://creativecommons.org/licenses/by/4.0/).
Share and Cite
Marques, I.; Fernandes, I.; Paulo, O.S.; Lidon, F.C.; DaMatta, F.M.; Ramalho, J.C.; Ribeiro-Barros, A.I. A Transcriptomic Approach to Understanding the Combined Impacts of Supra-Optimal Temperatures and CO2 Revealed Different Responses in the Polyploid Coffea arabica and Its Diploid Progenitor C. canephora. Int. J. Mol. Sci. 2021, 22, 3125. https://doi.org/10.3390/ijms22063125
Marques I, Fernandes I, Paulo OS, Lidon FC, DaMatta FM, Ramalho JC, Ribeiro-Barros AI. A Transcriptomic Approach to Understanding the Combined Impacts of Supra-Optimal Temperatures and CO2 Revealed Different Responses in the Polyploid Coffea arabica and Its Diploid Progenitor C. canephora. International Journal of Molecular Sciences. 2021; 22(6):3125. https://doi.org/10.3390/ijms22063125
Chicago/Turabian StyleMarques, Isabel, Isabel Fernandes, Octávio S. Paulo, Fernando C. Lidon, Fábio M. DaMatta, José C. Ramalho, and Ana I. Ribeiro-Barros. 2021. "A Transcriptomic Approach to Understanding the Combined Impacts of Supra-Optimal Temperatures and CO2 Revealed Different Responses in the Polyploid Coffea arabica and Its Diploid Progenitor C. canephora" International Journal of Molecular Sciences 22, no. 6: 3125. https://doi.org/10.3390/ijms22063125