Article

UDP-GLYCOSYLTRANSFERASE 72E3 Plays a Role in Lignification of Secondary Cell Walls in Arabidopsis

1
University Lille, CNRS, UMR 8576, Unité de Glycobiologie Structurale et Fonctionnelle (UGSF), F-59000 Lille, France
2
College La Cité, Technology Access Center in Bio-Innovation (TAC-B), Ottawa, ON K1K4R3, Canada
3
University Lille, CNRS, Inserm, CHU Lille, Institut Pasteur de Lille, US 41, UMS 2014, PLBS, F-59000 Lille, France
4
University Lille, CNRS, UMR 8516, LASIR, Infrared and Raman Spectroscopy Laboratory, F-59000 Lille, France
5
Laboratoire de Biotechnologie Végétale (LBV), Université Libre de Bruxelles, B-6041 Gosselies, Belgium
*
Author to whom correspondence should be addressed.
Int. J. Mol. Sci. 2020, 21(17), 6094; https://doi.org/10.3390/ijms21176094
Submission received: 29 June 2020 / Revised: 20 August 2020 / Accepted: 21 August 2020 / Published: 24 August 2020

Abstract

:
Lignin is present in plant secondary cell walls and is among the most abundant biological polymers on Earth. In this work we investigated the potential role of the UGT72E gene family in regulating lignification in Arabidopsis. Chemical determination of floral stem lignin contents in ugt72e1, ugt72e2, and ugt72e3 mutants revealed no significant differences compared to WT plants. In contrast, the use of a novel safranin O ratiometric imaging technique indicated a significant increase in the cell wall lignin content of both interfascicular fibers and xylem from young regions of ugt72e3 mutant floral stems. These results were globally confirmed in interfascicular fibers by Raman microspectroscopy. Subsequent investigation using a bioorthogonal triple labelling strategy suggested that the augmentation in lignification was associated with an increased capacity of mutant cell walls to incorporate H-, G-, and S-monolignol reporters. Expression analysis showed that this increase was associated with an up-regulation of LAC17 and PRX71, which play a key role in lignin polymerization. Altogether, these results suggest that UGT72E3 can influence the kinetics of lignin deposition by regulating monolignol flow to the cell wall as well as the potential of this compartment to incorporate monomers into the growing lignin polymer.

1. Introduction

Lignin is a major structural component of many plant cell walls. The appearance of this polymer is associated with terrestrialization since it is responsible for the mechanical support, essential for upright growth, but also for providing a hydrophobic environment to the cells specialized in the conduction of water [1]. As well as playing a central role in the biology of vascular plants, lignin also has a major impact on the quality of a wide range of economically important products derived from plant lignocellulosic biomass [2]. The composition of the lignin polymer can be very complex but the major constituents derive from the oxidative coupling of three p-hydroxycinnamyl alcohols (monolignols), p-coumaryl, coniferyl and sinapyl alcohols, differing in their degree of methoxylation. After incorporation into the lignin polymer, these monomers give rise to p-hydroxyphenyl (H), guaiacyl (G), and syringyl (S) units respectively [3]. Beyond these traditional monolignols, the polymer can also include other phenylpropanoids [4,5] including caffeyl alcohol in specific cactus and orchid species [6,7], tricin flavonoids and ferulates in grasses [8,9] or hydroxystilbenes in palm fruit [10].
Given [11] the importance of the lignin polymer for both the plant and for the economy, scientists have long investigated how plants synthesize monolignols and regulate lignin levels in the cell wall. The monolignol biosynthesis pathway starts with phenylalanine and/or tyrosine (derived from the shikimate pathway) that are used as initial substrates [1]. These are then processed through a series of enzymatic activities leading to the deamination, reduction, hydroxylation, and O-methylation of the intermediates in the cytoplasm [1,12]. The genes encoding the corresponding enzymes are mostly part of multigenic families with variable sizes and whose members may have redundant functions or not. In addition to their role in monolignol production, different enzymes can be specialized in the production of many different phenylpropanoids including flavonoids, stilbenes, coumarins, phenylpropenes, or hydroxycinnamic acids [13]. Experiments have shown that both lignin levels and chemical composition are modified by engineered changes in the expression of different genes involved in monolignol biosynthesis leading to the redirection of the carbon flux into another biosynthetically related compound or group of compounds (reviewed in [14]).
Following monolignol biosynthesis, the different lignin precursors are exported to the cell wall by mechanisms that still remain unclear. To some extent, ATP-binding cassette (ABC) transporter families seem to be involved in the transport through the plasma membrane. This was suggested by the demonstration that p-coumaryl alcohol membrane transport was induced via the heterologous expression of ABCG29 in yeast [15], as well as by the observation that several ABCG genes are co-regulated with cell wall associated genes [16]. However, the weak effect of the mutation of the corresponding genes suggests not only that strong redundancies may exist between the transporter genes, but also that alternative routes allowing monolignols to reach the apoplast could exist. The hypothesis of a transport by simple diffusion or diffusion facilitated by channels in the plasma membrane is now also considered [17,18]. This mechanism offers the advantage that it is compatible with the fact that a variety of molecules can be incorporated into the lignin polymer including oligomers formed by combinatorial coupling of monolignol radicals present within the cytoplasm [11].
Instead of being transported to the cell wall for polymerization, monolignols can be glycosylated by uridine diphosphate glycosyltransferases (UGT; E.C. 2.4.1.x) on the C4 phenolic hydroxyl group thereby forming p-coumaryl alcohol glucoside, coniferin and syringin from p-coumaryl-, coniferyl- and sinapyl- alcohols, respectively. In a more general way, most of the intermediates of the lignin biosynthetic pathway including acids, aldehydes and alcohols can also be glycosylated by UGTs. In Arabidopsis thaliana, these activities were associated to the UGT72B and UGT72E families [19]
The possibility that monolignol glucosides may represent a storage form of precursors for subsequent lignification remains a matter of debate since coniferin and syringin and to a lesser extent p-coumaryl alcohol glucoside, were detected in high amounts in the cambial sap of differentiating xylem of Picea excelsa [20]. Since then, coniferin has been detected during the growth period in a number of gymnosperm genus including Picea, Pinus, Chamaecyparis, Cryptomeria, and Larix [21,22,23,24,25]. The synchronized timing of coniferin production and lignin synthesis in the differentiating xylem could suggest that this glucoside may—in some cases—be a lignin precursor. In contrast to gymnosperms, the amount of coniferin in the differentiating xylem of angiosperms is very limited. A comparative study of monolignol glucosides in Syringa vulgaris and Larix leptolepis revealed important differences in tissue distribution, patterns and amounts, suggesting that these molecules may play different physiological roles in both angiosperms and gymnosperms [21]. Similarly, a comparison between Japanese cypress (Chamaecyparis obtusa) and a hybrid poplar (Populus sieboldii X P. grandidentata) also highlighted higher amounts of coniferin in the gymnosperm [24]. In a recent study, metabolic profiling of Arabidopsis thaliana leaf vacuoles revealed the presence of glycosylated mono-/oligolignols in this compartment [11]. In this latter case, it is difficult to make a link between leaf storage and lignification although whether these molecules can be further transported through the phloem towards other parts of the plant remains an open question.
When considering these different data, the regulatory role of the glycosylation on the availability of lignin precursors and more generally on the lignification process still remains unclear and deserves further investigation. Indeed, UGTs have been mentioned as actors of lignification [26,27] but to date, there are only very few experimental data supporting this hypothesis. In tobacco, the ectopic expression of a Populus tomentosa UGT gene controlled by the CaMV35S promoter increased the amounts of Klason lignin by approximately 60% [28]. This unexpected result showed that UGTs may have indirect effect on lignin deposition. In more recent studies, the Arabidopsis UGT72B1 gene was knocked-out, leading to an ectopic lignification phenotype [29] that was more consistent with the hypothesis of a role played by UGTs in the aglycone lignin precursor homeostasis.
In this work, we investigated the role of the 3 UGT72E family members in the regulation of lignification in Arabidopsis thaliana. We first showed that the expression of UGT72E3 is independent of that of the 2 others and that the dynamics of lignin deposition in the corresponding mutant was modified compared to the WT. This was assessed by Raman microspectroscopy and a histological ratiometric approach. We then evaluated the cell wall capacity to integrate monolignols with a bioorthogonal reporter incorporation technique and clearly showed that it was increased in the ugt72e3 mutant and associated with peroxidase and laccase gene upregulation.

2. Results

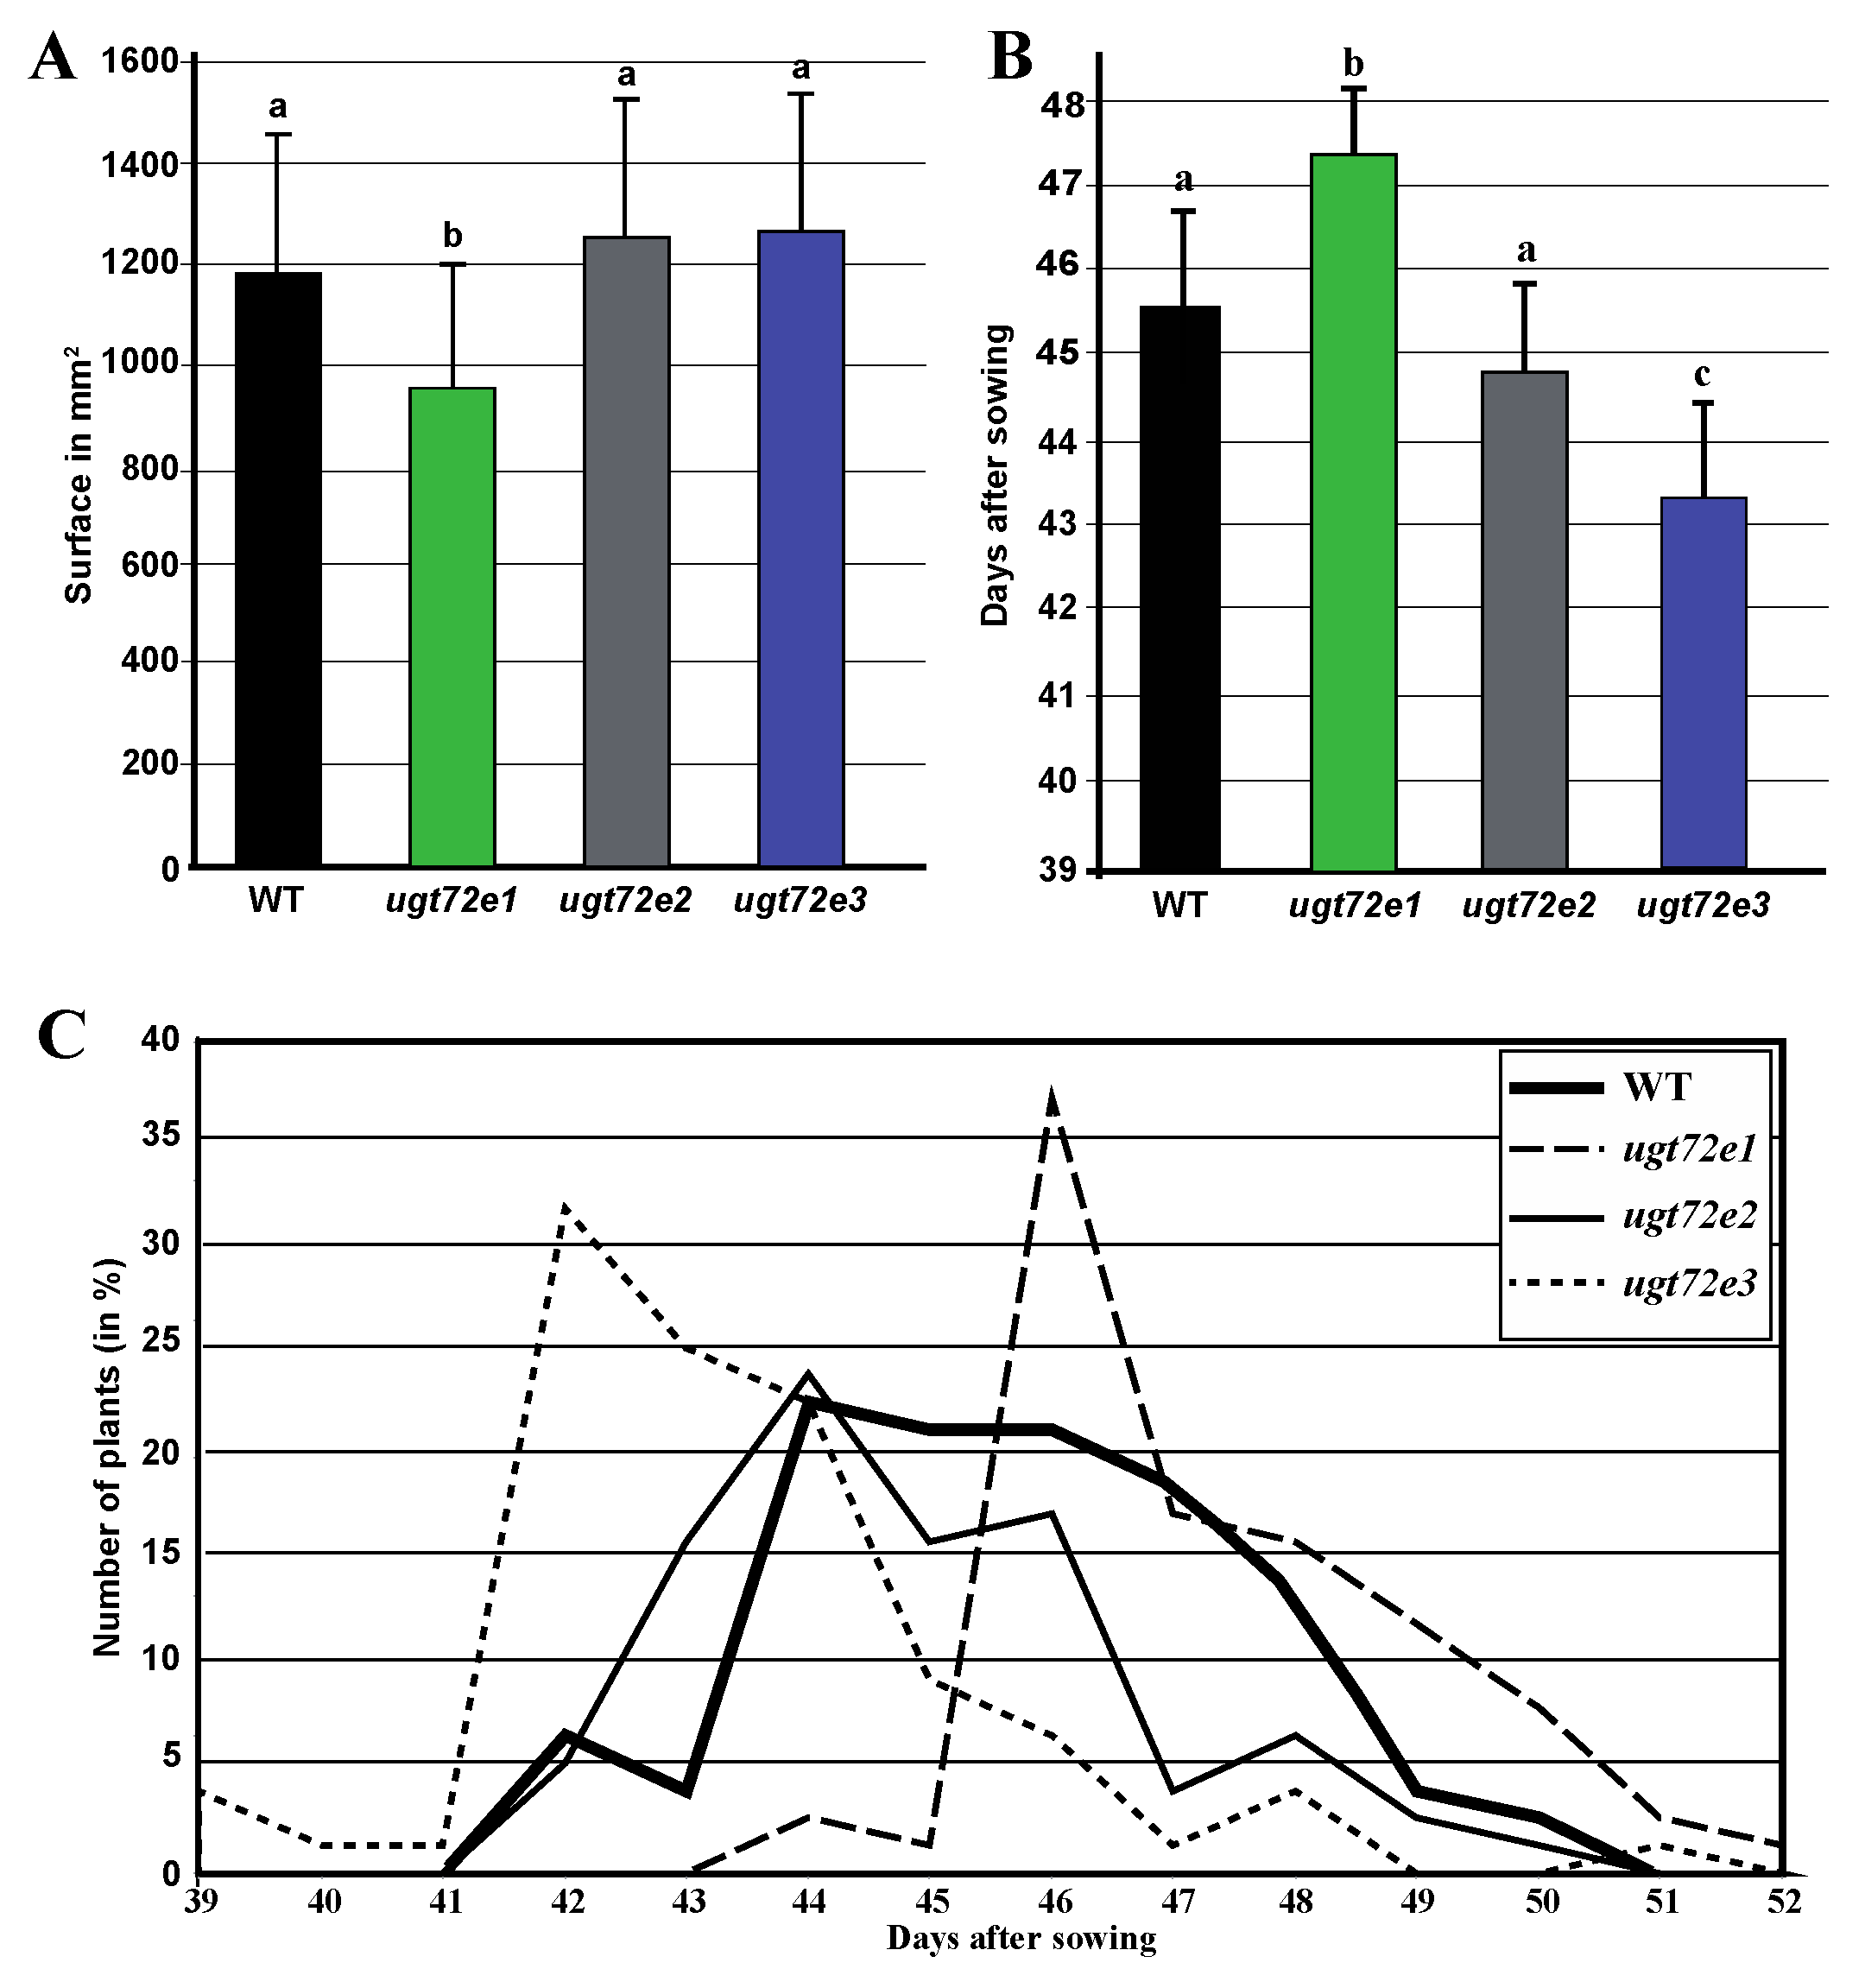
2.1. Impact of UGT72E Mutations on Plant Growth

To obtain information about the biological role of the different UGT72E genes, the corresponding insertion mutants were investigated for modified phenotypic characters. Although no marked phenotype was visible, specific measurements of the rosette surface of 28-day-old plants (corresponding to the 3.20–3.50 stage [30]) revealed a slight but significant reduction in rosette area for ugt72e1, but not for ugt72e2 and ugt72e3 mutants when compared to WT plants (Figure 1A) suggesting a possible negative effect of the ugt72e1 mutation on vegetative growth. Phenotypic differences were also observed at stage 5.1 corresponding to the emergence of the floral stem (Figure 1B). The number of days necessary to reach this stage was significantly increased in the ugt72e1 mutants, unchanged in ugt72e2 and decreased in ugt72e3 compared to WT plants. These differences were also reflected in the distribution of floral stem appearance times observed for the majority of plants within compared genotypes (Figure 1C). Both WT and ugt72e2 populations show a progressive flowering profile with a maximum at day 44 whereas the two other mutants exhibit a narrower flowering peak occurring either prior to WT (ugt72e3) or after (ugt72e1), followed by a rapid decline. Taken together these results would suggest that the knock-out of the UGT72E1 and UGT72E3 genes have a discrete but significant effect on plant development.

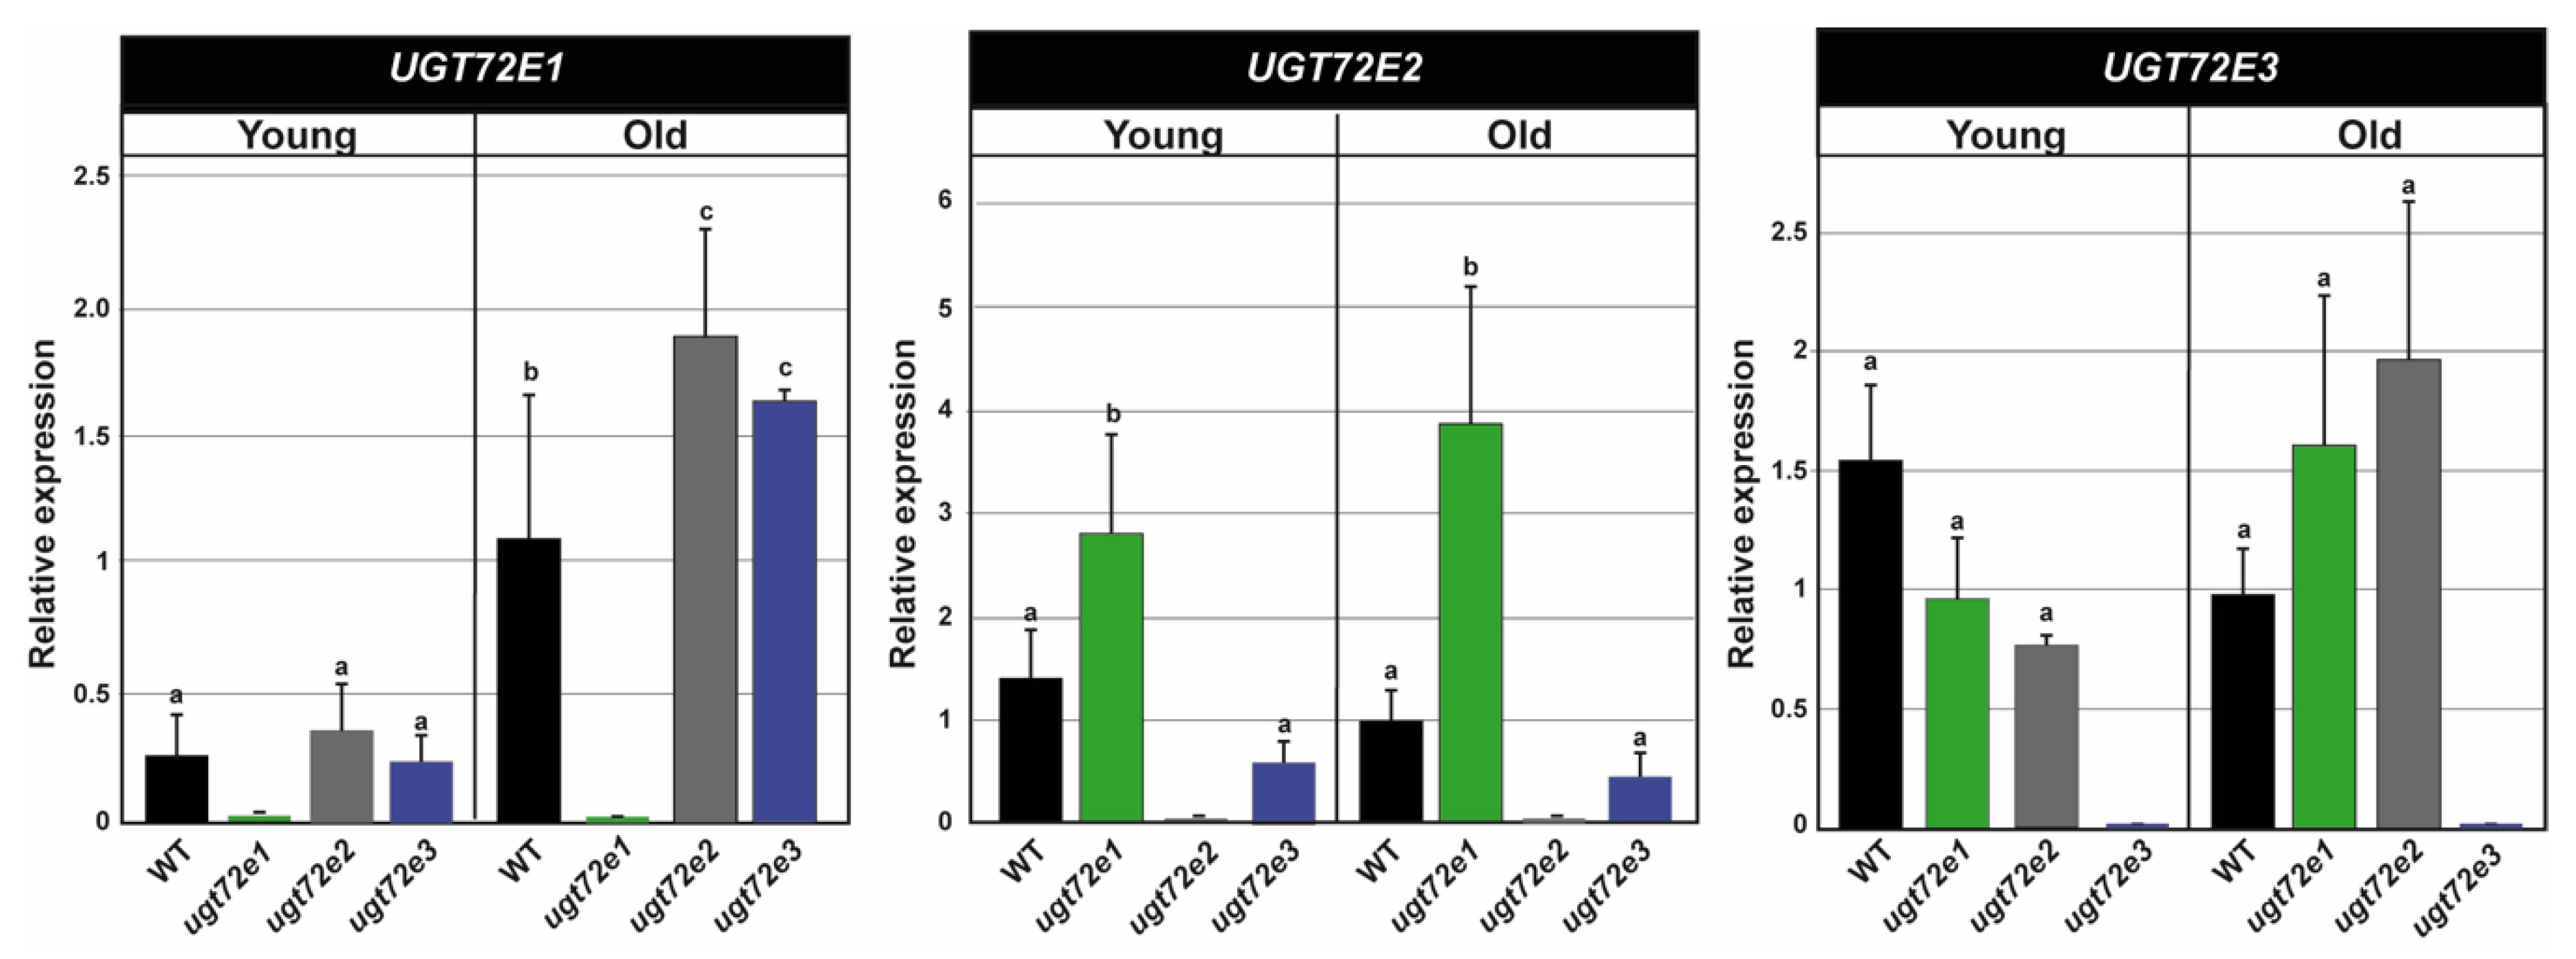
2.2. Expression of the UGT72E Genes in the WT and Mutant Floral Stems

To better understand the possible involvement of the UGT72E genes in floral stem development and to see whether the inactivation of one of the 3 genes may affect the expression of other UGT72E family members, expression analyses were performed on the top and bottom regions of this organ corresponding respectively to “young” and “old” tissues (Figure 2).
In WT floral stem tissues, all three genes were expressed albeit with different profiles. UGT72E1 was more highly expressed (approx. 4×) in old tissues compared to young tissues while the expression of UGT72E2 and UGT72E3 were similar in both stem regions. In the ugt72e2 and ugt72e3 mutants, UGT72E1 transcript accumulation was slightly but significantly increased in the old part, but not the young part of floral stems as compared to WT. In contrast the accumulation of UGT72E2 transcripts was only significantly increased in the ugt72e1 mutant (both young and old zones), but not ugt72e3 as compared to WT. Finally, no significant change in UGT72E3 transcript accumulation was observed (young and old zones) in ugt72e1 and ugt72e2 mutant tissues.

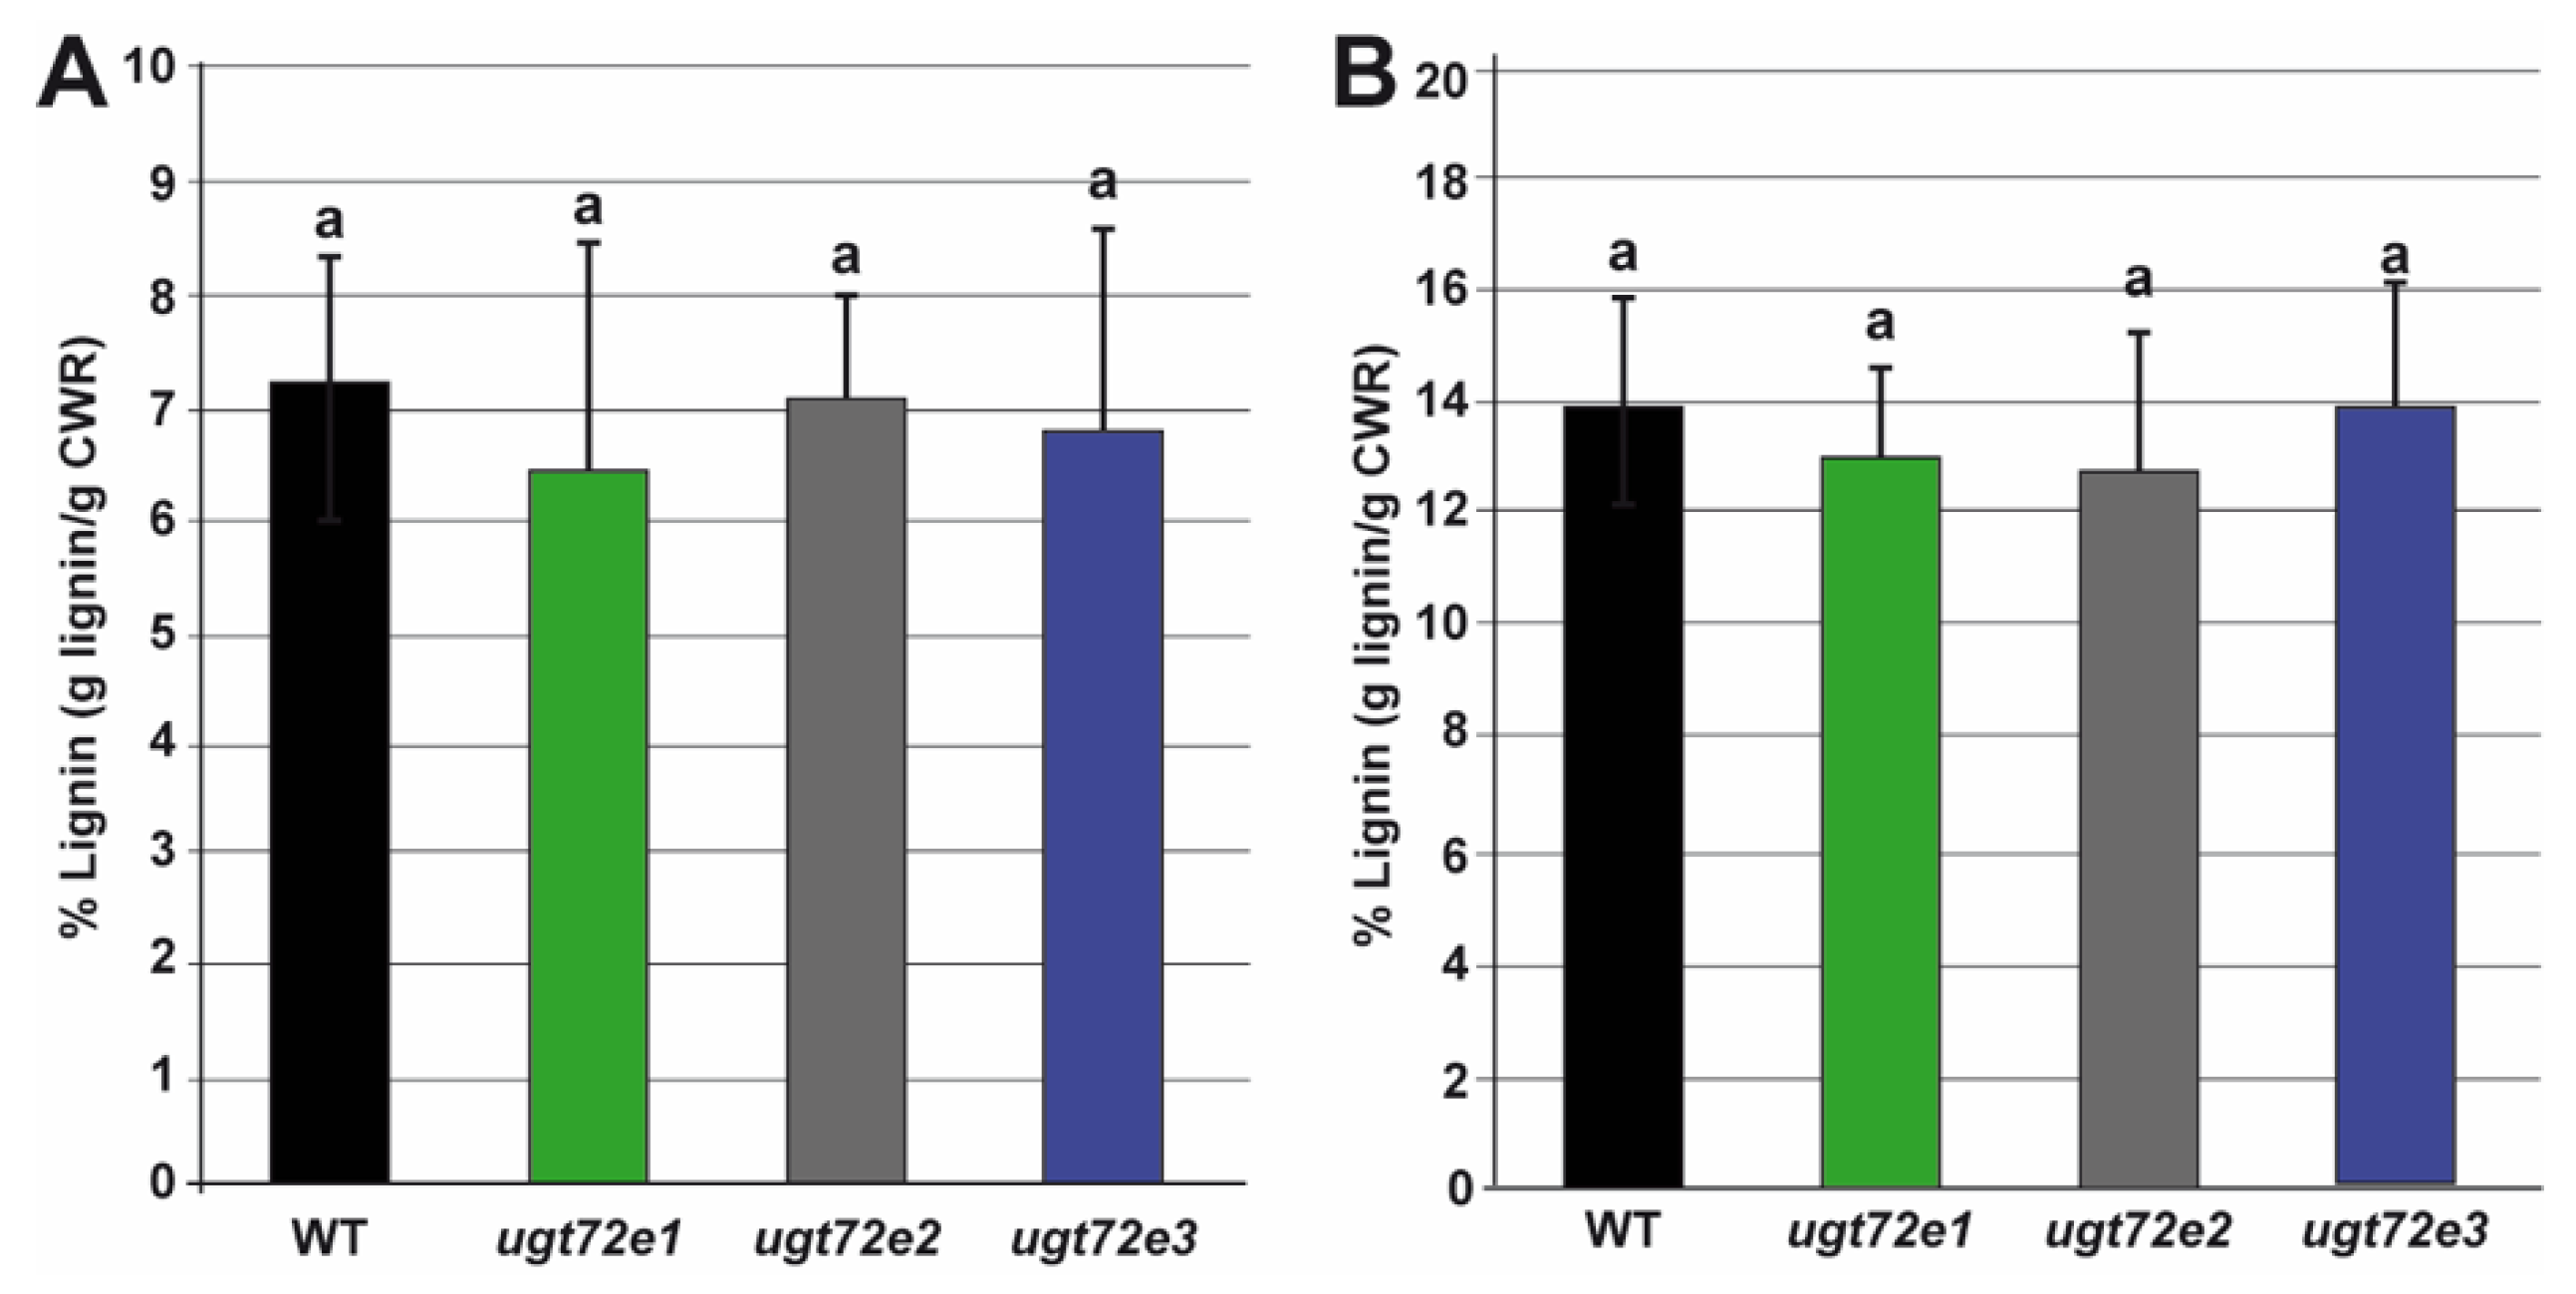
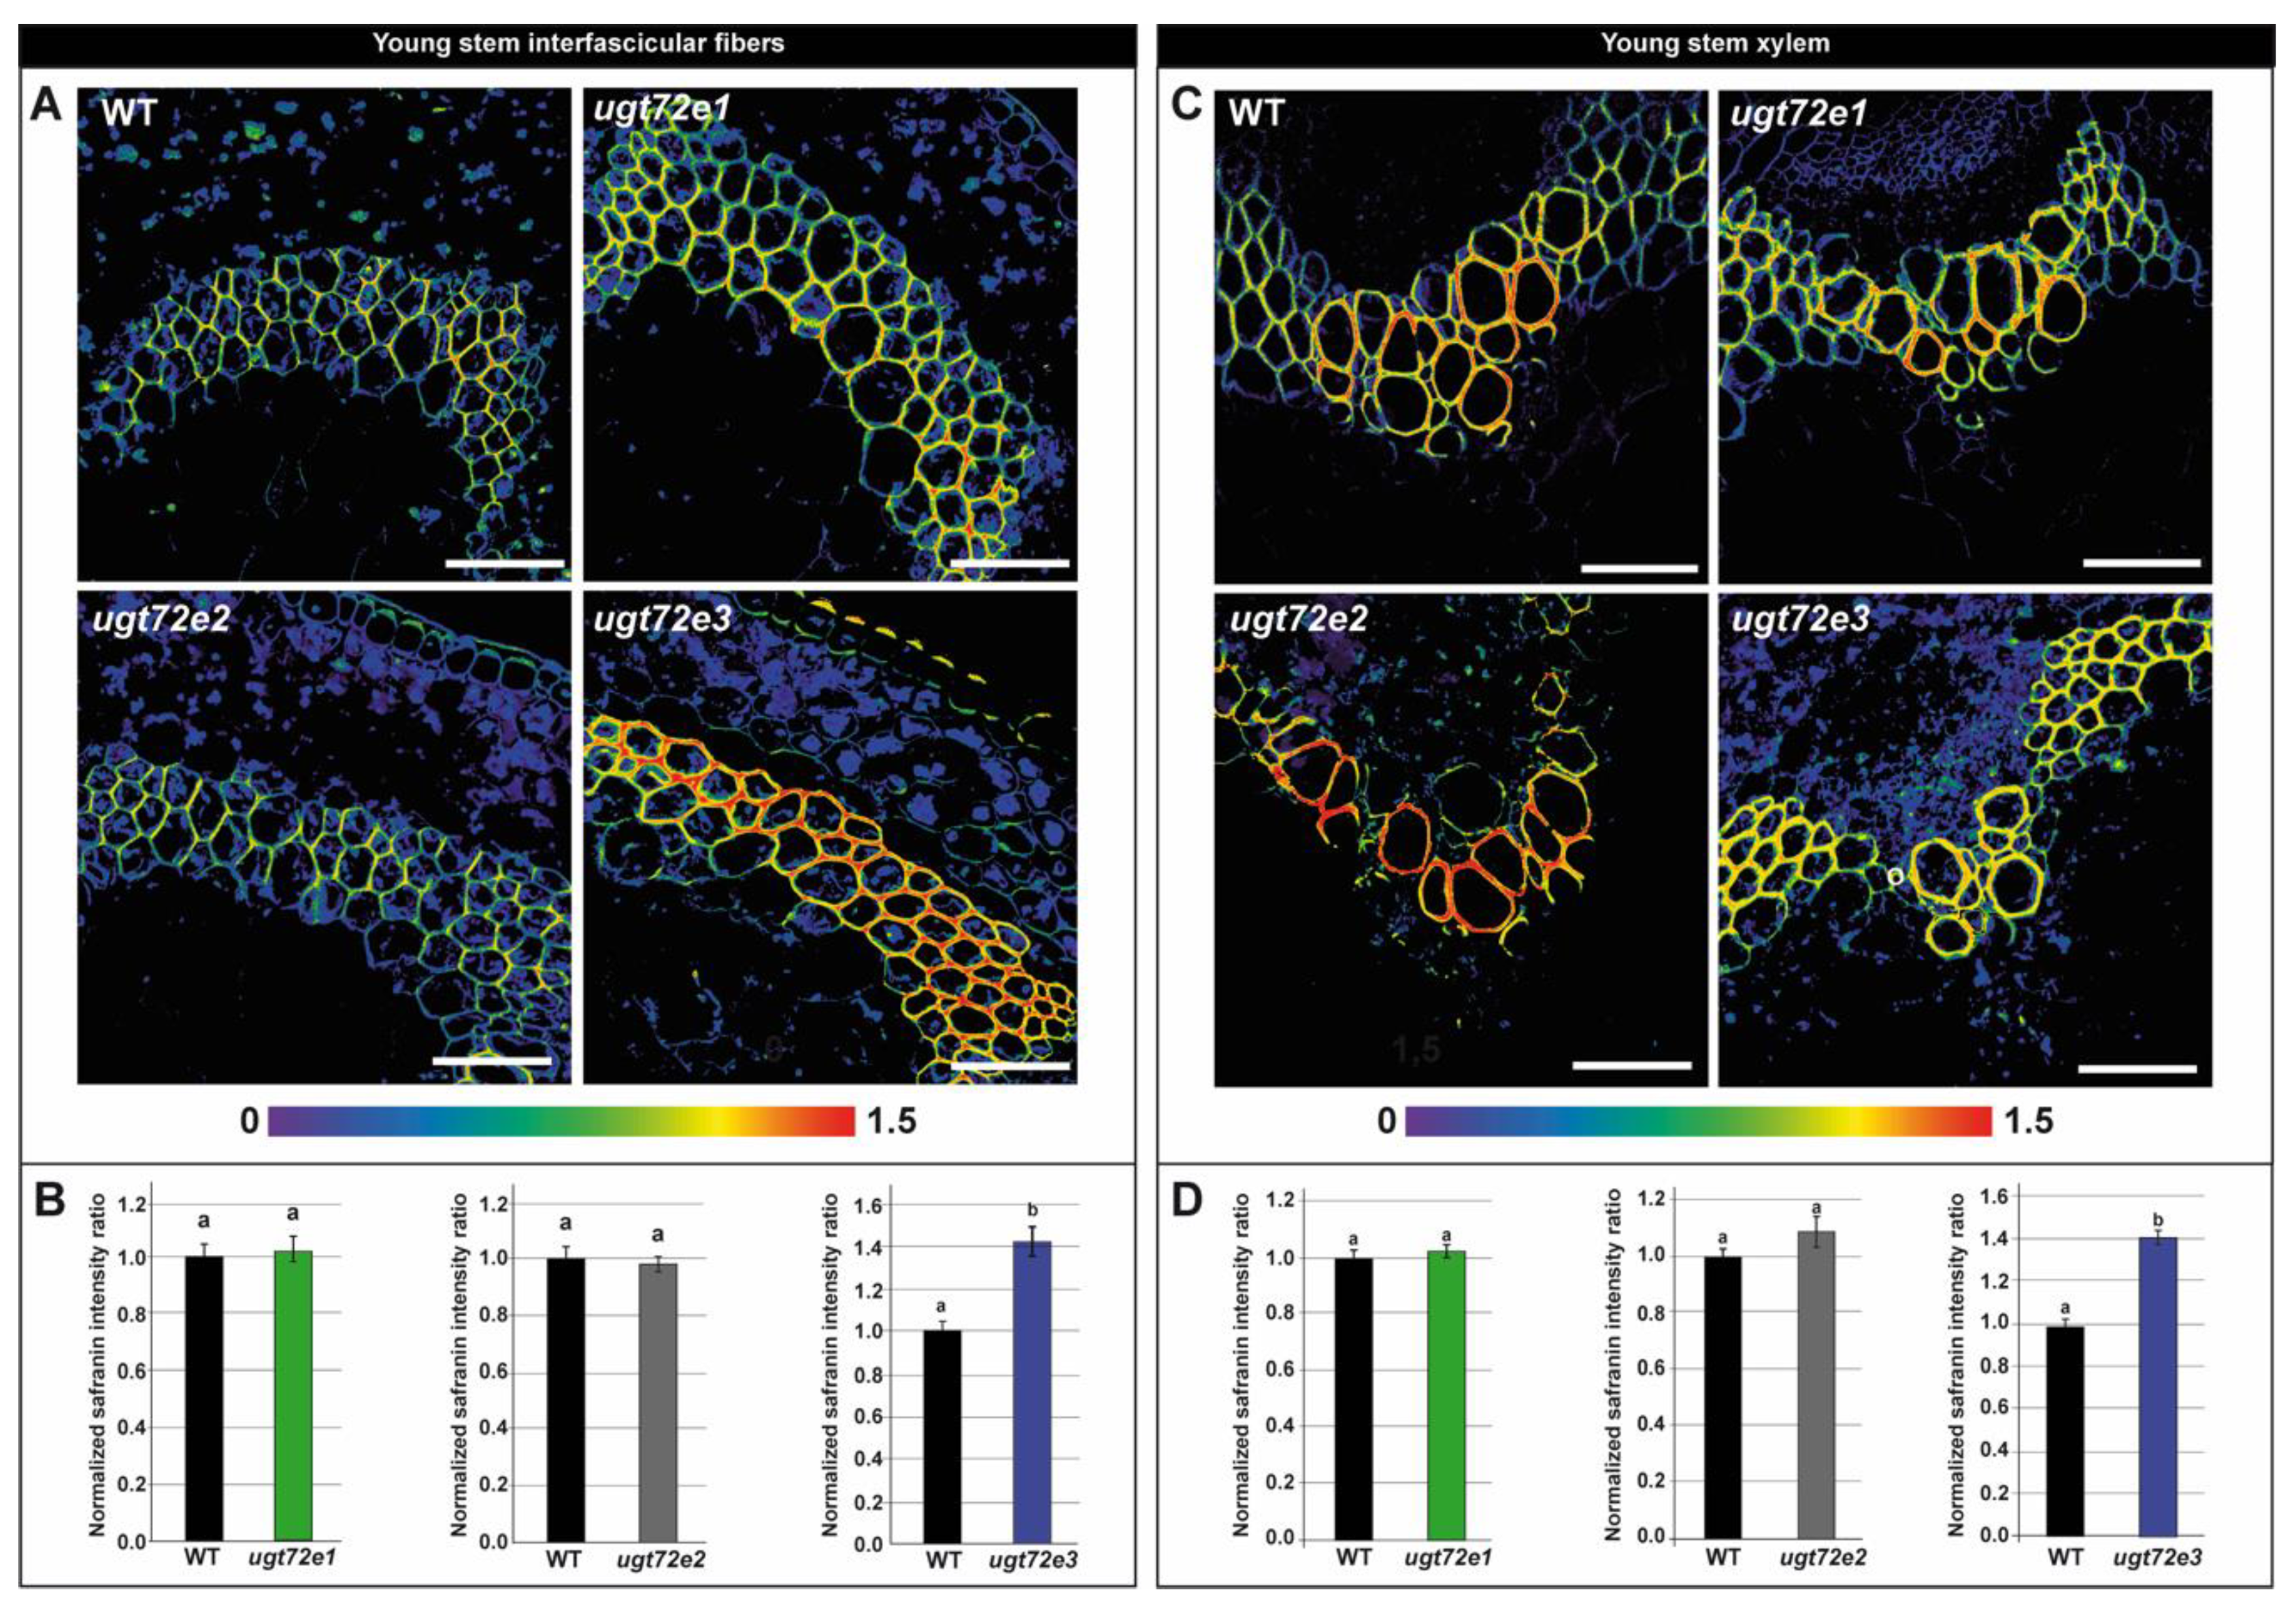
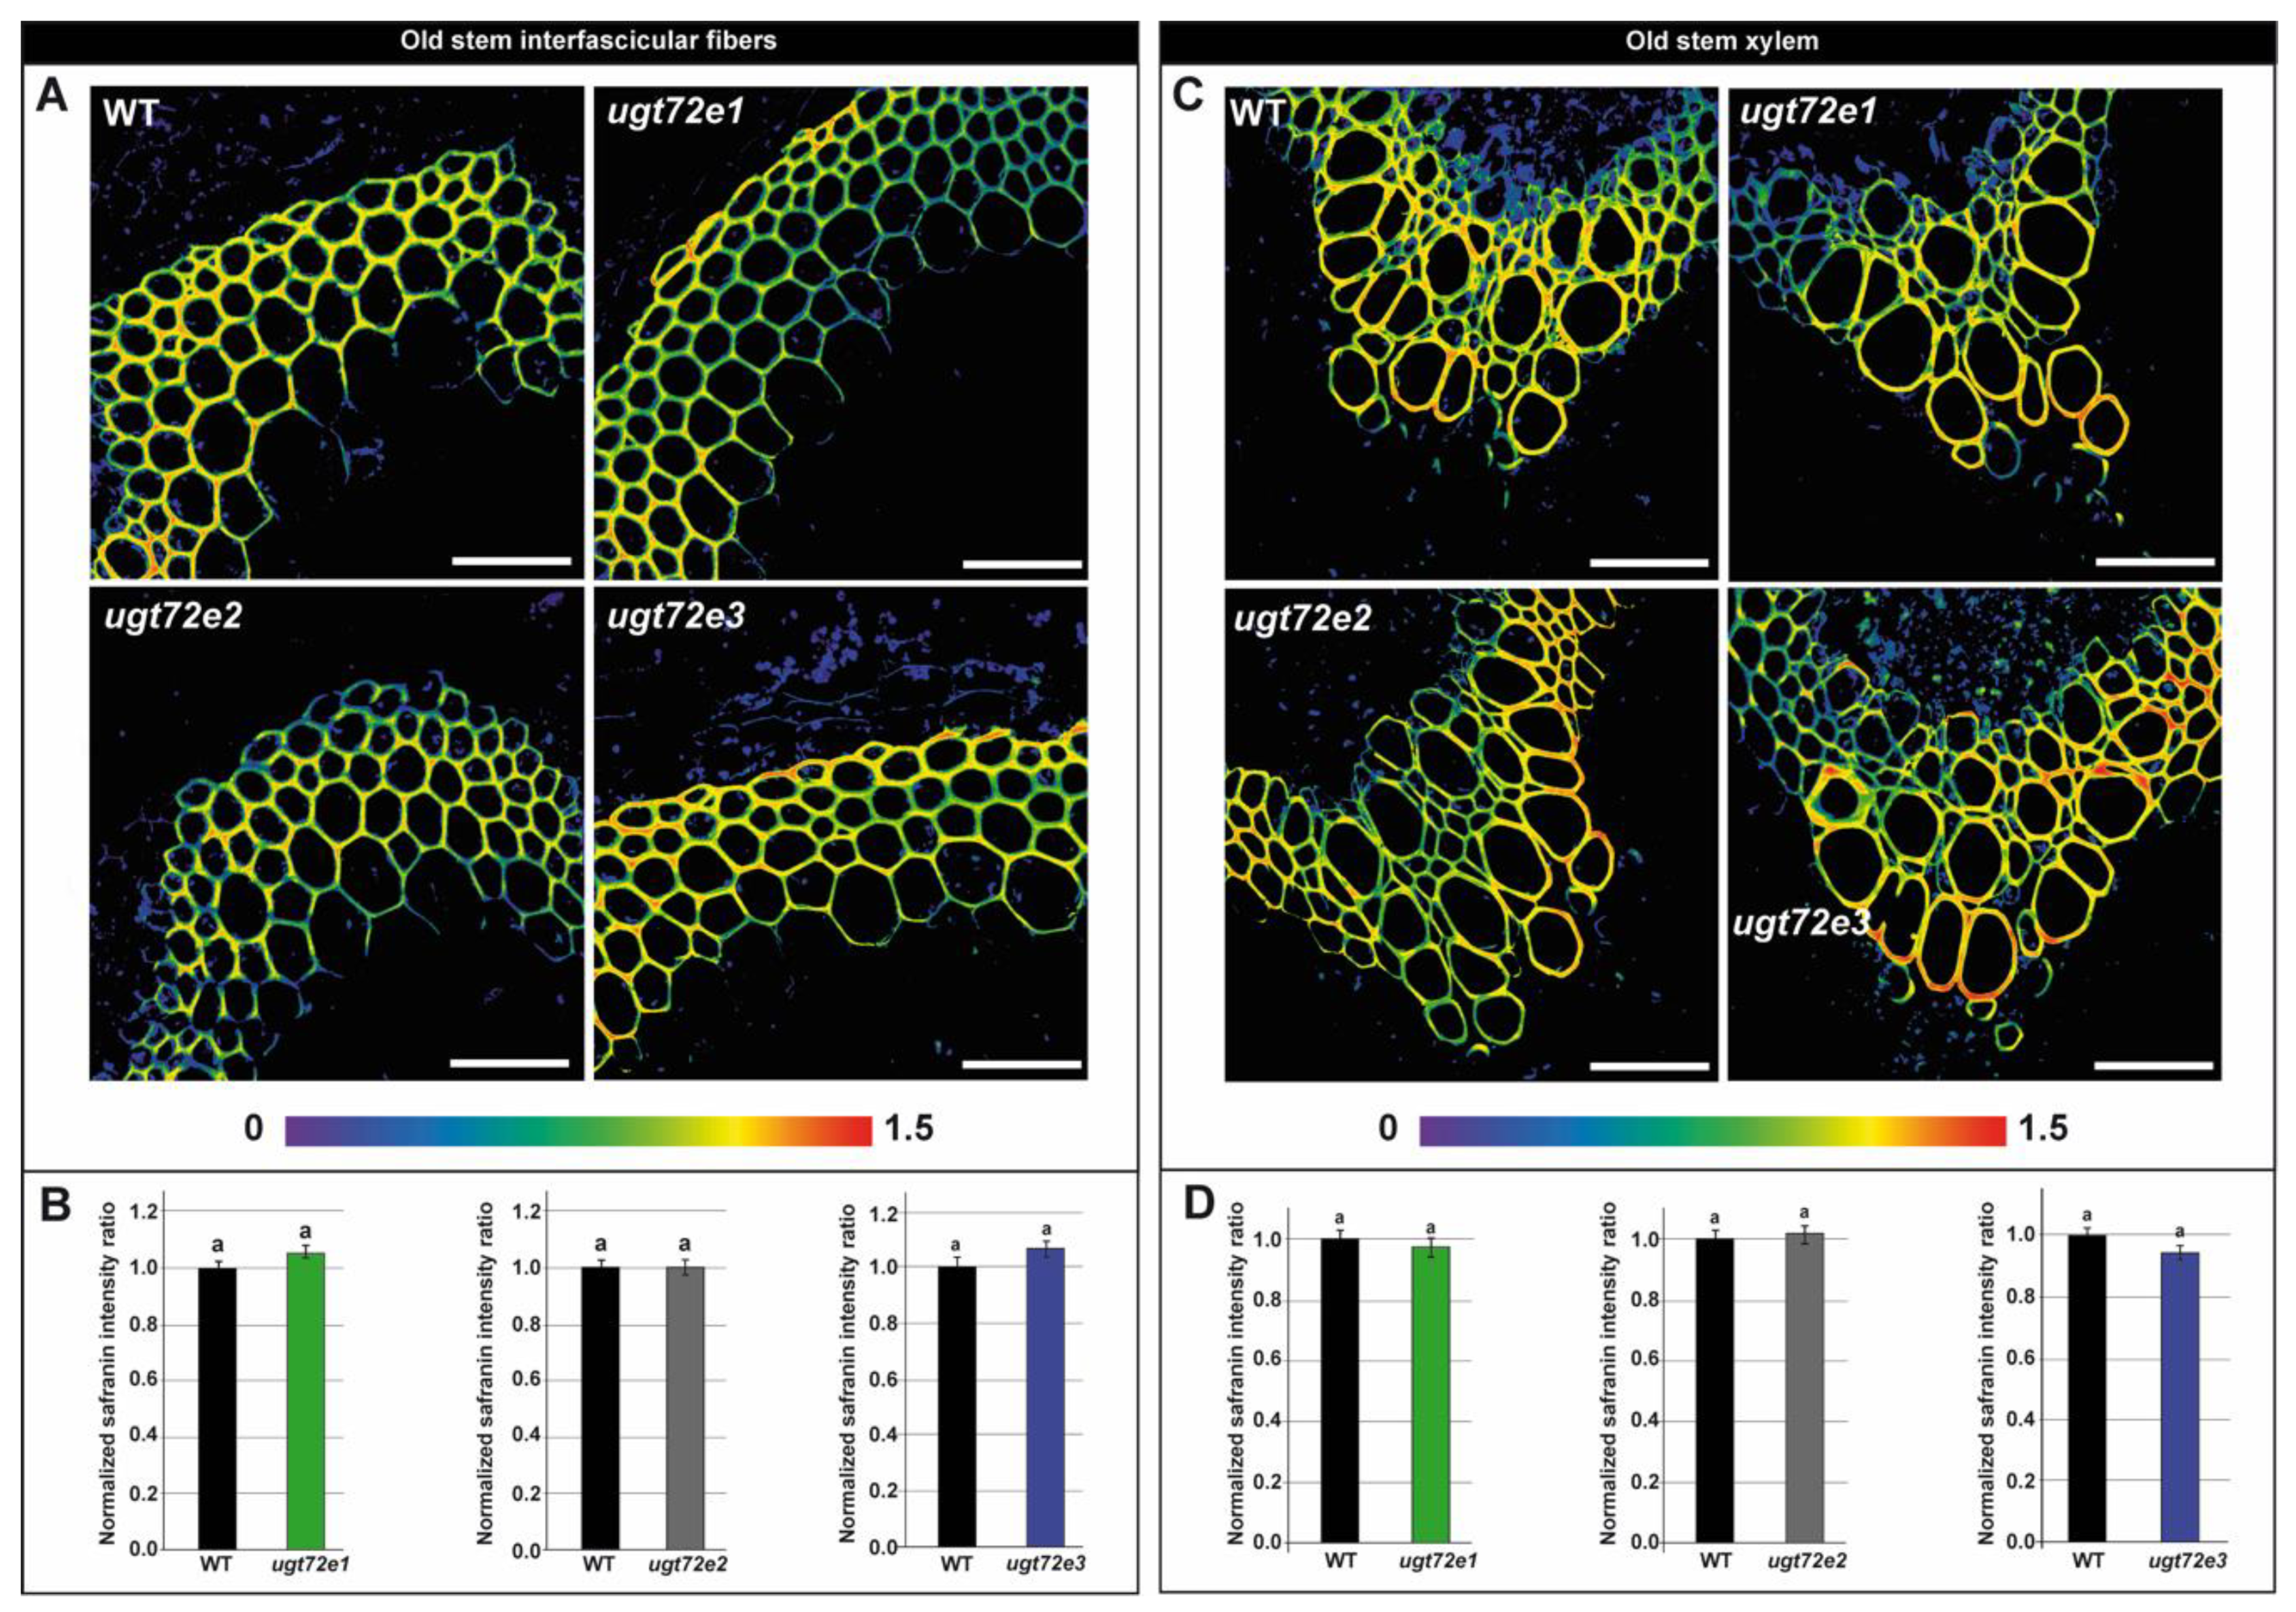
2.3. In Situ Analysis Reveals Increased Cell Wall Lignin Content Only in Ugt72e3 Mutant Stems

To see whether the inactivation of different UGT72E genes modified lignification, we used a dual approach consisting of (i) a global quantification by acetyl bromide and (ii) an evaluation of relative cellular lignin quantities by a histological ratiometric approach. In both cases, the analyses were performed on the young and old regions of 24 cm-high floral stems. When using the acetyl bromide procedure, no significant differences in lignin contents were observed between the different lines in both parts of the stems (Figure 3). The lignin amounts (g/g CWR) were roughly 2-fold higher in bottom stem fragments compared to the top ones whatever the genotype considered.
Since global wet chemistry measurements can mask subtle, but real changes in cell wall lignification, we used a histological approach based on our recent development of a quantitative in situ technique coupling fluorescent microscopy and safranin O staining [31]. There were no significant differences in the lignin content of both interfascicular fibers and xylem from young and old regions of the ugt72e1 and ugt72e2 mutant stems compared to the WT (Figure 4 and Figure 5). In contrast, the lignin content of the ugt72e3 mutant was significantly higher (approx. 40 %) in both tissues from the young part of the stems compared to WT stems. In the old part of the ugt72e3 stem, the lignin content was similar to the WT.
These results suggest the existence of a functional link between UGT72E3 gene expression (but not UGT72E1 or UGT72E2) and lignification. To confirm the specificity of the UGT72E3 gene mutation effect and evaluate a possible functional redundancy with UGT72E1 and UGT72E2, lignin was quantified in the double ugt72e1,2 mutant used as a control. Indeed, mutant complementation is often used to gain knowledge on the role of a particular gene, but has many disadvantages such as position effect of the T-DNA [32] carrying the non-mutated gene along with the variability of transgene expression by RNA sensing mechanisms [33] but also possible influences of environmental parameters [34].
We first showed that the expression level of UGT72E3 was the same as in the WT (Figure S1). Concerning lignin dosage, our results revealed no significant differences in floral stem lignin content between WT and ugt72e1,2 samples when evaluated by either the acetyl bromide method (Figure S2) or the safranin O technique (Figure S3). Taken together, these data demonstrate that the observed modifications in cell wall lignin content are most likely caused by UGT72E3 gene knock-out.

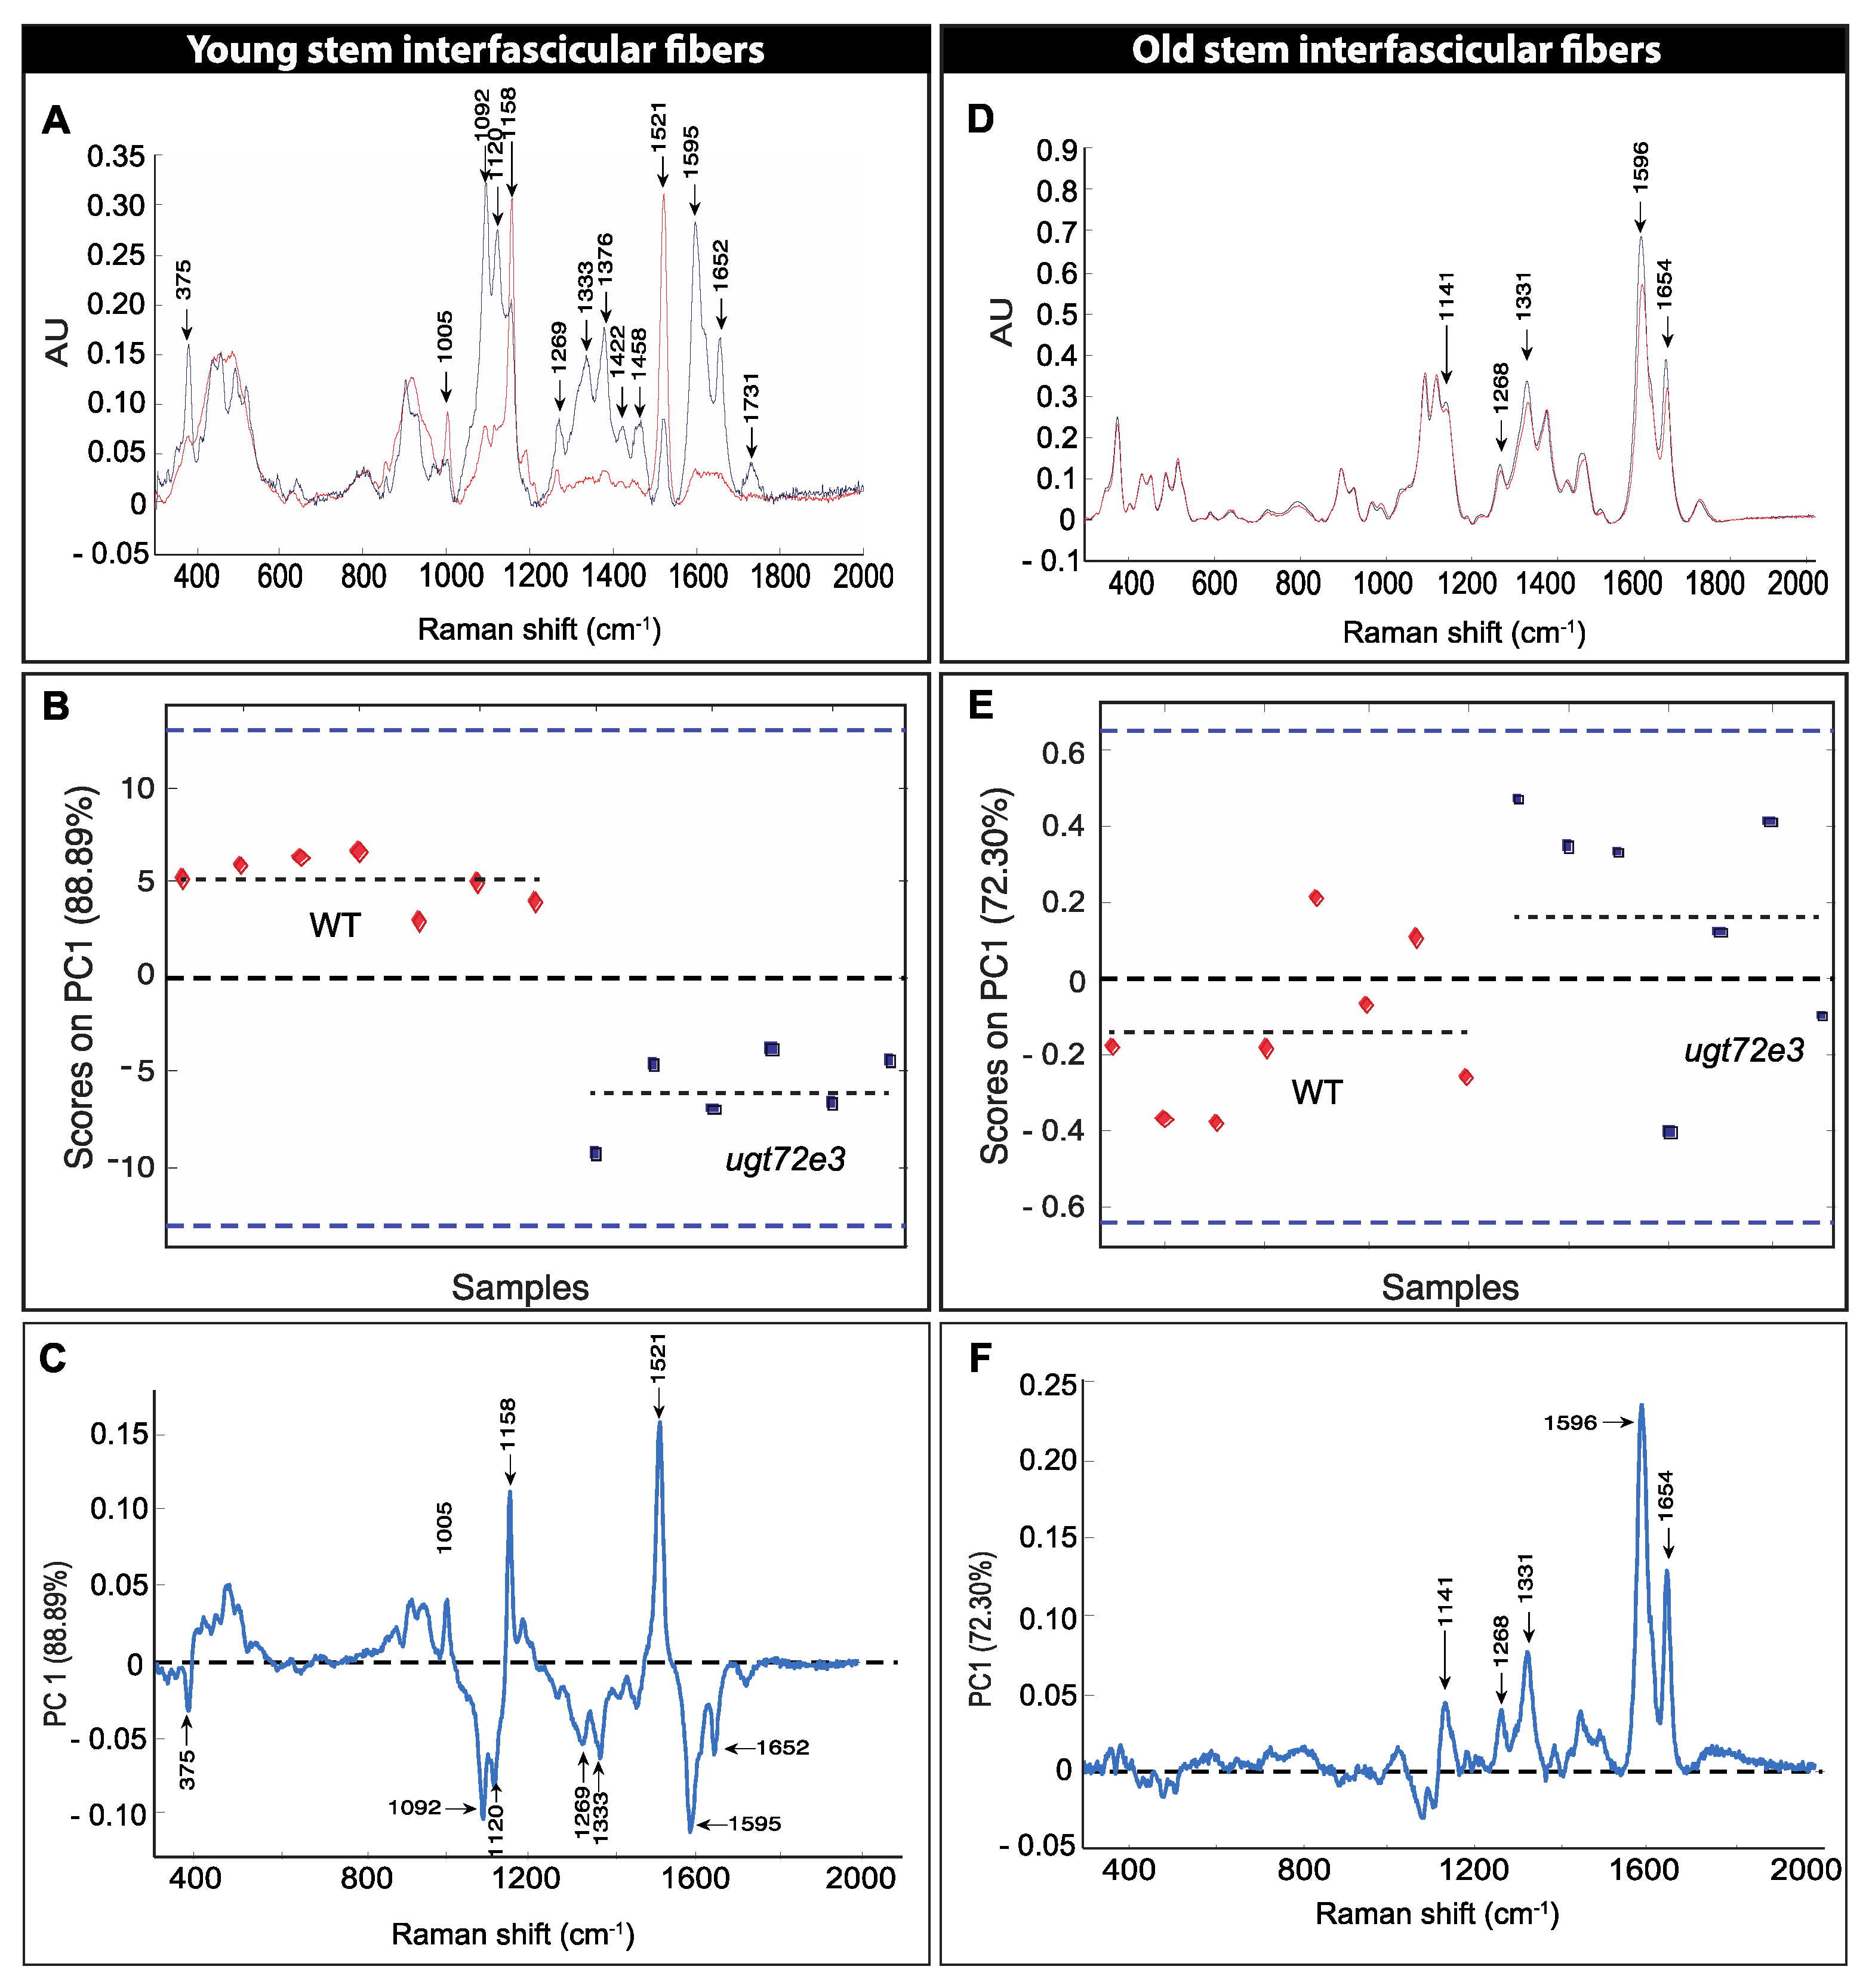
2.4. Raman Microspectroscopy Reveals Modifications in Ugt72e3 Cell Walls

To validate the results obtained by the safranin O methodology and to further explore effects of UGT72E3 knock-out on cell wall phenotype we used Raman microspectroscopy.
We firstly acquired spectra of interfascicular fiber cell walls from floral stem sections prepared from WT and ugt72e3 genotypes and generated mean spectra for analysis (Figure S4). Spectra obtained from xylem cell walls were found to be highly variable due to the heterogeneity of the cell types (e.g., vessels, fibers, parenchyma) and sizes within this tissue and it was therefore impossible to generate suitable mean spectra for meaningful comparison of WT and ugt72e3 xylem cell walls within the context of this study. The comparison of WT and ugt72e3 baseline-corrected spectra of interfascicular fiber cell walls from young stem regions (Figure 6A) revealed important differences between the two spectra. Four lignin-associated peaks (1269 cm−1, 1333 cm−1, 1595 cm−1, and 1652 cm−1) were higher in the ugt72e3 spectra compared to WT. Similar results were also obtained for major peaks that could be assigned to cellulose (375 cm−1, 1092 cm−1, and 1120 cm−1). In contrast only slight/no differences were observed for peaks related to other major cell wall polymers such as xylans (432 cm−1, 454 cm−1, 489 cm−1, and 516 cm−1). In WT spectra 3 peaks (1005 cm−1, 1158 cm−1, and 1521 cm−1) that were assigned to carotenoids and/or xanthophyll pigments [35] were more intense compared to the mutant spectra.
In order to confirm that the observed differences were statistically relevant we performed principal component analysis (PCA) on the spectra corresponding to the different WT and mutant samples analyzed. Our results show that the first principal component (PC1) represented 88.89% of the total differences observed (Figure 6B). Analyzing scores on PC1 showed that all WT and mutant samples were well discriminated on this component. Examination of the PC1 loading vector (Figure 6C) indicated that the peaks making positive contributions (1005 cm−1, 1158 cm−1, and 1521 cm−1) correspond to pigments while peaks making negative contributions correspond to lignin (1269 cm−1, 1333 cm−1, 1595 cm−1, and 1652 cm−1) and cellulose (375 cm−1, 1092 cm−1, and 1120 cm−1) in agreement with the average spectra (Figure 6A). The detection of carotenoids during our analyses is probably due to our technical procedure during which the young tissues containing high amounts of photosynthetic pigments were only fixed during a short period in ethanol. As a consequence, some cellular contents, including pigments, probably interacted with the cell wall material after cutting the tissues with the vibratome. The differences in the degree of contamination between the WT and the ugt72e3 mutant may possibly be related to a general modification of the cell wall architecture.
The mean spectra (Figure 6D) obtained from old WT and ugt72e3 floral stem regions were much more similar than corresponding spectra obtained from younger samples (Figure 6A). Nevertheless, when analyzing scores of different samples on the PC1 that accounted for 72.3% of the total variability (Figure 6E), we observed that the WT and ugt72e3 mutant could still be discriminated (but less so than in younger samples). Examination of the corresponding PC1 loading vector (Figure 6F) indicated that peaks making positive contributions could be assigned to lignin (1141 cm−1, 1268 cm−1, 1331 cm−1, 1596 cm−1, and 1654 cm−1). Altogether the data obtained by Raman microspectroscopy are in agreement with the results obtained using the safranin O approach. Both methods indicate that cell wall lignin content is significantly increased in the ugt72e3 mutant compared to WT and that the difference is greater in samples from young floral stem regions.

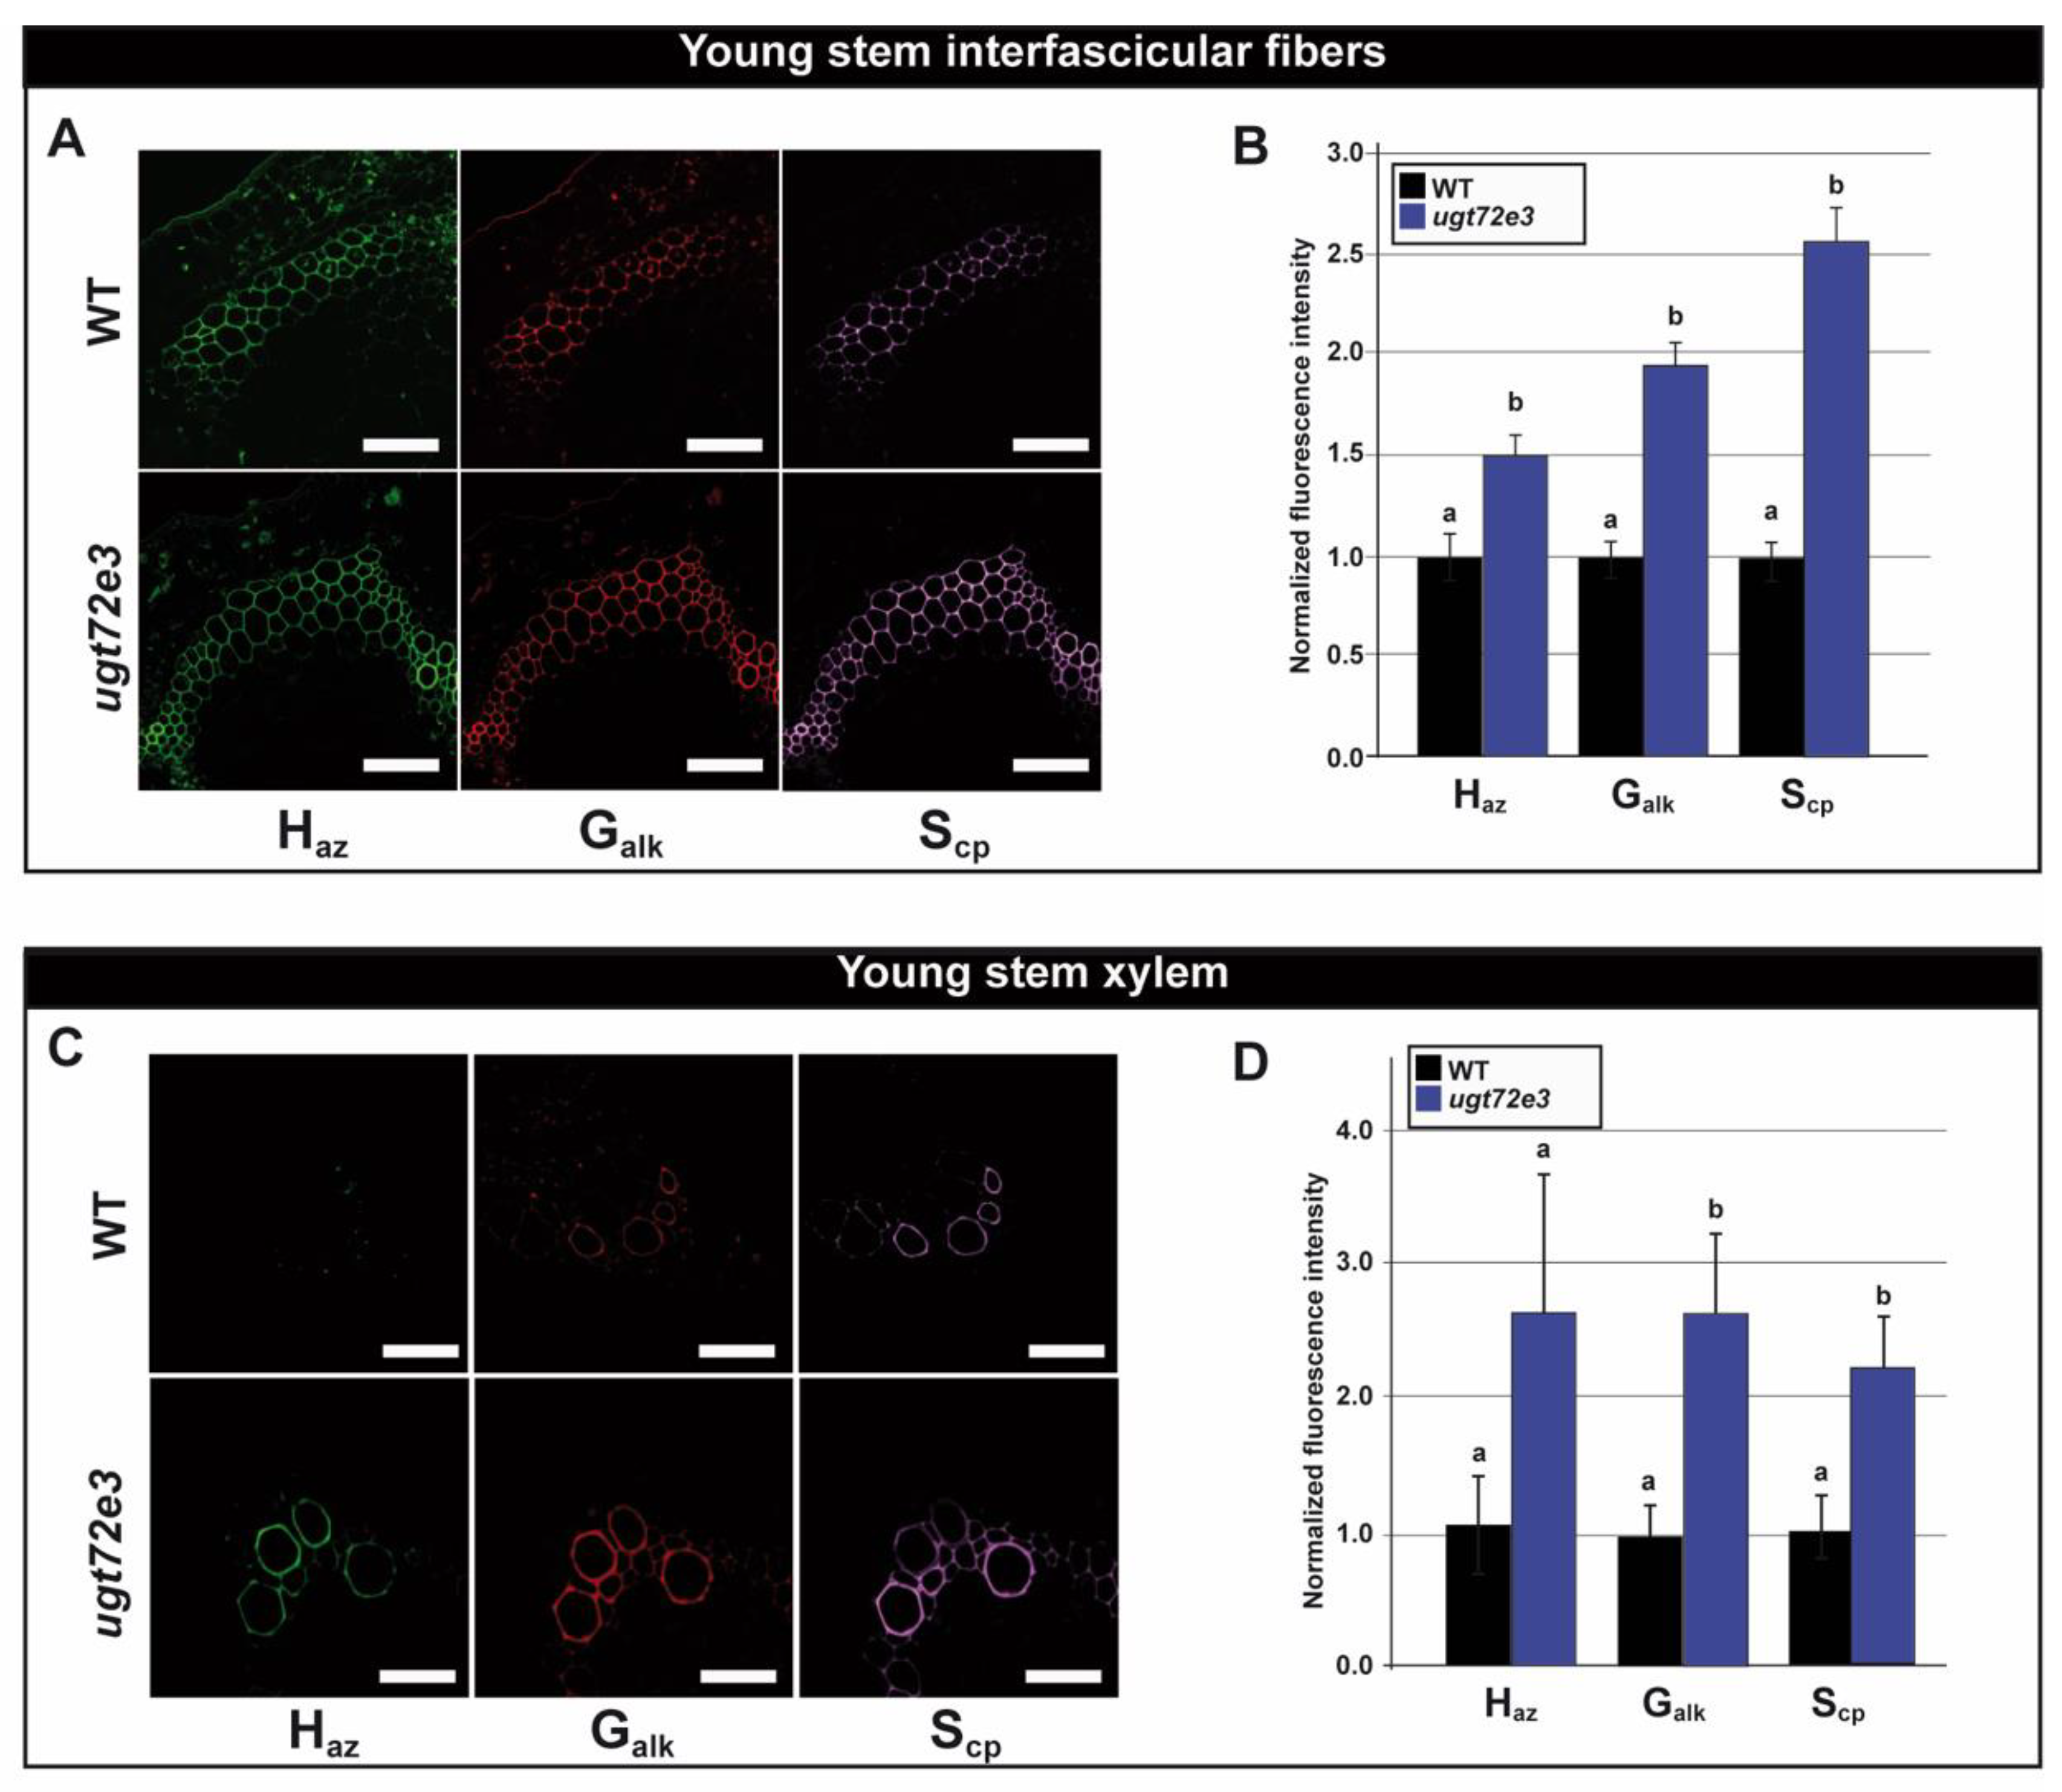
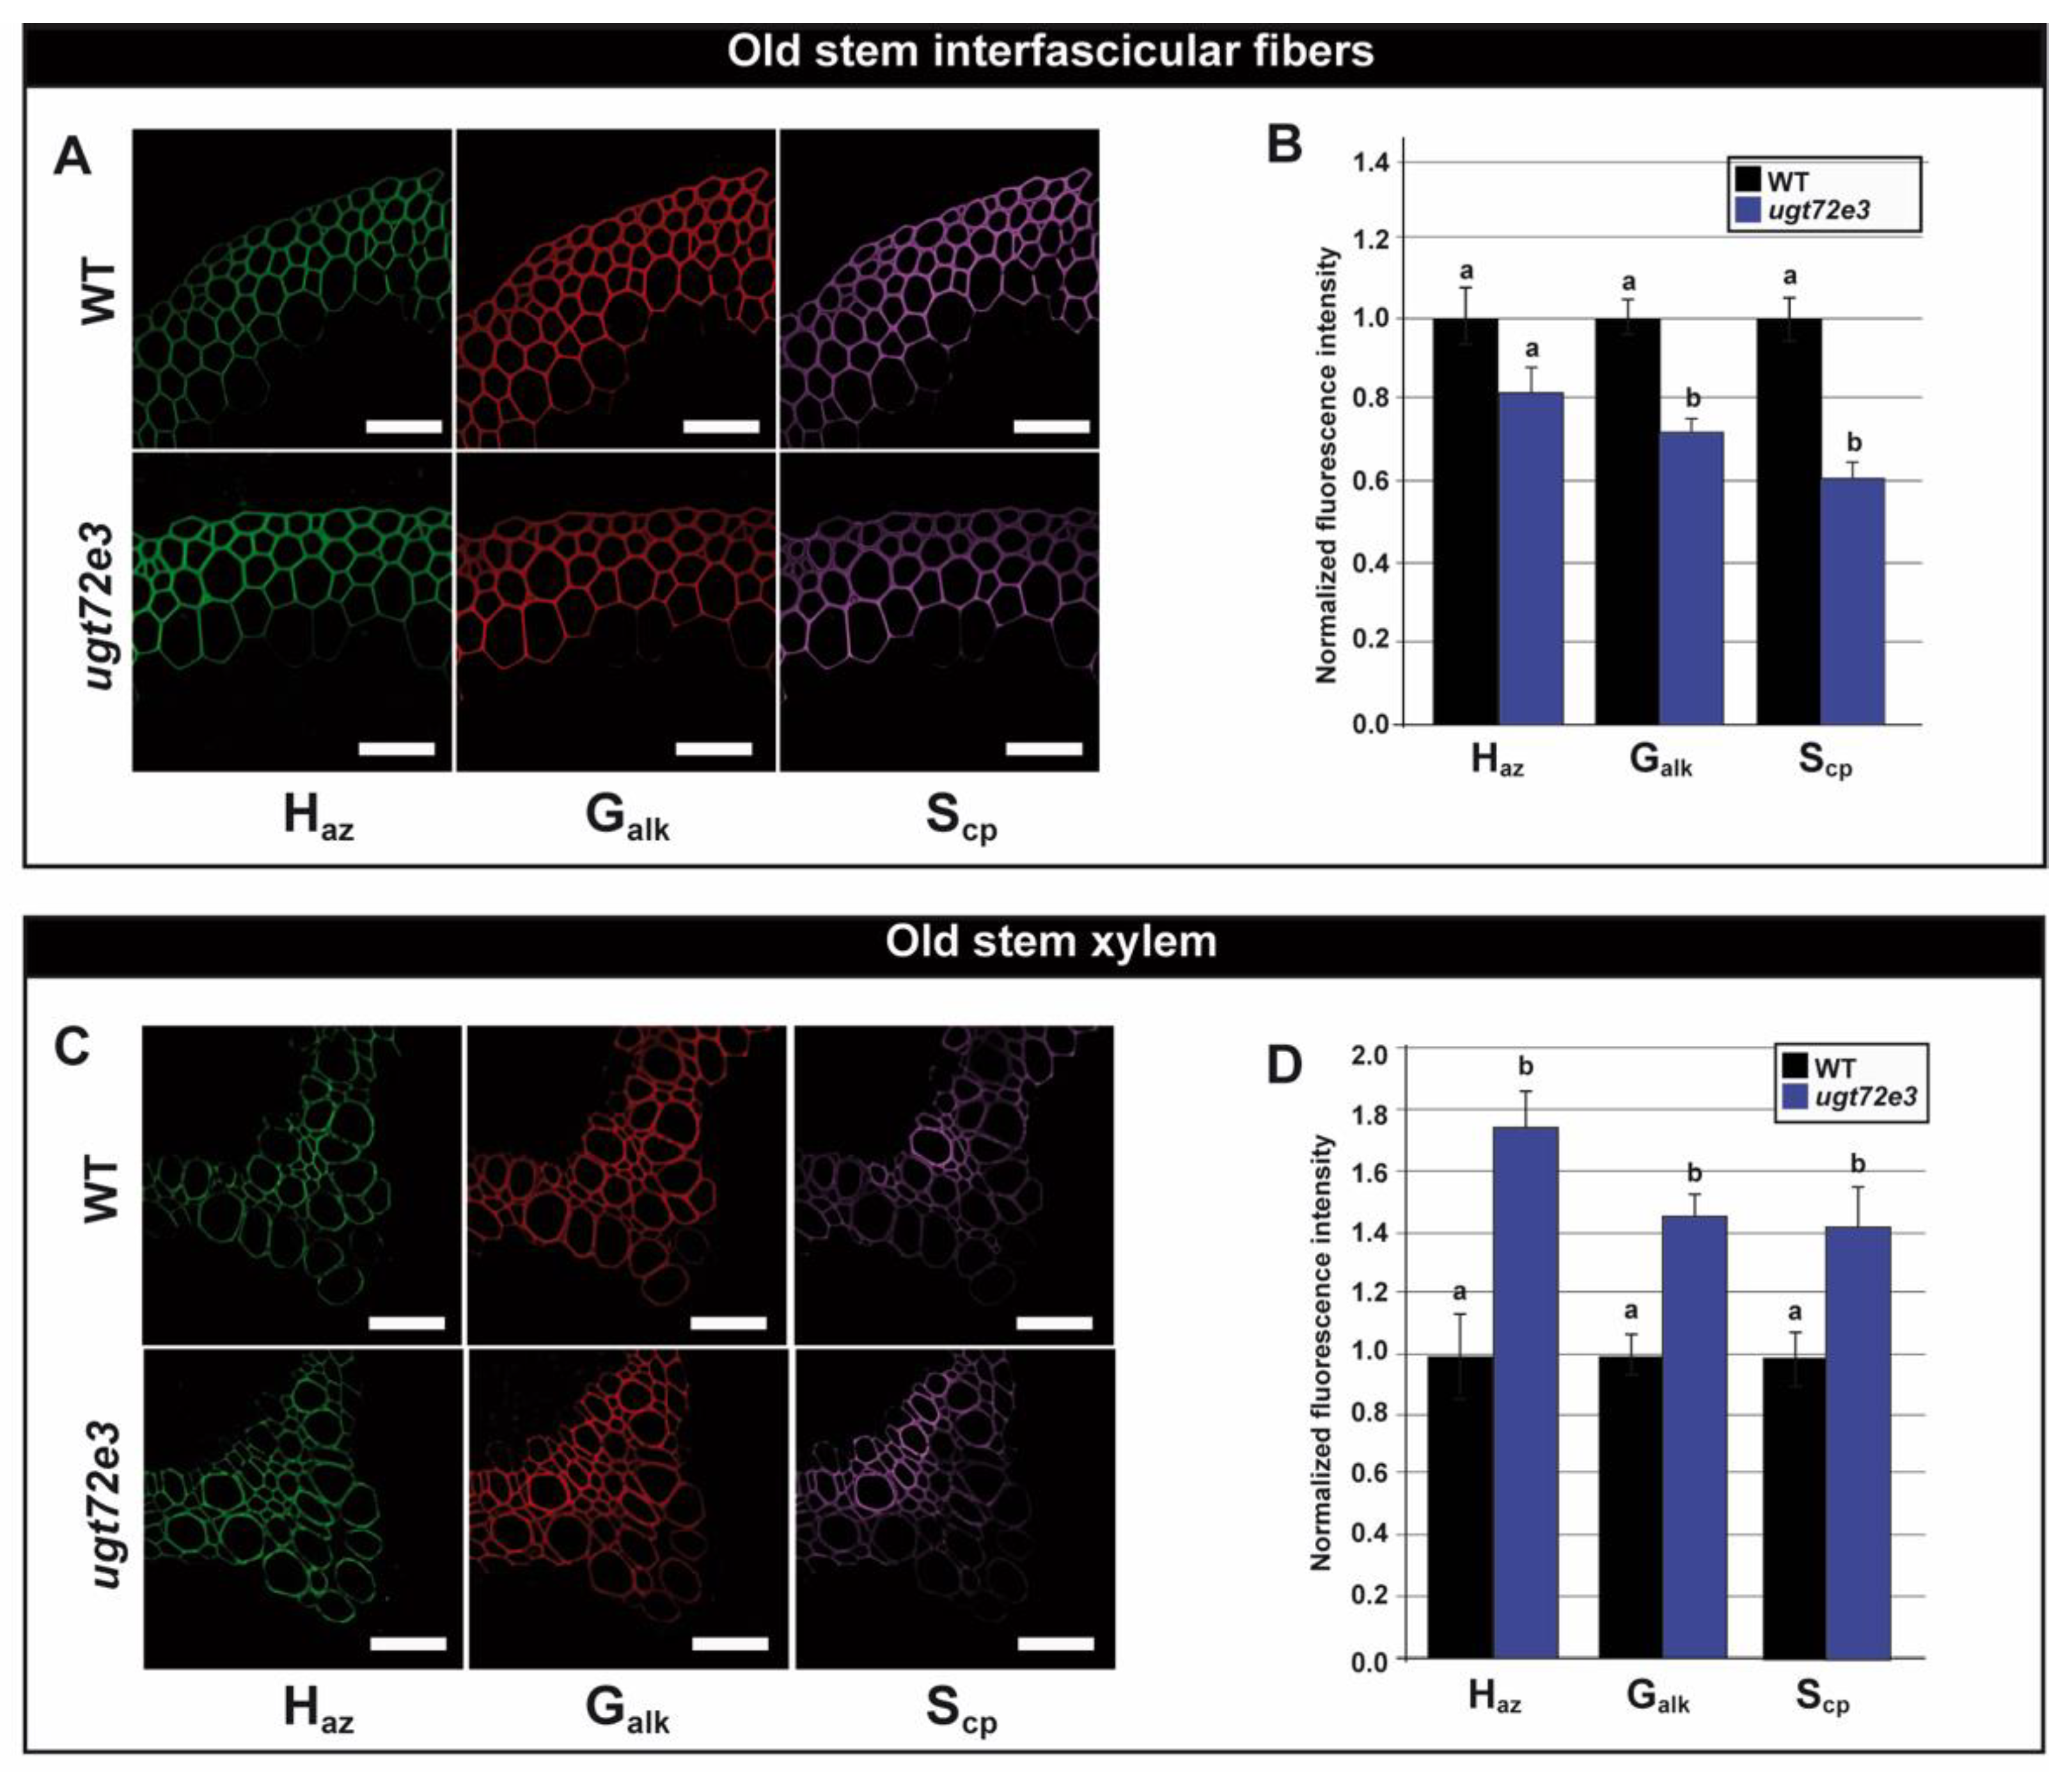
2.5. Monolignol Reporter Incorporation is Increased in Ugt72e3 Stems

In the light of the observed local increases in ugt72e3 cell wall lignin content revealed by both the safranin O approach and Raman spectroscopy, we compared the capacity of the WT and ugt72e3 mutant to incorporate monolignol reporters into the growing lignin polymer in situ using a recently developed bioorthogonal triple labelling strategy [36]. This technology gives detailed information about the potential of the cell wall machinery to incorporate tag-bearing monolignol surrogates (chemical reporters) and therefore provides dynamic information about the lignification process in cell walls.
The use of three different chemical reporters Haz, Galk and Scp (Figure S5) and independent bioorthogonal reactions allowed us to specifically evaluate the incorporation of lignin units corresponding to p-coumaryl alcohol, coniferyl alcohol, and sinapyl alcohol molecules respectively. The results are presented as normalized fluorescence intensities extracted from confocal microscopy images for the young (Figure 7) and old (Figure 8) regions of WT and ugt72e3 mutant floral stems.
When compared to the WT samples, the interfascicular fiber cell walls from young stem regions of the ugt72e3 mutant incorporated significantly higher amounts of all three reporters (Figure 7A,B) suggesting that the lignification process was modified in this mutant. Examination of xylem from the same region also revealed changes in the lignification process (Figure 7C,D). Here, mutant cell walls incorporated significantly higher amounts of Galk- and Scp- reporters compared to WT samples. Only the incorporation of Haz was not significantly different between WT and mutant xylem cell walls.
In older parts of the stem, reporter incorporation into interfascicular fiber cell walls was altered in ugt72e3 samples indicating that the lignification process was also modified (Figure 8A,B). However, in contrast to the pattern observed in the young part, here significantly lower amounts of Galk- and Scp-reporters (but not Haz-reporters) were incorporated compared to WT samples. Monolignol reporter incorporation was also significantly increased for Haz-, Galk-, and Scp-reporters in ugt72e3 xylem cell walls in comparison with the WT (Figure 8C,D). Taken together, these results clearly suggest that the knock-out of the UGT72E3 gene induces modifications in the lignification process.

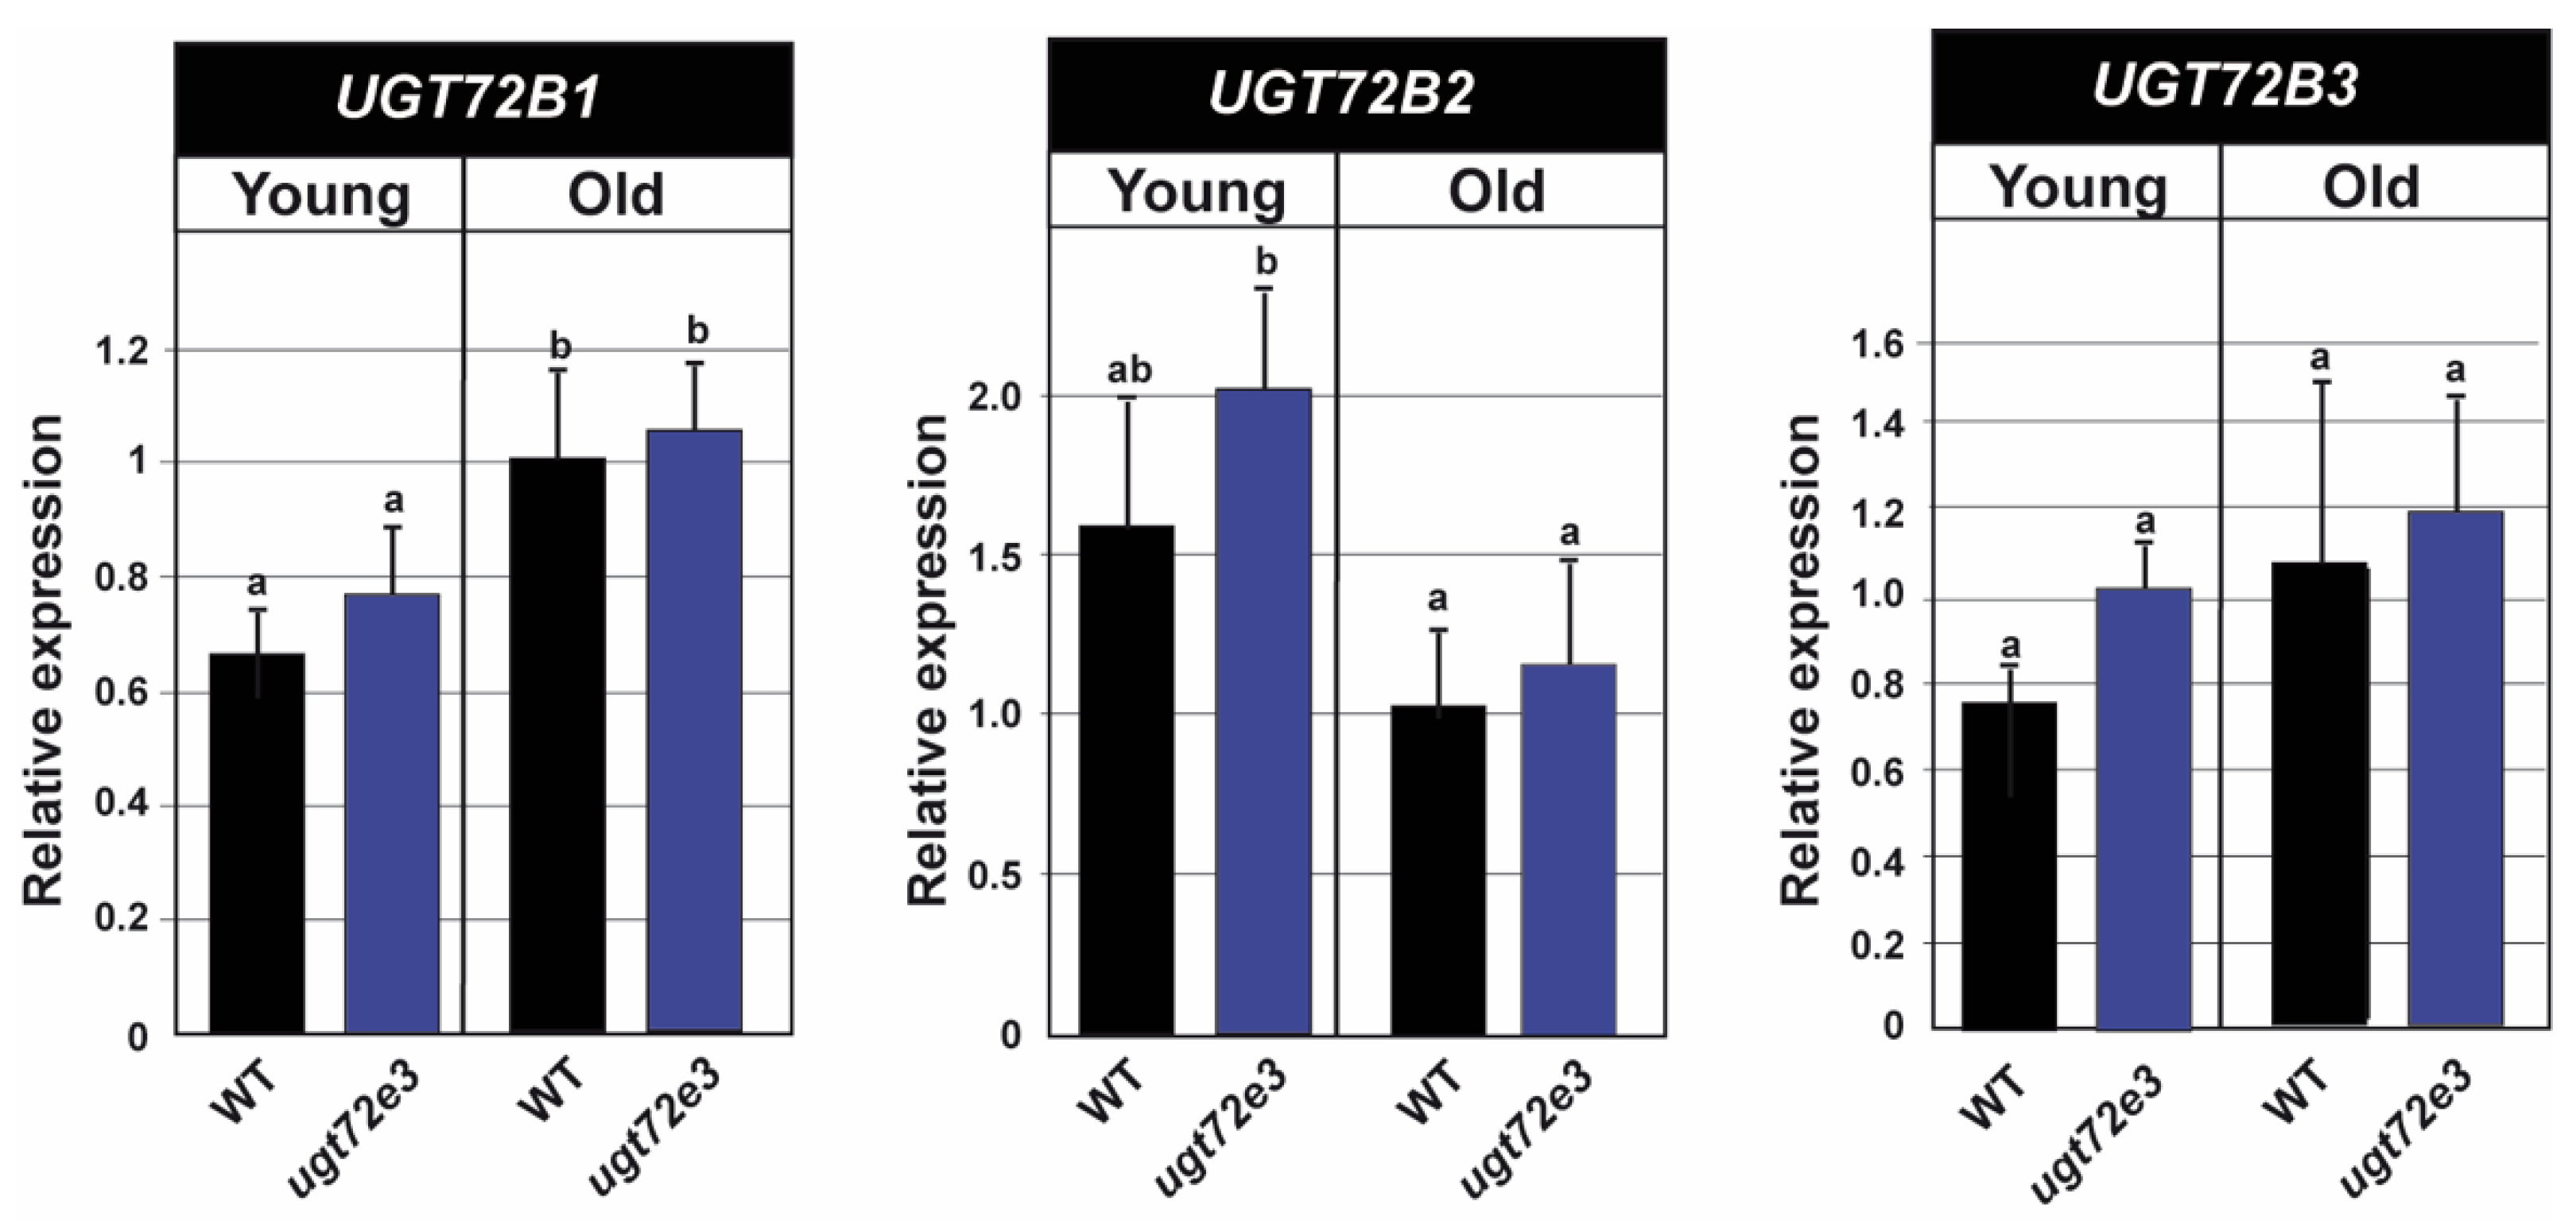
2.6. Ugt72e3 Mutation has no Influence on the Expression of the UGT72B Genes

Our results obtained by three independent methodological approaches (safranin O, Raman, reporter chemistry) all indicated changes to cell wall phenotype in the ugt72e3 mutant suggesting that UGT72E3 plays a role in cell wall metabolism. However, it was recently shown that glycosyltransferases from the UGT72B subfamily shared common biochemical functions with UGT72E2 in Arabidopsis thaliana [29]. Like the UGT72E genes, UGT72B1 is expressed in stems and its knock-out modified the expression of not only UGT72B3 but also UGT72E2, suggesting an interconnection between the UGT72E and UGT72B subfamilies. In order to rule out the possibility that the observed ugt72e3 phenotype was due to an indirect effect via the UGT72B genes, we investigated the effect of knocking-out the UGT72E3 gene on their expression in floral stems. As shown in Figure 9, the transcript accumulation of all three UGT72B genes is not significantly modified in the ugt72e3 mutant thereby demonstrating that the observed phenotype is not caused by an indirect effect on other lignin-related UGT72 genes.

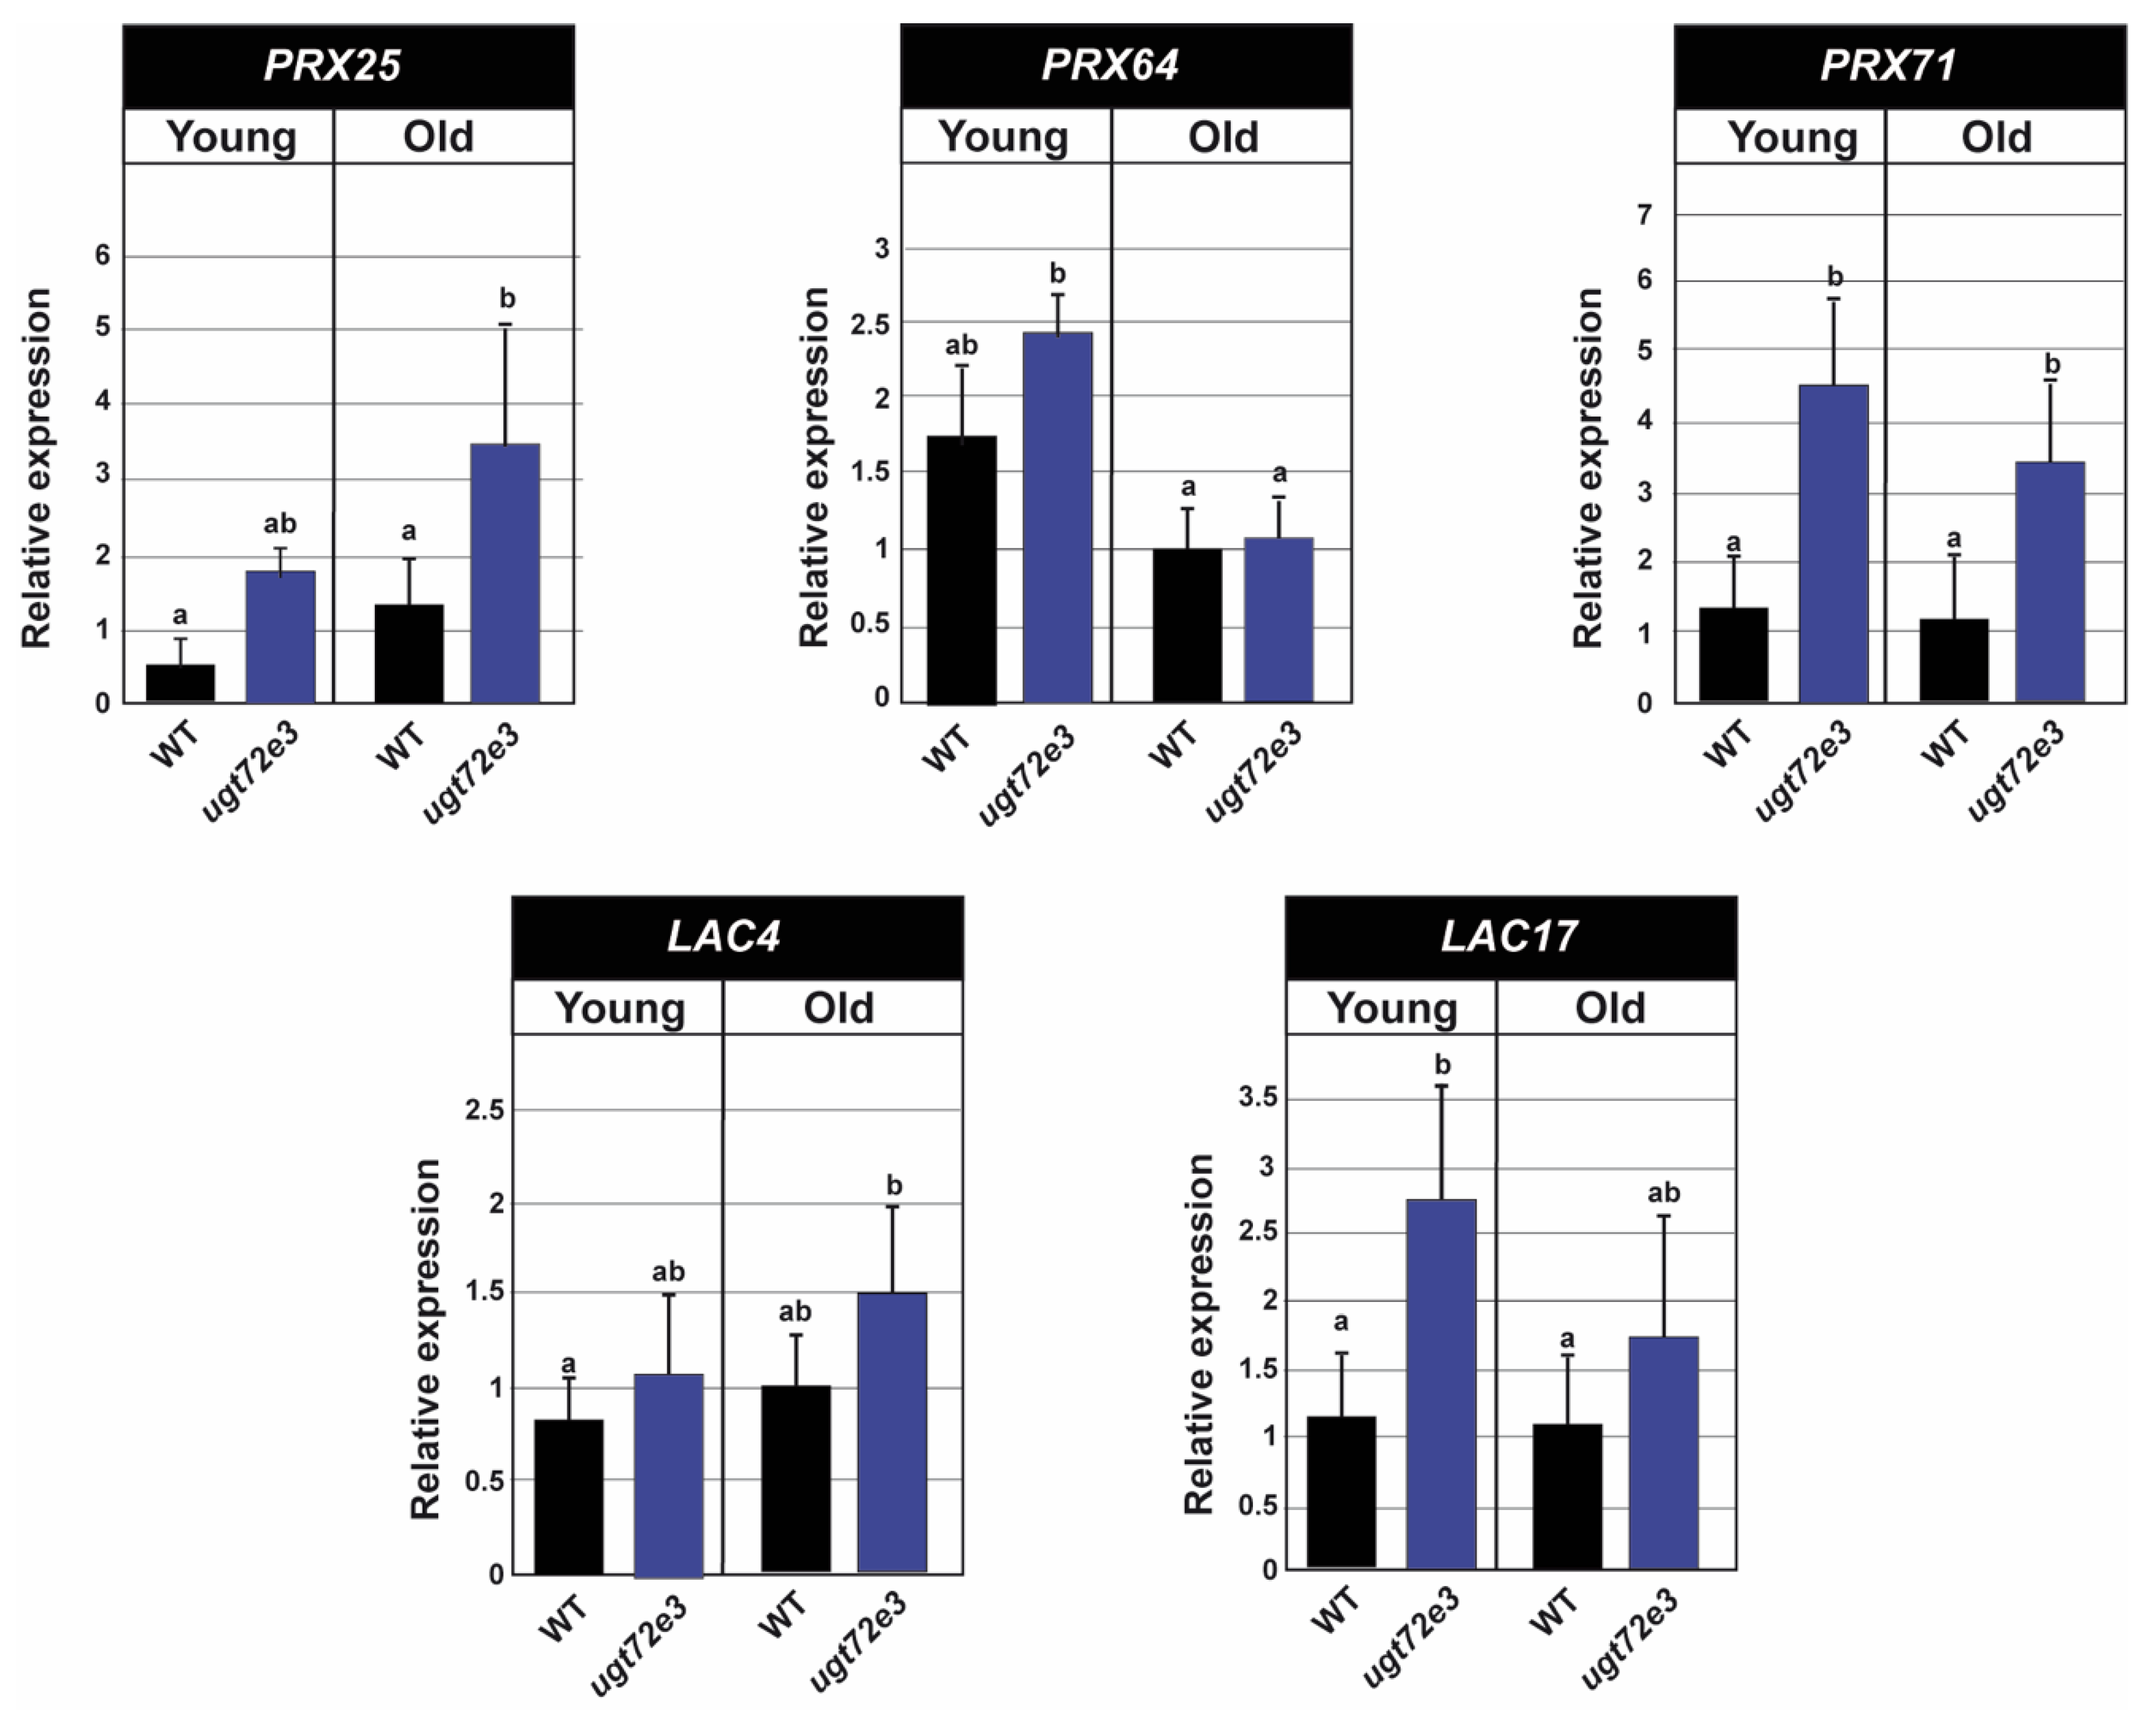
2.7. The Expression of PRX and LAC Genes Is Up-Regulated in Ugt72e3 Mutants

Results obtained with safranin O, Raman and chemical reporter approaches all indicated modified lignification profiles in the ugt72e3 mutant compared to WT plants. In particular, the chemical reporter strategy suggested that mutants incorporated tagged monolignols to higher levels in the young stem region. Since the formation and extension of the lignin polymer depends mainly on the activities of class III PRX and LAC enzymes we performed RT-qPCR analyses of selected lignin-related redox genes in ugt72e3 and WT samples. PRX25 and PRX71 genes were chosen because their knock-out mutants are characterized by a decrease in total lignins, thinner cell walls, and/or altered lignin structures in stems [37,38]. PRX64 was also selected since it showed a specific expression in the stems [39] and the corresponding protein was localized in the middle lamella and cell corners of cell walls [40]. We also selected LAC4 and LAC17 that have been proposed as key actors in stem lignification [41].
In the WT, no differences in the accumulation of the selected PRX and LAC transcripts were revealed when comparing young and old stem regions (Figure 10). When comparing WT and ugt72e3 mutant plants in older stem regions, PRX25 and PRX71 showed significant increases in transcript accumulation whereas in young stem samples, the accumulation was higher for PRX71 and LAC17. These data clearly indicate that the expression of several key lignin-related redox genes is up-regulated in the floral stems of ugt72e3 mutants and that the genes possibly involved in monolignol activation are different depending on the age of the stem portion.

3. Discussion

Glycosyl-transferase (GT) mediated reactions are considered as among the most important biotransformations on Earth [42]. To date, 110 different GT families are referenced in the CAZy database among which are the UGTs (uridine diphosphate glucosyltransferases) belonging to the GT1 family. There is an important mismatch between the number of glycosylated specialized metabolites in plants, potentially more than 100,000 [43], and the limited number of UGT genes, meaning that the corresponding enzymes can very certainly act on many different substrates. In Arabidopsis thaliana, this high functional diversity is reflected by the existence of 21 gene families based on sequence homology (UGT71-92 but not 77). The phylogenetic analysis of the 123 UGT protein sequences showed that they could be divided in 14 groups (A to N) [44]. Since many of the corresponding proteins are still insufficiently characterized, it remains difficult to know whether each group reflects common functions.
Over the last two decades UGT72E and, more recently UGT72B proteins belonging to the group E have received attention because of their possible role in regulating not only phenylpropanoid metabolism, but also deposition of the important cell wall polymer lignin. In terms of biochemical functions, in vitro tests of enzymatic activities indicate that both UGT72E1 and UGT72E2 can transfer a glucosyl group onto coniferaldehyde and sinapaldehyde and that UGT72E2 and UGT72E3 can transform sinapic acid but also sinapyl and coniferyl alcohols [19]. Ferulic acid can also be glycosylated by UGT72E2. The characterization of the UGT72B1 protein also showed that while the enzymatic activity was redundant with that of UGT72E2 [29], the Km value was higher in the former.
While a recent study [29] demonstrated that UGT72B1 is essential for normal cell wall lignification in Arabidopsis, the situation is less clear for members of the UGT72E family. Analyses of mutants over-/under-expressing UGT72E1/2/3 genes indicated changes in the levels of monolignol glucosides however, no significant effect on lignin deposition was observed [45]. In this paper we decided to reevaluate the potential involvement of the UGT72E family in lignification using chemical quantification together with several powerful in situ imaging approaches to characterize the Arabidopsis ugt72e1, ugt72e2, and ugt72e3 mutants.
Lignin contents were estimated using acetyl bromide. This dosage protocol was first developed for small wood samples [46] and later adapted for herbaceous species. It is particularly appropriate for lignin estimation in the floral stem of Arabidopsis because of the low amounts of cell wall xylans, which can potentially interfere with the spectrometric absorption [47] when using perchloric acid during the lignin extraction. In our protocol, the absence of artifactual furans [48] was also shown by checking the absence of a shift in the absorption spectrum to wavelengths lower than 280 nm. In our hands, this approach did not reveal any differences in lignin content between the ugt72e mutants and wild type. Chemical estimations of lignin, however, are generally destructive, providing an average value and resulting in the loss of detailed spatial information about cell wall lignin levels [49]. We therefore decided to use complementary in situ imaging techniques to investigate whether UGT72E gene knock-out affected cell wall lignin.
We firstly implemented a new quantification approach that we have developed based upon the potential of fluorescent microscopy coupled to safranin O staining [31]. Using this technique, it is now possible to generate high-definition spatial information about lignin localization as well as quantitative information based on ratiometric emission measurements. Our results showed that lignin deposition was significantly changed only in the ugt72e3 mutant, but not in ugt72e1 or ugt72e2. Lignin levels in both the xylem and interfascicular fibers from the younger part of ugt72e3 stems were higher when compared to the WT. In contrast, no statistical differences were observed in the bottom part of the organ that contains more mature cells.
It seems therefore that the knock-out of the UGT72E3 gene accelerates cell wall lignification in younger tissues but does not influence the final amounts at the end of cell wall development. In order to confirm this observation we then used Raman microspectroscopy and a chemical reporter strategy [49]. Both of these approaches confirmed that cell wall lignin levels were significantly increased in ugt72e3 mutants compared to WT plants and provided strong evidence for the idea that the UGT72E3 gene is involved in the regulation of cell wall lignification. Expression analyses showed that the accumulation of transcripts for the 3 UGT72B family members were not significantly modified in the mutant thereby ruling out the possibility that the phenotype was due to an indirect effect on the UGT72B genes.
The existence of a possible relationship between UGTs and lignification has been often mentioned but is only poorly supported by experimental data [13,26,27,50]. In tobacco plants, the ectopic expression of the Populus tomentosa PtGT1, homologous to the 3 UGT72E Arabidopsis genes, led to the accumulation of higher lignin levels in the xylem [28]. The interpretation of this result is not really intuitive when considering that UGTs may reduce the flux of monolignols towards the cell wall. It is possible that the use of the strong CaMV35S promoter to control UGT gene expression led to significant disruption of gene function in this case. It should also be taken in account that no enzymatic activity towards monolignols was associated with the corresponding recombinant protein, suggesting that the impact of this UGT on lignin biosynthesis is not directly through the glycosylation of monolignols, In Arabidopsis, the ugt72b1 mutant was characterized by ectopic lignification in areas around pith tissues and interfascicular fibers [29]. The increase in the quantities of lignins in the cell walls does agree with the fact that this UGT could catalyze the glucose conjugation of monolignols but still, the very strong impact of the mutation is surprising for this gene.
The ectopic expression of PtGT1 in tobacco resulted in an early flowering phenotype [28]. In our work, the development analysis of the ugt72e3 mutant also showed that it had an advanced flowering phenotype. This relationship between the development of the floral stem and its lignin contents is difficult to explain. In different plant species, the flowering time has often been linked to lignification when searching for a marker of the biomass yield. In Medicago truncatula, a delayed flowering mutant had higher biomass and lower lignin amounts compared to the wild type at the same age [51]. Nevertheless, the correlation between flowering time and lignification may dependent on the clade. In maize, the brown midrib bm1 heterozygote lines flowered significantly earlier than the wild-type plants but have a reduced content and altered subunit composition lignin polymer [52]. It is possible that the anatomical differences including the absence of secondary tissues in monocots may explain the observed difference with the dicots.
In the light of our results it therefore seems that the mutation of the UGT72E3 gene impacts lignin deposition, showing that glycosylation could act as a regulator of the monolignol flux. Indeed, when considering the recent suggestion that monolignols cross the plasma membrane by passive diffusion, it is likely that the decreased lipophilic nature of monolignol glycosides resulting from glycosylation would reduce monolignol flow to the cell wall [17]. The role of glycosylation was also highlighted during a study on the potential role of ABC transporters [53] suggesting that the glycoconjugates are transported into the vacuoles and aglycones go towards the cell wall through the plasma membrane. If the UGT72E gene is indeed involved in regulating monolignol flux to the cell wall then one would expect there to be an inverse relationship between lignin levels and amounts of glycosylated monolignols. Based on a recent metabolomic study on the inner seed coats of pomegranate [54], it was proposed that the high amounts of monolignols accumulated in the inner seed coats could either be transported to the cell wall and used as lignin precursors leading to a hard-inner seed coat phenotype, or else conjugated into monolignol glucosides and stored, causing a soft-seeded cultivar. In flax, the same inverse correlation was described in a comparative study of the amounts of glysosylated phenolic compounds in outer stem tissues containing fibres with very low amounts of cell wall lignins, and the lignin-rich xylem tissues [55]. In this case, phenolic glycoside levels were higher in the lignin-poor outer tissues compared to the lignin-rich inner tissues. In this same species, a transcriptomic approach showed that the expression of a UGT gene close to the UGT72E family, was downregulated in the highly lignified bast fibre lbf mutant [50] further supporting the idea of this relationship between the lignification status and monolignol glycosylation activity.
Given the hypothesis that the knock-out of the UGT72E3 gene leads to increased monolignol flow to the cell wall also raises the question of the capacity of cell walls to incorporate these precursors. Before monolignols can be incorporated into the growing lignin polymer, they must first be oxidized by cell wall located peroxidases and/or laccases. If these enzymes are not working close to their maximum efficiency then increasing monolignol flow to the cell wall should lead to increased incorporation and higher cell wall lignin levels. On the other hand, if lignin redox enzymes are biochemically saturated then increasing the monolignol flow will not change lignin levels. To gain insight into this question we used a novel bioorthogonal triple labelling strategy based on the use of chemical reporters to compare lignification dynamics in the floral stem of ugt72e3 mutants and WT plants [36]. In addition, we also determined expression levels of selected lignin-related peroxidase and laccase genes.
Our results showing that UGT72E3 knock-out stimulated the capacity of mutant cell walls to incorporate monolignol chemical reporters in interfascicular fibre and xylem cell walls of young stem regions is coherent with, not only the data obtained by the safranin O ratiometric approach and Raman microspectroscopy, but also the hypothesis of increased monolignol flow to the cell wall. The observation that the accumulation of PRX71 and LAC17 transcripts also increased in this stem region would suggest that these genes are up-regulated in response to the increased monolignol flow to the cell wall resulting from decreased glycosylation. The fact that PRX25, PRX64, and LAC4 expression were unchanged could indicate that the corresponding proteins are present in a constitutive way and are not saturated by increased monolignol flow or alternatively they may be less involved in the lignification of cell walls in the younger part of the stem. In tissues from old stem regions, a more complex pattern emerged with decreased lignin Galk- and Scp- reporter incorporation in ugt72e3 interfascicular fibre cell walls compared to WT associated with increased incorporation of all 3 reporters in xylem tissue. The observed reduction of Galk- and Scp- reporter incorporation in interfascicular fibre cell walls is potentially related to the fact that in this region of the stem, the lignin levels in these cell walls are very similar in both WT and mutant plants as demonstrated by the safranin O and Raman microspectroscopy results. This could suggest that the lignification process is winding down in these cells in agreement with reduced reporter incorporation. In contrast, the formation of new cells in the xylem is associated with continued lignification as shown by the increased incorporation of all 3 reporters. The gene expression data for the old stem region showed that PRX71 and PRX25, but not LAC17, were both more highly expressed in the ugt72e3 mutant, most likely representing a developmentally related switch in the nature of the lignin related redox enzymes. The analysis of the corresponding mutants with our in vivo triple labelling strategy could provide more information on the precise role of these different PRX and LAC genes. Further investigations using a high throughput transcriptomics approach on the ugt72e3 line will also provide information on the expression of lignin biosynthetic genes and the genes encoding transcription factors known to be involved in the regulation of the phenylpropanoid pathway. It is indeed possible that a higher amount of monolignols were synthesized due to the mutation.
In conclusion, this study has generated several key results supporting the hypothesis that monolignol glycosylation plays a regulatory role in controlling cell wall lignification in the Arabidopsis floral stem, especially in the young tissues. The use of three independent high-performance imaging techniques combined with gene expression data provides clear evidence for a role of the UGT72E3 protein in this process.

4. Materials and Methods

4.1. Plant Material and Sampling

All the Arabidopsis thaliana plants were in the Col-0 background. The three T-DNA insertion mutant lines GK-340H02, SM_3_20654 and SAIL_1279_D02 corresponding respectively to the UGT72E1 (At3g50740), UGT72E2 (At5g66690), and UGT72E3 (At5g26310) genes were ordered from NASC (http://arabidopsis.info) and the homozygotes were selected by PCR. Double mutants ugt72e1,2 were obtained by crossing ugt72e1 with ugt72e2. In each mutant, the T-DNA was positioned at the 5′ end of the unique exon.
The seeds were stratified during 72 h at 4 °C in the dark. Plants were grown in GroBank chambers (CLF Plant Climatics GmbH, Wertingen, Germany) under 12 h light (100 PAR light intensity) at 22 °C and 12 h dark at 20 °C. After 6 weeks, the photoperiod was changed to 16 h light, 8 h dark. For the phenotyping analyses, the rosette surfaces of at least 70 plants were measured on 28-day-old plants corresponding to the 3.20–3.50 stage [30] using FIJI v2.0 [56]. The age of the plants reaching the 5.1 stage, corresponding to the emergence of the floral stem, was also annotated. For lignin analyses, floral stems were collected when they reached 24 cm. The first bottom centimeter was discarded and a sample including either the above centimeter was used for safranin and biorthogonal labelling analyses or the 8 first centimeters used for lignin dosage by acetyl bromide or gene expression approaches (old stem regions). A second 8 cm fragment was collected for lignin dosage and gene expression analysis above the 11 first centimeters from the bottom of the stem. The central part of this fragment measuring 1 cm was used for safranin and biorthogonal labelling approaches (young stem regions).

4.2. Determination of Gene Expression by RT-qPCR

Top (young) and bottom (old) stem fragments from three 6-week-old plants for each biological replicate were pooled, frozen in liquid nitrogen and stored at −80 °C. Total RNA was extracted from ground tissues using Tri-Reagent (MRC, Inc., Dundee, Scotland, UK) according to manufacturer’s instructions, treated with TURBO DNA-free DNase (Thermo Fisher, Courtaboeuf, France) and quantified by Nanodrop. First strand cDNA was obtained from 1µg total RNA using iScript™ cDNA Synthesis Kit (Bio-Rad, Marnes-la-Coquette, France) according to manufacturer’s instructions. PCR was performed on Mx3005P (Agilent, Les Ulis, France) in duplicate on cDNA pooled from two independent reverse transcription reactions on three independent biological replicates. Reaction mixtures containing 10 µL of iQ SYBR Green Supermix (Bio-Rad, Marnes-la-Coquette, France), 375 nM each primer (Table S1) and 5 µL of cDNA diluted 6 times were incubated for 3 min 30 s at 95 °C followed by 40 cycles at 95 °C for 30 s and 60 °C for 30 s. Gene expression was normalized to the Protein Phosphatase 2A subunit A3 gene PP2A (AT1G13320) and PEROXIN4 (AT5G25760) [57]. Relative expression was determined as previously described [58]. One-way analyses of variance were performed with R, then grouping was done with Duncan multiple range test (p-value < 0.05).

4.3. Cell Wall Residue Preparation and Lignin Quantification

For each biological repeat, 4 or 8 fragments were collected from the bottom or top parts of the floral stems. Cell wall residues (CWR) were prepared as previously described [59]. The extensive solvent extraction method was chosen to remove proteins. It globally consisted in successive treatments of the plant material with the addition of 80% (v/v) ethanol, 100% acetone and CHCl3/methanol (1:1). The procedure of cell wall isolation also included amylase and amyloglucosidase treatments (the equivalent of 20 and 40 units respectively, per gram of cell wall sample) for starch removal. Finally, cell wall samples were ground in a bead miller (Mixer Mill MM 301; Retsch, Haan, Germany) at 30 Hz for 2 × 3 min of milling with 5 min pauses in between. The lignin quantification of CWR was performed using a modified acetyl bromide procedure [60]. Ten mg of cell wall sample were incubated in 5 mL of 25% (w/w) acetyl bromide in glacial acetic acid (extemporized preparation) at 70 °C for 30 min to achieve complete dissolution of residues. After cooling on ice, 2 mL of the mixture were incubated for 30 min in 0.5 M NaOH in glacial acetic acid. Lignin content was determined by measuring the OD at 280 nm and using ε = 20 g−1·L·cm−1

4.4. Sample Preparation for Imaging Analyses

Stem fragments were collected as described in 4.1 and embedded in agarose 4% before sectioning with a vibroslicer (VT-1000S, Leica, Wetzlar, Germany) to a thickness of 80 µm. The sections were placed in Murashige and Skoog half-strength (MS1/2) solution when used for biorthogonal labelling chemistry or fixed for 3 h. in 70% ethanol at room temperature under shaking and then kept at 4 °C before safranin O staining and Raman microspectroscopy.

4.5. Safranin O Ratiometric Imaging

Safranin O staining and analyses were performed as previously described [31]. Images from 3 independent biological replicates for each genotype and tissue were acquired. A Nikon A1R confocal equipped with a 60×/1.4 aperture oil immersion objective (Plan APO VC) and the NIS Element AR3.0 software was used (Nikon, Tokyo, Japan). Acquisition parameters were the following: track 1 (ex: 488 nm, BP: 525/50), track 2 (ex: 561 nm, BP: 595/50). Images were treated using FIJI v2.0 [56] and analyzed with the associated macro developed for this method as previously described [31]. Lignin appears in colors ranging from purple (low amounts) to red (high amounts).

4.6. Raman Microspectroscopy

Confocal Raman hyperspectral analyses were performed with a Labram HR Evolution (Horiba Scientific, Villeneuve-d’Ascq, France) equipped with a two-dimensional EMCCD detector (1600 × 200 pixels sensor), a 50× Fluotar LWD objective (Leica, Wetzlar, Germany) and a 545-nm laser with a power of 45 mW at the sample. The spectral range of 300 to 2000 cm−1 was used for acquisitions. Ten accumulations of 1 s with 100% laser power were used.
The spectra were collected with the LabSpec 6 software (Horiba Scientific, Lille, France). A minimum of 100 spectra (interfascicular fibres) and 80 spectra (xylem) per genotype from 6 to 8 plants distributed on 3 independent biological replicates were acquired. For data processing, once acquired, the hyperspectral images were unfolded and the spectra were baseline corrected using the Whittaker filter method (lambda = 10,000, λ= 0.01), normalized on the 590–630 cm−1 (top stem) and 375 cm−1 (bottom stem) bands and mean-centered with MatLab R2018b software. PCA were applied on the treated spectra of both genotypes from top and bottom stem samples.

4.7. Chemical Reporter Imaging

Chemical reporters Haz, Galk and Scp were synthesized as previously described [36,61,62]. Natural and tagged monolignols were metabolically incorporated in the plant samples at a final concentration of 5 µM for 20 h (Figure S5). Bioorthogonal ligation of a specific fluorescent probe to each incorporated reporters Haz, Galk, and Scp was carried out according to our previously described triple labelling technology with modifications [36], using a combination of inverse electronic demand Diels-Alder chemistry, Copper-catalyzed alkyne-azide cycloaddition and Strain-promoted alkyne-azide cycloaddition. Cyclopropane-reactive Tetrazine-Cy5 (Jena Bioscience, Jena, Germany) and alkyne-reactive Azidefluor 545 (Sigma-Aldrich, Saint-Louis, MO, USA) probes were used at 5 µM to label incorporated Scp- and Galk-units, respectively. DBCO-PEG4-Rhodamine Green (Jena Bioscience, Jena, Germany) was used at 2.5 µM to label incorporated Haz-units. Confocal microscopy was done with the same equipment used for safranin imaging with the following acquisition parameters: track 1—lignin autofluorescence (ex: 405, BP: 450/50); track 2—H units (ex: 488, BP: 525/50); track 3—G units (ex: 561, BP: 595/50); track 4—S units (ex: 561, BP: 700/75). An additional channel was acquired with transmitted line detector to obtain morphological images. Images from natural or tagged monolignol units from the different plant lines were acquired with the same acquisition parameters on the same day for valid comparison. Pictures were treated using FIJI v2.0 [56]. Quantitative measurements were performed using an in-house developed macro. Image processing consisted in two phases: the threshold background determination and the analysis. Threshold backgrounds were determined for the channels 2, 3, and 4 on samples treated with natural monolignols. A mean background threshold was determined for each sample from 3 images. Images from samples treated with tagged monolignols were converted in 32-bit images and the channels 2, 3, and 4 were extracted. The determined signal background was subtracted for each channel and pixels below the threshold background were classified as “NaN background”. A region of interest was determined for each sample and the protocol was applied on the three obtained images. Finally, signal intensity was measured and comparison between the different plant lines was performed.

Supplementary Materials

Supplementary materials can be found at https://www.mdpi.com/1422-0067/21/17/6094/s1. Figure S1: Expression analyses of the UGT72E3 gene in WT and ugt72e1,2 mutant. Figure S2: Lignin amounts in the WT and the ugt72e1,2 mutant. Figure S3: Local lignin content determination on the floral stems using safranin O fluorescence-based method on WT and ugt72e1,2 mutants. Figure S4: Raman microspectroscopy analysis of the interfascicular fibres. Figure S5: Chemical reporters used in this work. Table S1: Primers used for RT-qPCR.

Author Contributions

F.B.-C., J.L.R., B.H., A.C., and G.N. designed and performed the experiments, C.L. and C.B. produced the chemical tools and supervised the biorthogonal labelling strategy, C.S. supervised the imaging, L.D. supervised and analyzed the Raman data, M.B., S.H. and G.N. supervised this work and wrote the manuscript. All authors have read and agreed to the published version of the manuscript.

Funding

We thank the TisBio facilities and the FRABio Research Federation for providing a technical environment conducive to achieving this work. This study was funded by grants from the French Region Hauts de France and the EU (CPER/FEDER project ALIBIOTECH) to FBC. JLR was financed by the French Ministère de l’Enseignement Supérieur et de la Recherche during his PhD.

Conflicts of Interest

The authors declare no conflict of interest.

References

  1. Boerjan, W.; Ralph, J.; Baucher, M. Lignin biosynthesis. Annu. Rev. Plant. Biol. 2003, 54, 519–546. [Google Scholar] [CrossRef] [PubMed]
  2. Li, X.; Weng, J.K.; Chapple, C. Improvement of biomass through lignin modification. Plant J. 2008, 54, 569–581. [Google Scholar] [CrossRef] [PubMed]
  3. Ralph, J.; Lundquist, K.; Brunow, G.; Lu, F.; Kim, H.; Schatz, P.F.; Marita, J.M.; Hatfield, R.D.; Ralph, S.A.; Christensen, J.H.; et al. Lignins: Natural polymers from oxidative coupling of 4-hydroxyphenyl- propanoids. Phytochem. Rev. 2004, 3, 29–60. [Google Scholar] [CrossRef]
  4. Vanholme, R.; De Meester, B.; Ralph, J.; Boerjan, W. Lignin biosynthesis and its integration into metabolism. Curr. Opin. Biotechnol. 2019, 56, 230–239. [Google Scholar] [CrossRef] [PubMed]
  5. Del Río, J.C.; Rencoret, J.; Gutiérrez, A.; Elder, T.; Kim, H.; Ralph, J. Lignin monomers from beyond the canonical monolignol biosynthetic pathway: Another brick in the wall. ACS Sustain. Chem. Eng. 2020, 8, 4997–5012. [Google Scholar] [CrossRef]
  6. Chen, F.; Tobimatsu, Y.; Havkin-Frenkel, D.; Dixon, R.A.; Ralph, J. A polymer of caffeyl alcohol in plant seeds. Proc. Natl. Acad. Sci. USA 2012, 109, 1772–1777. [Google Scholar] [CrossRef] [Green Version]
  7. Chen, F.; Tobimatsu, Y.; Jackson, L.; Nakashima, J.; Ralph, J.; Dixon, R.A. Novel seed coat lignins in the Cactaceae: Structure, distribution and implications for the evolution of lignin diversity. Plant J. 2013, 73, 201–211. [Google Scholar] [CrossRef]
  8. Del Río, J.C.; Rencoret, J.; Prinsen, P.; Martínez, Á.T.; Ralph, J.; Gutiérrez, A. Structural characterization of wheat straw lignin as revealed by analytical pyrolysis, 2D-NMR, and reductive cleavage methods. J. Agric. Food Chem. 2012, 60, 5922–5935. [Google Scholar] [CrossRef] [Green Version]
  9. Grabber, J.; Ralph, J.; Hatfield, R.D. Cross-linking of maize walls by ferulate dimerization and Incorporation into lignin. J. Agric. food Chem. 2000, 48, 6106–6113. [Google Scholar] [CrossRef]
  10. Rencoret, J.; Ralph, J.; Kim, H.; Gutiérrez, A.; Carlos del Río, J. Hydroxystilbenes are monomers in palm fruit endocarp lignins. Plant Physiol. 2017, 174, 2072–2082. [Google Scholar] [CrossRef]
  11. Dima, O.; Morreel, K.; Vanholme, B.; Kim, H.; Ralph, J.; Boerjan, W. Small glycosylated lignin oligomers are stored in Arabidopsis leaf vacuoles. Plant Cell 2015, 27, 695–710. [Google Scholar] [CrossRef] [PubMed] [Green Version]
  12. Le Roy, J.; Blervacq, A.S.; Créach, A.; Huss, B.; Hawkins, S.; Neutelings, G. Spatial regulation of monolignol biosynthesis and laccase genes control developmental and stress-related lignin in flax. BMC Plant Biol. 2017, 17. [Google Scholar] [CrossRef] [PubMed]
  13. Le Roy, J.; Huss, B.; Creach, A.; Hawkins, S.; Neutelings, G. Glycosylation is a major regulator of phenylpropanoid availability and biological activity in plants. Front. Plant Sci. 2016, 7, 735. [Google Scholar] [CrossRef] [PubMed] [Green Version]
  14. Anderson, N.A.; Chapple, C. Perturbing lignin biosynthesis: Metabolic changes in response to manipulation of the phenylpropanoid pathway. In Recent Advances in Polyphenol Research; John Wiley & Sons, Ltd.: Chichester, UK, 2014; pp. 39–59. [Google Scholar]
  15. Alejandro, S.; Lee, Y.; Tohge, T.; Sudre, D.; Osorio, S.; Park, J.; Bovet, L.; Lee, Y.; Geldner, N.; Fernie, A.R.; et al. AtABCG29 is a monolignol transporter involved in lignin biosynthesis. Curr. Biol. 2012, 22, 1207–1212. [Google Scholar] [CrossRef] [PubMed] [Green Version]
  16. Takeuchi, M.; Watanabe, A.; Tamura, M.; Tsutsumi, Y. The gene expression analysis of Arabidopsis thaliana ABC transporters by real-time PCR for screening monolignol-transporter candidates. J. Wood Sci. 2018, 64, 477–484. [Google Scholar] [CrossRef] [Green Version]
  17. Perkins, M.; Smith, R.A.; Samuels, L. The transport of monomers during lignification in plants: Anything goes but how ? Curr. Opin. Biotechnol. 2019, 56, 69–74. [Google Scholar] [CrossRef]
  18. Vermaas, J.V.; Dixon, R.A.; Chen, F.; Mansfield, S.D.; Boerjan, W.; Ralph, J.; Crowley, M.F.; Beckham, G.T. Passive membrane transport of lignin-related compounds. Proc. Natl. Acad. Sci. USA 2019, 116, 23117–23123. [Google Scholar] [CrossRef]
  19. Lim, E.K.; Jackson, R.G.; Bowles, D.J. Identification and characterisation of Arabidopsis glycosyltransferases capable of glucosylating coniferyl aldehyde and sinapyl aldehyde. FEBS Lett. 2005, 579, 2802–2806. [Google Scholar] [CrossRef] [Green Version]
  20. Freudenberg, K.; Harkin, J.M. The glucosides of cambial sap of spruce. Phytochemistry 1963, 2, 189–193. [Google Scholar] [CrossRef]
  21. Terazawa, M.; Okuyama, H.; Miyake, M. Phenolic compounds in living tissue of woods, I: Phenolic beta-glucosides of 4-hydroxycinnamyl alcohol derivatives in the cambial sap of woods. Mokuzai Gakkaishi 1984, 30, 322–328. [Google Scholar]
  22. Savidge, R.A. Coniferin a biochemical indicator of committment to tracheid differentiation in conifers. Can. J. Bot. 1989, 67, 2663–2668. [Google Scholar] [CrossRef]
  23. Fukushima, K.; Taguchi, S.; Matsui, N.; Yasuda, S. Distribution and seasonal changes of monolignol glucosides in Pinus thunbergii. Mokuzai Gakkaishi 1997, 43, 254–259. [Google Scholar]
  24. Tsuyama, T.; Takabe, K. Distribution of lignin and lignin precursors in differentiating xylem of Japanese cypress and poplar. J. Wood Sci. 2014, 60, 353–361. [Google Scholar] [CrossRef]
  25. Yoshinaga, A.; Kamitakahara, H.; Takabe, K. Distribution of coniferin in differentiating normal and compression woods using MALDI mass spectrometric imaging coupled with osmium tetroxide vapor treatment. Tree Physiol. 2016, 36, 643–652. [Google Scholar] [CrossRef]
  26. Barros, J.; Serk, H.; Granlund, I.; Pesquet, E. The cell biology of lignification in higher plants. Ann. Bot. 2015, 115, 1053–1074. [Google Scholar] [CrossRef] [Green Version]
  27. Wang, Y.; Chantreau, M.; Sibout, R.; Hawkins, S. Plant cell wall lignification and monolignol metabolism. Front. Plant Sci. 2013, 4, 1–14. [Google Scholar] [CrossRef] [Green Version]
  28. Wang, Y.W.; Wang, W.C.; Jin, S.H.; Wang, J.; Wang, B.; Hou, B.K. Over-expression of a putative poplar glycosyltransferase gene, PtGT1, in tobacco increases lignin content and causes early flowering. J. Exp. Bot. 2012, 63, 2799–2808. [Google Scholar] [CrossRef]
  29. Lin, J.S.; Huang, X.X.; Li, Q.; Cao, Y.; Bao, Y.; Meng, X.F.; Li, Y.J.; Fu, C.; Hou, B.K. UDP-glycosyltransferase 72B1 catalyzes the glucose conjugation of monolignols and is essential for the normal cell wall lignification in Arabidopsis thaliana. Plant J. 2016, 88, 26–42. [Google Scholar] [CrossRef] [Green Version]
  30. Boyes, D.C.; Zayed, A.M.; Ascenzi, R.; McCaskill, A.J.; Hoffman, N.E.; Davis, K.R.; Görlach, J. Growth stage-based phenotypic analysis of Arabidopsis: A model for high throughput functional genomics in plants. Plant Cell 2001, 13, 1499–1510. [Google Scholar] [CrossRef] [Green Version]
  31. Baldacci-Cresp, F.; Spriet, C.; Twyffels, L.; Blervacq, A.S.; Neutelings, G.; Baucher, M.; Hawkins, S. A rapid and quantitative safranin-based fluorescent microscopy method to evaluate cell wall lignification. Plant J. 2020, 102, 1074–1089. [Google Scholar] [CrossRef]
  32. Gelvin, S.B. Integration of Agrobacterium T-DNA into the Plant Genome. Annu. Rev. Genet. 2017, 51, 195–217. [Google Scholar] [CrossRef] [PubMed]
  33. Schubert, D.; Lechtenberg, B.; Forsbach, A.; Gils, M.; Bahadur, S.; Schmidt, R. Silencing in Arabidopsis T-DNA transformants: The predominant role of a gene-specific RNA sensing mechanism versus position effects. Plant Cell 2004, 16, 2561–2572. [Google Scholar] [CrossRef] [PubMed] [Green Version]
  34. Chandler, C.H.; Chari, S.; Kowalski, A.; Choi, L.; Tack, D.; DeNieu, M.; Pitchers, W.; Sonnenschein, A.; Marvin, L.; Hummel, K.; et al. How well do you know your mutation? Complex effects of genetic background on expressivity, complementation, and ordering of allelic effects. PLoS Genet. 2017, 13, 1–25. [Google Scholar] [CrossRef] [PubMed]
  35. Winters, Y.D.; Lowenstein, T.K.; Timofeeff, M.N. Identification of carotenoids in ancient salt from death valley, saline valley, and searles lake, California, using laser raman spectroscopy. Astrobiology 2013, 13, 1065–1080. [Google Scholar] [CrossRef]
  36. Simon, C.; Lion, C.; Spriet, C.; Baldacci-Cresp, F.; Hawkins, S.; Biot, C. One, two, three: A bioorthogonal triple labelling strategy for studying the dynamics of plant cell wall formation In vivo. Angew. Chem.-Int. Ed. 2018, 57, 16665–16671. [Google Scholar] [CrossRef]
  37. Shigeto, J.; Kiyonaga, Y.; Fujita, K.; Kondo, R.; Tsutsumi, Y. Putative cationic cell-wall-bound peroxidase homologues in Arabidopsis, AtPrx2, AtPrx25, and AtPrx71, are involved in lignification. J. Agric. Food Chem. 2013, 61, 3781–3788. [Google Scholar] [CrossRef]
  38. Shigeto, J.; Itoh, Y.; Hirao, S.; Ohira, K.; Fujita, K.; Tsutsumi, Y. Simultaneously disrupting AtPrx2, AtPrx25 and AtPrx71 alters lignin content and structure in Arabidopsis stem. J. Integr. Plant Biol. 2015, 57, 349–356. [Google Scholar] [CrossRef]
  39. Tokunaga, N.; Kaneta, T.; Sato, S.; Sato, Y. Analysis of expression profiles of three peroxidase genes associated with lignification in Arabidopsis thaliana. Physiol. Plant. 2009, 136, 237–249. [Google Scholar] [CrossRef]
  40. Yi Chou, E.; Schuetz, M.; Hoffmann, N.; Watanabe, Y.; Sibout, R.; Samuels, A.L. Distribution, mobility, and anchoring of lignin-related oxidative enzymes in Arabidopsis secondary cell walls. J. Exp. Bot. 2018, 69, 1849–1859. [Google Scholar] [CrossRef]
  41. Berthet, S.; Demont-Caulet, N.; Pollet, B.; Bidzinski, P.; Cezard, L.; Le Bris, P.; Borrega, N.; Herve, J.; Blondet, E.; Balzergue, S.; et al. Disruption of LACCASE4 and 17 results in tissue-specific alterations to lignification of Arabidopsis thaliana stems. Plant Cell 2011, 23, 1124–1137. [Google Scholar] [CrossRef] [Green Version]
  42. Campbell, J.A.; Davies, G.J.; Bulone, V.; Henrissat, B. A classification of nucleotide-diphospho-sugar glycosyltransferases based on amino acid sequence similarities. Biochem. J. 1997, 326 Pt 3, 929–939. [Google Scholar] [CrossRef]
  43. Gachon, C.M.M.; Langlois-Meurinne, M.; Saindrenan, P. Plant secondary metabolism glycosyltransferases: The emerging functional analysis. Trends Plant Sci. 2005, 10, 542–549. [Google Scholar] [CrossRef] [PubMed]
  44. Wilson, A.E.; Tian, L. Phylogenomic analysis of UDP-dependent glycosyltransferases provides insights into the evolutionary landscape of glycosylation in plant metabolism. Plant J. 2019, 100, 1273–1288. [Google Scholar] [CrossRef] [PubMed]
  45. Lanot, A.; Hodge, D.; Jackson, R.G.; George, G.L.; Elias, L.; Lim, E.K.; Vaistij, F.E.; Bowles, D.J. The glucosyltransferase UGT72E2 is responsible for monolignol 4-O-glucoside production in Arabidopsis thaliana. Plant J. 2006, 48, 286–295. [Google Scholar] [CrossRef]
  46. Johnson, D.B.; Moore, W.E.; Zank, L.C. The spectrophotometric determination of lignin in small wood samples. Tappi 1961, 44, 793–798. [Google Scholar]
  47. Hatfield, R.D.; Grabber, J.; Ralph, J.; Brei, K. Using the acetyl bromide assay to determine lignin concentrations in herbaceous plants: Some cautionary notes. J. Agric. Food Chem. 1999, 47, 628–632. [Google Scholar] [CrossRef]
  48. Moreira-Vilar, F.C.; Siqueira-Soares, R.D.C.; Finger-Teixeira, A.; De Oliveira, D.M.; Ferro, A.P.; Da Rocha, G.J.; Ferrarese, M.D.L.L.; Dos Santos, W.D.; Ferrarese-Filho, O. The acetyl bromide method is faster, simpler and presents best recovery of lignin in different herbaceous tissues than klason and thioglycolic acid methods. PLoS ONE 2014, 9, e110000. [Google Scholar] [CrossRef] [Green Version]
  49. Simon, C.; Lion, C.; Biot, C.; Gierlinger, N.; Hawkins, S. Lignification and Advances in Lignin Imaging in Plant Cell Walls; Wiley Online Library: Hoboken, NJ, USA, 2018; Volume 1, ISBN 9781119312994. [Google Scholar]
  50. Chantreau, M.; Portelette, A.; Dauwe, R.; Kiyoto, S.; Crônier, D.; Morreel, K.; Arribat, S.; Neutelings, G.; Chabi, M.; Boerjan, W.; et al. Ectopic lignification in the flax lignified bast fiber1 mutant stem is associated with tissue-specific modifications in gene expression and cell wall composition. Plant Cell 2014, 26. [Google Scholar] [CrossRef] [Green Version]
  51. Tadege, M.; Chen, F.; Murray, J.; Wen, J.; Ratet, P.; Udvardi, M.K.; Dixon, R.A.; Mysore, K.S. Control of vegetative to reproductive phase transition Improves biomass yield and simultaneously reduces lignin content in Medicago truncatula. Bioenergy Res. 2015, 8, 857–867. [Google Scholar] [CrossRef]
  52. Vermerris, W.; Thompson, K.J.; McIntyre, L.M. The maize Brown midrib 1 locus affects cell wall composition and plant development in a dose-dependent manner. Heredity (Edinb) 2002, 88, 450–457. [Google Scholar] [CrossRef]
  53. Miao, Y.-C.; Liu, C.-J. ATP-binding cassette-like transporters are involved in the transport of lignin precursors across plasma and vacuolar membranes. Proc. Natl. Acad. Sci. USA 2010, 107, 22728–22733. [Google Scholar] [CrossRef] [PubMed] [Green Version]
  54. Qin, G.; Liu, C.; Li, J.; Qi, Y.; Gao, Z.; Zhang, X.; Yi, X.; Pan, H.; Ming, R.; Xu, Y. Diversity of metabolite accumulation patterns in inner and outer seed coats of pomegranate: Exploring their relationship with genetic mechanisms of seed coat development. Hortic. Res. 2020, 7. [Google Scholar] [CrossRef] [PubMed] [Green Version]
  55. Huis, R.; Morreel, K.; Fliniaux, O.; Lucau-Danila, A.; Fenart, S.; Grec, S.; Neutelings, G.; Chabbert, B.; Mesnard, F.; Boerjan, W.; et al. Natural hypolignification Is associated with extensive oligolignol accumulation in flax stems. Plant Physiol. 2012, 158, 1893–1915. [Google Scholar] [CrossRef] [PubMed] [Green Version]
  56. Schindelin, J.; Arganda-Carreras, I.; Frise, E.; Kaynig, V.; Longair, M.; Pietzsch, T.; Preibisch, S.; Rueden, C.; Saalfeld, S.; Schmid, B.; et al. Fiji: An open-source platform for biological-image analysis. Nat. Methods 2012, 9, 676–682. [Google Scholar] [CrossRef] [Green Version]
  57. Czechowski, T.; Stitt, M.; Altmann, T.; Udvardi, M.K.; Scheible, W.-R. Genome-wide identification and testing of superior reference genes for transcript normalization in Arabidopsis. Plant Physiol. 2005, 139, 5–17. [Google Scholar] [CrossRef] [Green Version]
  58. Pfaffl, M.W. A new mathematical model for relative quantification in real-time RT-PCR. Nucleic Acids Res. 2001, 29, e45. [Google Scholar] [CrossRef]
  59. Mansfield, S.D.; Kim, H.; Lu, F.; Ralph, J. Whole plant cell wall characterization using solution-state 2D NMR. Nat. Protoc. 2012, 7, 1579–1589. [Google Scholar] [CrossRef]
  60. Iiyama, K.; Wallis, A.F.A. Determination of lignin in herbaceous plants by an improved acetyl bromide procedure. J. Sci. Food Agric. 1990, 51, 145–161. [Google Scholar] [CrossRef]
  61. Simon, C.; Spriet, C.; Hawkins, S.; Lion, C. Visualizing lignification dynamics in plants with click chemistry: Dual labeling is BLISS! JoVE 2018, 131, e56947. [Google Scholar] [CrossRef] [Green Version]
  62. Lion, C.; Simon, C.; Huss, B.; Blervacq, A.S.; Tirot, L.; Toybou, D.; Spriet, C.; Slomianny, C.; Guerardel, Y.; Hawkins, S.; et al. BLISS: A bioorthogonal dual-labeling strategy to unravel lignification dynamics in plants. Cell Chem. Biol. 2017, 24, 326–338. [Google Scholar] [CrossRef] [Green Version]
Figure 1. Effect of UGT72E gene mutation on the development of Arabidopsis thaliana. (A). Rosette surface sizes after 28 days of growth. (B). Average age of the plants when the flowering stem reached stage 5.1. (C): Distribution curve showing the ages of plants within the different genotypes at the flowering stem stage 5.1. Means (+ SD) with the same lowercase letters are not significantly different according to Anova completed with Tukey post-hoc test (p-value < 0.01; n > 70).
Ijms 21 06094 g001
Figure 2. Expression analyses of UGT72E genes in wild type (WT) and ugt72e mutants. RT-qPCR was used to measure the expression of the genes in the old and young parts of the stem. The values are expressed relative to the WT old stem fragments for each analyzed gene. The expression of the genes corresponding to the mutants is null so was not tested statistically. PP2A (AT1G13320) and PEROXIN4 (AT5G25760) were used as internal reference genes. Means with the same lowercase letters are not significantly different according to Duncan test (p-value < 0.05, n = 3).
Ijms 21 06094 g002
Figure 3. Comparison of floral stem lignin content in WT and ugt72e mutants. The lignin dosage was performed by the acetyl bromide method in the young (A) parts (n = 5 replicates each containing 8 fragments) and old (B) parts (n = 5 replicates; each containing 4 fragments) of the floral stems. Values are expressed as mean values (±SD). No significant differences were shown by a Kruskal–Wallis test. CWR = cell wall residue.
Ijms 21 06094 g003
Figure 4. Local lignin content determination on the young parts of the floral stems using safranin O fluorescence-based method on WT and ugt72e mutants. The safranin O ratiometric images are shown in (A) and (C). The colour range used for image representation varies from the non-normalized ratio 0 (purple) to non-normalized ratio 1.5 (red). Scale bar = 50 µm. Quantification was performed on interfascicular fibers (B) and xylem (D). The normalized safranin intensity ratios (± SD) are represented. Means (± SD) with the same lowercase letters are not significantly different according to Student t-test (p-value < 0.01, n = 3).
Ijms 21 06094 g004
Figure 5. Local lignin content determination on the old parts of the floral stems using safranin O fluorescence-based method on WT and ugt72e mutants. The safranin O ratiometric images are shown in (A) and (C). The color range used for image representation varies from the non-normalized ratio 0 (purple) to non-normalized ratio 1.5 (red). Scale bar = 50 µm. Quantification was performed on interfascicular fibers (B) and xylem (D). The normalized safranin intensity ratios (± SD) are represented. Means (± SD) with the same lowercase letters are not significantly different according to Student t-test (p-value < 0.01, n = 3).
Ijms 21 06094 g005
Figure 6. Raman microspectroscopy and principal component analyses (PCA) of WT and ugt72e3 interfascicular fibers. The results are shown for the young (AC) and old (DF) parts of the floral stem. (A,D): Baseline corrected average spectra from 300 cm−1 to 2000 cm−1. The red spectrum corresponds to the WT and the blue to ugt72e3. Arrows indicate major peak Raman shift wavenumbers. (B,E): Principal component one (PC1) scores of individual WT (red) and ugt72e3 (blue) spectra following PCA. Each point represented corresponds to an independent individual. (C,F): Loading vectors for PC1 indicating peaks contributing to the corresponding PC1 scores.
Ijms 21 06094 g006
Figure 7. Monolignol incorporation capacity in the young part of the floral stem. The capacity of cell walls to incorporate monolignols into cell walls was evaluated by measuring the signal of fluorescent probes bound to monolignol chemical reporters metabolically incorporated into the lignin polymer. The tagged monolignol associated incorporation signal was localized in the interfascicular fibers and xylem cell walls (A,C). Haz tagged lignin reporter unit signal appears in green, Galk in red and Scp in purple. Scale bar = 50 µm. The associated incorporation signal was quantified in ugt72e3 and compared to the WT (B,D). Means (± SD) with the same lowercase letters are not significantly different according to Student t-test (p-value < 0.01, n = 3).
Ijms 21 06094 g007
Figure 8. Monolignol incorporation capacity in the old part of the floral stem. The capacity of cell walls to incorporate monolignols into cell walls was evaluated by measuring the signal of fluorescent probes bound to monolignol chemical reporters metabolically incorporated into the lignin polymer. The tagged monolignol associated incorporation signal was localized in the interfascicular fibers and xylem cell walls (A,C). Haz tagged lignin reporter unit signal appears in green, Galk in red and Scp in purple. Scale bar = 50 µm. The associated incorporation signal was quantified in ugt72e3 and compared to the WT (B,D). Means (± SD) with the same lowercase letters are not significantly different according to Student t-test (p-value < 0.01, n = 3).
Ijms 21 06094 g008
Figure 9. Expression analyses of UGT72B genes in WT and ugt72e3. RT-qPCR was used to measure the expression of the genes in the old and young parts of the stem. The values are expressed relative to the WT old stem fragments for each analyzed gene. PP2A (AT1G13320) and PEROXIN4 (AT5G25760) were used as internal reference genes. Means (± SD) with the same lowercase letters are not significantly different according to Duncan test (p-value < 0.05, n = 3).
Ijms 21 06094 g009
Figure 10. Expression analyses of selected laccases and peroxidases in WT and ugt72e3. PRX25, PRX64, PRX71, LAC4, and LAC17, genes were tested by RT-qPCR to measure the expression of the genes in the old and young parts of the stem. The values were relative to the WT old stem fragments for each analyzed gene. PP2A (AT1G13320) and PEROXIN4 (AT5G25760) were used as internal reference genes. Means (± SD) with the same lowercase letters are not significantly different according to Duncan test (p-value < 0.05, n = 3).
Ijms 21 06094 g010

