Article

Mapping and Identifying a Candidate Gene Plr4, a Recessive Gene Regulating Purple Leaf in Rice, by Using Bulked Segregant and Transcriptome Analysis with Next-Generation Sequencing

1
Guangxi Crop Genetic Improvement and Biotechnology Laboratory, Guangxi Academy of Agricultural Sciences, Nanning 530007, China
2
Rice Research Institute, Guangxi Academy of Agricultural Sciences, Nanning 530007, China
*
Authors to whom correspondence should be addressed.
These authors have contributed equally to this work.
Int. J. Mol. Sci. 2019, 20(18), 4335; https://doi.org/10.3390/ijms20184335
Submission received: 4 August 2019 / Revised: 1 September 2019 / Accepted: 2 September 2019 / Published: 4 September 2019
(This article belongs to the Section Molecular Genetics and Genomics)

Abstract

:
The anthocyanin biosynthesis of rice is a major concern due to the potential nutritional value. Purple appears in various organs and tissues of rice such as pericarp, flower organs, leaves, leaf sheaths, internodes, ligules, apex, and stigma. At present, there are many studies on the color of rice pericarp, but the gene and mechanism of other organs such as leaves are still unclear, and the gene regulatory network of specific organ coloring has not been systematically understood. In this study, genetic analysis demonstrated that the purple leaf traits of rice were regulated by a recessive gene. The green leaf cultivar Y58S and purple leaf cultivar XianHongB were used to construct the mapping population. A set of near isogenicline (NIL) (BC3F1) was bred via crossing and back-crossing. The generations of BC3F2 appeared to separate four phenotypes, pl1, pl2, pl3, and pl4, due to the occurrence of a purple color in different organs. We constructed three bulked segregant analysis (BSA) pools (pl1–pl2, pl1–pl3, and pl1–pl4) by using the separated generations of BC3F5 and mapped the purple leaf gene plr4 to the vicinity of 27.9–31.1 Mb on chromosome 4. Subsequently, transcriptome sequencing (RNA-Seq) for pl3 and pl2 was used to analyze the differentially expressed genes in the localization interval, where 12 unigenes exhibited differential expression in which two genes (Os04g0577800, Os04g0616400) were downregulated. The two downregulated genes (Os04g0577800 and Os04g0616400) are possible candidate genes because of the recessive genetic characteristics of the purple leaf genes. These results will facilitate the cloning of plr4 and illustrate the molecular mechanisms of the anthocyanin synthesis pathway.

1. Introduction

Anthocyanin is a strong antioxidant, which brings various colors to plant organs and exerts obvious effects on human health. The anthocyanin biosynthetic pathway is a branch of the plant flavonoid pathway, and its biosynthetic pathway has been relatively clear in the study of model plants such as Arabidopsis thaliana, maize, and petunia, where many key genes have been cloned. Anthocyanin biosynthesis is jointly controlled by two types of genes: structural genes including CHS, CHI, F3H, F3′H, F3′5′H, dihydroflavonol-4-reductase(DFR), ANS, and 3GT [1,2,3,4,5,6,7], which encode various enzymes required for anthocyanin biosynthesis pathways [8]; and regulatory genes, which encode transcription factors that regulate the spatio-temporal expression of structural genes including the R2R3-MYB protein, MYC family of basic helix–loop–helix (bHLH) proteins, and WD40 protein gene family. The regulatory process may be completed by a complex comprising a transcription factor containing a R2R3-Myb DNA binding domain, a transcription factor containing a bHLH domain, and a protein containing WD repeats. These two types of genes work together to control the distribution of anthocyanins in plants organs [9,10]. The R gene family including R, B, Lc, and Sn genes regulate the organ-specific pigmentation patterns [11].
Rice is one of the most important food crops for humans, and anthocyanin biosynthesis has been widely studied in rice. Through homologous gene cloning, the genes of CHS, CHI, ANS, and DFR have been identified in rice [12,13,14]. Some anthocyanin transcription factors have been reported such as OsC1, Ra, Rb, Rc, Rd, OsB1, and OsB2. The OsC1 gene of rice is highly homologous to the C1 gene on chromosome 9 of maize, which is located on the short arm of chromosome 6 [15] and encodes the transcription factor of the R2R3-Myb family; this family of transcription factors plays a key role in the biosynthesis of anthocyanin in rice [12,16,17,18,19]. The genes of Ra, Rb, Rc, and Rd belong to the R/B gene family. Ra is the homologous gene of the maize R/B gene that is located on chromosome 4 of rice, encodes a transcription factor of the bHLH domain, is composed of two genes Ra1 and Ra2, and plays an important role in the anthocyanin biosynthesis pathway. It is an important gene for black pericarpin rice [20]. The Rb gene, which is located on chromosome 1 of rice, can induce pigment accumulation in maize suspension cells [21]. The Rc and Rd genes, which encode bHLH protein, are positive regulators of proanthocyanidin synthesis, which is related to the color of the testa [22,23]. The Rc gene, which is located on chromosome 7 of rice, encodes the bHLH class transcription factor [22]. The Rd gene is homologous to the A gene of maize and is located on chromosome 1, which encodes DFR [23].
The accumulation of flavonoids, organs, and tissues in rice (Oryza sativa) can be purple, brown, or red in color. The potential nutritional value of colored pericarp has attracted attention, with geneticists and breeders having conducted a lot of research on this area. However, its location distribution mechanism in various tissues and organs has not been clearly studied. The accumulated anthocyanin of purple pericarp (or black rice) can be controlled by three alleles loci for Kala1, Kala3, and Kala4 (OsB2) [24,25]. Kala4, a transcriptional regulator of myc type in rice, is located at the same gene locus as OsB2. It has been reported that OsB2 is related to the accumulation of pigments in rice leaves [26]. Oikawa et al. found that the promoter structure of OsB2 (Os04g0557500) gene was rearranged due to the insertion of a retrotransposon, which led to the ectopic expression of OsB2 and the production of black rice [27]. The red pericarp is produced by the accumulation of proanthocyanidins. The synthesis of proanthocyanidins is regulated by the interaction of Rc (bHLH) and Rd (DFR) genes. The production of brown pericarp is involved only in the Rc gene, but not in the Rd gene [22,23]. The C–S–A gene model was proposed for rice hull pigmentation. C1 (Os06g0205100, OsC1) is a color-producing gene that acts as a switch in controlling color production and produces a brown color when working alone, but produces a purple color when used in combination with A1 (Os01g0633500, DFR). In addition, purple and brown hulls require a functional S1 (Os04g0557500); otherwise, these two colors will only occur in the apiculus [28]. Transcriptome and proteome profiling of red, black, and white rice revealed 32 genes involved in the flavonoid biosynthesis pathway on the basis of differential enrichment analysis in which only CHI, F3H, ANS, and FLS were detected by isobaric tags for relative and absolute quantification analyses [29].
A purple color occurs in organs and tissues such as pericarp, floral organs, leaves, leaf sheaths, internodes, ligules, apiculus, and stigma. Up to now, there have been many studies on the pericarp color of rice, but the pattern and gene of other organ coloration are still unclear, and the gene regulatory network of specific organ coloration has not been systematically understood. Moreover, the plw locus contains two adjacent genes, OsB1 and OsB2, which are responsible for leaf coloration, but their functions at the molecular level have not been clarified [26]. The plw gene is located on chromosome 4 of rice and is a regulatory factor controlling the synthesis of anthocyanidin in rice leaf tissue. The plw gene not only stains all aerial tissues, except for the internodes, but also displays purple pericarp [26]. The OsB1 and Ra1 genes are the same gene loci [20]. The OsB2 gene is a myc transcriptional regulator in rice that is involved in pigment accumulation in rice leaves. In black pericarp rice, the promoter structure of the OsB2 gene is rearranged due to the insertion of a retrotransposon, resulting in the ectopic expression of OsB2 and the production of black pericarp rice [27].
Purple leaf trait is a special leaf color marker trait with a stable expression and easy identification during the whole growth period. In addition to the molecular mechanism of anthocyanin regulation, it can be used in hybrid rice breeding such as two-line hybrid rice. Considering its own seed quality or the influence of weather, the two-line sterile line of rice often has 3–5% self-crossing hybrid seeds, which causes a loss of 500–600 million kg of rice annually in China. When the purple leaf character is introduced into the two-line sterile line, the true hybrid and self-fertile seeds can be identified based on leaf color, which can effectively and conveniently solve the problem of false hybrid identification in hybrid rice seed production.
In this study, genetic analysis demonstrated that the purple leaf traits of rice were regulated by recessive genes. Through bulked segregant analysis (BSA) with next-generation sequencing (BSA-Seq) and transcriptome sequencing (RNA-Seq) strategies, we identified plr4, which is a new gene that regulates purple leaf in rice.

2. Results

2.1. Statistical Analysis of Phenotypes and Genetics of Rice’s Purple Leaf Trait

The rice variety XianhongB, a fertility restorer line with purple coloration in the leaves, leaf sheaths, leaf rings, stems, and lemma, was selected as the donor parent. The rice variety Y58S, a male sterile line that appears as a whole green plant and with white stigma, was selected as the recipient parent. The plants of the F1 hybrid by crossing XianhongB with Y58S demonstrated green leaves and purple coloration in the leaf sheaths, leaf rings, stems, and lemma, indicating that the purple leaf of this rice variant was controlled by the recessive gene. A set of near isogenic lines (BC3F1) was bred via crossing and back-crossing with XianhongB and Y58S. The generations of BC3F2 were separated into four phenotypes: pl1, pl2, pl3, and pl4. pl1 was a whole green plant and with white stigma, the same as Y58S. pl2 exhibited purple coloration in the leaves, leaf sheaths, leaf margin, lemma tip, and stigma with the same traits as XianhongB. pl3 showed green leaves with purple coloration in the leaf sheaths, leaf margin, lemma tip, and stigma. pl4 presented green leaves and white stigma with purple coloration in the leaf sheaths, leaf margin, and lemma tip. The offspring of pl1, pl2, and pl4 were not separated in phenotype. The phenotype of the offspring of pl3 was separated into pl1, pl2, pl3, and pl4. Hence, the separated generations of BC3F5 and BC3F6 of pl3 were selected to map the purple leaf gene plr4 (Figure 1 and Figure 2).

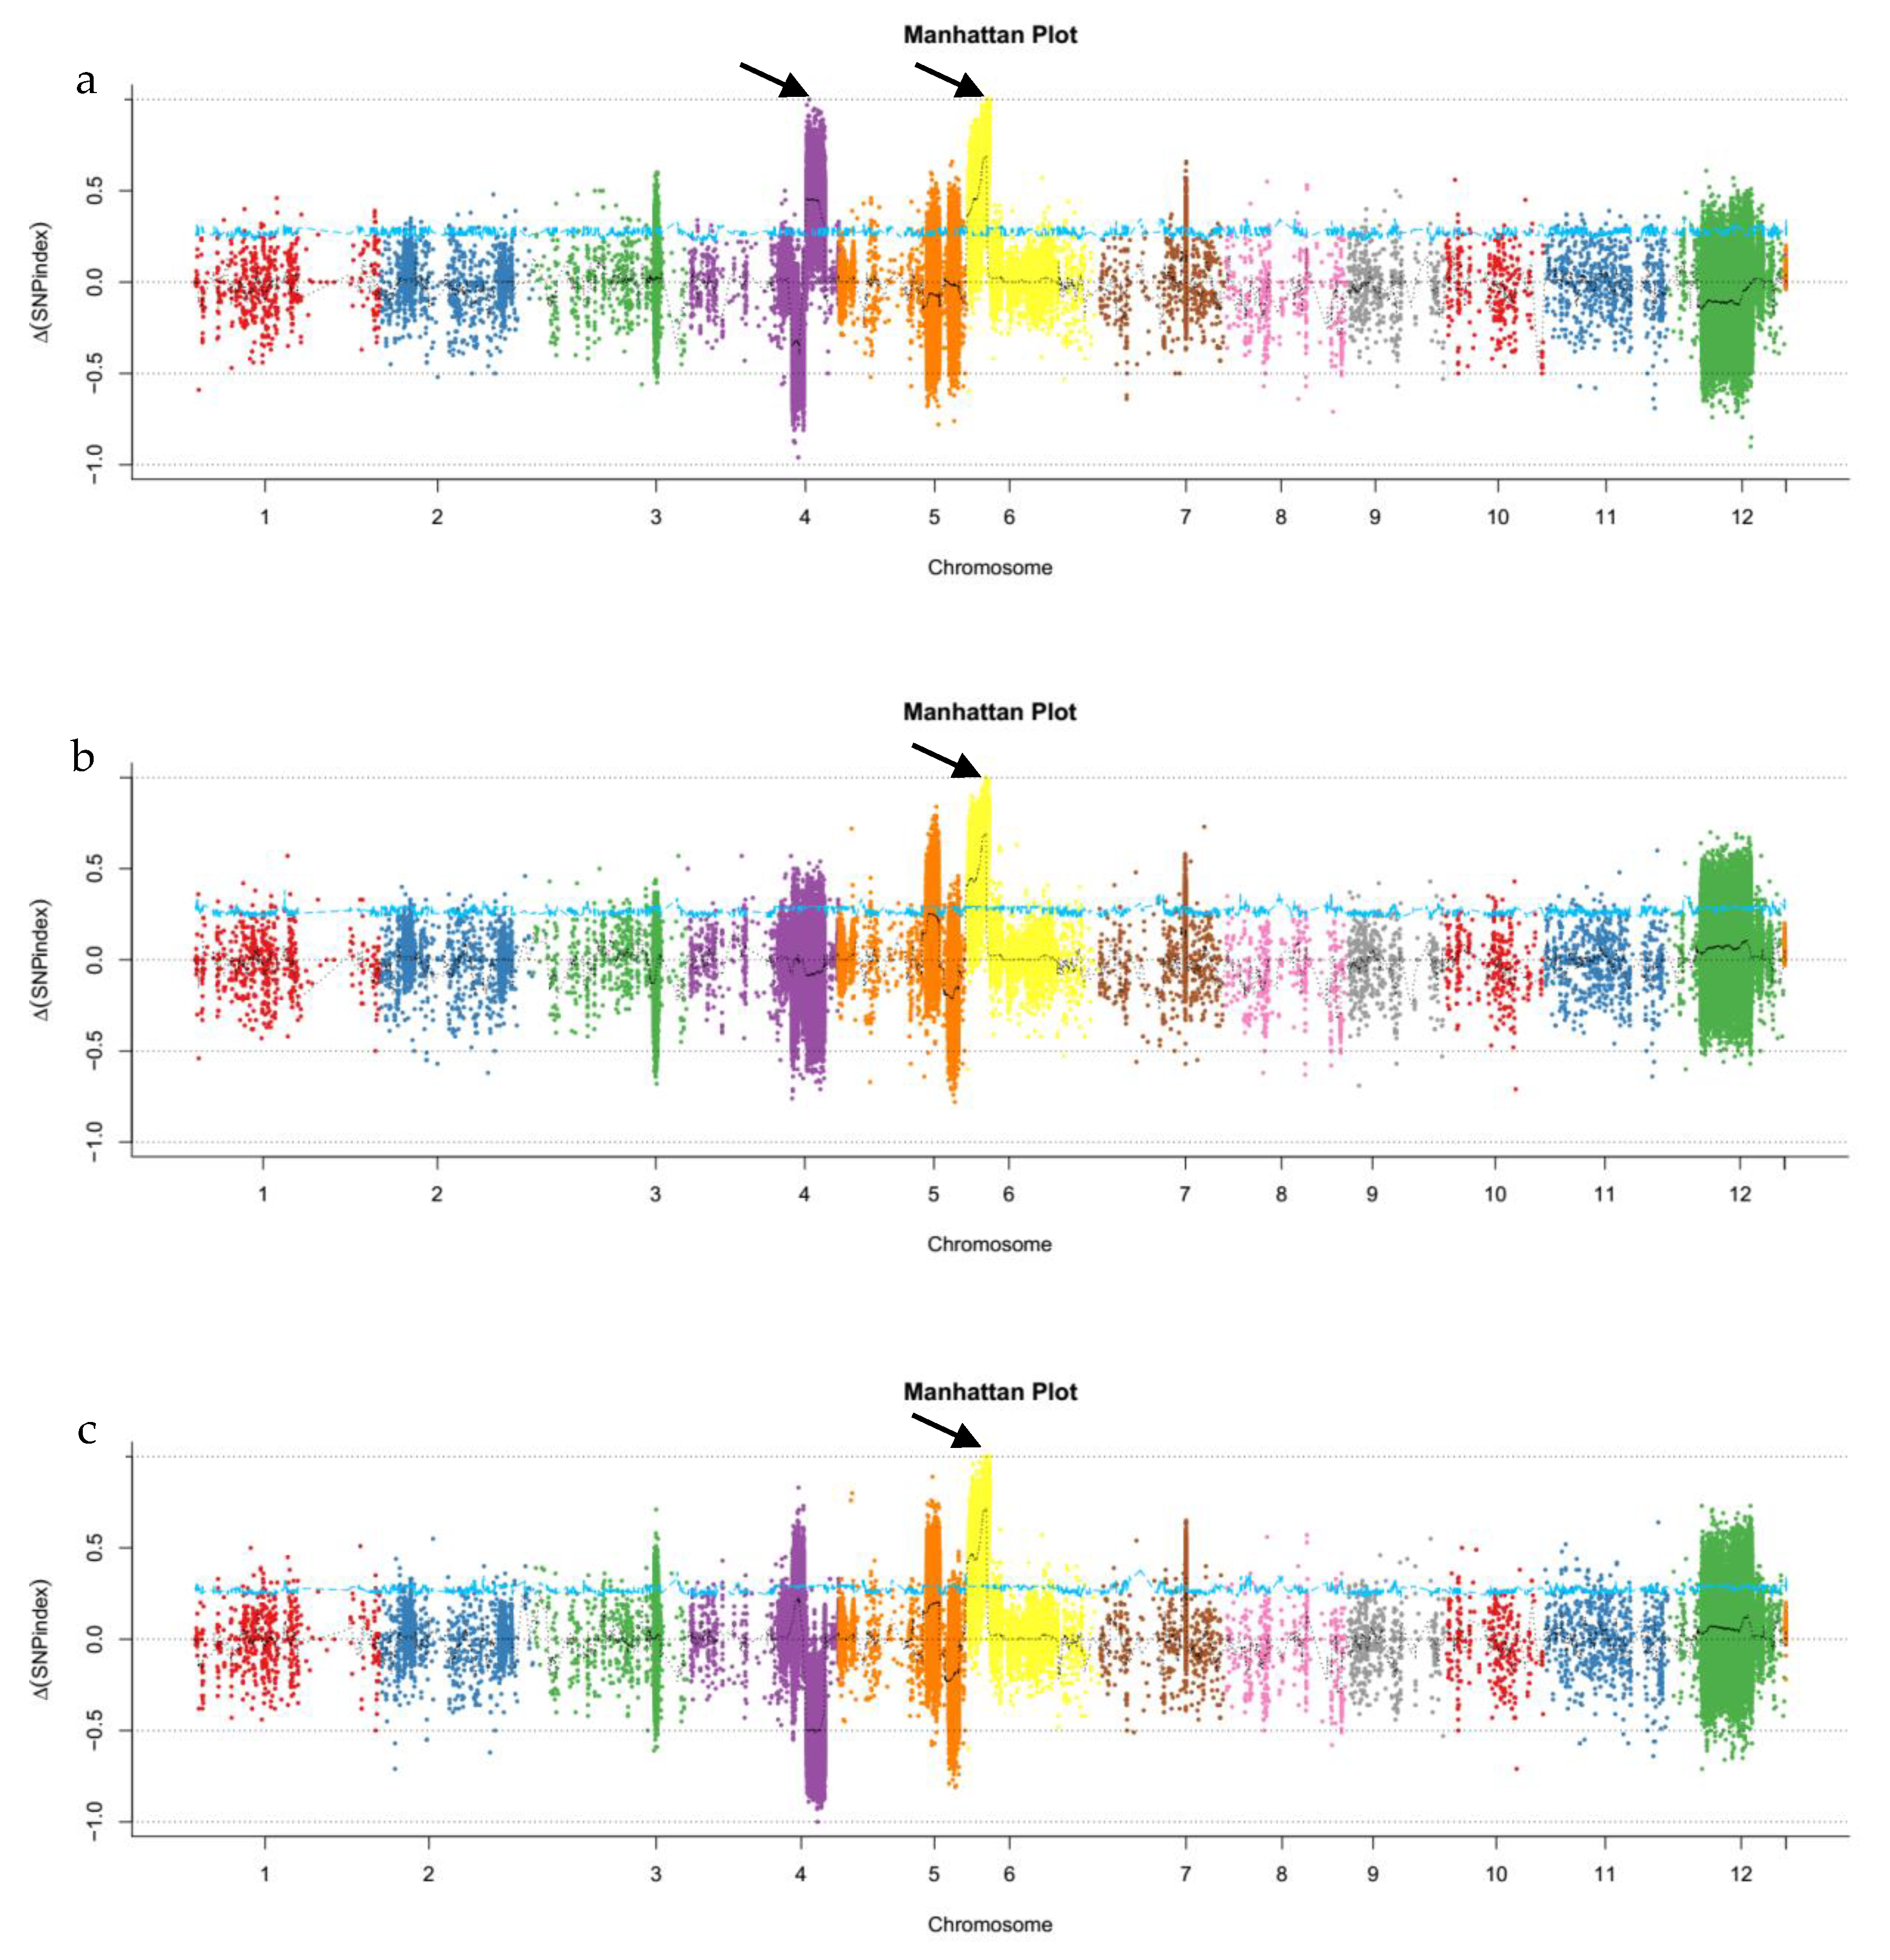
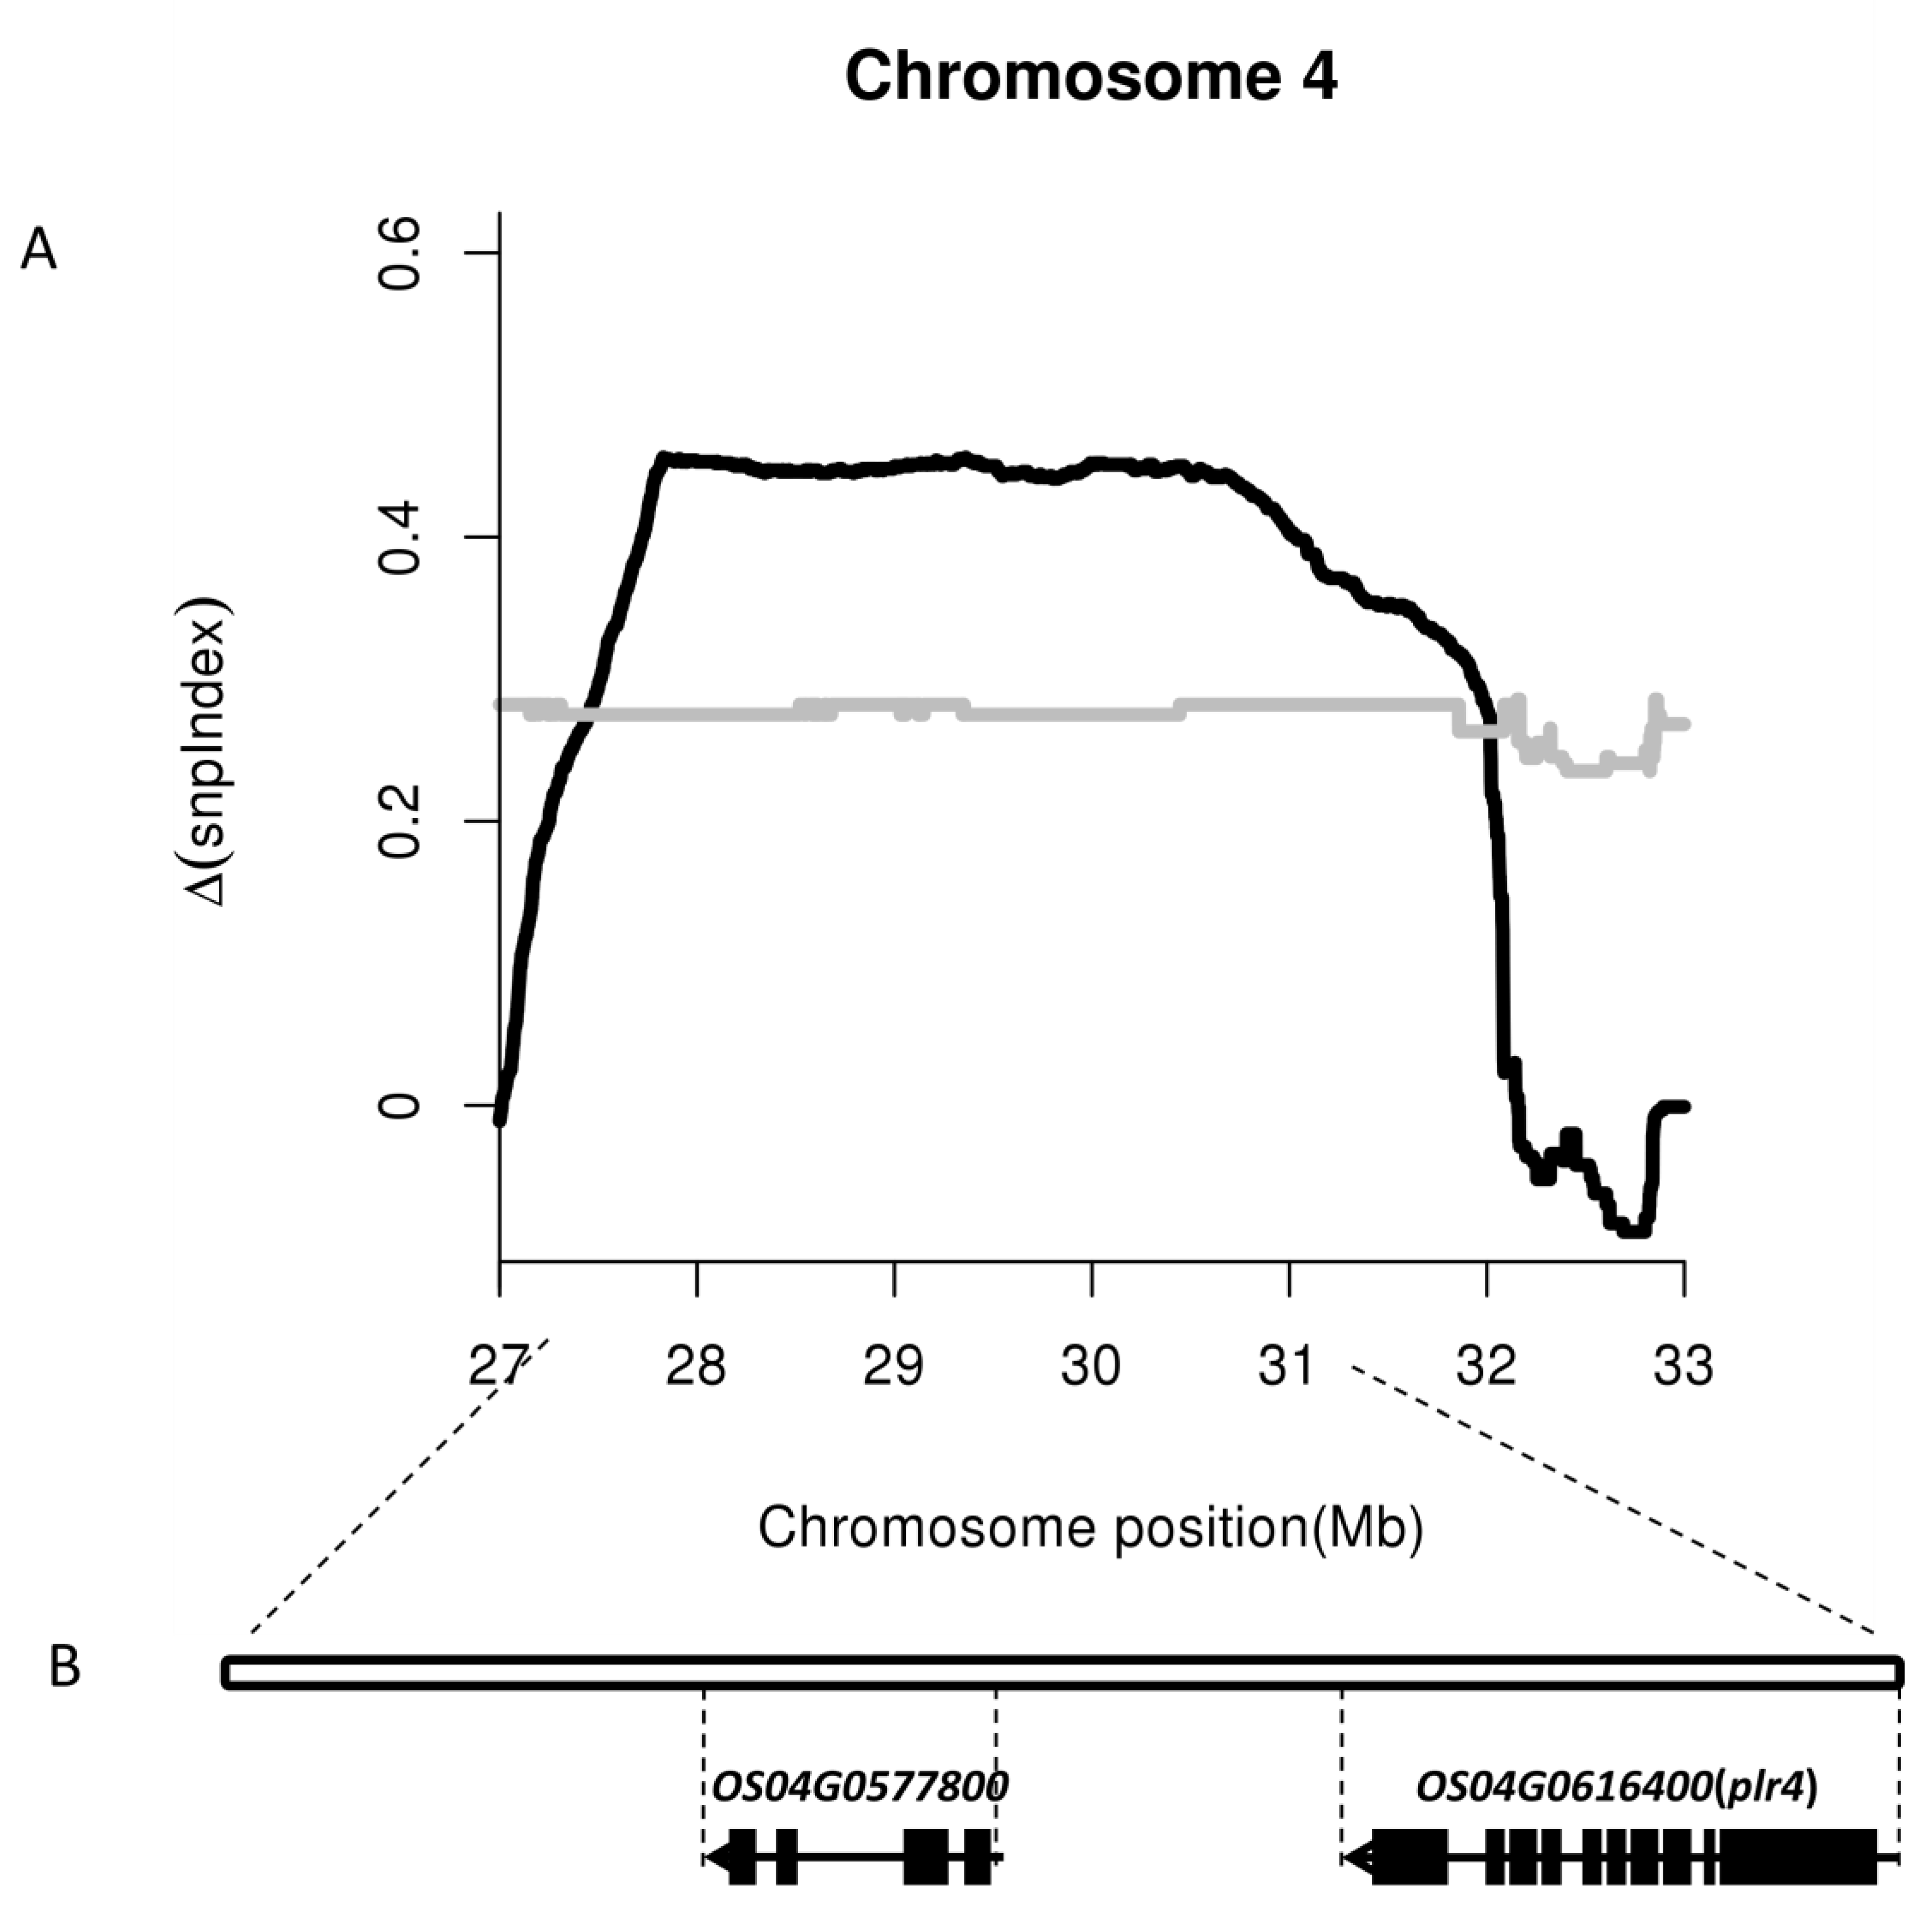
2.2. Identification of Candidate Intervals via Whole-Genome Resequencing Analysis

A total of 90.23 G of raw data were obtained and filtered into 89.94 G of clean data. We analyzed the quantity and quality of the data and found that Q20 ≥ 96.78% and Q30 ≥ 94.60%. GC content of the six samples’ clean data ranged from 42.40% to 44.30%. The average reading depth of six samples ranged from 31.04× to 53.58×, and the 95% confidence interval of SNP index for each reading depth was obtained. (Tables S1 and S2). The clean data were aligned to the reference genome. More than 2.55 million, 2.55 million, and 2.54 million SNPs and 0.47 million, 0.47 million, and 0.47 million indels were identified between the pl2 and pl1 pools, the pl3 and pl1 pools, and the pl4 and pl1 pools, respectively (Tables S3 and S4). The △All-index (△SNP-index and △Indel-index) was calculated, and a chart was plotted from the △All-index of every two sample pools (Figure 3). Two different intervals for the candidate gene that exceeded the threshold value were identified on the 27.9–31.1 MB of chromosome 4 and on the 1.9–5.4 MB of chromosome 6 via BSA analysis between the pl2 and pl1 pools. Through two BSA analyses between the pl3 and pl1 pools and between the pl4 and pl1 pools, the intervals for the candidate gene of the pl3 and pl4 phenotypes that exceeded the threshold value were identified on the 1.2–5.4 Mb and 0.9–5.4 Mb of chromosome 6, respectively. The findings were in accordance with the intervals in chromosome 6 of the BSA analysis between the pl2 and pl1 pools. These results suggest that the candidate genes of purple leaf rice are located in the 3.2 Mb region of chromosome 4 from 27.9 Mb to 31.1 Mb (Figure 3 and Figure S1).

2.3. Identification of Expressed Genes in a Single Candidate Interval via Transcriptome Sequencing

A total of 57,867,934–62,400,200 raw 150 bp paired-end reads were obtained from three green leaf samples (pl3) and three purple leaf samples (pl2) via RNA sequencing. After trimming the raw data, an average of 8.94 and 8.56 G clean bases remained from the pl2 and pl3 samples, respectively. The quantity and quality (Q20 ≥ 94.70% and Q30 ≥ 92.11%) of the data were analyzed. The GC content ranged from 57.75% to 60.38% (Table S5).
After mapping to the reference genome, a total of 92,028 unigenes were compared, and 19,970 and 19,733 genes were identified in the pl2 and pl3 plants, respectively (Table S6 and Figure S2). A total of 181 unigenes exhibited differential expression levels between pl2 and pl3 plants at a false discovery rate (FDR) ≤0.05 and |log2FC| ≥ 1 including 154 upregulated and 27 downregulated genes (Table S7). The most enriched gene ontology (GO) terms focused on metabolic process, catalytic activity, and transferase activity (Figures S3 and S4).
With the 3.2 Mb region of chromosome 4 (27.9–31.1 Mb), 327 unigenes were identified; 230 of the unigenes were expressed, and 12 unigenes exhibited differential expression in which only two genes (Os04g0577800, Os04g0616400) were downregulated. The two unigenes were located near the 27.9–31.1 Mb interval in the BSA analysis (Table S7 and Figure 4). Given the recessive genetic characteristics of the purple leaf genes, these two downregulated genes (Os04g0577800 and Os04g0616400) are possible candidate genes.
In addition, 19 DEGs demonstrated annotation functions related to the anthocyanin pathway (Table 1). Among these genes, six genes (OS02G0207100, OS04G0305700, OS04G0525100, OS04G0525200, OS06G0187500, and OS12G0561900) encode UDP-GLYCOSYLTRANSFERASE, four genes (OS01G0735300, OS06G0192100, OS07G0503500, and OS11G0461200) encode anthocyanidin 3-O-glucosyltransferase, two genes (OS04G0557800 and OS11G0258700) encode anthocyanin regulatory Lc protein, and seven genes (OS01G0372500, OS01G0633500, OS04G0557500, OS04G0630300, OS10G0320100, OS11G0530600, and OS12G0270900) encode leucoanthocyanidin dioxygenase, DFR, anthocyanin regulatory R-S protein, anthocyanidin reductase, flavonoid 3′-hydroxylase, chalcone synthase 1, and flavonol 3-sulfotransferase, respectively. Except that OS02G0207100, OS04G0630300, and OS12G0561900 were downregulated, the other 16 genes were upregulated in purple leaf rice.

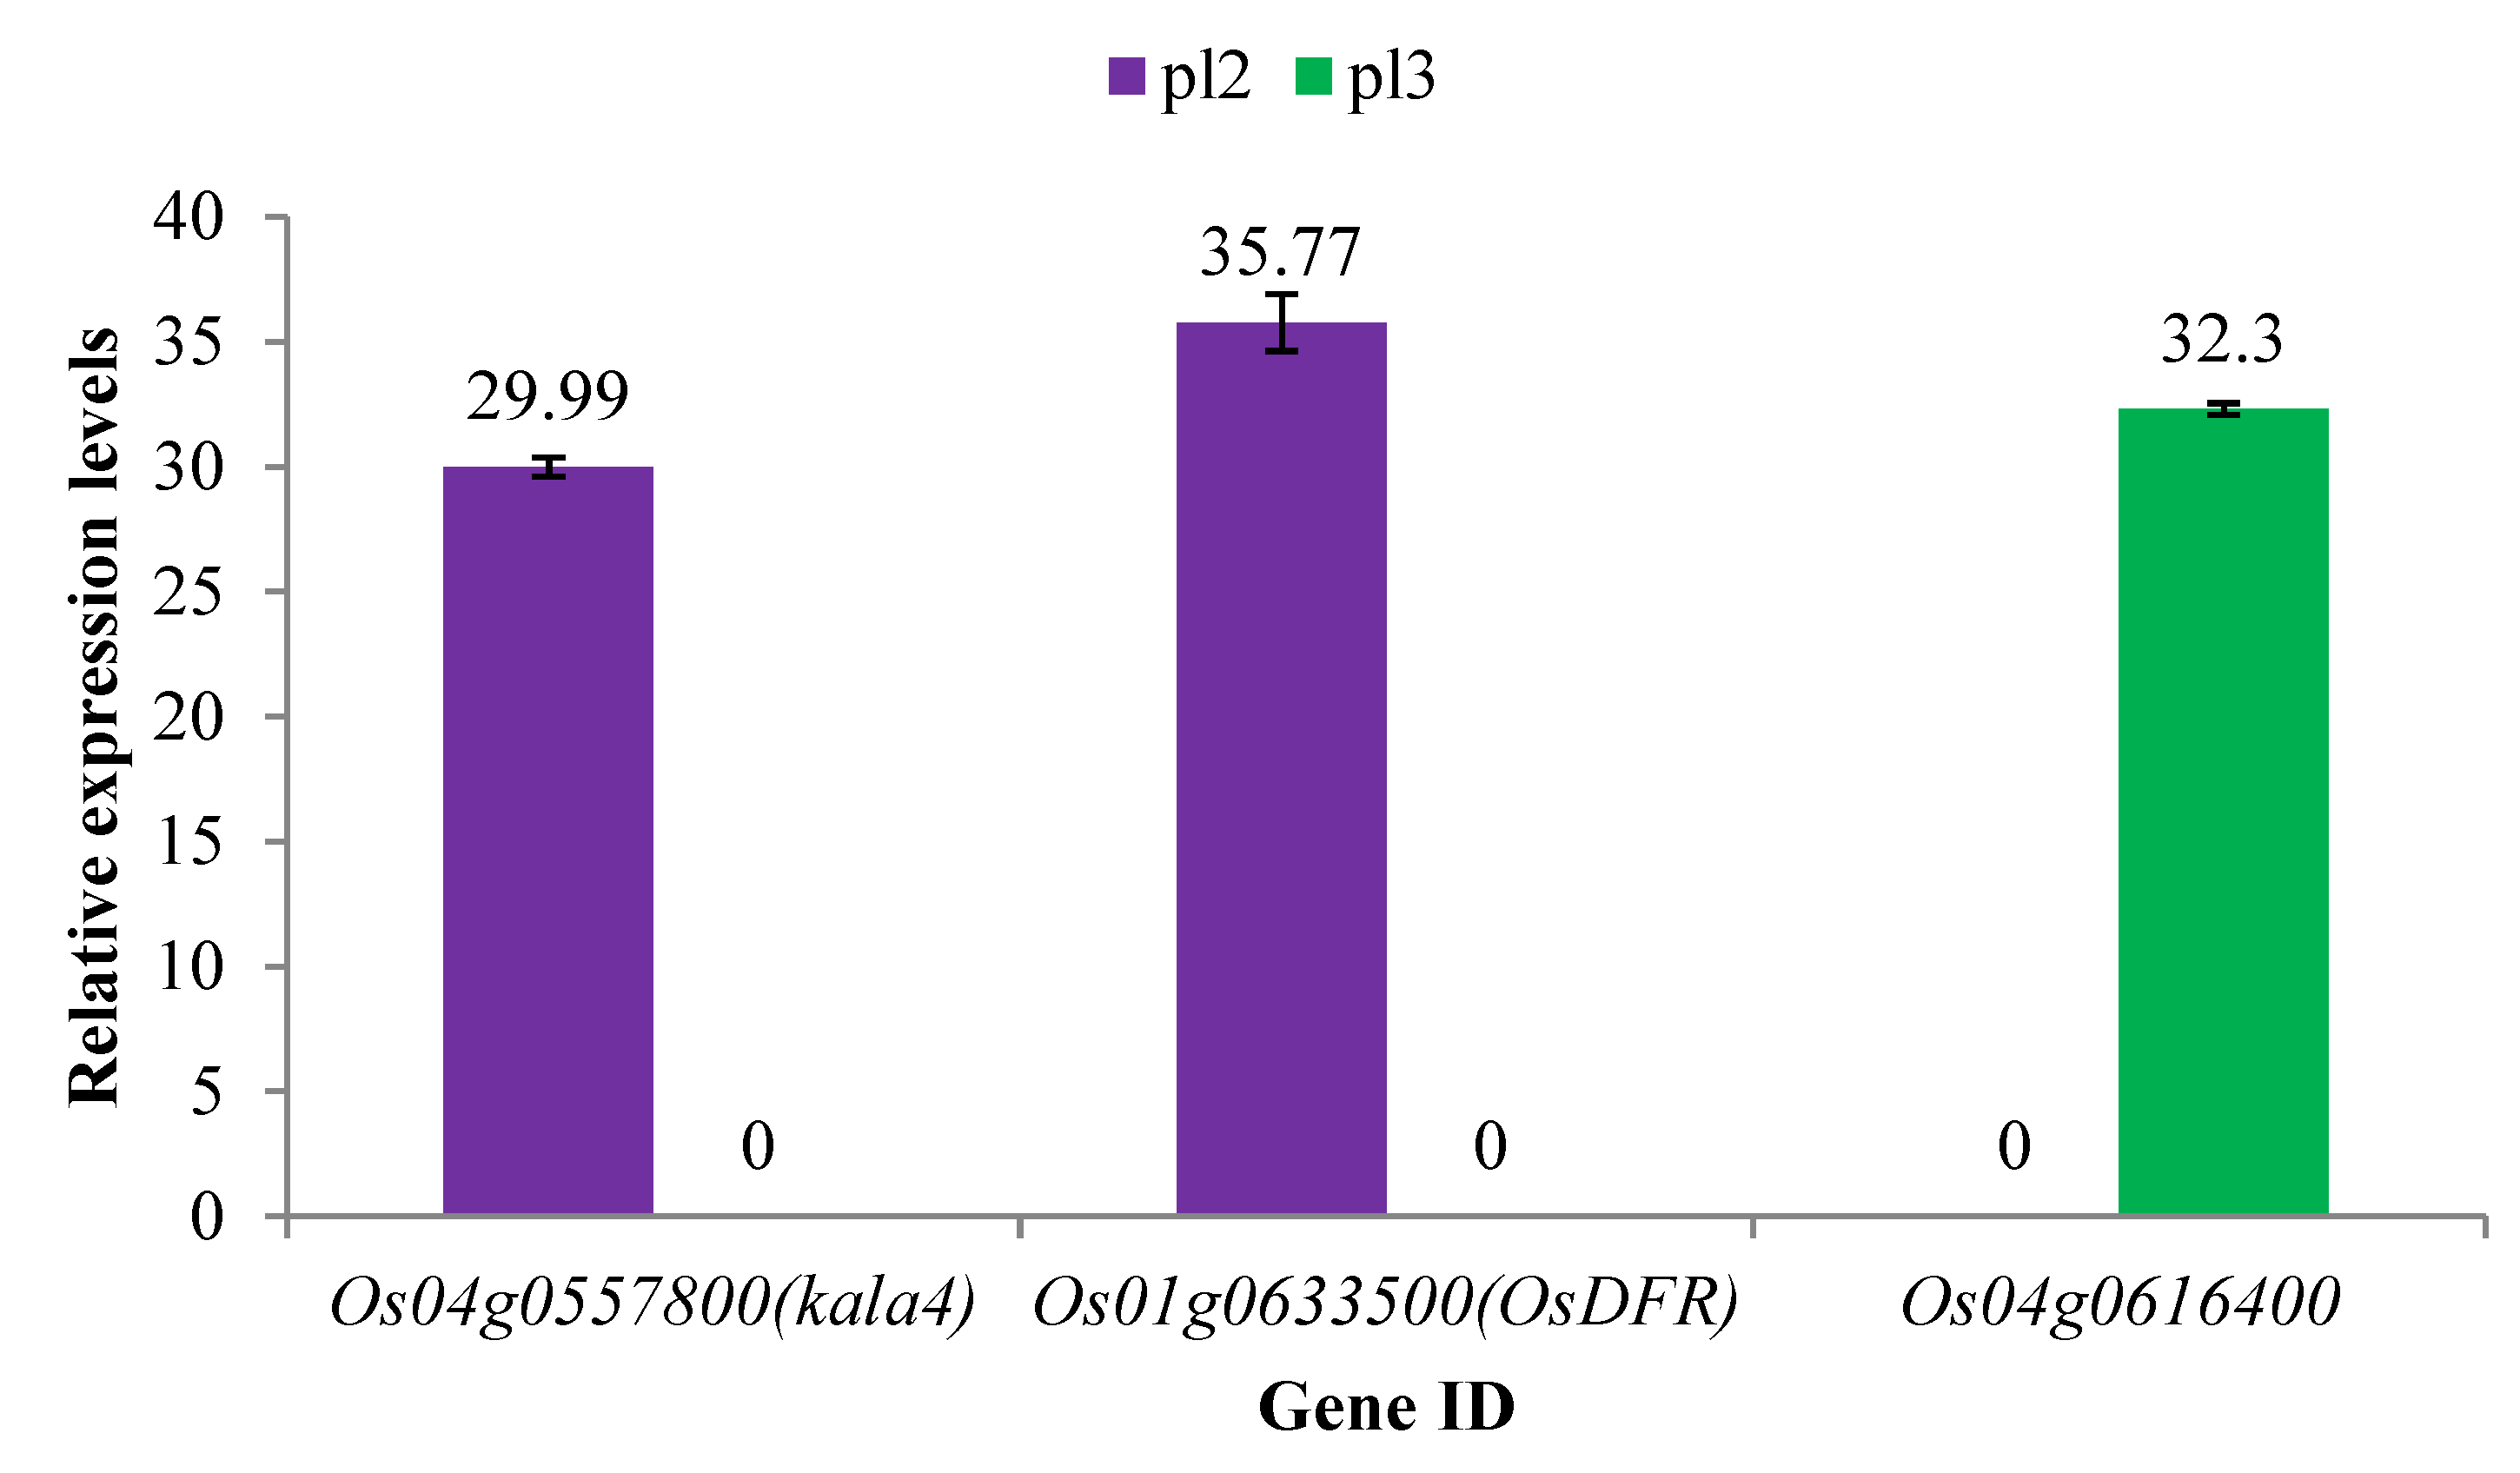
2.4. Verification of DEGs via qRT-PCR

To confirm that the genes identified within the 27.9–31.1 MB interval from RNA sequencing were differentially expressed, we selected one candidate gene (Os04g0616400) and two DEGs (Os04g0557800 and Os01g0633500) related to anthocyanin, and qRT-PCR analysis was used to verify the expression of DEGs in seedlings (Table S8). The results showed that these genes exhibited the same expression trend as RNA-Seq data (Figure 5). It can be seen that the reliability of the transcriptome analysis is sustained.

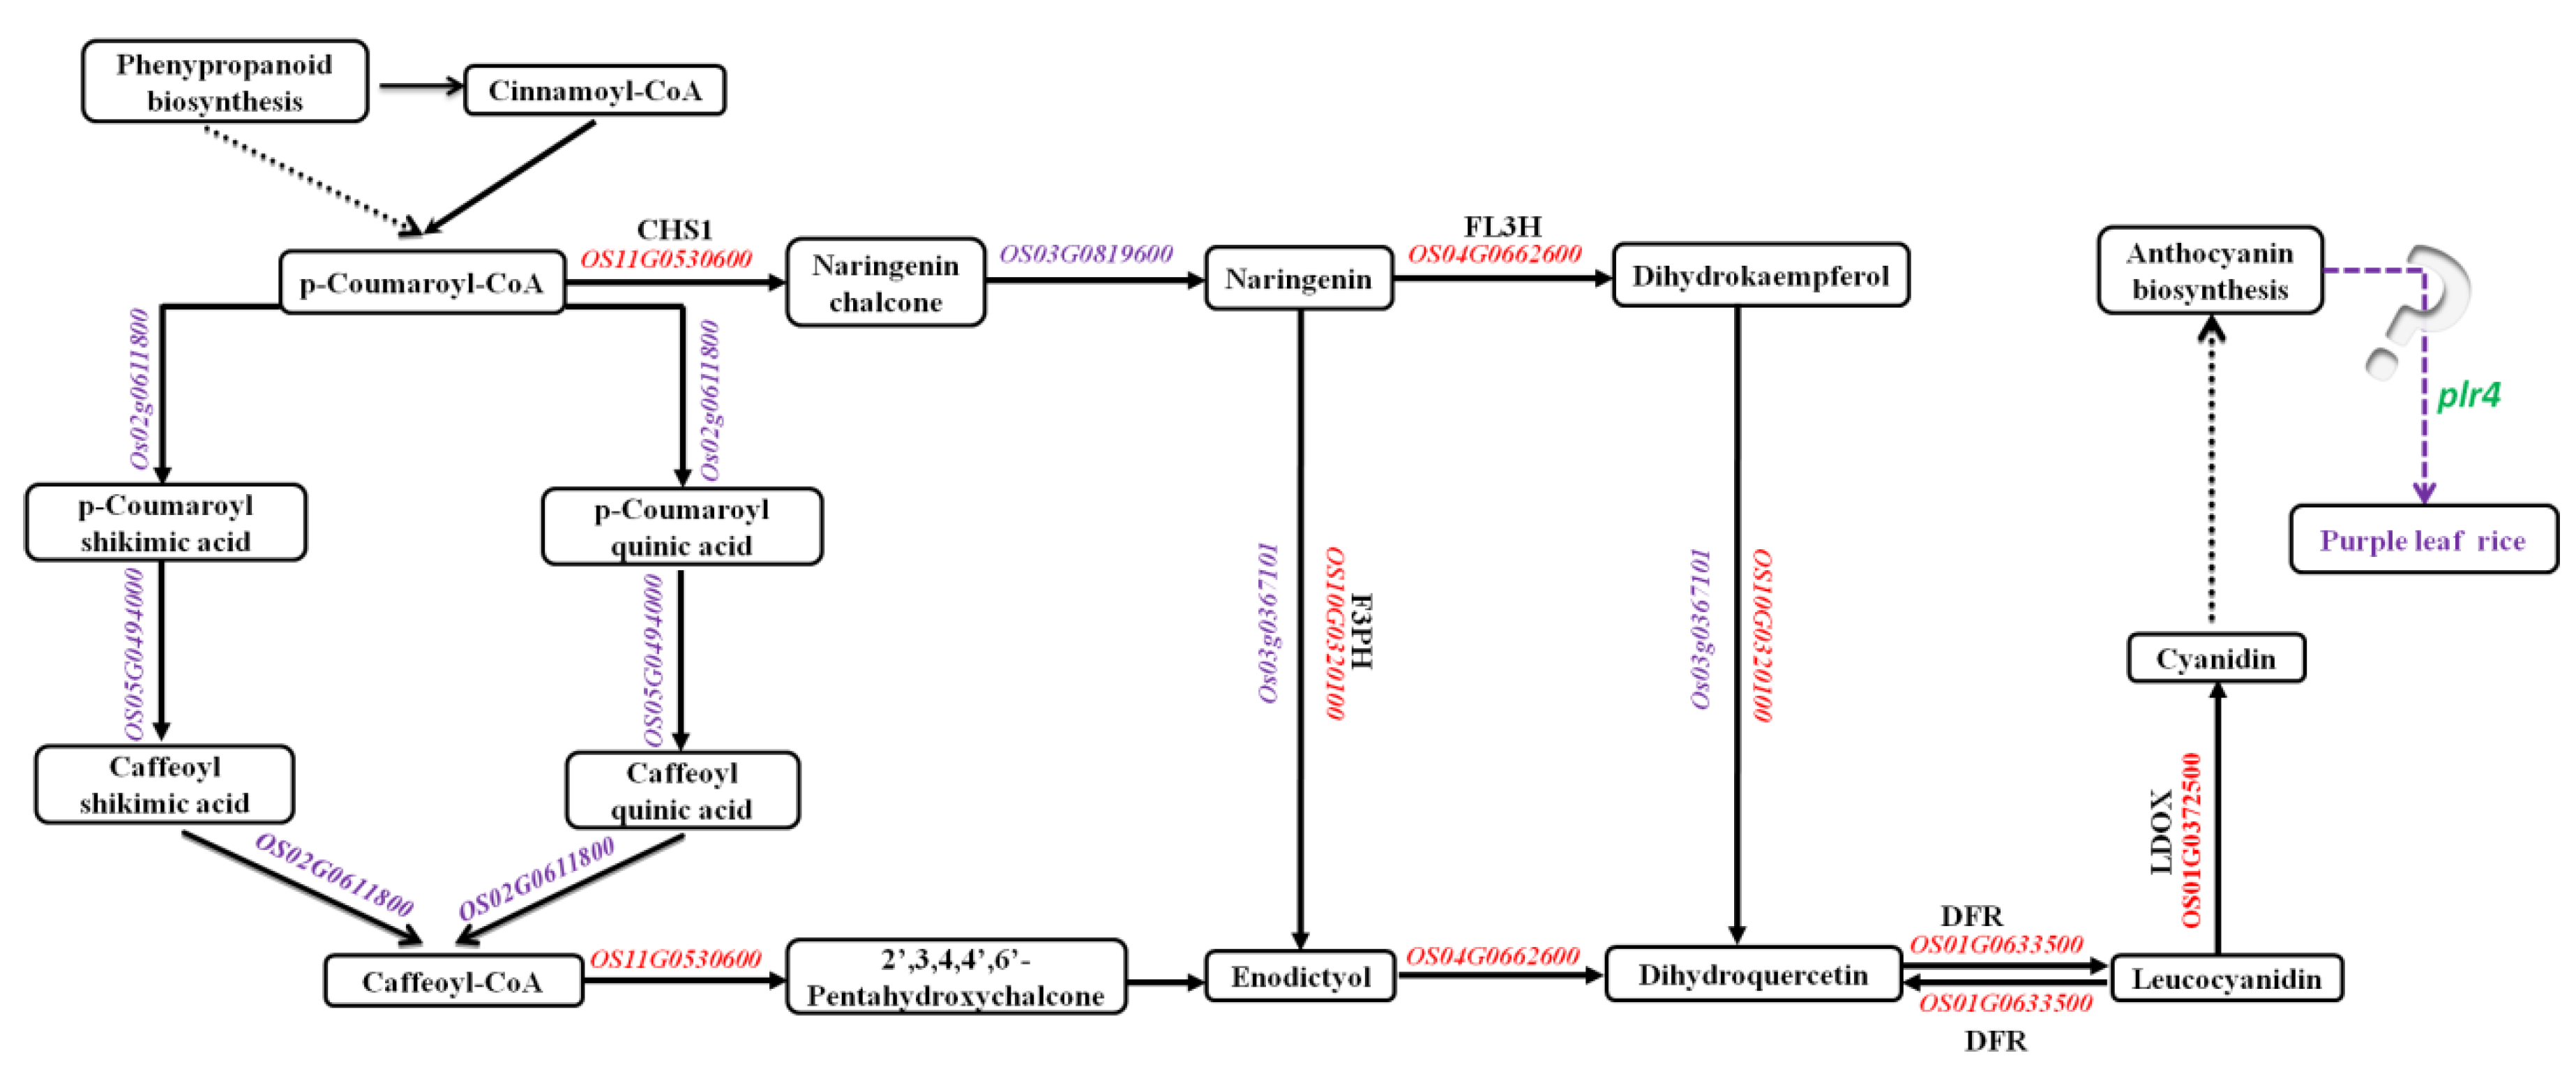
2.5. Kyoto Encyclopedia of Genes and Genomes (KEGG) Enrichment of DEGs in the Anthocyanin Biosynthesis Pathway

KEGG pathway enrichment revealed six DEGs in the anthocyanin biosynthesis pathway; five DEGs (OS11G0530600, OS04G0662600, OS10G0320100, OS01G0633500, and OS01G0372500) were upregulated, and only one DEG (OS04G0630300) was downregulated (Figures S5 and S6). The five upregulated genes were distributed throughout the anthocyanin synthesis pathway. The downregulated gene was the anthocyanidin reductase gene, which was located in the downstream of the proanthocyanidin biosynthesis pathway and functions independent of anthocyanin synthesis regulation.

3. Discussion

In the past few decades, molecular markers have played an important role in target gene location and selective breeding. However, the effect of gene mapping in different populations varies, and linkage mapping is difficult to carry out on some groups [30]. The purple leaf characters are regulated by multiple genes [20,26,27], and several related genes are located in the adjacent regions of chromosome 4 including the plr4 gene. We constructed the NILs, which could not be successfully mapped in the genome interval by molecular markers (data not shown).
The development of NGS technology can compensate for these deficiencies and promote the development of plant molecular breeding [31,32,33,34]. BSA mixed population separation analysis is often used in whole-genome resequencing, and two groups with extreme traits are mainly sequenced by mixed pool. The significant difference between the allele frequency (AF) of the polymorphic loci (SNP) of the two populations was compared to achieve the target of location-related genes and loci. RNA-seq can almost obtain the expression of all genes (including low abundance genes), evaluate the expression changes of various genes, and determine new genes and SNP loci [29]. In this study, NGS and RNA-seq were used to successfully locate a recessive purple leaf regulatory gene and screen its candidate genes.
Although several genes related to anthocyanin synthesis and regulation have been found, the molecular basis for the synthesis and regulation of anthocyanins in rice leaf tissue remains unclear. Given the interaction of polygenes and their genetic specificity, the recessive regulatory genes of the purple leaf of rice have been puzzled by the construction of the mapping population and gene cloning. At present, only the OsB2 (Os04g0557500) gene on chromosome 4 has been found to regulate the purple leaf in rice. Functional verification of OsB2 has only been reported for the ectopic expression of pericarp due to the rearrangement of its promoters [27]. These results have not clearly explained the molecular regulation mechanism of purple leaf in rice.
In this study, we identified the recessive regulatory gene plr4 of the purple leaf in rice, which was located near the 27.9–31.1 Mb interval of chromosome 4 (Figure 3). Subsequently, we analyzed the DEGs via transcriptome sequencing, where 19 DEGs demonstrated annotation functions related to the anthocyanin pathway (Table 1) including six UDP-glucosyltransferase genes, four anthocyanidin 3-O-glucosyltransferase genes, two Lc protein genes, and one each of leucoanthocyanidin dioxygenase, DFR, anthocyanin regulatory R-S protein, anthocyanidin reductase, flavonoid 3′-hydroxylase, chalcone synthase 1, and flavonol 3-sulfotransferase. Except that OS02G0207100, OS04G0630300, and OS12G0561900 were downregulated, the other 16 genes were upregulated in purple leaf rice. The genes OsB1 (Os04g0557800, Kala4) and OsB2 (Os04g0557500, Kala4) were upregulated in purple leaf rice, which further confirmed its association with anthocyanin [20,25,27]. On chromosome 4, only six genes were remarkably downregulated in purple leaf rice in which only two genes (Os04g0577800 and Os04g0616400) were located near the 27.9–31.1 Mb interval in the BSA analysis (Figure 4). Os04g0577800 (chr4: 29,124,636–29,126,983 bp, complement) is a fatty acid output protein gene in the chloroplast, which is a gene with relatively low expression in the purple leaf rice that we detected. Os04g0616400 (chr4: 31,285,362–31,298,409 bp, complement) has been annotated to a gene associated with serine protein kinase in Arabidopsis thaliana and demonstrates transferase activity. The read count of the gene expression was 0 in the samples of purple leaf rice we detected, but it is highly expressed in green leaf rice. Therefore, Os04g0616400 is a candidate gene for plr4, whose function in rice has not been confirmed, and its molecular basis remains unclear. KEGG analysis revealed that the anthocyanin biosynthesis pathway in rice purple leaves was probably co-regulated by plr4 and several anthocyanin-related genes OS11G0530600 (chalcone synthase), OS04G0662600 (flavanone 3-dioxygenase), OS10G0320100 (flavonoid 3′-monooxygenase), OS01G0633500 (DFR), and OS01G0372500 (leucoanthocyanidin dioxygenase). We speculate that the plr4 gene is the downstream gene of the anthocyanin metabolism pathway and plays a negative regulatory role in organ and tissue transfer after anthocyanin synthesis (Figure 6). In order to more than understand the molecular mechanism of plr4 gene in the purple leaf traits of rice, functional validation analysis should be performed by gene overexpression and gene knockout.
Purple leaf traits in rice have attracted extensive attention in terms of both the mechanism of anthocyanin biosynthesis pathway and in the application of hybrid rice breeding. In the breeding process of two-line hybrid rice, regardless of the species or weather, the seeds of two-line sterile line often undergo 3–5% self-hybridization, which leads to large production losses. In our study, the purple leaf traits were controlled by a pair of recessive genes, and were hybridized with green leaf rice after introducing the two-line sterile lines. At the seedling stage and even during the whole growth stage, the hybrid F1 plants exhibited green leaves, whereas the plants produced by the self-crossing of the two-line sterile lines showed purple leaves. On the basis of the obvious difference in leaf color, the purple leaf sterile plants could be identified and removed at the seedling stage, thereby ensuring the purity of field hybrids. By backcrossing XianhongB with two-line sterile lines Y58S and GZ63S, we introduced purple leaf traits and bred the purple leaf two-line sterile lines, which were applied to the breeding of two-line hybrid rice.

4. Materials and Methods

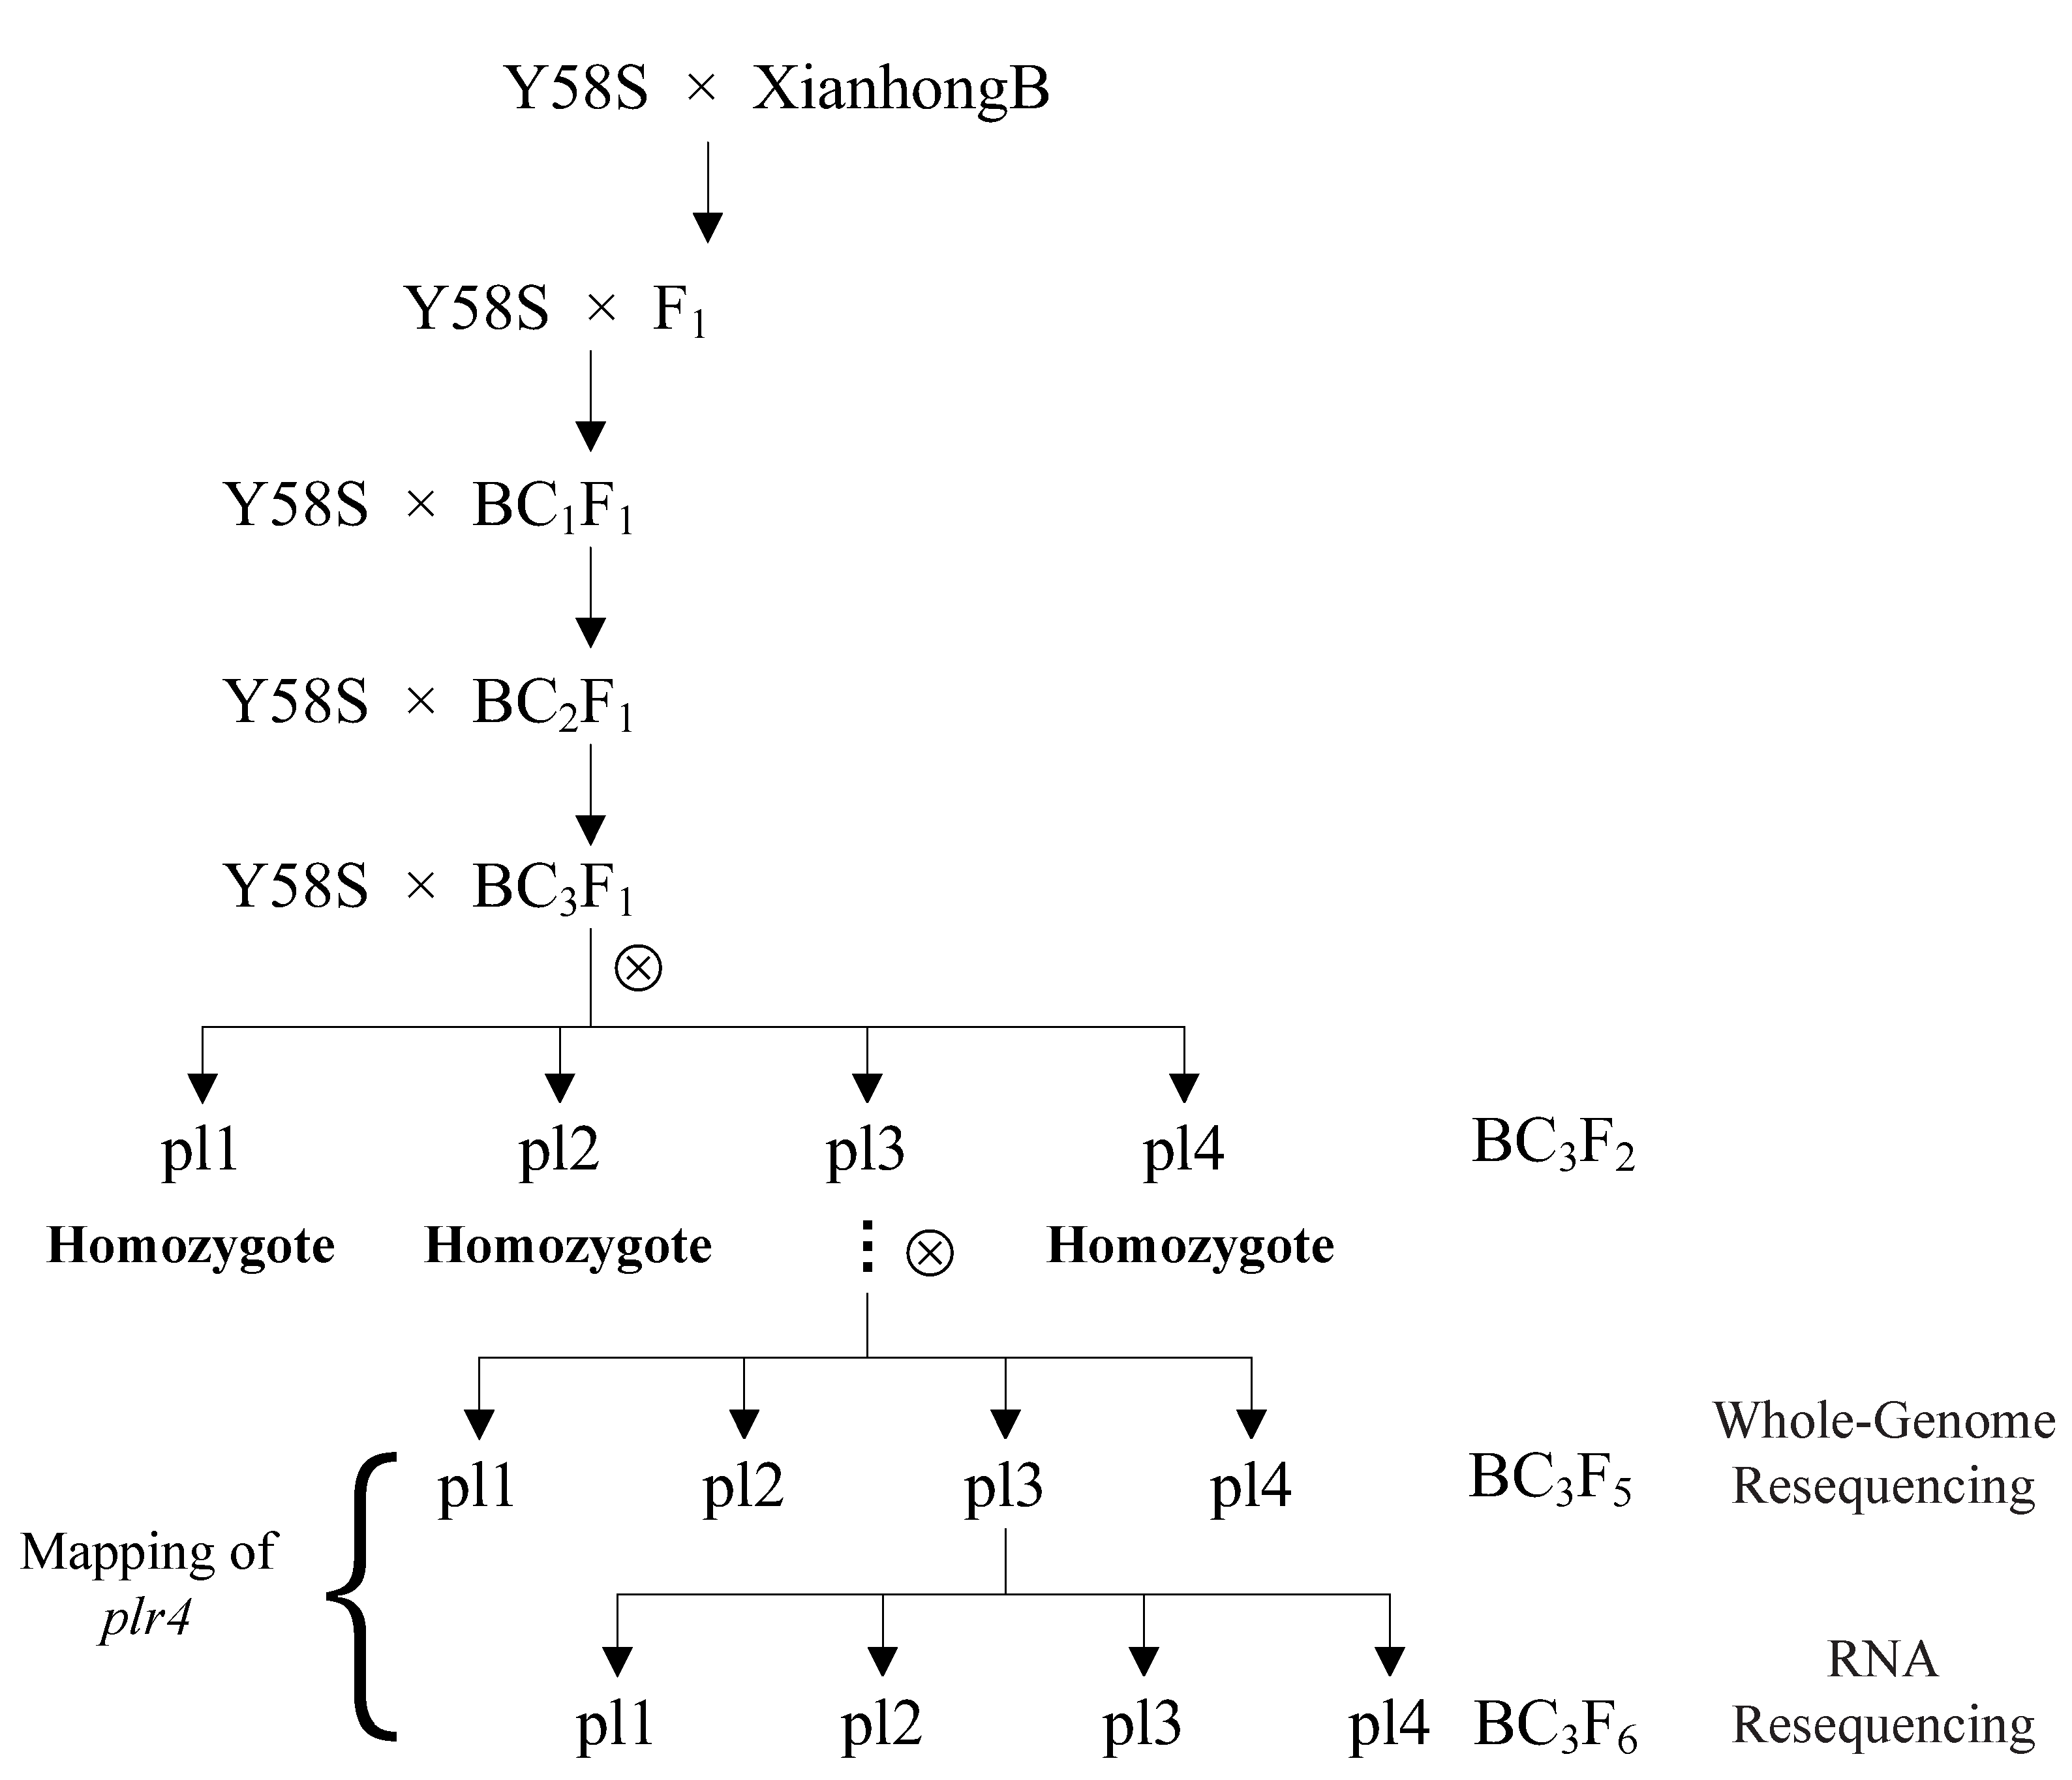
4.1. Materials and Population Construction

The rice variety XianhongB, a fertility restorer line, with purple coloration in the leaves, leaf sheaths, leaf rings, stems, and lemma, was selected as the donor parent. The rice variety Y58S, a male sterile line, with whole green plant and white stigma, was selected as the recipient parent. A set of NILs (BC3F1) was bred via crossing and back-crossing. In the BC3F2 to BC3F5 offspring, population separation and phenotype identification were carried out. We then sequenced the whole genome, and RNA sequencing was conducted for the BC3F5 and BC3F6 population, respectively, to map and identify the candidate gene (plr4) for the purple leaf traits. The materials were cultivated in an experimental field at the Guangxi Academy of Agricultural Sciences from March to November in 2008–2017 (Figure 1). After flowering, population separation was analyzed, and the data were recorded.

4.2. DNA Isolation and Analysis of WGS Data

The healthy leaves of two parents and BC3F5 individuals were collected at the tillering stage and stored in a −80 °C refrigerator. The genomic DNA was extracted by the modified CTAB (Cetyltrimethyl Ammonium Bromide) method [35]. The purity and integrity of each DNA sample were determined by agarose gel electrophoresis. BSA with next-generation sequencing was conducted on four DNA mixed pools (pl1-pool, pl2-pool, pl3-pool, and pl4-pool) from four extreme phenotypes of pl1, pl2, pl3, and pl4 (Figure 2), and each phenotype contained 40 individuals in the BC3F5 generation. A total amount of 1.5 μg DNA per sample was used as input material for the DNA sample preparations. Sequencing libraries were generated using Truseq Nano DNA HT Sample preparation kit (Illumina USA), following the manufacturer’s recommendations, and index codes were added to attribute sequences to each sample. The DNA sample was fragmented by sonication to a size of 350 bp, then DNA fragments were end polished, A-tailed, and ligated with the full-length adapter for Illumina sequencing with further PCR amplification. These libraries constructed above were sequenced by an Illumina HiSeq4000 platform and 150 bp paired-end reads were generated with insert size around 350 bp, and sequencing depth of 30× for parental plants and each BC3F5 generation pool.
Sequencing data were subjected to quality control and mapped to the reference genome. The raw data (raw reads) of fast format was first processed through a series of quality control (QC) procedures in-house C scripts to remove low quality paired reads, which mainly resulted from base-calling duplicates and adapter contamination. The reference genome of O. sativa ssp. japonica was downloaded from EnsemblGenomes [36] (ftp://ftp.ensemblgenomes.org/pub/plants/release-36/fasta/oryza_sativa/dna/). BWA (Burrows-Wheeler Aligner) was used to align the clean reads of each sample against the reference genome (settings: mem -t 4 -k 32 -M -R) [37]. Alignment files were converted to BAM files using SAMtools software (settings: -bS -t). In addition, potential PCR duplications were removed using SAMtools command “rmdup”. If multiple read pairs have identical external coordinates, only the pair with the highest mapping quality is retained [37]. The Unified Genotyper function was used for variant calling of all sample variants, and s SNPs were selected by using the variant filtration parameters in GATK [38]. The single nucleotide polymorphism index (SNPI) was calculated by using the reading depth information of homozygote single nucleotide polymorphisms in two pools, and the pl1 pool was used as a reference. The SNP index was calculated as the SNP index of the pl1 pool minus the SNP index of the pl2, pl3 and pl4 pool. Whole-genome resequencing was performed by Novogene Bioinformatics Technology Co., Ltd. (Beijing, China).

4.3. RNA Extraction and Illumina Sequencing

Total RNA was extracted from the seedling stage to obtain six mixed RNA samples, the leaf sample RNA of the pl3 phenotype homozygous group, and the pl2 phenotype homozygous group. Each group comprised three replicates in the BC3F6 population (Figure 1 and Figure 2). RNA was extracted and sequenced by Novogene Co. Ltd. (Beijing, China). After the total RNA was extracted from the samples, the RNA was enriched by magnetic beads with Oligo (dT). The obtained RNA to make the fragments into short fragments using divalent cations under elevated temperature in NEBNext® first-strand synthesis reaction buffer (5×), and then the fragmented RNA was used as the template to synthesize the first-strand cDNA using a random hexamer primer and M-MLV reverse transcriptase (RNase H-). Second-strand cDNA synthesis was subsequently performed using DNA polymerase I and RNase H. To select the cDNA fragments with lengths of 250–300 bp, the library fragments were purified with AMPure XP system (Beckman Coulter, Beverly, WV, USA). Following the manufacturer’s protocol, the terminal repair, poly (A) tails were added and sequencing adapter were carried out, and PCR amplification was used to complete the whole library preparation. The constructed library was sequenced on an Illumina Hiseq platform, and 125 bp/150 bp paired-end reads were generated. The reads obtained from the sequencing instruments were filtered to remove the adapters and low-quality reads. High-quality clean reads from all six samples were merged and mapped to the reference sequence.

4.4. Quantification of Gene Expression Level and Differential Expression Analysis

The level of gene expression was quantified by FPKM (fragments per kilobase of transcript per million mapped reads) [39]. Differential expression analysis of two conditions/groups (three biological replicates per condition) was performed using the DESeq R package (1.18.0). Genes with an adjusted p < 0.05 based on DESeq were considered differentially expressed. The expression level of DEG was higher in purple leaf plants than in green leaf plants, which was considered to be upregulated, whereas those exhibiting the opposite relationship was considered to be downregulated.

4.5. GO and KEGG Enrichment Analysis of DEGs

GO enrichment analysis of DEGS was carried out by using GOseq R software package, and gene length bias was corrected. The GO terms with corrected p < 0.05 were considered to be significantly rich in DEGS. KEGG is the major public pathway-related database for understanding high-level functions and utilities of the biological system (http://www.genome.jp/kegg/). We used KOBAS software to test the statistical enrichment of DEGs in the KEGG pathways.

4.6. qRT-PCR Analysis

Total RNA was extracted from the purple leaf plants and green leaf plants for RNA-Seq, and cDNA was synthesized using the RevertAid™ RT reagent kit (Thermo Fisher Scientific Inc., Waltham, USA). One significant DEG and two DEGs related to anthocyanin exhibiting differential expression patterns were selected for qRT-PCR analysis. The qRT-PCR validation was performed with three techniques repeated. The primers of qRT-PCR were designed by Primer 3 based on the sequence of these genes (Table S9). the QuantiNova™ SYBR® Green PCR kit (Qiagen Inc., Duesseldorf, Germany) was used for the reaction on an ABI 7500 qPCR instrument (Applied Biosystems Inc., Carlsbad, California, USA). Differences in gene expression were calculated using the 2−ΔΔCt method. The Actin gene (LOC4333919) of rice was used as an internal reference control.

5. Conclusions

The plr4 gene was mapped via genetic analysis, BSA-Seq, RNA-Seq, and qRT-PCR. Three DNA pools were constructed based on the four isolation phenotypes of purple leaf rice. BSA-Seq was used to locate the candidate region of the recessive gene plr4, which is associated with the purple leaf of rice. RNA-Seq analysis showed that 10 genes were expressed differently in the candidate region and nearby regions, and only two (Os04g0577800 and Os04g0616400) of them were downregulated, which might be the target recessive genes. qRT-PCR analysis of the three selected genes also confirmed that the expression changes were consistent with the results of RNA-Seq. This study may provide a basis for further understanding the molecular regulation mechanism of purple leaves and provide an effective and powerful scientific basis for the anthocyanin biosynthesis pathway and cross-breeding application in rice.

Supplementary Materials

Supplementary materials can be found at https://www.mdpi.com/1422-0067/20/18/4335/s1.

Author Contributions

J.G., G.D. (Gaoxing Dai), L.G. and G.D. (Guofu Deng) conceived the original plan for this work and designed the research. J.G. performed most of the experiments and analyzed the data; G.D. (Gaoxing Dai) and L.G. constructed the NILs; W.Z., H.L., J.H., D.Q., W.C. and H.W. performed parts of experiments; J.G. wrote the manuscript; J.G., G.D. (Gaoxing Dai), L.G., W.Z., H.L., J.H., D.Q., H.W., X.Y. and D.L. performed manuscript modification; G.D. (Guofu Deng) and L.G. supervised the project and overviewed all aspects of the work. All authors read and approved the final manuscript.

Funding

This work was financially supported by funds from The National Key Research and Development Program of China (2017YFD0100103), the Nanning Comprehensive Test Station of National Rice Industry Technology System (CARS-01-88), the Special Fund for Guangxi Science and Technology Base and Talents (AD17129064), the Guangxi Natural Science Foundation (2018GXNSFAA281202), the Guangxi Science and Technology Base and Special Talents (GuiKe AD18050003), and the Open Subject of Key Laboratory of Rice Genetics and Breeding in Guangxi (160-380-16-9).

Conflicts of Interest

The authors declare no conflicts of interest.

Abbreviations

GOGene Ontology
KEGGKyoto Encyclopedia of Genes and Genomes
qRT-PCRQuantitative real time-PCR
NILsNear isogeniclines
BSA-SeqBulked segregant analysis with a next-generation sequencing
RNA-SeqTranscriptome sequencing
FDRFalse discovery rate
DEGsDifferentially expressed genes

References

  1. Austin, M.B.; Noel, J.P. The chalcone synthase superfamily of type III polyketide synthases. Nat. Prod. Rep. 2003, 20, 79–110. [Google Scholar] [CrossRef] [PubMed]
  2. Yamazaki, M.; Nakajima, J.; Yamanashi, M.; Sugiyama, M.; Makita, Y.; Springob, K.; Awazuhara, M.; Saito, K. Metabolomics and differential gene expression in anthocyanin chemo-varietal forms of Perilla frutescens. Phytochemistry 2003, 62, 987–995. [Google Scholar] [CrossRef]
  3. Bogs, J.; Ebadi, A.; McDavid, D.; Robinson, S.P. Identification of the flavonoid hydroxylases from grapevine and their regulation during fruit development. Plant Physiol. 2006, 140, 279–291. [Google Scholar] [CrossRef] [PubMed]
  4. Jeong, S.T.; Goto-Yamamoto, N.; Hashizume, K.; Esaka, M. Expression of the flavonoid 3′-hydroxylase and flavonoid 3′,5′-hydroxylase genes and flavonoid composition in grape (Vitis vinifera). Plant Sci. 2006, 170, 61–69. [Google Scholar] [CrossRef]
  5. Castellarin, S.D.; Di Gaspero, G.; Marconi, R.; Nonis, A.; Peterlunger, E.; Paillard, S.; Adam-Blondon, A.F.; Testolin, R. Colour variation in red grapevines (Vitis vinifera L.): Genomic organisation, expression of flavonoid 3′-hydroxylase, flavonoid 3′,5′-hydroxylase genes and related metabolite profiling of red cyanidin-/blue delphinidin-based anthocyanins in berry skin. BMC Genom. 2006, 7, 12. [Google Scholar] [CrossRef] [PubMed]
  6. Shimada, S.; Inoue, Y.T.; Sakuta, M. Anthocyanidin synthase in non-anthocyanin-producing Caryophyllales species. Plant J. 2005, 44, 950–959. [Google Scholar] [CrossRef] [PubMed]
  7. Nakatsuka, T.; Nishihara, M.; Mishiba, K.; Yamamura, S. Temporal expression of flavonoid biosynthesis-related genes regulates flower pigmentation in gentian plants. Plant Sci. 2005, 168, 1309–1318. [Google Scholar] [CrossRef]
  8. Winkel-Shirley, B. It takes a garden. How work on diverse plant species has contributed to an understanding of flavonoid metabolism. Plant Physiol. 2001, 127, 1399–1404. [Google Scholar] [CrossRef]
  9. Ramsay, N.A.; Glover, B.J. MYB-bHLH-WD40 protein complex and the evolution of cellular diversity. Trends Plant Sci. 2005, 10, 63–70. [Google Scholar] [CrossRef]
  10. Xie, D.Y.; Sharma, S.B.; Wright, E.; Wang, Z.Y.; Dixon, R.A. Metabolic engineering of proanthocyanidins through co-expression of anthocyanidin reductase and the PAP1 MYB transcription factor. Plant J. 2006, 45, 895–907. [Google Scholar] [CrossRef] [Green Version]
  11. Ludwig, S.R.; Wessler, S.R. Maize R gene family: Tissue-specific helix-loop-helix proteins. Cell 1990, 62, 849–851. [Google Scholar] [CrossRef]
  12. Reddy, A.R.; Scheffler, B.; Madhuri, G.; Srivastava, M.N.; Kumar, A.; Sathyanarayanan, P.V.; Nair, S.; Mohan, M. Chalcone synthase in rice (Oryza sativa L.): Detection of the CHS protein in seedlings and molecular mapping of the chs locus. Plant Mol. Biol. 1996, 32, 735–743. [Google Scholar] [CrossRef] [PubMed]
  13. Druka, A.; Kudrna, D.; Rostoks, N.; Brueggeman, R.; von Wettstein, D.; Kleinhofs, A. Chalcone isomerase gene from rice (Oryza sativa) and barley (Hordeum vulgare): Physical, genetic and mutation mapping. Gene 2003, 302, 171–178. [Google Scholar] [CrossRef]
  14. Reddy, A.M.; Reddy, V.S.; Scheffler, B.E.; Wienand, U.; Reddy, A.R. Novel transgenic rice overexpressing anthocyanidin synthase accumulates a mixture of flavonoids leading to an increased antioxidant potential. Metab. Eng. 2007, 9, 95–111. [Google Scholar] [CrossRef] [PubMed]
  15. Ahn, S.; Tanksley, S.D. Comparative linkage maps of the rice and maize genomes. Proc. Natl. Acad Sci. USA 1993, 90, 7980–7984. [Google Scholar] [CrossRef] [PubMed]
  16. Fan, F.J.; Fan, Y.Y.; Du, J.H.; Zhuang, J.Y. Fine Mapping of C (Chromogen for Anthocyanin) Gene in Rice. Rice Sci. 2008, 15, 1–6. [Google Scholar] [CrossRef]
  17. Saitoh, K.; Onishi, K.; Mikami, I.; Thidar, K.; Sano, Y. Allelic diversification at the C (OsC1) locus of wild and cultivated rice: Nucleotide changes associated with phenotypes. Genetics 2004, 168, 997–1007. [Google Scholar] [CrossRef] [PubMed]
  18. Gao, D.; He, B.; Zhou, Y.; Sun, L. Genetic and molecular analysis of a purple sheath somaclonal mutant in japonica rice. Plant Cell Rep. 2011, 30, 901–911. [Google Scholar] [CrossRef]
  19. Chin, H.S.; Wu, Y.P.; Hour, A.L.; Hong, C.Y.; Lin, Y.R. Genetic and Evolutionary Analysis of Purple Leaf Sheath in Rice. Rice 2016, 9, 8. [Google Scholar] [CrossRef]
  20. Hu, J.; Anderson, B.; Wessler, S.R. Isolation and characterization of rice R genes: Evidence for distinct evolutionary paths in rice and maize. Genetics 1996, 142, 1021–1031. [Google Scholar]
  21. Hu, J.; Reddy, V.S.; Wessler, S.R. The rice R gene family: Two distinct subfamilies containing several miniature inverted-repeat transposable elements. Plant Mol. Biol. 2000, 42, 667–678. [Google Scholar] [CrossRef] [PubMed]
  22. Sweeney, M.T.; Thomson, M.J.; Pfeil, B.E.; McCouch, S. Caught red-handed: Rc encodes a basic helix-loop-helix protein conditioning red pericarp in rice. Plant Cell 2006, 18, 283–294. [Google Scholar] [CrossRef] [PubMed]
  23. Furukawa, T.; Maekawa, M.; Oki, T.; Suda, I.; Iida, S.; Shimada, H.; Takamure, I.; Kadowaki, K. The Rc and Rd genes are involved in proanthocyanidin synthesis in rice pericarp. Plant J. 2007, 49, 91–102. [Google Scholar] [CrossRef] [PubMed]
  24. Reddy, A. Genetic and molecular analysis of the anthocyanin pigmentation pathway in rice. In Rice Genetics III. Proceedings of the Third International Rice Genetics Sympos-ium, GS, K.; *E International Rice Research Institute: Manila, Philippines, 1995; pp. 341–352. [Google Scholar]
  25. Maeda, H.; Yamaguchi, T.; Omoteno, M.; Takarada, T.; Fujita, K.; Murata, K.; Iyama, Y.; Kojima, Y.; Morikawa, M.; Ozaki, H.; et al. Genetic dissection of black grain rice by the development of a near isogenic line. Breed. Sci. 2014, 64, 134–141. [Google Scholar] [CrossRef] [PubMed] [Green Version]
  26. Sakamoto, W.; Ohmori, T.; Kageyama, K.; Miyazaki, C.; Saito, A.; Murata, M.; Noda, K.; Maekawa, M. The Purple leaf (Pl) locus of rice: The Plw allele has a complex organization and includes two genes encoding basic helix-loop-helix proteins involved in anthocyanin biosynthesis. Plant Cell Physiol. 2001, 42, 982–991. [Google Scholar] [CrossRef] [PubMed]
  27. Oikawa, T.; Maeda, H.; Oguchi, T.; Yamaguchi, T.; Tanabe, N.; Ebana, K.; Yano, M.; Ebitani, T.; Izawa, T. The Birth of a Black Rice Gene and Its Local Spread by Introgression. Plant Cell 2015, 27, 2401–2414. [Google Scholar] [CrossRef] [PubMed] [Green Version]
  28. Sun, X.; Zhang, Z.; Chen, C.; Wu, W.; Ren, N.; Jiang, C.; Yu, J.; Zhao, Y.; Zheng, X.; Yang, Q.; et al. The C-S-A gene system regulates hull pigmentation and reveals evolution of anthocyanin biosynthesis pathway in rice. J. Exp. Bot. 2018, 69, 1485–1498. [Google Scholar] [CrossRef] [PubMed]
  29. Chen, X.; Tao, Y.; Ali, A.; Zhuang, Z.; Guo, D.; Guo, Q.; Riaz, A.; Zhang, H.; Xu, P.; Liao, Y.; et al. Transcriptome and Proteome Profiling of Different Colored Rice Reveals Physiological Dynamics Involved in the Flavonoid Pathway. Int. J. Mol. Sci. 2019, 20, 2463. [Google Scholar] [CrossRef] [PubMed]
  30. Teng, C.; Du, D.; Xiao, L.; Yu, Q.; Shang, G.; Zhao, Z. Mapping and Identifying a Candidate Gene (Bnmfs) for Female-Male Sterility through Whole-Genome Resequencing and RNA-Seq in Rapeseed (Brassica napus L.). Front. Plant Sci. 2017, 8, 2086. [Google Scholar] [CrossRef] [PubMed]
  31. Zuo, J.; Li, J. Molecular genetic dissection of quantitative trait loci regulating rice grain size. Annu. Rev. Genet. 2014, 48, 99–118. [Google Scholar] [CrossRef] [PubMed]
  32. Zhu, Y.; Chen, K.; Mi, X.; Chen, T.; Ali, J.; Ye, G.; Xu, J.; Li, Z. Identification and Fine Mapping of a Stably Expressed QTL for Cold Tolerance at the Booting Stage Using an Interconnected Breeding Population in Rice. PLoS ONE 2015, 10, e0145704. [Google Scholar] [CrossRef] [PubMed]
  33. Nguyen, K.L.; Grondin, A.; Courtois, B.; Gantet, P. Next-Generation Sequencing Accelerates Crop Gene Discovery. Trends Plant Sci. 2019, 24, 263–274. [Google Scholar] [CrossRef] [PubMed]
  34. Lachagari, V.; Gupta, R.; Lekkala, S.P.; Mahadevan, L.; Kuriakose, B.; Chakravartty, N.; Mohan, K.A.; Santhosh, S.; Reddy, A.R.; Thomas, G. Whole Genome Sequencing and Comparative Genomic Analysis Reveal Allelic Variations Unique to a Purple Colored Rice Landrace (Oryza sativa ssp. indica cv. Purpleputtu). Front. Plant Sci. 2019, 10, 513. [Google Scholar] [CrossRef] [PubMed]
  35. Murray, M.G.; Thompson, W.F. Rapid isolation of high molecular weight plant DNA. Nucleic Acids Res. 1980, 8, 4321–4325. [Google Scholar] [CrossRef] [PubMed]
  36. Kersey, P.J.; Lawson, D.; Birney, E.; Derwent, P.S.; Haim el, M.; Herrero, J.; Keenan, S.; Kerhornou, A.; Koscielny, G.; Kahari, A.; et al. Genomes: Extending Ensembl across the taxonomic space. Nucleic Acids Res. 2010, 38, D563–D569. [Google Scholar] [CrossRef]
  37. Li, H.; Durbin, R. Fast and accurate short read alignment with Burrows-Wheeler transform. Bioinformatics 2009, 25, 1754–1760. [Google Scholar] [CrossRef] [Green Version]
  38. McKenna, A.; Hanna, M.; Banks, E.; Sivachenko, A.; Cibulskis, K.; Kernytsky, A.; Garimella, K.; Altshuler, D.; Gabriel, S.; Daly, M.; et al. The Genome Analysis Toolkit: A MapReduce framework for analyzing next-generation DNA sequencing data. Genome Res. 2010, 20, 1297–1303. [Google Scholar] [CrossRef] [Green Version]
  39. Trapnell, C.; Williams, B.A.; Pertea, G.; Mortazavi, A.; Kwan, G.; van Baren, M.J.; Salzberg, S.L.; Wold, B.J.; Pachter, L. Transcript assembly and quantification by RNA-Seq reveals unannotated transcripts and isoform switching during cell differentiation. Nat. Biotechnol. 2010, 28, 511–515. [Google Scholar] [CrossRef] [Green Version]
Figure 1. Construction of mapping population.
Ijms 20 04335 g001
Figure 2. Phenotypic characteristics of purple leaf for different tissues and growth stages of rice. (a) heading stage, (b) seedling stage, (c) leaf, (d) leaf sheath, and (e) flower organ. The bar sizes are (a) 5 cm, (b), (c), (d), and (e) 1 cm.
Ijms 20 04335 g002
Figure 3. Two generations of the delta_All-index distributed on chromosomes. (a) pl1–pl2 pool, (b) pl1–pl3 pool, and (c) pl1–pl4 pool. The black arrow points to the BSA location range.
Ijms 20 04335 g003
Figure 4. Identification and validation of the plr4 gene on chromosome 4. (A) Distribution of △(SNP-index) on chromosome 4; and (B) location of plr4 via whole-genome sequencing and RNA-Seq.
Ijms 20 04335 g004
Figure 5. qRT-PCR to verify the DEGs via RNA-Seq. The abscissa is the gene accession, and the ordinate is the relative expression level of the gene.
Ijms 20 04335 g005
Figure 6. The predicted molecular mechanism of purple leaf formation in rice. Purple is the expression gene, red is the upregulation expression gene, and green is the downregulation expression gene.
Ijms 20 04335 g006
Table 1. The 19 differentially expressed genes demonstrated annotation functions related to the anthocyanin pathway.
Gene_idReadcount_pl2Readcount_pl3Log2foldchangePvalPadjAnnotation
OS02G02071003.08386344325.98592481−3.07490.000160780.031904UDP-glycosyltransferase
OS04G0305700227.966024560.114184031.9232.87 × 1060.00089272UDP-glycosyltransferase
OS04G0525100517.029791555.585331083.21757.28 × 1083.11 × 105UDP-glycosyltransferase
OS04G0525200192.480456224.213230972.99082.22 × 10101.78 × 10−7UDP-glycosyltransferase
OS06G01875003107.154031953.11081781.70491.28 × 1050.0035155UDP-glycosyltransferase
OS12G056190011.7574275250.86821711−2.11320.000245050.045572UDP-glycosyltransferase
OS01G073530066.190511838.4447367842.97050.000205620.03935anthocyanidin 3-O-glucosyltransferase
OS06G01921003002.334615101.02863764.89322.83 × 10134.05 × 1010anthocyanidin 4-O-glucosyltransferase
OS07G0503500285.538707919.213065863.89352.49 × 1081.28 × 105anthocyanidin 5-O-glucosyltransferase
OS11G0461200183.268042629.449933472.63762.74 × 1050.0069429anthocyanidin 6-O-glucosyltransferase
OS04G055780026651.3606350.703434669.03799.20 × 10723.03 × 1067anthocyanin regulatory Lc protein
OS11G025870037.486069850Inf6.84 × 10115.92 × 108anthocyanin regulatory Lc protein
OS01G03725008756.7121416.441438359.05691.39 × 10204.15 × 1017Leucoanthocyanidin dioxygenase
OS01G06335004738.9175243.0082178110.6213.50 × 10302.88 × 1026Dihydroflavonol−4-reductase
OS04G05575004723.6207112.4942418810.8871.07 × 10401.75 × 1036Anthocyanin regulatory R-S protein
OS04G063030010.54946251386.0994026−5.19371.24 × 1098.16 × 107Anthocyanidin reductase
OS10G0320100938.020469498.060733413.25795.13 × 10125.63 × 109Flavonoid 3′-hydroxylase
OS11G0530600814.683769515.869224435.68199.91 × 10296.52 × 1025Chalcone synthase 1
OS12G0270900383.64913918.8365611855.44028.77 × 10284.81 × 1024Flavonol 3-sulfotransferase

