Role of Carbonic Anhydrases and Inhibitors in Acid–Base Physiology: Insights from Mathematical Modeling

1
Department of Physiology and Biophysics, Case Western Reserve University School of Medicine, Cleveland, OH 44106, USA
2
Department of Medicine, Case Western Reserve University School of Medicine, Cleveland, OH 44106, USA
3
Department of Biochemistry, Case Western Reserve University School of Medicine, Cleveland, OH 44106, USA
*
Author to whom correspondence should be addressed.
Int. J. Mol. Sci. 2019, 20(15), 3841; https://doi.org/10.3390/ijms20153841
Submission received: 26 June 2019
/
Revised: 24 July 2019
/
Accepted: 25 July 2019
/
Published: 6 August 2019
(This article belongs to the Special Issue Protease and Carbonic Anhydrase Inhibitors, II)
Abstract
:Carbonic anhydrases (CAs) catalyze a reaction fundamental for life: the bidirectional conversion of carbon dioxide (CO2) and water (H2O) into bicarbonate (HCO3−) and protons (H+). These enzymes impact numerous physiological processes that occur within and across the many compartments in the body. Within compartments, CAs promote rapid H+ buffering and thus the stability of pH-sensitive processes. Between compartments, CAs promote movements of H+, CO2, HCO3−, and related species. This traffic is central to respiration, digestion, and whole-body/cellular pH regulation. Here, we focus on the role of mathematical modeling in understanding how CA enhances buffering as well as gradients that drive fluxes of CO2 and other solutes (facilitated diffusion). We also examine urinary acid secretion and the carriage of CO2 by the respiratory system. We propose that the broad physiological impact of CAs stem from three fundamental actions: promoting H+ buffering, enhancing H+ exchange between buffer systems, and facilitating diffusion. Mathematical modeling can be a powerful tool for: (1) clarifying the complex interdependencies among reaction, diffusion, and protein-mediated components of physiological processes; (2) formulating hypotheses and making predictions to be tested in wet-lab experiments; and (3) inferring data that are impossible to measure.
Keywords:
CO2; pH; HCO3−; facilitated diffusion; buffering; cell membranes; renal proximal tubules; red blood cells; alveoli; gas exchange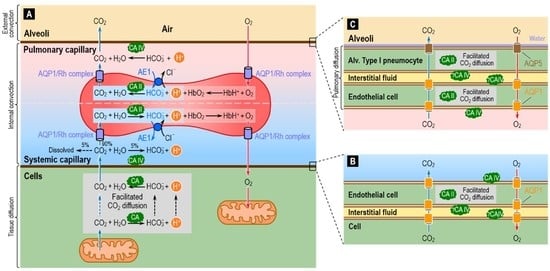
1. Introduction
Carbonic anhydrases (CAs) are ubiquitous metalloenzymes that catalyze one of the most important reactions in life: the interconversion of carbon dioxide (CO2) and water (H2O) to bicarbonate (HCO3−) and protons (H+). Because this reaction is so fundamental to life, understanding the physiological role of this enzyme has been the focus of research for almost 90 years since the discovery of CA, in red blood cells (RBCs), by Meldrum and Roughton [1]. The discovery of CA occurred at a time during which physiologists were intensely interested in the chemical nature of blood, and in understanding how the slow interconversion of CO2 and HCO3− in vitro (>1 min) could be compatible with the relative fast pulmonary capillary transit time (~1 s). Our understanding has increased substantially since those days.
We now know that CAs fall into at least seven unique families (α, β, γ, δ, ξ, η and θ)—encoded by seven evolutionarily distinct gene families—and that at least one CA family is present in virtually every living organism.
The initial descriptions of the η and θ gene families are only a few years old [2,3]. For a review of the CA families, see a recent monograph [4]. To date, investigators have deposited in the PDB over 900 CA structures [5]. Although most of these structures represent the α-family, the structures also include those for the β, γ and ξ families. For additional information on the history and recent advancements of crystallography of CA, we refer to a recent review [5].
The α-family is the most widely studied because of its role in human physiology and pathophysiology. The α-CA family comprises 16 members in vertebrates, each with a characteristic tissue-specific expression, cellular and sub-cellular localizations, kinetics and sensitivity to inhibitors [6,7,8,9]). Based on their sub-cellular localization, the members of the α-CA family can be divided into four groups: cytosolic (CA I, CA II, CA III, CA VII, CA VIII, CA X, CA XI, and CA XIII), mitochondrial (CA VA and CA VB), secretory (CA VI), and membrane-associated (CA IV, CA IX, CA XII, CA XIV, and CA XV). The mature membrane-associated CAs can be either glycosylphosphatidylinositol (GPI)-linked (CA IV and CA XV) or transmembrane (CA IX, CA XII and CA XIV).
Three of the cytosolic CAs—CA VIII, CA X and CA XI—are catalytically inactive, due to the absence of critical amino acids (e.g., His residues necessary to coordinate Zn2+ at the reaction center). Hence, these CAs are called CA-related proteins (CARPs). Although the CARPs are linked to human disease and are known to interact with cytosolic proteins, their physiological roles remain unclear (for reviews, see [10,11,12,13]). For all three CARPs, mutations that partially restore the catalytic site to resemble that of the classical α-CAs engender catalytic activity [14,15,16]. In addition to the 16 aforementioned CAs, two receptor protein tyrosine phosphatases (RPTPs), RPTPγ and RPTPζ, have extracellular CA-like domains (CALDs) that are closely related to the CARPs. Recent work indicates that RPTPγ may be a dual sensor for extracellular CO2 and HCO3− that is responsible for the physiological response of renal proximal tubules to changes in blood levels of CO2 and HCO3− [17]. It may be that, rather than interconverting CO2 and HCO3−, the CALD domains (and the closely related CARPs), sense CO2 vs. HCO3−.
Because CAs catalyze a reaction that is so fundamental in life, these enzymes affect a wide range of physiological processes in a variety of tissues and cellular compartments. These processes include respiration (e.g., transmembrane CO2 movements, O2 exchange in red blood cells via the pH and CO2 Bohr effects), transepithelial fluid secretion, transepithelial acid–base transport (e.g., gastric-acid secretion and pancreatic HCO3− secretion), and acid secretion by osteoclasts in bone resorption [18,19,20,21,22]. CA-dependent acid–base transport by renal epithelia plays a central role in regulating whole-body acid–base balance, which in turns affects cell pH, the stability of which is critical for countless biochemical reactions (e.g., gluconeogenesis, ureagenesis, and lipogenesis) and nearly every other cellular function. Overexpression of CA is associated with a variety of pathological states, including glaucoma, tumorigenesis, obesity, calcification and epilepsy [9,23,24,25,26,27,28]. Thus, investigators continue to invest considerable attention to the design of CA-selective inhibitors as potential therapeutic agents [29,30,31,32].
CAs have been the subject of numerous reviews and monographs of a general nature [4,8,33,34,35,36,37,38,39,40], or that focus on specific aspects of CA biology, including diseases [41,42,43,44,45,46,47,48], protein structures [5,7,49], and drugs [8,29,30,31]. The present review differs because it focuses on the mathematical modeling of CA biology in the context of acid–base physiology and the movements of CO2 across cell membranes that separate the many compartments within the body. One major compartment is the extracellular fluid (ECF) that bathes the cells of the body. This is Claude Bernard’s “milieu intérieur”, and includes blood plasma, interstitial fluid, and transcellular fluid (e.g., cerebral spinal fluid). A complication is that the composition of the ECF varies regionally. Thus, blood-plasma composition not only changes as blood courses along a capillary, but the profile potentially differs among each of the body’s 10 billion capillaries. Another major compartment is the intracellular fluid (ICF), which includes the cytosol and fluid inside of cellular organelles. Of course, each of the 30–40 trillion cells in the human body, even adjacent cells, has a potentially unique set of compositions. Finally, the body surrounds many fluid compartments—Bernard’s “milieu extérieur”—that really are outside the body. These compartments include the contents of renal tubules in which urine formation occurs, alveoli in which pulmonary gas exchange occurs, and the entire gastrointestinal tract, including structures that diverge from the intestines (e.g., ducts of the pancreas). Nearly all of these countless compartments, and many of the membranes that surround them, contain CAs. Mathematical modeling holds the potential of helping us understand physiology in areas of the body where processes are currently impossible to measure or difficult to interpret. Thus, in this review, we also consider how mathematical modeling can provide insights on CA functions in tissues—that is, complex compartments—taking as specific examples renal proximal tubules as well as alveoli and their adjacent capillaries.
2. Role of Carbonic Anhydrases in Acid–Base Buffering
In the next sections, we review some concepts of acid–base chemistry that are important for understanding the role of CA in acid–base homeostasis. For a more in depth treatment of these topics, we refer to Ref. [50], which provides a tutorial for beginners in the field. For a more advanced treatment of these topics, we refer to Refs. [51,52].
2.1. Role of Buffers in Acid–Base Homeostasis
For any compartment in the body—or nanodomains adjacent to membranes or other structures—maintaining pH within a narrow range could be essential for normal physiological processes. Homeostasis is the active control—and thus the tendency to stabilize the value—of a vital physiological parameter. Integrated over many compartments, pH homeostasis is critical for life. The fine tuning of steady-state pH in a compartment is the result of adjustments in the rates at which acid–base equivalents move across the membranes bordering that compartment.
Intimately related to the concept of pH homeostasis is that of buffering. A buffer is any chemical that can reversibly consume or release H+:
In the above reaction, HB(n+1) is a weak acid with a valence of n + 1, whereas Bn is the conjugate weak base with a valence of n. It is important to note that buffers play no role in establishing the steady-state pH of a compartment—that depends only on the addition or consumption of acid–base equivalents. Nevertheless, buffers do play two important roles in acid–base homeostasis, but only temporary (time-dependent) ones: (1) An acute acid or alkaline load to a compartment perturbs the equilibria of a multitude of pH buffers, and the buffers reactions respond by tending to minimize the initial change in pH. (2) The compensatory response of acid–base transporters to the pH perturbation shifts these equilibria in the direction opposite to that of the original perturbation, so that the buffer reactions tend to slow the attainment of the new steady state. In other words, the role of buffers is to prevent pH from changing too far or too fast—they tend to stabilize pH [50,51,53,54].
For organisms with substantial rates of CO2/HCO3− metabolism, the CO2/HCO3− buffer pair—a special case of the buffer in Reaction (1)—can, in principle, be a more powerful buffer than all other buffers combined. However, this high CO2/HCO3− buffering power has two requirements: (1) As we discuss below, the “system” must be “open” vis-à-vis CO2/HCO3−. (2) The CO2/HCO3− buffer reactions must be able to progress with sufficient velocity that they can contribute in the available time—the raison d’être for carbonic anhydrases.
2.2. The CO2/HCO3− Buffer System and Related Species
The major components of the CO2/HCO3− buffer system—CO2, HCO3− and H+—are linked through the two-step reaction
The first reaction—the CO2 hydration/carbonic acid (H2CO3) dehydration reaction—is very slow. The second reaction—the dissociation or ionization of H2CO3—is extremely rapid and is always at equilibrium under physiological conditions [55]. Because many physiological processes occur in a time scale much faster than that of the CO2 hydration reaction, most tissues and cells in the body express a form of CA.
The reactions in (2) can be written in the thermodynamically equivalent form
The Henderson–Hasselbalch equation describes the equilibrium, in logarithmic form, of the above reaction and states that, in a simple CO2/HCO3− buffer system, pH depends on the ratio of the concentrations of HCO3− and dissolved CO2:
where pKCO2 is the negative log10 of the equilibrium constant K of Reaction (3), and has a value of ~6.10 in mammalian blood plasma at 37 °C.
In addition to the above CO2-related reactions, several others can occur in biological solutions. For example, the HCO3− that forms in Reaction (2) can dissociate rapidly to form carbonate (CO3=):
This reaction, governed by a pK of ~10.3 at 37 °C, is of limited significance for buffering at the pH of mammalian blood plasma, but could be important for compartments at high pH. Moreover, CO3=, in turn, can form ion pairs with Na+, Li+, Ca2+ and Mg2+. Finally, Reaction (5) is crucial for certain so-called HCO3− transporters that in fact appear to carry CO3= [56].
Another reaction that involves CO2 is the direct combination with OH−:
Like Reaction (5), Reaction (6) is of little significance for CO2/HCO3− buffering except in high-pH compartments, where [OH−] is high. Although the literature often simplifies the situation by stating that CAs catalyze the first step in Reaction (2), the α-CAs at the level of the catalytic zinc atom (i.e., Zn2+) catalyze Reaction (6), while at the same time splitting H2O (H2O H+ + OH−) to provide the needed OH−. Recently, Zhao and colleagues developed a novel assay for measuring CA activity, based on stopped-flow techniques and the creation of a well-defined out-of-equilibrium condition [57].
From the above discussion, we can conclude that most CO2-related carbon in the human body—aside from the carbonates in structures such as bone and tooth enamel—is present in the form of HCO3−. In fact, for a pH of 7.40—the value of normal, human arterial plasma at 37 °C—the Henderson–Hasselbalch equation predicts that the concentration of HCO3− is approximately 20 times the concentration of dissolved CO2. For a pH of 7.20—a representative value of normal intracellular pH of most cells—the Henderson–Hasselbalch equation predicts that the concentration of HCO3− is approximately 12.6 times the concentration of dissolved CO2.
2.3. Competition among Buffers
H+ (or the OH− formed in the reaction H2O H+ + OH−) is the common denominator in the above reactions. In other words, these reactions are all competing for a common pool of H+/OH−. Understanding this competition is extraordinarily complex. In the 20th century, physiologists quantitating acid–base chemistry typically employed the so-called Davenport diagram [58], which lumps together all non-CO2/HCO3− buffers in Reaction (1) into a single pseudo-buffer, the protonation of which varies approximately linearly with pH, and ignores all reactions involving CO3=. Moreover, the Davenport approach applies only to equilibrium conditions in a single compartment. Reference [51] provides a theoretical explanation for constructing the Davenport diagram and using it to interpret acid–base disturbances. Nevertheless, the Davenport approach was a major step forward in understanding the competition among buffer reactions.
Modern computational approaches make it possible to model explicitly each individual buffer pair, as done by Somersalo et al. [59], and to simulate how the system achieves equilibrium in a time- and space-dependent manner, taking into consideration both the reactions and diffusion of each buffer component. Moreover, preliminary reports describe extensions of such models to reactions involving CO3= [60]. A recent modeling contribution describes the reaction and diffusion processes in a confined space near a cell membrane [61].
2.4. CO2/HCO3− Buffering in Closed vs. Open Systems
A closed system is one from which none of the components of CO2/HCO3−—related reactions (including any carbonate-related species) can escape, nor into which none can enter. Here, the buffering power (βclosed)—a measure of pH stability—is maximal when pH = pKCO2 and falls off symmetrically at higher/lower pH values. In general, for a buffer pair of the form HB/B−, βclosed is
According to Equation (7), βclosed is proportional to the total amount of buffer, [TB]—which is the sum of [HB] and [B−] [51].
In a closed system, the buffering power of CO2/HCO3− is relatively low, as for any other buffer pair (e.g., H2PO4−/HPO4=). In such a closed system, the buffering of added H+ in Reaction (2) is limited by the depletion of HCO3− and build-up of CO2. Conversely, buffering due to H+ depletion is limited by the depletion of CO2 and build-up of HCO3−.
Although CO2/HCO3− is a mediocre buffer in a closed system, it can be extremely powerful if the “system” is open to CO2, as is generally the case. For example, the CO2 in arterial blood plasma is virtually in equilibrium with the CO2 in alveolar air, which acts as an infinite sink for CO2 because of the body’s ability to regulate ventilation and thereby stabilize alveolar [CO2] despite large changes in the metabolic production of CO2. Thus, the buffering of H+ in Reaction (2) is limited only by the depletion or accumulation of HCO3− because the CO2 produced ultimately ends up in the atmosphere. In such an open system, βopen for CO2/HCO3− rises exponentially with pH, as follows:
and—in the physiological range—can be enormous.
Because blood plasma is in direct communication with the bulk of the ECF, and because CO2 in the ECF equilibrates across cell membranes [62] with the CO2 in the cytoplasm, the human body behaves more or less as one large open system for CO2. The ability of the body to exploit this large CO2/HCO3− buffering power requires that the CO2/HCO3− buffer reaction can take place on an appropriately rapid physiological time scale, which is the job of CAs.
3. Role of Carbonic Anhydrases in the Facilitated Diffusion of CO2 and Other Buffers
The traffic of CO2 into or out of a compartment depends not only on the movement of CO2 across the border of that compartment (e.g., the plasma membrane in the case of a cell) but also on the diffusion of CO2 across the adjacent unstirred layers—more accurately termed unconvected layers [59]—on both sides of the membrane (i.e., intracellular and extracellular fluids in the case of a cell). Because free diffusion of CO2 is often slow considering the rapid time and spatial scales of physiological processes, the CO2/HCO3− buffer—in addition to its role in buffering—can play a key role in facilitating (or, equivalently, augmenting) the diffusion of CO2 within or across the many compartments of the body.
In the next sections, we discuss how CO2/HCO3−-related reactions and CA can augment the diffusion of CO2 within aqueous unconvected layers (ULs) and across membranes. In particular, we focus our attention on some of the work done in the past 50 years and that has set important milestones towards our understanding of the contribution of the reaction and diffusion processes involved in facilitating CO2 diffusion.
3.1. Role of CA in the Facilitated Diffusion of CO2
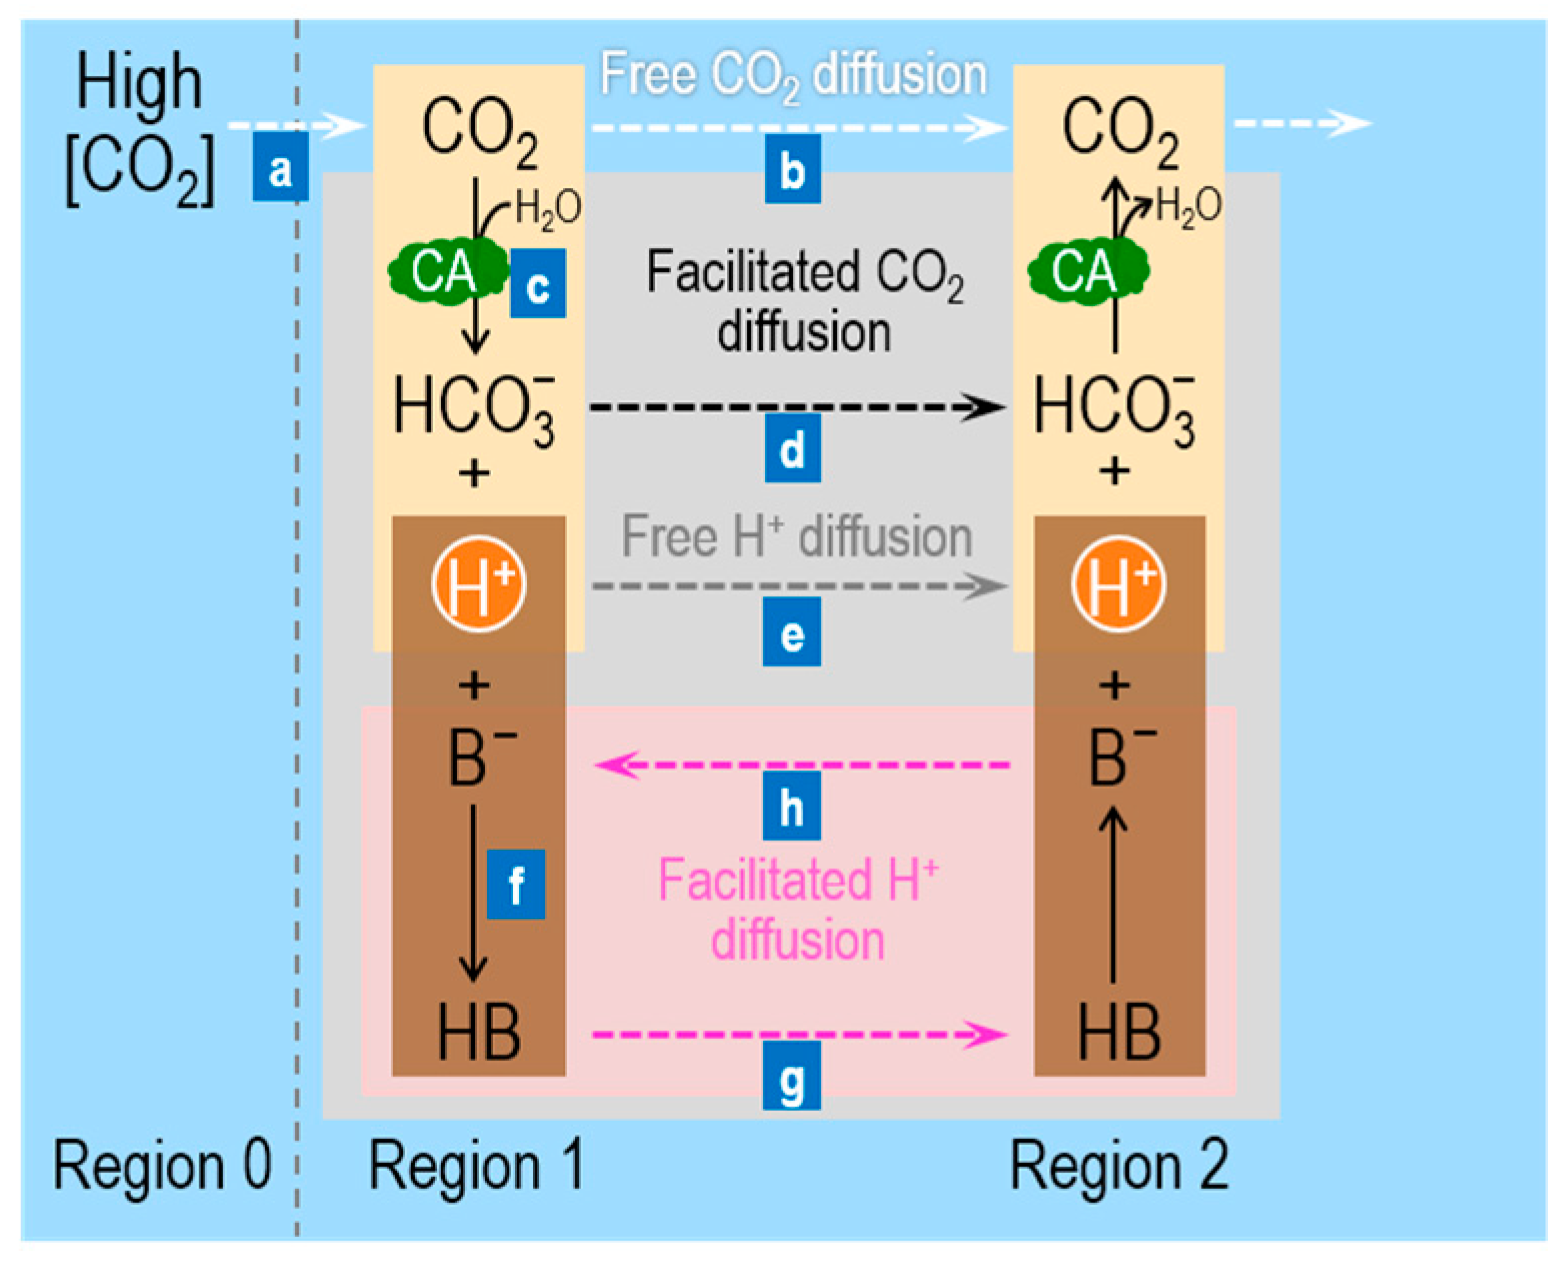
“Facilitated CO2 diffusion” describes the contribution of HCO3−, H+, and other buffer pairs (HB/B−) to CO2 transport by simultaneous reaction and diffusion processes in which the parallel diffusion of HCO3−, H+, and HB—and the antiparallel movement of B−—enhances the “free” diffusion of CO2. As we show below, similar processes also can facilitate the diffusion of HCO3−, H+, B−, and HB.
Figure 1 summarizes the processes (labeled “a”, “b”, “c”, etc.) involved in facilitated CO2 diffusion in a layer of buffered solutions (shaded grey area between Regions 1 and 2). Imagine that we begin with a layer of buffered solution that contains the CO2/HCO3− buffer, CA, and a mobile buffer HB/B−—in equilibrium both with respect to chemical reactions and diffusion. We now suddenly raise [CO2] in Region 0 (to the left of Region 1 in Figure 1), thereby establishing a gradient for CO2 from Region 0 (R0) to Region 1 (R1)—that is, [CO2]R0 > [CO2]R1—and causing a flux of CO2 (“a” Figure 1). The CO2 newly arriving in Region 1 can have two fates (“b” and “c” in Figure 1): (b) because [CO2]R1 now exceeds [CO2]R2, CO2 can freely diffuse from Region 1 → Region 2 (R2, dashed white arrow); or (c) it can combine with H2O to form equal amounts of HCO3− and H+, thereby making [HCO3−]R1 > [HCO3−]R2 and [H+]R1 > [H+]R2. In Region 1, the presence of CA promotes facilitated diffusion by two mechanisms. First, the CA promotes the consumption of CO2 in Region 1, and thereby magnifies the concentration gradient driving CO2 diffusion from Region 0 → Region 1 (“a” in Figure 1). This is the critical first step of facilitated diffusion: because of CA, carbon (in the form of CO2) moves more rapidly from Region 0 to Region 1. Second, CA in Region 1 promotes the transformation of most of this carbon (under physiological conditions) to HCO3−, which then diffuses from Region 1 to Region 2 (dashed black arrow; “d” in Figure 1).
The entire process outlined above ought to be pH sensitive. Under physiological conditions (e.g., pH = 7.4, pKCO2 = 6.1), the ratio [HCO3−]/[CO2] is 10(7.4–6.1) = 20. Thus, if 21 molecules of CO2 diffused from Region 0 to Region 1, one would remain CO2 but 20 would become HCO3− (if we assume that pH does not change). Thus, the CA-catalyzed reaction consumes ~95% of the CO2 arriving in Region 1, thereby enhancing the CO2 gradient from Region 0 → Region 1. Moreover, by converting ~95% of the incoming CO2 to HCO3−, the reaction increases the concentration gradient from Region 1 → Region 2 by 20× more for HCO3− than for CO2. Because CO2 and HCO3− have similar diffusion coefficients, the CA-enhanced conversion from CO2 to HCO3− in Region 1 greatly accelerates the flux of carbon, mostly in the guise of HCO3−.
If the ambient pH were the same as the pKCO2, the contribution of facilitated diffusion would be much less. In this case, if two molecules of CO2 diffused from Region 0 to Region 1, one would remain CO2 and one would become HCO3−. Compared to the example at pH 7.4, the enhancements of both the CO2 gradient from Region 0 → Region 1, and of the HCO3− gradient from Region 1 → Region 2 would be diminished.
Once the CO2 and HCO3− arrive in Region 2, some of the newly arriving HCO3− will—under the influence of CA—combine with H+ to form CO2 and H2O. Region 2 now becomes the new Region 1, and the facilitation process recapitulates itself indefinitely.
We now turn our attention to the non-CO2/HCO3− buffer. The newly formed H+ in Region 1 can (see “e” and “f” in Figure 1): (e) diffuse freely from Region 1 to Region 2 (dashed grey arrow); or (f) react with B− to form HB. Process “f” is important for two reasons. First, it promotes the conversion of a greater fraction of incoming CO2 to HCO3−. Second, because concentration gradients for H+ are seldom large, process “e” is usually very slow. On the other hand, the vast majority of newly formed H+ will react with B− to form HB, so that the increase in [HB]R1 may—depending on pH, pKHB, and [TB]R1—be orders of magnitude greater than the increase in [H+]R1. Thus, the gradient [HB]R1 > [HB]R2 may increase by orders of magnitude more than the gradient [H+]R1 > [H+]R2, and thus the presence of the mobile buffer facilitates diffusion of H+ ions from Region 1 to Region 2 (pink shaded area; “g” in Figure 1). After HB arrives in Region 2, it rapidly dissociates into B− and H+. B− diffuses back to Region 1 (“h” in Figure 1), whereas the newly formed H+ rapidly reacts with the HCO3− ions that have diffused from Region 1 and form CO2.
In summary, facilitated CO2 diffusion depends on four factors, aside from the initial increment in [CO2]o. Viewed from the perspective of Region 1, these are: (i) the difference (pH – pKCO2), which establishes the fraction of CO2 (arriving from Region 0) consumed to form HCO3−; (ii) CA, which accelerates this consumption of incoming CO2; (iii) the total concentration of the mobile buffer, [TB], which influences the velocity of H+ consumption and the magnitudes of the gradients for B− and HB; and (iv) the difference (pH – pKHB), which influences the same parameters as (iii). The same four factors play a converse role as viewed from Region 2, and the eight factors together determine the fluxes through the five dashed arrows in Figure 1. Note that all solutes diffuse in the direction of the CO2 gradient, except B−, which diffuses in the direction opposite to that of HB.
The role of CA in facilitating diffusion of CO2 was first demonstrated in 1966 in the laboratory of Forster [63], where Longmuir and colleagues measured the apparent diffusion coefficient of CO2 (DCO2,app) in buffered solutions. They found that adding to the buffer solution a tiny amount of purified CA, or the CA in hemolyzed whole human blood, increased the value of DCO2,app from that in water. These authors concluded that, in the absence of CA, the CO2 hydration/dehydration reactions are the rate limiting steps and that CA augments the diffusion of CO2. In the same year, Enns et al. [64] and Moll and Gros [65] demonstrated that facilitated diffusion of CO2 occurs in layers of red blood cells [64,65] and that acetazolamide (ACZ) blocks this facilitation [64]. In 1967, Enns showed that this facilitation (vs. the free diffusion of CO2) increases with increasing pH and becomes dominant at pH values greater than the pKCO2 of 6.10, when the concentration of HCO3− exceeds the concentration of CO2 [66].
Gros and Moll [67] and Gros et al. [68] underscored the importance of facilitated H+ diffusion in the facilitation of CO2 diffusion. These authors showed that, in addition to CA, facilitated CO2 diffusion requires a sufficient amount of mobile buffers to provide an equivalent flux of H+ (i.e., HB plus H+ per se) equal to the flux of HCO3−—consistent with the 1-to-1 stoichiometry of H+ and HCO3− in Reaction (3). They reached this conclusion by complementing their experiments with quantitative considerations [67] and mathematical modeling [68]. In their quantitative approaches, based on Fick’s first law of diffusion or on the Nernst–Planck equation in one dimension, these authors assumed that, in the presence of CA, Reaction (3) is in equilibrium and that facilitated diffusion is electrically silent. Thus, by everywhere imposing: (a) chemical equilibrium of Reaction (3) and (b) electroneutrality in the layer, and also applying (c) appropriate boundary conditions to mimic their experimental conditions, they solved numerically the resulting model equations to predict total fluxes of CO2 (defined as the sum of the fluxes of dissolved CO2 and of HCO3−) that would agree quantitatively with the fluxes of CO2 measured experimentally [68,69]. The model predictions supported the conclusion that soluble proteins (i.e., CAs) and mobile buffers can significantly increase H+ diffusion and CO2 transfer.
3.2. Role of CA in the Facilitated Diffusion of Solutes Other Than CO2
In addition to facilitating CO2 diffusion, CA can also promote the facilitated diffusion of HCO3− and H+, as well as of B− and HB.
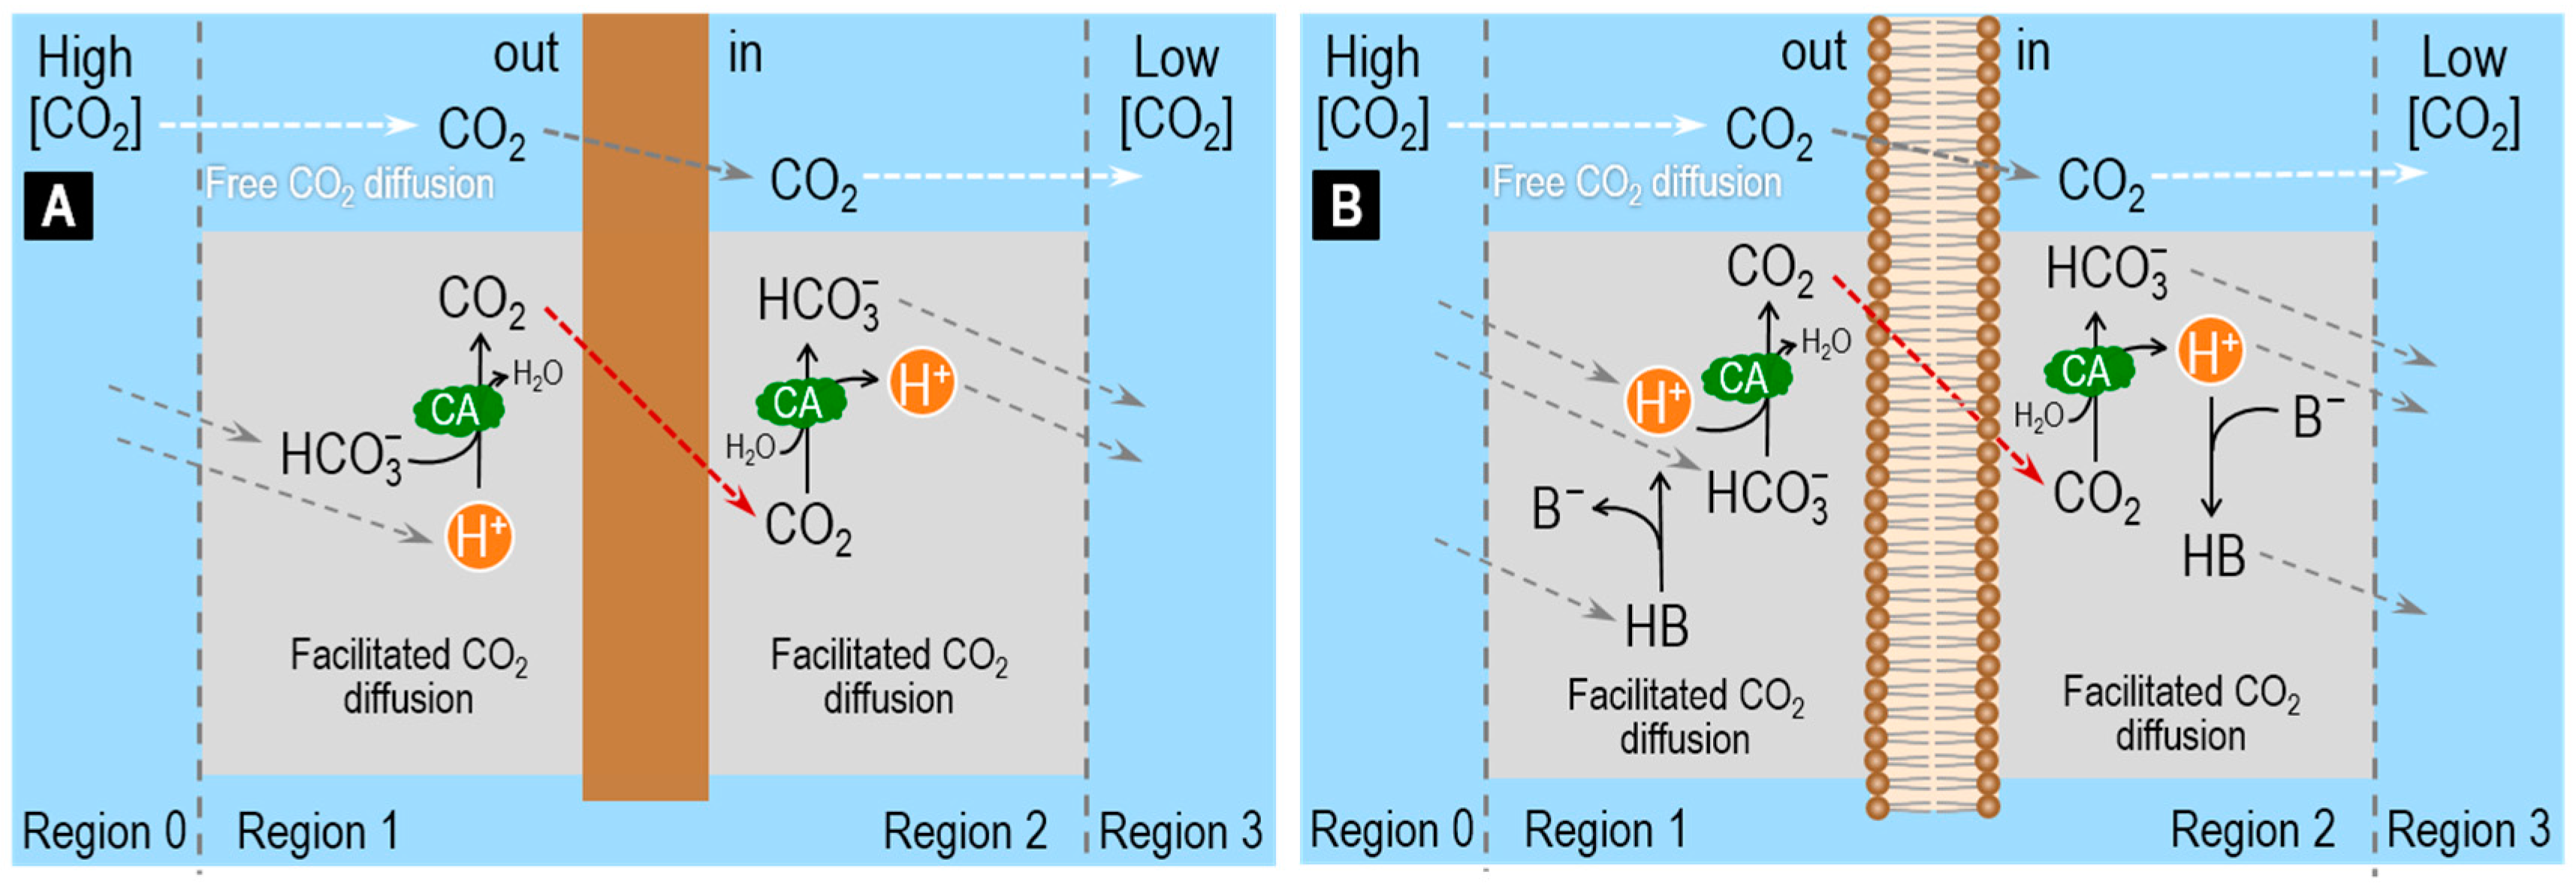
In Figure 2A, we suddenly raise only [HCO3−] in Region 0, generating a HCO3− flux from Region 0 to Region 1. At the pH of blood (pH >> pKCO2), only a small fraction of the HCO3− newly arriving in Region 1 goes on to form CO2. Thus, the diffusion of CO2 from Region 1 to Region 2 (i.e., the facilitated diffusion of HCO3−) augments only slightly the free HCO3− diffusion from Region 1 to Region 2. Note that, because the non-CO2/HCO3− buffer now produces H+ in Region 1 (rather than consuming H+ as in Figure 1), H+ now diffuses in the direction opposite that of CO2 and HCO3−. In summary, CO2 and B− move in parallel with HCO3− (the prime mover), whereas H+ and HB (i.e., the two acidic non-CO2/HCO3− components) move antiparallel.
In Figure 2B, we suddenly raise only [H+] in Region 0, generating an H+ flux from Region 0 to Region 1. Nearly all of the H+ newly arriving in Region 1 goes on to form CO2 or HB. Thus, the diffusion of CO2 and HB from Region 1 to Region 2 (i.e., the facilitated diffusion of H+) augments greatly the free H+ diffusion from Region 1 to Region 2. The CA enhances the contribution of CO2/HCO3− vs. HB/B−. In summary, H+ and the two acidic members of the buffer pairs (i.e., CO2 and HB) move in parallel with H+ (the prime mover), whereas the two basic members of the buffer pairs (i.e., HCO3− and B−) move antiparallel. Spitzer and colleagues examined this system both in terms of physiological experiments on cardiac myocytes and modeling [70].
3.3. Role of CA in the Diffusion of CO2 across Artificial Membranes
CA plays an important role not only in facilitating the diffusion of CO2 within a layer of buffer solutions but also in facilitating diffusion of CO2 across biological membranes. In this section, we review the reaction and diffusion processes underlying facilitated CO2 diffusion across membranes.
According to an integrated form of Fick’s first law of diffusion, the flux of CO2 across a membrane (JM,CO2) is equal to the product of the permeability of the membrane to CO2 (PM,CO2) times the difference in the concentration of CO2 across the membrane:
where [CO2]out,aq is the concentration of CO2 in the aqueous layer immediately adjacent to the extracellular or outer surface (“out”) of the membrane and [CO2]in,aq is the concentration of CO2 in the aqueous layer immediately adjacent to the intracellular or inner surface (“in”) of the membrane. With these definitions of [CO2], PM,CO2 is the permeability of the membrane per se. If we instead defined the [CO2] values as those in the bulk solution at some distance from the membrane, then the permeability would be less because it would include the effects of the resistance to diffusion offered by the unconvected layers on either side of the membrane [62].
According to Equation (9), JM,CO2 can increase because of an increase in PM,CO2 and/or because of an increase in the transmembrane CO2 concentration difference. Integral membrane proteins such as aquaporins (AQPs) or Rhesus (Rh) can increase JM,CO2 by increasing PM,CO2 [59,71,72,73,74,75,76]; CAs can increase JM,CO2 by maximizing transmembrane CO2 concentration differences [77,78,79].
Several authors have investigated facilitated CO2 diffusion across hydrophobic membranes. For example, Broun et al. used artificial membranes, made of silicone rubber, and “enzymatic coating”, to study the mechanisms by which “interfacial enzymatic reactions”, such as CA, may facilitate diffusion of CO2 across a membrane [80,81]. By employing pH-stat recordings and mathematical modeling, they found that transmembrane CO2 fluxes are doubled when CA is on the surface of the membrane [81]. These authors employed a steady-state one-dimensional reaction–diffusion model to predict the concentration profiles of CO2 and HCO3− in the boundary layers of unconvected aqueous solution adjacent to the membrane, when CO2 permeates the membrane (Figure 3A). The model predicts that CA, by increasing the rate of Reaction (3), causes steeper HCO3− concentration gradients in the ULs adjacent to the hydrophobic membrane and also steeper CO2 concentration gradients across the membrane [80,81].
In 1977, Gutknecht et al. used 14C-labeled CO2 to measure the diffusive flux of CO2 across artificial planar lipid bilayers (made of cholesterol, egg lecithin and decane) and adjacent ULs [82]. They demonstrated that, in the absence of CA in the bathing solutions, Reaction (2) is too slow to allow efficient conversion of HCO3− into CO2 in the UL adjacent to the outer side of the membrane and, therefore, is unable to facilitate CO2 diffusion. In the presence of CA in the bathing solutions, rapid conversion of HCO3− into CO2 sustains a relatively high [CO2] in the UL on the upstream side of the membrane thereby facilitating diffusion of CO2 through the artificial lipid bilayer membrane. These authors emphasized the important role of non-CO2/HCO3− buffers (i.e., HB/B−) in facilitating CO2 diffusion across a membrane (Figure 3B). Indeed, they observed that CA facilitates CO2 diffusion only when a mobile non-CO2/HCO3− buffer (such as Tris or HEPES) is also present in the ULs. As illustrated in Figure 3B, the non-CO2/HCO3− buffer supplies the H+ needed to combine with HCO3− to produce CO2 in the UL adjacent to the outer side of the membrane (out) and removes the H+ produced by the CO2 hydration reaction in the UL adjacent to the inner side (in) of the membrane [82,83].
In their study, Gutknecht et al. combined biophysical experiments with a theoretical analysis of the diffusion of CO2 through ULs surrounding a bilayer membrane. The bilayer separates two regions with identical bathing solutions except for the presence of tracer (i.e., 14C) in Region 1. By assuming that
- CO2, HCO3− and CO3= are in chemical equilibrium, that is, the reactions among these solutes occur very rapidly (i.e., CA is present), at a rate much faster than the rate of solute diffusion across the ULs and the membrane;
- only HCO3− and CO3= carry the tracer and diffuse through the ULs; and
- only CO2 moves across the membrane,
These authors were able to use a simplified form of an equation developed earlier [83,84] to relate the steady-state one directional diffusive flux of total CO2 (JCO2) to the diffusive flux of A− in the UL and the transmembrane flux of CO2:
where PUL,B− is the permeability of the UL to A−, [A−] is the sum of the concentrations of HCO3− and CO3= in Region 1 (the region where the flux of CO2 originates) and PM,CO2 has the usual meaning.
Gutknecht et al. employed the above equation to calculate JCO2 as a function of [A−], at a constant [CO2] (i.e., as the pH increases). Moreover, by taking advantage of the catalytic action of CA and by using different pH ranges, these authors were able to identify a condition (CA in the bath and pH > 9) that allowed them to estimate PM,CO2 by fitting the above equation to their experimental data. In this case, JCO2 saturates because the ratio of [A−]/[CO2] is so high that diffusion of A− in the UL dominates diffusion of CO2 across the membrane.
3.4. Role of CA in the Diffusion of CO2 across the Membrane of a Living Cell
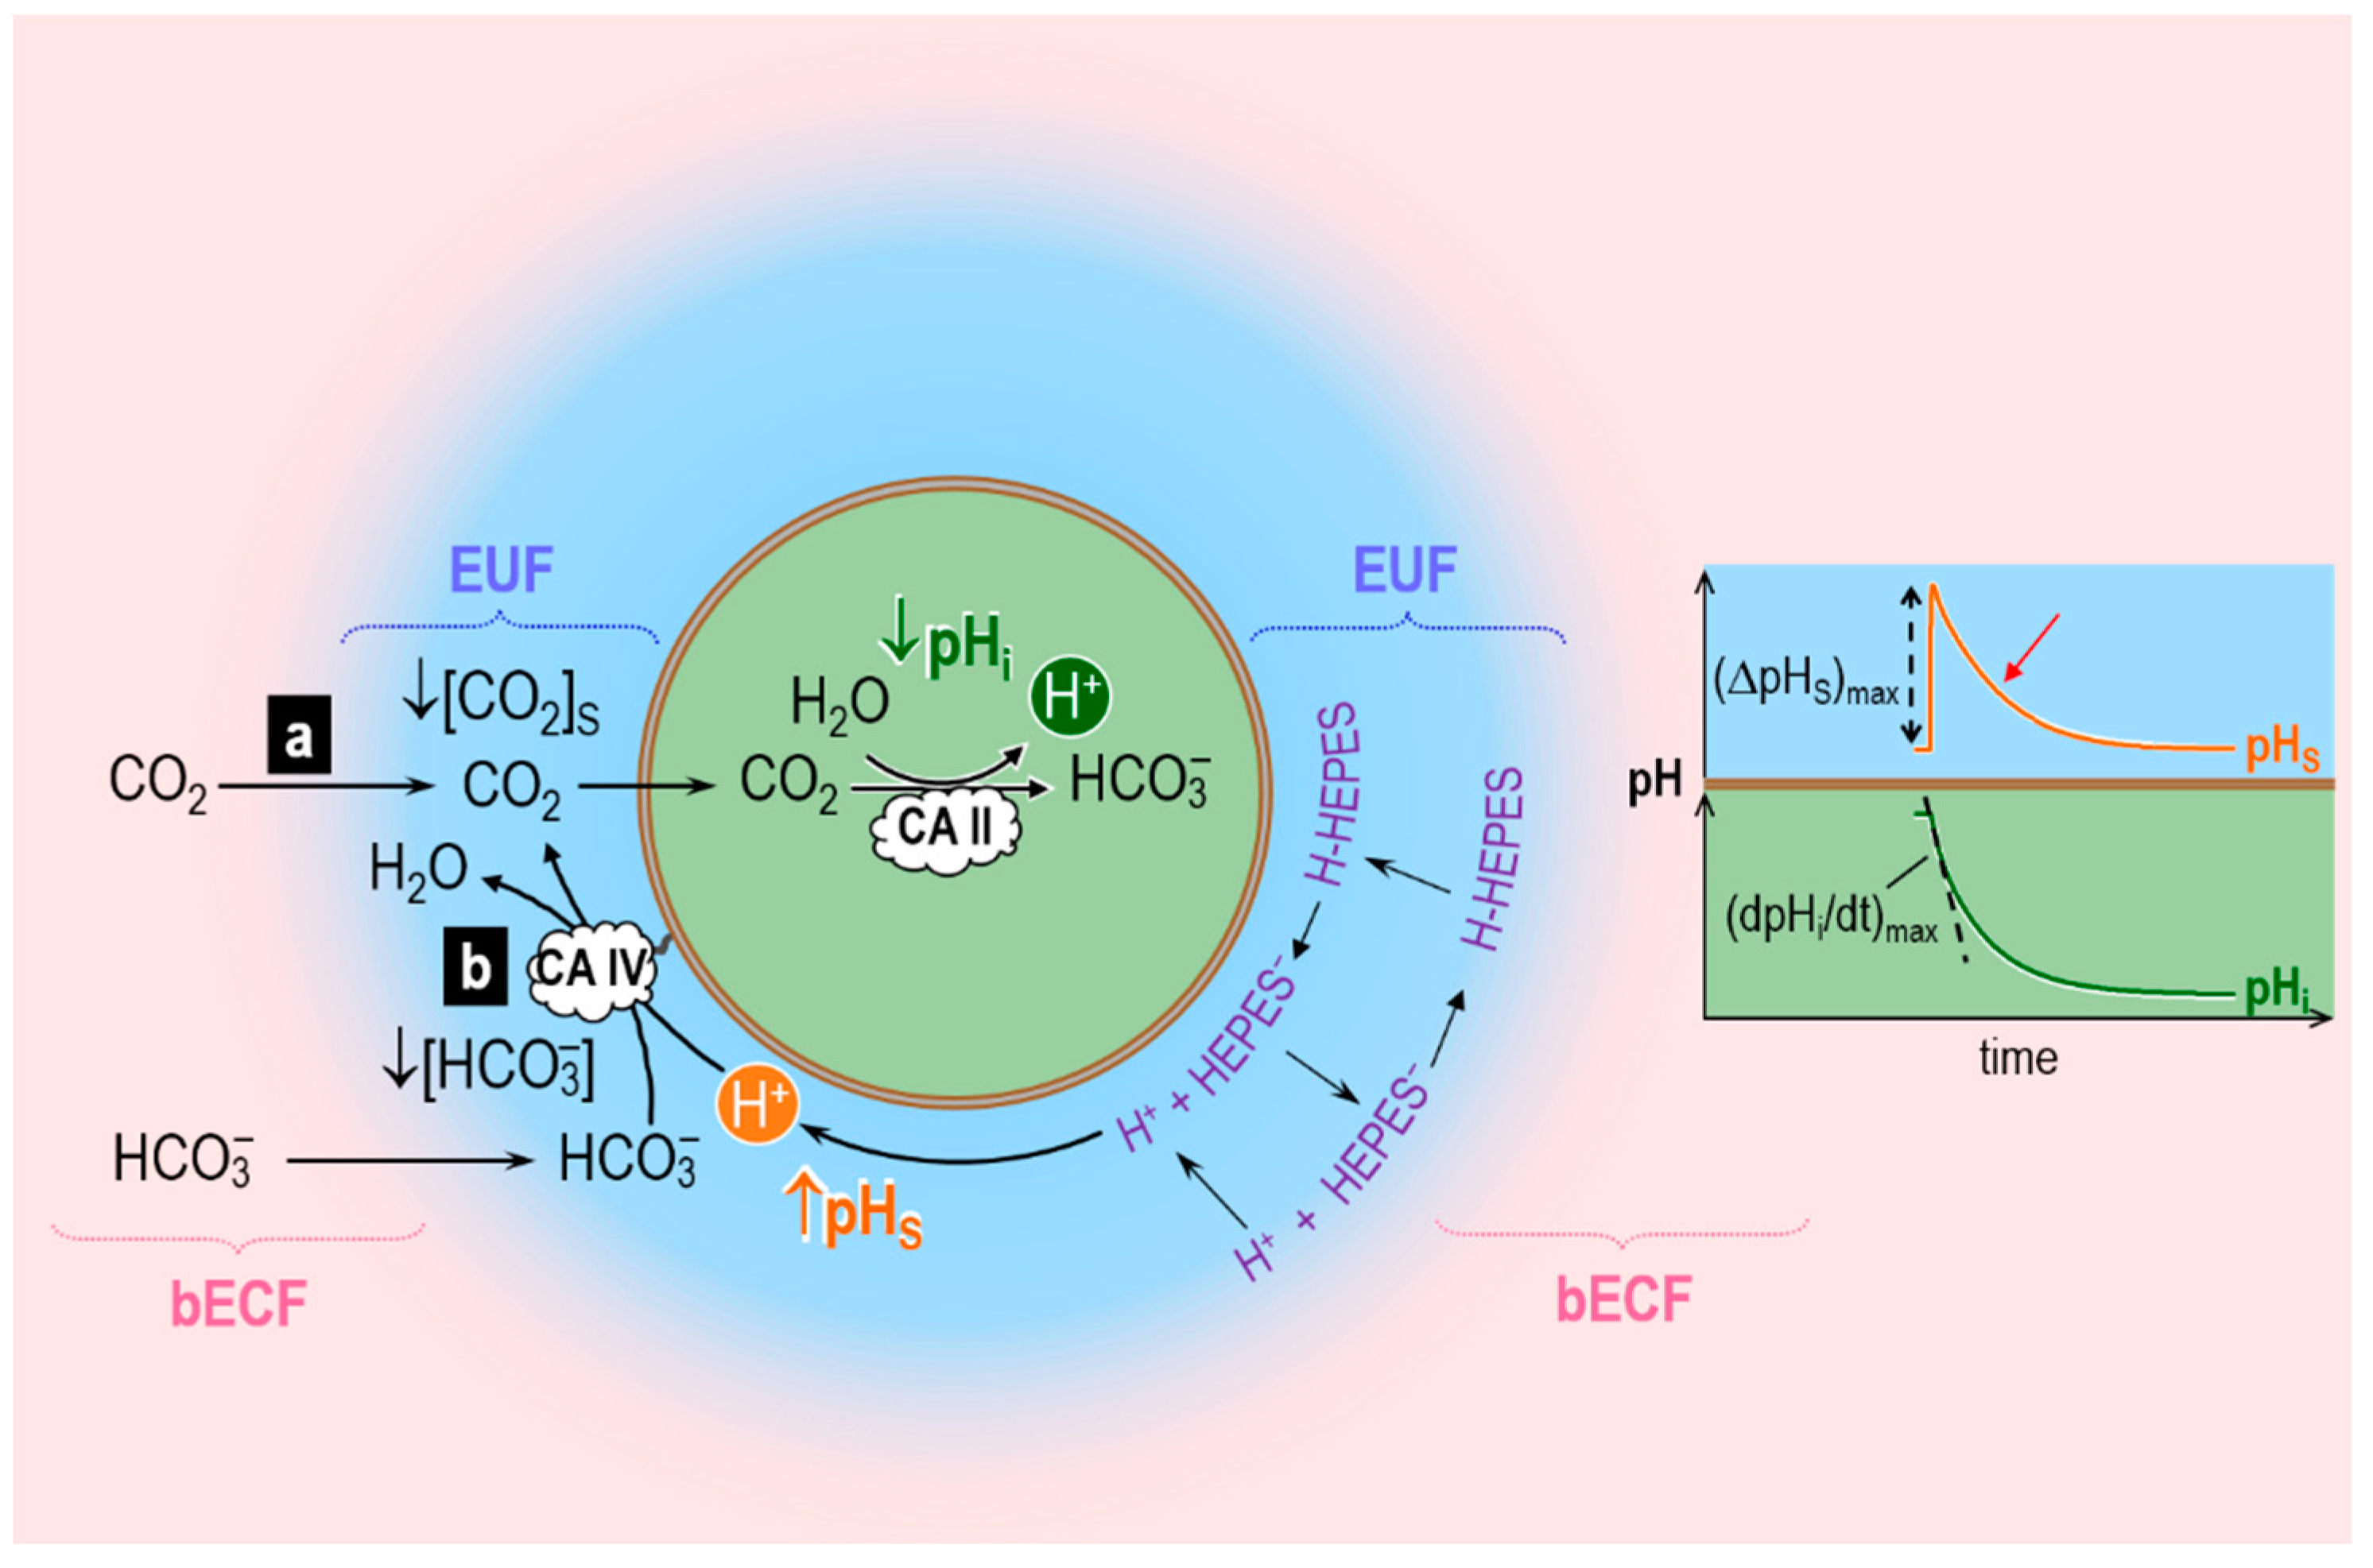
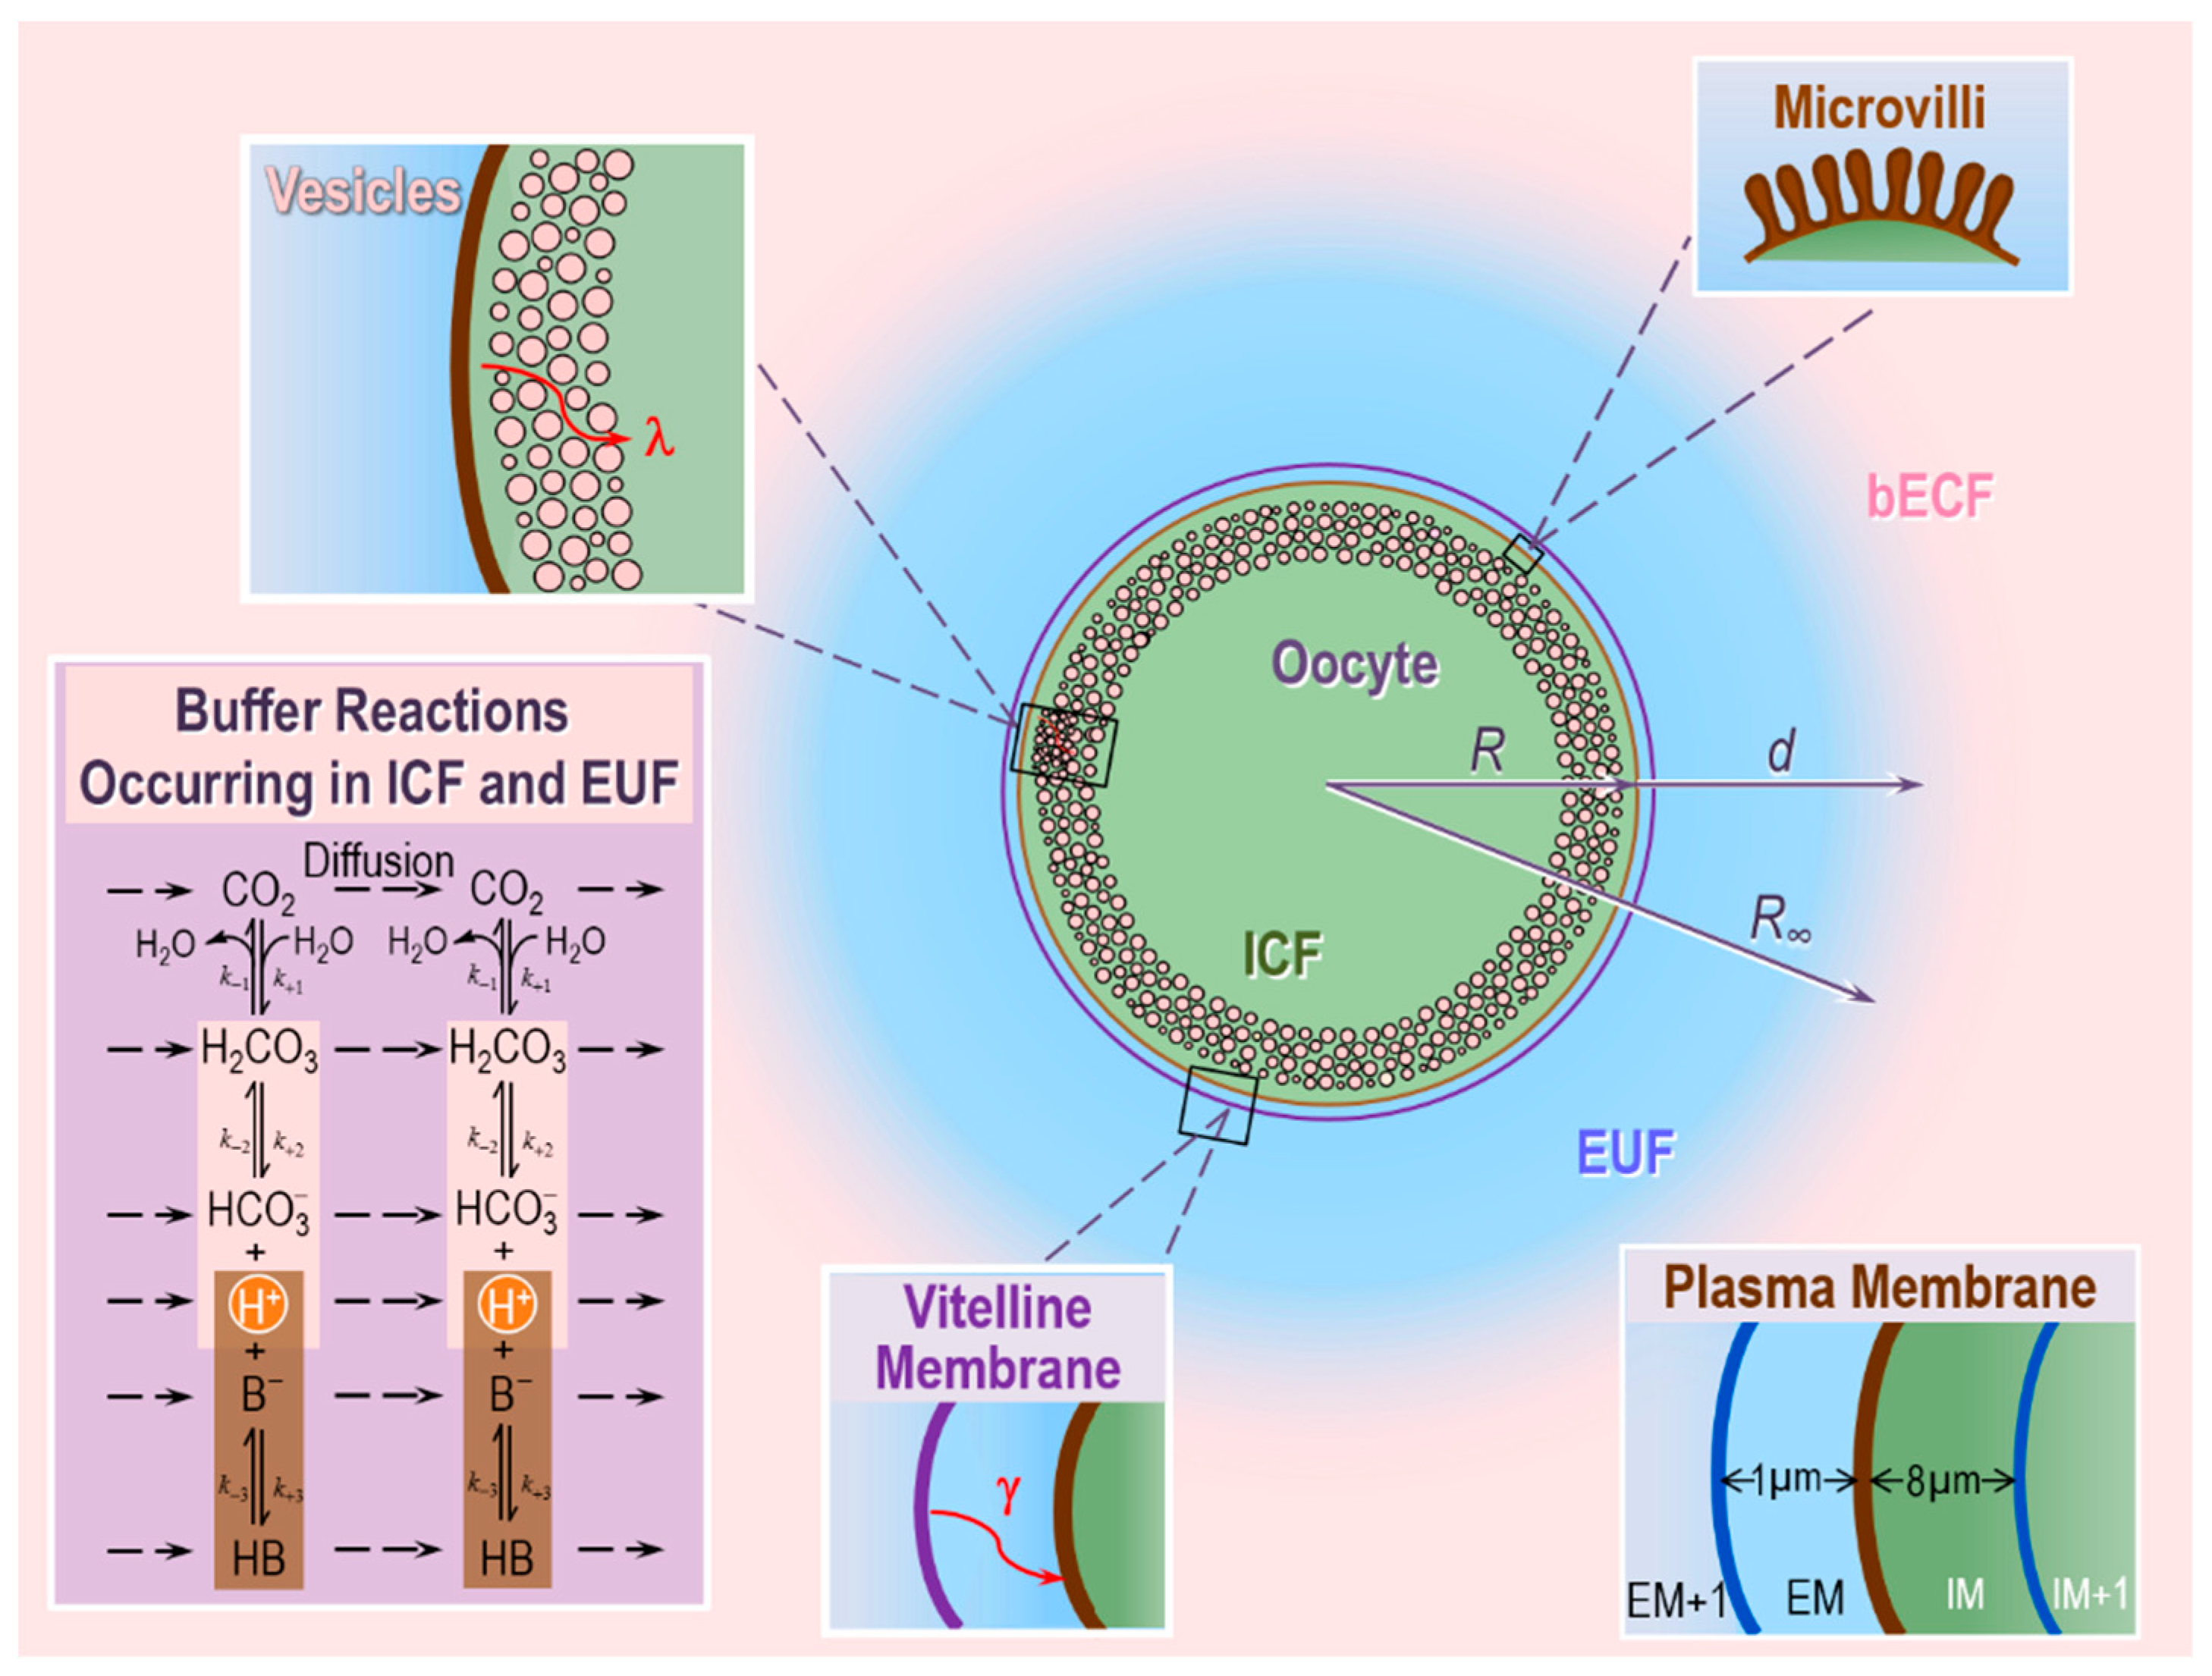
A recent series of three companion papers from our group examined the role of CAs (cytosolic CA II or extracellular-surface CA IV) and non-CO2/HCO3− buffers on the fluxes of CO2 across the membrane of a living cell—a Xenopus laevis oocyte [77,78,79]. For this type of study, oocytes are useful model systems because of their negligible native membrane permeability to H+ and HCO3−-related species.
Musa-Aziz et al. assessed transmembrane CO2 fluxes by using liquid-membrane pH-sensitive microelectrodes to measure simultaneously the changes in intracellular pH (pHi) and extracellular-surface pH (pHS) caused by the addition (or removal) of equilibrated CO2/HCO3− solution in (or from) the bulk extracellular fluid (bECF). Figure 4 illustrates the principles behind the pHi and pHS changes caused by CO2 addition when CO2 is the only solute that can permeate the plasma membrane. The opposite occurs in the case of CO2 removal. Addition of equilibrated CO2/HCO3− in the bECF causes [CO2] to rise in the unconvected fluid in contact with the cell membrane, leading to an influx of CO2 into the cell. Because of this CO2 influx, [CO2] at the outer surface of the cell ([CO2]S) never reaches [CO2]bECF. This cell-surface CO2 lost to the interior of the cell can be replenished by two processes: (a) diffusion of CO2 from the bECF; and (b) the reaction HCO3− + H+ → CO2 + H2O at the cell outer surface. Process (a) does not involve any changes in [H+], and therefore does not register measurements via a pH microelectrode. Process (b) involves the consumption of H+ and therefore can be measured by a pH microelectrode. Musa-Aziz et al. used a blunt pH-sensitive microelectrode, gently pushed against the oocyte surface, to measure the rapid pHS increase caused by process (b) (see Figure 4, orange trajectory) followed by the pHS decay that parallels the decay in the CO2 influx as CO2 levels inside the cell reach those on the outside. In the cytosol, the entry of CO2 causes pHi to decay (Figure 4, dark green trajectory) because of the intracellular reaction CO2 + H2O → HCO3− + H+.
In their experiments with oocytes injected with CA II, Musa-Aziz et al. found that cytosolic CA II not only increases the maximal rate of intracellular acidification, (dpHi/dt)max—as one would expect because CA II accelerates the intracellular reaction CO2 + H2O → HCO3− + H+—but also the maximal change of the pHS transient, (ΔpHS)max. The cytosolic CA also shortens the time constant (τ) as pHS decays from its peak (red arrow in Figure 4)—another index of an enhanced CO2 influx. (That is, the same net amount of CO2 enters the cell, but over a shorter time.) Pretreatment of CAII-injected oocytes with ethoxzolamide (EZA, a permeant CA II inhibitor) completely reversed the effects of CA II on the pHi and pHS transients. Thus, these authors hypothesized that cytosolic CA II, by accelerating the intracellular reaction CO2 + H2O → HCO3− + H+, maintains a relatively low [CO2]i early during the CO2 exposure, thereby maximizing the transmembrane gradient of CO2 that drives CO2 influx. This greater influx of CO2 early during the CO2 exposure enhances the decrease of [CO2]S, thereby accentuating (ΔpHS)max. These experiments with CA II lead to an important principle: the most straightforward pH-related approach for assessing the effects of a cytosolic CA on CO2 fluxes is to measure pHS, that is, the pH transient on the side of the membrane “trans” to the CA.
Musa-Aziz et al. also examined the effect of CA IV, which is present at the outer cell surface of the cell (Figure 4). They concluded that, by accelerating the reaction HCO3− + H+ → CO2 + H2O at the outer cell surface, extracellular-surface CA IV maintains a relatively high [CO2]S, thereby maximizing the transmembrane gradient of CO2 that drives CO2 influx. These experiments with CA IV also lead to an important principle: the most straightforward pH-related approach for assessing the effects of a cell-surface CA on CO2 fluxes is to measure (dpHi/dt)max, that is, the pH transient on the side of the membrane “trans” to the CA.
To test the above hypotheses on the role of CA II and CA IV in enhancing CO2 fluxes, these authors extended the earlier reaction–diffusion model developed by Somersalo et al. to describe the influx of CO2 influx into an oocyte [59]. Following Somersalo et al., Occhipinti et al. assumed that the system contains three major regions (see Figure 5):
- The oocyte, a sphere that comprises the cell membrane and intracellular fluid. Within the ICF, reactions among buffers and diffusion of solutes occur. Surrounding the oocyte is…
- The extracellular unconvected fluid (EUF), a spherical annulus that is concentric with the oocyte. Within the EUF, reactions among buffers and diffusion of solutes occur. Conceptually, the EUF is similar to the classical unstirred layer (a steady-state concept, with a characteristic value for each solute), except that the EUF has meaning even before the establishment of a steady state, and the EUF has the same thickness for each solute [59]. Surrounding the EUF is…
- The bECF, an infinite reservoir of pre-equilibrated solution that mimics the composition of the bath solution used in the physiological experiments. No reaction or diffusion occurs in the bECF.
The ICF and EUF communicate through the plasma membrane, which is infinitely thin and permeable only to CO2, which can freely diffuse across the membrane according to Fick’s first law of diffusion. The EUF and bECF communicate via diffusion only. The buffer reactions in the ICF and EUF include those of: (a) the CO2/HCO3− buffer, modeled according to the two-step Reaction (2), and (b) a single non-CO2/HCO3− buffer of the form HB B− + H+. In the ICF, the HB/B− buffer mimics the sum of all intrinsic buffers (i.e., the buffers whose components do not cross the plasma membrane) that are present in the ICF of an oocyte. In the EUF, the HB/B− buffer represents the mobile HEPES buffer used in typical physiological experiments. The catalytic activity of CA is implemented by multiplying the rate constants of the first step of Reaction (2) by the same acceleration factor A. Specifically, the extracellular-surface CA-like activity, which mimics expression of CA IV on the outer surface of the oocyte, is implemented by multiplying the rate constants of the first step of Reaction (2) by the same factor AS (acceleration factor for surface CA-activity) only in the region immediately adjacent to the extracellular surface of the plasma membrane (EM, see Figure 5, inset at the bottom right). The intracellular/cytosolic CA-like activity, which mimics CA II, is implemented by multiplying the rate constants of the first step of Reaction (2) by the same factor Ai (acceleration factor for intracellular CA-activity) everywhere inside the cell.
Assuming spherical radial symmetry, the concentration C of each solute s, Cs, changes in time and space (radial distance r from the center of the cell) according to the reaction–diffusion equation
Note that Ds is the diffusion coefficient of solute s, which can change in space, Ss,l are the stoichiometry coefficients and Φl are the reaction fluxes.
The resulting system of coupled partial differential equations (PDEs), with appropriate boundary and initial conditions, is solved in MATLAB using the numerical implementation proposed in [59].
To simulate the physiological experiments of the two papers by Musa-Aziz et al. [77,78], Occhipinti et al. in their companion paper optimized the theoretical model of Somersalo et al. [59] by introducing new features, including: the vitelline membrane surrounding the oocyte, a surface amplification factor to account for folds and microvilli, a layer of intracellular vesicles beneath the plasma membrane, reduced cytosolic water content, reduced cytosolic diffusion of solutes, and a new protocol for simulating delivery and removal of the bulk extracellular CO2/HCO3− solution [79]. This more refined and realistic model reproduces the essential features of the measured pHi and pHS transients for experiments with control, CA II-injected, and CA IV-expressing oocytes, under various experimental conditions (e.g., different extracellular CO2/HCO3− levels, different extracellular HEPES levels).
Using the solute concentrations predicted by the model as a function of time and space, the authors calculated the transmembrane fluxes of CO2 as well as the diffusive and reaction fluxes of all solutes near the outer and inner side of the membrane. The model confirmed the hypothesis that CA IV and CA II markedly accelerate transmembrane CO2 fluxes by replenishing CO2 on the side of the membrane from which CO2 departs and consuming CO2 on the side to which CO2 goes.
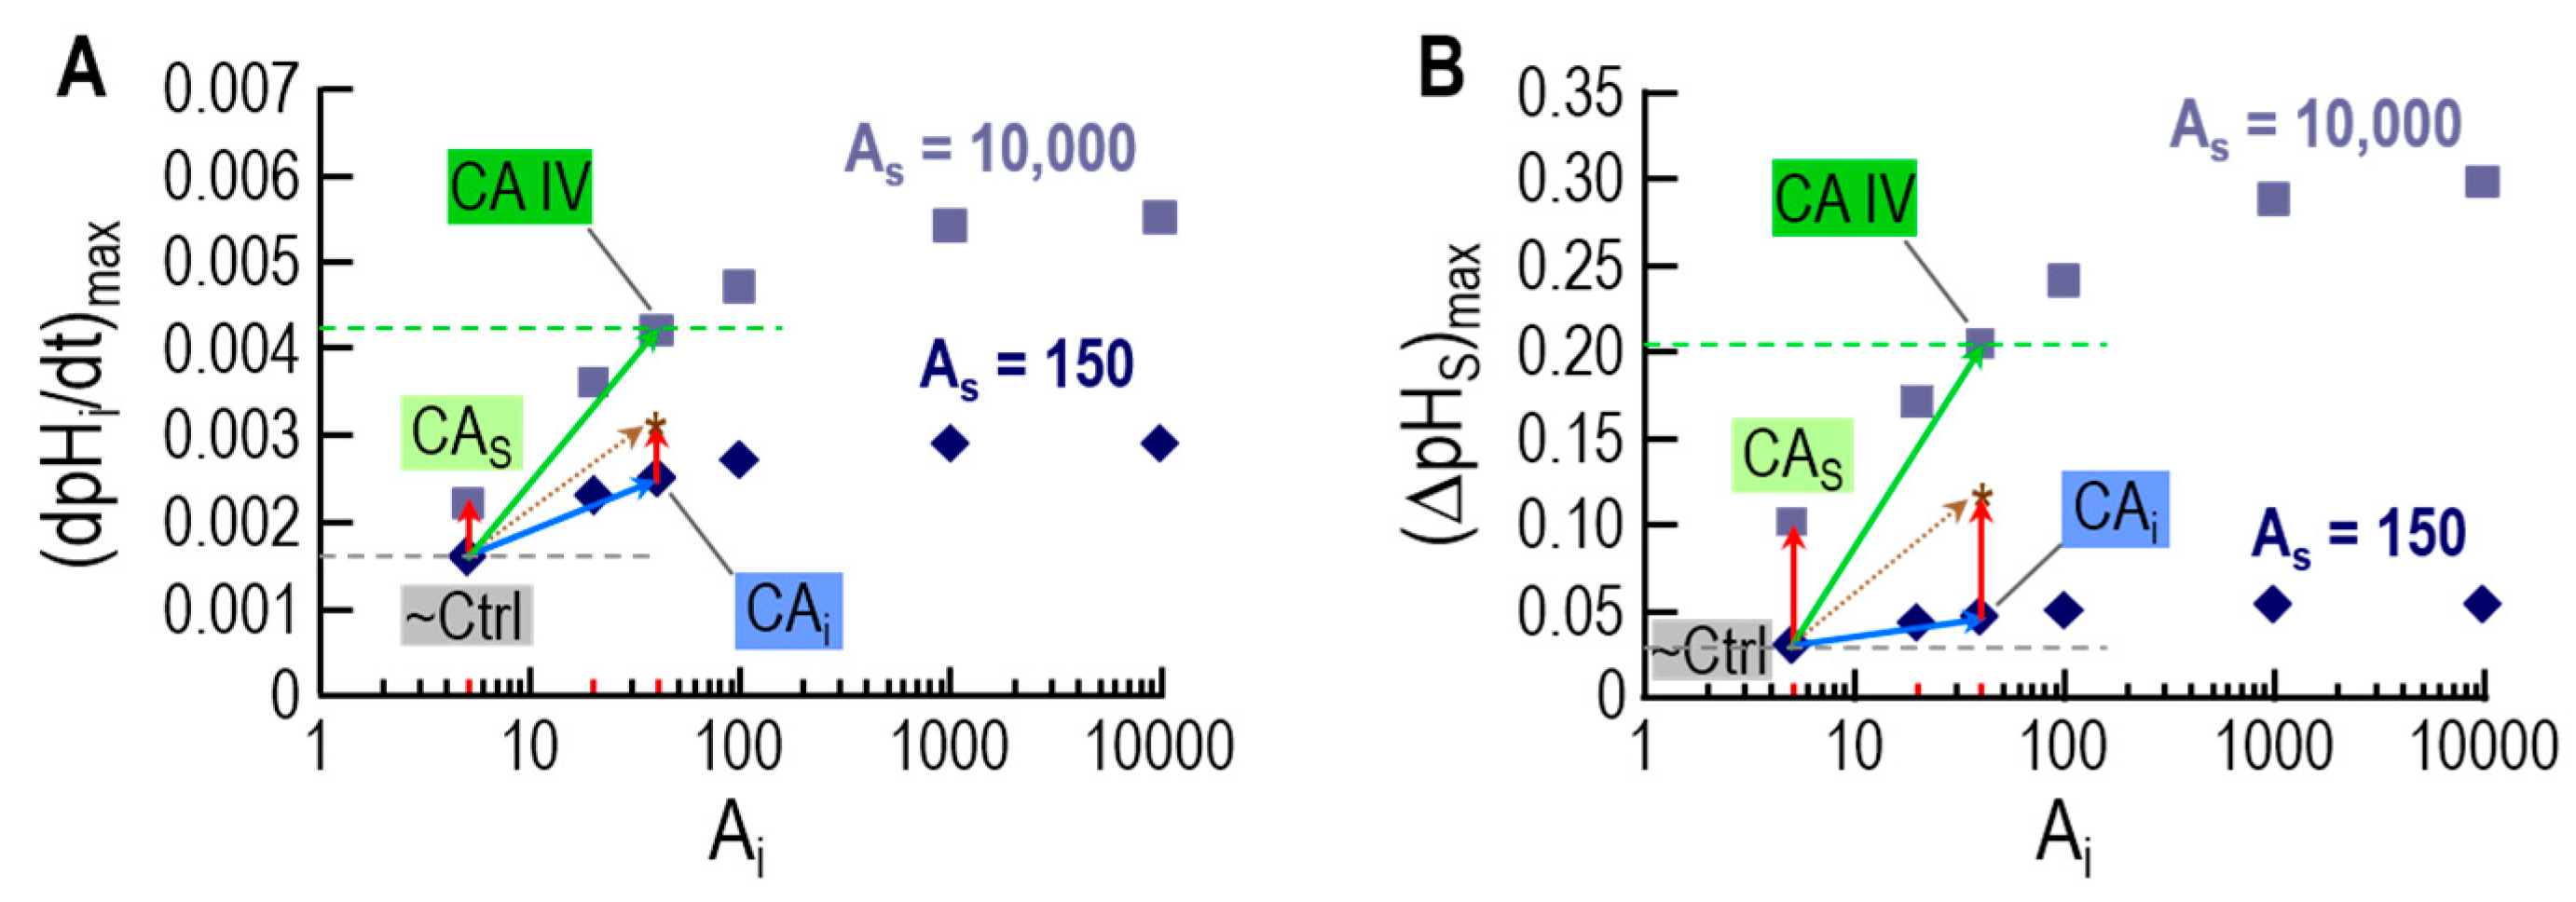
An important insight is that—for experiments with oocytes expressing CA IV—the model can reproduce pHi and pHS transients from physiological experiments only if a small additional amount of CA-like activity is also implemented in the cytosol. This finding was in line with the experiments with inhibitors in oocytes expressing CA IV, and helped in reaching the conclusion that expression of CA IV in oocytes leads to the appearance of a low concentration of CA in a cytosol-accessible compartment. Figure 6 illustrates the results of the simulations that lead to this conclusion.
As shown by the diamonds in Figure 6A,B, increasing intracellular CA activity (x-axis) even to very high levels (i.e,. Ai = 5 at point labeled “~Ctrl” → Ai = 10,000 at extreme right) has relatively little effect on either (dpHi/dt)max or (ΔpHS)max when extracellular-surface CA activity is relatively low (AS = 150). Conversely, a very large increase in extracellular-surface CA activity (i.e., AS = 150 at point labeled “~Ctrl” → AS = 10,000 at point labeled “CAS”) has relatively little effect on either (dpHi/dt)max or (ΔpHS)max when intracellular CA activity is low (Ai = 5). However, the combination of increasing levels of CA activity in both locations produces much larger increases in both (dpHi/dt)max and (ΔpHS)max. For example, the point labeled “CAIV” mimics oocytes expressing CA IV, and supports the conclusion (previous paragraph) that expression of CA IV leads to increases in CA activity not only on extracellular-surface, but also in the cytosol.
The novel prediction from the simulation data in Figure 6 is that the effects of a cytosolic and extracellular-surface CA activity are supra-additive with respect to (dpHi/dt)max and (ΔpHS)max, and thus CO2 diffusion across the membrane.
4. Role of Carbonic Anhydrases in Whole-Body Acid–Base Homeostasis: Transport of HCO3− and CO2
A vital parameter for mammals is the value of arterial blood pH, which the human body maintains within a narrow range around ~7.40 under normal physiological conditions [51]. In line with the Henderson–Hasselbalch equation (Equation (4)), blood pH depends on the ratio of [HCO3−] to [CO2]. Because the kidneys regulate plasma [HCO3−] and the lungs regulate plasma [CO2], the stability of blood pH depends on the dual (and independent) action of the kidneys and the lungs. Because CA catalyzes the interconversion of CO2 into HCO3− through Reaction (2), this enzyme plays a major role in both the kidneys and the lungs. In the kidneys, CA is essential for HCO3− reabsorption and H+ secretion. In the pulmonary and systemic capillaries, CA is essential for CO2 transport across membranes, and thus carriage of CO2 from the systemic tissues to the alveoli for elimination from the body during expiration.
In the next two subsections, we review how CA—by impacting renal and respiratory physiology—plays a central role in whole-body pH homeostasis, how the inhibition of CA impacts acid–base balance, and how mathematical modeling can contribute to our understanding of the underlying processes.
4.1. The Renal System: H+ Secretion and HCO3− Reabsorption
Although CAs are widely distributed throughout the kidneys, CA II and CA IV dominate in human kidneys [41]. Cytosolic CA II accounts for ~95% of total renal CA activity and is expressed virtually everywhere along the nephron, except the thin ascending limb and the preceding turn of Henle’s loop [41]. The membrane-associated CA IV and CA XII account for the remaining 5% of total renal CA activity [41]. CA IV is expressed in the apical and basolateral membranes of both the early and middle portions of the proximal tubule (PT) as well as the entire thick ascending limb [41,85]. More distally, CA IV is expressed only on the apical membranes of the α-intercalated cells of later cortical segments as well as in the principal cells of the inner and outer medullary collecting ducts [41]. CA XII immunoreactivity is distinct in the basolateral membranes of the thick ascending limb, distal convoluted tubule, and principal cells of the initial collecting tubule and later nephron segments [86].
CAs in the kidneys play a major role in the secretion of H+ into the tubule lumen, followed by the movement of HCO3− into the interstitial fluid and blood. These activities achieve the final urinary acid–base composition and help maintain whole-body acid–base homeostasis. The proximal tubule is the major site of HCO3− reabsorption/H+ secretion, followed by the thick ascending limb and the distal nephron. The proximal tubule reabsorbs ~80% of the HCO3− that the glomeruli filter, and that otherwise would be lost in the urine, causing a life-threatening metabolic acidosis [87].
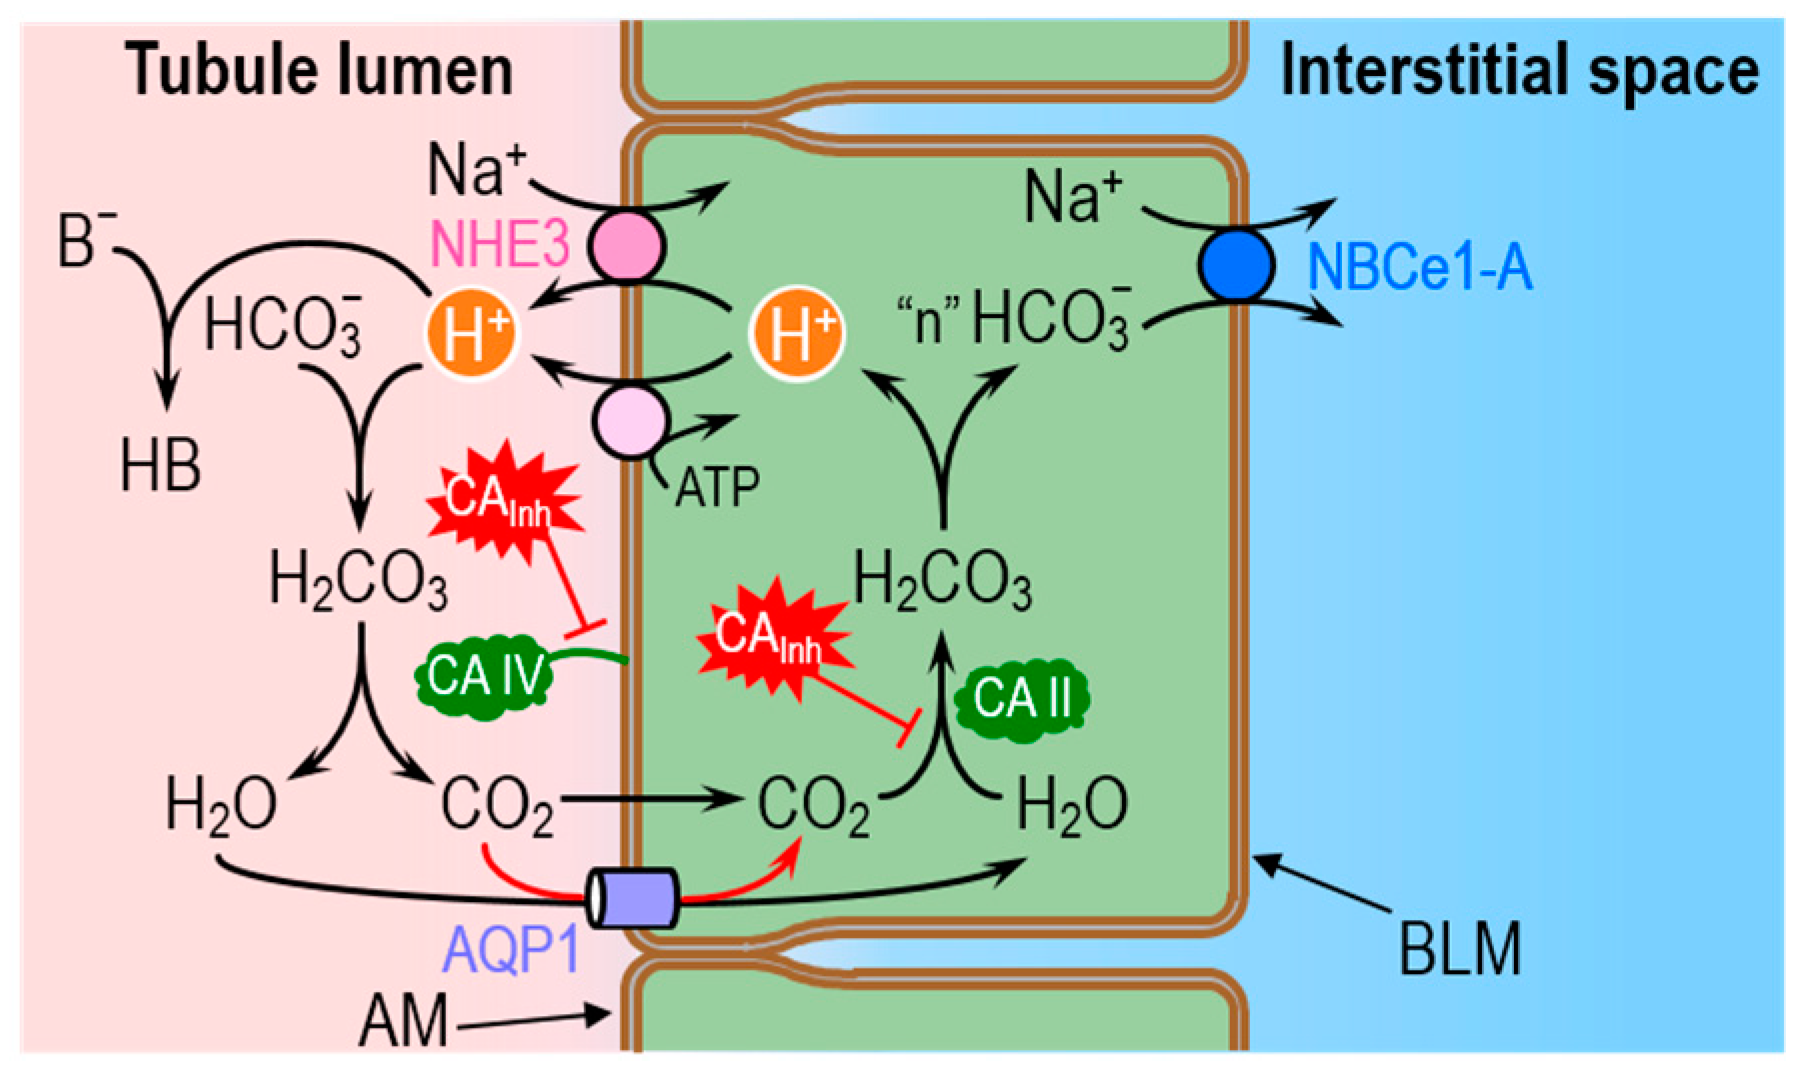
Figure 7 illustrates the basic cellular mechanisms of HCO3− reabsorption in proximal tubule cells, and the legend provides a more detailed summary of the processes. Briefly, as the tubule cells secrete H+ into the lumen—via the Na-H exchanger 3 and vacuolar H+ pumps—a tiny fraction of the H+ titrates non-HCO3− (B−) to form the conjugate weak acids (HB). Most of the secreted H+ titrates the filtered load of HCO3− to form H2CO3, which ultimately dissociates into CO2 and H2O. The majority of the newly formed CO2 and H2O molecules move into the tubule cell via the water channel aquaporin 1 (AQP1) [71,75,88,89]. In the cytosol, CO2 and H2O rapidly recombine to form H2CO3, which then dissociates to regenerate intracellular HCO3− and H+. It is the slow CO2 + H2O ⇌ H2CO3 reaction in this two-step sequence that the GPI-linked CA IV bypasses in the lumen, and that the CA II bypasses in the cytosol. The HCO3− newly formed in the cytosol exits the tubule cell across the basolateral membrane (via the Na/HCO3 cotransporter NBCe1-A) into the interstitial space and ultimately in the blood. The H+ recycles back into the lumen.
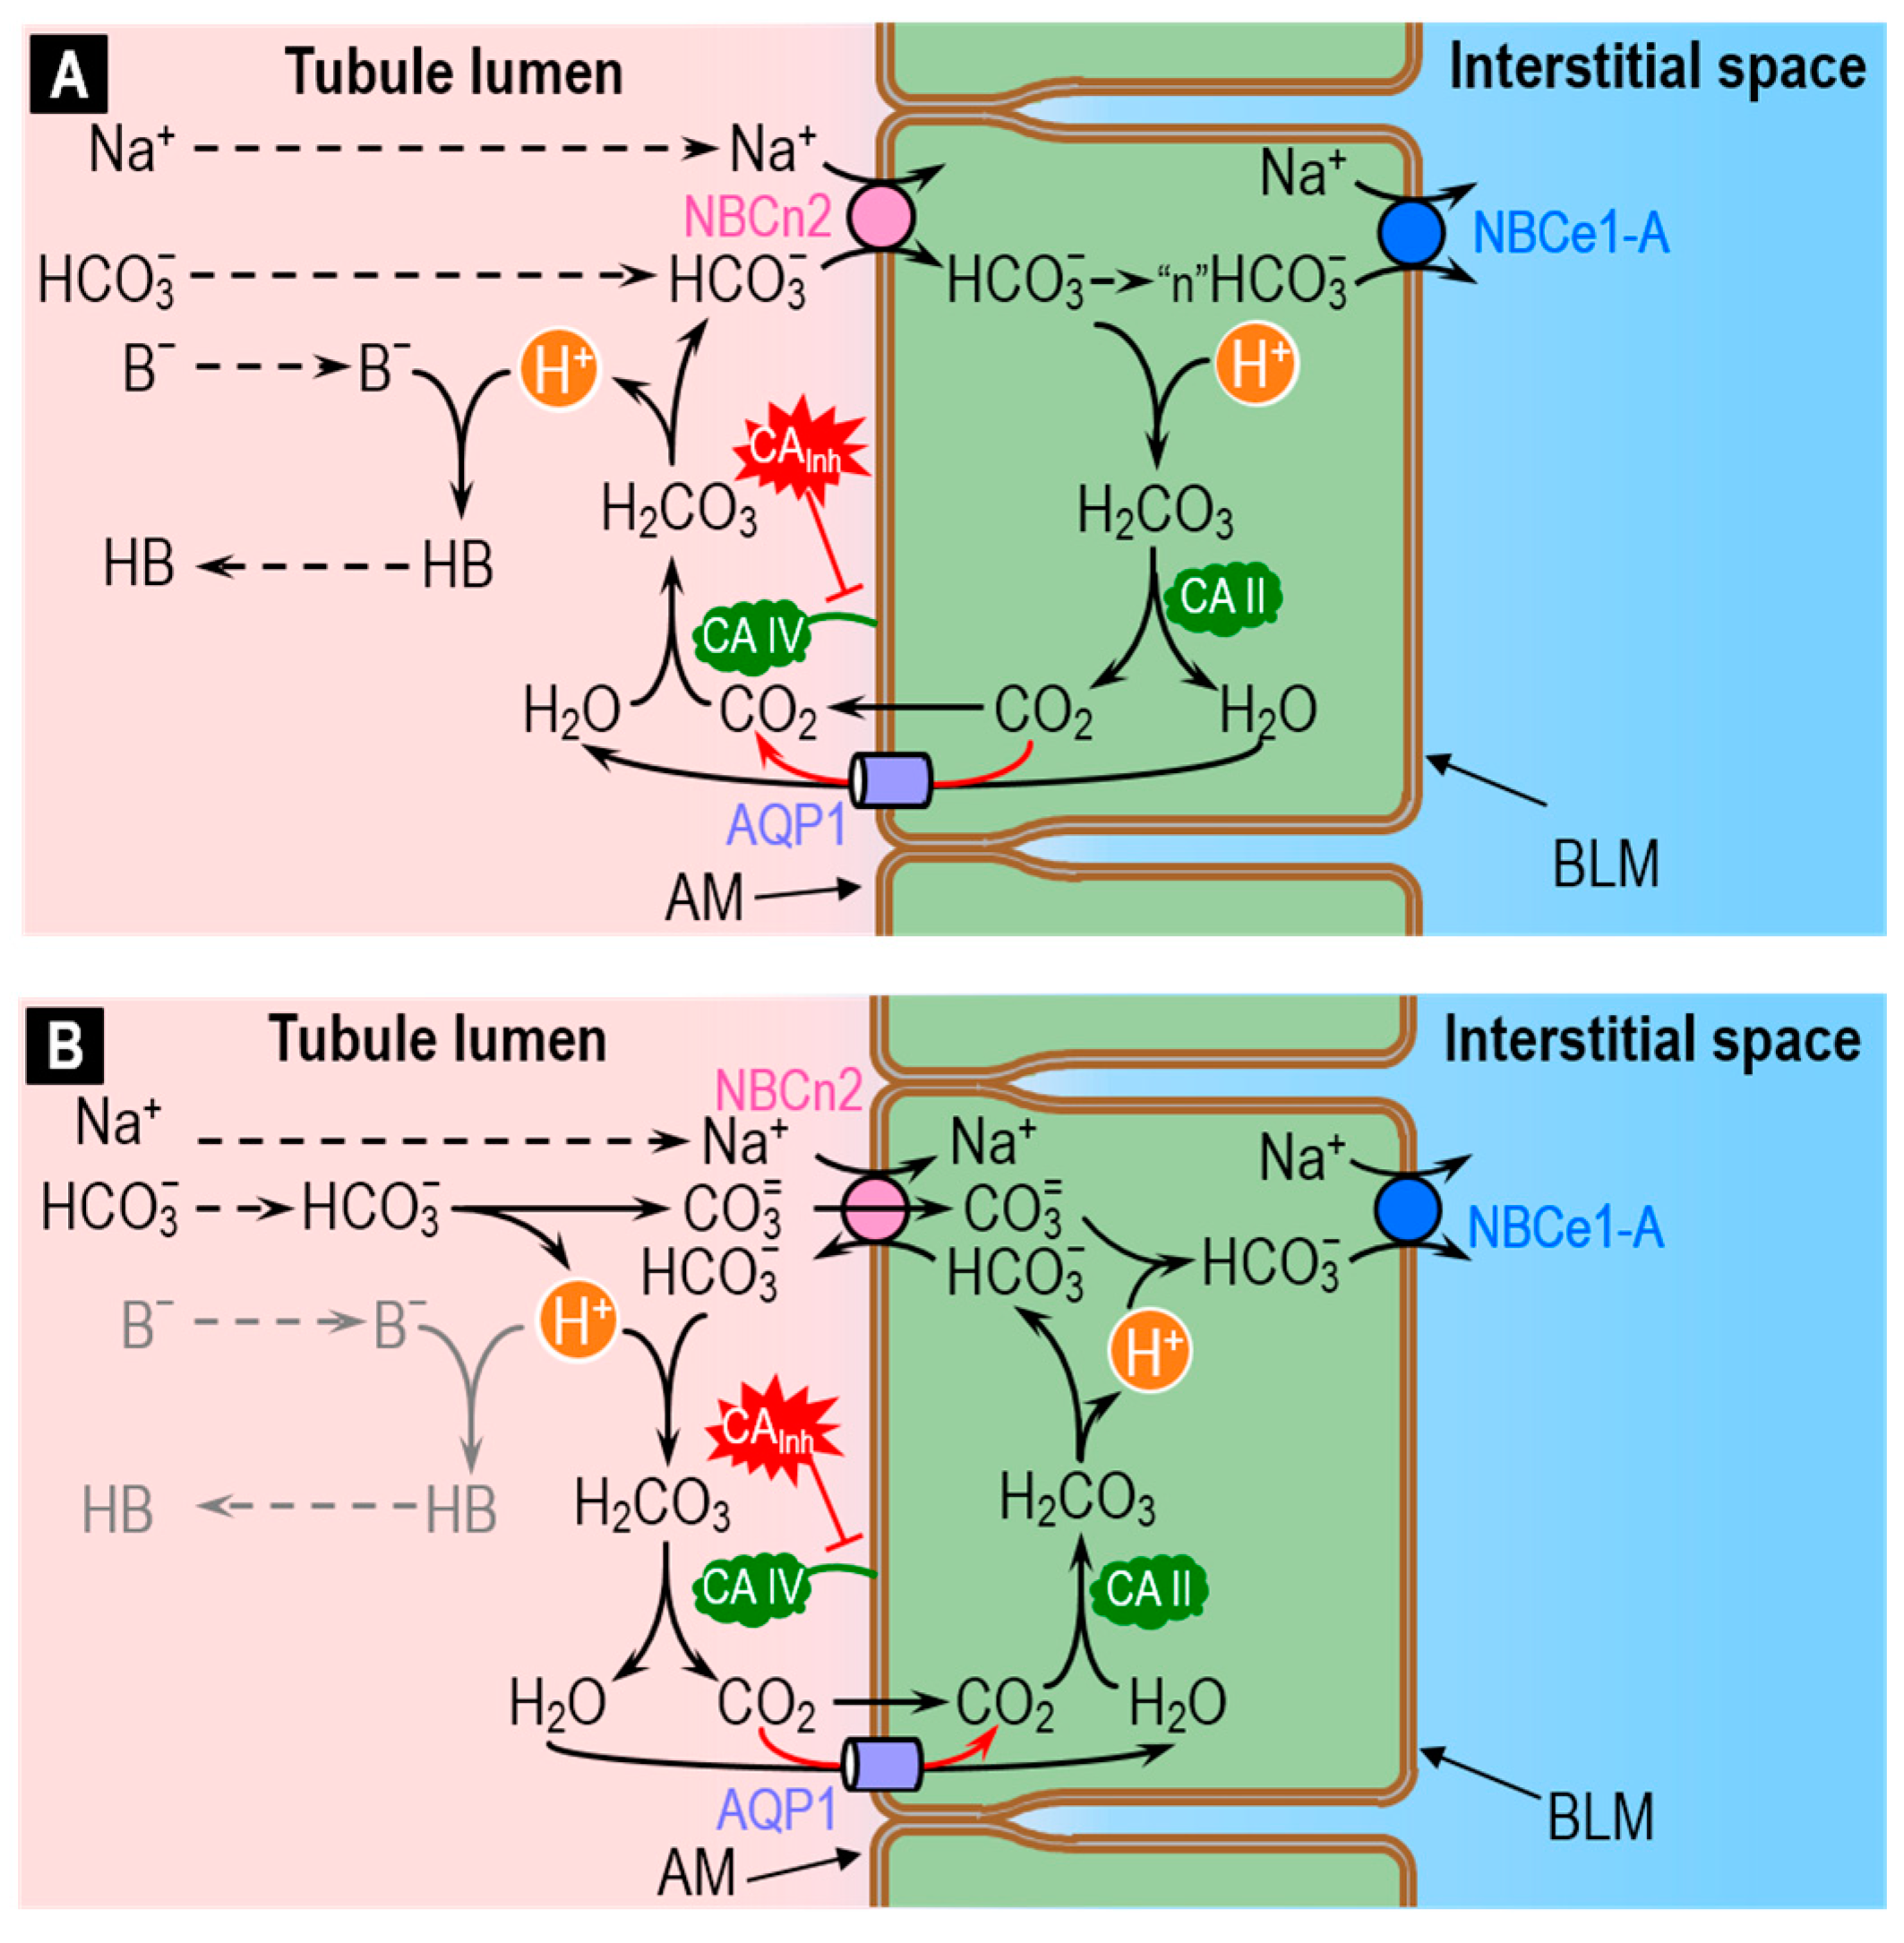
The recent discovery that the electroneutral Na/HCO3 cotransporter NBCn2 is abundantly present in the apical membrane of the PT [90] is consistent with the idea that this transporter may mediate ~20% of total acid–base traffic across the apical membrane—previously unaccounted for. Although the mechanism of NBCn2 may be the simple cotransport of Na+ plus HCO3− (Figure 8A), evidence that NBCn2 may in fact be an exchanger [91] is consistent with the idea that NBCn2 exchanges Na+ plus CO3= for HCO3− (Figure 8B). The legend of Figure 8 provides a more detailed summary of these hypothetical processes.
As illustrated in Figure 8A, the role of apical CA IV in the cotransporter model would be to replenish HCO3− transported into the cell by NBCn2 and, in the process, generate H+ that would, in turn, titrate non-CO2/HCO3− buffers (i.e., H+ + B− → HB) in the tubule lumen. Mathematical modeling predicts that direct HCO3− reclamation via NBCn2 would be slightly more efficient energetically than the titration of luminal HCO3− by secreted H+ [90]. Conversely, mathematical modeling predicts that H+ secretion is slightly more efficient energetically than HCO3− uptake in titrating luminal non-CO2/HCO3− buffers like phosphate and NH3.
As illustrated in Figure 8B, the role of apical CA IV in the exchanger model would be to dispose of: (a) the H+ generated as HCO3− dissociates to form CO3=; and (b) the HCO3− transported outward by NBCn2. In this mechanism, virtually none of the H+ generated in the lumen would be available to titrate B− to HB. In other words, the exchanger mechanism predicts that NBCn2 would have a single net effect: reclaiming NaHCO3.
The important role that CA plays in HCO3− reabsorption/H+ secretion in renal tubules can be appreciated from experiments with inhibitors. Intraluminal pH measurements have shown that, in the proximal tubule, inhibition of luminal CA causes lumen pH to decrease to a value lower than the equilibrium pH predicted by the Henderson–Hasselbalch equation [92]. Indeed, the model in Figure 7 predicts that inhibition of luminal CA IV would slow the consumption of H+ and lead to a fall in luminal pH (pHLumen), as observed. The HCO3−-uptake model of Figure 8A predicts the opposite. The observation that CA inhibition causes an acid shift in pHLumen led to two important conclusions: (1) H+ secretion is the primary mechanism for acidification of the tubule fluid; and (2) a CA with activity accessible to the tubule fluid is present at the apical membrane [93,94,95,96]. The experiments in proximal tubules perfused in vivo with dextran-bound CAInh—which inhibit only luminal CA—demonstrated that the lumen is in contact with luminal or “membrane-bound” CA and that this CA is necessary for ~80% of HCO3− reabsorption [97].
A logical flaw in Conclusion 1 in the previous paragraph is that H+ secretion (Figure 7) is not the only mechanism that predicts an acid shift in pHLumen upon blocking CA IV: The exchanger (i.e., Na+ + CO3= uptake in exchange for HCO3−) model in Figure 8B makes the same prediction.
Whereas the pH disequilibrium experiments with CAInh pointed towards a role of CA IV in HCO3− reabsorption, the discovery of the human CA II-deficiency syndrome emphasized the importance of CA II activity in normal renal physiology [23,98]. CA II-deficient patients exhibit renal tubular acidosis, which implicates CA II as an important component of urinary acidification. The development of a CA II-deficient mouse model—which also exhibits a defect in renal acidification—represented another advancement towards understanding the role of renal CA II [99]. Evidence on the involvement of CA II in HCO3− reabsorption comes from experiments showing a reduced basolateral HCO3− exit [100,101] and a more alkaline intracellular pH [101] in the presence of CA inhibitors.
Another role of renal CA may be facilitation of CO2 diffusion across proximal tubule cells [102]. In their elegant study, Schwartz and Burg measured the flux of CO2 across isolated perfused rabbit proximal convoluted tubules in the presence of a CO2 gradient from bath (i.e., solution facing basolateral membrane) to lumen, or vice versa. To test whether cytosolic and/or membrane-bound CA facilitates the flux of CO2 across proximal tubule cells—a mechanism discussed above, in Figure 1, Figure 3, Figure 4—these authors added ACZ to the bath while maintaining a bath-to-lumen CO2 gradient. They found that ACZ causes the collected luminal fluid to become more alkaline (because less CO2 was arriving in the lumen) and the flux of CO2 from bath to lumen to decrease by 55%. These findings (assuming that ACZ can enter PT cells across the basolateral membrane) support the hypothesis that CA facilitates CO2 diffusion across proximal-tubule cells. Moreover, following the work of Gutknecht et al. [82] discussed above, Schwarz and Burg observed that the flux of CO2 through the UL surrounding the tubule is enhanced when CA is in the bath.
Krahn and Weinstein used mathematical modeling of a rat proximal tubule brush border to investigate the role of CA and of its inhibition on the UL near the brush border [103]. Their modeling approach assumed that the brush border consists of uniform cylinders (representing the villi), equally distributed on a flat surface. By further assuming that the length of the villi is much larger than their width, they ignored the concentration gradients in the radial direction and reduced the problem to one-dimensional in space, with the spatial dimension representing the direction along the long axis of the microvillus. The model includes two compartments: the intra-villous and the intervillous spaces, which are separated by a plasma membrane that contains transporters that move solutes between compartments. The model accounts for the evolution in space (but does not consider time dependence) of concentration profiles of ten solutes (including the components of the CO2/HCO3− buffer)—both inside and surrounding the microvilli—along the long axis. By reducing the values of the rate constants for the first step of Reaction (2), these authors simulated the inhibition or absence of CA and showed that, in the presence of buffers, CA facilitates the flux of CO2 through the UL near the brush border [103].
Finally, we observe that our recent finding of the supra-additive effect of extracellular and intracellular CA on the transmembrane flux of CO2 (see Figure 6) is in line with CA-dependent facilitated CO2 diffusion across plasma membrane and, more importantly, it may point towards a synergistic role of CA IV and CA II in enhancing the flux of CO2 across the apical membrane of the proximal tubule (see Figure 7).
Mathematical modeling has already provided some important insight into some events in Figure 7 and Figure 8A. Distinguishing between the alternate NBCn2 mechanisms—cotransport (Figure 8A) vs. exchange (Figure 8B)—will require more sophisticated modeling approaches, as well understanding the totality of acid–base transport events taking place in the proximal tubule, other nephron segments, and other epithelia engaged in acid–base transport.
4.2. The Respiratory System: CO2 Removal from the Human Body
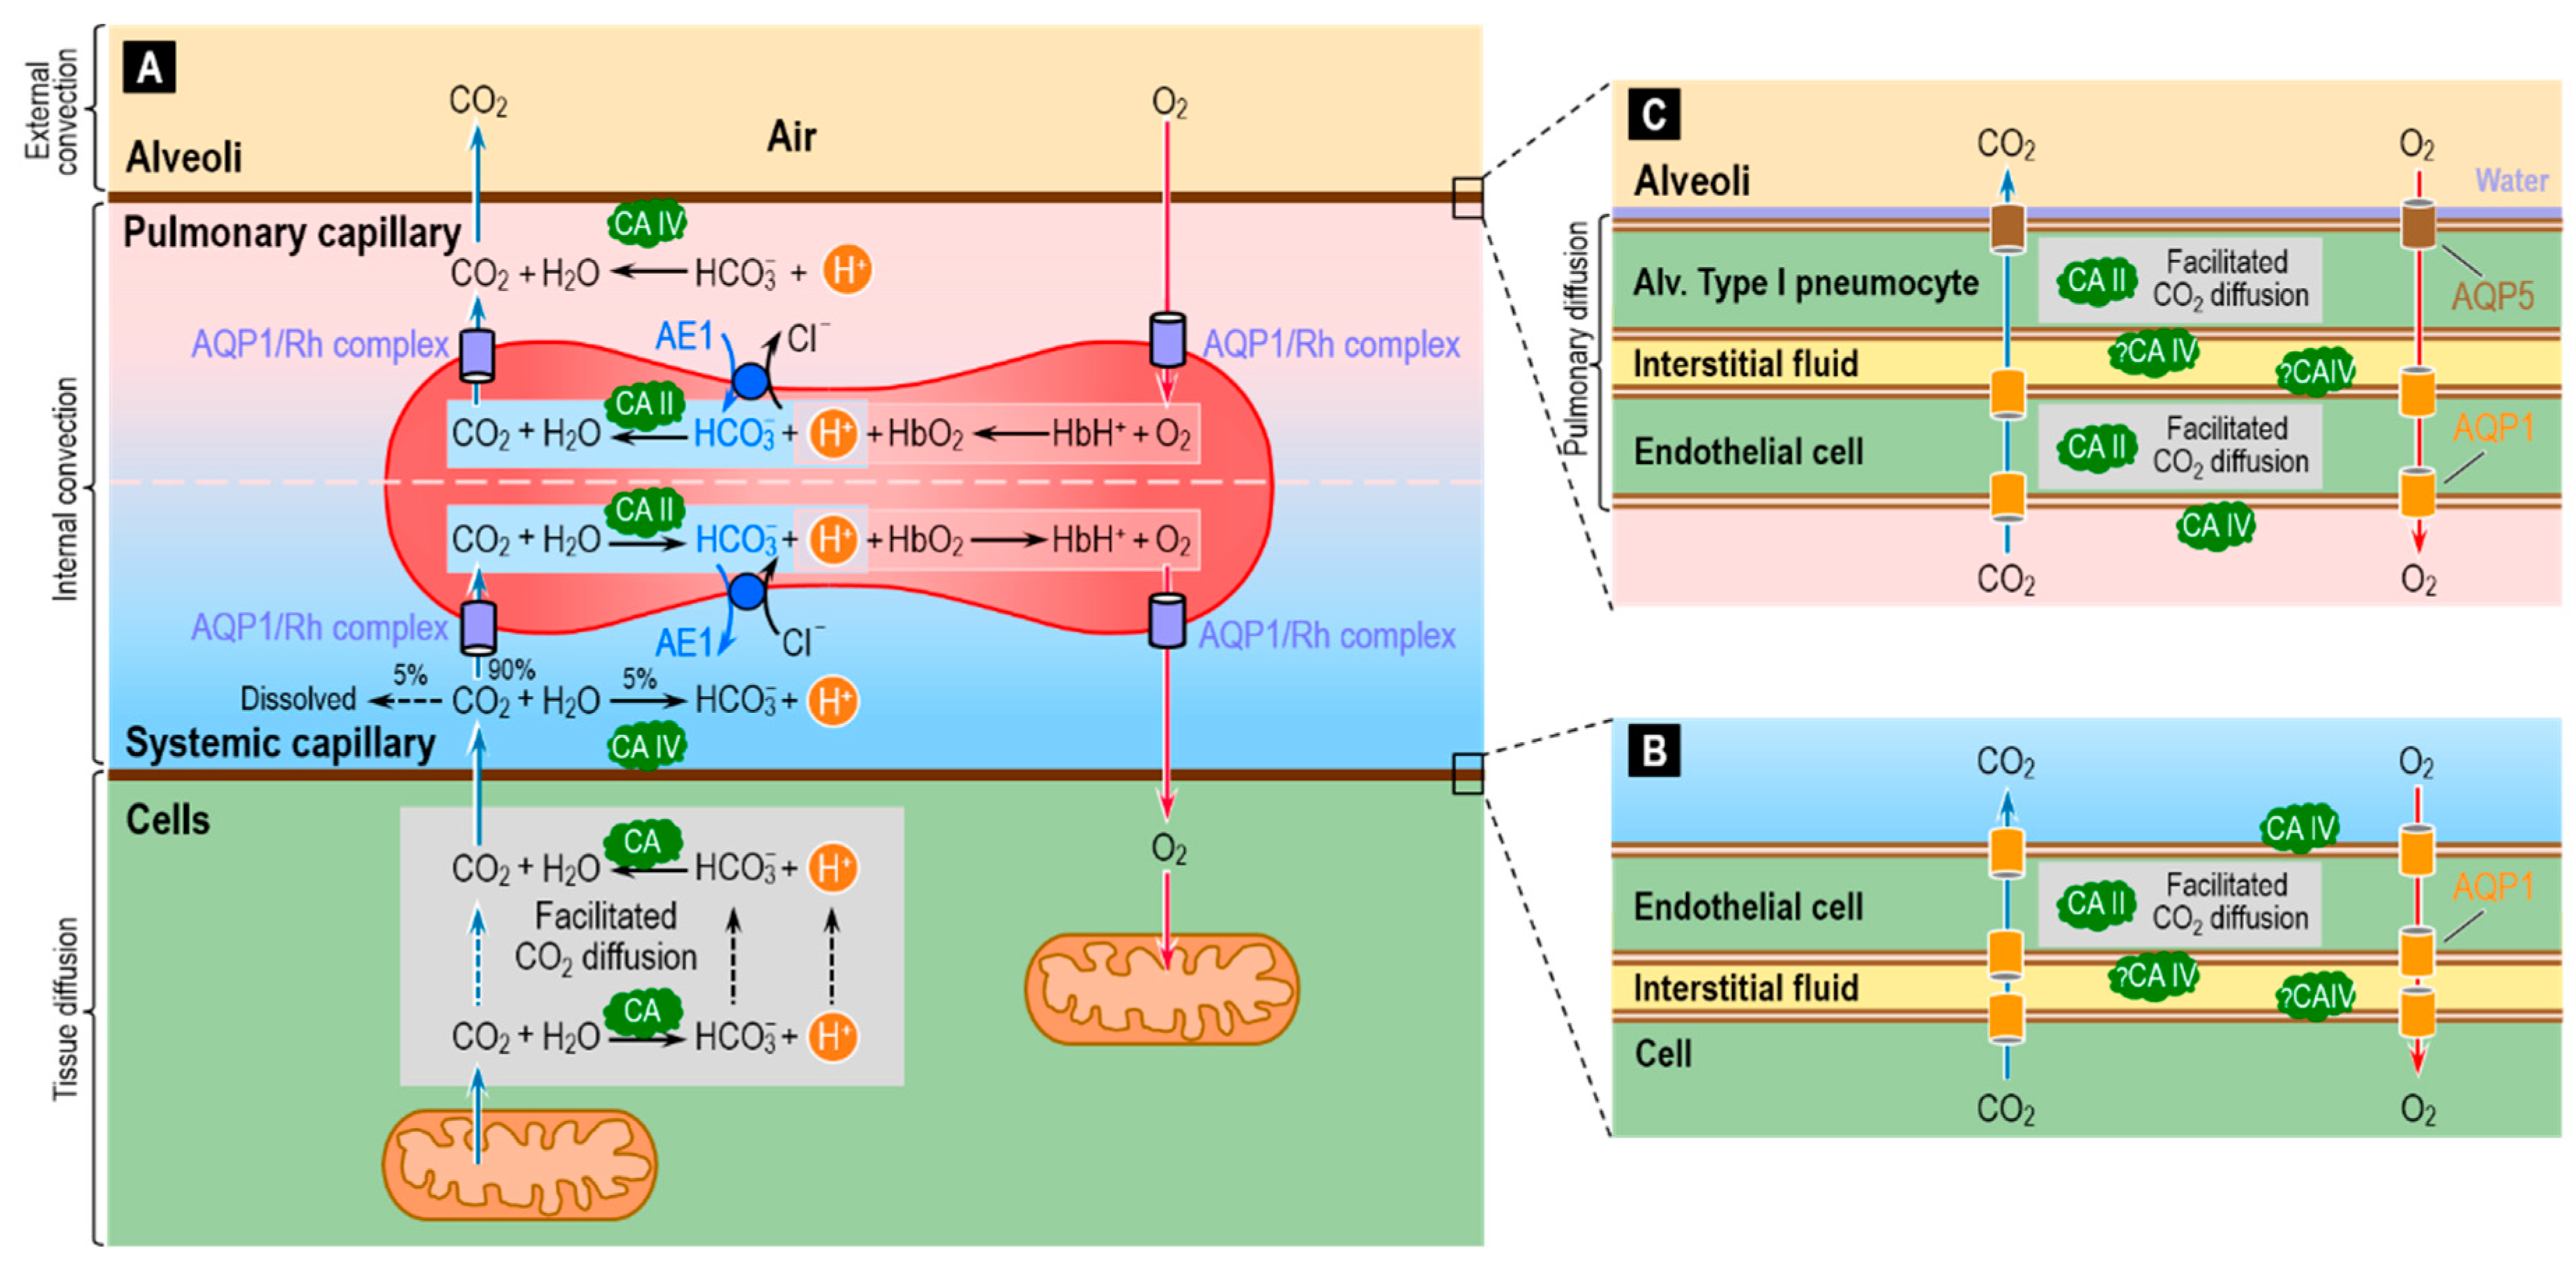
One of the major housekeeping tasks of the human body is the transfer of CO2—a waste product of aerobic metabolism—from mitochondria to systemic capillaries, to RBCs that flow to pulmonary capillaries, and then from these RBCs to the alveolar air space, and finally the excretion of this CO2 from the body by exhalation. As illustrated in Figure 9A, this process—which along with O2 transport is part of external respiration—involves a combination of reactions, diffusion (including facilitated diffusion of CO2), transport mediated by membrane proteins, and convection. Diffusion operates over short-distances (i.e., in the neighborhood of the systemic and pulmonary capillaries), and convection dominates over long-distances (i.e., blood flow between systemic and pulmonary capillaries, and air flow between alveoli and environment). The efficient removal of CO2 from the body is essential to prevent the build-up of CO2 in the intracellular and extracellular compartments, and thereby prevent their acidification.
The widespread presence of CA throughout the respiratory system helps to make the process of CO2 removal remarkably efficient. The cytosolic protein CA II is the most abundant form, and RBCs contain high levels of high-activity CA II [37,110]. In addition to CA II, RBCs have even higher levels of the lower-activity CA I. The overall CA activity of RBCs is the highest known of all cell types. It has been estimated that, in RBCs, CAs accelerate the overall reaction CO2 + H2O HCO3− + H+ by a factor of up to 20,000–25,000 fold [40,72,111,112]. These estimates were recently confirmed by mass spectrometric measurements of the time course of the decay of C18O16O in human RBCs suspensions—a technique used in combination with a compartmental mathematical model of the reaction and transport processes associated with 18O exchange [72,112,113].
Investigators generally agree that blood plasma normally lacks CA activity aside from that attributable to lysed RBCs. However, tissues with high fluxes of CO2 into or out of the blood have a component of CA activity that is accessible to the fluid within the capillary lumen. Two cases in point are at least certain systemic capillaries (Figure 9B) and virtually all pulmonary capillaries (Figure 9C). In both cases, the endothelial cells have membrane-bound CA IV at the extracellular luminal surface—particularly well studied in the lung [114,115,116,117,118].
In blood-perfused lungs, RBCs account for ~99% of total CA activity. Of the remaining ~1% (i.e., the CA activity of lung tissue per se), CA II accounts for ~70–90% and CA IV for the rest [110,119,120,121]. Because of the extremely small sizes of the lung cells, it has been challenging to ascertain the cellular and sub-cellular localizations of lung CAs among the various components of the gas-exchange surfaces. Note that the total distance between the pulmonary capillary blood plasma and the alveolar air—the thicknesses of the endothelial cell + the interstitial space + the thin alveolar type I pneumocyte that lines ~90% of the alveolar air sac—is typically ~1 μm [122,123,124]. The consensus already had been that CA II is present in the thicker alveolar type II pneumocytes [110,125], which secrete surfactant, and possibly also in certain endothelial cells [121]. More recently, investigators have detected CA II in alveolar type I pneumocytes [126].
The CA II in systemic capillary endothelial cells (Figure 9B), as well as in alveolar type I pneumocytes and pulmonary capillary endothelial cells (Figure 9C), could in principle facilitate CO2 diffusion through the thin layers of cytosol. In addition, aquaporins 1 and 5—known to conduct CO2 [71,73,74,75]—could provide a low-resistance pathway for CO2 diffusion across the cell membranes.
In additional to its presence on the side of the pulmonary endothelium facing the plasma, CA IV may be accessible to the parenchymal interstitial space [110,114,117], that is, between the pulmonary endothelial cell and the alveolar type I pneumocyte (Figure 9C). Although CA IV may be expressed on the basolateral (i.e., capillary) side of the alveolar epithelium (i.e., the alveolar type I and II pneumocytes), it has not been detected on the apical side (i.e., facing air) [127,128]. One might have thought that CA activity in the alveolar water film would: (a) accelerate CO2 efflux from the alveolar type I pneumocyte into the water film and alveolar air; or (b) facilitate CO2 diffusion through the water film. Mathematical modeling could provide insight into the requisite lack of evolutionary pressures. Perhaps the presence of AQP5 (CO2 as well as H2O channels) obviate the need for CA in the water film. Perhaps the water film is so thin that facilitated diffusion is not a substantive issue.
The development of the CA II-deficient mouse model represented an important tool for revealing the location at the cellular level of membrane-associated CA [99,129]. Histochemical examination of lung tissue from the CA II-deficient mouse reveals strong staining that must be due to CA IV in the alveolar epithelium (presumably at the basolateral membrane because CA activity is absent from the apical side [see above]) and possibly some staining in the capillary endothelium (presumably at least at the luminal membrane, where CA activity is detected [see above]). However, because these two epithelia are so thin and so closely opposed, the histochemical analysis could not establish the precise locations of CA IV between the alveolar epithelium and pulmonary capillary endothelium [129].
Understanding the physiological role of CAs in the lungs has been very challenging mainly because of the still-remaining uncertainties on the cellular and subcellular distributions of CA II and CA IV. While it is established that CA II in RBCs is essential for CO2 carriage from peripheral tissues to the lungs and for O2 carriage via the Bohr effect [42], the roles of CAs in and around the pulmonary capillary endothelium and alveolar type I pneumocytes is unresolved. Mathematical simulations of total or partial CA inhibition in the various components of the gas-exchange surfaces, as well as experiments employing selective inhibitors, have shed light on the function of pulmonary CAs. However, results from in vitro (e.g., using perfused lungs) and in vivo experiments appear to be contradictory. For an in-depth summary of these studies, we refer to Refs. [92,110,121,130]. Here, we briefly review some of the key findings, with special attention to the contribution of mathematical modeling.
As mentioned above, it is well established that membrane-bound CA activity is accessible to the pulmonary capillary lumen. Supporting evidence comes from in vitro and in silico pH disequilibrium studies—in the absence of CA activity accessible to plasma—focused on investigating disturbances of the CO2/HCO3− equilibrium in blood plasma following addition of CO2 to the blood at the systemic capillary beds, or removal of CO2 from the blood at the gas-exchange surface. In the 1970s, investigators developed various models to simulate CO2 exchange from tissue to blood [131] and from blood to lungs [132,133]. These models treat the blood as a two-compartment system (RBC and plasma), where the relevant chemical reactions (e.g., slow CO2 hydration/dehydration) occur. Diffusion within each compartment is instantaneous. The Fick equation [134] describes fluxes of CO2 and O2 across the RBC membrane and across the endothelium (between blood plasma and either systemic tissue or alveolar air). In Refs. [131,133], the Goldman–Hodgkin–Katz (GHK) equation (i.e., electrodiffusion) [135] describes the movements of HCO3− and Cl− (i.e., Cl-HCO3 exchange) across the RBC membrane. In Ref. [132], the Fick equation describes the movements of HCO3− across the RBC membrane, with the flux of Cl− assumed to be equal but opposite to that of HCO3−. (Of course, neither the GHK nor the Fick equation can truly mimic the saturation kinetics of the Cl-HCO3 exchanger.) These models predicted that, as CO2 exchanges with a red cell suspension [131] or with the pulmonary capillary plasma [131,132,133], lack of CA in the extracellular fluid/plasma, causes a pH disequilibrium in that compartment.
In vitro experiments with isolated perfused lungs devoid of blood—a condition important to eliminate the dominant effect of CA in RBCs—and with CA inhibitors of different tissue permeabilities confirmed the above theoretical predictions [136,137,138]. Mathematical simulations predict that one role of the membrane-bound CA at the surface of the pulmonary vascular endothelium is to produce chemical equilibrium within the normal pulmonary-capillary transit time and therefore avoid post-capillary (i.e., in the pulmonary veins and systemic arteries) pH disequilibrium (pH in plasma < pH at equilibrium). In such a disequilibrium state, the continuous slow conversion of HCO3− to CO2 (see Figure 9A, reaction above the RBC) in the post-capillary plasma leaving the lung would result in a non-physiological situation in which arterial [CO2] is higher than alveolar [CO2] [110].
Another role of membrane-bound CA IV on the pulmonary capillary endothelium might be to increase the flux of CO2 from the blood plasma to the alveolar space [42]. As illustrated by the reaction above the RBC in Figure 9A, CA IV would favor the conversion of plasma HCO3− (created in the systemic capillaries from metabolically generated CO2) back to CO2, thereby maintaining a relatively high plasma [CO2] at the gas-exchange interface. Similarly, the CA IV located on the luminal side of the endothelium of systemic capillary (Figure 9A, reactions below the RBC) may facilitate diffusion of CO2 from tissue to capillary plasma by keeping plasma [CO2] low through rapid conversion of CO2 to HCO3− [42].
From the above discussion, it should be clear that several authors, as well as others [139,140], believe that pulmonary-capillary CA IV and lung CA in general play a significant role in promoting CO2 elimination. However, other authors—citing the very short diffusion distances among the various components of the gas-exchange surfaces between the pulmonary capillary and the alveoli layers—make qualitative arguments against this possibility [121]. One could begin to address this controversy by developing spatially distributed mathematical models that account not only for chemical reactions, but also for diffusion and membrane-protein–mediated transport throughout the system in Figure 9. Future models could also incorporate better kinetic descriptions of the Cl-HCO3 exchanger AE1, channels for the conduction of CO2 and O2, and deformation of the RBCs as they transit along the pulmonary capillaries.
In parallel with our discussion of renal acid–base physiology, mathematical modeling has already provided some important insight into some events in Figure 9A. However, we are still far away from a comprehensive picture of the events taking place inside—and through the membrane of—the RBC, let alone in understanding the events in the microenvironments depicted in Figure 9B,C. Understanding these complex processes will require not only comprehensive wet-lab data, but also sophisticated modeling approaches.
5. Conclusions
Since the time of Roughton, we have appreciated that the rapid CA-catalyzed interconversion of CO2 and HCO3− makes it possible for RBCs to transfer CO2 from the systemic tissues to the alveoli (Figure 9). Besides this role in whole-body respiration, CAs are important for a seemingly endless list of processes throughout the body. However, as important as these processes are, merely listing them tends to obfuscate the fundamental principles by which the enzymatic activity of CAs contributes to physiology—contributions that modeling can help to elucidate. Here, we identify three such principles.
First, although we only allude to it in this review, CAs enable the CO2/HCO3− system to buffer protons on a rapid time scale. For example, a sudden flux of H+ into a cell (e.g., H+/lactate uptake mediated by the monocarboxylate transporter MCT1) could cause a precipitous—and potentially dangerous—fall in local pHi if buffered only by non-CO2/HCO3− buffers and the uncatalyzed CO2/HCO3− reactions. The presence of CA II in the cytosol allows the CO2/HCO3− system to participate in buffering on a rapid time scale, and thereby minimize pH changes. Related to this issue is the situation depicted in Figure 7, where the challenge of the proximal tubule is to reclaim luminal HCO3− even though the PT cell (at least in theory) only has the machinery to: (a) secrete H+ into the lumen; and (b) transfer CO2 across the apical membrane. Complicating the challenge is that the rapidly flowing luminal fluid (which contains the filtered HCO3−) is in contact with PT cells for < 1 s. CA IV facilitates HCO3− reclamation by rapidly titrating the HCO3− to CO2—in other words, buffering the secreted H+.
Second, CAs can facilitate the transfer of protons between the CO2/HCO3− buffer system and another buffer system. In the example of Figure 8A, the cell takes up HCO3− directly and yet must also titrate B− to HB. Here, the CA IV facilitates the transfer of H+ from the CO2/HCO3− system to another (i.e., B−/HB) system.
Third, as outlined in Figure 1, Figure 2, Figure 3, Figure 4 and Figure 5, CAs can maximize gradients—in the bulk solution or across membranes—and thereby facilitate the diffusion of CO2, HCO3−, H+, deprotonated buffers (B−), and protonated buffers (HB). In such reaction–diffusion systems, the reactions are variations of the interconversions illustrated in Figure 7; Figure 8.
The three fundamental principles just discussed—which underlie the overwhelming majority of CA physiology throughout the different compartments of the body—can be extremely complex, especially when one must consider reactions involving not only HCO3− but CO3=, or when the system contains multiple non-CO2/HCO3− buffers. In such complex systems, mathematical modeling can be invaluable for assessing the relative importance of different components or pathways (e.g., H+ secretion vs. HCO3−/CO3= uptake in Figure 7 and Figure 8). The models also help investigators formulate hypotheses, and make predictions that the investigators can test in wet-lab experiments. For example, what would be the predicted effect (based on mathematical simulations) of blocking or knocking out a particular CA or acid–base transporter?
A variation on the complexity issue in the previous paragraph is another important problem in biology: dealing with missing data. In the model of Figure 9, we are still uncertain about whether particular CAs are present and, if so, where? Again, simulations based on specific hypotheses can make predictions that are testable in the wet lab (e.g., based on inhibitors, knockouts). For example, one could use modeling to explore how, in principle, different spatial expression patterns for CAs and AQPs could optimize gas exchange (e.g., enhancing CO2 removal) in health, or compromise it in disease.
Another variation on the missing-data theme is to use simulations to infer data that one cannot easily measure. Consider, for example, an investigator who monitors pHi while exposing a cell to CO2/HCO3−. Even a relatively simple compartmental model could provide valuable insight into how [CO2] and [HCO3−]—two parameters not directly measured—change with time in the cytosol [141]. With sophisticated spatially distributed mathematical models, one could get insight into how pH, [CO2], and [HCO3−] change with time at different depths beneath the cell membrane, and how the spatiotemporal profile may change with the introduction of CA IV at the outer surface of the membrane and/or CA II in the bulk intracellular fluid. Even more sophisticated mathematical models—together with appropriate computational methods—could begin to account for more complex, but still not entirely realistic, geometries like those in Figure 9.
In summary, mathematical models involving CA and CO2/HCO3− can be an invaluable complement to wet-lab experiments by providing unprecedented insight into physiological mechanisms as well as guidance in both data interpretation and the design of future experiments.
Funding
The work of R.O. was supported by NIH grant K01-DK107787. The work of W.F.B. was supported by Office of Naval Research (ONR) grant N00014-15-1-2060; a Multidisciplinary University Research Initiative (MURI) grant N00014-16-1-2535 from the DoD; and NIH grants U01GM111251 and DK113197. W.F.B. gratefully acknowledges the support of the Myers/Scarpa endowed chair.
Conflicts of Interest
The authors declare no conflict of interest.
References
- Meldrum, N.U.; Roughton, F.J. Carbonic anhydrase. Its preparation and properties. J. Physiol. 1933, 80, 113–142. [Google Scholar] [CrossRef] [PubMed]
- Del Prete, S.; Vullo, D.; Fisher, G.M.; Andrews, K.T.; Poulsen, S.-A.; Capasso, C.; Supuran, C.T. Discovery of a new family of carbonic anhydrases in the malaria pathogen Plasmodium falciparum—The η-carbonic anhydrases. Bioorg. Med. Chem. Lett. 2014, 24, 4389–4396. [Google Scholar] [CrossRef] [PubMed]
- Kikutani, S.; Nakajima, K.; Nagasato, C.; Tsuji, Y.; Miyatake, A.; Matsuda, Y. Thylakoid luminal θ-carbonic anhydrase critical for growth and photosynthesis in the marine diatom Phaeodactylum tricornutum. Proc. Natl. Acad. Sci. USA 2016, 113, 9828–9833. [Google Scholar] [CrossRef] [PubMed]
- Frost, S.C.; McKenna, R. Carbonic Anhydrase: Mechanism, Regulation, Links to Disease, and Industrial Applications; Subcellular Biochemistry; Springer: Dordrecht, The Netherlands; Heidelberg, Germany; New York, NY, USA; London, UK, 2014; ISBN 978-94-007-7358-5. [Google Scholar]
- Lomelino, C.L.; Andring, J.T.; McKenna, R. Crystallography and Its Impact on Carbonic Anhydrase Research. Int. J. Med. Chem. 2018, 2018. [Google Scholar] [CrossRef] [PubMed]
- Silverman, D.N.; Lindskog, S. The catalytic mechanism of carbonic anhydrase: Implications of a rate-limiting protolysis of water. Acc. Chem. Res. 1988, 21, 30–36. [Google Scholar] [CrossRef]
- Imtaiyaz Hassan, M.; Shajee, B.; Waheed, A.; Ahmad, F.; Sly, W.S. Structure, function and applications of carbonic anhydrase isozymes. Bioorg. Med. Chem. 2013, 21, 1570–1582. [Google Scholar] [CrossRef]
- Supuran, C.T. Carbonic anhydrases—An overview. Curr. Pharm. Des. 2008, 14, 603–614. [Google Scholar] [CrossRef]
- Esbaugh, A.J.; Tufts, B.L. The structure and function of carbonic anhydrase isozymes in the respiratory system of vertebrates. Respir. Physiol. Neurobiol. 2006, 154, 185–198. [Google Scholar] [CrossRef]
- Tashian, R.E.; Hewett-Emmett, D.; Carter, N.; Bergenhem, N.C. Carbonic anhydrase (CA)-related proteins (CA-RPs), and transmembrane proteins with CA or CA-RP domains. In The Carbonic Anhydrases; Springer: Berlin/Heidelberg, Germany, 2000; pp. 105–120. [Google Scholar]
- Aspatwar, A.; Tolvanen, M.E.; Parkkila, S. Phylogeny and expression of carbonic anhydrase-related proteins. BMC Mol. Biol. 2010, 11, 25. [Google Scholar] [CrossRef]
- Aspatwar, A.; Tolvanen, M.E.E.; Ortutay, C.; Parkkila, S. Carbonic anhydrase related proteins: Molecular biology and evolution. Subcell. Biochem. 2014, 75, 135–156. [Google Scholar]
- Aspatwar, A.; Tolvanen, M.E.E.; Parkkila, S. An update on carbonic anhydrase-related proteins VIII, X and XI. J. Enzyme Inhib. Med. Chem. 2013, 28, 1129–1142. [Google Scholar] [CrossRef] [PubMed]
- Sjöblom, B.; Elleby, B.; Wallgren, K.; Jonsson, B.H.; Lindskog, S. Two point mutations convert a catalytically inactive carbonic anhydrase-related protein (CARP) to an active enzyme. FEBS Lett. 1996, 398, 322–325. [Google Scholar] [CrossRef] [Green Version]
- Picaud, S.S.; Muniz, J.R.C.; Kramm, A.; Pilka, E.S.; Kochan, G.; Oppermann, U.; Yue, W.W. Crystal structure of human carbonic anhydrase-related protein VIII reveals the basis for catalytic silencing. Proteins 2009, 76, 507–511. [Google Scholar] [CrossRef] [PubMed] [Green Version]
- Nishimori, I.; Vullo, D.; Minakuchi, T.; Scozzafava, A.; Capasso, C.; Supuran, C.T. Restoring catalytic activity to the human carbonic anhydrase (CA) related proteins VIII, X and XI affords isoforms with high catalytic efficiency and susceptibility to anion inhibition. Bioorg. Med. Chem. Lett. 2013, 23, 256–260. [Google Scholar] [CrossRef] [PubMed]
- Zhou, Y.; Skelton, L.A.; Xu, L.; Chandler, M.P.; Berthiaume, J.M.; Boron, W.F. Role of receptor protein tyrosine phosphatase γ in sensing extracellular CO2 and HCO3−. J. Am. Soc. Nephrol. 2016, 27, 2616–2621. [Google Scholar] [CrossRef] [PubMed]
- Patrikainen, M.; Pan, P.; Kulesskaya, N.; Voikar, V.; Parkkila, S. The role of carbonic anhydrase VI in bitter taste perception: Evidence from the Car6−/− mouse model. J. Biomed. Sci. 2014, 21, 82. [Google Scholar] [CrossRef] [PubMed]
- Dodgson, S.J. Liver Mitochondrial Carbonic Anhydrase (CA V), Gluconeogenesis, and Ureagenesis in the Hepatocyte. In The Carbonic Anhydrases: Cellular Physiology and Molecular Genetics; Dodgson, S.J., Tashian, R.E., Gros, G., Carter, N.D., Eds.; Springer: Boston, MA, USA, 1991; pp. 297–306. ISBN 978-1-4899-0750-9. [Google Scholar]
- Lehenkari, P.; Hentunen, T.A.; Laitala-Leinonen, T.; Tuukkanen, J.; Väänänen, H.K. Carbonic anhydrase II plays a major role in osteoclast differentiation and bone resorption by effecting the steady state intracellular pH and Ca2+. Exp. Cell Res. 1998, 242, 128–137. [Google Scholar] [CrossRef] [PubMed]
- Hong, J.H.; Muhammad, E.; Zheng, C.; Hershkovitz, E.; Alkrinawi, S.; Loewenthal, N.; Parvari, R.; Muallem, S. Essential role of carbonic anhydrase XII in secretory gland fluid and HCO3− secretion revealed by disease causing human mutation. J. Physiol. 2015, 593, 5299–5312. [Google Scholar] [CrossRef] [PubMed]
- Maren, T.H.; Broder, L.E. The Role of Carbonic Anhydrase in Anion Secretion into Cerebrospinal Fluid. J. Pharmacol. Exp. Ther. 1970, 172, 197–202. [Google Scholar] [PubMed]
- Sly, W.S.; Hewett-Emmett, D.; Whyte, M.P.; Yu, Y.S.; Tashian, R.E. Carbonic anhydrase II deficiency identified as the primary defect in the autosomal recessive syndrome of osteopetrosis with renal tubular acidosis and cerebral calcification. Proc. Natl. Acad. Sci. USA 1983, 80, 2752–2756. [Google Scholar] [CrossRef]
- Nagelhus, E.A.; Mathiisen, T.M.; Bateman, A.C.; Haug, F.-M.; Ottersen, O.P.; Grubb, J.H.; Waheed, A.; Sly, W.S. Carbonic anhydrase XIV is enriched in specific membrane domains of retinal pigment epithelium, Muller cells, and astrocytes. Proc. Natl. Acad. Sci. USA 2005, 102, 8030–8035. [Google Scholar] [CrossRef] [PubMed]
- Kivelä, A.-J.; Kivelä, J.; Saarnio, J.; Parkkila, S. Carbonic anhydrases in normal gastrointestinal tract and gastrointestinal tumours. World J. Gastroenterol. 2005, 11, 155–163. [Google Scholar] [CrossRef] [PubMed]
- Kivelä, A.J.; Parkkila, S.; Saarnio, J.; Karttunen, T.J.; Kivelä, J.; Parkkila, A.K.; Pastoreková, S.; Pastorek, J.; Waheed, A.; Sly, W.S.; et al. Expression of transmembrane carbonic anhydrase isoenzymes IX and XII in normal human pancreas and pancreatic tumours. Histochem. Cell Biol. 2000, 114, 197–204. [Google Scholar] [PubMed]
- Mboge, M.Y.; Kota, A.; McKenna, R.; Frost, S.C. Biophysical, Biochemical, and Cell Based Approaches Used to Decipher the Role of Carbonic Anhydrases in Cancer and to Evaluate the Potency of Targeted Inhibitors. Int. J. Med. Chem. 2018, 2018. [Google Scholar] [CrossRef] [PubMed]
- Swietach, P.; Patiar, S.; Supuran, C.T.; Harris, A.L.; Vaughan-Jones, R.D. The role of carbonic anhydrase 9 in regulating extracellular and intracellular pH in three-dimensional tumor cell growths. J. Biol. Chem. 2009, 284, 20299–20310. [Google Scholar] [CrossRef] [PubMed]
- Supuran, C.T. Carbonic anhydrases: Novel therapeutic applications for inhibitors and activators. Nat. Rev. Drug Discov. 2008, 7, 168–181. [Google Scholar] [CrossRef] [PubMed]
- Supuran, C.T. Applications of carbonic anhydrases inhibitors in renal and central nervous system diseases. Expert Opin. Ther. Pat. 2018, 28, 713–721. [Google Scholar] [CrossRef] [PubMed]
- Supuran, C.T. Carbonic anhydrase inhibitors as emerging agents for the treatment and imaging of hypoxic tumors. Expert Opin. Investig. Drugs 2018, 27, 963–970. [Google Scholar] [CrossRef]
- Scozzafava, A.; Supuran, C.T. Glaucoma and the applications of carbonic anhydrase inhibitors. Subcell. Biochem. 2014, 75, 349–359. [Google Scholar]
- Henry, R.P. Multiple roles of carbonic anhydrase in cellular transport and metabolism. Annu. Rev. Physiol. 1996, 58, 523–538. [Google Scholar] [CrossRef]
- Chegwidden, W.W.R.; Carter, N.N.D.; Edwards, Y.Y.H. The Carbonic Anhydrases; Springer: Berlin/Heidelberg, Germany, 2000; ISBN 3-7643-5670-7. [Google Scholar]
- Gilmour, K.M. Perspectives on carbonic anhydrase. Comp. Biochem. Physiol. Part A Mol. Integr. Physiol. 2010, 157, 193–197. [Google Scholar] [CrossRef] [PubMed]
- Tripp, B.C.; Smith, K.; Ferry, J.G. Carbonic Anhydrase: New Insights for an Ancient Enzyme. J. Biol. Chem. 2001, 276, 48615–48618. [Google Scholar] [CrossRef] [PubMed] [Green Version]
- Maren, T.H. Carbonic anhydrase: Chemistry, physiology, and inhibition. Physiol. Rev. 1967, 47, 595–781. [Google Scholar] [CrossRef] [PubMed]
- Bauer, C.; Gros, G.; Bartels, H. Biophysics and Physiology of Carbon Dioxide; Springer: Berlin/Heidelberg, Germany, 1980; ISBN 978-3-642-67572-0. [Google Scholar]
- Dodgson, S.J.; Gros, G.; Carter, N.D. The Carbonic Anhydrases: Cellular Physiology and Molecular Genetics; Springer: Boston, MA, USA, 1991; ISBN 978-1-4899-0750-9. [Google Scholar]
- Geers, C.; Gros, G. Carbon dioxide transport and carbonic anhydrase in blood and muscle. Physiol. Rev. 2000, 80, 681–715. [Google Scholar] [CrossRef] [PubMed]
- Purkerson, J.M.; Schwartz, G.J. The role of carbonic anhydrases in renal physiology. Kidney Int. 2007, 71, 103–115. [Google Scholar] [CrossRef] [PubMed] [Green Version]
- Adamson, R.; Swenson, E.R. Acetazolamide Use in Severe Chronic Obstructive Pulmonary Disease. Pros and Cons. Ann. Am. Thorac. Soc. 2017, 14, 1086–1093. [Google Scholar] [PubMed]
- Sly, W.S.; Hu, P.Y. Human carbonic anhydrases and carbonic anhydrase deficiencies. Annu. Rev. Biochem. 1995, 64, 375–401. [Google Scholar] [CrossRef]
- Bidani, A.; Crandall, E.D. Velocity of CO2 exchanges in the lungs. Annu. Rev. Physiol. 1988, 50, 639–652. [Google Scholar] [CrossRef]
- Boron, W.F. Evaluating the role of carbonic anhydrases in the transport of HCO3−-related species. Biochim. Biophys. Acta 2010, 1804, 410–421. [Google Scholar] [CrossRef]
- Swietach, P.; Vaughan-Jones, R.D.; Harris, A.L. Regulation of tumor pH and the role of carbonic anhydrase 9. Cancer Metastasis Rev. 2007, 26, 299–310. [Google Scholar] [CrossRef]
- Waheed, A.; Sly, W.S. Carbonic anhydrase XII functions in health and disease. Gene 2017, 623, 33–40. [Google Scholar] [CrossRef] [PubMed]
- Maren, T.H. Carbonic anhydrase: General perspective and advances in glaucoma research. Drug Dev. Res. 1987, 10, 255–276. [Google Scholar] [CrossRef]
- Lindskog, S. Structure and mechanism of carbonic anhydrase. Pharmacol. Ther. 1997, 74, 1–20. [Google Scholar] [CrossRef]
- Boron, W.F. Regulation of intracellular pH. Adv. Physiol. Educ. 2004, 28, 160–179. [Google Scholar] [CrossRef] [PubMed]
- Boron, W.F. Acid-base physiology. In Medical Physiology: A Cellular and Molecular Approach; Boron, W.F., Boulpaep, E.L., Eds.; Saunders Elsevier: Philadelphia, PA, USA, 2016; pp. 628–646. ISBN 978-1-4557-4377-3. [Google Scholar]
- Bevensee, M.O.; Boron, W.F. Control of intracellular pH. In Seldin and Giebisch’s The Kidney: Physiology & Pathophysiology; Academic Press: Cambridge, MA, USA, 2013; Volume 2, pp. 1773–1835. [Google Scholar]
- Roos, A.; Boron, W.F. Intracellular pH. Physiol. Rev. 1981, 61, 296–434. [Google Scholar] [CrossRef] [PubMed]
- Occhipinti, R.; Boron, W.F. Mathematical modeling of acid-base physiology. Prog. Biophys. Mol. Biol. 2015, 117, 43–58. [Google Scholar] [CrossRef] [PubMed] [Green Version]
- Forster, R.E.; Dodgson, S.J. Membrane transport and provision of substrates for carbonic anhydrase: In vertebrates. In The Carbonic Anhydrases; Springer: Berlin/Heidelberg, Germany, 2000; pp. 263–280. [Google Scholar]
- Lee, S.-K.; Grichtchenko, I.I.; Boron, W.F. Distinguishing HCO3− from CO32− transport by NBCe1-A. FASEB J. 2011, 25, 656.9. [Google Scholar]
- Zhao, P.; Geyer, R.R.; Boron, W.F. A novel stopped-flow assay for quantitating carbonic-anhydrase activity and assessing red-blood-cell hemolysis. Front. Physiol. 2017, 8, 169. [Google Scholar] [CrossRef] [PubMed]
- Davenport, H.W. The ABC of Acid-Base Chemistry: The Elements of Physiological Blood-Gas Chemistry for Medical Students and Physicians; Sixth, Revised; University of Chicago Press: Chicago, IL, USA, 1974; ISBN 978-0-226-13703-2. [Google Scholar]
- Somersalo, E.; Occhipinti, R.; Boron, W.F.; Calvetti, D. A reaction-diffusion model of CO2 influx into an oocyte. J. Theor. Biol. 2012, 309, 185–203. [Google Scholar] [CrossRef] [PubMed]
- Occhipinti, R.; Lee, S.-K.; Boron, W.F. Mathematical modeling of bicarbonate versus carbonate transport by the electrogenic Na+/HCO3− cotransporter. IUPS 2013 2013, 543P. [Google Scholar]
- Calvetti, D.; Prezioso, J.; Occhipinti, R.; Boron, W.F.; Somersalo, E. Computational model of electrode-induced microenvironmental effects on pH measurements near a cell membrane. Submitted.
- Boron, W.F. Sharpey-Schafer lecture: Gas channels. Exp. Physiol. 2010, 95, 1107–1130. [Google Scholar] [CrossRef] [PubMed]
- Longmuir, I.S.; Forster, R.E.; Woo, C.-Y. Diffusion of Carbon Dioxide through Thin Layers of Solution. Nature 1966, 209, 393–394. [Google Scholar] [CrossRef]
- Enns, T.; Sham, G.B.; Anderson, S. Carbonic anhydrase diffusion of CO2 in whole blood. Physiologist 1966, 9, 176. [Google Scholar]
- Moll, W.; Gros, G. Untersuchungen uber den gasaustausch der erythrocyten. In Pflugers Archiv Fur Die Gesamte Physiologie des Menschen und Der Tiere; Springer: New York, NY, USA, 1966; Volume 291, p. R54. [Google Scholar]
- Enns, T. Facilitation by carbonic anhydrase of carbon dioxide transport. Science 1967, 155, 44–47. [Google Scholar] [CrossRef] [PubMed]
- Gros, G.; Moll, W. Facilitated diffusion of CO2 across albumin solutions. J. Gen. Physiol. 1974, 64, 356–371. [Google Scholar] [CrossRef] [PubMed]
- Gros, G.; Moll, W.; Hoppe, H.; Gros, H. Proton transport by phosphate diffusion—A mechanism of facilitated CO2 transfer. J. Gen. Physiol. 1976, 67, 773–790. [Google Scholar] [CrossRef] [PubMed]
- Gros, G.; Gros, H.; Lavalette, D.; Amand, B.; Pochon, F. Mechanisms of facilitated CO2 and H+ diffusion in protein solutions. In Biophysics and Physiology of Carbon Dioxide; Springer: Berlin/Heidelberg, Germany, 1980; pp. 36–48. [Google Scholar]
- Spitzer, K.W.; Skolnick, R.L.; Peercy, B.E.; Keener, J.P.; Vaughan-Jones, R.D. Facilitation of intracellular H+ ion mobility by CO2/HCO3− in rabbit ventricular myocytes is regulated by carbonic anhydrase. J. Physiol. 2002, 541, 159–167. [Google Scholar] [CrossRef]
- Cooper, G.J.; Boron, W.F. Effect of pCMBS on CO2 permeability of Xenopus oocytes expressing aquaporin 1 or its C189S mutant. Am. J. Physiol. 1998, 275, C1481–C1486. [Google Scholar] [CrossRef] [PubMed]
- Endeward, V.; Cartron, J.-P.; Ripoche, P.; Gros, G. RhAG protein of the Rhesus complex is a CO2 channel in the human red cell membrane. FASEB J. 2008, 22, 64–73. [Google Scholar] [CrossRef]
- Geyer, R.R.; Musa-Aziz, R.; Qin, X.; Boron, W.F. Relative CO2/NH3 selectivities of mammalian Aquaporins 0–9. Am. J. Physiol. Cell Physiol. 2013, 304, C985–C994. [Google Scholar] [CrossRef]
- Musa-Aziz, R.; Chen, L.-M.; Pelletier, M.F.; Boron, W.F. Relative CO2/NH3 selectivities of AQP1, AQP4, AQP5, AmtB, and RhAG. Proc. Natl. Acad. Sci. USA 2009, 106, 5406–5411. [Google Scholar] [CrossRef] [PubMed]
- Nakhoul, N.L.; Davis, B.A.; Romero, M.F.; Boron, W.F. Effect of expressing the water channel aquaporin-1 on the CO2 permeability of Xenopus oocytes. Am. J. Physiol. 1998, 274, C543–C548. [Google Scholar] [CrossRef] [PubMed]
- Geyer, R.R.; Parker, M.D.; Toye, A.M.; Boron, W.F.; Musa-Aziz, R. Relative CO2/NH3 permeabilities of human RhAG, RhBG and RhCG. J. Membr. Biol. 2013, 246, 915–926. [Google Scholar] [CrossRef] [PubMed]
- Musa-Aziz, R.; Occhipinti, R.; Boron, W.F. Evidence from simultaneous intracellular- and surface-pH transients that Carbonic Anhydrase IV enhances CO2 fluxes across Xenopus oocyte plasma membranes. Am. J. Physiol. Cell Physiol. 2014, 307, C814–C840. [Google Scholar] [CrossRef] [PubMed]
- Musa-Aziz, R.; Occhipinti, R.; Boron, W.F. Evidence from simultaneous intracellular- and surface-pH transients that Carbonic Anhydrase II enhances CO2 fluxes across Xenopus oocytes plasma membranes. Am. J. Physiol. Cell Physiol. 2014, 307, C791–C813. [Google Scholar] [CrossRef] [PubMed]
- Occhipinti, R.; Musa-Aziz, R.; Boron, W.F. Evidence from mathematical modeling that Carbonic Anhydrase II and IV enhance CO2 fluxes across Xenopus oocytes plasma membranes. Am. J. Physiol. Cell Physiol. 2014, 307, C841–C858. [Google Scholar] [CrossRef] [PubMed]
- Broun, G.; Selegny, E.; Minh, C.T.; Thomas, D. Facilitated transport of CO(2) across a membrane bearing carbonic anhydrase. FEBS Lett. 1970, 7, 223–226. [Google Scholar] [CrossRef]
- Broun, G.; Tran-Minh, C.; Thomas, D.; Domurado, D.; Selegny, E. The use of proteic and enzymatic coatins and/or membranes for oxygenators. ASAIO J. 1971, 17, 341–349. [Google Scholar]
- Gutknecht, J.; Bisson, M.A.; Tosteson, F.C. Diffusion of carbon dioxide through lipid bilayer membranes: Effects of carbonic anhydrase, bicarbonate, and unstirred layers. J. Gen. Physiol. 1977, 69, 779–794. [Google Scholar] [CrossRef]
- Gutknecht, J.; Tosteson, D.C. Diffusion of weak acids across lipid bilayer membranes: Effects of chemical reactions in the unstirred layers. Science 1973, 182, 1258–1261. [Google Scholar] [CrossRef]
- Gutknecht, J.; Bruner, L.J.; Tosteson, D.C. The permeability of thin lipid membranes to bromide and bromine. J. Gen. Physiol. 1972, 59, 486–592. [Google Scholar] [CrossRef] [PubMed]
- Purkerson, J.M.; Kittelberger, A.M.; Schwartz, G.J. Basolateral carbonic anhydrase IV in the proximal tubule is a glycosylphosphatidylinositol-anchored protein. Kidney Int. 2007, 71, 407–416. [Google Scholar] [CrossRef] [PubMed] [Green Version]
- Parkkila, S.; Parkkila, A.K.; Saarnio, J.; Kivelä, J.; Karttunen, T.J.; Kaunisto, K.; Waheed, A.; Sly, W.S.; Türeci, O.; Virtanen, I.; et al. Expression of the membrane-associated carbonic anhydrase isozyme XII in the human kidney and renal tumors. J. Histochem. Cytochem. 2000, 48, 1601–1608. [Google Scholar] [CrossRef] [PubMed]
- Giebisch, G.; Windhager, E.E.; Aronson, P.S. Transport of acids and bases. In Medical Physiology. A Cellular and Molecular Approach; Boron, W.F., Boulpaep, E.L., Eds.; Elsevier Saunders: Philadelphia, PA, USA, 2016; pp. 821–835. ISBN 978-1-4557-4377-3. [Google Scholar]
- Agre, P.; Sasaki, S.; Chrispeels, M.J. Aquaporins: A family of water channel proteins. Am. J. Physiol. 1993, 265, F461. [Google Scholar] [CrossRef] [PubMed]
- Zhou, Y.; Bouyer, P.; Boron, W.F. Evidence that AQP1 is a functional CO2 channel in proximal tubules. FASEB J. 2006, 20, A1225–A1226. [Google Scholar]
- Guo, Y.-M.; Liu, Y.; Liu, M.; Wang, J.-L.; Xie, Z.-D.; Chen, K.-J.; Wang, D.-K.; Occhipinti, R.; Boron, W.F.; Chen, L.-M. Na+/HCO3− Cotransporter NBCn2 Mediates HCO3− Reclamation in the Apical Membrane of Renal Proximal Tubules. J. Am. Soc. Nephrol. 2017, 28, 2409–2419. [Google Scholar] [CrossRef]
- Parker, M.D.; Musa-Aziz, R.; Rojas, J.D.; Choi, I.; Daly, C.M.; Boron, W.F. Characterization of human SLC4A10 as an electroneutral Na/HCO3 cotransporter (NBCn2) with Cl− self-exchange activity. J. Biol. Chem. 2008, 283, 12777–12788. [Google Scholar] [CrossRef]
- Gilmour, K.M. The Disequilibrium pH: A Tool for the Localization of Carbonic Anhydrase. Comp. Biochem. Physiol. Part A. Mol. Integr. Physiol 1998, 119, 243–254. [Google Scholar] [CrossRef]
- Rector, F.C.; Carter, N.W.; Seldin, D.W. The Mechanism of Bicarbonate Reabsorption in the Proximal and Distal Tubules of the Kidney. J. Clin. Investig. 1965, 44, 278–290. [Google Scholar] [CrossRef]
- Vieira, F.L.; Malnic, G. Hydrogen ion secretion by rat renal cortical tubules as studied by an antimony microelectrode. Am. J. Physiol. 1968, 214, 710–718. [Google Scholar] [CrossRef] [Green Version]
- DuBose, T.D.; Pucacco, L.R.; Seldin, D.W.; Carter, N.W.; Kokko, J.P. Microelectrode determination of pH and PCO2 in rat proximal tubule after benzolamide: Evidence for hydrogen ion secretion. Kidney Int. 1979, 15, 624–629. [Google Scholar] [CrossRef] [PubMed]
- DuBose, T.D.; Lucci, M.S. Effect of carbonic anhydrase inhibition on superficial and deep nephron bicarbonate reabsorption in the rat. J. Clin. Investig. 1983, 71, 55–65. [Google Scholar] [CrossRef] [PubMed]
- Lucci, M.S.; Tinker, J.P.; Weiner, I.M.; DuBose, T.D. Function of proximal tubule carbonic anhydrase defined by selective inhibition. Am. J. Physiol.-Ren. Physiol. 1983, 245, F443–F449. [Google Scholar] [CrossRef] [PubMed]
- Sly, W.S.; Whyte, M.P.; Sundaram, V.; Tashian, R.E.; Hewett-Emmett, D.; Guibaud, P.; Vainsel, M.; Baluarte, H.J.; Gruskin, A.; Al-Mosawi, M.; et al. Carbonic Anhydrase II Deficiency in 12 Families with the Autosomal Recessive Syndrome of Osteopetrosis with Renal Tubular Acidosis and Cerebral Calcification. N. Engl. J. Med. 1985, 313, 139–145. [Google Scholar] [CrossRef] [PubMed]
- Lewis, S.E.; Erickson, R.P.; Barnett, L.B.; Venta, P.J.; Tashian, R.E. N-ethyl-N-nitrosourea-induced null mutation at the mouse Car-2 locus: An animal model for human carbonic anhydrase II deficiency syndrome. Proc. Natl. Acad. Sci. USA 1988, 85, 1962–1966. [Google Scholar] [CrossRef] [PubMed]
- Soleimani, M.; Aronson, P.S. Effects of acetazolamide on Na+-HCO-3 cotransport in basolateral membrane vesicles isolated from rabbit renal cortex. J. Clin. Investig. 1989, 83, 945–951. [Google Scholar] [CrossRef] [PubMed]
- Henderson, R.M.; Bell, P.B.; Cohen, R.D.; Browning, C.; Iles, R.A. Measurement of intracellular pH with microelectrodes in rat kidney in vivo. Am. J. Physiol.-Ren. Physiol. 1986, 250, F203–F209. [Google Scholar] [CrossRef] [PubMed]
- Schwartz, G.J.; Weinstein, A.M.; Steele, R.E.; Stephenson, J.L.; Burg, M.B. Carbon dioxide permeability of rabbit proximal convoluted tubules. Am. J. Physiol. 1981, 240, F231–F244. [Google Scholar] [CrossRef] [PubMed]
- Krahn, T.A.; Weinstein, A.M. Acid/base transport in a model of the proximal tubule brush border: Impact of carbonic anhydrase. Am. J. Physiol.-Ren. Physiol. 1996, 270, F344–F355. [Google Scholar] [CrossRef]
- Endeward, V.; Musa-Aziz, R.; Cooper, G.J.; Chen, L.-M.; Pelletier, M.F.; Virkki, L.V.; Supuran, C.T.; King, L.S.; Boron, W.F.; Gros, G. Evidence that aquaporin 1 is a major pathway for CO2 transport across the human erythrocyte membrane. FASEB J. 2006, 20, 1974–1981. [Google Scholar] [CrossRef]
- Jennings, M.L. Structure and function of the red blood cell anion transport protein. Annu. Rev. Biophys. Biophys. Chem. 1989, 18, 397–430. [Google Scholar] [CrossRef] [PubMed]
- Parker, M.D.; Boron, W.F. The divergence, actions, roles, and relatives of sodium-coupled bicarbonate transporters. Physiol. Rev. 2013, 93, 803–959. [Google Scholar] [CrossRef] [PubMed]
- Boron, W. Transport of oxygen and carbon dioxide in the blood. In Medical Physiology; Boron, W., Boulpaep, E., Eds.; Elsevier: Philadelphia, PA, USA, 2017; pp. 647–659. ISBN 978-1-4557-4377-3. [Google Scholar]
- Zhao, P.; Geyer, R.R.; Sim, E.S.; Salameh, A.I.; Meyerson, H.; Wass, A.B.; Moss, F.J.; Boron, W.F. Oxygen channels in red blood cells. FASEB J. 2016, 30, 1224.24. [Google Scholar]
- Verkman, A.S. Role of aquaporins in lung liquid physiology. Respir. Physiol. Neurobiol. 2007, 159, 324–330. [Google Scholar] [CrossRef] [PubMed] [Green Version]
- Swenson, E.R. Respiratory and renal roles of carbonic anhydrase in gas exchange and acid-base regulation. In The Carbonic Anhydrases; Birkhäuser: Basel, Switzerland, 2000; pp. 281–341. [Google Scholar]
- Forster, R.E.; Itada, N. Carbonic Anhydrase Activity in Intact Red Cells as Measured by Means of 18O Exchange between CO2 and Water. In Biophysics and Physiology of Carbon Dioxide; Bauer, C., Gros, G., Bartels, H., Eds.; Springer: Berlin/Heidelberg, Germany, 1980; pp. 177–183. [Google Scholar]
- Al-Samir, S.; Papadopoulos, S.; Scheibe, R.J.; Meißner, J.D.; Cartron, J.-P.; Sly, W.S.; Alper, S.L.; Gros, G.; Endeward, V. Activity and distribution of intracellular carbonic anhydrase II and their effects on the transport activity of anion exchanger AE1/SLC4A1. J. Physiol. 2013, 591, 4963–4982. [Google Scholar] [CrossRef] [PubMed]
- Endeward, V.; Gros, G. Low carbon dioxide permeability of the apical epithelial membrane of guinea-pig colon. J. Physiol. 2005, 567, 253–265. [Google Scholar] [CrossRef] [PubMed]
- Effros, R.M.; Chang, R.S.; Silverman, P. Acceleration of plasma bicarbonate conversion to carbon dioxide by pulmonary carbonic anhydrase. Science 1978, 199, 427–429. [Google Scholar] [CrossRef]
- Klocke, R.A. Catalysis of CO2 reactions by lung carbonic anhydrase. J. Appl. Physiol. 1978, 44, 882–888. [Google Scholar] [CrossRef]
- Ryan, U.S.; Whitney, P.L.; Ryan, J.W. Localization of carbonic anhydrase on pulmonary artery endothelial cells in culture. J. Appl. Physiol. 1982, 53, 914–919. [Google Scholar] [CrossRef]
- Fleming, R.E.; Crouch, E.C.; Ruzicka, C.A.; Sly, W.S. Pulmonary carbonic anhydrase IV: Developmental regulation and cell-specific expression in the capillary endothelium. Am. J. Physiol. 1993, 265, L627–L635. [Google Scholar] [CrossRef]
- Zhu, X.L.; Sly, W.S. Carbonic anhydrase IV from human lung. Purification, characterization, and comparison with membrane carbonic anhydrase from human kidney. J. Biol. Chem. 1990, 265, 8795–8801. [Google Scholar] [PubMed]
- Henry, R.P.; Dodgson, S.J.; Forster, R.E.; Storey, B.T. Rat lung carbonic anhydrase: Activity, localization, and isozymes. J. Appl. Physiol. 1986, 60, 638–645. [Google Scholar] [CrossRef] [PubMed]
- Nioka, S.; Henry, R.P.; Forster, R.E. Total CA activity in isolated perfused guinea pig lung by 18O-exchange method. J. Appl. Physiol. 1988, 65, 2236–2244. [Google Scholar] [CrossRef] [PubMed]
- Nioka, S.; Forster, R.E. Lung Carbonic Anhydrase. In The Carbonic Anhydrases: Cellular Physiology and Molecular Genetics; Dodgson, S.J., Tashian, R.E., Gros, G., Carter, N.D., Eds.; Springer: Boston, MA, USA, 1991; pp. 333–340. ISBN 978-1-4899-0750-9. [Google Scholar]
- Weibel, E.R. Lung morphometry: The link between structure and function. Cell Tissue Res. 2017, 367, 413–426. [Google Scholar] [CrossRef] [PubMed]
- Gehr, P.; Bachofen, M.; Weibel, E.R. The normal human lung: Ultrastructure and morphometric estimation of diffusion capacity. Respir. Physiol. 1978, 32, 121–140. [Google Scholar] [CrossRef]
- Crapo, J.D.; Barry, B.E.; Gehr, P.; Bachofen, M.; Weibel, E.R. Cell Number and Cell Characteristics of the Normal Human Lung. Am. Rev. Respir. Dis. 1982, 126, 332–337. [Google Scholar] [PubMed]
- Fleming, R.E.; Moxley, M.A.; Waheed, A.; Crouch, E.C.; Sly, W.S.; Longmore, W.J. Carbonic anhydrase II expression in rat type II pneumocytes. Am. J. Respir. Cell Mol. Biol. 1994, 10, 499–505. [Google Scholar] [CrossRef]
- Chen, J.; Lecuona, E.; Briva, A.; Welch, L.C.; Sznajder, J.I. Carbonic anhydrase II and alveolar fluid reabsorption during hypercapnia. Am. J. Respir. Cell Mol. Biol. 2008, 38, 32–37. [Google Scholar] [CrossRef]
- Effros, R.M.; Mason, G.; Silverman, P. Role of perfusion and diffusion in 14CO2 exchange in the rabbit lung. J. Appl. Physiol. 1981, 51, 1136–1144. [Google Scholar] [CrossRef]
- Effros, R.M. Carbonic Anhydrase and Alveolar Fluid Absorption. Am. J. Respir. Cell Mol. Biol. 2008, 39, 124. [Google Scholar] [CrossRef]
- Ridderstråle, Y.; Wistrand, P.J.; Holm, L.; Carter, N.D. Use of carbonic anhydrase II-deficient mice in uncovering the cellular location of membrane-associated isoforms. In The Carbonic Anhydrases; Birkhäuser: Basel, Switzerland, 2000; pp. 143–155. [Google Scholar]
- Swenson, E.R. Carbonic anhydrase inhibitors and high altitude illnesses. Subcell. Biochem. 2014, 75, 361–386. [Google Scholar] [PubMed]
- Forster, R.E.; Crandall, E.D. Time course of exchanges between red cells and extracellular fluid during CO2 uptake. J. Appl. Physiol. 1975, 38, 710–718. [Google Scholar] [CrossRef] [PubMed]
- Hill, E.P.; Power, G.G.; Longo, L.D. Mathematical simulation of pulmonary O2 and CO2 exchange. Am. J. Physiol. 1973, 224, 904–917. [Google Scholar] [CrossRef] [PubMed]
- Bidani, A.; Crandall, E.D.; Forster, R.E. Analysis of postcapillary pH changes in blood in vivo after gas exchange. J. Appl. Physiol. 1978, 44, 770–781. [Google Scholar] [CrossRef] [PubMed]
- Tyrrell, H.J.V. The origin and present status of Fick’s diffusion law. J. Chem. Educ. 1964, 41, 397. [Google Scholar] [CrossRef]
- Alvarez, O.; Latorre, R. The enduring legacy of the “constant-field equation” in membrane ion transport. J. Gen. Physiol. 2017, 149, 911–920. [Google Scholar] [CrossRef]
- Crandall, E.D.; O’Brasky, J.E. Direct evidence of participation of rat lung carbonic anhydrase in CO2 reactions. J. Clin. Investig. 1978, 62, 618–622. [Google Scholar] [CrossRef] [PubMed]
- Heming, T.A.; Geers, C.; Gros, G.; Bidani, A.; Crandall, E.D. Effects of dextran-bound inhibitors on carbonic anhydrase activity in isolated rat lungs. J. Appl. Physiol. 1986, 61, 1849–1856. [Google Scholar] [CrossRef]
- Heming, T.A.; Vanoye, C.G.; Stabenau, E.K.; Roush, E.D.; Fierke, C.A.; Bidani, A. Inhibitor sensitivity of pulmonary vascular carbonic anhydrase. J. Appl. Physiol. 1993, 75, 1642–1649. [Google Scholar] [CrossRef]
- Enns, T.; Hill, E.P. CO2 diffusing capacity in isolated dog lung lobes and the role of carbonic anhydrase. J. Appl. Physiol. 1983, 54, 483–490. [Google Scholar] [CrossRef]
- DeCoursey, T.E. Hypothesis: Do voltage-gated H(+) channels in alveolar epithelial cells contribute to CO(2) elimination by the lung? Am. J. Physiol. Cell Physiol. 2000, 278, C1–C10. [Google Scholar] [CrossRef] [PubMed]
- Boron, W.F.; De Weer, P. Intracellular pH transients in squid giant axons caused by CO2, NH3, and metabolic inhibitors. J. Gen. Physiol. 1976, 67, 91–112. [Google Scholar] [CrossRef] [PubMed]
Figure 1.
Schematic of the reaction and diffusion processes involved in facilitated CO2 diffusion. Before time zero, we assume that Regions 0, 1, and 2 have identical compositions, with all reactions being in equilibrium and no concentration gradients existing between Regions. At time zero, we establish a CO2 gradient from Region 0 (high [CO2]) to Region 1 (low [CO2]) in the presence of HB/B−, a generic non-CO2/HCO3− buffer. Although CO2 is the only species moving from Region 0 to Region 1, all species can move between Region 1 and Region 2. Some CO2 moves from Region 1 to Region 2 by free diffusion. The shaded grey area identifies facilitated CO2 diffusion (i.e., HCO3− and H+ moving in the same direction as CO2) from Region 1 to Region 2. The pink shaded area identifies facilitated H+ diffusion (i.e., the antiparallel movements of HB and B−, with HB [the weak acid] moving in the same direction as CO2 [the potential weak acid]). The solid arrows identify reactions, and the dashed arrows identify free solute diffusion. These reaction and diffusion events greatly accelerate the transfer of carbon (in the guise of CO2 or HCO3−) from Region 1 to Region 2. For details, see text. CA, carbonic anhydrase.

Figure 2.
Schematic of the reaction and diffusion processes involved in facilitated diffusion of: HCO3− (A); H+ (B); B− (C); and HB (D). We set up the four examples as in Figure 1, except that the component that we add to Region 0 is different. At time zero, we establish a gradient for HCO3− in (A) from Region 0 (high [HCO3−]) to Region 1 (low [HCO3−]), for H+ in (B), for B− in (C), and for HB in (D). The solid arrows identify reactions, and the dashed arrows identify free solute diffusion. For details, see text. CA, carbonic anhydrase.

Figure 3.
Schematic of the reaction and diffusion processes involved in facilitated CO2 diffusion up to and away from membranes that are permeable only to CO2. Before time zero, we assume that all Regions have identical compositions, with all reactions being in equilibrium and no concentration gradients existing between adjacent Regions. At time zero, we establish a CO2 gradient from Region 0 to Region 1. (A) Silicone rubber artificial membrane, with no buffers other than CO2/HCO3− in the aqueous solutions (Broun model [80,81]). Here, the CA is attached to both sides of the membrane (“enzymatic coating”), but is present nowhere else in the system. In this system, a low level of facilitated CO2 diffusion—low because CA is not in the bulk solution and no non-CO2/HCO3− buffers are present—would speed the appearance of CO2 on the left side of the membrane, enhancing the gradient for CO2 to cross the membrane. In addition, a low level of facilitated CO2 diffusion would speed the removal of CO2 on the right side of the membrane, again enhancing the transmembrane CO2 gradient. (B) Artificial planar lipid bilayer, with the HB/B− buffer pair present in both aqueous solutions, and soluble CA present throughout the aqueous solutions (Gutknecht–Tosteson model [82]). Here the facilitated diffusion of CO2—from Region 0 to 1, within Region 1, from Region 1 to Region 2, within Region 2, and from Region 2 to Region 3—is faster than in (A) for two reasons: the presence of CA and the presence of HB/B−. Both speed CO2 facilitated diffusion in Regions 1 and 2. As a result, the gradient of CO2 across the membrane—and thus the transmembrane flux—is larger in (B) than in (A).

Figure 4.
Reaction and diffusion events caused by influx of CO2 into a cell (an oocyte) and effect on extracellular-surface pH (pHS) and intracellular pH (pHi). Here, the influx of CO2 into the cell creates a CO2 sink at the outer surface of the membrane, ↓ [CO2]S. The two insets show the time courses of pHS and pHi during the CO2 influx. bECF, bulk extracellular fluid; EUF, extracellular unconvected fluid; CA, carbonic anhydrase. Modified from Figure 1 of [78].

Figure 5.
Key elements of the reaction–diffusion mathematical model of CO2 fluxes across the plasma membrane of an oocyte. The model includes: a thin layer of vesicles beneath the plasma membrane (inset in top left corner), folds and microvilli at the plasma membrane (PM; inset in top right corner), intracellular and extracellular buffer reactions (inset in bottom left corner), cytosolic water volume that is lower than total intracellular volume, lower diffusion constant for solutes in cytosol vs. extracellular fluid, and the vitelline membrane that envelops the PM (inset in bottom center). The inset in the bottom right corner illustrates the spatial discretization in the proximity of the PM. For additional details, see text. bECF, bulk extracellular fluid; EUF, extracellular unconvected fluid; ICF, intracellular fluid; EM, region immediately adjacent to the extracellular side of the plasma membrane; IM, region immediately adjacent to the intracellular side of the plasma membrane; R, radius of oocyte; R∞, radius of the computational domain; d, thickness of the EUF; λ and γ, tortuosity factors; k, reaction rate. Modified from Figure 1 of [79].

Figure 6.
Supra-additive effects of intracellular and extracellular-surface CA activities on kinetics of pH changes, as predicted by mathematical modeling. The insets to Figure 4 show the protocol of the physiological experiment: the addition of CO2/HCO3− to the extracellular fluid causes: (a) a quasi-exponential decrease of intracellular pH (pHi); and (b) a rapid increase in the pH at the extracellular surface (pHS), followed by a quasi-exponential decay. (A) The maximal rate of the pHi decrease—(dpHi/dt)max—for 12 simulations, 6 varying the intracellular CA acceleration factor (Ai) at a fixed extracellular-surface CA acceleration factor (AS) of 150 (diamonds), and 6 varying Ai at a fixed AS of 10,000 (squares). (B) The maximal shift in pHS—(ΔpHS)max—for the same 12 simulations in (A). Each of the 12 simulations models a hypothetical oocyte exposed to a bulk solution containing 1.5% CO2/10 mM HCO3− at pH 7.50. (A) Dependence of (dpHi/dt)max on Ai, for each of the two different values of AS. (B) Dependence of (ΔpHS)max on Ai, for each of the two different values of AS. In each panel, the six diamonds represent an isopleth for AS = 150, whereas the six squares represent an isopleth for AS = 10,000. In each panel, the diamond labeled “~Ctrl” (i.e., Ai = 5, AS = 150) represents a “control” oocyte that is, an oocyte not expressing or injected with any heterologous protein. For “~Ctrl”, the (dpHi/dt)max value in (A) and the (ΔpHS)max value in (B) approximately match the mean data for physiological experiments, indicated by the horizontal dashed gray lines. In each panel, the square labeled “CA IV” (i.e., Ai = 40, AS = 10,000) represents an oocyte expressing CA IV, with (dpHi/dt)max and (ΔpHS)max values approximately matching the mean data for physiological experiments, indicated by the horizontal dashed green lines. In each panel, the square labeled “CAS” (i.e., Ai = 5, AS = 10,000) represents a hypothetical oocyte that—compared to “~Ctrl”—has an isolated increase in AS. Note that the (dpHi/dt)max and (ΔpHS)max values for this hypothetical “CAS” increase by amounts (red vector) that are far smaller than those actually observed for real oocytes expressing CA IV (i.e., vertical distances between horizontal dashed green and grey lines). The only way for the simulations to explain the physiological data is if CA IV expression not only raises AS from 150 to 10,000 but also raises Ai from 5 to 40 (green vector). Indeed, physiological evidence indicates that Ai must indeed increase. In each panel, the diamond labeled “CAi” (i.e., Ai = 40, AS = 150) represents a hypothetical oocyte with a cytosolic CA activity that is the same as that postulated for an oocyte actually expressing CA IV (blue vector). The sum of the red vector (increase AS only) and the blue vector (increase Ai only) is the point labeled “*” (dashed golden vector). Notice that the green vector predicts that CA IV expression (combined increases in AS and Ai) produces much larger increases in (dpHi/dt)max and (ΔpHS)max than the dashed golden vector (the sum of isolated increases in AS and Ai). In other words, the effects of simultaneously increasing AS and Ai are supra-additive. Modified from Figure 13 in [79].

Figure 7.
Classical model of HCO3− reabsorption and titration of non-CO2/HCO3− luminal weak bases by the renal proximal tubule (PT). According to the classical view, the only acid–base transporters at the apical membrane (i.e., the membrane facing the tubule lumen) are the Na-H exchanger NHE3 and the vacuolar-type H+ pump. The energy for Na-H exchange comes from the inward Na+ gradient, established by the Na-K pump on the basolateral membrane (not shown), and the energy for the apical H+ pump comes from ATP hydrolysis. HCO3− reabsorption (or reclamation) occurs when the H+ secreted in the tubule lumen rapidly combines with HCO3− (previously filtered in the glomerulus) to form H2CO3, which slowly dissociates to form H2O and CO2. Although the figure shows the GPI-linked enzyme carbonic anhydrase (CA) IV as catalyzing the slow dehydration of H2CO3, in fact CA IV bypasses this slow step by catalyzing the direct conversion of HCO3− and H+ to H2O and CO2. The CO2 and H2O newly formed in the lumen then diffuse into the PT cytosol, mostly through the channel aquaporin AQP1. In the cytosol, although the figure shows cytosolic CA II catalyzing the slow hydration of CO2 to form H2CO3, in fact, the CA II directly converts CO2 and H2O to H+ and HCO3−. The H+ recycles back into the lumen. The HCO3− exits the PT cell across the basolateral (i.e., blood-side) membrane via the electrogenic Na/HCO3 cotransporter, which exports the equivalent of 2 or 3 HCO3− ions with 1 Na+ ion. The process just described merely reclaims previously filtered HCO3−; it does not titrate any acids in the body. A second fate of the H+ secreted in the lumen can be its combination with luminal NH3—which the PT cell generates from glutamine and glutamate—to form NH4+, most of which appears in the urine. This process is termed ammonium secretion. A third fate of the secreted H+ is to titrate weak bases other than HCO3− or NH3 (e.g., phosphate, creatinine) to form the conjugate weak acid. The amount of such acid is termed the titratable acidity. In the figure, we show all of these non-HCO3− titrations as the idealized reaction B− + H+ → HB. Of course, B can have any valence (e.g., 0 in the case of NH3), and HB has a valence 1 greater than that of B (+1 in the case of NH4+). A fourth and final fate of the secreted H+ is to remain unbuffered and thereby lower the pH of the tubule fluid. Whether the secreted H+ titrates NH3 or another non-CO2/HCO3− buffer, or remains unbuffered, one “new HCO3−” moves via NBCe1-A into the interstitial space to titrate acids throughout the body. AM, apical membrane; BLM, basolateral membrane; CAInh, carbonic anhydrase inhibitor.

Figure 8.
Two models of how the electroneutral Na/HCO3 cotransporter NBCn2 could mediate the reabsorption of HCO3− and titration of non-CO2/HCO3− buffers in the renal proximal tubule (PT). Guo et al. discovered that a variant of NBCn2 (first 4 N-terminal amino acids: MCDL) is present at the apical membrane of proximal-tubule (PT) cells [90]. Although NBCn2 is generally depicted as mediating NaHCO3 uptake (A), evidence suggests that it in fact is an exchanger. If so, the simplest model is that it exchanges Na+ plus CO3= for HCO3− (B). (A) NBCn2 as a cotransporter. If the apical NBCn2 directly moves the filtered Na+ and HCO3− into the cytosol, the result would be a deficit of Na+ and HCO3− in the nanodomains near the transporter. One means of replenishing the lost NaHCO3 would be the diffusion of Na+ and HCO3− from the bulk luminal fluid to the apical membrane. Another means of replenishing the HCO3− would be the conversion of CO2 and H2O to HCO3− and H+, facilitated by apical CA IV. Our simulations [90] suggest that the reaction (H2O + CO2 → H+ + HCO3−) accounts for only a small fraction of total HCO3− replenishment. The newly produced HCO3− would move into the cytosol via NBCn2, whereas the newly produced H+ would either titrate B− to form HB, or remain unbuffered. In the cytosol, most of the HCO3− arriving via NBCn2 would diffuse toward the basolateral membrane, for exit via the electrogenic Na/HCO3 cotransporter NBCe1-A. However, a small fraction of the entering HCO3− would in principle, under the catalytic action of CA II, recycle back into the lumen—mostly via aquaporin 1 (AQP1)—as H2O and CO2. This diffusion of H2O and CO2 is in the direction opposite shown in Figure 7, but would ultimately be responsible for the titration of B− to HB. In a real PT, the H2O and CO2 necessary to replenish luminal HCO3− could come from Na-H exchange and H+ pumping, as shown in Figure 7. (B) NBCn2 as an exchanger. In this model, filtered Na+ and HCO3− diffuses from the bulk luminal fluid towards NBCn2. The HCO3− that approaches NBCn2 dissociates into CO3= and H+, with CO3= entering the PT cytosol via NBCn2. Virtually all of the newly produced luminal H+ titrates the HCO3− that NBCn2 moves out of the PT cell. The result is the formation of luminal H2O and CO2—catalyzed by apical CA IV—and the subsequent influx of H2O and CO2, again mostly via AQP1, into the cytosol. Once inside the cell, the CO2 and H2O—catalyzed by CA II—would regenerate HCO3− for export into the lumen via NBCn2, and H+, which would titrate the incoming CO3= to HCO3−, which would eventually exit the cell via NBCe1-A. Note that, in this scenario, virtually no luminal H+ would be left over to titrate B− to HB. In other words, NBCn2 would appear to mediate the pure uptake of NaHCO3 without titrating other buffers. AM, apical membrane; BLM, basolateral membrane; CAInh, carbonic anhydrase inhibitor.

Figure 9.
Diagram of the reaction, diffusion and transport processes involved in the removal of the metabolically produced CO2 from cells to blood (systemic capillary) and from blood (pulmonary capillary) to the lung (alveoli). (A) Of the CO2 that diffuses from cells to the systemic capillary, ~10% remains in the blood plasma—as dissolved CO2 (~5%), HCO3− (~5%) or carbamino compounds (<1%)—whereas ~90% enters the RBCs, almost entirely via the water channel AQP1 [104] or the Rh complex [72]. In the cytosol of the RBCs, most CO2 rapidly combines with H2O to form HCO3− and H+, under the catalytic action of CA I (not shown) and CA II. Much of this newly formed HCO3− exits via the Cl-HCO3 exchanger AE1 [105,106]. A smaller fraction of the incoming CO2 covalently reacts with hemoglobin (Hb) to form carbamino-Hb and H+, and a tiny fraction remains dissolved in the RBC cytosol. Hb buffers nearly all of the newly formed H+ [58,107]. These events all reverse in the pulmonary capillary, where RBCs unload CO2 for diffusion into the alveolar space. Another important function of CA in RBCs is augmentation of the association and dissociation of O2 with Hb via the Bohr effect. In the systemic capillary, the entry of CO2 into RBCs causes their pH to decrease, thereby reducing the Hb-O2 binding affinity and favoring O2 unloading to the tissue. The formation of carbamino-Hb also favors O2 unloading. In the pulmonary capillary, the exit of CO2 from the RBCs has the opposite effect, favoring O2 loading from the alveoli to the pulmonary capillary. Recent evidence points toward a role of AQP1 and the Rh complex in the diffusion of O2 across the RBC membrane [108]. CA IV on the lumen side of the capillary endothelial cells may accelerate the reaction CO2 + H2O → HCO3− + H+ in the lumen of systemic capillaries, thereby maximizing flux from tissue to blood, and may accelerate the opposite reaction HCO3− + H+ → CO2 + H2O in the lumen of pulmonary capillaries, thereby maximizing CO2 flux from blood to alveoli (see Figure 3B). (B) Magnification of the different layers of the gas-exchange surface at the systemic capillary. The barrier between the RBC cytosol and capillary lumen actually consists of three plasma membranes—that of the cell that generates the CO2, and the two membranes of the endothelial cell—plus the interstitial fluid and cytosol of the endothelial cell. Cytosolic CA would facilitate CO2 diffusion through the endothelial cell (see Figure 1) and enhance diffusion across the membranes (see Figure 3B). CA IV may be present on the membranes facing the extremely thin layer of interstitial fluid, where this enzyme could also facilitate CO2 diffusion through the interstitial fluid as well as the transmembrane diffusion of CO2. Note that AQP1 or other AQPs—depending on the identity of the capillary bed—could provide a low-resistance pathway for the diffusion of CO2 and O2 across all three of these membranes. (C) Magnification of the different layers of the pulmonary capillary-alveolar gas exchange surface. This system is more complex than that in (B) because the gases must cross four cells membranes. In addition, AQP5 is present at very high densities in the alveolar side of the alveolar type I pneumocyte [109].

© 2019 by the authors. Licensee MDPI, Basel, Switzerland. This article is an open access article distributed under the terms and conditions of the Creative Commons Attribution (CC BY) license (http://creativecommons.org/licenses/by/4.0/).
Share and Cite
MDPI and ACS Style
Occhipinti, R.; Boron, W.F. Role of Carbonic Anhydrases and Inhibitors in Acid–Base Physiology: Insights from Mathematical Modeling. Int. J. Mol. Sci. 2019, 20, 3841. https://doi.org/10.3390/ijms20153841
AMA Style
Occhipinti R, Boron WF. Role of Carbonic Anhydrases and Inhibitors in Acid–Base Physiology: Insights from Mathematical Modeling. International Journal of Molecular Sciences. 2019; 20(15):3841. https://doi.org/10.3390/ijms20153841
Chicago/Turabian StyleOcchipinti, Rossana, and Walter F. Boron. 2019. "Role of Carbonic Anhydrases and Inhibitors in Acid–Base Physiology: Insights from Mathematical Modeling" International Journal of Molecular Sciences 20, no. 15: 3841. https://doi.org/10.3390/ijms20153841
Note that from the first issue of 2016, this journal uses article numbers instead of page numbers. See further details here.