
A GIS-Based Approach for Flood Risk Zoning by Combining Social Vulnerability and Flood Susceptibility: A Case Study of Nanjing, China


Abstract
:1. Introduction
2. Social Vulnerability and Flood Susceptibility
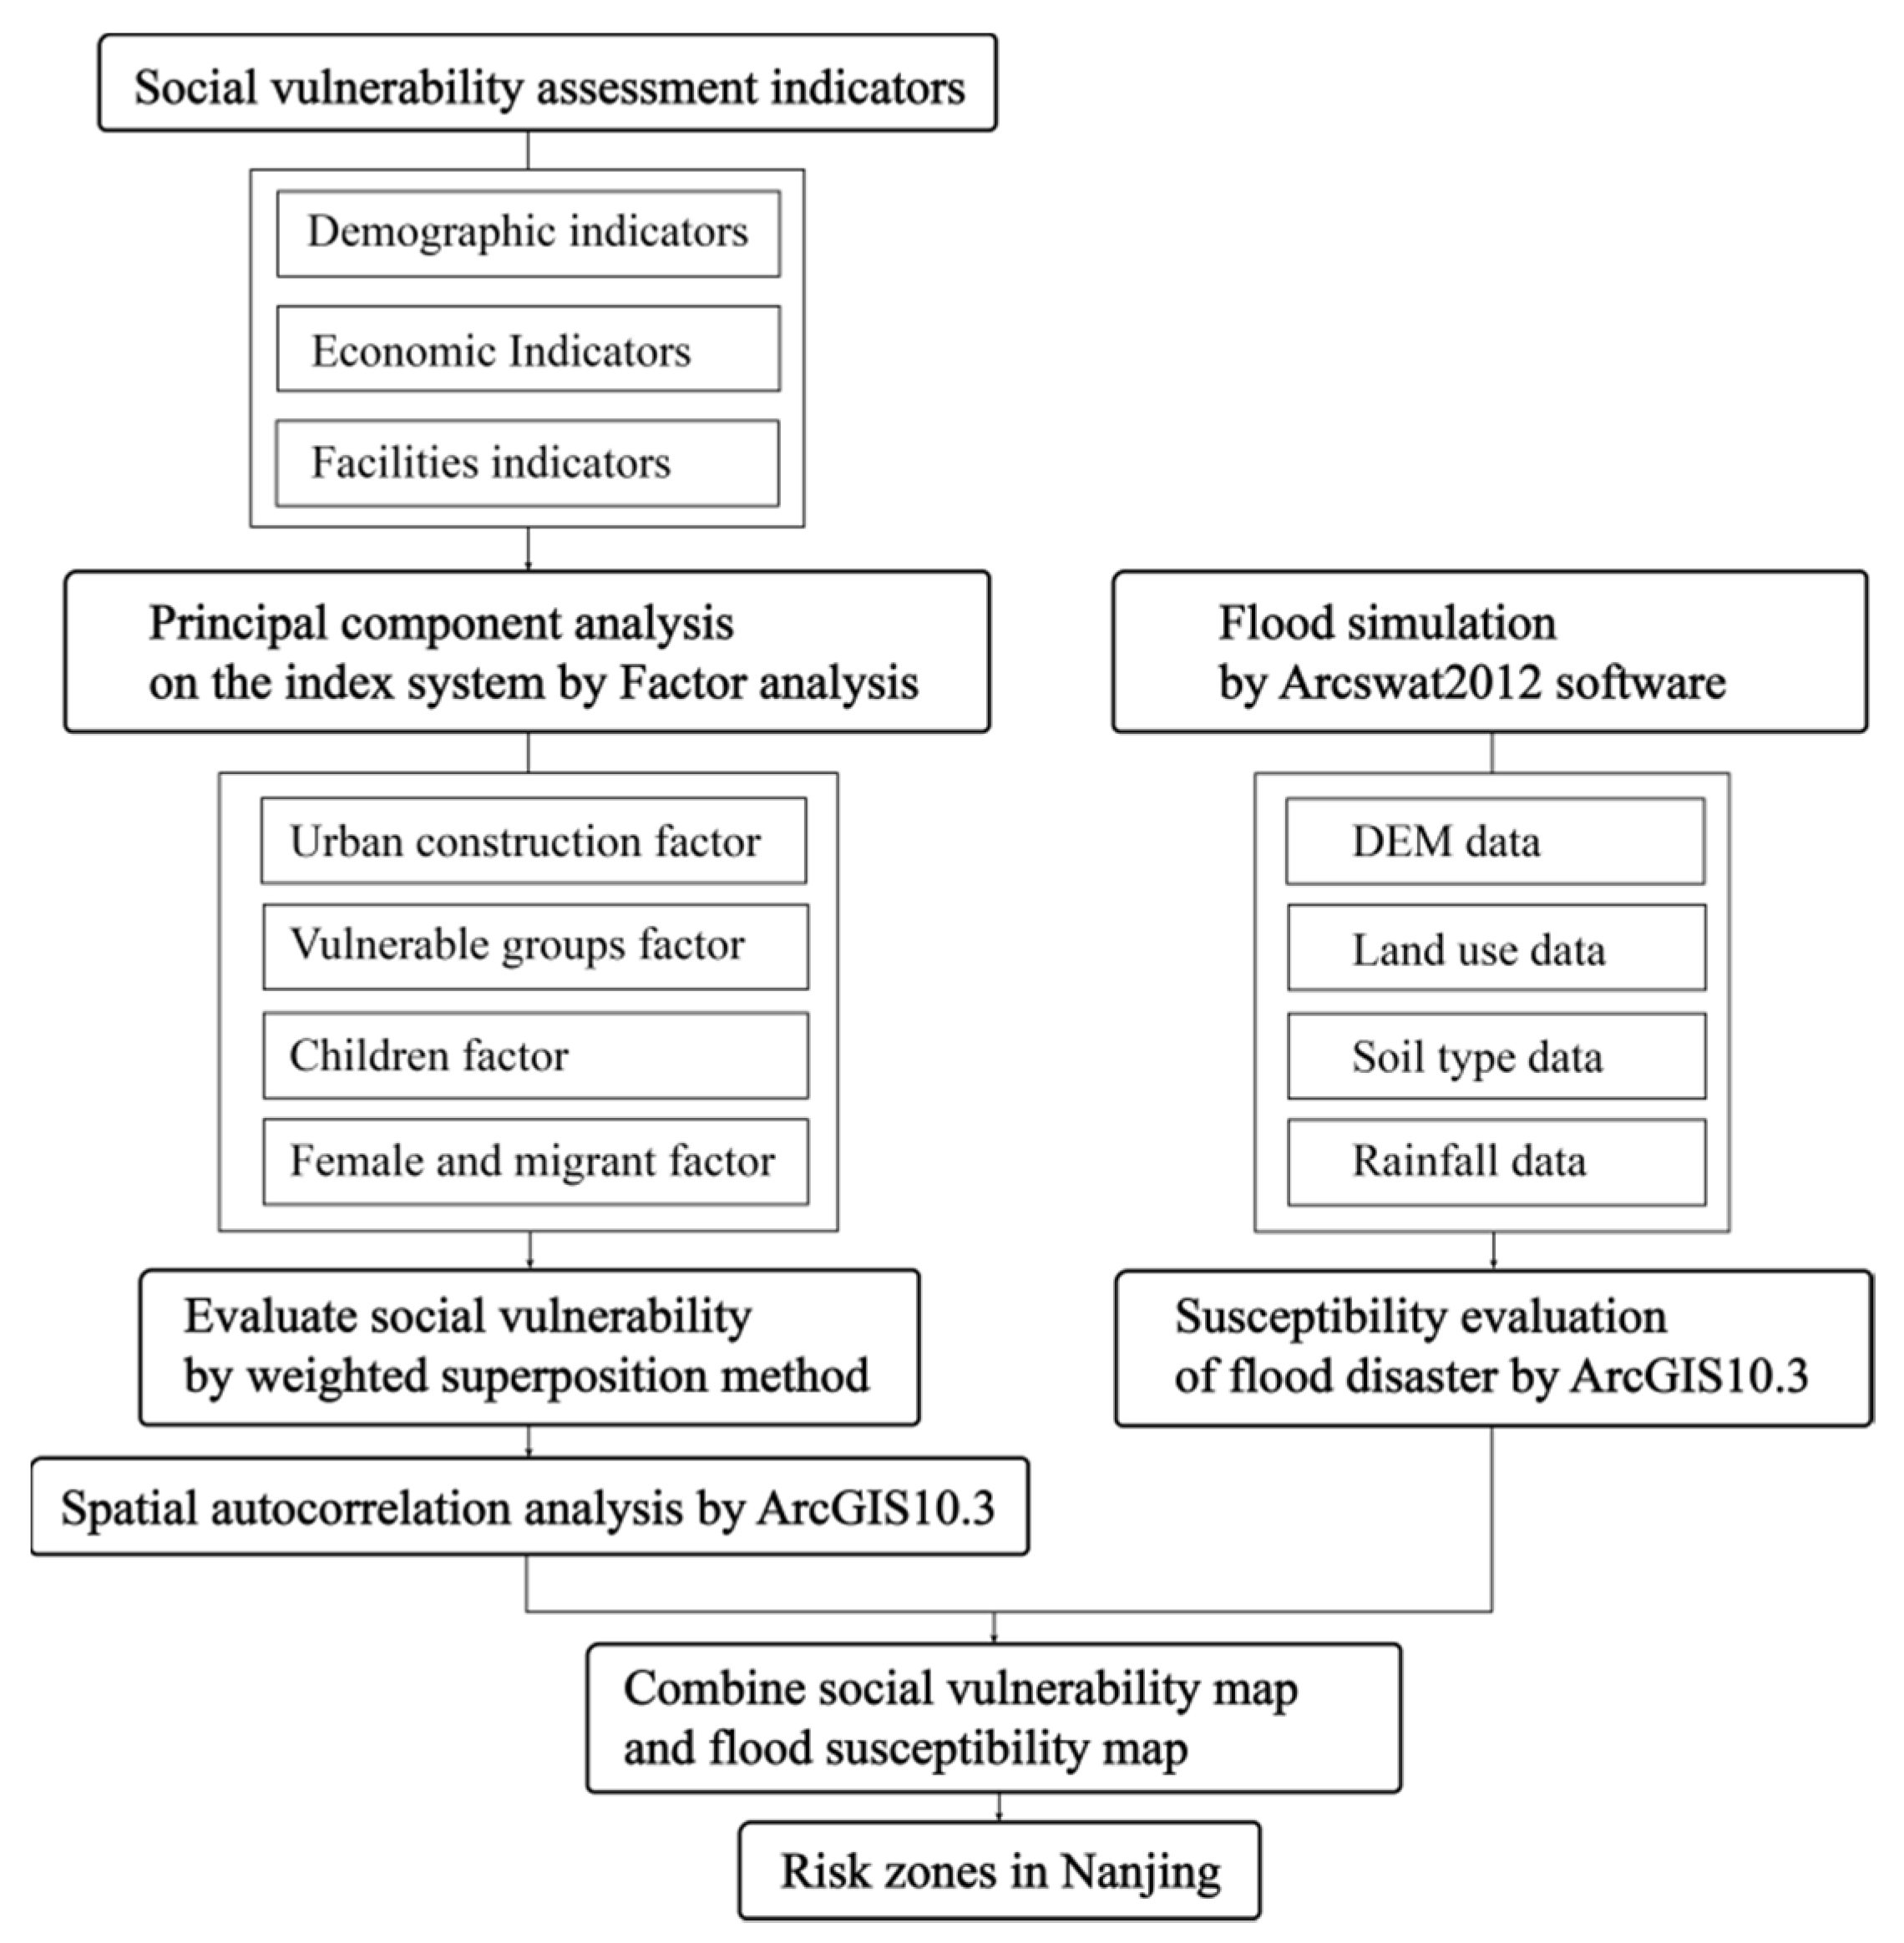
3. Framework and Method
3.1. Framework
3.2. Variables

| Variable | No. | Name | Description and Measurement | Impact | Data Source |
|---|---|---|---|---|---|
| Demographic indicators | [5,9] | ||||
| Age structure | 1 | P75 | Percent of population over 75 years | + | |
| 2 | P14 | Percent of population under 14 years | + | ||
| 3 | PKP | Percent of population under kindergarten and primary school age | + | ||
| Gender | 4 | PFEM | Percent of females | + | |
| Rural | 5 | PAGR | Proportion of agricultural household registration | + | |
| Immigrant | 6 | PMIG | Percent of immigrants | + | |
| Education | 7 | PlowEDU | Percent of low-education population (≤9 years of education) | + | |
| 8 | PILLITER | Percent of illiterate population | + | ||
| Population | 9 | PDNSTY | Population density | + | |
| Economic indicators | [9,35,36] | ||||
| Home value | 10 | AVEHPRI | Average house prices | - | |
| 11 | DRET | Retail density | - | ||
| 12 | AVEHARE | Housing area per capita | - | ||
| Construction density | 13 | DCORP | Corporate density | + | |
| 14 | PCONSTR | Proportion of construction land | + | ||
| Facilities indicators | [5,9,34] | ||||
| Unsafe conditions | 15 | DKIN | Kindergarten density | + | |
| 16 | DPRI | Primary school density | + | ||
| 17 | DMID | Middle school density | + | ||
| 18 | DNURS | Nursing home density | + | ||
| Service facilities | 19 | DBUS | Bus station density | - | |
| 20 | DPS | Park and square density | - | ||
| 21 | DHOSP | Hospital density | - |
3.3. Methods
3.3.1. SoVI Scores
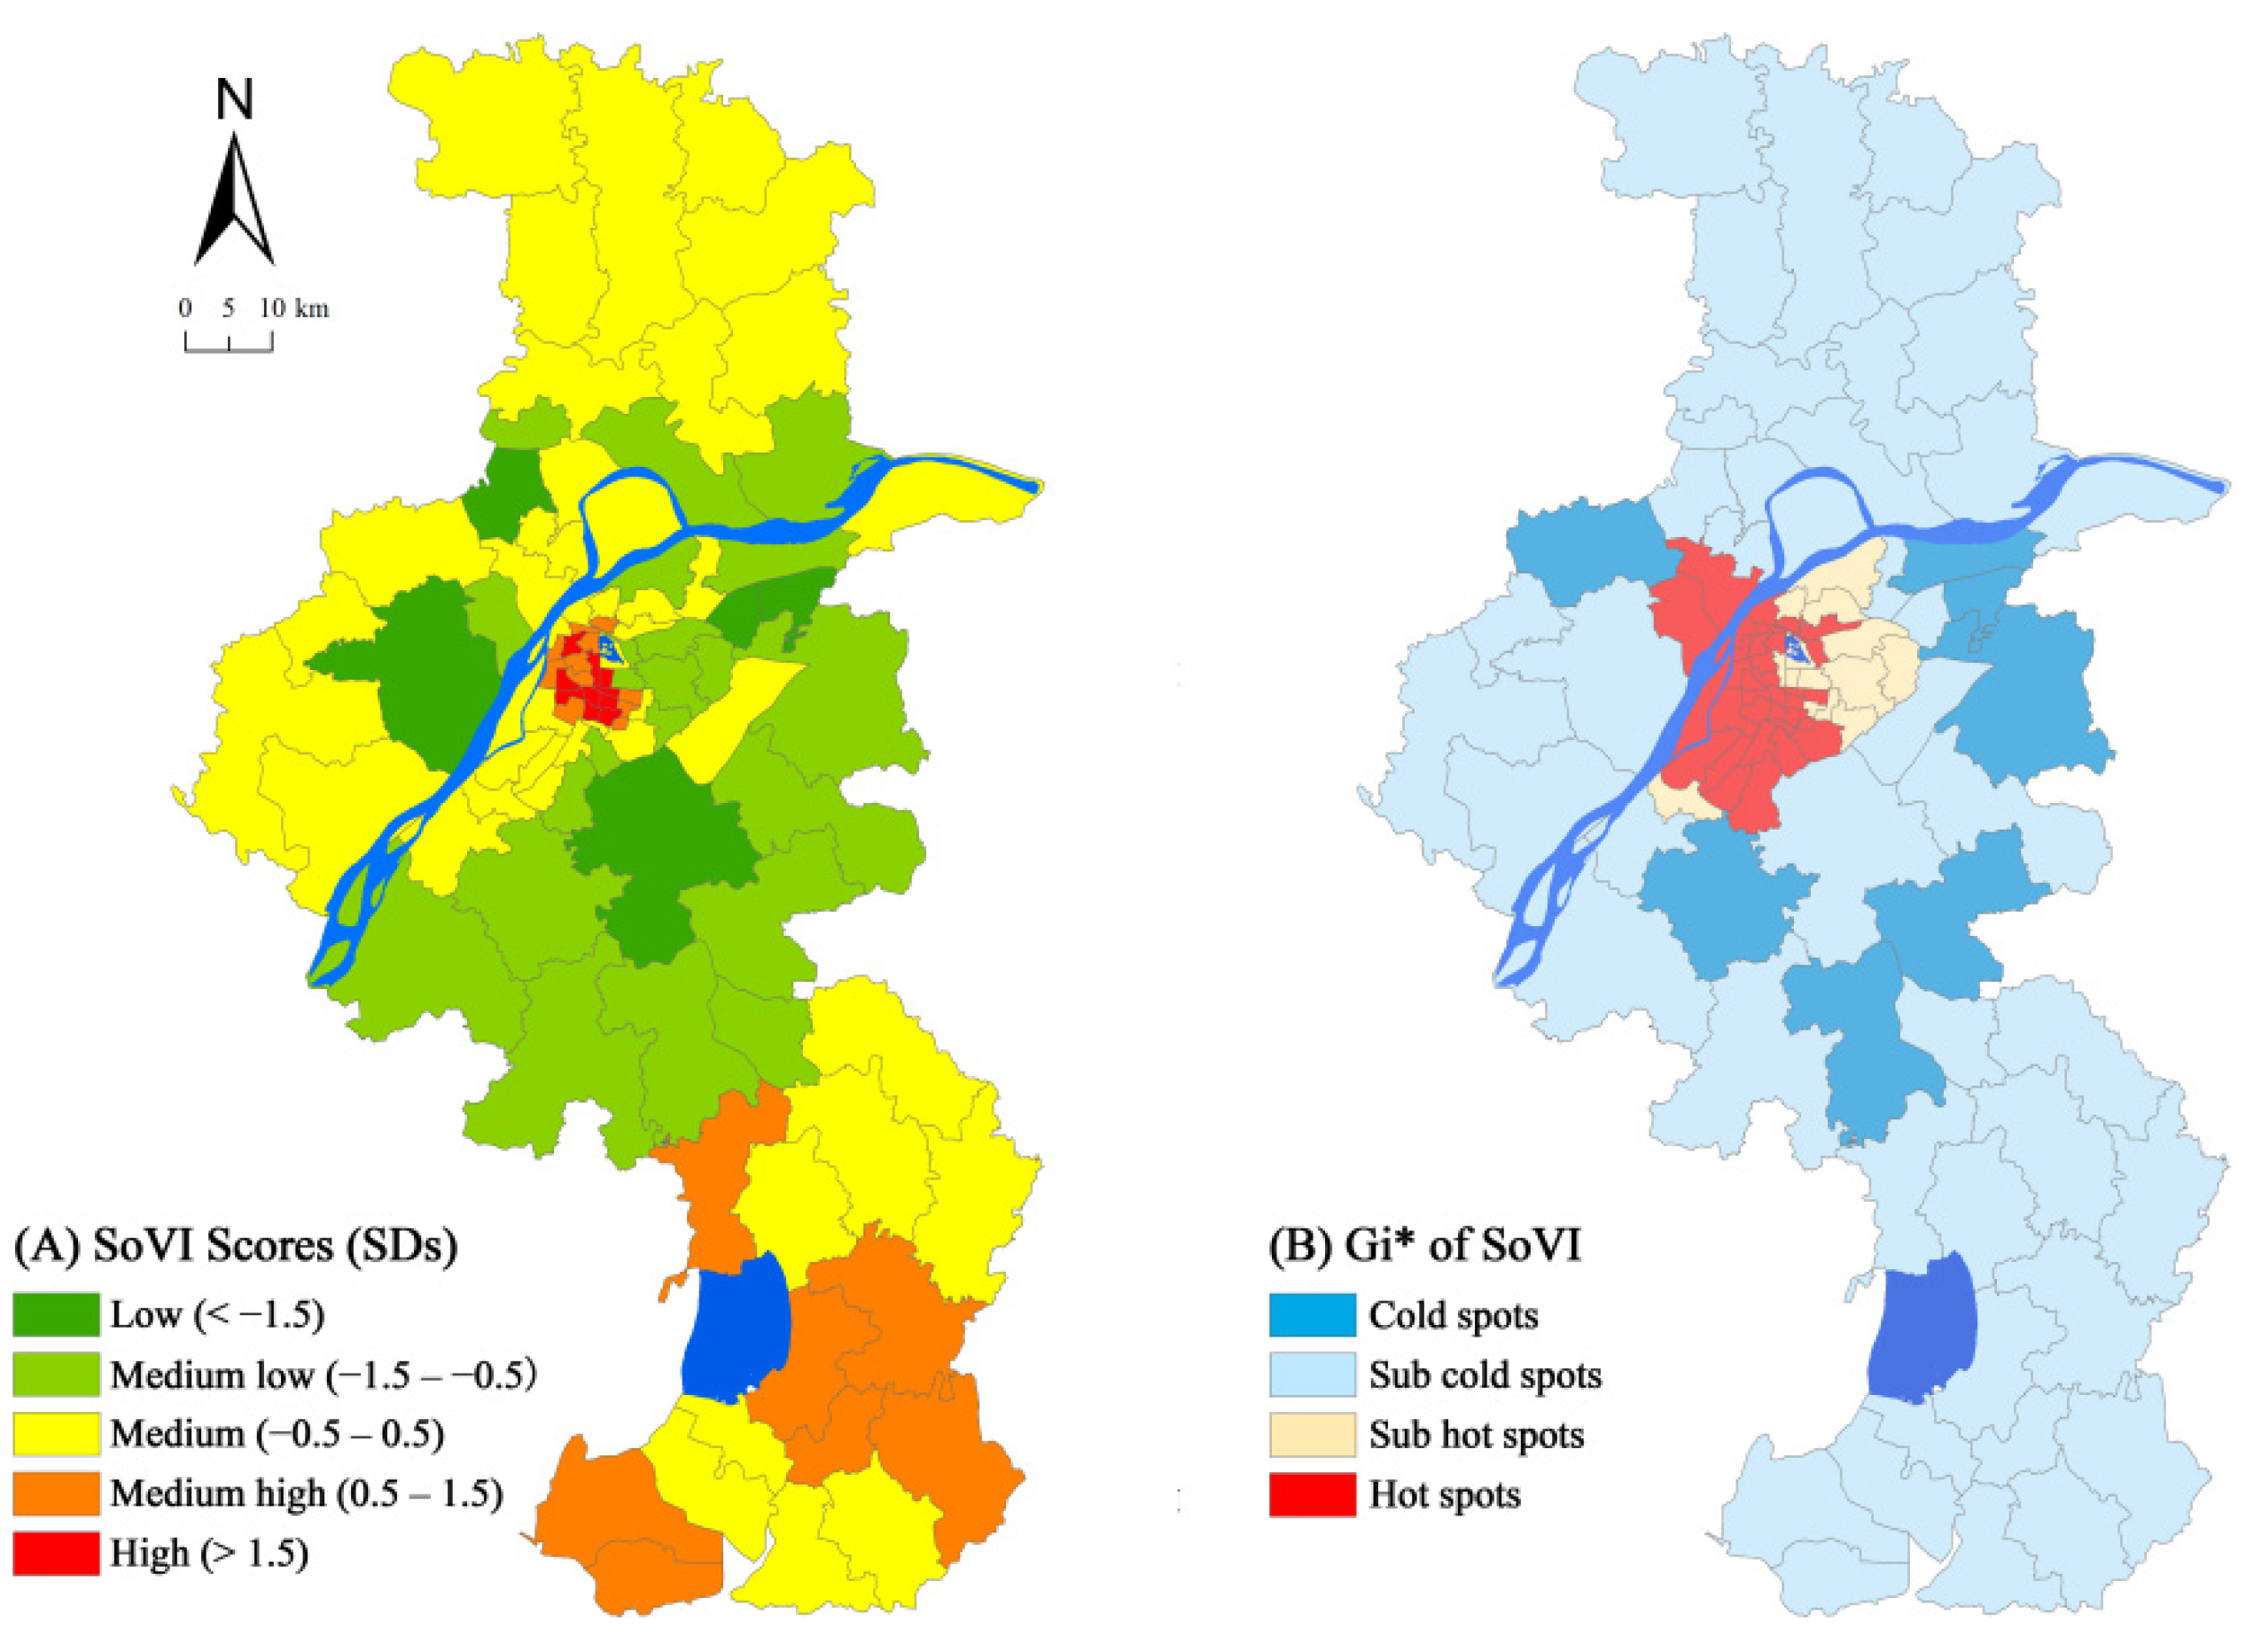
3.3.2. Spatial Pattern of SoVI
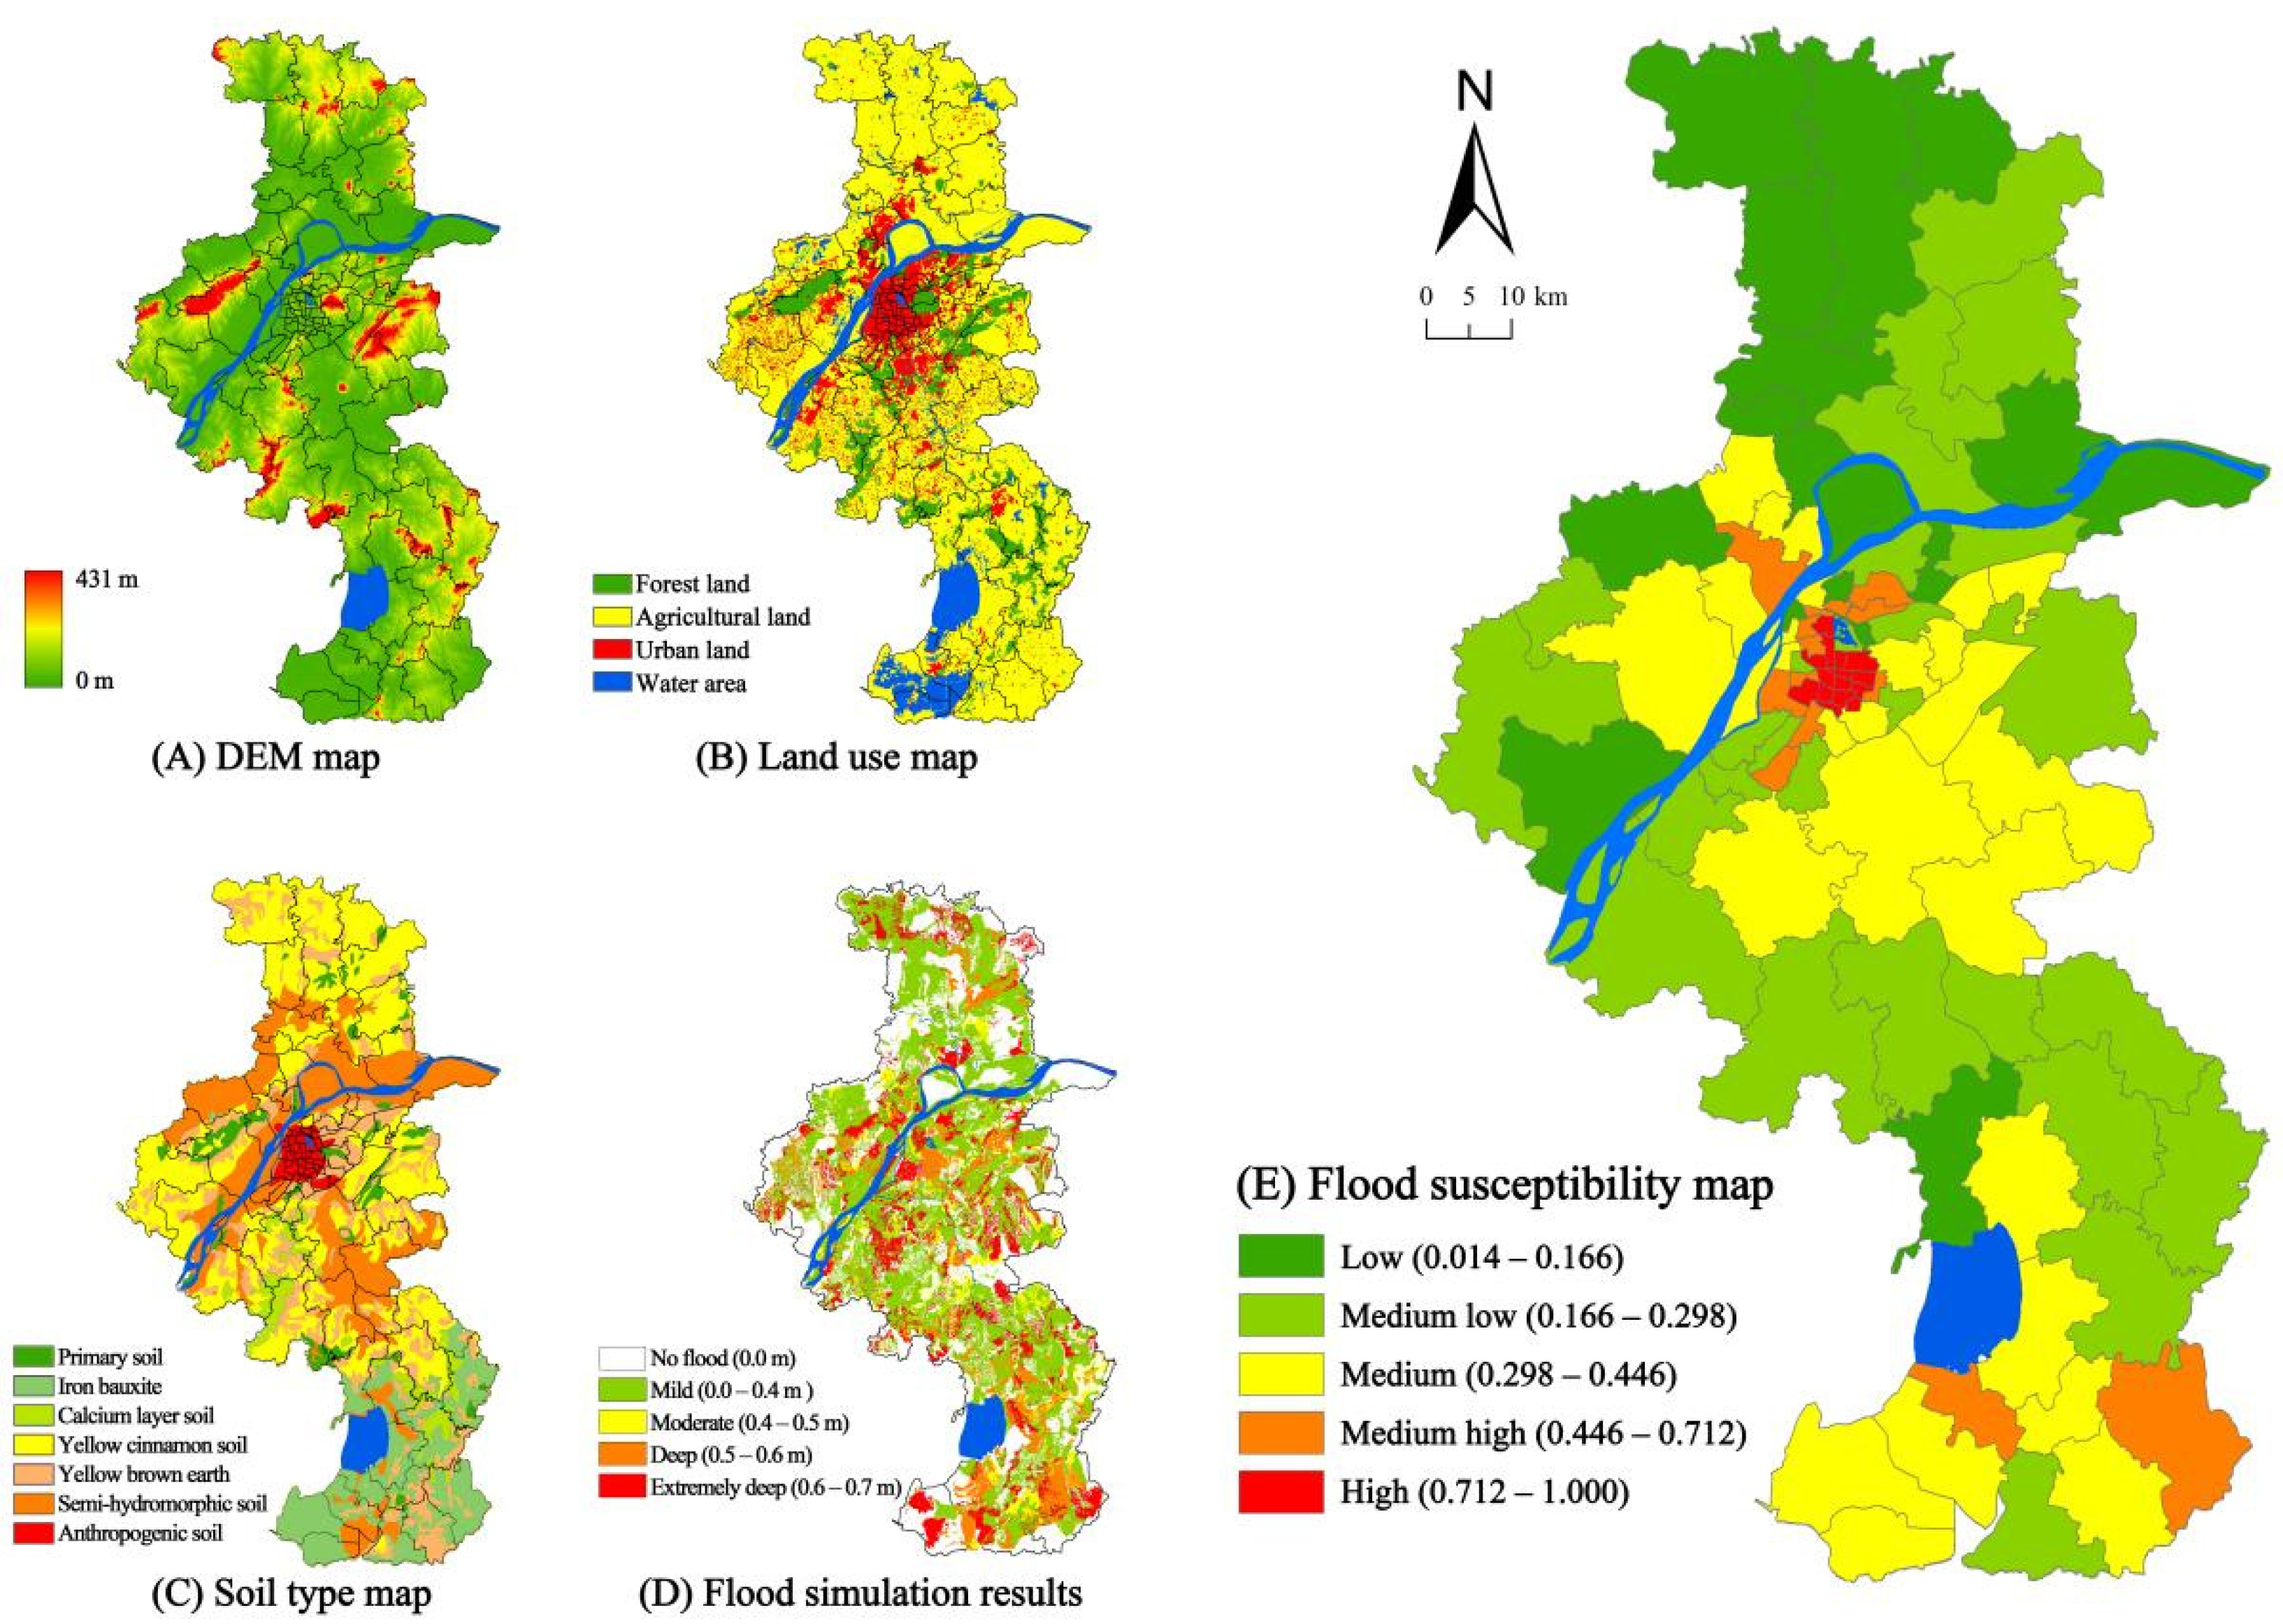
3.3.3. Flood Susceptibility
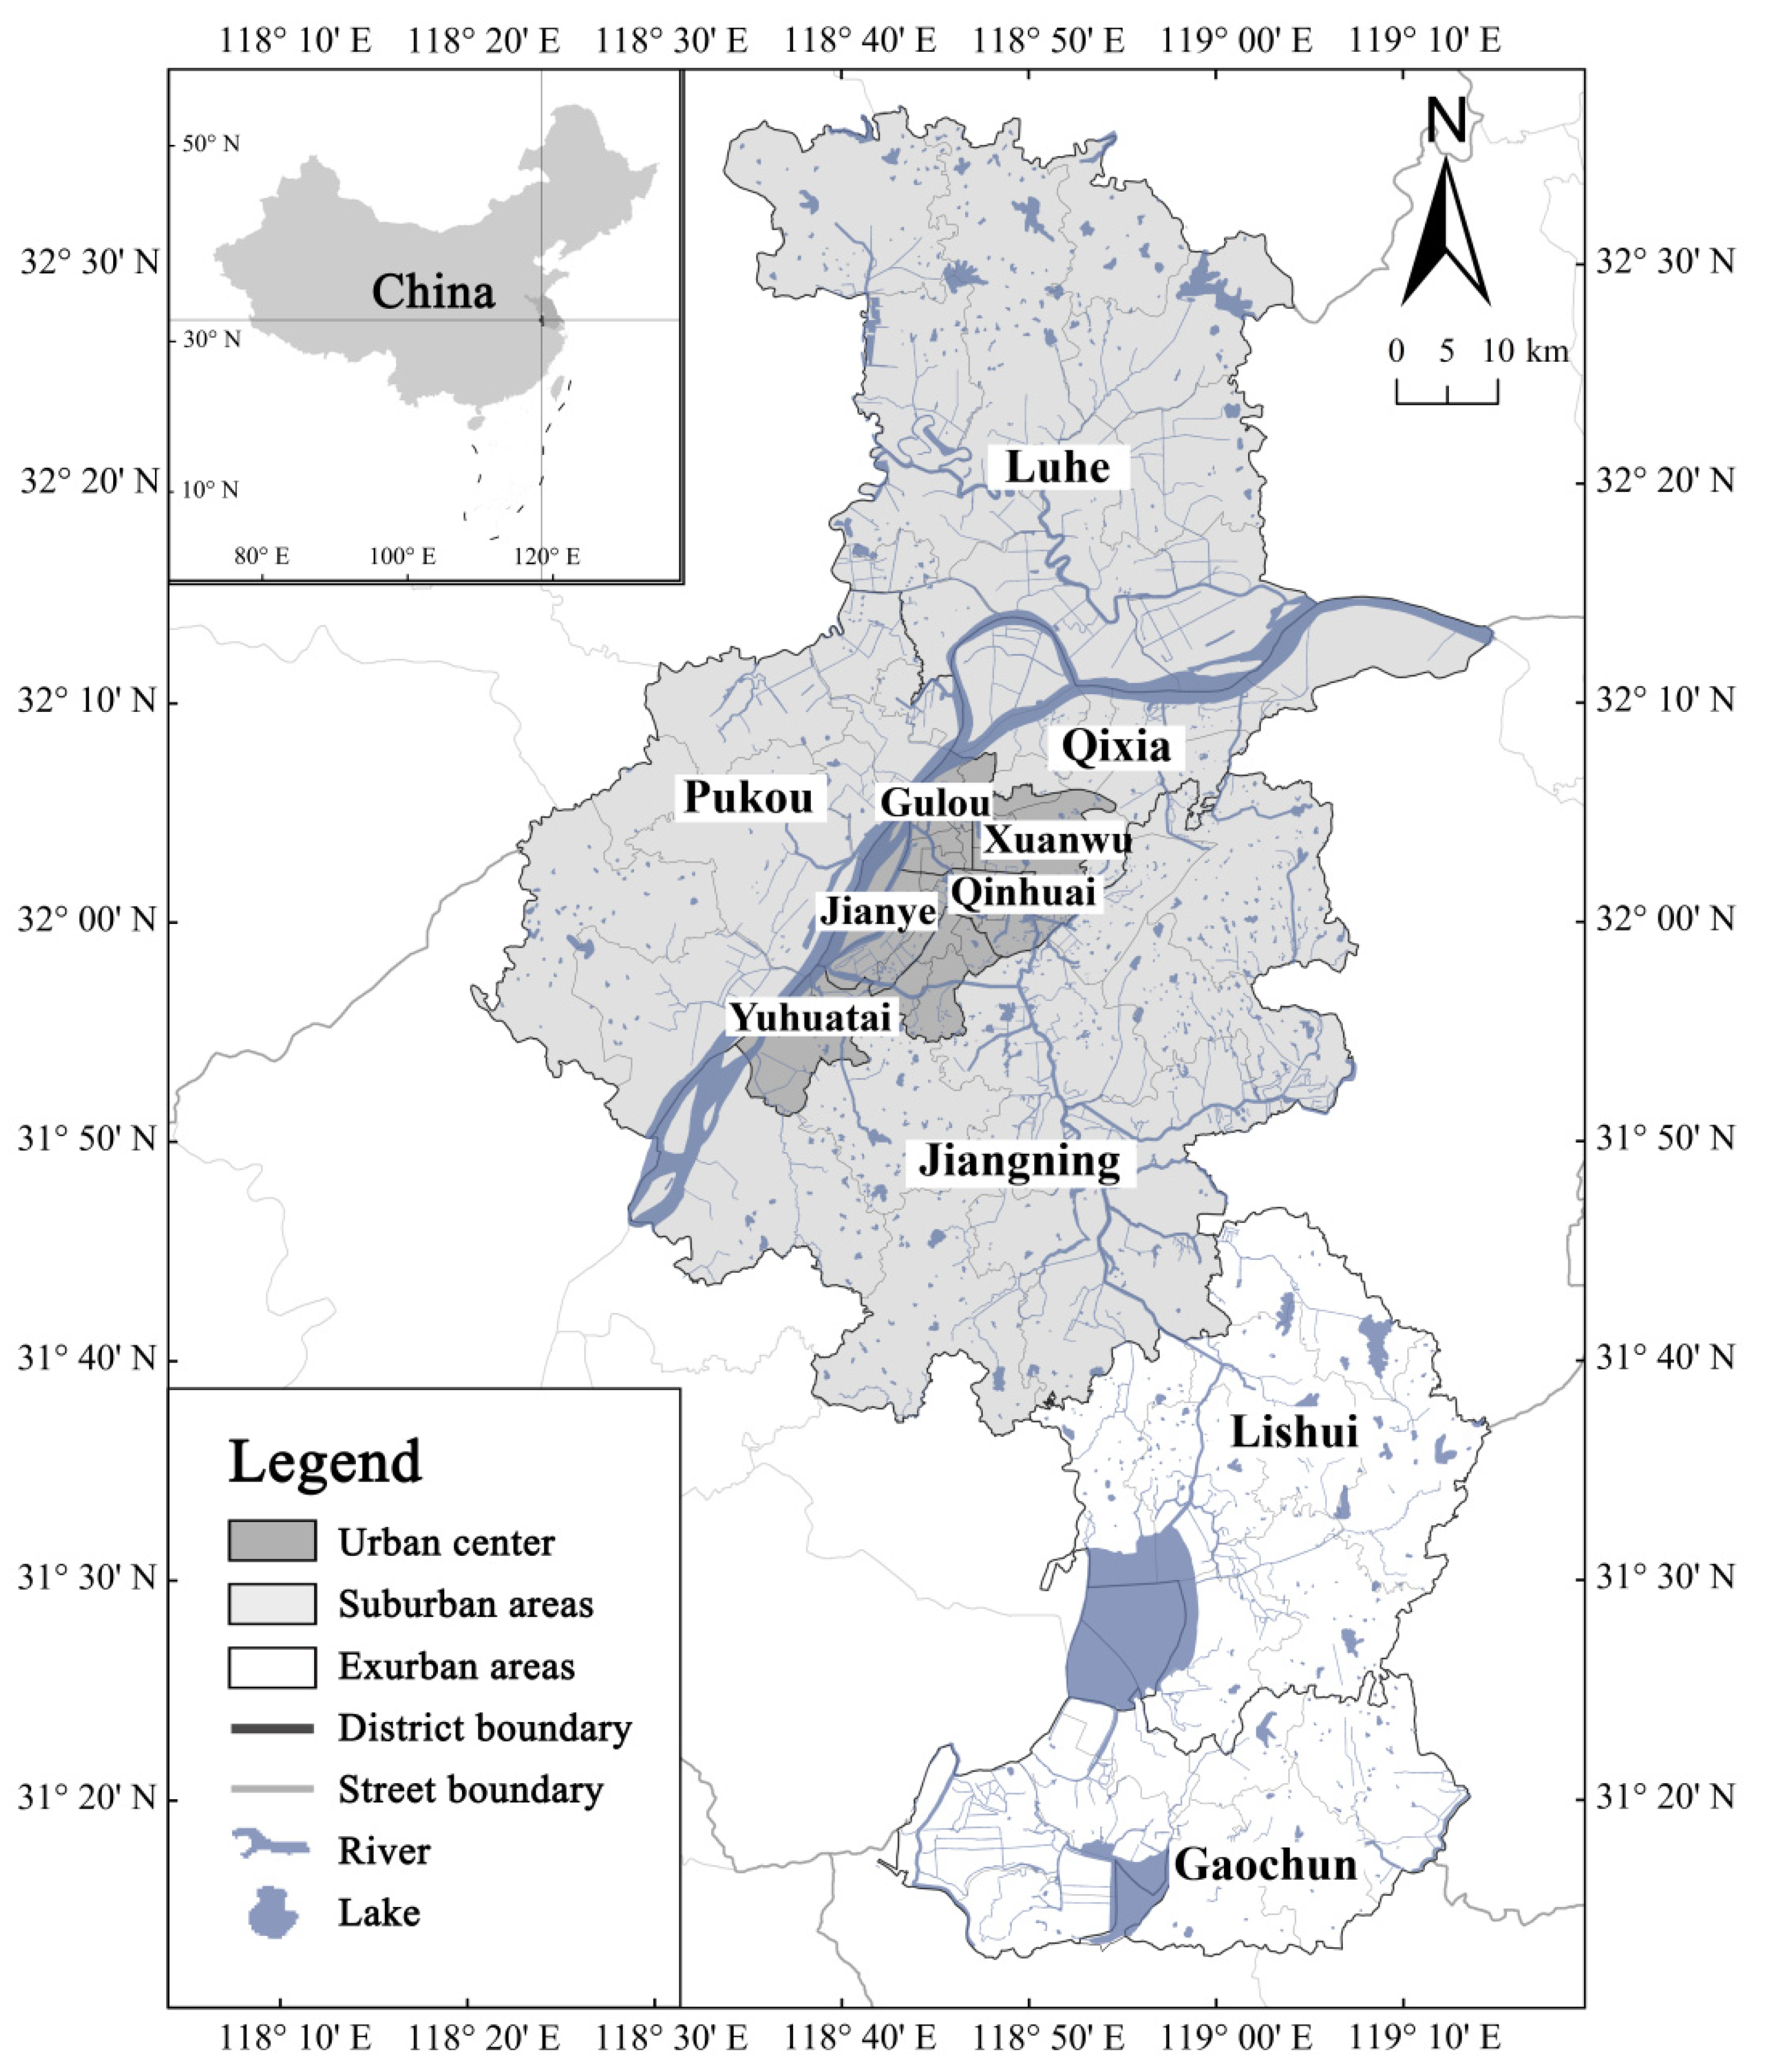
4. Study Area and Data
4.1. Study Area
4.2. Data
4.2.1. Indicators of Social Vulnerability Assessment
4.2.2. Flood Susceptibility Data
5. Results and Discussion
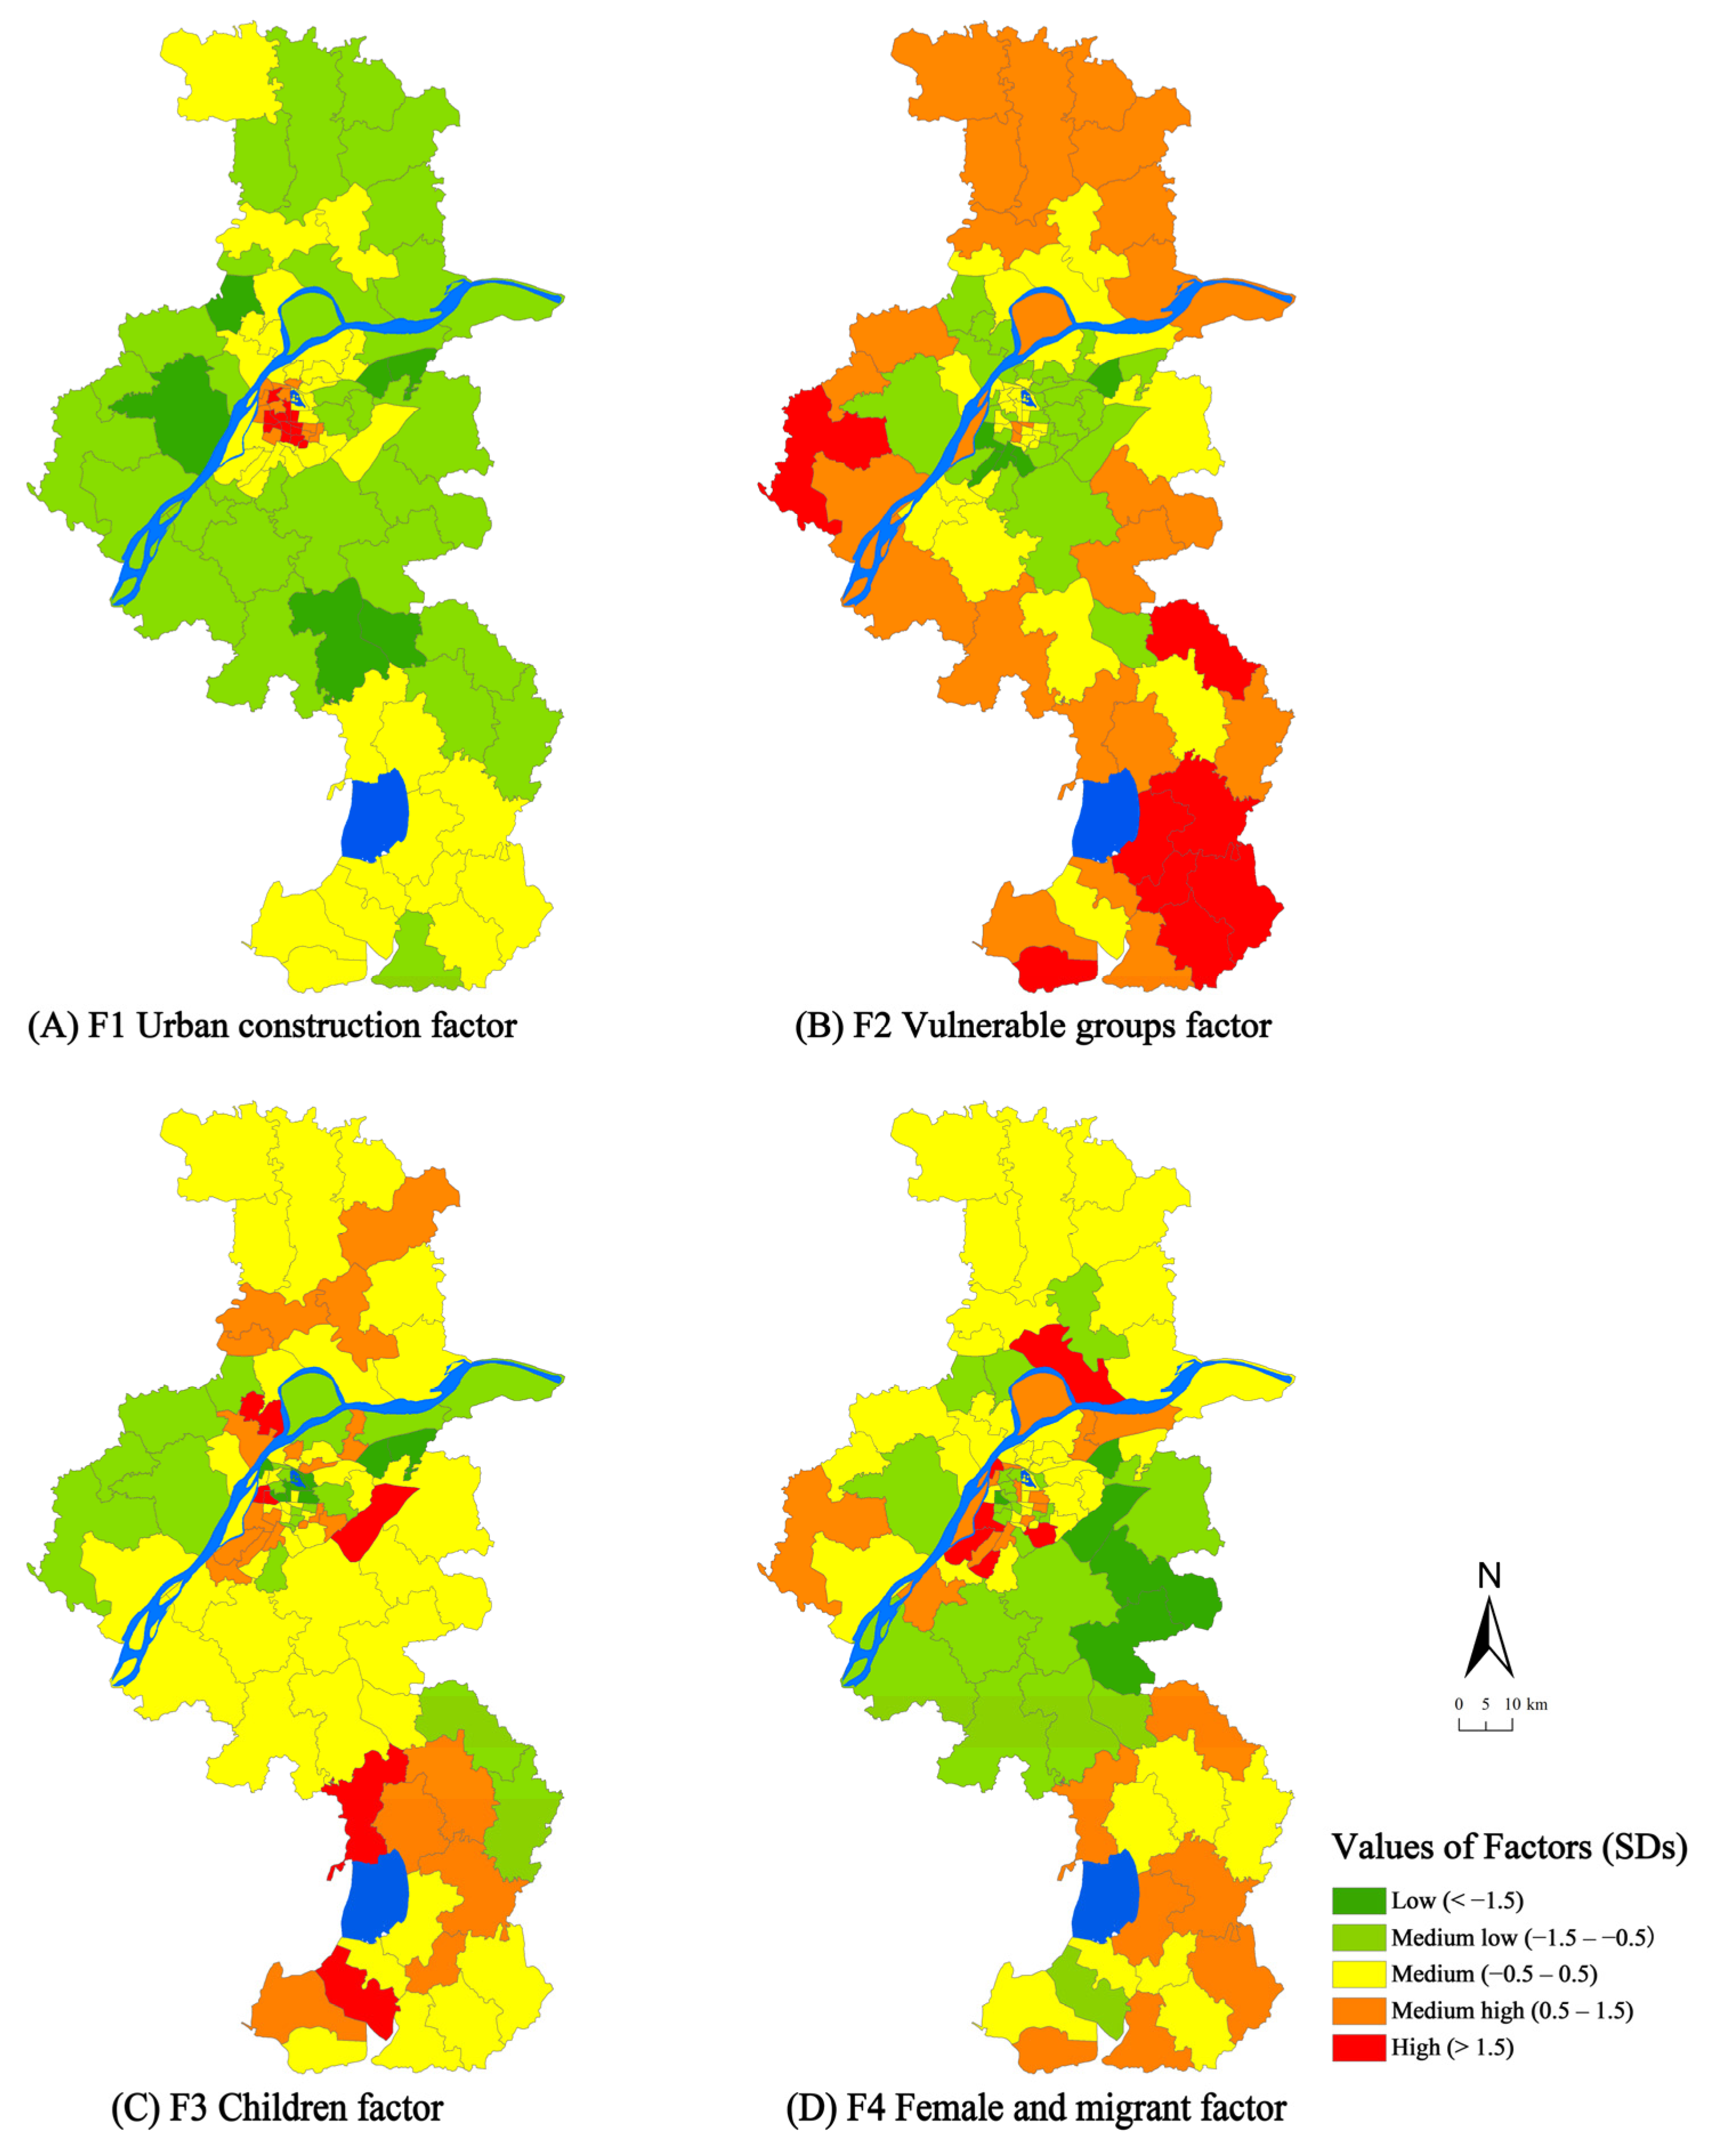
5.1. SoVI Factors
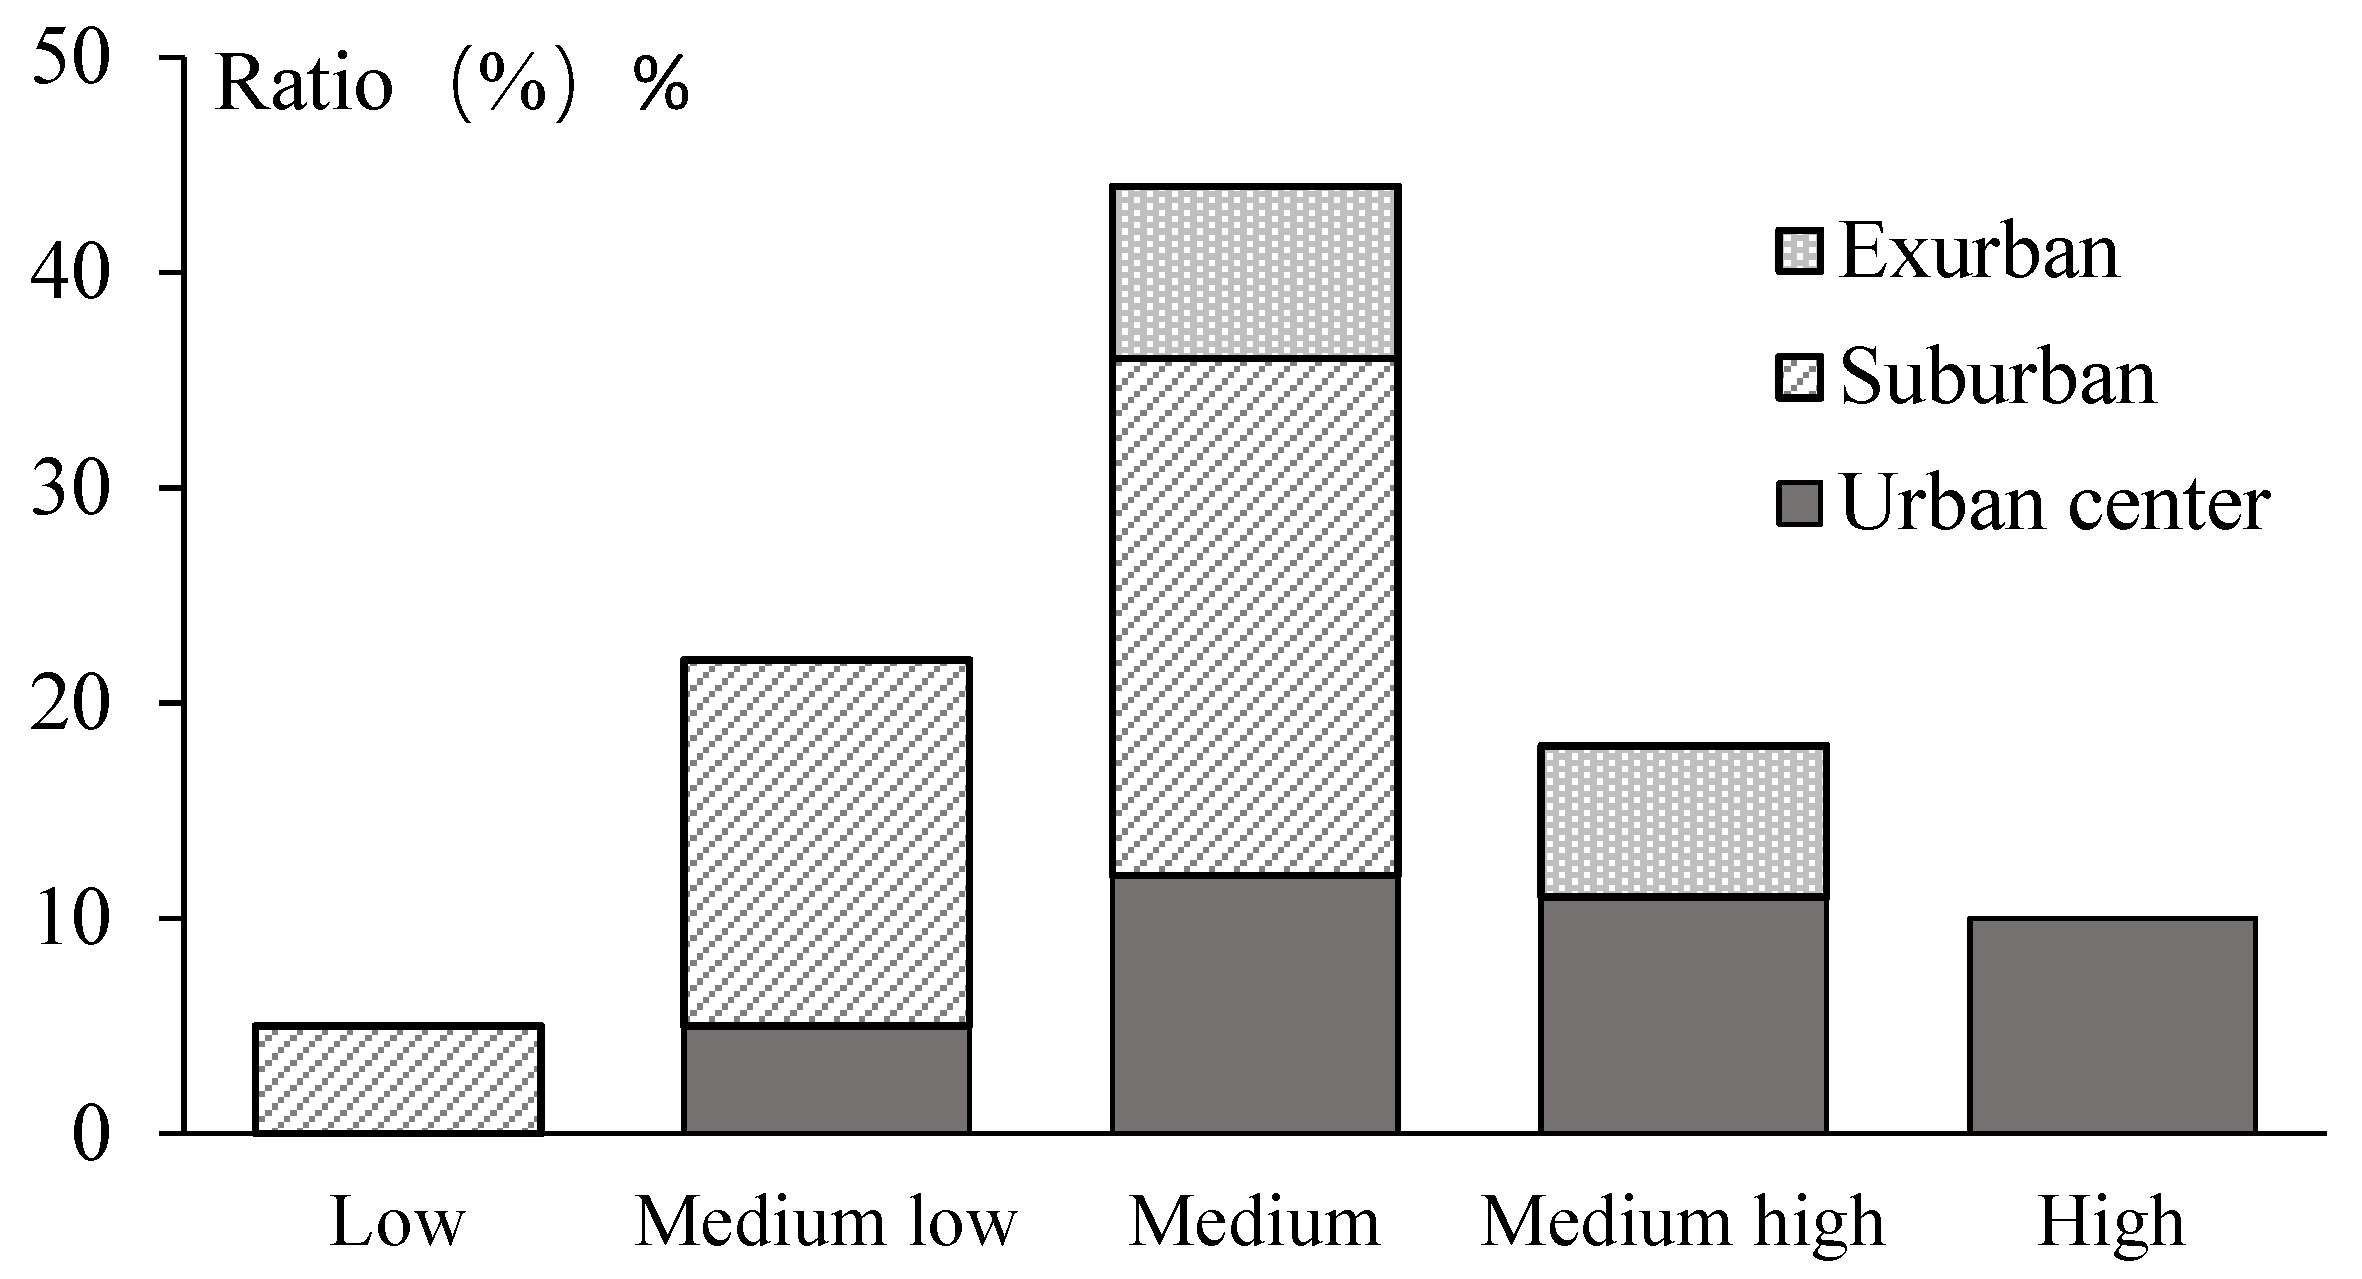
5.2. SoVI Index
5.3. Flood Susceptibility
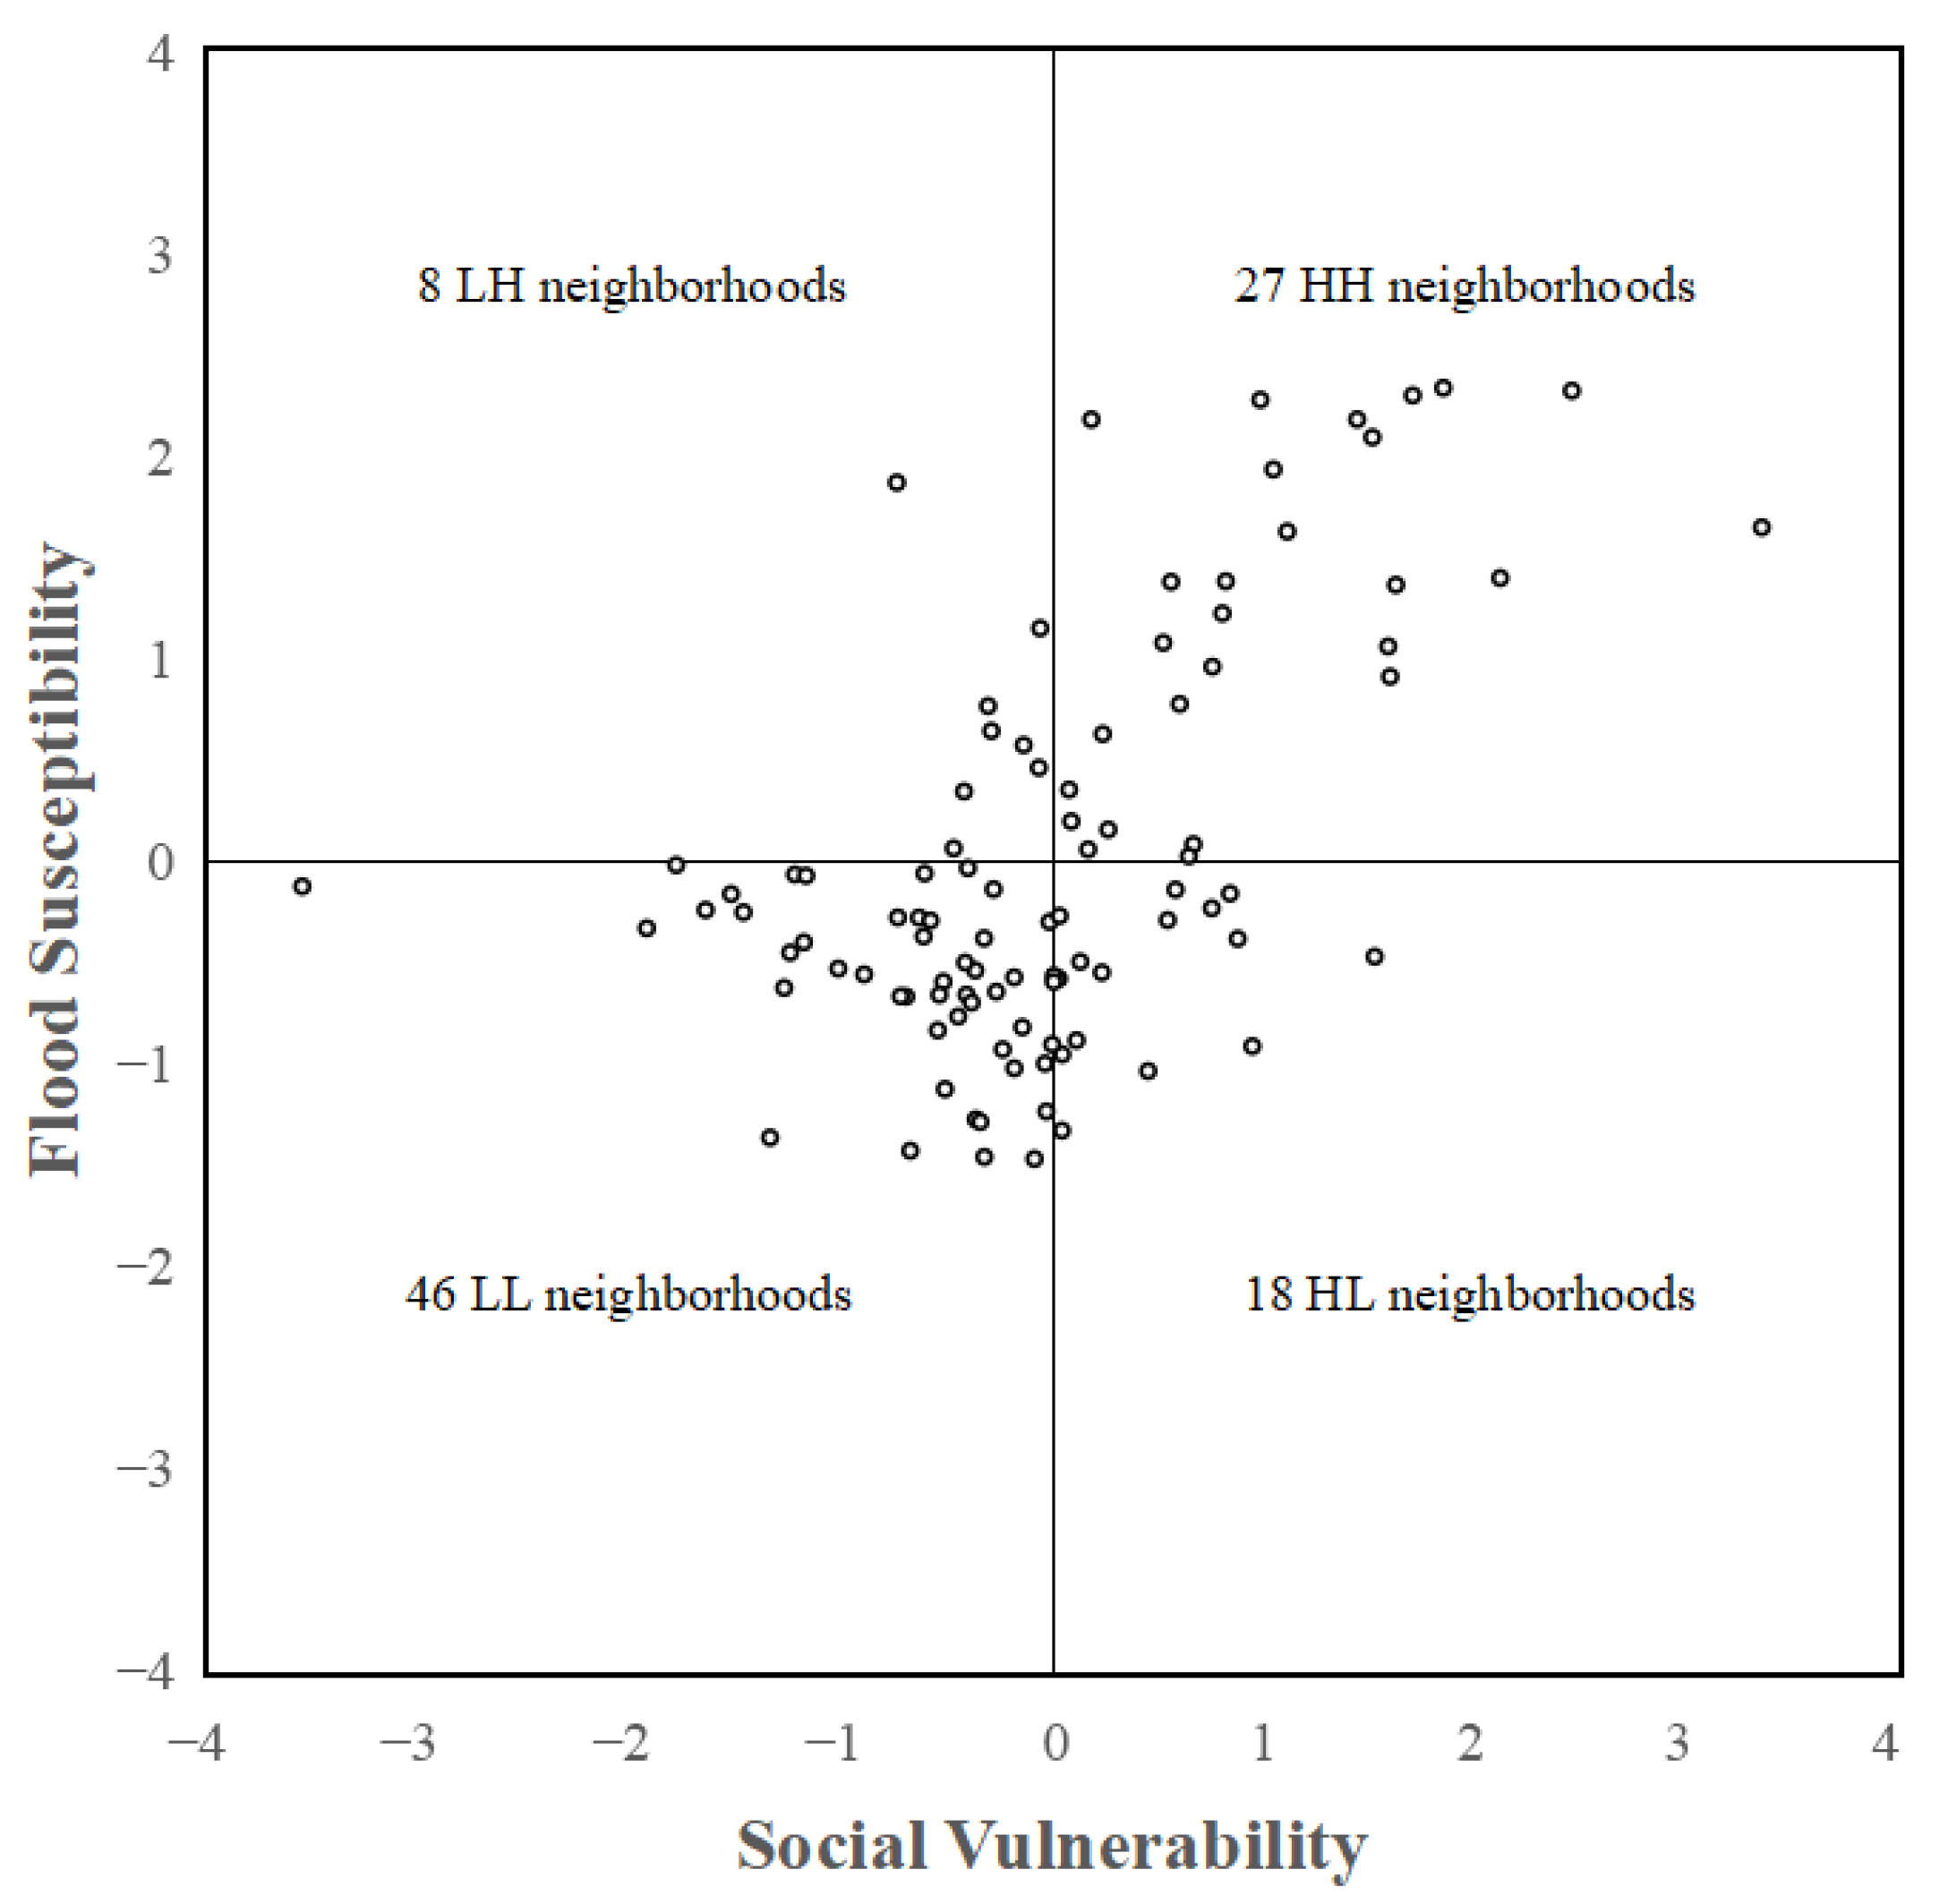
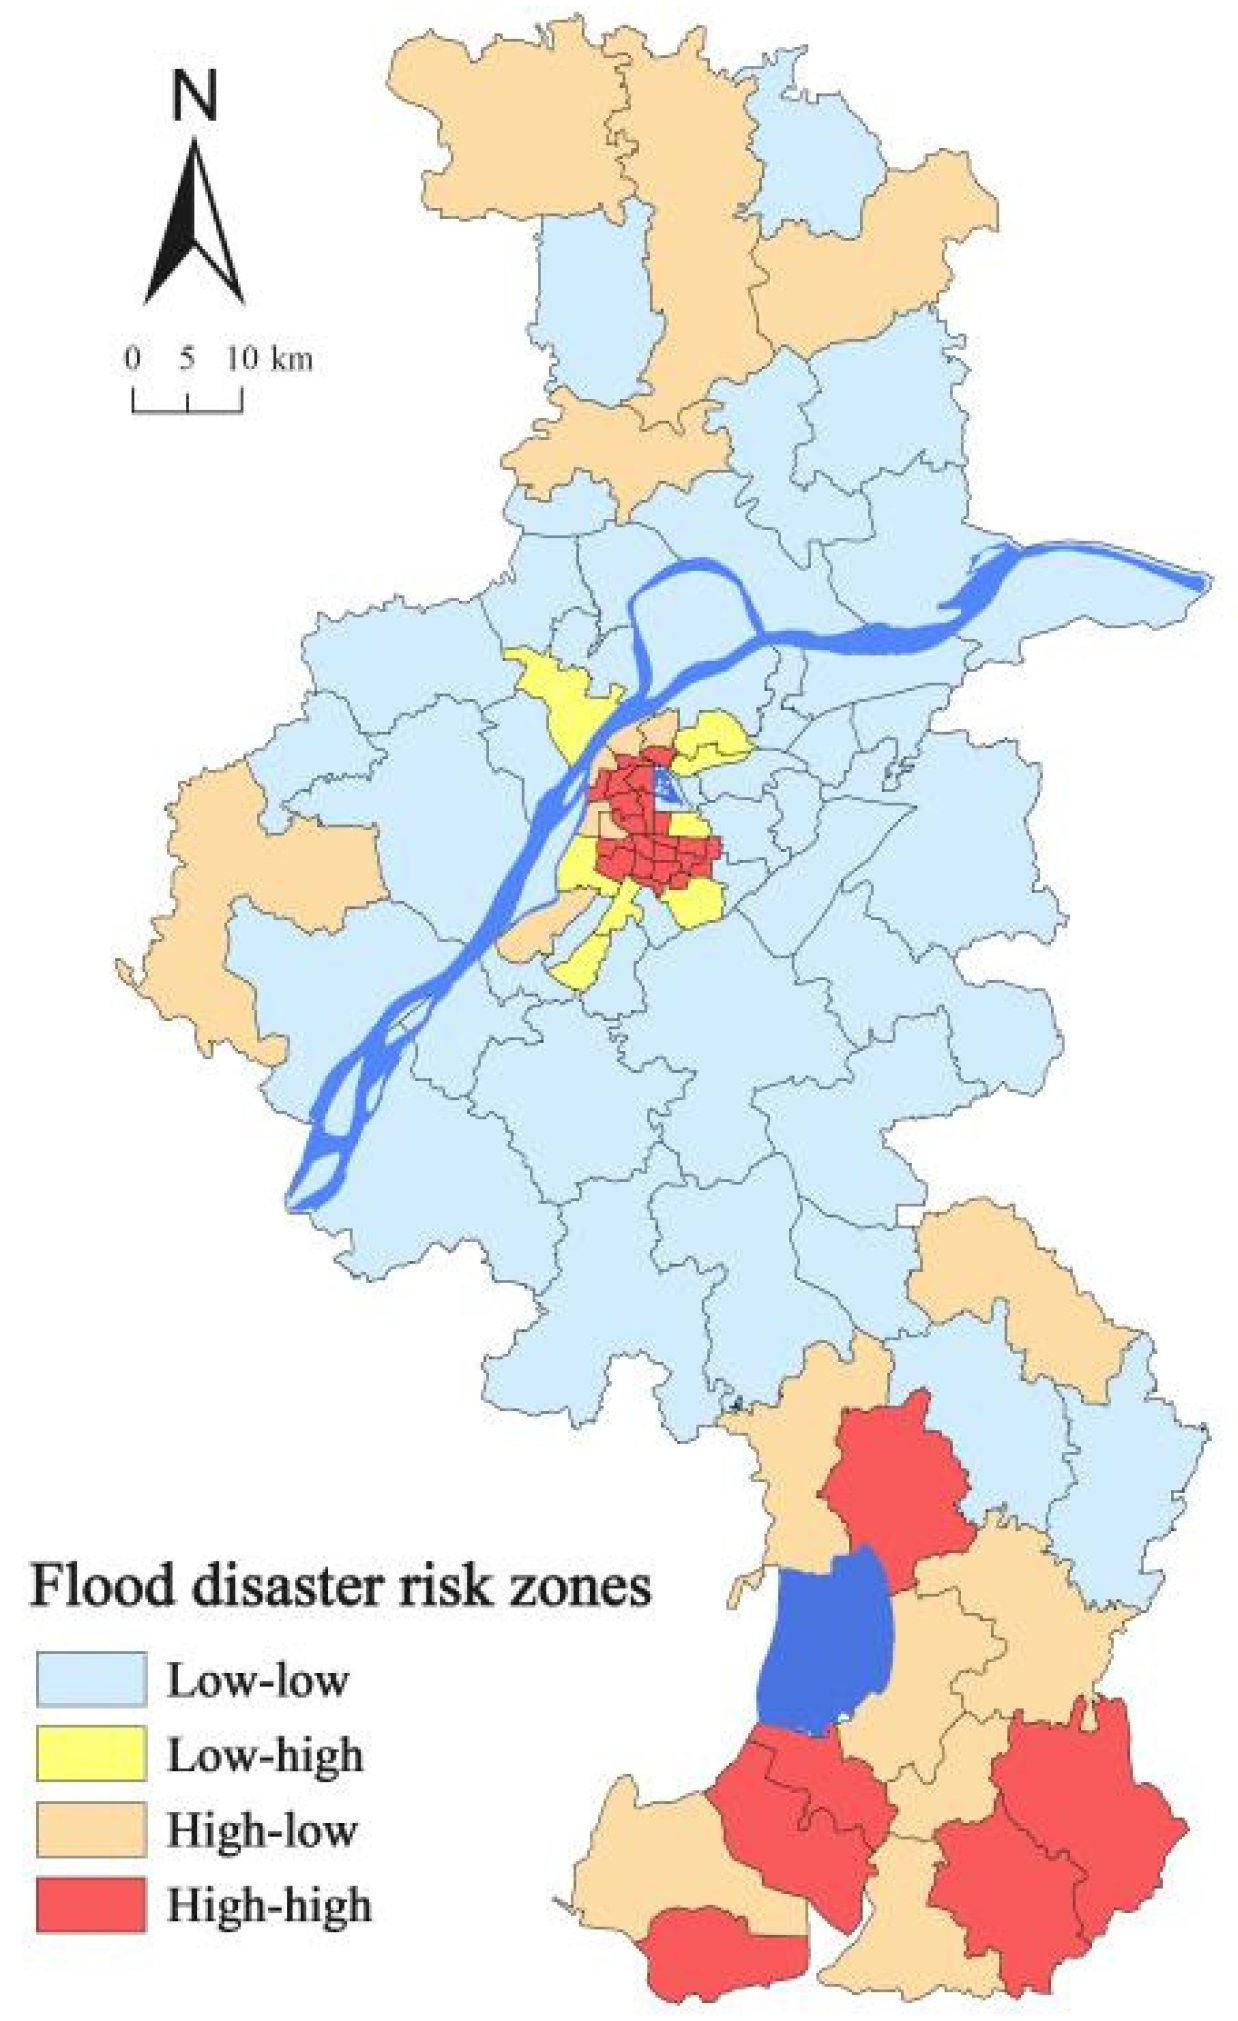
5.4. Combining Flood Susceptibility and Social Vulnerability
6. Conclusions
Author Contributions
Funding
Conflicts of Interest
References
- CRED-UNISDR. The Human Cost of Weather Related Disasters, 1995–2015; Centre for Research on the Epidemiology of Disasters and United Nations Office for Disaster Risk Reduction: Brussels, Belgium, 2015. [Google Scholar]
- Rehman, S.; Sahana, M.; Hong, H.Y.; Sajjad, H.; Ahmed, B.B. A systematic review on approaches and methods used for flood vulnerability assessment: Framework for future research. Nat. Hazards 2019, 96, 975–998. [Google Scholar] [CrossRef]
- Filatova, T. Market-based instruments for flood risk management: A review of theory, practice and perspectives for climate adaptation policy. Environ. Sci. Policy 2014, 37, 227–242. [Google Scholar] [CrossRef]
- Koks, E.E.; Jongman, B.; Husby, T.G.; Botzen, W.J.W. Combining hazard, exposure and social vulnerability to provide lessons for flood risk management. Environ. Sci. Policy 2015, 47, 42–52. [Google Scholar] [CrossRef]
- Cutter, S.L. Social Vulnerability to Environmental Hazards. Soc. Sci. Q. 2003, 84, 242–261. [Google Scholar] [CrossRef]
- de Sherbin, A.; Bardy, G. Social vulnerability to floods in two coastal megacities: New York City and Mumbai. Vienna Yearb. Popul. Res. 2015, 13, 131–165. [Google Scholar] [CrossRef] [Green Version]
- Fekete, A. Validation of a social vulnerability index in context to river-floods in Germany. Nat. Hazards Earth Syst. Sci. 2009, 9, 393–403. [Google Scholar] [CrossRef] [Green Version]
- Holand, I.S.; Lujala, P.; Rod, J.K. Social vulnerability assessment for Norway: A quantitative approach. Nor. Geogr. Tidsskr. Nor. J. Geogr. 2011, 65, 1–17. [Google Scholar] [CrossRef]
- Birkmann, J.; Cardona, O.D.; Carreño, M.L.; Barbat, A.H.; Pelling, M.; Schneiderbauer, S.; Kienberger, S.; Keiler, M.; Alexander, D.; Zeil, P.; et al. Framing vulnerability, risk and societal responses: The MOVE framework. Nat. Hazards 2013, 67, 193–211. [Google Scholar] [CrossRef]
- Cutter, S.L.; Finch, C. Temporal and spatial changes in social vulnerability to natural hazards. Proc. Natl. Acad. Sci. USA 2008, 105, 2301–2306. [Google Scholar] [CrossRef] [PubMed] [Green Version]
- Fekete, A. Social vulnerability change assessment: Monitoring longitudinal demographic indicators of disaster risk in Germany from 2005 to 2015. Nat. Hazards 2019, 95, 585–614. [Google Scholar] [CrossRef]
- Oulahen, G.; Mortsch, L.; Tang, K.; Harford, D. Unequal Vulnerability to Flood Hazards: “Ground Truthing” a Social Vulnerability Index of Five Municipalities in Metro Vancouver, Canada. Ann. Assoc. Am. Geogr. 2015, 105, 473–495. [Google Scholar] [CrossRef]
- Roncancio, D.J.; Nardocci, A.C. Social vulnerability to natural hazards in So Paulo, Brazil. Nat. Hazards 2016, 84, 1–17. [Google Scholar] [CrossRef]
- Hewitt, K. Interpretation of Calamity: From the Viewpoint of Human Ecology; Routledge: London, UK, 1983; ISBN 9780429329579. [Google Scholar]
- Wisner, B.; Blaikie, P.; Cannon, T.; Davis, I. At Risk, Natural Hazards, People’s Vulnerability and Disasters; Routledge: London, UK, 2004; ISBN 9780203974575. [Google Scholar]
- Chen, L.; Liu, L.; Pei, J.; Deng, M. An ensemble risk assessment model for urban rainstorm disasters based on random forest and deep belief nets: A case study of Nanjing, China. Nat. Hazards 2021, 107, 2671–2692. [Google Scholar] [CrossRef]
- Guillard-Gonçalves, C.; Cutter, S.L.; Emrich, C.T.; Zêzere, J.L. Application of Social Vulnerability Index (SoVI) and delineation of natural risk zones in Greater Lisbon, Portugal. J. Risk Res. 2014, 18, 651–674. [Google Scholar] [CrossRef]
- Saha, T.K. How far spatial resolution affects the ensemble machine learning based flood susceptibility prediction in data sparse region. J. Environ. Manag. 2021, 297, 113344. [Google Scholar] [CrossRef]
- Jongman, B.; Kreibich, H.; Apel, H.; Barredo, J.I.; Bates, P.D.; Feyen, L.; Gericke, A.; Neal, J.; Aerts, J.C.J.H.; Ward, P.J. Comparative flood damage model assessment: Towards a European approach. Nat. Hazards Earth Syst. Sci. 2012, 12, 3733–3752. [Google Scholar] [CrossRef] [Green Version]
- Roder, G.; Sofia, G.; Wu, Z.; Tarolli, P. Assessment of Social Vulnerability to Floods in the Floodplain of Northern Italy. Weather Clim. Soc. 2017, 9, 717–737. [Google Scholar] [CrossRef]
- Hadipour, V.; Vafaie, F.; Kerle, N. An indicator-based approach to assess social vulnerability of coastal areas to sea-level rise and flooding: A case study of Bandar Abbas city, Iran. Ocean. Coast. Manag. 2020, 188, 105077. [Google Scholar] [CrossRef]
- Zeng, J.; Zhu, Z.Y.; Zhang, J.L.; Ouyang, T.P.; Qiu, S.; Zou, Y.; Zeng, T. Social vulnerability assessment of natural hazards on county-scale using high spatial resolution satellite imagery: A case study in the Luogang district of Guangzhou, South China. Environ. Earth Sci. 2012, 65, 173–182. [Google Scholar] [CrossRef]
- Zhang, N.; Huang, H. Social vulnerability for public safety: A case study of Beijing, China. Chin. Sci. Bull. 2013, 58, 2387–2394. [Google Scholar] [CrossRef] [Green Version]
- Zhou, Y.; Li, N.; Wu, W.; Wu, J.; Shi, P. Local spatial and temporal factors influencing population and societal vulnerability to natural disasters. Risk Anal. Off. Publ. Soc. Risk Anal. 2014, 34, 614–639. [Google Scholar] [CrossRef] [PubMed]
- Huang, J.; Su, F.; Zhang, P. Measuring social vulnerability to natural hazards in Beijing-Tianjin-Hebei Region, China. Chin. Geogr. Sci. 2015, 25, 472–485. [Google Scholar] [CrossRef]
- Ge, Y.; Wen, D.; Dai, J. A New Approach to Identify Social Vulnerability to Climate Change in the Yangtze River Delta. Sustainability 2017, 9, 2236. [Google Scholar] [CrossRef] [Green Version]
- Gu, H.; Du, S.; Liao, B.; Wen, J.; Wang, C.; Chen, R.; Chen, B. A hierarchical pattern of urban social vulnerability in Shanghai, China and its implications for risk management. Sustain. Cities Soc. 2018, 41, 170–179. [Google Scholar] [CrossRef]
- Song, J.; Chang, Z.; Li, W.; Feng, Z.; Wu, J.; Cao, Q.; Liu, J. Resilience-vulnerability balance to urban flooding: A case study in a densely populated coastal city in China. Cities 2019, 95, 102381. [Google Scholar] [CrossRef]
- Li, Y.; Gong, S.Z.; Zhang, M.; Liu, M.; Sun, C.; Zhao, Y. Vulnerability evaluation of rainstorm disaster based on ESA conceptual framework: A case study of Liaoning province, China. Sustain. Cities Soc. 2021, 64, 102540. [Google Scholar] [CrossRef]
- IPCC. Managing the Risk of Extreme Events and Disasters to Advance Climate Change Adaptation; Special Report of the Intergovernmental Panel on Climate Change; Cambridge University Press: Cambridge, UK, 2012; ISBN 978-1-107-60780-4. [Google Scholar]
- Barnett, J. Adapting to climate change in Pacific Island countries: The problem of uncertainty. World Dev. 2001, 29, 977–993. [Google Scholar] [CrossRef] [Green Version]
- Rose, A. Economic Principles, Issues, and Research Priorities in Hazard Loss Estimation; Springer: New York, NY, USA, 2004; ISBN 978-3-540-24787-6. [Google Scholar]
- Oulahen, G.; Mortsch, L.; Connell, E.O.; Harford, D.; Rutledge, A. Local practitioners’ use of vulnerability and resilience concepts in adaptation to flood hazards. Clim. Chang. 2019, 153, 41–58. [Google Scholar] [CrossRef]
- Adger, W.N.; Brooks, N.; Bentham, G.; Agnew, M.D.; Eriksen, S.H. New Indicators of Vulnerability and Adaptive Capacity; Technical Report 7; Tyndall Centre for Climate Change Research: Norwich, UK, 2004. [Google Scholar]
- Andrey, J.; Jones, B. The dynamic nature of social disadvantage: Implications for hazard exposure and vulnerability in Greater Vancouver. Can. Geogr. Le Géographe Can. 2008, 52, 146–168. [Google Scholar] [CrossRef]
- Tate, E. Uncertainty Analysis for a Social Vulnerability Index. Ann. Assoc. Am. Geogr. 2013, 103, 526–543. [Google Scholar] [CrossRef]
- Ochola, S.O.; Eitel, B.; Olago, D.O. Vulnerability of schools to floods in Nyando River catchment, Kenya. Disasters 2010, 34, 732–754. [Google Scholar] [CrossRef]
- Lin, W.Y.; Hung, C.T. Applying spatial clustering analysis to a township-level social vulnerability assessment in Taiwan. Geomatics. Nat. Hazards Risk 2016, 7, 1659–1676. [Google Scholar] [CrossRef] [Green Version]
- Liu, C.L.; Song, W.X. Perspectives of Socio-Spatial Differentiation from Soaring Housing Prices a Case Study in Nanjing, China. Sustainability 2019, 11, 2627. [Google Scholar] [CrossRef] [Green Version]
- Morrow, B.H. Identifying and Mapping Community Vulnerability. Disasters 1999, 23, 1–18. [Google Scholar] [CrossRef] [PubMed]
- Lee, Y.J. Social vulnerability indicators as a sustainable planning tool. Environ. Impact Assess. Rev. 2014, 44, 31–42. [Google Scholar] [CrossRef]
- Xu, H.; Ma, C.; Lian, J.; Xu, K.; Chaima, E. Urban flooding risk assessment based on an integrated k-means cluster algorithm and improved entropy weight method in the region of Haikou, China. J. Hydrol. 2018, 563, 975–986. [Google Scholar] [CrossRef]
- Wood, N.J.; Burton, C.G.; Cutter, S.L. Community variations in social vulnerability to Cascadia-related tsunamis in the U.S. Pacific Northwest. Nat. Hazards 2009, 52, 369–389. [Google Scholar] [CrossRef] [Green Version]
- Ge, Y.; Dou, W.; Liu, N. Planning Resilient and Sustainable Cities: Identifying and Targeting Social Vulnerability to Climate Change. Sustainability 2017, 9, 1394. [Google Scholar] [CrossRef] [Green Version]
- Rabby, Y.W.; Hossain, M.B.; Hasan, M.U. Social vulnerability in the coastal region of Bangladesh: An investigation of social vulnerability index and scalar change effects. Int. J. Disaster Risk Reduct. 2019, 41, 101329. [Google Scholar] [CrossRef]
- Wang, B.; Loo, B.P.Y.; Zhen, F.; Xi, G. Urban resilience from the lens of social media data: Responses to urban flooding in Nanjing, China. Cities 2020, 106, 102884. [Google Scholar] [CrossRef]
- Aerts, J.C.J.H.; Botzen, W.J.; Clarke, K.C.; Cutter, S.L.; Hall, J.W.; Merz, B.; Michel-Kerjan, E.; Mysiak, J.; Surminski, S.; Kunreuther, H. Integrating human behaviour dynamics into flood disaster risk assessment. Nat. Clim. Chang. 2018, 8, 193–199. [Google Scholar] [CrossRef] [Green Version]
- Aggarwal, A. Exposure, hazard and risk mapping during a flood event using open source geospatial technology. Geomat. Nat. Hazards Risk 2016, 7, 1426–1441. [Google Scholar] [CrossRef] [Green Version]
- Chen, X.L.; Zhang, H.; Chen, W.J.; Huang, G.R. Urbanization and climate change impacts on future flood risk in the Pearl River Delta under shared socioeconomic pathways. Sci. Total Environ. 2021, 762, 143144. [Google Scholar] [CrossRef] [PubMed]
- Zeleňáková, M.; Gaňová, L.; Purcz, P.; Satrapa, L. Methodology of flood risk assessment from flash floods based on hazard and vulnerability of the river basin. Nat. Hazards 2015, 79, 2055–2071. [Google Scholar] [CrossRef]
- Alam, M.; Rabbani, G. Vulnerabilities and responses to climate change for Dhaka. Environ. Urban. 2016, 19, 81–97. [Google Scholar] [CrossRef] [Green Version]
- Young, A.F.; Jorge Papini, J.A. How can scenarios on flood disaster risk support urban response? A case study in Campinas Metropolitan Area (São Paulo, Brazil). Sustain. Cities Soc. 2020, 61, 102253. [Google Scholar] [CrossRef]
- McLaughlin, M. Developments in flood maps for flood risk management in Scotland. Scott. Geogr. J. 2019, 135, 5–22. [Google Scholar] [CrossRef]
- Brody, S.; Blessing, R.; Sebastian, A.; Bedient, P. Examining the impact of land use/land cover characteristics on flood losses. J. Environ. Plan. Manag. 2014, 57, 1252–1265. [Google Scholar] [CrossRef]
- Maantay, J.; Maroko, A. Mapping urban risk: Flood hazards, race, & environmental justice in New York. Appl. Geogr. 2009, 29, 111–124. [Google Scholar] [CrossRef] [Green Version]
- Frazier, T.; Boyden, E.E.; Wood, E. Socioeconomic implications of national flood insurance policy reform and flood insurance rate map revisions. Nat. Hazards 2020, 103, 329–346. [Google Scholar] [CrossRef]


| Component Factors | No. | Name | Loading | Eigenvalue | Interpretable Variance | Cumulative Variance Contribution Rate (%) |
|---|---|---|---|---|---|---|
| Factor 1: Urban construction | 9 | PDNSTY | 0.925 | 10.593 | 39.928 | 39.928 |
| 10 | AVEHPRI | −0.596 | ||||
| 11 | DRET | −0.874 | ||||
| 13 | DCORP | 0.827 | ||||
| 14 | PCONSTR | 0.818 | ||||
| 15 | DKIN | 0.875 | ||||
| 16 | DPRI | 0.912 | ||||
| 17 | DMID | 0.647 | ||||
| 18 | DNURS | 0.610 | ||||
| 19 | DBUS | −0.846 | ||||
| 20 | DPS | −0.586 | ||||
| 21 | DHOSP | −0.768 | ||||
| Factor 2: Vulnerable groups | 1 | P75 | 0.863 | 2.531 | 18.200 | 58.128 |
| 5 | PAGR | 0.729 | ||||
| 7 | PlowEDU | 0.737 | ||||
| 8 | PILLITER | 0.695 | ||||
| 12 | AVEHARE | −0.588 | ||||
| Factor 3: Children | 2 | P14 | 0.892 | 1.562 | 11.306 | 69.434 |
| 3 | PKP | 0.922 | ||||
| Factor 4: Female and Migrants | 4 | PFEM | −0.704 | 1.253 | 6.472 | 75.906 |
| 6 | PMIG | 0.834 |
Publisher’s Note: MDPI stays neutral with regard to jurisdictional claims in published maps and institutional affiliations. |
© 2021 by the authors. Licensee MDPI, Basel, Switzerland. This article is an open access article distributed under the terms and conditions of the Creative Commons Attribution (CC BY) license (https://creativecommons.org/licenses/by/4.0/).
Share and Cite
Chen, Y.; Ye, Z.; Liu, H.; Chen, R.; Liu, Z.; Liu, H. A GIS-Based Approach for Flood Risk Zoning by Combining Social Vulnerability and Flood Susceptibility: A Case Study of Nanjing, China. Int. J. Environ. Res. Public Health 2021, 18, 11597. https://doi.org/10.3390/ijerph182111597
Chen Y, Ye Z, Liu H, Chen R, Liu Z, Liu H. A GIS-Based Approach for Flood Risk Zoning by Combining Social Vulnerability and Flood Susceptibility: A Case Study of Nanjing, China. International Journal of Environmental Research and Public Health. 2021; 18(21):11597. https://doi.org/10.3390/ijerph182111597
Chicago/Turabian StyleChen, Yi, Zhicong Ye, Hui Liu, Ruishan Chen, Zhenhuan Liu, and Hui Liu. 2021. "A GIS-Based Approach for Flood Risk Zoning by Combining Social Vulnerability and Flood Susceptibility: A Case Study of Nanjing, China" International Journal of Environmental Research and Public Health 18, no. 21: 11597. https://doi.org/10.3390/ijerph182111597