Sustainable development as a general concept can be considered as vague and ambiguous. Thus, it becomes crucial to adopt scientific methods, previously used with different purposes, to measure the suitability of green artificial reefs, i.e., the “capacity” to adopt the principles of CE.
2.1. Substitution Proposals
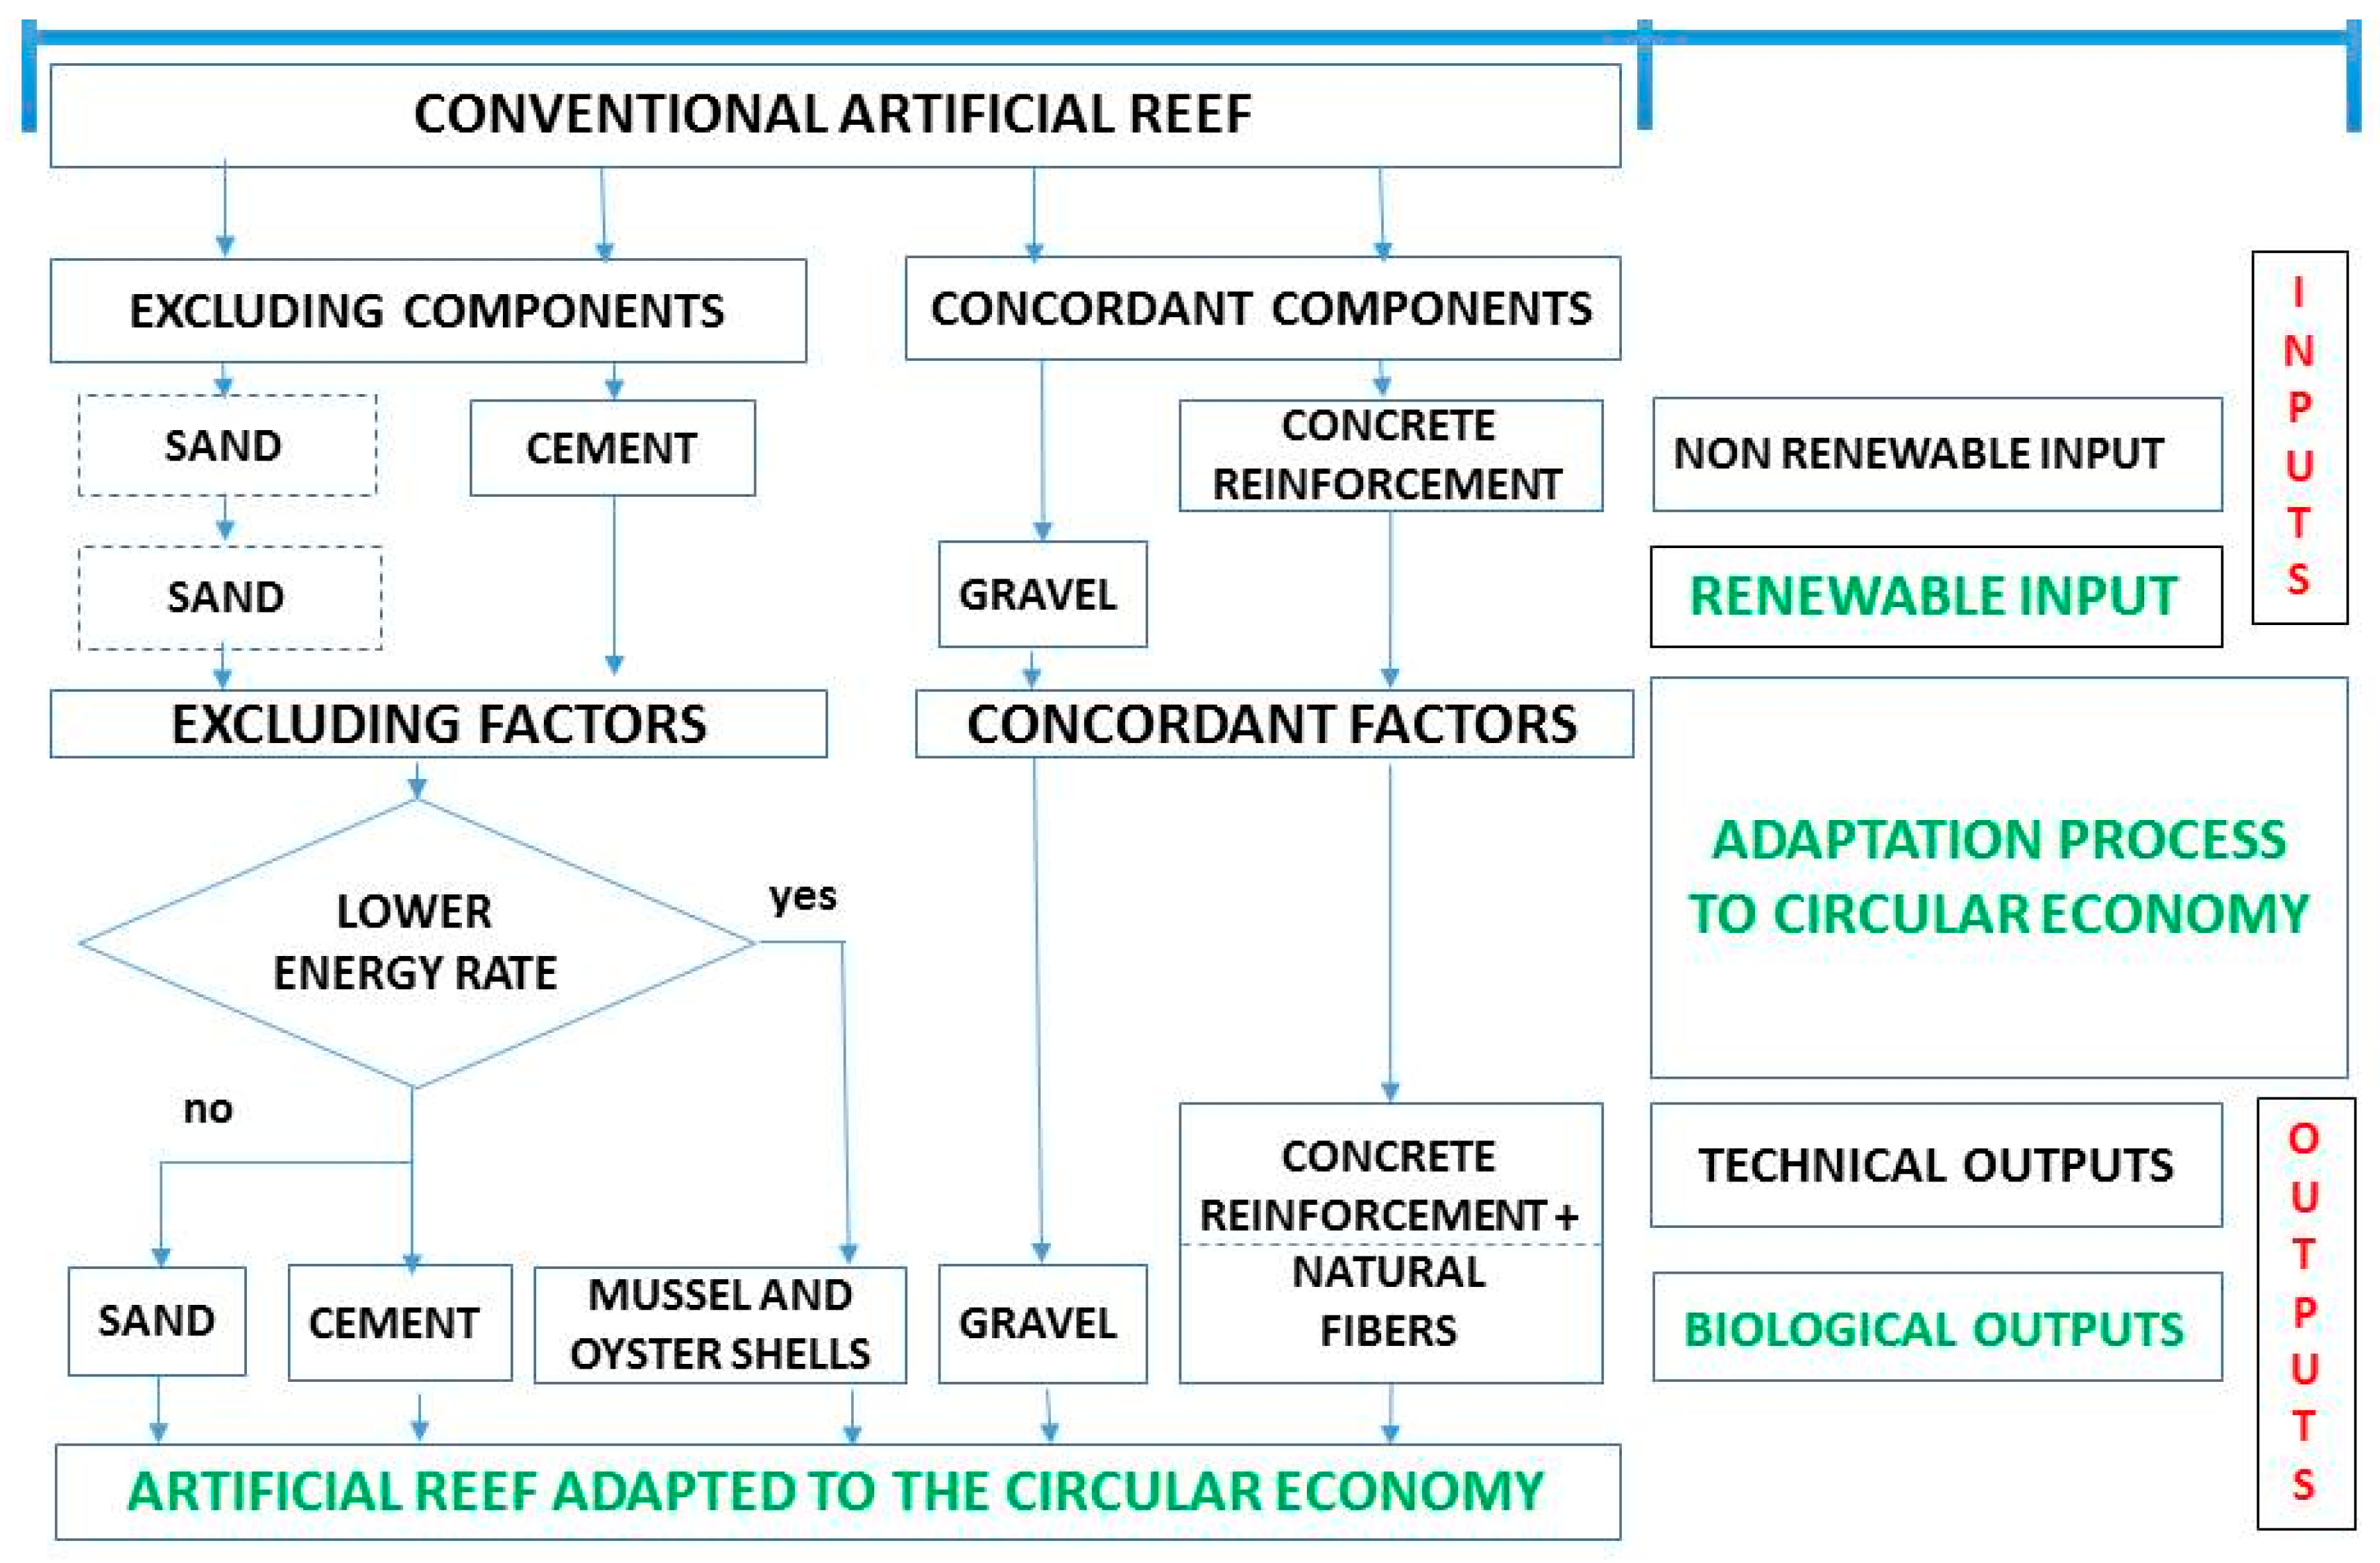
The idea of transforming a CAR into a GAR relies on the decision tree shown in
Figure 3. With any industrial process, optimising sustainability in terms of component materials means limiting the consumption of resources and the emission of chemical residues. The first task involves maximising the exploitation of renewable materials within the limits of an ecosystem to replenish itself. The second task entails minimising any emission harmful to the environment.
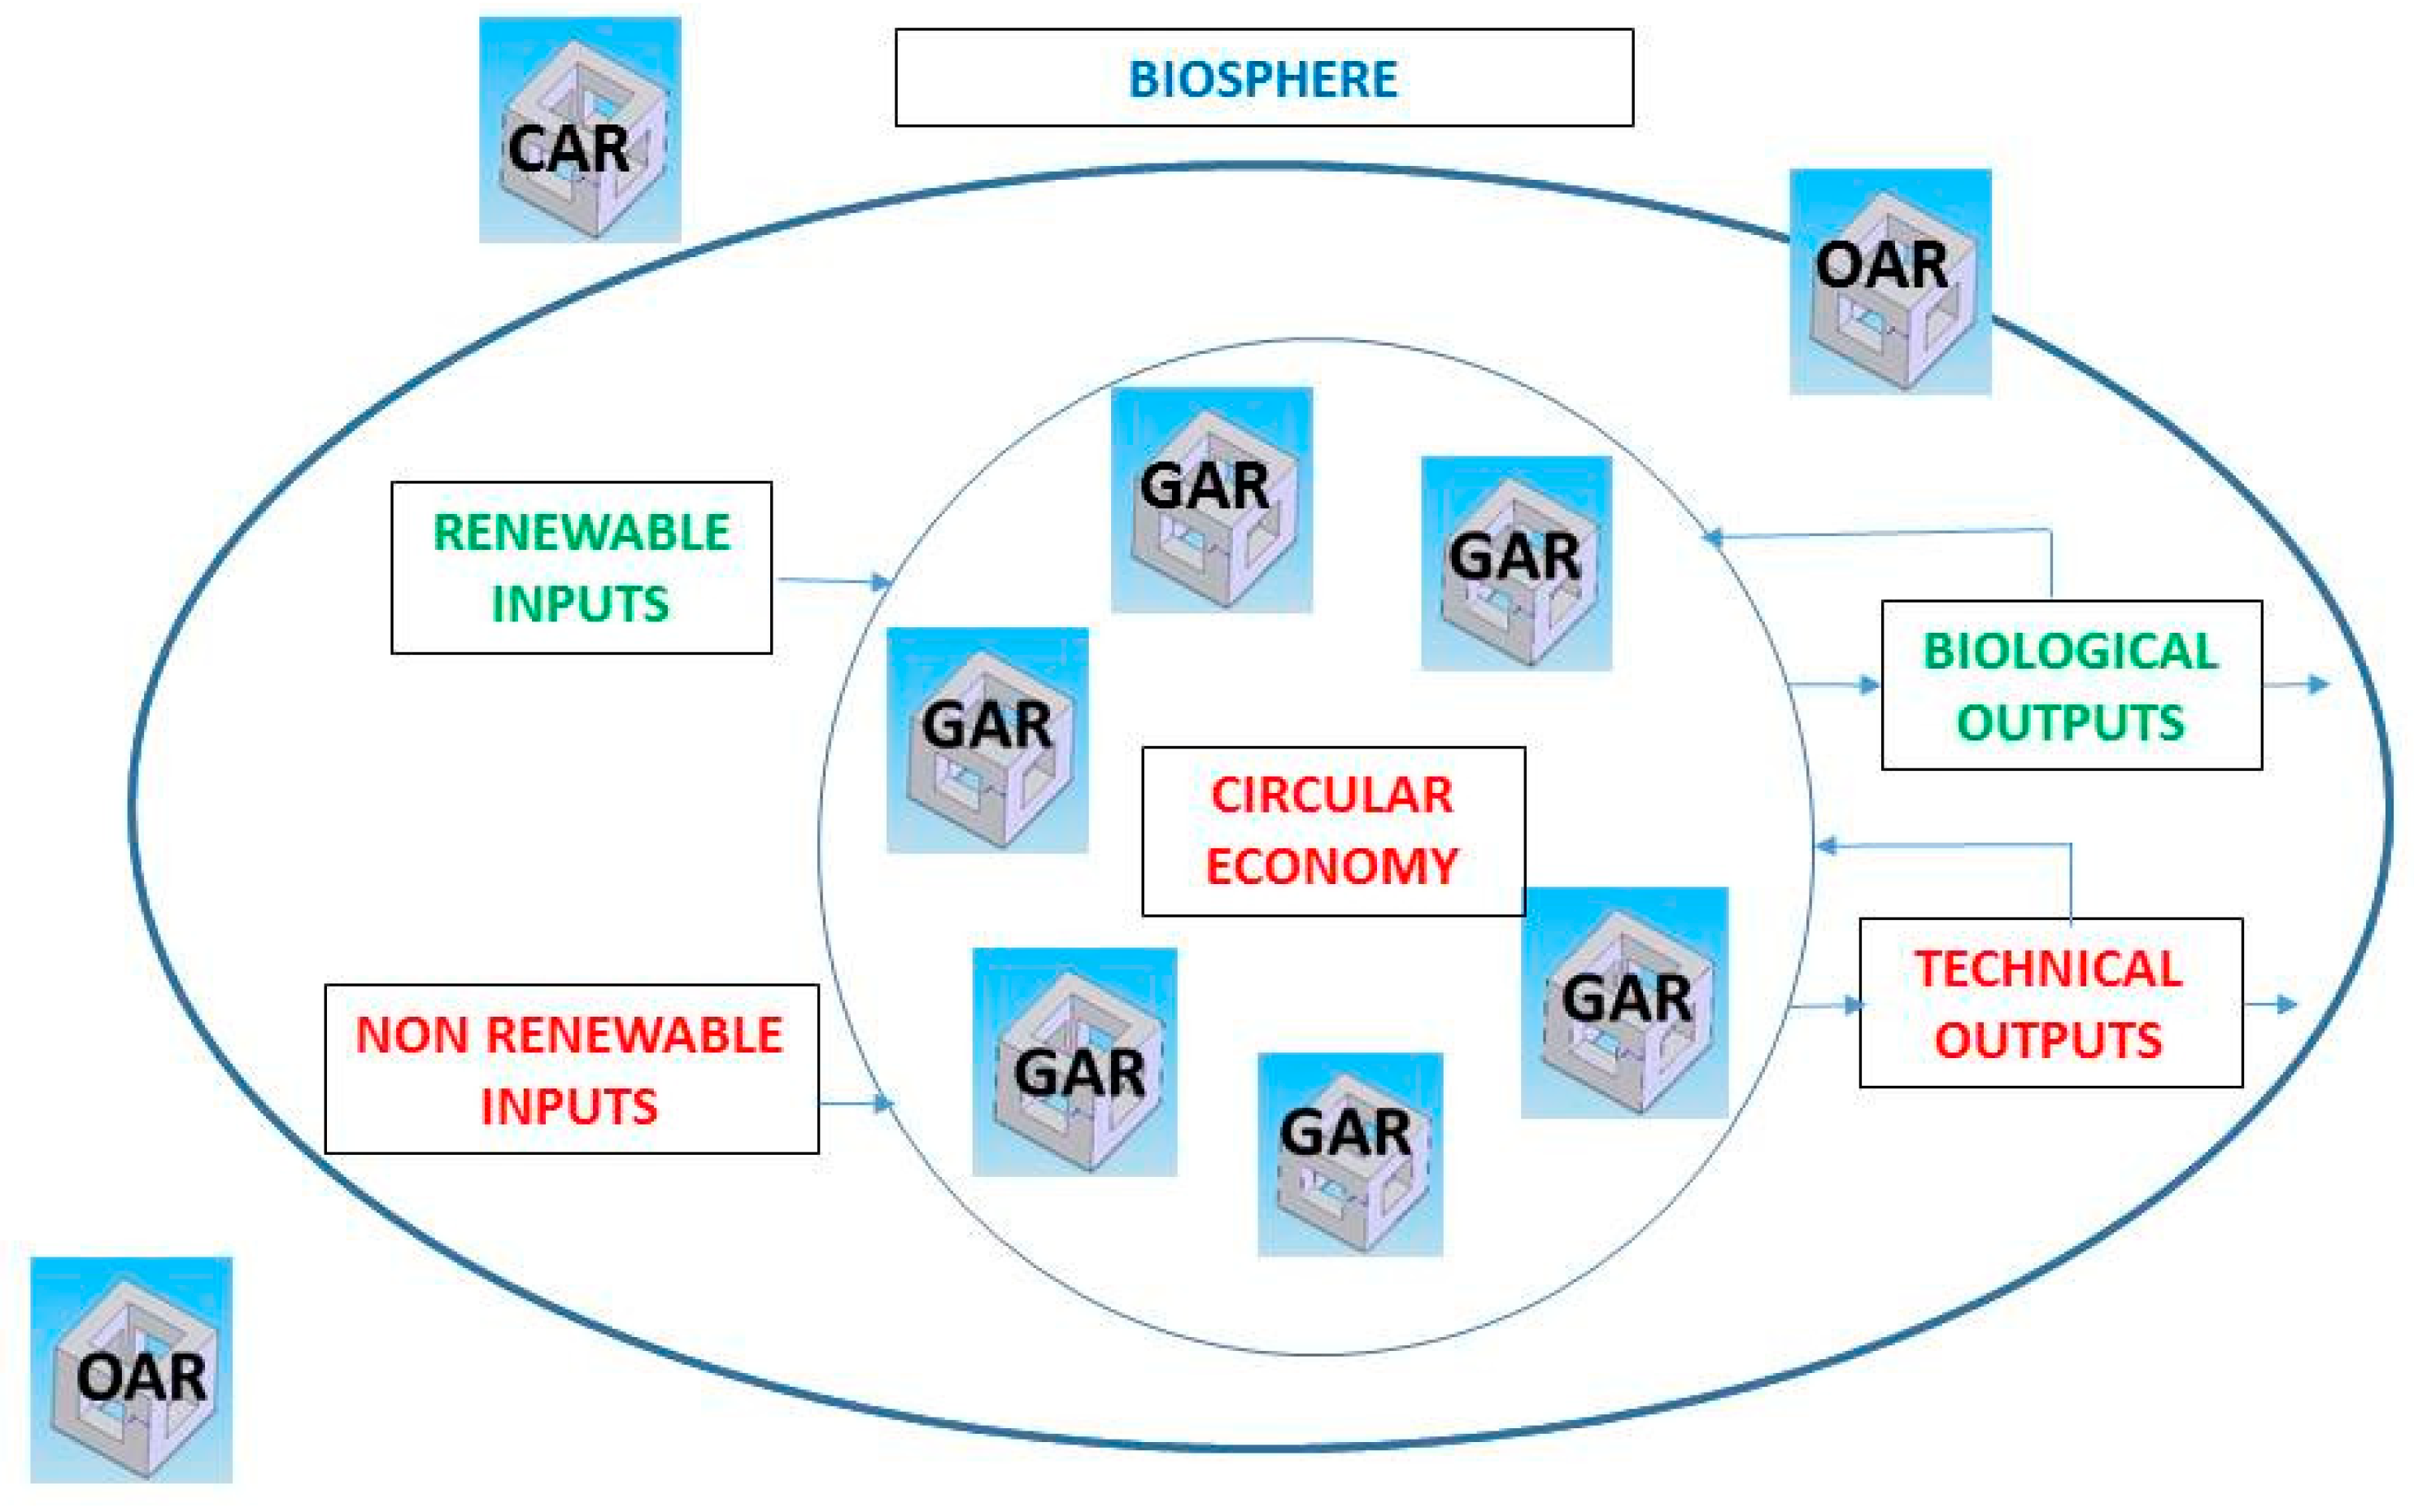
Figure 3 shows that there are two excluding components: sand and cement. These components can be substituted by seashells. Moreover, the reinforcement of concrete can be substituted by natural fibres as previously explained. Cement and usual reinforcements constitute non-renewable inputs, while sand and gravel are renewable inputs. Regarding the outputs, usual reinforcements can be classified as technical outputs while sand, cement, shells, gravel and natural fibres are biological outputs. A GAR adapted to the circular economy should include shells and natural fibres in its composition, trying to reduce both the extraction rate of non-renewable resources and the generation rate of technical waste through the use of substitute materials.
The CE places particular emphasis on activities that reduce, re-use and recycle materials [
37].
Table 3 shows the CAR components and how to embrace this principle. Both in terms of product and residues, the level of their environmental impact can be considered low depending on whether renewable or non-renewable raw materials are used and if the residues are chemical or organic [
89]. The last column includes the possibilities of applying CE principles. As can be seen, a substitution of cement, sand and metal reinforcement is proposed due to the environmental impact during production in the case of cement and metal reinforcement and during exploitation in the case of aggregates.
There are three common theoretical strategies within the paradigm of the CE:
- -
Minimising the input of raw materials and output of residues;
- -
Maintaining a resource’s value for as long as possible within the system;
- -
Reintegrating products into the system when they reach the end of their service life [
90,
91,
92].
The reduction in sand and cement can be especially important due to the cement industry´s environmental impact in terms of carbon dioxide emissions (CO
2), one of this industry´s by-products [
46,
93,
94,
95,
96,
97]. Cement manufacture consumes a lot of energy, requiring heating up to 1450 °C, resulting in a significant increase in its production costs [
98]. The necessary resources for its production are becoming scarce worldwide; some countries already have problems acquiring them [
99]. In any event, the global production of concrete increased notably in the last century and its future demand is expected to continue increasing [
100].
Thus, the reduction in cement use in concrete production processes directly affects its reduction in emissions of CO
2. Tayeh et al. [
99] demonstrated that seashells constitute an adequate alternative for ordinary Portland cement since CO
2 emissions from the cement hydration process are noticeably reduced.
Sand extraction is a mechanical action that harms our ecosystem [
101]. Many studies have been carried out on the effects of seashells as addition replacements (fine and coarse) [
102,
103,
104,
105,
106,
107,
108,
109,
110,
111]. Carral et al. [
16] propose incorporating crushed shells as an adequate substitute for 20% of the sand used in reinforced concrete. The possibility of substituting part of these metal frames which make up natural fibre-reinforced concrete (NFRC) is a highly interesting option which demands in-depth study [
65,
66,
67,
68,
69,
70,
71,
72,
112].
Table 4 describes the following five proposals analysed in the present work:
- -
CAR: conventional artificial reef made by reinforced concrete (basically cement, sand, gravel and steel frame);
- -
GAR1: 10% of the cement is substituted by shells and 25% of the steel frame is substituted by eucalyptus fibres;
- -
GAR2: 20% of the sand is substituted by shells and 25% of the steel frame is substituted by eucalyptus fibres;
- -
GAR3: 5% of the cement is substituted by shells, 10% of the sand is substituted by shells and 25% of the steel frame is substituted by eucalyptus fibres;
- -
GAR4: 5% of the cement is substituted by shells, 10% of the sand is substituted by shells and 100% of the steel frame is substituted by eucalyptus fibres.
Table 4 also includes the dosage, i.e., the components of concrete (cement, sand, gravel and frames) presented in 1 m
3 of artificial reef. The substitution percentages shown in
Table 4 were taken from the existing literature. Tayeh et al. [
99] reported that up to 10% of the cement can be substituted by oyster and mussel shells crushed and calcined at 600 °C. Regarding the sand, Carral et al. [
16] concluded that 20% of the sand can be substituted by oyster and mussel shells crushed and baked at 300 °C. Regarding the frames, Mukhopadhyay and Khatana [
68] reported that up to 25% of the steel frames can be substituted by vegetable fibres randomly distributed. Nevertheless, if some of these vegetable fibres are distributed in bars, the substitution can reach 100%. In this case, 25% can be randomly distributed but the remaining 75% of the vegetable fibres must be distributed in beams.
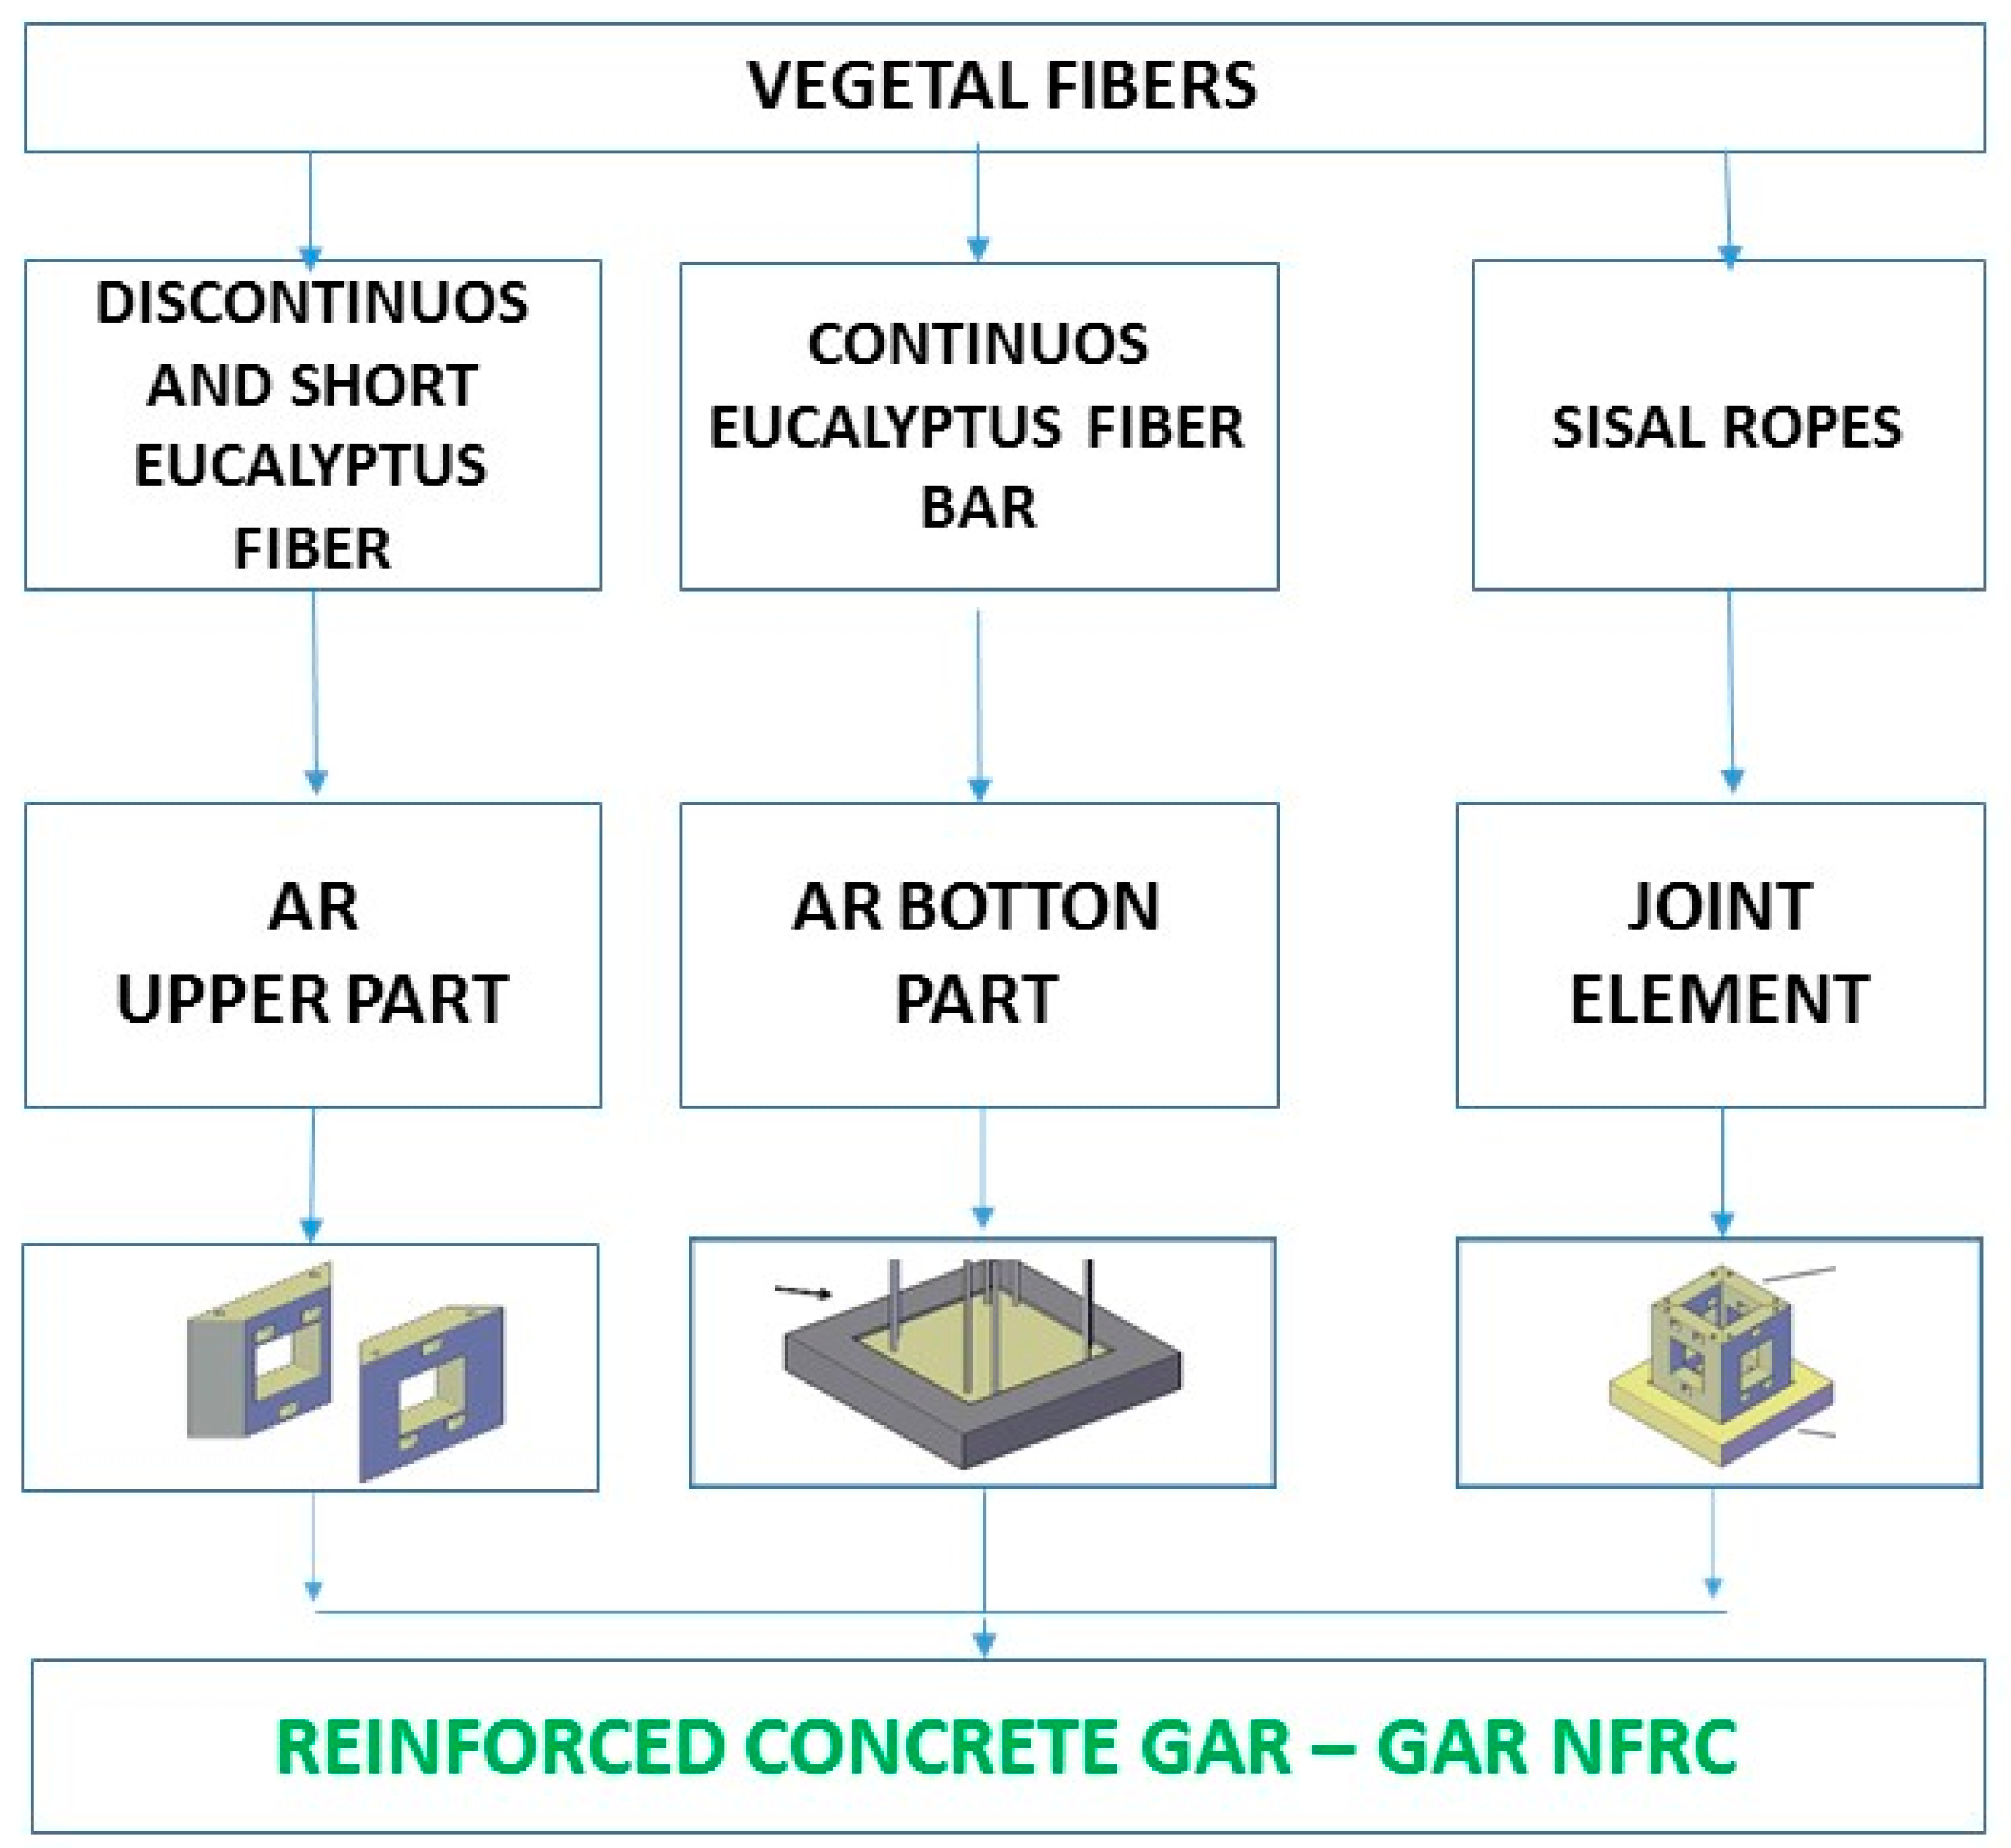
Figure 4 details the construction of the artificial reef if 100% of the frames are substituted by vegetable fibres. As can be seen, the upper parts of the artificial reef have discontinuous and short fibres randomly distributed, while the bottom part must include continuous fibres.
2.2. Analysis of Materials Flow
Robèrt et al. [
113] indicated that “dematerialisation” is one of the mechanisms to achieve environmental sustainability, through the reduction in material flows. The implementation of CE implies converting linear flows into circular material [
114]. This requires the assessment of the balance between profits and costs associated with these loops. Suarez-Eiroa et al. [
38] propose the following four objectives:
(1) The first objective is to decouple the economic development of the use of finite resources [
38,
89,
92,
114,
115]. This can be stated as “the extraction rate of renewable resources has to be lower than the regeneration rate of those resources” [
41]. All of this is to be considered within a framework [
34,
35,
116] that is in a constant state of development [
117,
118,
119,
120]. Consequently, it is necessary to distinguish between two types of inputs: renewable (RI) and non-renewable (NRI). It is also possible to estimate the use rate of each type of input as can be deducted from Equations (1) and (2). In accordance with the above references, the consumption rate of renewable inputs (Equation (1)) should be lower than the corresponding regeneration rate, Equation (3):
where
RI and
NRI are the corresponding quantities of renewable and non-renewable inputs, respectively.
(2) Since non-renewable resources are running out, it is required that “the consumption of non-renewable resources must be minimised as much as possible and, eventually, disposed” [
38]. Therefore, the NRI rate (Equation (2)) must be lower than the RI rate (Equation (1)), as indicated in Equation (4) [
44]. In this context, Turner [
121] presented a less restrictive condition. That is, non-renewable resource consumption should be as low as possible, as shown in Equation (5), giving preference to the consumption of renewables [
121]:
By way of example, it is important to note that 1 m
3 of CAR includes as renewable inputs (RI) gravel (1300 kg/m
3) and sand (750 kg/m
3), while cement (350 kg/m
3) and frames (45 kg/m
3) constitute non-renewable inputs (NRI). The previous quantities are included in
Table 4. The calculation of RI and NRI rates, included in Table, 5 is based on Equations (1) and (2), respectively, i.e.,
RIrate = (1300 + 750)/(350 + 45 + 1300 + 750) = 0.839 and
NRIrate = (350 + 45)/(350 + 45 + 1300 + 750) = 0.161. The RI and NRI rates corresponding to GAR1, GAR2, GAR3 and GAR4 were obtained similarly, but this time taking into account the corresponding substitution percentages included in
Table 4. The reader should bear in mind that both the shells and the vegetable fibres are renewable inputs. The reader can find in
Table 5 both the RI and NRI rates.
(3) “The rate of emission of biological wastes must be lower than the natural capacity of ecosystems to assimilate the delivered wastes” [
38]. The objective of minimising waste has also been identified by other authors [
38,
89,
90,
115,
122,
123]. In this sense, it is important to distinguish between two types of waste: biological outputs (BOs) and technical outputs (TOs) [
89]. Consequently, it is necessary to estimate the generation rates of both biological and technical outputs, Equations (6) and (7), respectively. According to Daly´s proposed operational criteria [
44], the emission rate for biological waste,
BOrate, must be inferior to the natural capacity of ecosystems to assimilate released wastes, Equation (8):
where
BO and
TO are the corresponding quantities of biological and technical outputs, respectively.
(4) “Technical outputs must be minimised or, eventually, eliminated” [
38]. Technical waste is not biodegradable. It requires human intervention in the process of its reincorporation into the economic system. Consequently, technical waste must be minimised or even eliminated [
89,
124]:
From the data included in
Table 4, 1 m
3 of CAR produces as biological outputs gravel (1300 kg/m
3), sand (750 kg/m
3) and cement (350 kg/m
3), while frames (45 kg/m
3) produce technical outputs. The calculation of BO and TO rates in
Table 6 is based on Equations (6) and (7), respectively, i.e.,
BOrate = (1300 + 750 + 350)/(350 + 45 + 1300 + 750) = 0.982 and
TOrate = 45/(350 + 45 + 1300 + 750) = 0.018. The BO and TO rates corresponding to GAR1, GAR2, GAR3 and GAR4 were obtained similarly (
Table 6), once again, taking into account the corresponding substitution percentages included in
Table 4.
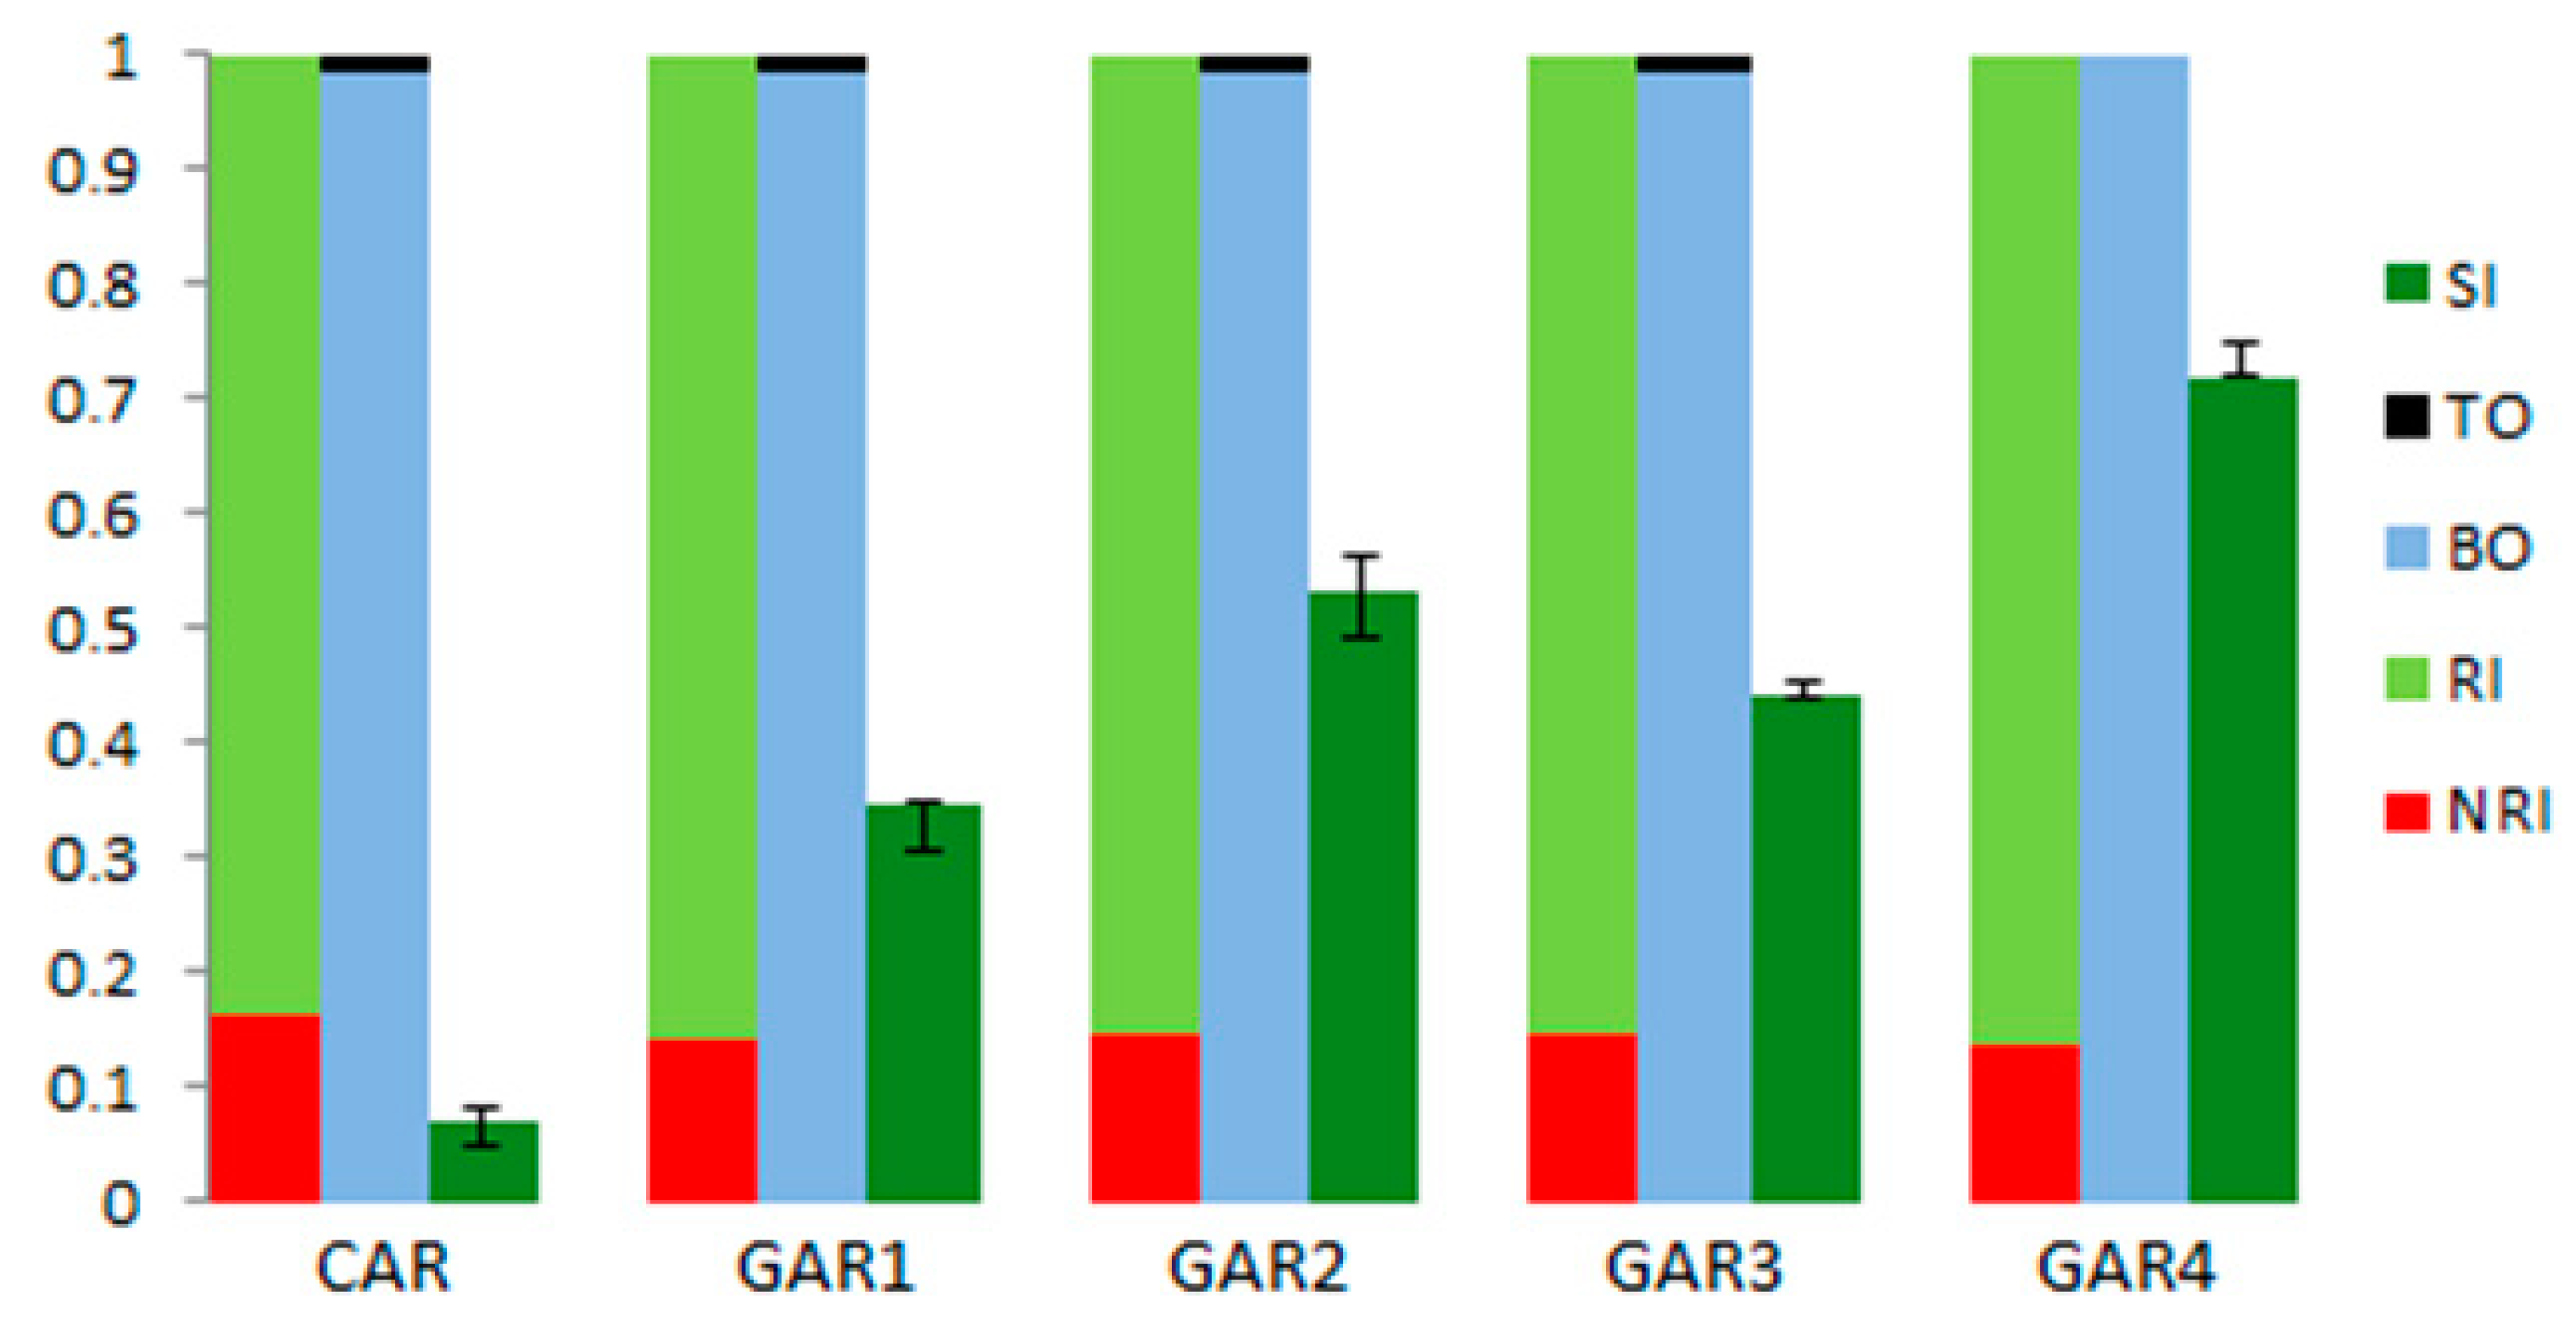
To summarise,
Table 7 illustrates the results for the CAR, GAR1 (the best “realistic” proposal, i.e., employing 25% eucalyptus frames) and GAR4 (“idealistic” proposal). These data are obtained from
Table 5 and
Table 6. For instance, regarding the CAR,
NRIrate = 0.161,
RIrate = 0.839 (
Table 5),
BOrate = 0.982 and
TOrate = 0.018 (
Table 6).
2.3. Sustainability Analysis
The MIVES (Spanish acronym of Integrated Value Model for Sustainability Assessment) method was employed to quantify the sustainability index (
SI) of each one of the four green artificial reefs defined in
Table 4 (GAR1–GAR4). A CAR, with no substitute materials, was also included in the assessment. MIVES is a deterministic multi-criteria decision making (MCDM) technique. Consequently, it constitutes a formal approach to handling complex decision-making situations, providing coherence in the decision-making processes [
125,
126,
127].
The first step in the MIVES method consists of defining the decision tree, also known as the requirement tree. It usually consists of three levels: requirements (R), criteria (C) and indicators (I). The indicators are the most specific aspects and the requirements the most general ones. Three basic requirements were considered: economic, environmental and social.
Table 8 outlines the decision tree together with the weights of the different branches. It is important to note that, in the existing literature, there are no similar models to assess the sustainability of artificial reefs. The weights, indicated between parentheses, were set by experts in the field. Several objective methods can be found in the literature to establish the weights through mathematical expressions. Nevertheless, subjective weighting criteria are most commonly used, and objective methods are particularly recommended when there is no agreement among the sets of weights proposed by the experts [
128,
129]. In any case, a sensitivity analysis of the values defined for the weights is carried out in
Section 3.
It is necessary to make some clarifications about the model and about the way in which some indicators are evaluated. First, it is important to note than only the indicators that generate differences in the results among the alternatives should be included in a MIVES model. In other words, if all the alternatives under assessment adopt the same (or very close) input value for a specific aspect, the corresponding indicator can be removed from the model. This is the reason why some indicators such as the employment generation, the positive impact on the ecosystems or the potential recreational uses (fishing, diving, etc.) among others, are not included in
Table 8.
The total cost indicator (R1C1I1) includes both the cost of the materials as well as the cost of the energy used in their production. A value of EUR 0.12/kWh was assumed for such a purpose [
130]. The reader should bear in mind that the costs associated with the production and assembling processes of each AR unit, as well as the costs derived from the transportation and the positioning and anchoring, were not included in this indicator. The main reason is that the manufacturing, transport and installation costs are expected to be the same for all the alternatives included in this study. Indicator R1C2I1 serves to assess the costs that have been avoided by using the shells in the different AR units, preventing their disposal. In other words, a higher amount of shells used in an AR unit is linked to a lower amount of not exploitable waste to be eliminated (with the corresponding savings).
Indicator R2C1I1 is similar to the previous one. In fact, they are measured in the same units and through the same value function. Nevertheless, R2C1I1 takes into account the avoided generation of wastes derived from the use of shells in the production of AR units. In other words, indicator R1C2I1 assesses the economic side while indicator R2C1I1 focused on the environmental side of the “same coin”.
The amount of resources employed in each AR unit was evaluated on the basis of indicators R2C2I1–R2C2I3. A higher input value, i.e., a higher consumption, always generates a lower level of satisfaction. The consumption of shells was not included in this criterion, since the derived positive impacts were previously assessed in other indicators. The amount of water used in each alternative is always the same and this is the reason why the water use indicator was excluded. On the other hand, these three indicators (R2C2I1–R2C2I3) also served, to a certain extent, to quantify some of the most common emissions (CO
2, CO, NO
x, VOCs (volatile organic compounds), SO
x and PM
10 (particulate matter with diameters equal to or smaller than 10 micrometres)). This has been possible because of the use of the weights (5%, 70% and 25%) based on [
131]. In [
131], Mel estimated the average contribution of the aggregates, cement and steel production to the previous pollutants, obtaining values in line with the ones employed in this study.
Once again, at the time of assessing the total energy consumption (R2C3I1), the manufacturing, transport and installation processes were excluded. The reason is the same that was previously explained. The generation of waste at the end of each AR’s useful life is assessed through indicators R2C4I1 and R2C4I2. Logically, a higher input value generates a lower satisfaction and vice versa.
From a social point of view, two indicators were taken into account (R3C1I1 and R3C1I2). They assessed the potential contribution of each AR unit to the sustainability in the canning and wood industries, respectively. A higher consumption of shells or fibres is assumed to generate a positive impact on the corresponding sectors. These two indicators are measured in points (from 0 to 100). The number of points for each alternative was directly estimated from the amount of shells and fibres consumed.
MIVES transforms different types of indicators, measured in different units, into a dimensionless quantity,
Vi, called value or level of satisfaction, through the use of value functions, Equation (10) [
125,
126,
127]. According to this, from a specific input value (
Xi) measured in the corresponding units (m, EUR, kg, etc.), value functions return a value between 0 and 1, the minimum and maximum levels of satisfaction, respectively:
where
Xmin is the input value associated with the minimum level of satisfaction (0), while
Xmax is the input value linked to the maximum level of satisfaction (1).
Ci,
Ki and
Pi are parameters that allow the user to define value functions with different geometries (linear, convex, concave or s-shaped).
Table 9 shows the values that these parameters adopt for the different value functions as well as the units of measurement for the indicators.
Table 10 contains the model input values for the five alternatives under assessment.
With the information provided in
Table 8,
Table 9 and
Table 10, it is possible to estimate the sustainability index (
SI) for each alternative. In the present work, the so-called SAW (simple additive weighting) method was employed, and the
SI is given by Equation (11) [
125,
126,
127,
132]:
where
N is the number of indicators considered in the requirement tree (11 in this case);
αi,
βi and
γi are the weights for the requirements, criteria and indicators, respectively, contained in
Table 8. The
SI also falls within the interval [0,1], again the worst and best possible values, respectively.
It is important to remark that MCDM methods are affected by subjectivity and MIVES is not an exception. In fact, subjectivity comes into play at the time of establishing the weights and also at the time of defining value functions. Consequently, different sets of results can be obtained when Equation (11) is used, depending on these factors. Nevertheless, although the numerical results may change, the ranking of alternatives should be similar if reasonable weights and value functions are defined. In other words, changes in the positions can only appear in those alternatives that have very close input values and therefore, very similar performances. Similarly, the difference between the sustainability indices obtained by the two alternatives also changes if different weights and value functions are used. Nevertheless, if those differences are compared, proportionality will be maintained to certain extent. A possible solution to manage these issues is to perform a sensitivity analysis [
126,
127], as the one implemented in this study. Another option is to transform the model into a probabilistic one, defining probability distributions for all the parameters affected by subjectivity and applying Monte Carlo simulation [
125]. Nevertheless, this is out of the scope of this study, although it will be considered as a possible future development.

 ,
, 


