Space-Time Patterns, Change, and Propagation of COVID-19 Risk Relative to the Intervention Scenarios in Bangladesh


Abstract
:1. Introduction
- Timely detection and evaluation of active space-time clusters of COVID-19 infections that currently pose threat to public health;
- Track space-time propagation of previously existed clusters for an understanding of ‘where’ and ‘when’ infections spread;
- Identify linkages between the retrospective emerging patterns of COVID-19 spread and time-lagged NPI scenarios.
2. Materials and Methods
2.1. COVID-19 Daily Reports—Bangladesh and Dhaka Megacity
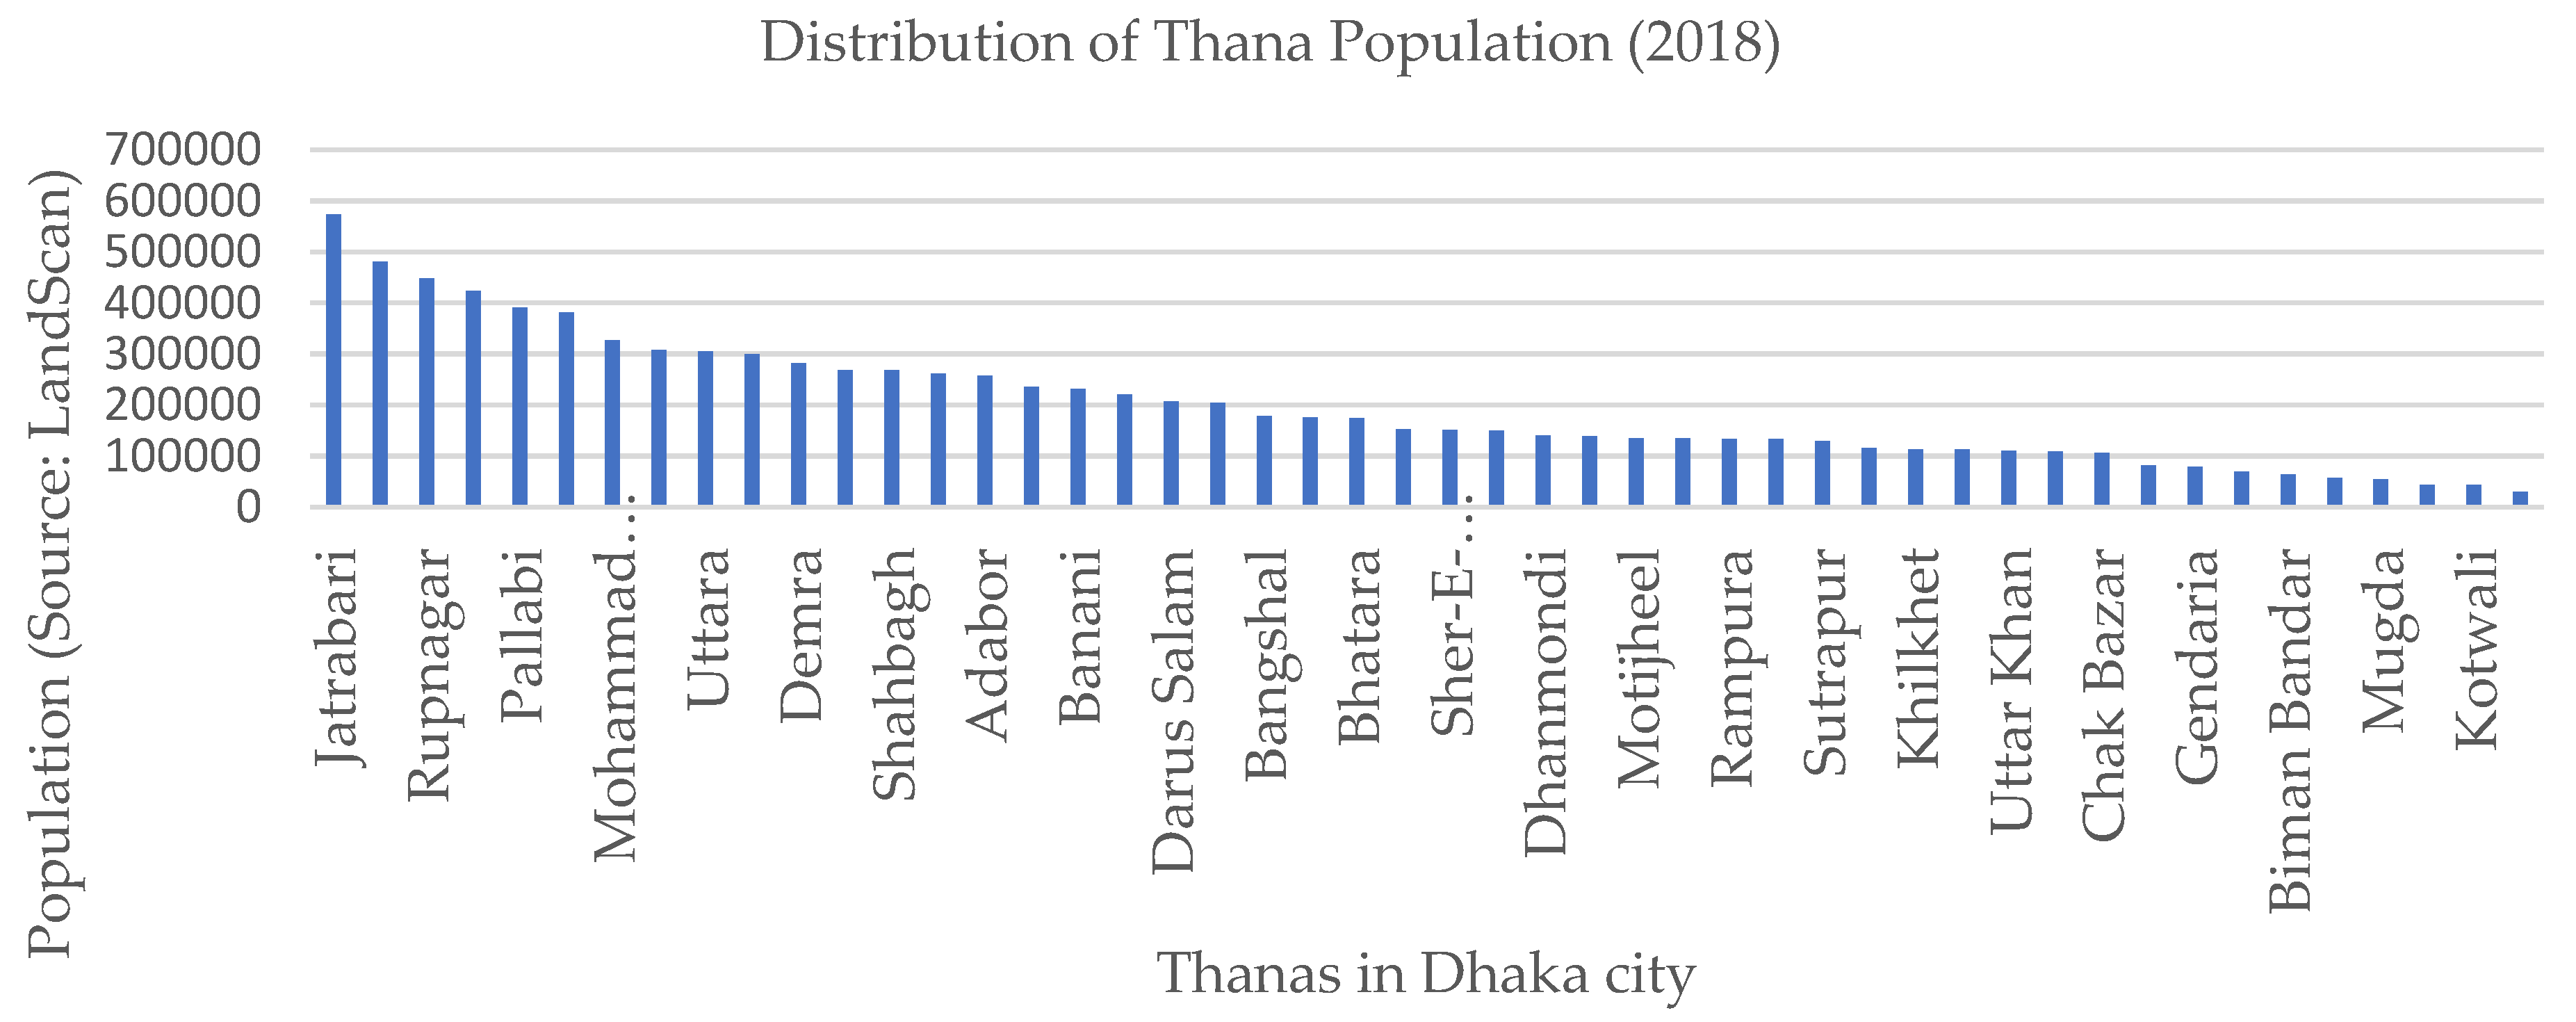
2.2. LandScan Population Data
2.3. Emerging Space-Time Cluster Analysis
3. Results
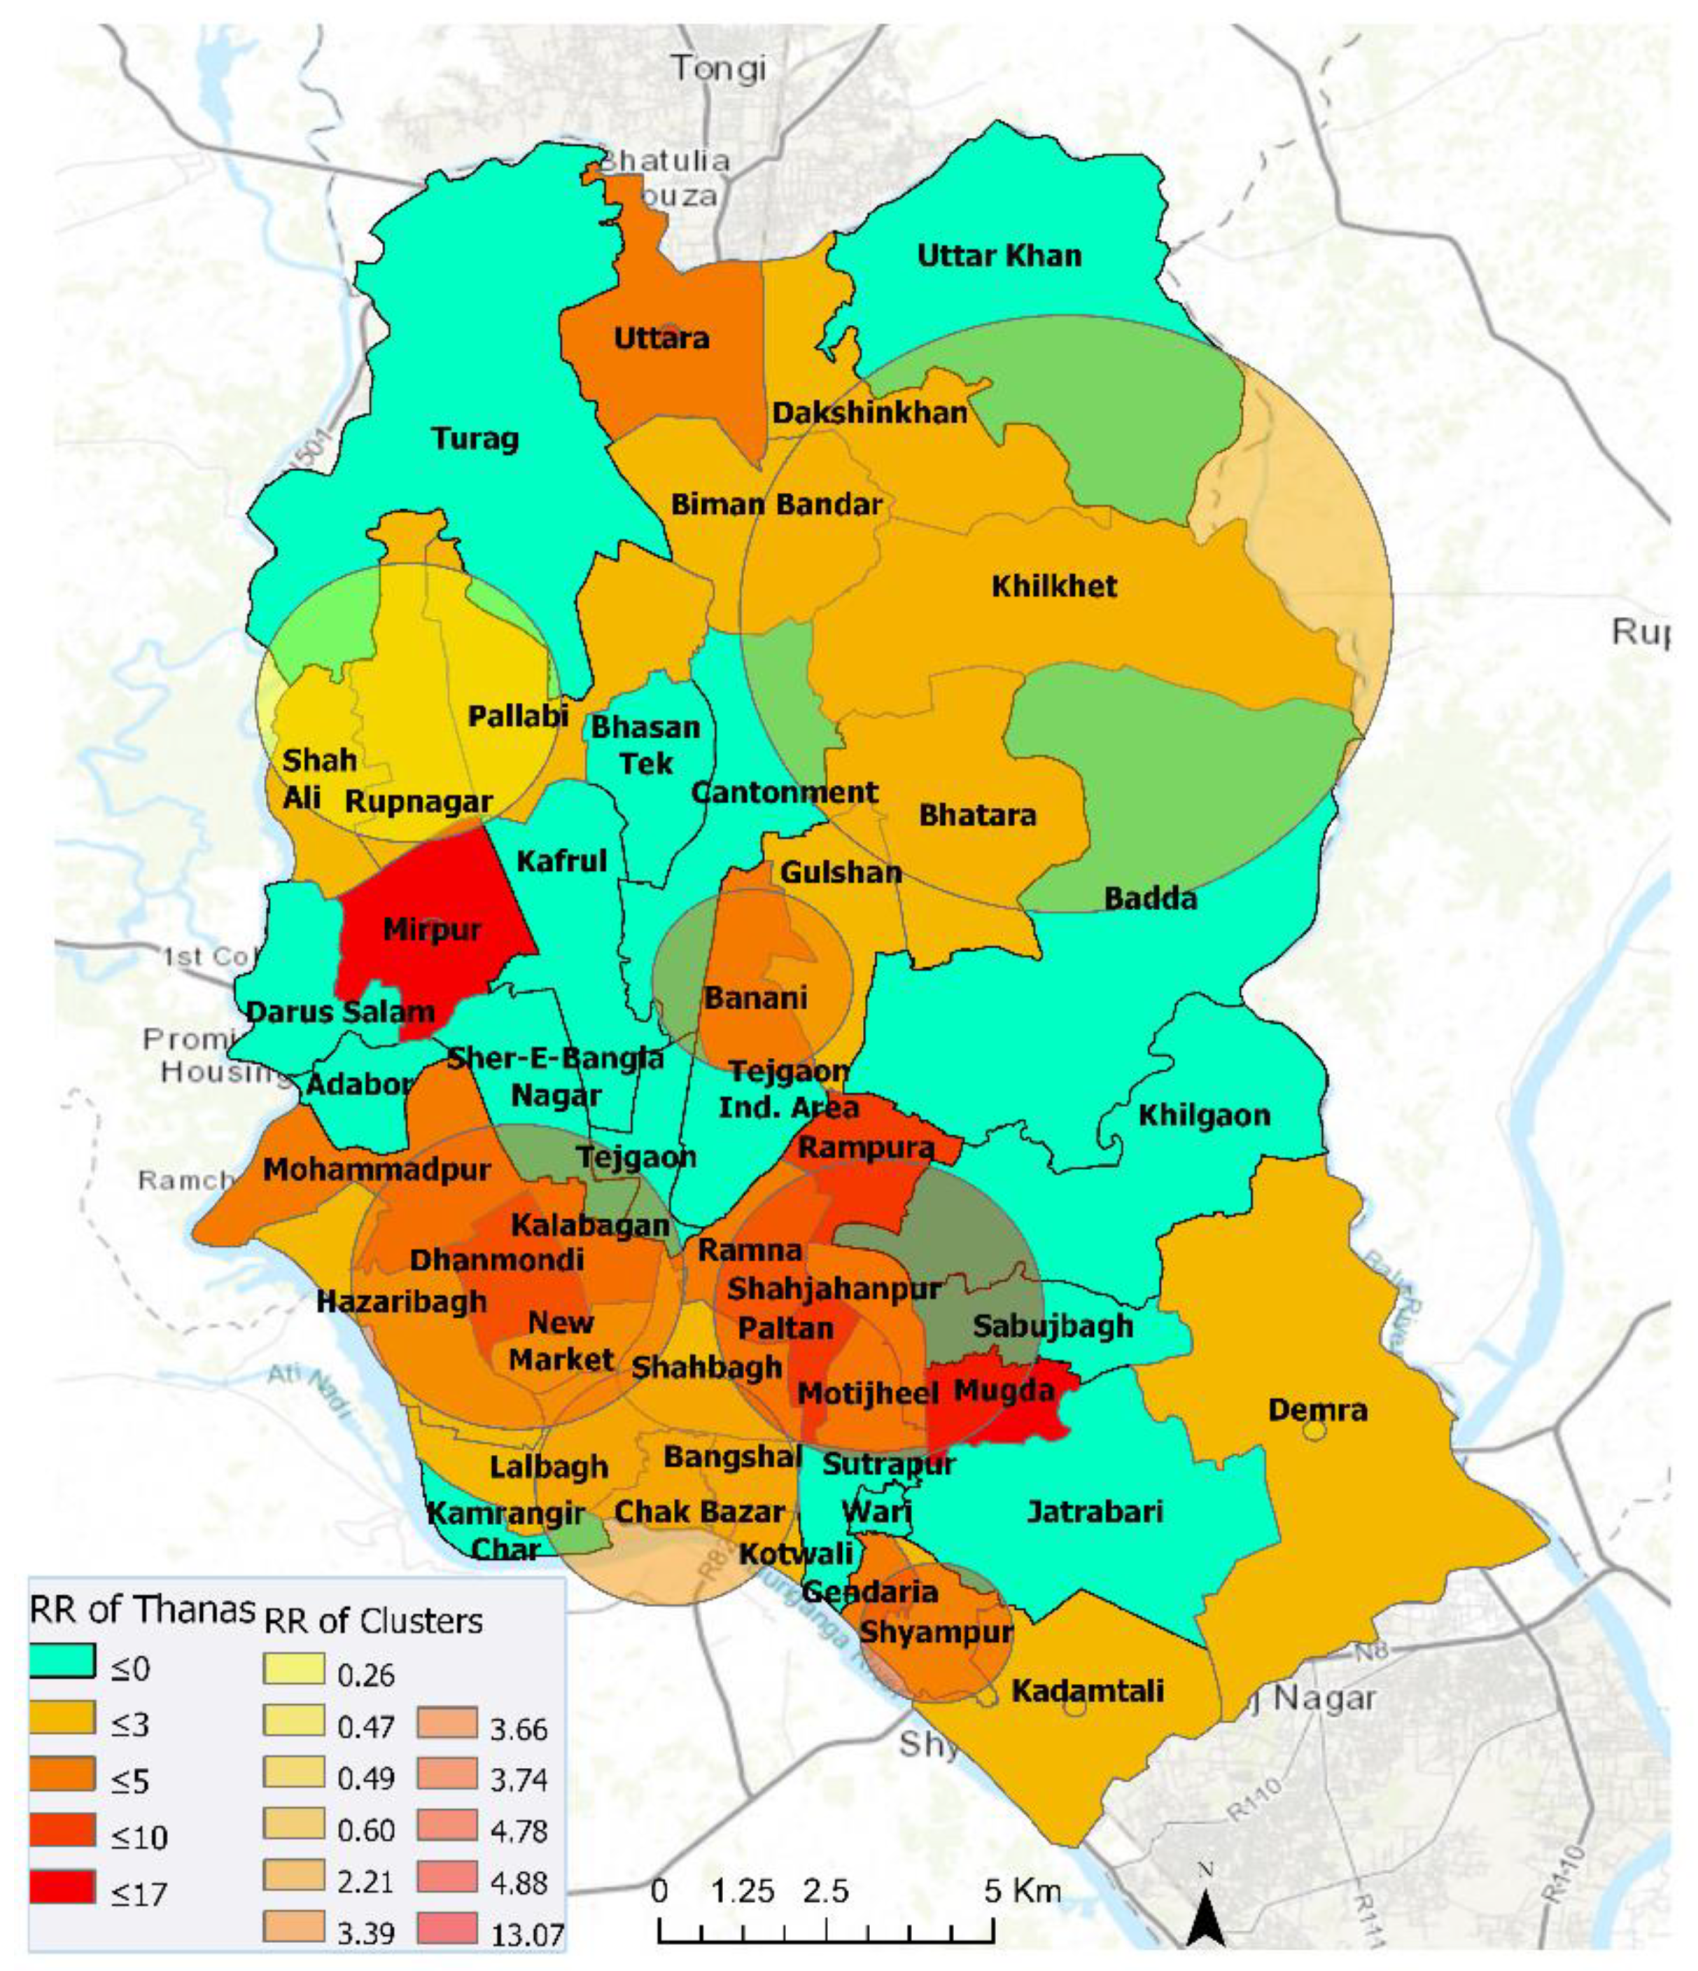
3.1. Thana-Level Emerging COVID-19 Risk Clusters in Dhaka Megacity
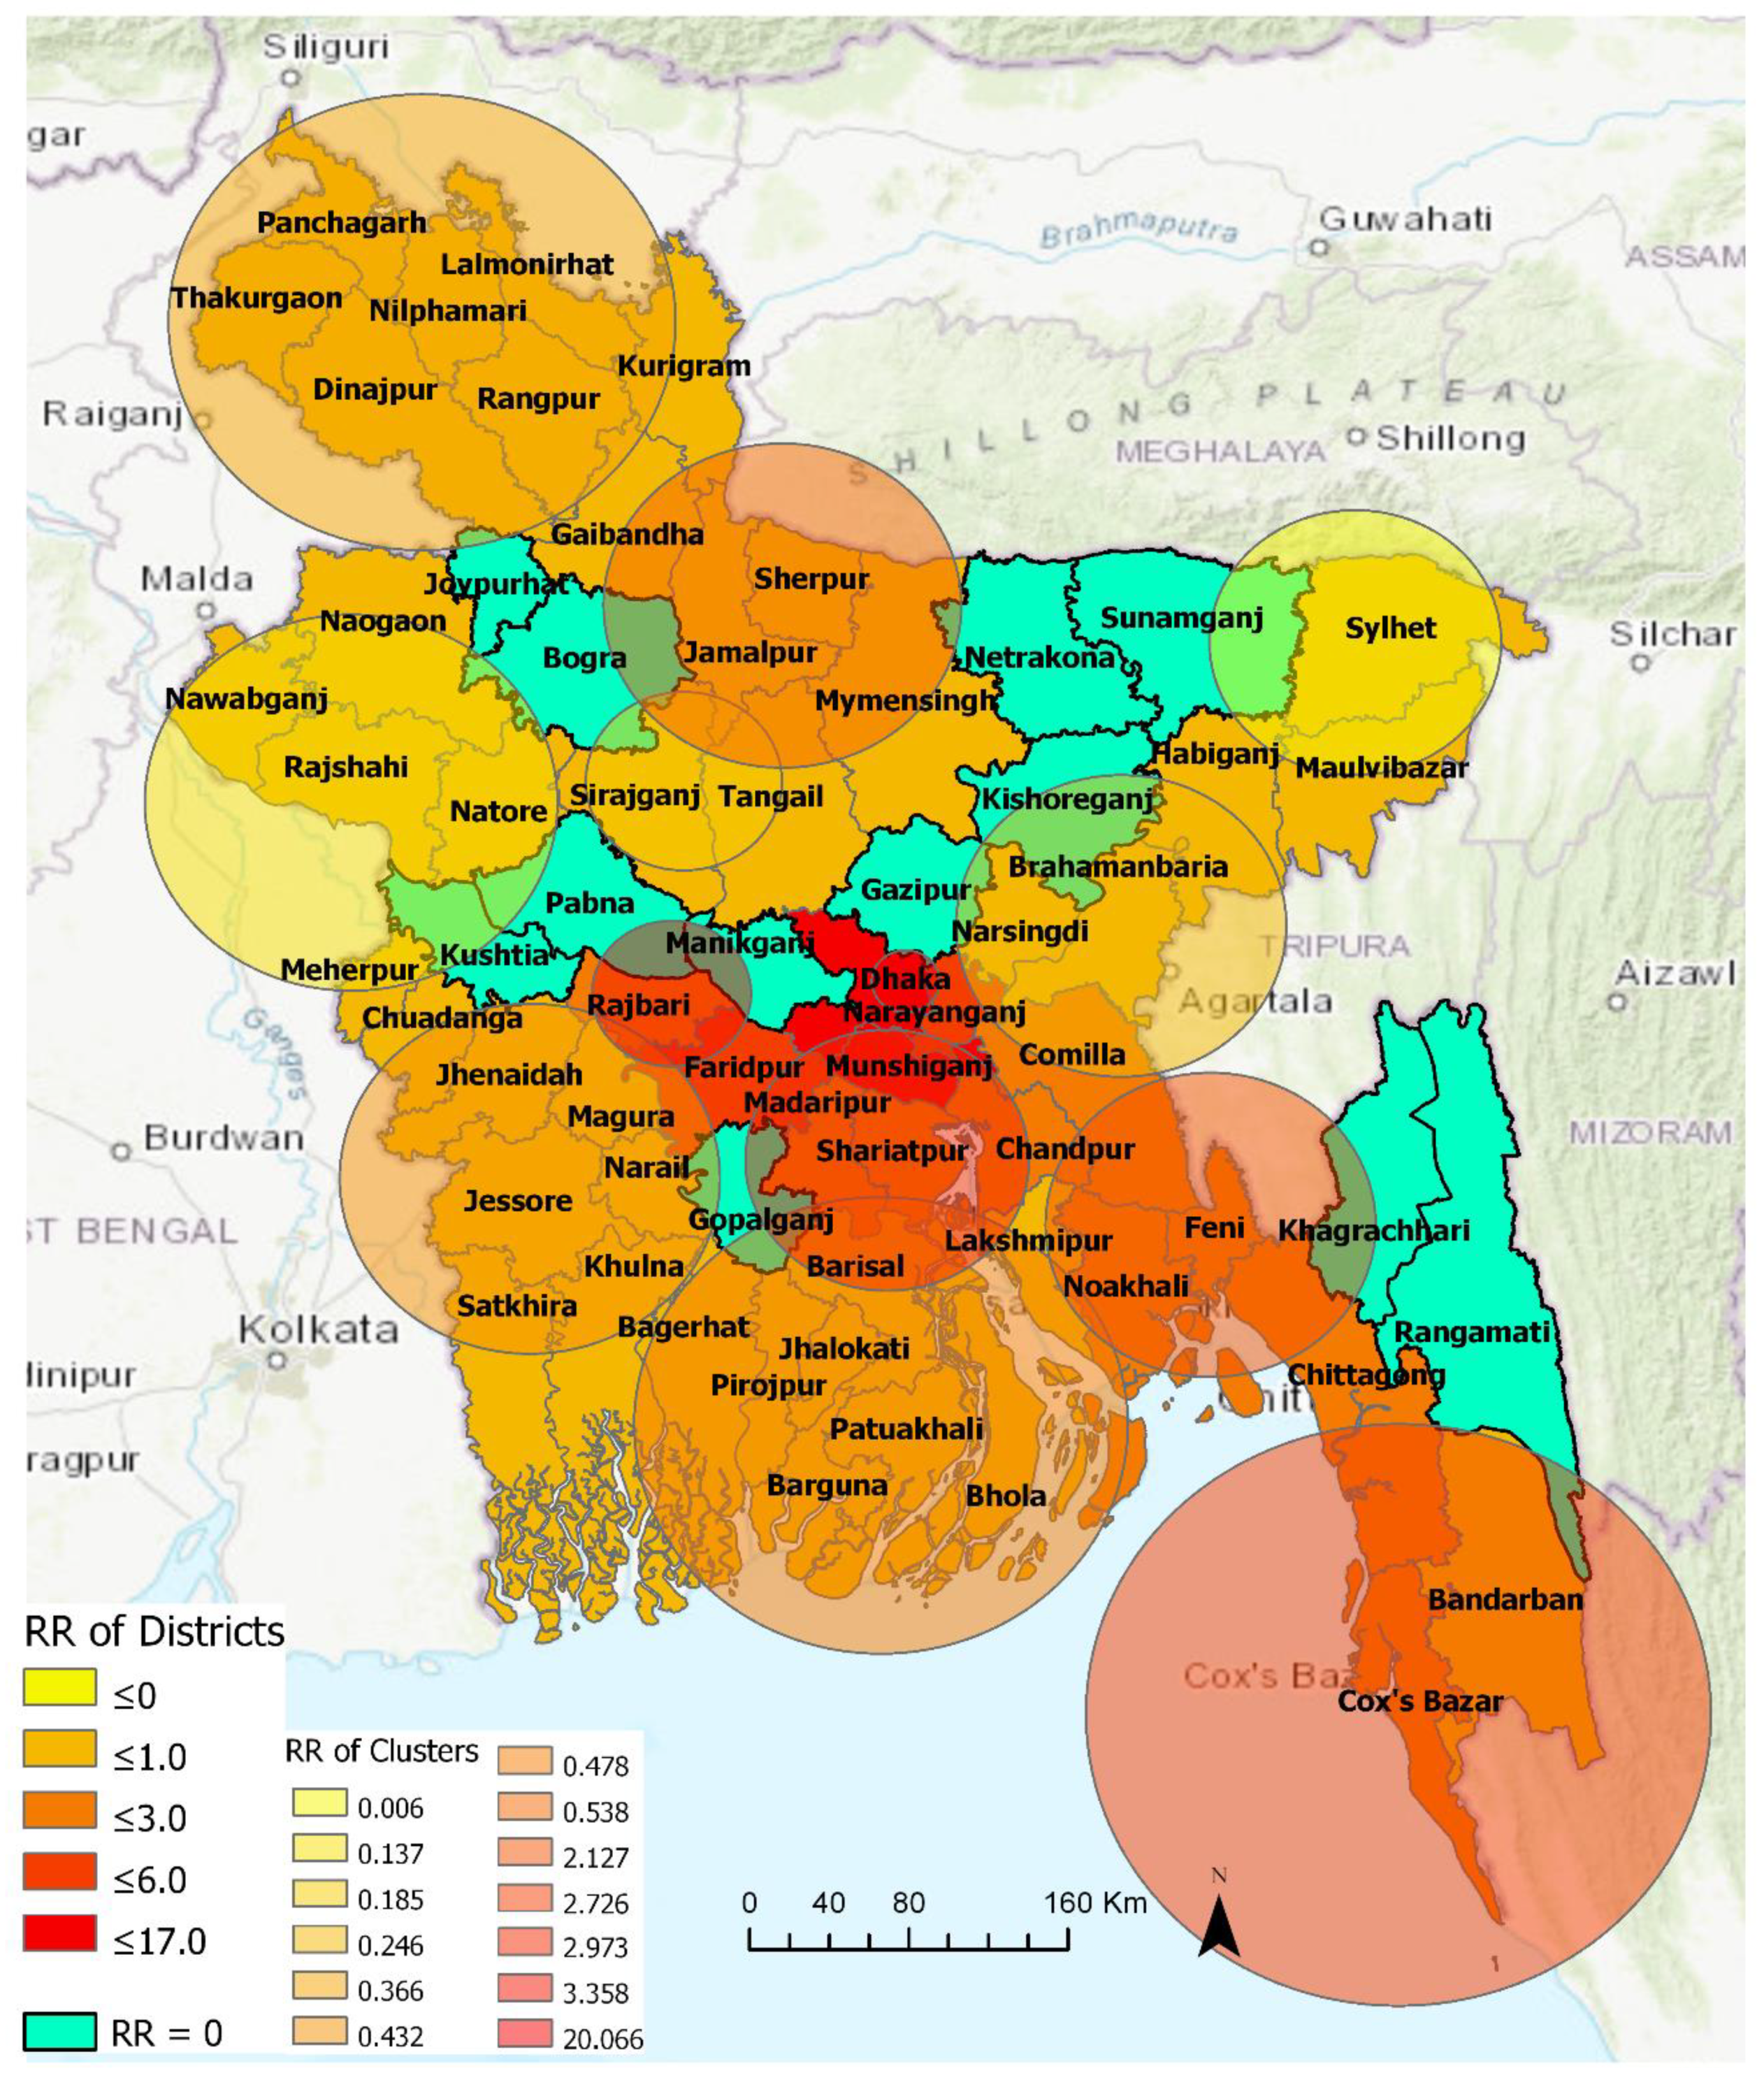
3.2. District-Level Emerging COVID-19 Risk Clusters—4 April–15 June 2020
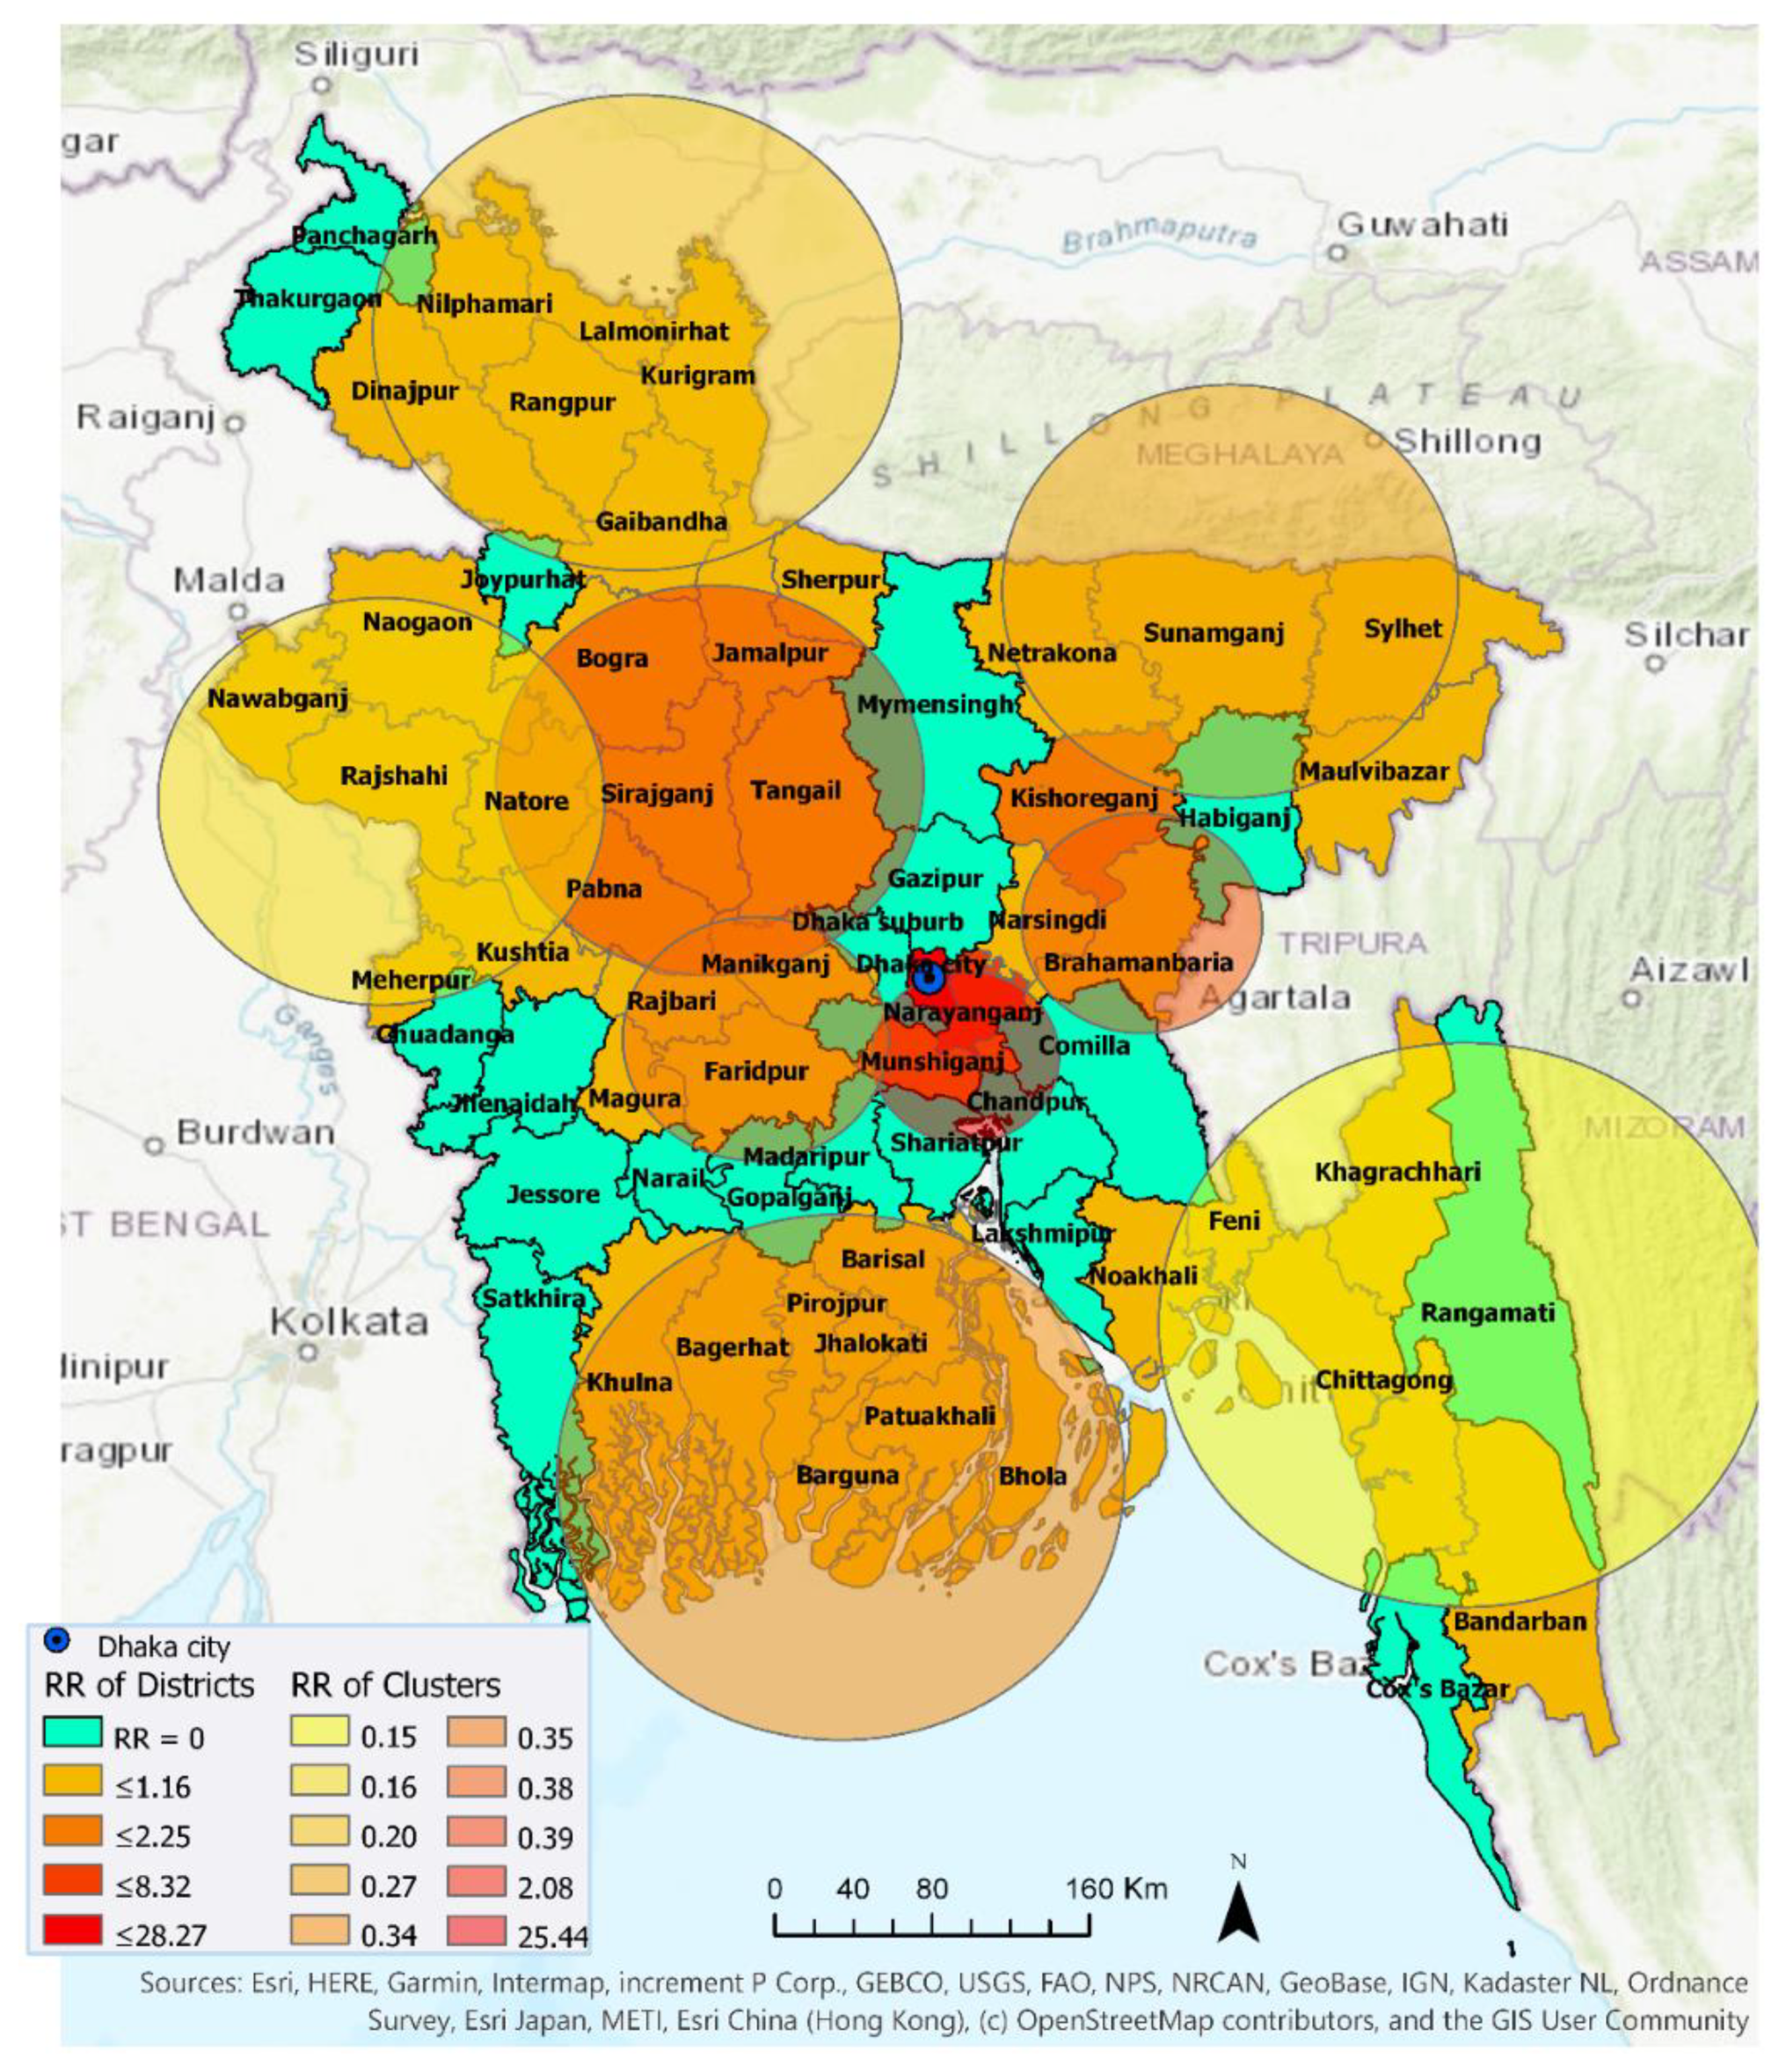
3.2.1. 4 April–30 April 2020
3.2.2. 4 April–15 June 2020
3.3. Progression of Relative Risk of COVID-19 in Bangladesh
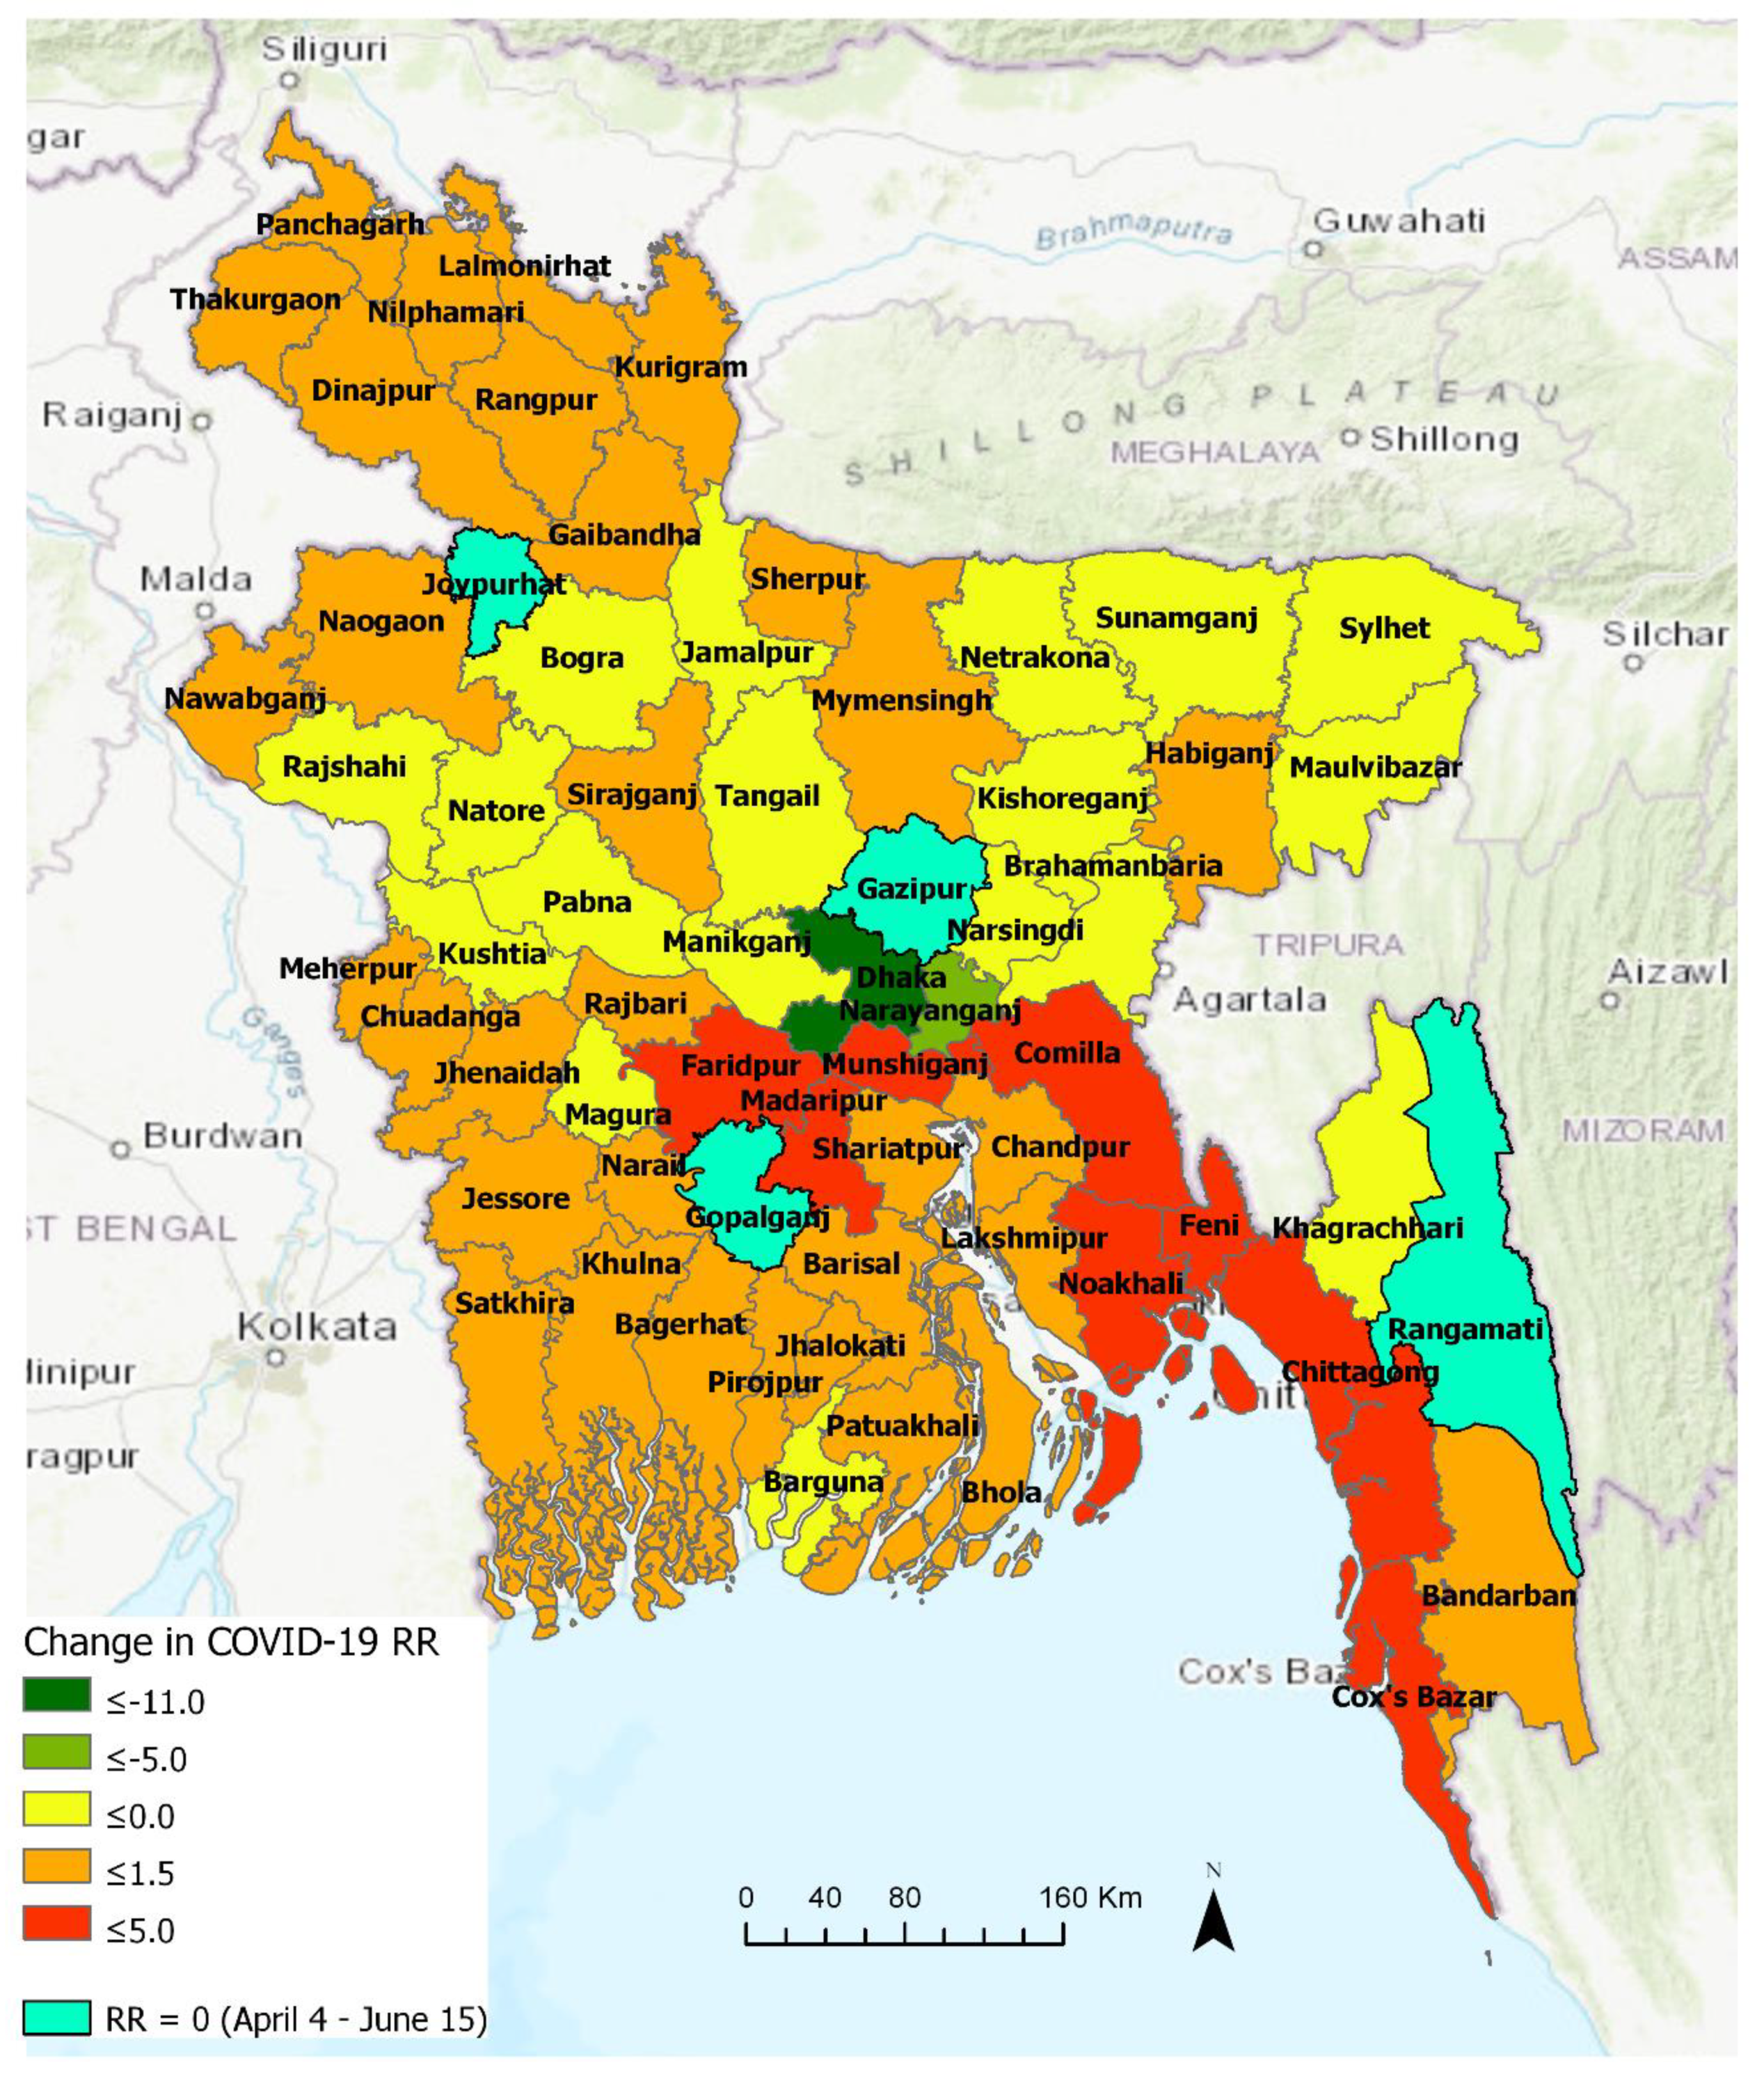
3.3.1. Comparison between Early and Later Phase (Pre- and Post-30 April)
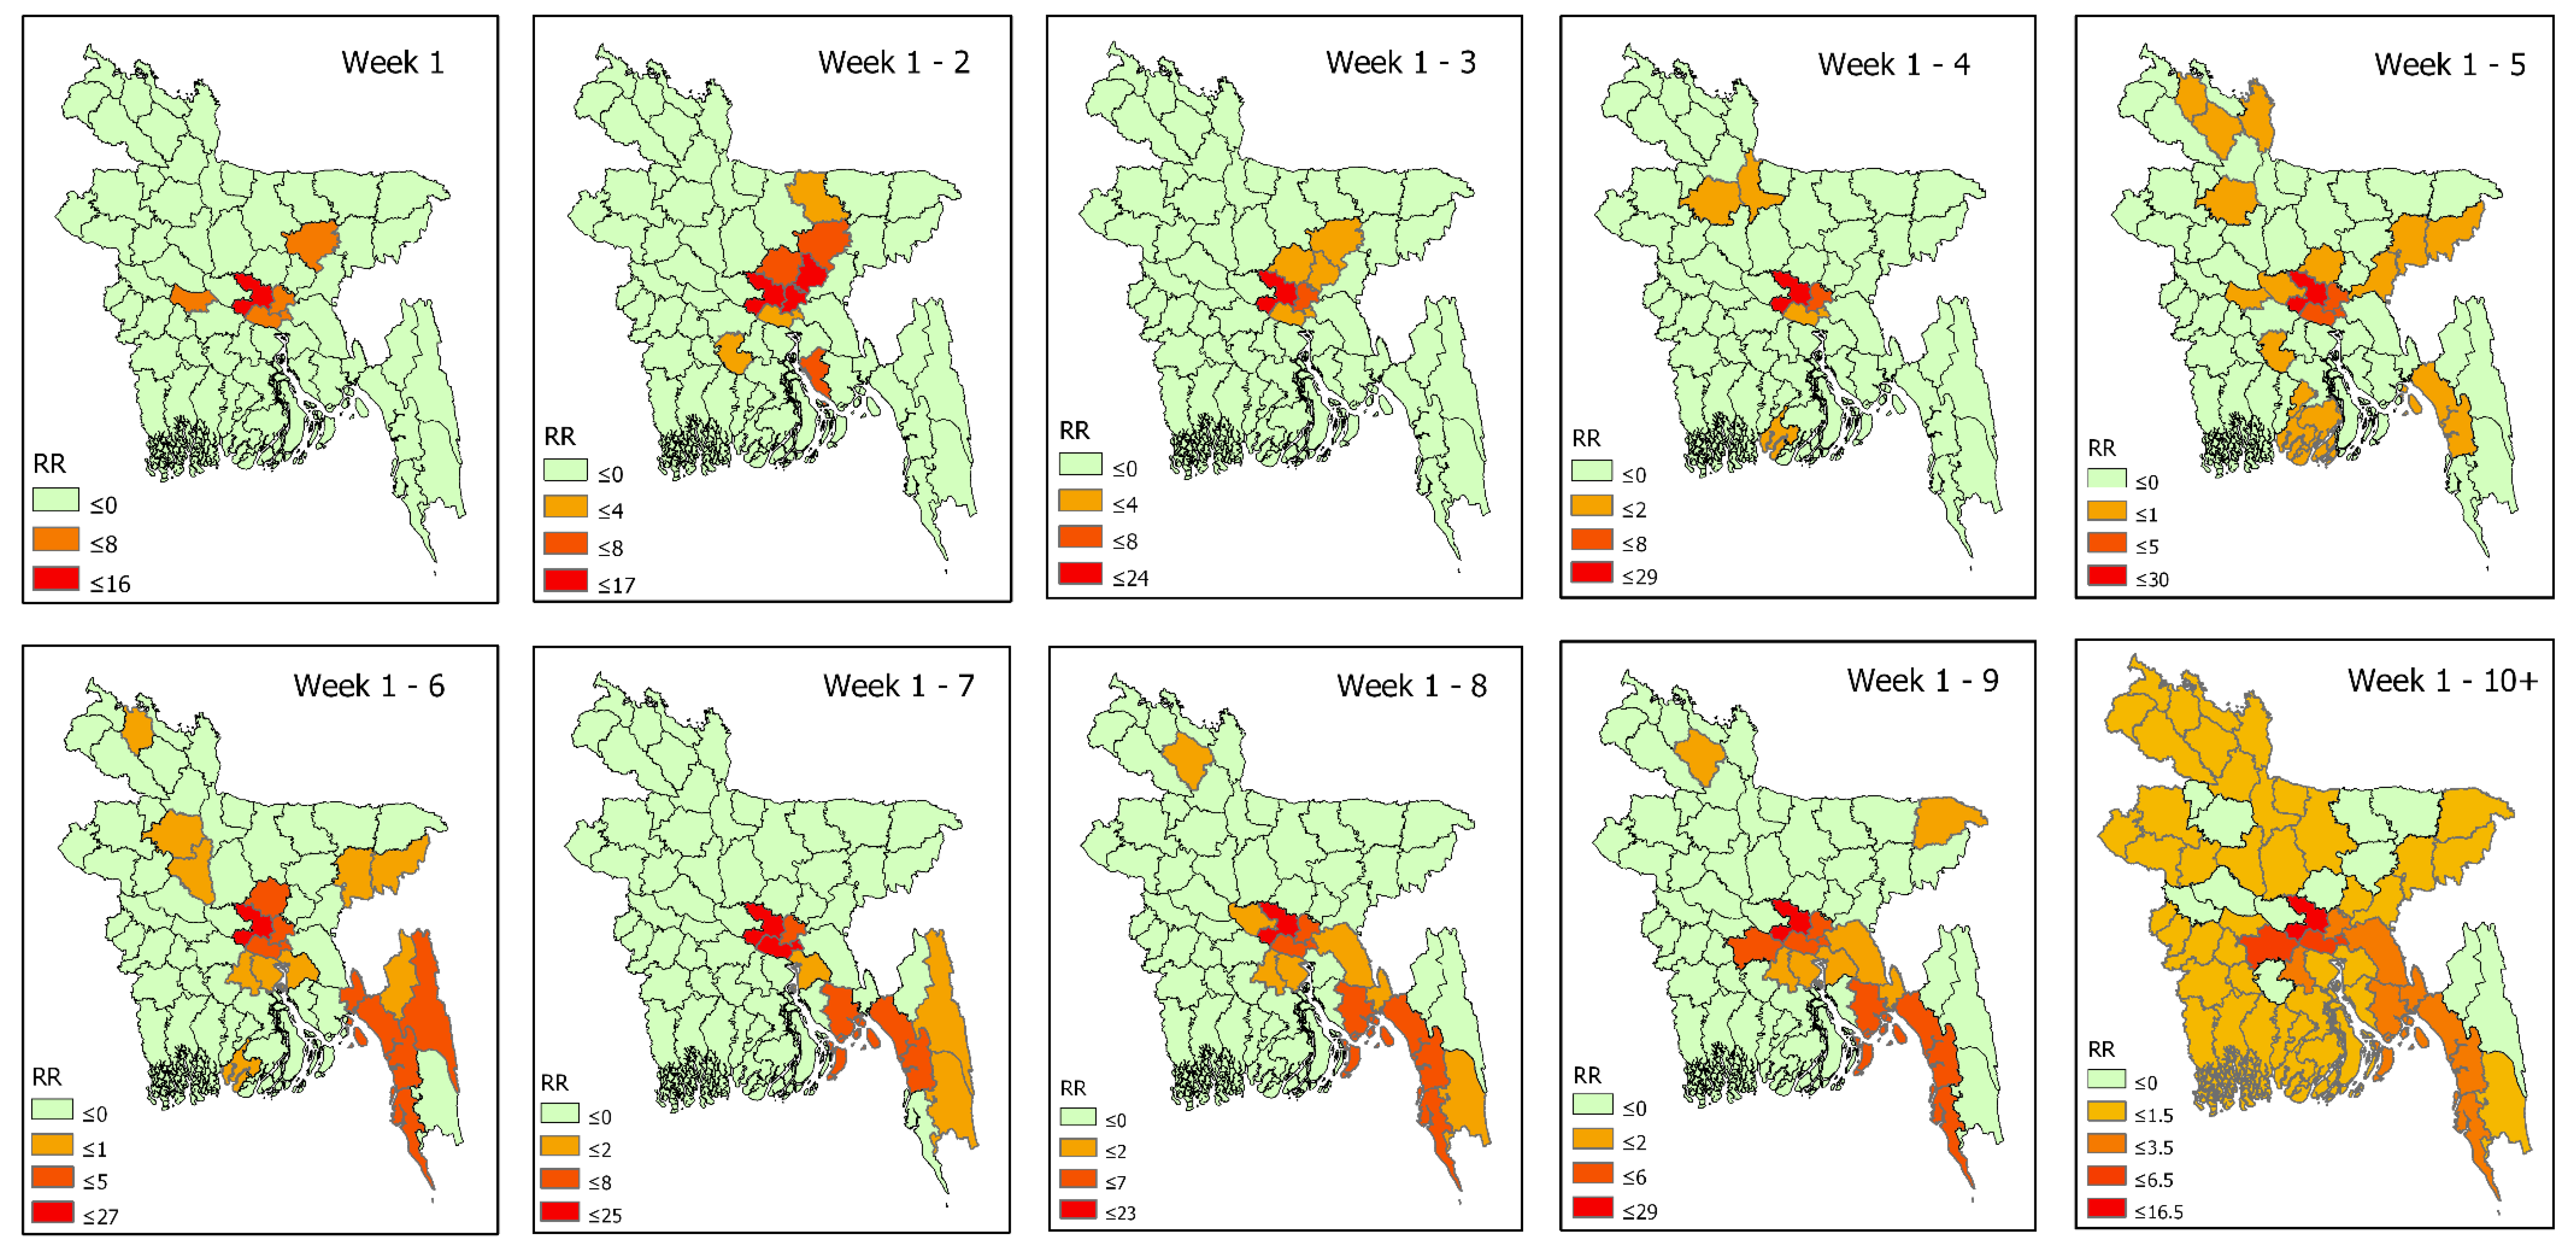
3.3.2. Space-Time Propagation of COVID-19 Transmission in Bangladesh
4. Discussion
5. Conclusions
Author Contributions
Funding
Acknowledgments
Conflicts of Interest
Appendix A


References
- Peeri, N.C.; Shrestha, N.; Rahman, S.; Zaki, R.; Tan, Z.; Bibi, S.; Baghbanzadeh, M.; Aghamohammadi, N.; Zhang, W.; Haque, U. The SARS, MERS and novel coronavirus (COVID-19) epidemics, the newest and biggest global health threats: What lessons have we learned? Int. J. Epidemiol. 2020, 49, 717–726. [Google Scholar] [CrossRef] [PubMed] [Green Version]
- Li, Q.; Guan, X.; Wu, P.; Wang, X.; Zhou, L.; Tong, Y.; Ren, R.; Leung, K.S.; Lau, E.H.; Wong, J.Y.; et al. Early Transmission Dynamics in Wuhan, China, of Novel Coronavirus–Infected Pneumonia. N. Engl. J. Med. 2020, 382, 1199–1207. [Google Scholar] [CrossRef] [PubMed]
- Acter, T.; Uddin, N.; Das, J.; Akhter, A.; Choudhury, T.R.; Kim, S. Evolution of severe acute respiratory syndrome coronavirus 2 (SARS-CoV-2) as coronavirus disease 2019 (COVID-19) pandemic: A global health emergency. Sci. Total. Environ. 2020, 730, 138996. [Google Scholar] [CrossRef] [PubMed]
- Dong, E.; Du, H.; Gardner, L. An interactive web-based dashboard to track COVID-19 in real time. Lancet Infect. Dis. 2020, 20, 533–534. [Google Scholar] [CrossRef]
- Desjardins, M.; Hohl, A.; Delmelle, E. Rapid surveillance of COVID-19 in the United States using a prospective space-time scan statistic: Detecting and evaluating emerging clusters. Appl. Geogr. 2020, 118, 102202. [Google Scholar] [CrossRef]
- Giuliani, D.; Dickson, M.M.; Espa, G.; Santi, F. Modelling and Predicting the Spatio-Temporal Spread of Coronavirus Disease 2019 (COVID-19) in Italy. SSRN Electron. J. 2020. [Google Scholar] [CrossRef] [Green Version]
- Tang, W.; Liao, H.; Marley, G.; Wang, Z.; Cheng, W.; Wu, D.; Yu, R. The Changing Patterns of Coronavirus Disease 2019 (COVID-19) in China: A Tempogeographic Analysis of the Severe Acute Respiratory Syndrome Coronavirus 2 Epidemic. Clin. Infect. Dis. 2020, 71, 818–824. [Google Scholar] [CrossRef]
- Chowdhury, R.; Heng, K.; Shawon, S.R.; Goh, G.; Okonofua, D.; Ochoa-Rosales, C.; Gonzalez-Jaramillo, V.; Bhuiya, A.; Reidpath, D.; Prathapan, S.; et al. Dynamic interventions to control COVID-19 pandemic: A multivariate prediction modelling study comparing 16 worldwide countries. Eur. J. Epidemiol. 2020, 35, 389–399. [Google Scholar] [CrossRef]
- Monjur, M.R.; Hassan, Z. Early phases of COVID-19 management in a low-income country: Bangladesh. Infect. Control. Hosp. Epidemiol. 2020. [Google Scholar] [CrossRef] [Green Version]
- Bhuiyan, A.K.M.I.; Sakib, N.; Pakpour, A.H.; Griffiths, M.D.; Mamun, M.A. COVID-19-Related Suicides in Bangladesh Due to Lockdown and Economic Factors: Case Study Evidence from Media Reports. Int. J. Ment. Heal. Addict. 2020, 1–6. [Google Scholar] [CrossRef]
- Wadood, A.; Mamun, A.; Rafi, A.; Islam, K.; Mohd, S.; Lee, L.L.; Hossain, G. Knowledge, attitude, practice and perception regarding COVID-19 among students in Bangladesh: Survey in Rajshahi University. medRxiv 2020. [Google Scholar] [CrossRef] [Green Version]
- Khan, H.R.; Howlader, T.; Islam, M. Battling the COVID-19 Pandemic Is Bangladesh Prepared. Medrxiv 2020. [Google Scholar] [CrossRef]
- Al Azad, A.K.; Hussain, A.M. Modeling and Analysis of the Early-Growth Dynamics of COVID-19 Transmission. Preprints 2020. [Google Scholar] [CrossRef]
- Ahmed, A.; Rahman, M.M. COVID-19 trend in Bangladesh: Deviation from epidemiological model and critical analysis of the possible factors. medRxiv 2020. [Google Scholar] [CrossRef]
- Islam, T.; Talukder, A.K.; Siddiqui, N.; Islam, M.T. Tackling the Pandemic COVID-19: The Bangladesh Perspective. Preprints 2020. [Google Scholar] [CrossRef]
- Franch-Pardo, I.; Napoletano, B.M.; Rosete-Verges, F.; Billa, L. Spatial analysis and GIS in the study of COVID-19. A review. Sci. Total. Environ. 2020, 739, 140033. [Google Scholar] [CrossRef]
- Xiong, Y.; Wang, Y.; Chen, F.; Zhu, M. Spatial Statistics and Influencing Factors of the COVID-19 Epidemic at Both Prefecture and County Levels in Hubei Province, China. Int. J. Environ. Res. Public Health 2020, 17, 3903. [Google Scholar] [CrossRef]
- Guan, W.-J.; Ni, Z.-Y.; Hu, Y.; Liang, W.-H.; Ou, C.-Q.; He, J.-X.; Liu, L.; Shan, H.; Lei, C.-L.; Hui, D.S.; et al. Clinical Characteristics of Coronavirus Disease 2019 in China. N. Engl. J. Med. 2020, 382, 1708–1720. [Google Scholar] [CrossRef]
- Su, L.; Hong, N.; Zhou, X.; He, J.; Ma, Y.; Jiang, H.; Han, L.; Chang, F.; Shan, G.; Zhu, W.; et al. Evaluation of the Secondary Transmission Pattern and Epidemic Prediction of COVID-19 in the Four Metropolitan Areas of China. Front. Med. 2020, 7. [Google Scholar] [CrossRef]
- Gatto, M.; Bertuzzo, E.; Mari, L.; Miccoli, S.; Carraro, L.; Casagrandi, R.; Rinaldo, A. Spread and dynamics of the COVID-19 epidemic in Italy: Effects of emergency containment measures. Proc. Natl. Acad. Sci. USA 2020, 117, 10484–10491. [Google Scholar] [CrossRef] [Green Version]
- Orea, L.; Álvarez, I.C. How effective has the Spanish lockdown been to battle COVID-19? A spatial analysis of the coronavirus propagation across provinces. Documento de Trabajo 2020, 3, 1–33. [Google Scholar]
- Ferreira, R.V.; Martines, M.R.; Toppa, R.H.; Assuncao, L.M.; Desjardins, M.; Delmelle, E. Applying a Prospective Space-Time Scan Statistic to Examine the Evolution of COVID-19 Clusters in the State of São Paulo, Brazil. medRxiv 2020. [Google Scholar] [CrossRef]
- Hohl, A.; Delmelle, E.; Desjardins, M. Rapid detection of COVID-19 clusters in the United States using a prospective space-time scan statistic: An update. SIGSPATIAL Spec. 2020, 12, 27–33. [Google Scholar] [CrossRef]
- Mollalo, A.; Vahedi, B.; Rivera, K.M. GIS-based spatial modeling of COVID-19 incidence rate in the continental United States. Sci. Total. Environ. 2020, 728, 138884. [Google Scholar] [CrossRef]
- Kulldorff, M.; Heffernan, R.; Hartman, J.; Assunção, R.; Mostashari, F. A Space–Time Permutation Scan Statistic for Disease Outbreak Detection. PLoS Med. 2005, 2, e59. [Google Scholar] [CrossRef] [Green Version]
- Dobson, J.E.; Bright, E.A.; Coleman, P.R.; Durfee, R.C.; Worley, B.A. LandScan: A global population database for estimating populations at risk. Photogramm. Eng. Remote Sens. 2000, 66, 849–857. [Google Scholar]
- Bhaduri, B.; Bright, E.; Coleman, P.; Urban, M.L. LandScan USA: A high-resolution geospatial and temporal modeling approach for population distribution and dynamics. GeoJournal. 2007, 69, 103–117. [Google Scholar] [CrossRef]
- Kulldorff, M.; Athas, W.F.; Feurer, E.J.; A Miller, B.; Key, C.R. Evaluating cluster alarms: A space-time scan statistic and brain cancer in Los Alamos, New Mexico. Am. J. Public Health 1998, 88, 1377–1380. [Google Scholar] [CrossRef] [Green Version]
- Kulldorff, M. Prospective time periodic geographical disease surveillance using a scan statistic. J. R. Stat. Soc. Ser. A Stat. Soc. 2001, 164, 61–72. [Google Scholar] [CrossRef]
- Kulldorff, M. SatScan User Guide 2006; Information Management Services Inc.: Rockville, MD, USA, 2006; p. 8. [Google Scholar]
- Owusu, C.; Desjardins, M.R.; Baker, K.M.; Delmelle, E. Residential mobility impacts relative risk estimates of space-time clusters of chlamydia in Kalamazoo County, Michigan. Geospat. Health 2019, 14, 254–264. [Google Scholar] [CrossRef] [Green Version]
- Desjardins, M.R.; Whiteman, A.; Casas, I.; Delmelle, E. Space-time clusters and co-occurrence of chikungunya and dengue fever in Colombia from 2015 to 2016. Acta Trop. 2018, 185, 77–85. [Google Scholar] [CrossRef] [PubMed]
- Kamruzzaman, M. Bangladesh: Thousands Gather at Mosques amid Pandemic. Anadolu Ajansı, 8 May 2020. Available online: http://www.aa.com.tr/en/asia-pacific/bangladesh-thousands-gather-at-mosques-amid-pandemic/1833947 (accessed on 6 August 2020).
- India Today. Coronavirus: Bangladesh Shuts Largest Brothel over Covid-19 Fears (21 March 2020). Available online: https://www.indiatoday.in/world/story/coronavirus-bangladesh-shuts-largest-brothel-over-covid-19-fears-1658163-2020-03-21 (accessed on 14 June 2020).
- Karim, N. Sex Workers in One of World’s Largest Brothels Appeal for Funds due Coronavirus (23 March 2020). Available online: https://www.reuters.com/article/us-health-coronavirus-bangladesh/sex-workers-in-one-of-worlds-largest-brothels-appeal-for-funds-due-coronavirus-idUSKBN21A2YA (accessed on 14 June 2020).
- AFP News: Massive Bangladesh Coronavirus Prayer Gathering Sparks Outcry (19 March 2020). Available online: https://news.yahoo.com/massive-bangladesh-coronavirus-prayer-gathering-sparks-outcry-193538973.html (accessed on 14 June 2020).
- Mahmud, A.; Garcia, J. 100,000 People Gather for Funeral in Bangladesh, Defying Coronavirus Lockdown (20 April 2020). Available online: https://www.cnn.com/world/live-news/coronavirus-pandemic-04-19-20-intl/h_dc3aa1b7d774fa483ceebe9ece71653e (accessed on 14 June 2020).
- Nooruddin, I.; Shahid, R. Atlantic Council Report: Defusing Bangladesh’s COVID-19 Time Bomb (31 March 2020). Available online: https://www.atlanticcouncil.org/blogs/new-atlanticist/defusing-bangladeshs-covid-19-timebomb/ (accessed on 14 June 2020).
- Savage, S.; Ahsan, N. Coronavirus Exposes the Deep Divide in Bangladeshi Society (11 June 2020). Available online: https://www.telegraph.co.uk/global-health/climate-and-people/coronavirus-exposes-deep-divide-bangladeshi-society/ (accessed on 14 June 2020).
- Lai, S.; Ruktanonchai, N.W.; Zhou, L.; Prosper, O.; Luo, W.; Floyd, J.R.; Wesolowski, A.; Santillana, M.; Zhang, C.; Du, X.; et al. Effect of non-pharmaceutical interventions to contain COVID-19 in China. Nature 2020, 1–7. [Google Scholar] [CrossRef] [PubMed]
- Pettersson, H.; Manley, B.; Hernandez, S. CNN Health: Tracking Coronavirus’ Global Spread (14 June 2020). Available online: https://www.cnn.com/interactive/2020/health/coronavirus-maps-and-cases/ (accessed on 14 June 2020).
- Kulldorff, M.; Kleinman, K. Comments on ‘A critical look at prospective surveillance using a scan statistic’ by T. Correa, M. Costa, and R. Assunção. Stat. Med. 2015, 34, 1094–1095. [Google Scholar] [CrossRef] [PubMed] [Green Version]
- Khan, H.R.; Howlader, T. Breaking the back of COVID-19 Is Bangladesh doing enough testing. Medrxiv 2020. [Google Scholar] [CrossRef]


| Parameters Used in Prospective Analysis | |
|---|---|
| Probability model | Discrete Poisson |
| Scan for areas | High or low rates |
| Time aggregation units | 1 |
| Spatial window | 10% of the population at risk |
| Spatial window shape | Circular |
| Maximum temporal cluster size | 50% of the study period |
| Minimum temporal cluster size | 2 units |
| Minimum number of cases for high rate clusters | 3 (5 for Dhaka city) |
| p-value | Default |
| Maximum Monte Carlo replications | 999 |
| Spatial and temporal trend adjustments | None |
| Cluster | Duration (Days) | No. of Thanas | p | Observed | Expected | Relative Risk (RR) | No. of Thanas RR > 1 |
|---|---|---|---|---|---|---|---|
| 1 | 30-May–15-June | 1 | <0.001 | 1289 | 107.98 | 11.94 | 1 (Mirpur) |
| 2 | 30-May–15-June | 6 | <0.001 | 1304 | 294.99 | 4.42 | 6 |
| 3 | 30-May–15-June | 5 | <0.001 | 1142 | 332.11 | 3.44 | 5 |
| 4 | 30-May–15-June | 1 | <0.001 | 506 | 106.85 | 4.74 | 1 (Uttara) |
| 5 | 30-May–15-June | 2 | <0.001 | 539 | 163.76 | 3.29 | 2 |
| 6 | 12-May–15-June | 3 | <0.001 | 177 | 664.8 | 0.27 | 0 |
| 7 | 30-May–15-June | 5 | <0.001 | 648 | 300.39 | 2.16 | 5 |
| 8 | 30-May–15-June | 2 | <0.001 | 143 | 38.5 | 3.71 | 2 |
| 9 | 12-May–15-June | 1 | <0.001 | 152 | 305.51 | 0.5 | 0 |
| 10 | 12-May–15-June | 5 | <0.001 | 262 | 428.88 | 0.61 | 1 |
| 11 | 12-May–15-June | 1 | <0.001 | 97 | 203.16 | 0.48 | 0 |
| Cluster | Duration (Days) | No. of Districts | p | Observed | Expected | Relative Risk | No. of Districts RR > 1 |
|---|---|---|---|---|---|---|---|
| 1 | 18-April–30-April | 3 | <0.001 | 3866 | 310.1932 | 25.44 | 3 |
| 2 | 18-April–30-April | 6 | <0.001 | 56 | 349.8174 | 0.15 | 0 |
| 3 | 18-April–30-April | 6 | <0.001 | 68 | 332.197 | 0.20 | 0 |
| 4 | 18-April–30-April | 6 | <0.001 | 48 | 288.4021 | 0.16 | 0 |
| 5 | 18-April–30-April | 4 | <0.001 | 73 | 267.9812 | 0.27 | 0 |
| 6 | 18-April–30-April | 8 | <0.001 | 100 | 281.342 | 0.35 | 0 |
| 7 | 18-April–30-April | 6 | <0.001 | 126 | 318.2578 | 0.39 | 0 |
| 8 | 18-April–30-April | 4 | <0.001 | 45 | 126.2793 | 0.35 | 0 |
| 9 | 18-April–30-April | 1 | <0.001 | 147 | 71.30506 | 2.08 | 1 |
| 10 | 22-April–30-April | 2 | <0.001 | 34 | 89.81475 | 0.38 | 0 |
| Cluster | Duration (Days) | No. of Districts | p | Observed | Expected | Relative Risk (RR) | No. of Districts RR > 1 |
|---|---|---|---|---|---|---|---|
| 1 | 13-May–15-June | 2 | <0.001 | 18,314 | 1360.11 | 20.07 | 2 |
| 2 | 13-May–15-June | 3 | <0.001 | 4828 | 1879.79 | 2.73 | 2 |
| 3 | 22-May–15-June | 5 | <0.001 | 3421 | 1202.36 | 2.97 | 5 |
| 4 | 11-May–15-June | 5 | <0.001 | 256 | 1808.05 | 0.14 | 0 |
| 5 | 11-May–15-June | 7 | <0.001 | 946 | 2510.26 | 0.37 | 0 |
| 6 | 22-May–15-June | 3 | <0.001 | 2745 | 1327.34 | 2.13 | 3 |
| 7 | 11-May–15-June | 3 | <0.001 | 346 | 1377.94 | 0.25 | 0 |
| 8 | 11-May–15-June | 2 | <0.001 | 210 | 1112.93 | 0.19 | 0 |
| 9 | 11-May–15-June | 7 | <0.001 | 927 | 2099.74 | 0.43 | 0 |
| 10 | 6-Jun–15-June | 8 | <0.001 | 984 | 2018.82 | 0.48 | 0 |
| 11 | 6-May–5-June | 2 | <0.001 | 2 | 308.89 | 0.01 | 0 |
| 12 | 11-May–15-June | 4 | <0.001 | 1112 | 2032.00 | 0.54 | 0 |
| 13 | 7-Jun–15-June | 2 | <0.001 | 444 | 133.02 | 3.36 | 2 |
| Onset Week | High RR District | Intervention Scenarios | News Reference(s) | ||
|---|---|---|---|---|---|
| What Happened | When Happened | Likely Incubation Period | |||
| 4–10 April | Rajbari | Daulatdia brothel–largest in Bangladesh, was shut down | 20 March | ~2 weeks | India Today (21 March 2020) [34] Karim, N. (23 March 2020) [35] |
| 11–17 April | Lakshmipur | >25,000 people congregated for a prayer event called ‘Khatme Shifa’ at the Central Eidgah in Raipur | 18 March | ~3 weeks | AFP News (19 March 2020) [36] |
| 2 May–8 May | Brahmanbaria Habiganj Maulvibazar | >100,000 people attended a funeral in Brahmanbaria | 18 April | ~2 weeks | Mahmud & Garcia (20 April 2020) [37] |
| Chittagong | Coastal areas of Chittagong and Cox’s Bazar bustled with people and activity | Imposed school holiday (18–28 Mar) | ~5 weeks | Nooruddin & Shahid (31 March 2020) [38] | |
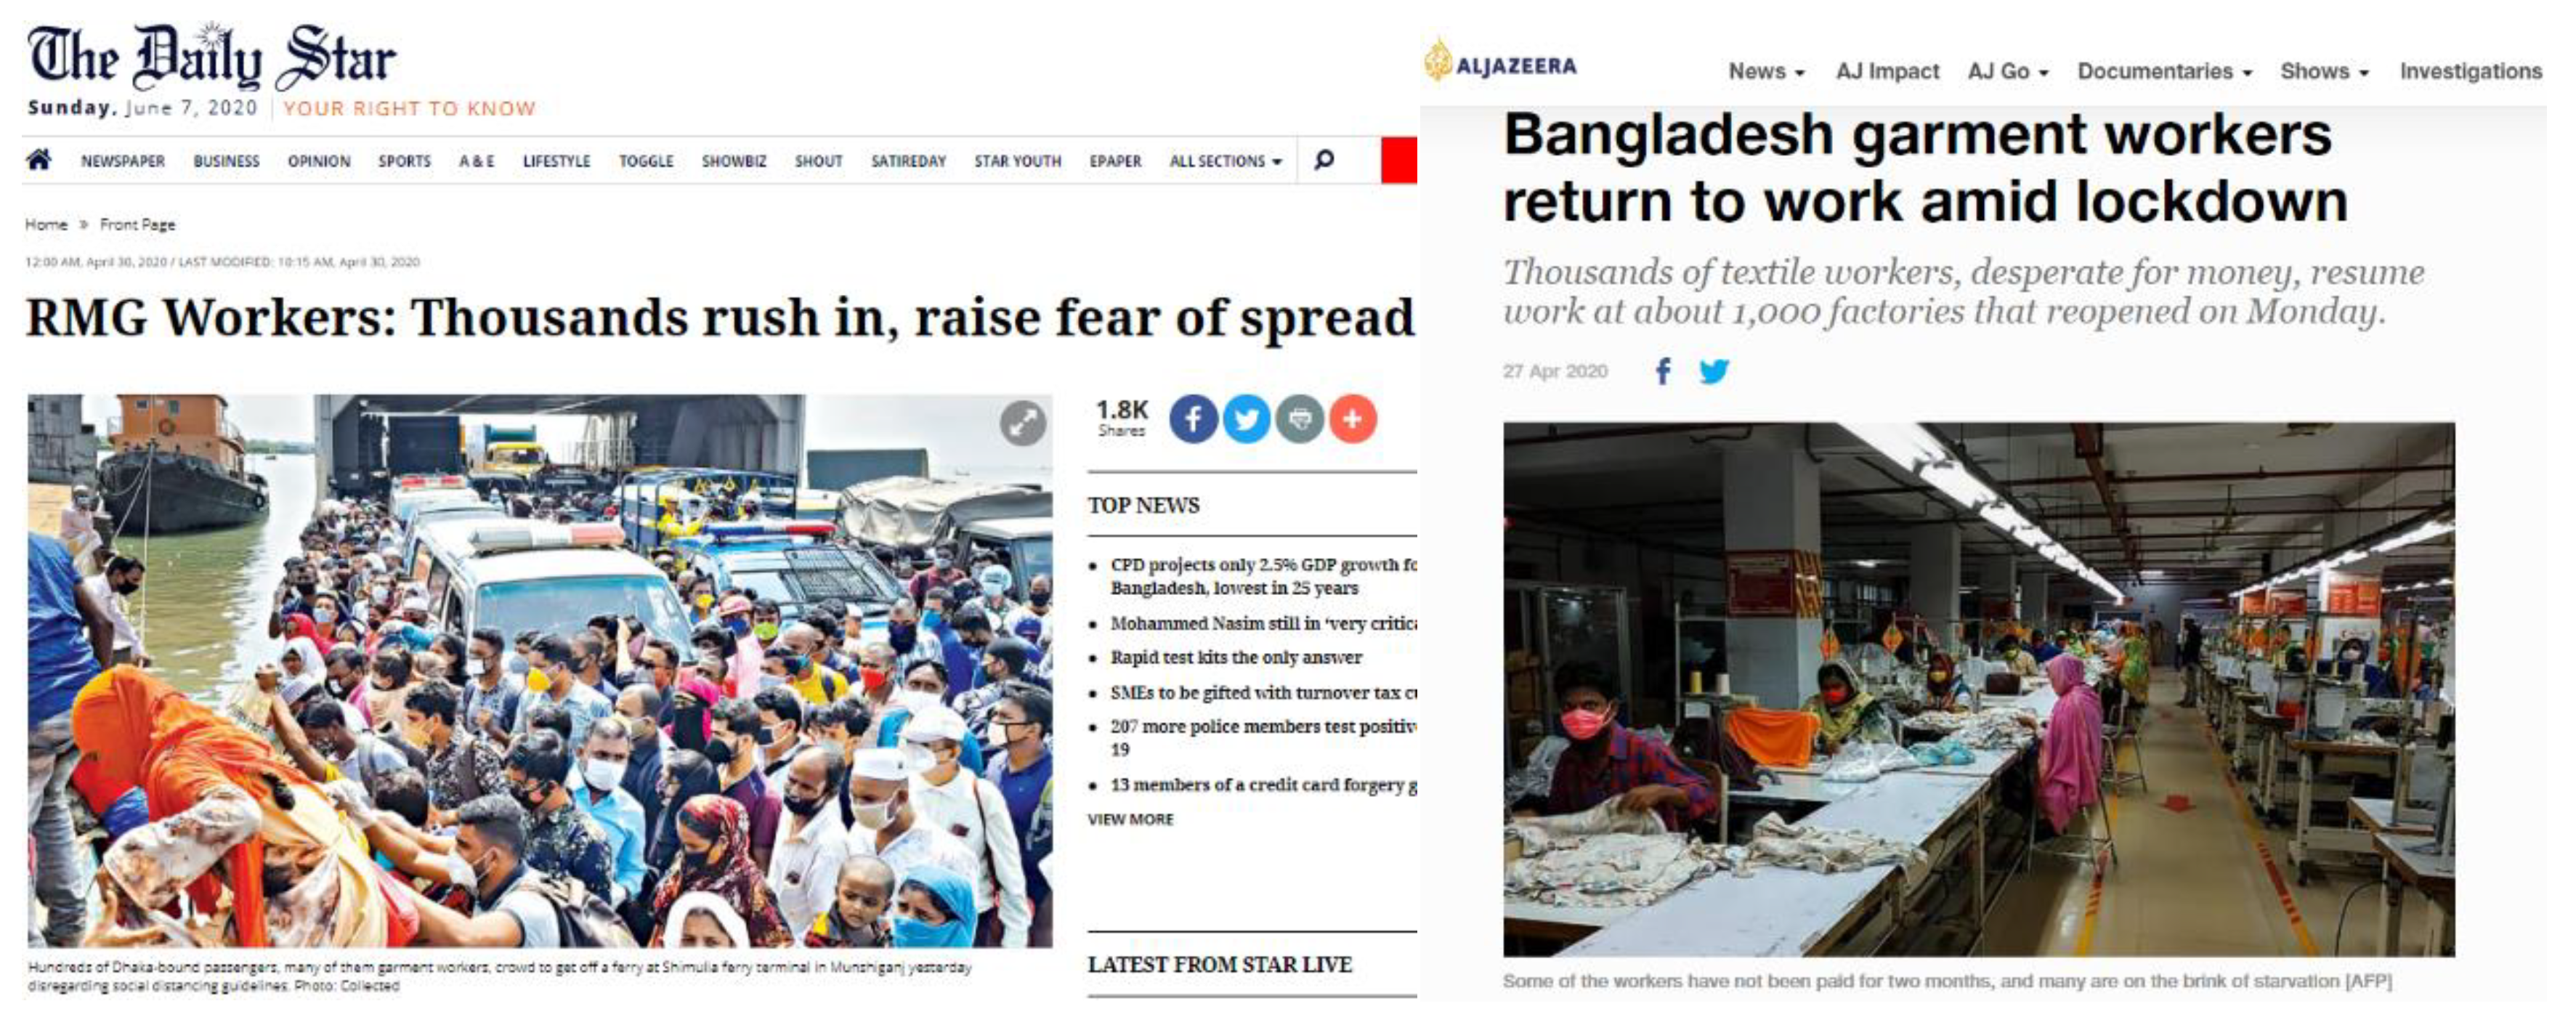
| 9–15 May | Madaripur Shariatpur Chandpur Feni Cox’s Bazar | Amidst nationwide lockdown, people rushed to Dhaka’s industrial belts to resume working | 27 April | ~ 2 weeks | Nooruddin & Shahid (31 March 2020) [38] |
© 2020 by the authors. Licensee MDPI, Basel, Switzerland. This article is an open access article distributed under the terms and conditions of the Creative Commons Attribution (CC BY) license (http://creativecommons.org/licenses/by/4.0/).
Share and Cite
Masrur, A.; Yu, M.; Luo, W.; Dewan, A. Space-Time Patterns, Change, and Propagation of COVID-19 Risk Relative to the Intervention Scenarios in Bangladesh. Int. J. Environ. Res. Public Health 2020, 17, 5911. https://doi.org/10.3390/ijerph17165911
Masrur A, Yu M, Luo W, Dewan A. Space-Time Patterns, Change, and Propagation of COVID-19 Risk Relative to the Intervention Scenarios in Bangladesh. International Journal of Environmental Research and Public Health. 2020; 17(16):5911. https://doi.org/10.3390/ijerph17165911
Chicago/Turabian StyleMasrur, Arif, Manzhu Yu, Wei Luo, and Ashraf Dewan. 2020. "Space-Time Patterns, Change, and Propagation of COVID-19 Risk Relative to the Intervention Scenarios in Bangladesh" International Journal of Environmental Research and Public Health 17, no. 16: 5911. https://doi.org/10.3390/ijerph17165911