Article

A Novel Approach for Indexing Heavy Metals Pollution to Assess Groundwater Quality for Drinking Purposes

1
Faculty of Geoscience and Environmental Engineering, Southwest Jiaotong University, Chengdu 611756, China
2
College of Water and Environmental Engineering, Sudan University of Science and Technology, Khartoum 12304, Sudan
3
School of Transportation and Logistics Engineering, Southwest Jiaotong University, Chengdu 611756, China
*
Author to whom correspondence should be addressed.
Int. J. Environ. Res. Public Health 2020, 17(4), 1245; https://doi.org/10.3390/ijerph17041245
Submission received: 2 January 2020 / Revised: 6 February 2020 / Accepted: 11 February 2020 / Published: 14 February 2020
(This article belongs to the Special Issue Trace Element Exposure and Human Health)

Abstract

:
The present study proposes a new approach for indexing heavy metals ions to examine groundwater quality in North Kurdufan Province, Sudan. The new approach is developed based on the most frequently used methods for indexing heavy metals pollution in water. It is created in order to avoid the weaknesses of the current indexing systems. As per the new indexing approach, heavy metal contamination in water samples is evaluated by two types of indices: the negative evaluation index (NEI) and positive evaluation index (PEI). The water worthiness is assessed based on a pair of indices, NEI and PEI. Water quality increases with the decrease of PEI and NEI values. NEI indicates the contribution of heavy metals with a concentration not exceeding the highest desirable limit ( I i ) in the water sample, while vice versa regarding the PEI. If all heavy metals concentrations in the water sample do not exceed I i , the sum of NEI should be less than zero, but not less than −100, implying that the sum of PEI will be zero. When all heavy metals concentration exceeds I i , the sum of NEI should be equal to zero, and PEI will be greater than zero. The results of the newly proposed approach have been discussed and compared with the existing indexing methods as regards to the best and worst samples. The spatial distribution of NEI and PEI are in complete agreement with the metals spatial distribution. The comparison result showed that the new index is robust, with fair calculations, and gives the best classification of groundwater quality.

1. Introduction

Groundwater has the advantage of low transmission cost, which makes it a perfect source for water supply, compared with surface water. Over the last two decades, the use of groundwater primarily for irrigation has increased significantly to meet the agricultural and economic development targets in many areas of Sudan, especially in regions far off the Nile system [1]. Unfortunately, these developments were implemented in an unplanned manner, which led to many problems for groundwater sources. In the study area, two sources of contaminants are expected to happen, which are considered to be an uncontrolled release. These groundwater contaminants sources come from: natural and anthropogenic (or man-made), that can alter the natural composition of groundwater. The natural source basically occurs from the rocks weathering, resulting from improper discharge from wells. The anthropogenic source includes municipal wastes, fertilizers, pesticides and many other factors that can reach to groundwater through groundwater recharge with surface water, which contain various pollutants [2]. While natural sources mainly include hazardous substances such as fluoride, nitrates, and heavy metals, which are found in the geological formations [2], once groundwater gets contaminated, it is difficult to reverse it to the pristine state [3].
Heavy metals contamination is posing a major problem to the aquatic environment and, therefore, are hazardous towards living beings [4,5]. Many prior studies concluded that there is an adverse health effect related to heavy metals exposure [6,7]. Water quality for the designated purpose is a function of water parameters concentration value with their desirable and permissible limits as per national and world health organization standards. Since the water sample contains a set of individual elements in different concentrations compared to the allowable limit for a particular purpose, it is difficult to judge water quality based on independent assessment. Thus, it is necessary to have a comprehensive quality assessment that will jointly take into account all the effects of water constituents. From this standpoint, the development of heavy metals pollution indexing methods (HPI s ) is investigated. HPI s are not limited to the aquatic environment but were applied to environment mold that comprises soil, sediment, foods, etc. [8,9,10,11,12].
Furthermore, the classification task is arduous as water quality does not only depend on the water constituent’s concentration but also on their relative importance in water as well as their toxicity. Therefore, the overall evaluation indices would make the task straightforward. Many researchers have developed different approaches to water quality indices and, understandably, all of them are semi-empirical [8,9,13,14,15,16,17,18,19]. Additionally, most of these techniques lack a theoretical basis, and their results vary quite a lot from each other. The methods mostly used for heavy metals indexing in groundwater quality assessment are proposed initially and formulated by Mohan, Edet and their co-authors [4,8,17,20,21] based on the highest desirable, maximum permissible and maximum allowable concentration. Also, Liu et al. [18,22] proposed an index to assess the environmental quality based on the maximum allowable concentration. These above methods have major drawbacks related to the estimation of the relative importance of individual elements in water quality, among others, which may lead to erroneous sample classification. In this work, a new approach is proposed to address these shortcomings while maintaining the advantage. We applied this approach to examine groundwater quality in north Kurdufan Province, Sudan, to assess the application potentials.
Past studies carried out for Kurdufan regions were limited to hydrological, geological, and hydrochemical properties of the confined and unconfined aquifers [23,24,25,26]. The studies concluded that the groundwater belonging to both aquifers inherited the physicochemical properties of sedimentary formations. In this research, we investigate groundwater quality and heavy metals risk based on the proposed modified heavy metal evaluation index (MHEI) in the case study of North Kurdufan Province, Sudan.

2. The Motivation for the New Approach

2.1. Heavy Metal Pollution Index (HPI)

HPI proposed by Mohan et al. [8], is used to determine overall water quality depending on heavy metal ions, and calculated according to Equation (1).
H P I = i = 1 n W i Q i
where W i is the relative weight or weighting factor for each chosen parameter defined as Equation (2); Q i is the individual quality rating for the i t h heavy metal ion calculated for each parameter using Equation (3) and n is the number of parameters.
W i = w i i = 1 n w i
Q i = M i - I i ( S i - I i ) × 100
where w i means the unit weight factor for the i t h heavy metal, which is inversely proportional to the maximum permissible value S i of the corresponding parameter as defined in Equation (4). M i is the measured concentration value of each parameter in the groundwater samples; I i and S i indicate the highest desirable and maximum permissible value standard of the i t h parameters, respectively in according to Sudanese Standards and Metrology Organization (SSMO 2002), World Health Organization (WHO 2011), and (GB/T14848-1993) standards [27,28,29]. In the case of potable water, the maximum allowable value of HPI is 100, and less than 100 is considered suitable for drinking.
w i 1 S i = k S i = 1 S i
where the proportionality factor k is taken equal to one for all metals in the literature [8,20].

2.2. Mean Metal Index (MI)

Tamasi and Cini [9] applied maximum allowed concentration (MAC) in estimating the value of MI and expressed by Equation (5).
M I = i = 1 n M i M A C i
To assess the quality of drinking water, the value of MI can be divided into six classes: very pure (<0.3), purified (0.3–1.0), slightly affected (1.0–2.0), moderately affected (2.0–4.0), strongly affected (4.0–6.0) and seriously affected (>6.0) [10].

2.3. PoS Method

PoS index is developed by Tziritis et al. [18] to evaluate overall water quality depending on its physicochemical composition, and calculated according to Equation (6).
P o S = i = 1 n Q i
Q i = ( M i × W i ) S i × 1000
where Q i is the individual quality contribution index, M i represents the monitored concentration of ith parameters, and W i is the relative weight for each chosen parameter defined as Equation (8).
W i = w i i = 1 n w i
where w i is the assigned weight value, which determines depend on its overall impact in terms of human toxicity. Based on the original PoS method [22], the partial scores of each parameter are allotted (Priority List of Hazardous Substances), as presented in Table 1.
According to the authentic PoS method, the groundwater samples are categorized into six classes indicating to water quality degradation level: minimum (1.0), low (2.0), medium (3.0), high (4.0), very high (5.0) and severe degradation (6.0) [18]. The reference index of PoS is calculated by supposing M i equating the maximum allowable limit (MAC i ), which is subsequently used to determine the PoS categories. For more details on PoS index can be found in recent literature [30].
The formulations of the techniques mentioned above have some major shortcomings; we can summarize them in the following points:
  • The numerator term in Equation (3) can lead to the wrong classification. Consider the measured concentration values of zinc of two samples A and B to be 55 and 45 μg/L, respectively, and the highest desirable limit value of zinc is 50 μg/L; the effect of both concentrations will be the same, while in reality, sample A should fail, and sample B should pass the quality test.
  • As already known, a higher value of HPI indicates poor water quality and vice versa. Thus, when calculating the individual quality rating Q i using Equation (3), the Q i value adds to the overall index even when M i is less than I i .
  • Also, the expression of MI and PoS are given in Equations (5) and (7). The influence of the sub-index for each heavy metal will be added to the overall index even when M i is less than MAC, leading to an erroneous increase of MI and PoS.
  • The estimation of MI as in Eqnuation (5) considered the concentration value of elements without regarding the toxicity to the overall water quality.
  • As per Equations (1) and (4), if the water sample encompasses many metals, the value of the relative weight of some elements such as zinc may be equal zero ( S i = 3000). Thus, the influence of zinc metal in the water sample will be absent, even when M i is higher than S i .
  • There are many rating ranges for HPIs as excellent, perfect, good, poor, and very poor regarding the water quality. However, the classifications of water quality by the aforementioned approaches are neither clear nor sufficient to determine the water quality. In theory and practice, the rating should be flexible depending on the level of influence of the individual concentration of elements as per water quality standard. This issue has been handled in developing the proposed MHEI method.

3. Materials and Methods

3.1. Sampling Site, Collection, and Analysis of Data

The samples are collected from different locations in a populated area of North Kurdufan State. Figure 1 depicts the sampling sites. The geological formations in the area are combinations of (Pleistocene to Recent): (1) Basement complex of Precambrian, (2) Nawa Series (upper Paleozoic), (3) Nubian Series (Mesozoic) and (4) Um Ruwaba Series (Pliocene to Pleistocene) [23]. The samples are collected in one-liter polyethylene bottles after a thorough cleaning. The bottles were labeled before being transported and kept at a temperature below 4 °C until analyzed. Groundwater samples are filtered through a 0.45-μm Millipore membrane filter to separate the suspended sediments before analyzing them in the laboratory. The samples are collected from 18 groundwater extraction pump of a confined aquifer (Figure 1). The samples are collected after 10 min of pumping in one-liter polyethylene bottles after a thorough cleaning and repeated the samplings three once per well for each period (Three samples/well). The data are collected from January to December through two years 2017 and 2018; and statistically analyzed. It is noted that there was no significant variation through different periods in analyzing groundwater samples, so, the average value of groundwater quality parameters is considered in our study. The heavy metal ions are analyzed in quality-assured laboratories in Sudan (Environmental laboratory of the College of Water and Environmental Engineering, Sudan University of Science and Technology). The Inductively Couples Plasma—Optical Emission Spectrometry (ICP-OES) is applied to test concentration of heavy metals. Because it has been gaining favor with laboratories around the world as the instrument of choice for performing trace metal analysis. For accurate results, the ICP-OES was adjusted to generator parameter (Nebulizer Flow 0.81 L/min, Plasma Power 1300 W, Coolant Flow 15.0 L/min, and Auxiliary Flow 1.0 L/min), relative torch position (Horizontal 2.0, Vertical 6.5, and Distance 0.0), and measure time parameter (Total Time (s) 25.20, Netto Time (s) 24.00, and Stabilization Time (s) 0.00). The samples size to be tested should be at least 5 mL. Before analysis, we prepared standards for a range of concentrations consisting expected sample concentrations. The validation method experiment was carried out for the determination of metal content in the groundwater samples by Inductively Coupled Plasma Optical Emission Spectrometry (ICP-OES). The analytical measurements were made by using Spectro CIROS VISION ICP Model instrument. Data acquisition and processing were carried out using Smart Analyzer Vision software. The results of samplings analysis is obtained by interpolation method using linearity calibration curve for all parameters, with five (5) different concentrations. All the calibration coefficient of variations are better than 0.999. The limit of detection (LOD) and limit of quantitation (LOQ) of instrument for the parameters (mg/L) Fe, Mn, Zn, Pb, Cd, and Cr are 0.009 and 0.03, 0.13 and 0.44, 1.173 and 0.391, 0.039 and 0.13, 0.006 and 0.002, and 0.039 and 0.013, respectively. The estimation of expanded uncertainty of measurement (Spectro ICP) for six heavy metals μg/L are (Fe ± 0.6), (Mn ± 0.11), (Zn ± 0.14), (Pb ± 0.87), (Cd ± 0.70) and (Cr ± 0.12), with k = 2 for all metals. A preliminary assessment suggests that some elements are below the detection limit for all samples. Hence, the present study considered six heavy metal ions, namely iron (Fe), manganese (Mn), zinc (Zn), lead (Pb), cadmium (Cd), and chromium (Cr) in assessing groundwater quality. The parameters data obtained are compared with different standards for drinking purposes, including Sudanese Standards and Metrology Organization (SSMO 2002) [27], World Health Organization (WHO 2011) guidelines [28], and the Chinese Standard for Groundwater Quality (GB/T14848-1993) [29]. A global positioning system (GPS) has been used to determine the specific location of each sample. ArcGIS interpolation maps are used to reflect the spatial groundwater quality change pattern of the results of the prior indexing systems and the new approach.

3.2. Modified Heavy Metal Evaluation Index (MHEI)

In the present study, a new approach for water quality assessment is proposed, which extends the three most popular techniques in heavy metals indexing by the new elements as discussed below;
Supposing that the water sample consists of n number of heavy metal ions, then MHEI can be expressed by Equation (9).
M H E I = i = 1 n M H E I i i = 1 n ω i Q i
where MHE I i is a modified heavy metal evaluation index of the i t h indices, ω i and Q i are the relative weight and a sub-index for the corresponding heavy metals and can be computed as in Equations (10) and (11), respectively.
ω i = W i i = 1 n W i
Q i = ( M i - I i ) ( S i - I i ) × 100
where W i is the assigned weight value for each metal. We are considered the unit weights ( W i ) of all heavy metals are inversely proportional to their corresponding MAC and defined as:
W i 1 M A C i = k M A C i = 1 M A C i
where M i is the monitored concentration value of the i t h parameters, and S i means maximum permissible concentration according to (SSMO 2002) and (GB/T14848-1993) standards. The constant of proportionality k is considered to be one for all metals. In this study, the (SSMO 2002) standard is considered. Where the specification is not available in (SSMO 2002) standards, the (GB/T14848-1993) standards guidelines are used. If the highest desirable value is not assigned in the standards, the maximum allowable value is used.
The new approach considers two indices to estimate MHEI; the negative evaluation index (NEI), and positive evaluation index (PEI) as defined below:
N E I = i = 1 n 1 M H E I i
P E I = i = 1 n 2 M H E I i
where n1 indicates the number of heavy metals whose M i value is equal or less than the highest desirable value, and n2 means the heavy metals with the M i value greater than the highest desirable value.
If the measured concentration value M i of a heavy metal ion in the water sample is equal to zero or below the detection limit (DL), the negative evaluation sub-index should be −100. If M i for all elements in the water samples is to equal 0 or ≤DL, the sum of negative evaluation indices NEI should be −100, implying the sum positive evaluation indices PEI for all heavy metal ions in the water sample will be zero. For measured value equal or less than the highest desirable limit ( M i I i ), the PEI here equal to zero, whereas NEI is a negative number greater than −100. If the monitored value is less than the highest desirable limit, the NEI for the corresponding elements is zero; then, the PEI is a positive number strictly less than +100. If M i S i for all heavy metal concentrations in the water sample, the sum of positive evaluation indices PEI is equal or greater than +100, and the NEI will be zero. In the case of the water sample comprising sub-indices (PEI s and NEI s ) of different parameters, we add NEIs and PEIs separately to produce a pair of NEI and PEI indices as per Equations (13) and (14). Therefore, MHEI considers five levels in classifying water for drinking purpose, as listed in Table 2.

3.3. Spatial Interpolation Methods

The spatial interpolation is a numerical method that converts attribute database values of a set of locations (points) into a surface map that reflects the spatial change in these values throughout the study area. The spatial interpolation methods, for map generation, are a beneficial tool, which provides a piece of sensitive information for decision-makers. There are several mathematical methods to complete the spatial interpolation process, such as Kriging, Inverse Distance Weighted (IDW), Natural Neighbor, Spline, Trend, etc. However, the Kriging and IDW technique were widely used in environmental studies and the most appropriate interpolation tool to reflect the behavior of the movement of the contaminants inside the aquifer. In this study, we applied the IDW method to generate spatial interpolation maps.

Inverse Distance Weighted

IDW is a geo-statistical-based method, depend on the spatial engagement functions for investigation of the water parameters distribution within the study area. ArcGIS 10.3 software with the aid of (Spatial Analysis Tools) function is used to present the results of interpolation.

4. Results and Discussion

4.1. The Behavior of Heavy Metals in the Study Area

Six heavy metal ions are considered in the present study to assess groundwater quality for drinking purposes. These elements in groundwater samples are assessed and compared against corresponding maximum permissible values of SSMO and WHO [27,28] standards for drinking water (Table 3). Table 3 also discusses the statistical behavior of each heavy metal in the study background, with their corresponding percentages exceeding the guideline values. The results showed that all heavy metals ions are within permissible limits of both standards except Fe in the samples obtained from Eltogoor, Um Balagie, Kewaimat, Um Nabag, Medaisis, Um Sout and Abu Shouk sites. Figure 2 shows the spatial distribution of sampling locations and GIS interpolation of heavy metal ions.

4.1.1. Fe, Mn, Zn

Iron is a natural element of the earth’s crust [21]. It is present in groundwater due to the transfer of rainwater through the different earth layers and its friction with the elements of the soil that are saturated with quantities of iron [21,31]. The Fe concentration is over the MAC in most of the sampling sites. Most of the samples in the study area have a manganese level below MAC. Only at seven samples (GW02, GW04, GW09, GW10, GW11, GW17, and GW18), the concentration is above the MAC. The exceedance may be a result of over-pumping, which leads to the weathering of rocks containing manganese. In the study area, Zn concentration is below the MAC in all of the sampling sites.

4.1.2. Pb, Cd, Cr

Pb, Cd, and Cr are toxic elements, and hazardous towards living beings [21,31]. The concentration of lead in the study area falls above the MAC in most of the samples (10 samples). The concentration of cadmium in the study area falls below the MAC in most of the samples (13 samples). All of the samples in the study area have a chromium level below MAC except the sampling site (GW11). The slight excedance of the three elements on the MAC value can be from natural sources.

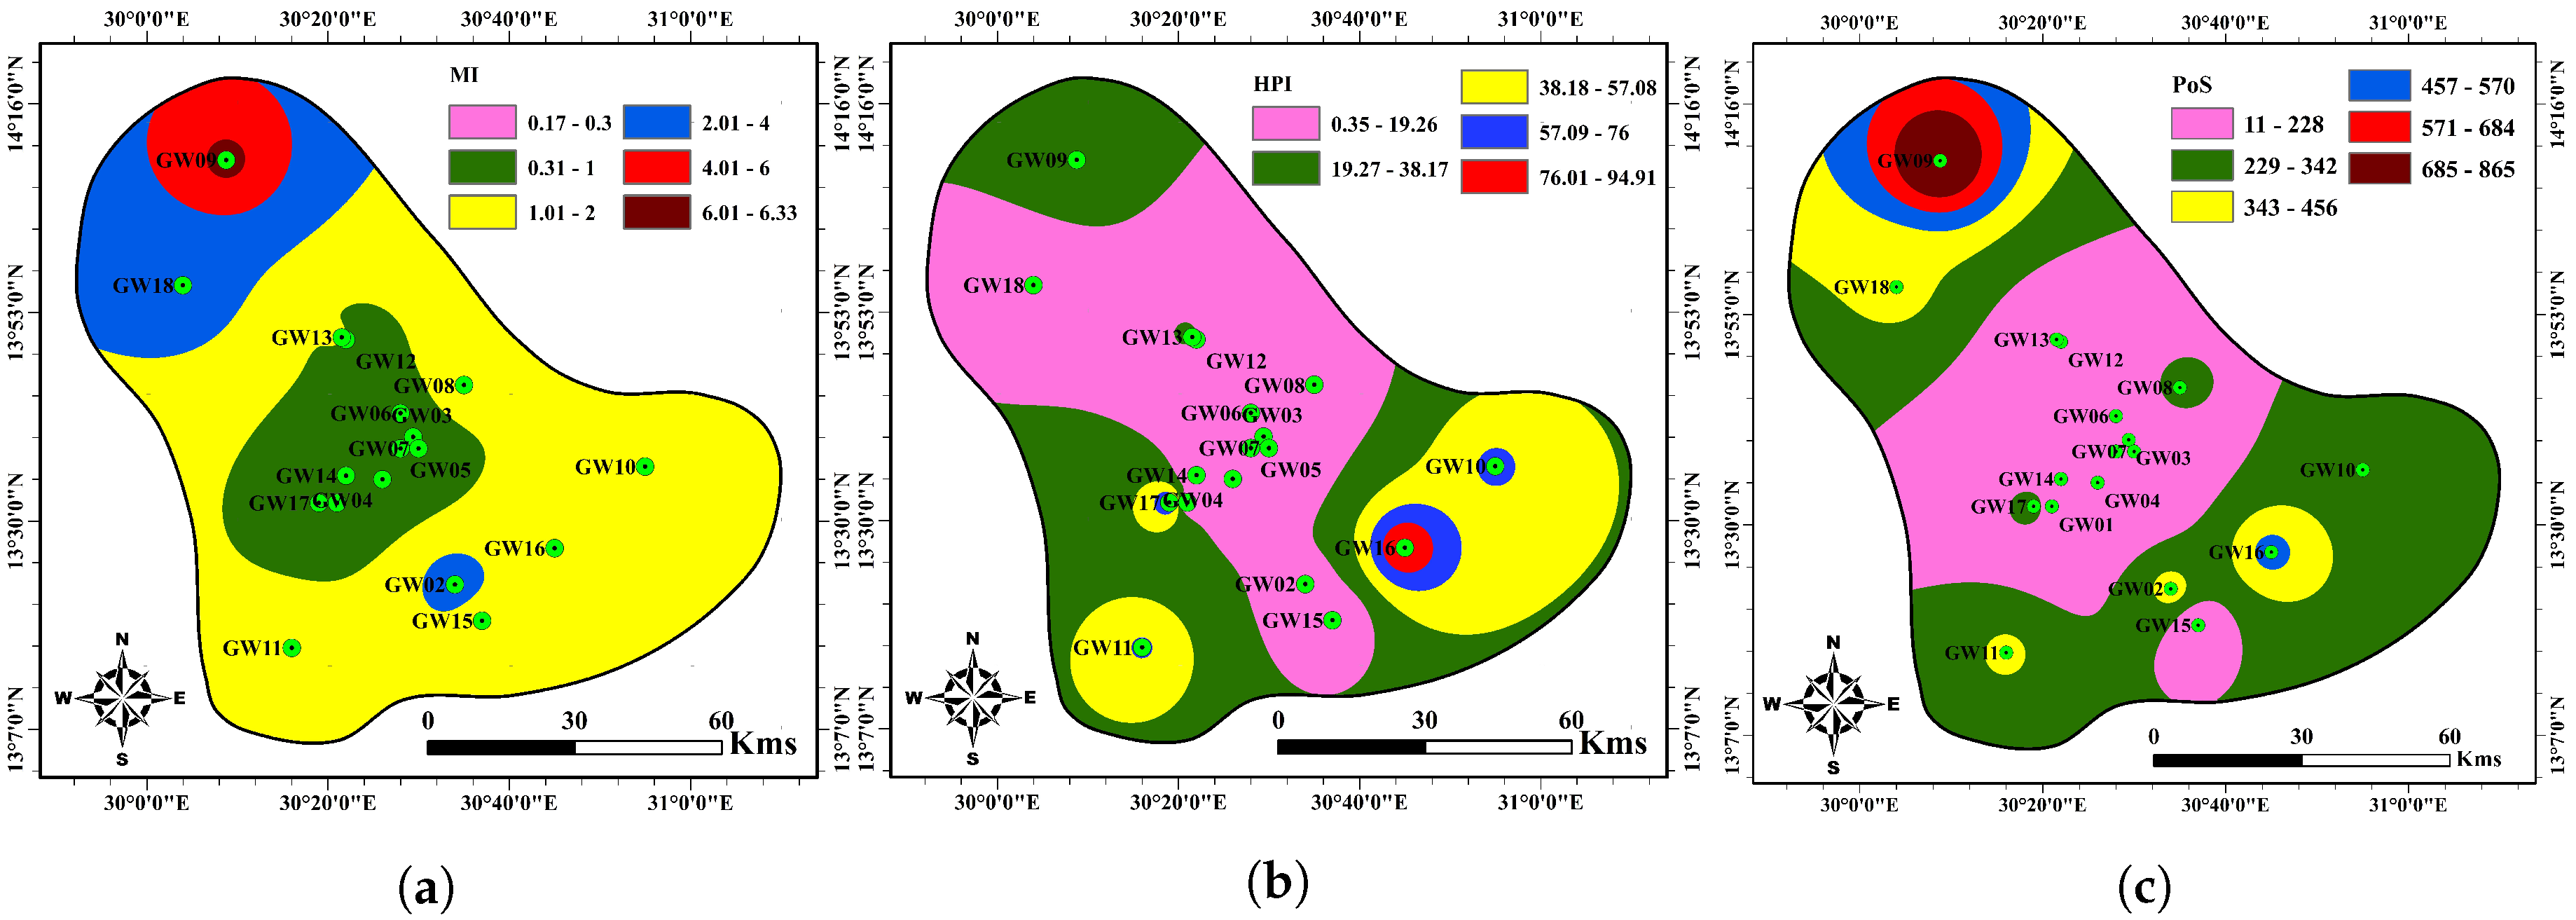
4.2. Calculation of HPI, MI, PoS, and MHEI Indices

The models are applied to six heavy metals ions: Fe, Mn, Zn, Pb, Cd, and Cr to calculate the HPI based on Equations (1)–(4), MI using Equation (5), PoS using Equations (6)–(8) and MHEI, according to Equations (9)–(14). For the sake of limited space in this paper, the result of HPI for site GW01 is summarized in Table 4 as an example. Similarly, the computational results of MI, PoS, and MHEI are listed in Table 5, Table 6 and Table 7, respectively, for site GW01 as an example. Please note that the full-length results can be made available upon request. Regarding MHEI, we considered unit weights ( W i ) for all heavy metal ions are inversely proportional to their MAC value (Equation (12)). SSMO [27] and (GB/T14848-1993) [29] of drinking water standards are used for calculating HPI, MI, PoS, and MHEI (Table 7). Table 7 summarizes the results of the proposed MHEI and compared methods.
The results of HPI (Table 8) show that all the groundwater samples in the study area are suitable for drinking purposes. The water quality classification according to the MI approach suggests that two samples are of very pure quality, seven samples are pure quality, six samples as slightly affected, two samples moderately polluted, and one sample seriously affected by the heavy metals. With respect to PoS, the results illustrate that the majority of groundwater samples (eight) show minimum, followed by five samples of low, three samples of a medium, and one sample of high-quality deterioration, respectively. The remaining sample falls into the category of severe deterioration. Regarding MHEI, the results show that one sample is of excellent quality, and thirteen samples are of good quality while the remaining samples are moderate water quality.
Specifically, 12 out of 18 samples have their NEI and PEI varying between −81 to −99 and 0.00 to 14.21, respectively, indicating excellent-good water quality. Also, two samples obtained PEI and NEI in the range of 27.73 to 28.84 and −0.03 to −8.2, respectively, signifying good water quality. The four remaining samples have PEI and NEI within the fields of 54.66 to 84.33 and 0.00 to −16.32, respectively, which indicates slightly polluted water.

4.3. Comparison of Indices Results

Table 8 shows the classifications of the groundwater samples based on MI, HPI, PoS, and MHEI. For the groundwater samples, all the heavy metals in it are below the permissible limit except iron in some samples. Through Table 8, Table 9 and Table 10, it is observed that neither HPI, PoS nor MI could judge the worthiness of water which MHEI could do easily. The best groundwater samples based on MI, HPI, PoS and MHEI indices are GW05, GW07, GW05, and GW05, respectively. In fact, any sample with PEI = 0 (all heavy metal ions are less than or equal to the highest desirable limit) is excellent water for drinking (e.g., GW05). Therefore, GW05 is the best as rightly indicated by the proposed MHEI, PoS, and MI. However, according to HPI, GW05 is 2nd best sample, which confirms the weakness of this indexing method. Also, the worst samples according to MI, HPI, PoS, and MHEI are GW09, GW16, GW09, and GW16, respectively. Concentrations of heavy metals (μg/L) in the best and worst groundwater samples are presented in Table 10. Despite increased concentrations of Fe, Mn, Zn, and Pb in sample GW09 as compared to sample GW16, the high-level concentration of Cd in sample GW16 dominates the effects of other heavy metals, and high toxicity of cadmium makes GW09 in the other order of the worst ranking [32].
MI and PoS consider the amount of concentration more than its importance in water quality. Also, regarding MI, sample GW09 is classified as seriously contaminated by heavy metals (i.e., MI > 6.0), but only the concentration of iron is higher than the permissible limit. The fact that the concentration of iron exceeds the permissible limit cannot justify the classification by MI and PoS for GW09. The sub negative and positive evaluation indices are the strengths of the proposed MHEI indexing method, which are missing in HPI, MI, and PoS indexing systems.
Computed HPI and MHEI show that all groundwater samples from the boreholes are suitable for human consumption. The spatial distribution of NEI and PEI are in complete agreement with the metals spatial distribution (Figure 2 and Figure 3). Also, Figure 4 presents the spatial distribution of MI, HPI and PoS values for water quality in the study area. It is seen from Figure 3 and Figure 4 that the groundwater quality is good in most study areas, while a poor groundwater quality exists in the southeastern and southwestern parts.

5. Conclusions

The present study proposed a new method for heavy metals pollution indexing to assess groundwater quality for drinking purposes in North Kurdufan state, Sudan. The proposed method applies two indices in the water quality evaluation process; negative evaluation index (NEI) and positive evaluation index (PEI). The water quality is evaluated based on a pair of indices, NEI, and PEI. NEI and PEI directly reflect water quality: water quality increases with the decrease of PEI and NEI values. NEI indicates the contribution of heavy metals with a concentration not exceeding the highest desirable limit in water sample quality, while vice versa regarding the PEI. NEI varies from 0 to −100 while PEI may vary from 0 to any positive value. Eighteen groundwater samples collected from a confined aquifer have been analyzed. The results of MI, HPI, PoS and MHEI show that all groundwater samples from the boreholes are suitable for human consumption except sample (GW09) was found unsuitable as per MI and PoS methods. The proposed MHEI was compared with HPI, MI, and PoS which are widely used in the literature, and the following conclusions are drawn;
  • The spatial distribution of NEI and PEI are in complete agreement with the metals spatial distribution.
  • The MI and HPI indexing failed to account for the toxicity of elements in the evaluation of groundwater quality. This may explain why some samples were erroneously indexed. The proposed MHEI considered the element concentration as well as the toxicity in the groundwater quality evaluation dprocess to index the metals thoroughly, thus producing relatively better results.
  • The traditional heavy metals indexing techniques, namely MI, HPI, and PoS always take the metal concentration in water sample as a positive pollutant, even when the measured concentration is below the highest desirable limit. However, according to MHEI, heavy metal effect may be measured by a pair of indices, NEI and PEI. Additionally, some major shortcomings in the formulations of conventional indexing methods.
  • This study also proposed a more flexible water quality rating system that is more in sync with the standard guidelines documents.
  • The performance of the MHEI model proposed was strong, promising, and proved useful for evaluating heavy metals pollution levels in groundwater. It also takes care of many deficiencies of the existing approaches.
The proposed MHEI indexing can provide accurate and reliable information on water quality and serves as a useful tool for sustainable water resource management in the future.

Author Contributions

E.E. study conceptualization and formal analysis, E.E. investigation, and data collection, E.E., B.E., A.K.M. and Y.M. wrote and prepared the original manuscript draft, E.E. and B.E. prepared figures, E.E., T.H. and A.K.M. writing-review and editing, E.E. and T.H. supervision, project administration, and funding acquisition T.H. All authors helped to draft the manuscript. All authors read and approved the final version of the manuscript.

Funding

This research was supported by the Sichuan Science and Technology Program (2019YFH0058).

Acknowledgments

The authors would like to thank Yahaya Mahama, Ph.D. candidates at Southwest Jiaotong University, China, for his help to improve the paper language. We also acknowledged the editor and the anonymous reviewers for their constructive and valuable comments that highly enhanced the paper.

Conflicts of Interest

The authors announce that there is no competing interests. The funders had no role in the design of the study, collection, analysis, interpretation of the data, manuscript editing and publishing.

References

  1. Fragaszy, S.; Closas, A. Cultivating the Desert: Irrigation Expansion and Groundwater Abstraction in Northern State, Sudan. Water Altern. 2016, 9, 139–161. [Google Scholar]
  2. Hassan, I.; Elhassan, B.M.; Mustafa, M.A. Heavy Metals and Refractory Organic Compounds in Khartoum State’s Groundwater Resources. Eur. J. Eng. Res. Sci. 2017, 2, 13–16. [Google Scholar] [CrossRef] [Green Version]
  3. Li, Z.; Xu, C.; Li, M.; Yan, G.; Liu, X.; Ma, Y. Identification and assessment of water safety risk for groundwater recharge with reclaimed water in China. Stoch. Environ. Res. Risk Assess. 2017, 31, 1671–1682. [Google Scholar] [CrossRef]
  4. Singh, R.; Venkatesh, A.; Syed, T.H.; Reddy, A.; Kumar, M.; Kurakalva, R.M. Assessment of potentially toxic trace elements contamination in groundwater resources of the coal mining area of the Korba Coalfield, Central India. Environ. Earth Sci. 2017, 76, 566. [Google Scholar] [CrossRef]
  5. Liang, B.; Han, G.; Liu, M.; Yang, K.; Li, X.; Liu, J. Distribution, sources, and water quality assessment of dissolved heavy metals in the Jiulongjiang River water, southeast China. Int. J. Environ. Res. Public Health 2018, 15, 2752. [Google Scholar] [CrossRef] [PubMed] [Green Version]
  6. Idris, I.M.; Younis, Y.M.; Elbashir, A.A. Monitoring the Anthropogenic and Geochemical Environment Surrounding the Butana Drinking Water Sources via the Determination of Heavy Metals Composition of the Soil, Streams Sediments and Gold Mining Tailings in the Wet Season (III). Biomed. J. Sci. Tech. Res. 2018, 9. [Google Scholar] [CrossRef] [Green Version]
  7. Zhang, Q.; Xu, P.; Qian, H. Assessment of Groundwater Quality and Human Health Risk (HHR) Evaluation of Nitrate in the Central-Western Guanzhong Basin, China. Int. J. Environ. Res. Public Health 2019, 16, 4246. [Google Scholar] [CrossRef] [PubMed] [Green Version]
  8. Mohan, S.V.; Nithila, P.; Reddy, S.J. Estimation of heavy metals in drinking water and development of heavy metal pollution index. J. Environ. Sci. Health Part A 1996, 31, 283–289. [Google Scholar] [CrossRef]
  9. Tamasi, G.; Cini, R. Heavy metals in drinking waters from Mount Amiata (Tuscany, Italy). Possible risks from arsenic for public health in the Province of Siena. Sci. Total Environ. 2004, 327, 41–51. [Google Scholar] [CrossRef]
  10. Caeiro, S.; Costa, M.H.; Ramos, T.; Fernandes, F.; Silveira, N.; Coimbra, A.; Medeiros, G.; Painho, M. Assessing heavy metal contamination in Sado Estuary sediment: An index analysis approach. Ecol. Indic. 2005, 5, 151–169. [Google Scholar] [CrossRef]
  11. Maanan, M.; Saddik, M.; Maanan, M.; Chaibi, M.; Assobhei, O.; Zourarah, B. Environmental and ecological risk assessment of heavy metals in sediments of Nador lagoon, Morocco. Ecol. Indic. 2015, 48, 616–626. [Google Scholar] [CrossRef]
  12. Doyi, I.; Essumang, D.; Gbeddy, G.; Dampare, S.; Kumassah, E.; Saka, D. Spatial distribution, accumulation and human health risk assessment of heavy metals in soil and groundwater of the Tano Basin, Ghana. Ecotoxicol. Environ. Safety 2018, 165, 540–546. [Google Scholar] [CrossRef] [PubMed]
  13. Horton, R.K. An index number system for rating water quality. J. Water Pollut. Control Fed. 1965, 37, 300–306. [Google Scholar]
  14. Prati, L.; Pavanello, R.; Pesarin, F. Assessment of surface water quality by a single index of pollution. Water Res. 1971, 5, 741–751. [Google Scholar] [CrossRef]
  15. Dinius, S. Social accounting system for evaluating water resources. Water Resour. Res. 1972, 8, 1159–1177. [Google Scholar] [CrossRef]
  16. Walski, T.M.; Parker, F.L. Consumers water quality index. J. Environ. Eng. Div. 1974, 100, 593–611. [Google Scholar]
  17. Edet, A.; Offiong, O. Evaluation of water quality pollution indices for heavy metal contamination monitoring. A study case from Akpabuyo-Odukpani area, Lower Cross River Basin (southeastern Nigeria). GeoJournal 2002, 57, 295–304. [Google Scholar] [CrossRef]
  18. Tziritis, E.; Panagopoulos, A.; Arampatzis, G. Development of an operational index of water quality (PoS) as a versatile tool to assist groundwater resources management and strategic planning. J. Hydrol. 2014, 517, 339–350. [Google Scholar] [CrossRef]
  19. Kabuba, J.; Mulaba-Bafubiandi, A.; Battle, K. Neural Network Technique for modeling of Cu (II) removal from aqueous solution by Clinoptilolite. Arab. J. Sci. Eng. 2014, 39, 6793–6803. [Google Scholar] [CrossRef]
  20. Prasad, B.; Mondal, K.K. The impact of filling an abandoned open cast mine with fly ash on ground water quality: A case study. Mine Water Environ. 2008, 27, 40–45. [Google Scholar] [CrossRef]
  21. Rezaei, A.; Hassani, H.; Hayati, M.; Jabbari, N.; Barzegar, R. Risk assessment and ranking of heavy metals concentration in Iran’s Rayen groundwater basin using linear assignment method. Stoch. Environ. Res. Risk Assess. 2018, 32, 1317–1336. [Google Scholar] [CrossRef]
  22. Liu, S.; Yen, S.T.; Kolpin, D.W. Pesticides in ground water: Do atrazine metabolites matter? JAWRA J. Am. Water Resour. Assoc. 1996, 32, 845–853. [Google Scholar] [CrossRef]
  23. Rodis, H.G.; Hassan, A.; Wahadan, L. Ground-Water Geology of Kordofan Province, Sudan; Technical Report; USGPO: Washington, DC, USA, 1968.
  24. Ali, H.; Whiteley, R. Gravity exploration for groundwater in the Bara Basin, Sudan. Geoexploration 1981, 19, 127–141. [Google Scholar] [CrossRef]
  25. Sadig, A.A.; Vail, J.R. Geology and regional gravity traverses of the Nuba Mountains, Kordofan Province, Sudan. J. Afr. Earth Sci. (1983) 1986, 5, 329–338. [Google Scholar] [CrossRef]
  26. Abdalla, O.A. Groundwater modeling in semiarid Central Sudan: Adequacy and long-term abstraction. Arab. J. Geosci. 2009, 2, 321. [Google Scholar] [CrossRef]
  27. Sudanese Standards and Metrology Organization (SSMO). Unbotted Drinking Water Guidelines Bulletin; Ministry of Industry, Department of Standard Specifications: Khartoum, Sudan, 2002.
  28. WHO. Guidelines for Drinking-Water Quality; World Health Organization: Geneva, Switzerland, 2011; Volume 216, pp. 303–304. [Google Scholar]
  29. Quality Standard for Groundwater(GB/T 14848–1993); AQSIQ (General Administration of Quality Supervision, Inspection and Quarantine of the People’s Republic of China): Beijing, China, 1993. (In Chinese)
  30. Gautam, S.K.; Evangelos, T.; Singh, S.K.; Tripathi, J.K.; Singh, A.K. Environmental monitoring of water resources with the use of PoS index: A case study from Subarnarekha River basin, India. Environ. Earth Sci. 2018, 77, 70. [Google Scholar] [CrossRef]
  31. Barzegar, R.; Moghaddam, A.A.; Kazemian, N. Assessment of heavy metals concentrations with emphasis on arsenic in the Tabriz plain aquifers, Iran. Environ. Earth Sci. 2015, 74, 297–313. [Google Scholar] [CrossRef]
  32. Khan, M.; Yaseen, M.; Shahzad, H. Extraction of Cd2+ from Model Aqueous Solution and Waste Tonner Carbon Using Polypropylene-Supported Liquid Membrane and Na2CO3 as Strippant. Arab. J. Sci. Eng. 2019, 44, 6411–6422. [Google Scholar] [CrossRef]
Figure 1. Map location of groundwater sampling stations of the study area.
Ijerph 17 01245 g001
Figure 2. Spatial distribution of heavy metal ions in the groundwater samples and GIS interpolation maps of (a) Fe, (b) Mn, (c) Zn, (d) Pb, (e) Cd and (f) Cr in the study area.
Ijerph 17 01245 g002
Figure 3. Spatial distribution of groundwater samples and GIS interpolation maps of MHEI (a) NEI and (b) PEI values in the study area.
Ijerph 17 01245 g003
Figure 4. Spatial distribution of groundwater samples and GIS interpolation maps of (a) MI, (b) HPI and (c) PoS values in the study area.
Ijerph 17 01245 g004
Table 1. The classification of water quality degradation level according to PoS index.
Toxic ClassParametersPointsP-Classw i W i Quality Degradation
5Pb10V80.301887High
5Cd10V80.301887
4Cr100IV50.188679Moderate
3Zn1000III30.113208Non-low
2Mn5000II1.50.056604
1Fe50,000I10.037736
Table 2. Water quality classification based on the MHEI.
MHEI Value RangeMeasured Concentration RangeType of Water
−100 ≤ NEI ≤ 0 and PEI = 0DL ≥ M i I i Excellent water
−100 < NEI ≤ 0 and 0 < PEI ≤ 50 I i < M i S i Good water
−100 < NEI ≤ 0 and 50 < PEI ≤ 100 I i < M i S i Moderate water
−100 < NEI ≤ 0 and PEI = 50 I i < M i S i Poor water
NEI = 0 and PEI > 100 M i > S i Water unsuitable for drinking purposes
Table 3. Descriptive statistics of heavy metal ions in the groundwater samples and their comparison with SSMO (2002) and WHO (2011) guideline values for drinking water.
Parameters a Min. b Max.MeanMedian c Std. DevSSMO (2002)WHO (2011)% Exceeding Guideline Value
Fe36.85661.4956.99220.31435.3730030038.89
Mn19.9304.975.3743.8574.075004000.00
Zn5.4395.053.4921.388.2300030000.00
Pb d ND31.025.0926.954.221001000.00
CdND3.01.931.950.763.03.00.00
CrND16.07.065.04.5840500.00
Note: All heavy metals ions unit in μg/L, a Mminimum, b Maximum, c Standard Deviation, and d Not Detected.
Table 4. The W i , Q i , and HPI calculation for groundwater samples (GW01 as an example) of the study area.
Parameters a M i b S i c I i d w i e W i f Q i W i × Q i
Fe288.53001000.00330.00994.250.840
Mn26.0500500.00200.0055.3330.029
Zn21.33000500.00030.0010.9730.001
PbND31005.00.01000.0270.000.00
CdND3.00.10.33330.8910.000.00
CrND405.00.02500.0670.000.00
HPI = i = 1 n W i Q i 0.87
a Measured concentration value, b Maximum permissible value, c Highest desirable value, d Unit weight factor, e Relative weight, and f Sub index.
Table 5. The MI calculation for groundwater samples (GW01 as an example) of the study area.
ParametersM i a MAC i M i /MAC i
Fe288.52001.443
Mn26.0500.520
Zn21.35000.043
PbND100.00
CdND1.00.00
CrND100.00
MI = Mean value 0.334
a Maximum allowable value.
Table 6. The PoS calculation for groundwater samples (GW01 as an example) of the study area.
ParametersM i S i w i W i Q i
Fe288.530010.03773636.29
Mn26.05001.50.0566042.94
Zn21.3300030.1132080.80
PbND310080.3018870.00
CdND3.080.3018870.00
CrND4050.1886790.00
PoS = PoS = Aggregation of all Q i 40
Table 7. Standard values of corresponding heavy metals ions and calculation of MHEI for groundwater samples (GW01 as an example) of the study area.
ParametersM i S i I i MAC i a W i b ω i Q i ω i × Q i c PEI d NEI
Fe288.53001002000.0050.00494.250.380.38−97.89
Mn26.050050500.0200.016−5.33−0.09
Zn21.33000505000.0020.002−0.970.00
PbND1005.0100.1000.082−100−8.15
CdND3.00.11.01.0000.815−100−81.5
CrND405.0100.1000.082−100−8.5
a Unit weight factor, b Relative weight, c Positive evaluation index, and d Negative evaluation index.
Table 8. Comparison results of water quality classification by MI, HPI, PoS, and MHEI.
IDLocationMIHPIPoSMHEI
ScoreClassScoreClassScore a DominantClassPEINEIClass
GW01Um Galagie0.33Pure0.87Suitable for drinking purposes40FeMinimum0.38−97.89Good
GW02Eltogoor2.97Moderately12.61387Fe, MnMedium6.08−97.80Good
GW03Hamdan 11.03Slightly28.95242PbLow27.73−0.03Good
GW04Hamdan 20.67Pure0.3137MnMinimum0.49−97.80Good
GW05Um Ushar 10.16Very pure0.2710-Minimum0.00−98.26Excellent
GW06Um Ushar 20.71Pure0.90116PbMinimum1.89−81.87Good
GW07Um Laham0.31Pure0.2446-Minimum0.10−89.72Good
GW08Um Balagie1.79Slightly6.27274Fe, PbLow4.38−81.75Good
GW09Kewaimat6.33Seriously25.73845Fe, Mn, PbSevere14.21−89.65Good
GW10Um Samima1.21Slightly59.58327Mn, Pb, CdLow55.85−8.15Moderate
GW11Um Gewaiz1.30Slightly58.45362Fe, Mn, Pb, Cd, CrMedium54.660.00Moderate
GW12Elhadid0.25Very pure0.4427-Minimum0.19−97.89Good
GW13NUm Nabag1.52Slightly31.90303FeLow28.84−8.20Good
GW14Bara0.55Pure0.7488PbMinimum1.75−90.71Good
GW15Medaisis0.96Pure2.41142Fe, PbMinimum2.46−89.70Good
GW16Namil1.90Slightly95.31495Fe, CdHigh84.33−16.32Moderate
GW17Um Sout0.96Pure80.52332Mn, Pb, CdLow74.06−8.56Moderate
GW18Abu Shouk2.96Moderately12.10374Fe, MnMedium5.95−97.80Good
a The score of heavy metal is above the threshold value.
Table 9. Best and worst groundwater samples based on MI, HPI, PoS, and MHEI.
Sample RankMIHPIPoSMHEI
IDValueIDValueIDValueIDPEINEI
BestGW050.16GW070.24GW0510GW050.00−98.3
WorstGW096.33GW1695.31GW09845GW1684.3−16.3
Table 10. Concentrations of heavy metal ions (μg/L) in the best and worst groundwater samples in the study area.
Sample RankIDFeMnZnPbCdCr
BestGW0544.834.721NDNDND
GW0748.629.819.4NDND5.0
WorstGW095661.4304.939527.6NDND
GW161487.345.912ND3.0ND

