Factors Underlying Unmet Medical Needs: A Cross-Sectional Study


1
Department of Korean Medicine Rehabilitation, Jaseng Hospital of Korean Medicine, 536 Gangnam-daero, Gangnam-gu, Seoul 06110, Korea
2
Jaseng Spine and Joint Research Institute, Jaseng Medical Foundation, 3F, 538 Gangnam-daero, Gangnam-gu, Seoul 06110, Korea
3
KM Policy Research Center, Korea Institute of Oriental Medicine, 1672, Yuseong-daero, Yuseong-gu, Daejeon 34054, Korea
*
Authors to whom correspondence should be addressed.
Int. J. Environ. Res. Public Health 2019, 16(13), 2391; https://doi.org/10.3390/ijerph16132391
Submission received: 24 May 2019
/
Revised: 1 July 2019
/
Accepted: 1 July 2019
/
Published: 5 July 2019
(This article belongs to the Section Health Behavior, Chronic Disease and Health Promotion)
Abstract
:Unmet medical needs refer to the state where a patient’s medical care or service is insufficient, inadequate, or lacking. Numerous factors influence unmet medical needs. We used a multi-pronged approach to explore the factors influencing unmet medical needs in the Korean health care system according to Anderson’s Behavioral Model of Health Services Use. To this end, we used data from 11,378 adults over 19 years old in the 2016 Korea Health Panel Survey and performed multiple logistic regression analyses. The odds of experiencing unmet medical needs were significantly greater among older participants (odds ratio (OR) = 2.51, 95% confidence interval (CI) = 1.78–3.56); low-income participants (OR = 1.41, 95% CI = 1.14–1.75); non-workers (OR = 1.24, 95% CI = 1.06–1.46); those who had received non-covered treatment (OR = 1.24, 95% CI = 1.08–1.42); those who did not regularly exercise (OR = 1.23, 95% CI = 1.02–1.48); and those experiencing pain (OR = 2.29, 95% CI = 1.97–2.66), worse self-rated health status (OR = 2.29, 95% CI = 1.89–2.79), and severe depression (OR = 2.46, 95% CI = 1.39–4.35). About one in ten Korean citizens (11.60%) have unmet medical service needs. Policies that strengthen coverage for physically and economically vulnerable groups are needed.
1. Introduction
Health care should be of a certain quality and delivered in an acceptable and cost-effective manner to everyone in a society [1]. Naturally, however, people have varied health care demands, which can broadly be classified into medical needs and medical wants, depending on the decision maker [2]. Needs are based on expert judgments, while wants originate in the patients themselves. There is no universally accepted definition of ‘unmet need’, which is used differently by other commentators [3]. Reeves et al. (2015) defined unmet need as being unable to obtain care when people believed it to be medically necessary [4].
Among the 27 member countries of the Organization for Economic Co-Operation and Development (OECD), about 2.5% of patients have reported unmet medical needs [5]. The reasons provided for these unmet medical needs varied, and included financial reasons (Greece, Italy, Poland, and Portugal), wait time (Poland, Finland, and Estonia), and difficulty in transportation (Norway). The United Kingdom showed particularly low inequality between the upper and lower 50% of the population in terms of income level, whereas the United States exhibited the largest inequality between income levels, with 1/3 of adults among the lower 50% of the population in terms of income level experiencing unmet medical needs due to financial reasons [6]. According to the World Health Report, published by the World Health Organization (WHO), guaranteeing accessibility to medical care based on need rather than ability to pay is one method of improving population health [7]. Therefore, health care systems should be evaluated to ensure that individuals are receiving the medical services they need; one such evaluation measure is “the proportion of the population that has unmet needs.”
The Republic of Korea’s universal health care system has contributed to a marked improvement in population health conditions while also achieving one of the lowest levels of spending among OECD member countries through its implementation of high patient co-pays and limited public health insurance coverage [8]. The national health insurance (NHI) system designates “covered” and “non-covered” services. The latter are services that are not guaranteed for coverage by the NHI, which means that the patient must pay 100% of the treatment costs [9]. The coverage rate of the NHI (i.e., the number of covered services out of all services) in the past 10 years has been around 63.2%; this rate has become a point of criticism for many experts, who believe that the coverage is insufficient to offset the ever-increasing burden of medical costs for citizens [10]. Moreover, according to previous studies, the rate of unmet medical needs is higher than 10% [11,12]. Indicators of self-reported unmet medical needs must be evaluated alongside other indicators such as treatment possibility and accessibility, including the extent of health care coverage in that country, the amount of out-of-pocket payments, and actual use of health services [5].
Numerous influencing factors of unmet medical needs have been identified, and they can be broadly categorized as follows [13]: (1) availability, including long waiting times or unavailable services; (2) accessibility, including financial or transportation barriers; and (3) acceptability, including busyness or ignoring health problems [14]. Past studies on these factors have had different focuses, such as on women [11,15], income and health condition factors [16], the relationship of unmet medical needs with chronic diseases [17], household characteristics [18], costs [19], employment status [20], and habitation factors such as living on an island [21]. However, the factors influencing unmet medical needs will differ according to the characteristics of the health care system; past studies have typically only examined the relevance of individual patient characteristics, without consideration of the factors inherent in the larger health care system. To address this gap in the literature, we analyzed not only the individual characteristics related to unmet medical needs but also the characteristics of the Korean health care system (e.g., type of medical care, whether treatment is non-covered). The larger aim of this study is to devise policy suggestions on a country level, for example for Japan, France, Germany, and the Netherlands, with health care systems that are similar to that of the Republic of Korea.
2. Materials and Methods
2.1. Study Design and Population
We used data from the Korea Health Panel Survey (KHPS), a nationwide study conducted by a consortium formed by the Korea Institute of Health and Social Affairs and the National Health Insurance Corporation (KNHC). The purpose of the KHPS is to obtain basic data regarding health care utilization, health expenditures, and health-related behaviors, to be used in establishing policies related to achieving healthy living while limiting medical costs [22]. The KHPS has been conducted annually since 2008. The main goals of the development and dissemination of the KHPS are to provide the most versatile database possible on healthcare behaviors. Sample weights for the KHPS were calculated after adjusting for unequal selection probabilities and non-responses and making a population distribution disclosure via post-stratification corresponding to the sample distribution [23]. We used the 2016 yearly combined KHPS healthcare data collected in 2016 (beta version 1.5.1) for this cross-sectional study. The 2016 data is based on 6437 households and a total of 18,576 household members.
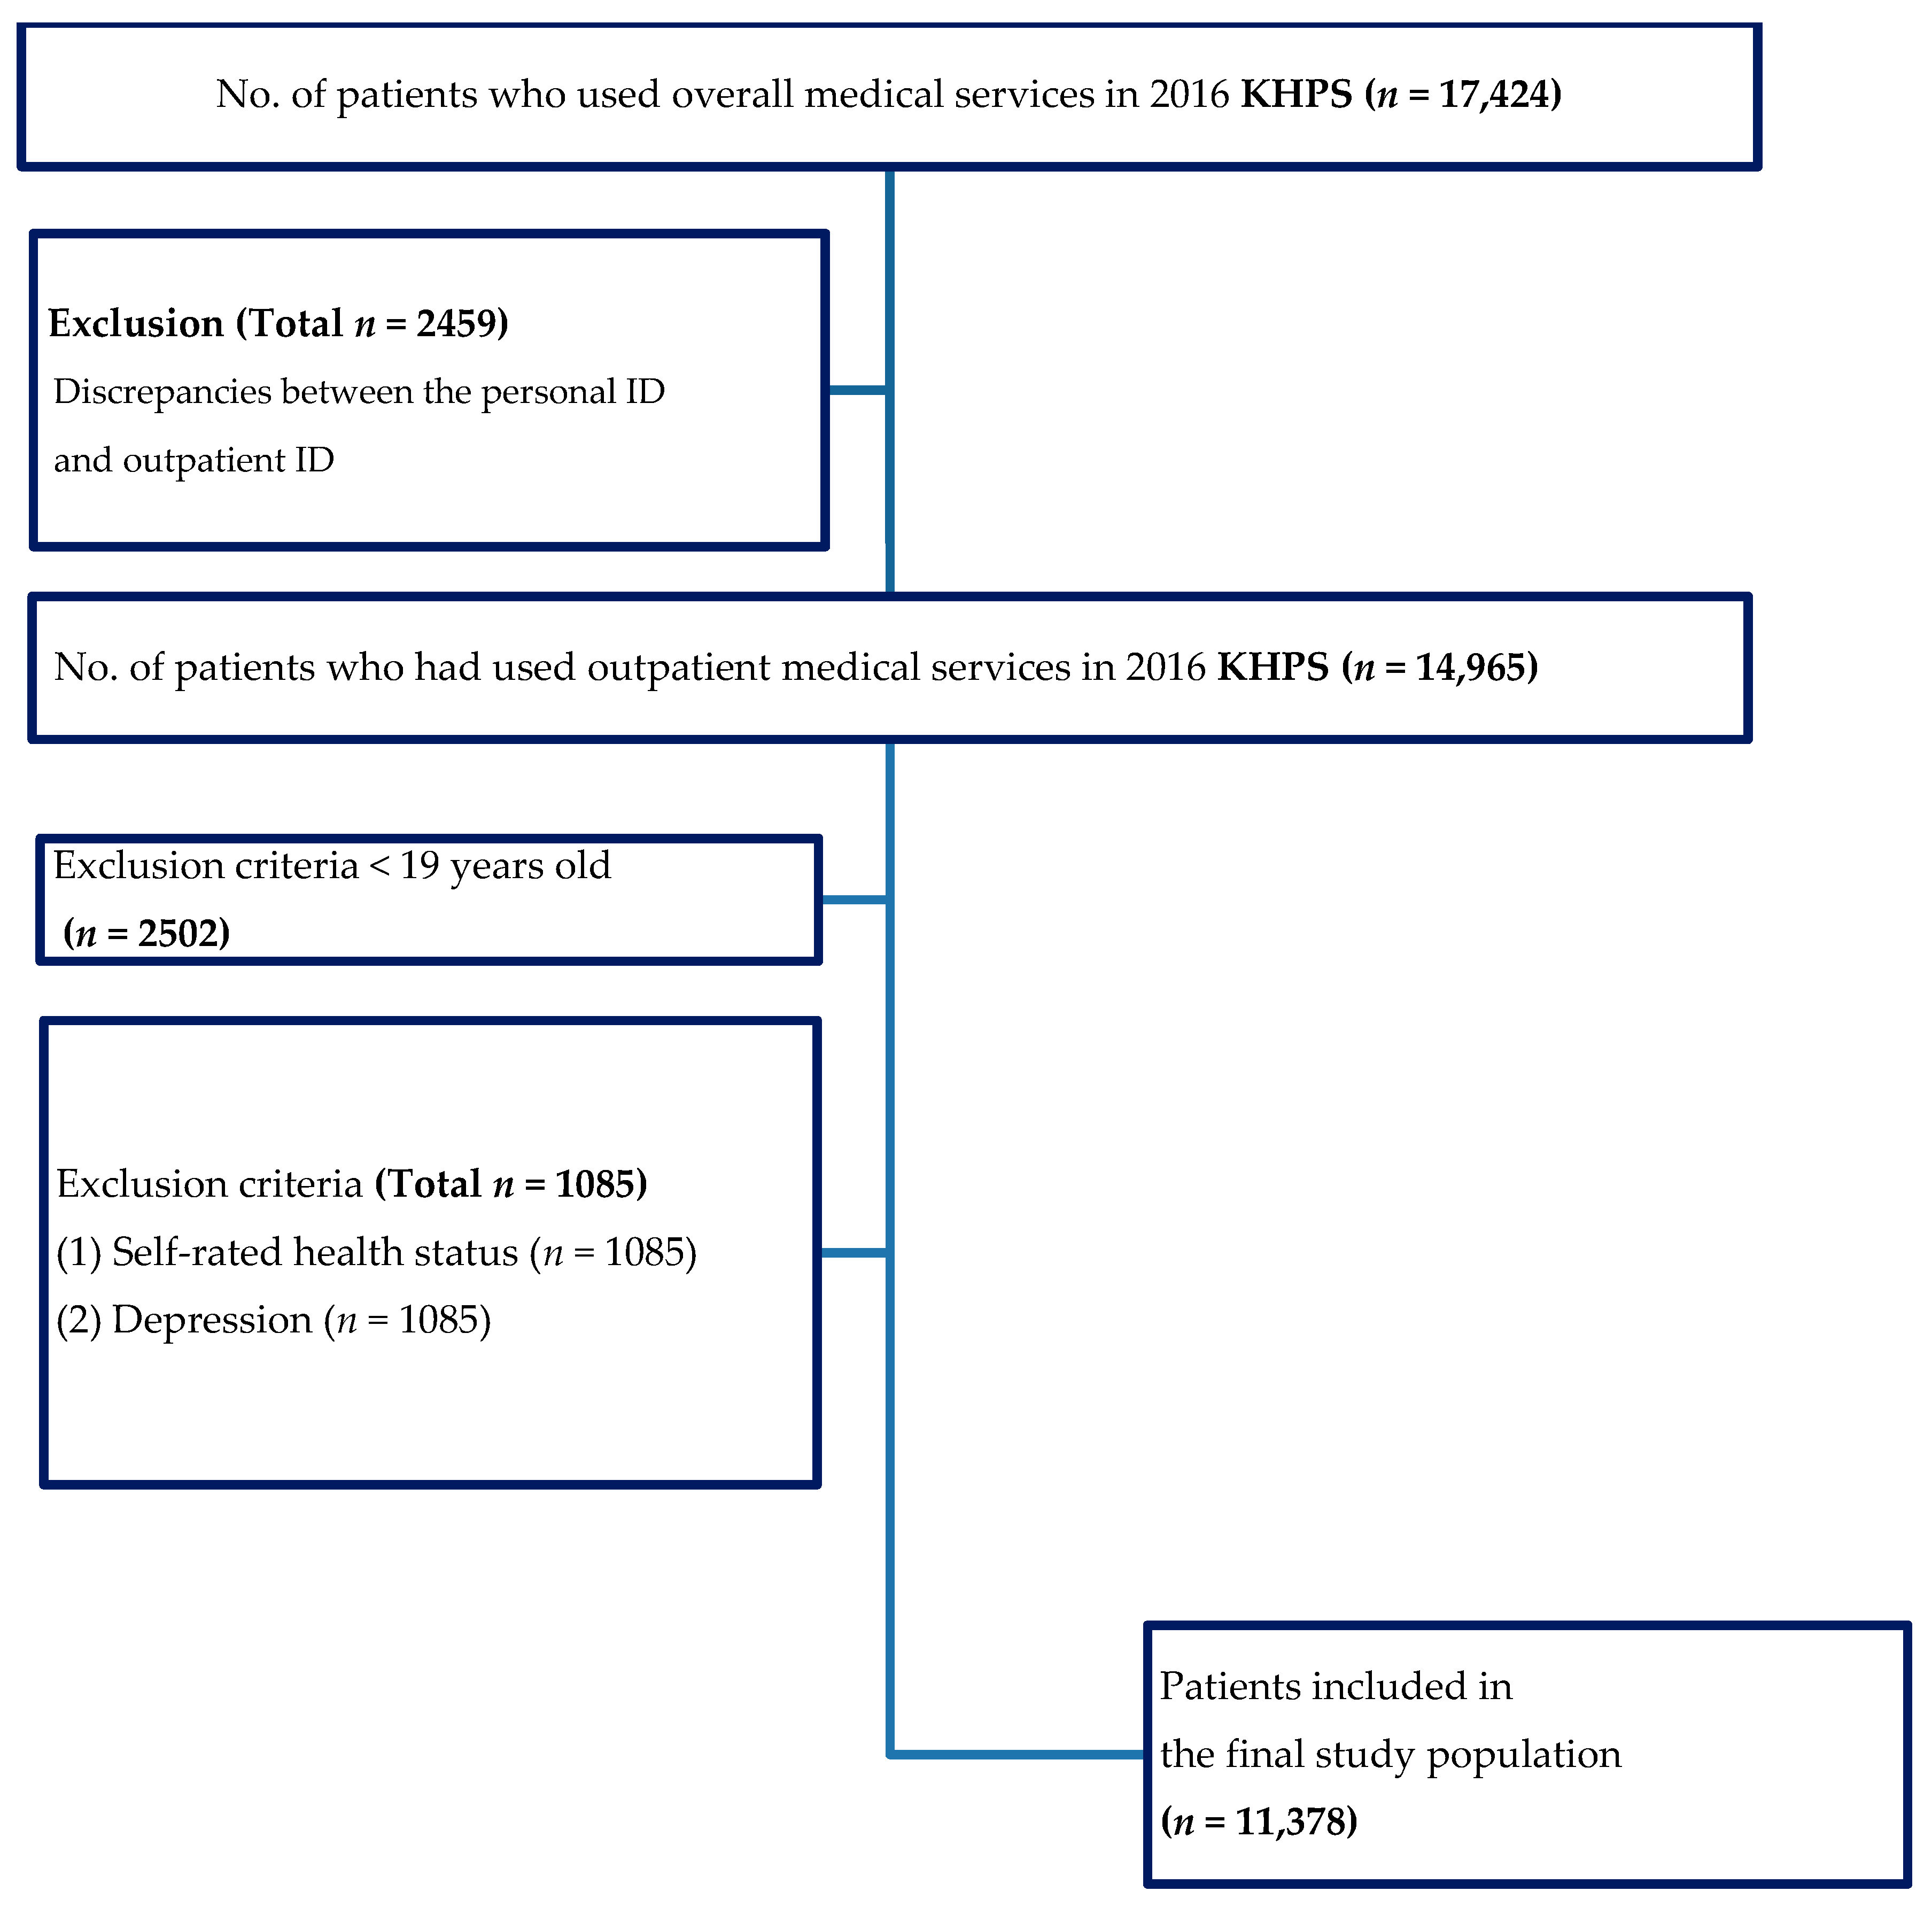
For this study, we excluded respondents with discrepancies between the personal ID and outpatient ID. Additionally, individuals younger than 19 years of age were excluded, as were those people who provided no answers or erroneous responses to some items according to the KHP codebook. Also, we have had several expert meetings regarding operationalize the variable (income and type of medical care). Income was not equally distributed and the missing value is 1/4 of the raw data. Among people with a low income, there is a tendency in Korea to not respond to such items. Therefore, we did not remove missing data and analyzed them as belonging to a low-income group. The sample size of individuals who had received traditional Korean medicine was too small, so we had to operationalize the variable to people who had experienced traditional Korean medicine at least once in their lives. Finally, there were a total of 11,378 respondents for the final analyses and Figure 1 shows the participant flow.
2.2. Variables
The dependent variable of this study was whether respondents had experienced unmet medical needs. This was evaluated with a single item: “In the past year, have you ever needed hospital care or an examination but did not receive it?” Respondents who answered, “Yes, I have experienced a situation where I did not receive care at least once” were defined as having experienced unmet medical needs.
To analyze the factors that influence unmet medical needs, we followed Anderson’s Behavioral Model of Health Services Use [24,25,26]. The factors suggested in Anderson’s model can be categorized into three types:
(1) Predisposing factors: These characteristics are those that people possess, often regardless of their will, before the occurrence of a medical need. They include sex, age, education level, and marital status. Age was categorized into 10-year intervals, while education level was categorized into middle/high school graduation, college or university graduation, and graduate school graduation. For marital status, individuals who were married (including common-law marriage) were defined as married, and all other statuses were categorized as unmarried.
(2) Enabling factors: These factors refer to the individual and community resources that enable the use of medical care. In this study, we focused on economic activity, total household income, medical insurance type, private insurance, and use of non-covered treatment costs. Economic activity, private insurance, and non-covered treatment costs were categorized as either “yes” or “no.” Household income was categorized into quintiles by income level. Medical insurance was categorized into three groups (NHI, Medicaid, or others).
(3) Need factors: These factors refer to those related to the level of disability or disease of an individual that are direct causes of the use of medical services. We considered the presence of certain chronic diseases, disability, regular exercise, and pain; self-rated health status; and level of depression. Regular exercise and pain were evaluated dichotomously (“yes/no”), while self-rated health status was categorized into good, moderate, and poor. Depression was categorized according to severity: light, moderate, and severe. We evaluated the presence of any of the following chronic diseases: high blood pressure, diabetes, hyperlipidemia, joint disease, tuberculosis, ischemic heart disease, and cerebrovascular disease.
2.3. Statistical Analysis
Categorical variables were presented as frequencies and percentages, whereas continuous variables (e.g., age) were presented as means and standard deviations. We converted costs into 2019 U.S. dollars (1 USD = 1133.5 KRW as of 5 April 2019). To examine the current status of unmet medical needs according to respondents’ characteristics, we calculated the frequencies and percentages of such needs and used the chi-square test for comparison.
Next, we performed multiple logistic regression analyses to identify the factors that influence unmet medical needs. We also conducted a stratified logistic regression analysis of the factors by age group (19–39, 40–59, 60 or older) and examined if the association of non-covered treatment costs differed by age, sex, and treatment type. The fit of the models was tested using the likelihood ratio and the area under the receiver operating characteristic curve (AUC). All analyses were performed using SAS 9.4 (SAS Institute, Cary, NC, USA) and IBM SPSS Statistics 25 (SPSS Inc., Chicago, IL, USA).
2.4. Ethics Statement
Because of the retrospective nature of this study, which utilized data with encrypted personal information, it was granted an exemption from ethical approval in writing by the Institutional Review Board of Jaseng Hospital of Korean Medicine in Seoul, Korea (JASENG 2019-03-003). All authors read and followed the tenets of the Declaration of Helsinki in preparing this study.
3. Results
Table 1 shows the presence of unmet medical needs according to respondents’ characteristics. Out of the 11,378 total subjects, 1320 (11.60%) had experienced unmet medical needs.
Table 2 shows the results of a similar analysis while also stratifying by age group. The following factors were associated with unmet medical needs in all age groups: among the predisposing factors, being female (p = 0.000); among the enabling factors, total household income (p = 0.000); and among the need factors, pain, self-related health status, and depression (p = 0.000).
Table 3 shows the results of the overall multiple logistic regression analysis. As can be seen in Model 1, the odds of unmet medical need were higher among the older age group (70–79 years old, odds ratio (OR) = 2.51, 95% confidence interval (CI) = 1.78–3.56), participants with a lower level of education (OR = 1.51, 95% CI = 1.24–1.85), and participants who were unmarried (OR = 1.63, 95% CI = 1.42–1.86). Model 2 revealed several more related factors, including income, type of health insurance, and private insurance, in addition to the Model 1 factors of being female and unmarried. The odds of unmet medical needs were higher among participants with a lower monthly income (OR = 1.49, 95% CI = 1.21–1.84), those receiving Medicaid (OR = 1.43, 95% CI = 1.13–1.82), and those without private insurance (OR = 1.17, 95% CI = 1.01–1.36). Model 3 revealed that the odds of unmet medical needs were significantly greater among participants who lacked employment (OR = 1.24, 95% CI = 1.06–1.46), those who were Medicaid recipients (OR = 1.48, 95% CI = 1.22–1.78), those who had received non-covered treatment (OR = 1.24, 95% CI = 1.08–1.42), those not regularly exercising (OR = 1.23, 95% CI = 1.02–1.48), those experiencing pain (OR = 2.29, 95% CI = 1.97–2.66), those who reported a bed self-rated health status (OR = 2.29, 95% CI = 1.89–2.79), and those who had severe depression (OR = 2.46, 95% CI = 1.39–4.35).
Table 4 shows the results of the regression analysis according to age group (19–39 years, 40–59 years, ≥60 years). The results indicated that, across all age groups, self-rated health status and depression were significant factors. For self-rated health status, the odds ratios of unmet medical needs were as follows: 19–39 years old (OR = 2.43, 95% CI = 1.32–4.48), 40–59 years old (OR = 2.23, 95% CI = 1.57–3.16), and ≥60 years old (OR = 2.34, 95% CI = 1.77–3.08). For depression, the odds ratios were as follows: 19–39 years old (OR = 2.26, 95% CI = 1.31–3.91), 40–59 years old (OR = 1.43, 95% CI = 1.08–1.89), and ≥60 years old (OR = 1.97, 95% CI = 1.63–2.39). For participants aged 19–39 years, the enabling factors (i.e., economic activity and income) had the largest association on unmet medical needs. Compared to participants in the highest income quintile (5Q), the odds of unmet medical needs increased as income decreased (2Q: OR = 2.32, 95% CI = 1.14–4.71; 3Q: OR = 3.83, 95% CI = 2.12–6.91). Compared to participants who were not participating in economic activities, those who did participate had higher odds of unmet medical needs, although economic activity did not have a large impact on the 40–59 years age group compared to the other age groups. The odds of unmet medical needs was higher among individuals with disability in the 40–59 years old group (OR = 1.62, 95% CI = 1.04–2.55), those who did not engage in regular exercise (OR = 1.68, 95% CI = 1.02–2.77), and those who experienced pain (OR = 2.82, 95% CI = 2.22–3.59), all of which hinder physical accessibility. Among participants who are ≥60 years, non-covered treatment increased the odds of unmet medical needs to a greater extent than in the other age groups (OR = 1.31, 95% CI = 1.08–1.58). Among the younger participants, marital status did not have an impact on unmet medical needs; however, it had a large association on the odds of unmet medical needs for middle-aged and older individuals (40–59: OR = 1.41, 95% CI = 1.06–1.87, 60 years≦: OR = 1.59, 95% CI = 1.31–1.92).
Table 5 shows the association of non-covered treatment on the odds of unmet medical needs according to sex, age, and type of medical care. This factor was associated with unmet medical needs only in males (Model 3 OR = 1.47, 95% CI = 1.19–1.82), those ≥60 years old (Model 3 OR = 1.31, 95% CI = 1.08–1.58), and those who had only experience with Western medicine (Model 3 OR = 1.33, 95% CI = 1.15–1.55).
Table A1 shows the mean costs of individuals with met medical needs and those with unmet medical needs according to type of medical care. When looking at the costs used in Western medicine and traditional Korean medicine, we found that the total treatment costs, health insurance costs, out-of-pocket costs, and non-covered treatment costs were higher among those who had experienced unmet medical needs in both types. The non-covered treatment costs of Western medicine were higher than were those of traditional Korean medicine (Western medicine: $111.39; traditional Korean medicine: $3.31).
4. Discussion
This study examined the current status and correlates of unmet medical needs among Korean adults using data from the KHPS. The results indicate that 11.6% of Korean adults had experienced unmet medical needs, which is slightly lower than the 14.5% found in a previous study [27]. However, it is about five times as high as the 2.5% found among the 27 OECD countries in 2016 [5]. The largest reason for unmet medical needs was financial barriers (28.8%), which is identical to the findings of a previous study [20,28] (see Table A2). The correlates of unmet medical needs can be summarized as follows.
First, the predisposing factors were age, education level, and marital status. As shown in Table A3, the experience of unmet medical needs increased with age, which accords with the findings of previous research [29,30,31]. The rate was particularly high among those in their forties, possibly because this group has less time to access medical services due to their relatively active social lives [19]. The analyses by age offer some support for this, as the need factors that hindered physical accessibility, such as disability and pain, had a larger impact on this phenomenon than did financial reasons among individuals in their forties compared to other age groups (Table 4). As for education level, past research has found it to be associated with health behaviors and attitudes [11,32]. It is possible that the experience of unmet medical needs was more common among participants with lower education levels and those who were unmarried because they put less focus on health management [15,33].
Second, the enabling factors related to unmet medical needs were economic activity, monthly income, and medical insurance type. These associations, particularly the fact that the odds of unmet medical needs were higher for non-workers, those with lower monthly household incomes, those on Medicaid, and those with non-covered treatment costs, can be largely attributed to financial reasons [34]. The financial burden [5,35] experienced by unemployed persons and those from lower income households [36] can lead to unmet medical needs. The main cause of unmet medical needs was found to be financial reasons in other countries as well, including Greece, Italy, Poland, and Portugal [37,38]. In South Korea, Medicaid recipients are low-income individuals who are eligible for coverage when they require medical services due to disease, injury, or pregnancy [39]. The fact that Medicaid recipients experience unmet medical needs suggests that the NHI does not provide financially sufficient coverage.
Non-covered treatments are defined as treatments for which persons must pay the costs along with their co-pays due to a limited scope of coverage [30]. According to the OECD Health Statistics 2015, 37% of the total health expenditures in South Korea was from out-of-pocket payments [40]. The proportion of households that incur so-called catastrophic medical costs—Being overburdened by non-covered medical expenses, which often culminates in bankruptcy—Increased from 3.68% in 2010 to 4.39% in 2013. The increase was to 12.86% among the lowest-income households [41]. Patients who receive non-covered Patients who receive non-covered treatment often have difficulty meeting their medical needs because of the burden of medical costs treatment often have difficulty meeting their medical needs because of the burden of medical costs [42]. The total medical costs, health insurance costs, co-pays, and non-covered cost amount were found to be higher among individuals who had experienced unmet medical needs (Table A1). Therefore, policies aimed at reducing the financial burdens of patients, such as by reducing the number of non-covered treatments through an expansion of health insurance coverage, are needed.
Third, the need factors related to unmet medical needs were regular exercise, pain, self-rated health status, and depression. The prevalence of unmet medical needs has been found to be higher among those with worse mobility or with chronic pain due to the resultant difficulties with mobility [43]. Past studies have also found unmet medical needs to be associated with worse self-rated health status [44] and depression [45,46] because of the costs related to depression [47,48].
When combining the results of this study and those of previous research, it appears that the factors that affect unmet medical need are older age, lower education level, a lack of economic activity, worse self-rated health status, and severe depression. Socially and economically vulnerable classes tend to require more health care and experience more health problems [15]. One way of addressing this problem is through cost sharing, which enables greater access of medical care by a particular demographic group. Therefore, policies should be established to reduce medical costs or enhance coverage of elderly and vulnerable populations, which may help to enhance equality in the use of medical care.
This research has several limitations. First, the results of this study cannot be easily generalized, as they are likely to be influenced by the cultural background and payment or compensation system of the country. Therefore, in future studies, it will be necessary to interpret the results in light of the country’s health care system. Second, among the factors that might influence unmet medical needs are distance to the medical facility and moral laxity due to private insurance [49]. However, these variables were not included in the health panel data, which means we could not control for them. Third, the KHPS is based on patient self-reports rather than on medical records. The accuracy of the survey data may be impaired by any of a number of sources of bias, such as recall bias. Also, operational definition was needed for variables with missing values is high(income) or rare (TM) through several expert meeting. Therefore, there may be problems with the accuracy of the data and this procedure might have introduced selection bias. Finally, because this study used a cross-sectional research design based on data from one year (2016), the causal relationships must be confirmed in future studies [50]. It might be possible to explore the trends in changes through a time-series analysis using accumulated longitudinal data in the future.
Despite these limitations, our study has significance for the following reasons. We analyzed the current status and multiple correlates of unmet medical needs using recent representative, data from the KHPS. Perhaps the greatest advantages of the study are that we examined the factors that affect unmet medical needs in detail and that we included factors such as non-covered treatments. In the future, policy studies are needed to evaluate and develop health policies on this topic, as current research in this area is insufficient. We believe that this study will be a high quality reference for countries with similar health systems to that of Korea—especially France, Germany, Japan, and Ireland—in which private insurance complements the public system’s cost-sharing obligations.
5. Conclusions
The results of this study indicate that about 1 in 9 Korean citizens (11.6%) have unmet medical needs. In this study, the following three factors have been shown to be caused by unmet medical needs. First, regarding predisposing factors, with increased age, decreased levels of education, and the absence of a spouse, participants were more likely to experience unmet medical needs. Second, regarding need factors, participants experienced unmet medical needs when monthly household income was lower, medical benefits came from Medicaid, and non-covered treatments were more prevalent. Third, with regard to enabling factors, participants experienced unmet medical needs when they did not exercise, they experienced pain, their self-rated health status was worse, and they experienced severe depression. In conclusion, socially and economically vulnerable people experience more unmet medical needs than do others. Therefore, economic and public health approaches are necessary to reduce experiences with unmet medical needs; these include enhancement of health care coverage at the national level.
Author Contributions
Conceptualization, B.J. and I.-H.H.; methodology, B.J.; software, B.J.; validation, I.-H.H. and D.K.; formal analysis, B.J. and Y.S.Y.; investigation, B.J. and Y.S.Y.; resources, I.-H.H.; data curation, B.J. and I.-H.H.; writing—original draft preparation, Y.S.Y. and B.J.; writing—review and editing, I.-H.H. and D.K.; supervision, I.-H.H. and B.J.
Funding
This research received no external funding.
Conflicts of Interest
The authors declare no conflict of interest.
Appendix A

Table A1.
Medical costs of participants with unmet needs and those with met needs according to type of medical care.
Table A1.
Medical costs of participants with unmet needs and those with met needs according to type of medical care.
| Category | Met Needs | Unmet Needs | ||
|---|---|---|---|---|
| Mean | SD | Mean | SD | |
| TM_Outpatient visits | 2.27 | 9.303 | 3.22 | 11.961 |
| TM_Total cost * | 35.90 | 167.56 | 51.84 | 200.79 |
| TM_INSUP cost † | 26.53 | 123.22 | 41.04 | 170.70 |
| TM_SLF cost ‡ | 6.08 | 29.25 | 7.50 | 27.91 |
| TM_Uncovered cost § | 3.31 | 57.68 | 3.30 | 34.91 |
| WM_Outpatient visits | 17.31 | 23.022 | 19.87 | 26.565 |
| WM_Total * | 576.28 | 7848.72 | 529.80 | 1146.17 |
| WM_INSUP cost † | 358.00 | 7816.19 | 302.50 | 936.14 |
| WM_SLF ‡ | 106.97 | 182.09 | 116.32 | 190.84 |
| WM_Uncovered cost § | 111.39 | 329.53 | 111.27 | 250.60 |
* Total cost: Sum of INSUP cost and SLF cost paid to the medical care institution. What is determined to be eligible for reimbursement by the Health Insurance Review and Assessment Service (HIRA) out of the total treatment amount is indicated in the submitted insurance claim statement. We converted costs into 2019 U.S. dollars (1 USD = 1142.30 KRW as of April 10, 2019). † INSUP cost: Cost reimbursed by the Korean National Health Insurance Service as the insurer. ‡ SLF cost: Self-payment amount paid by the beneficiary. § Non-covered cost: Costs not guaranteed by National Health Insurance and of which the patient must pay 100%. Abbreviations: TM, traditional Korean medicine; WM, Western medicine.
Table A2.
Factors that affect general perceived unmet needs.
| Reason for Unmet Needs | n | (%) |
|---|---|---|
| Financial reasons (burden of treatment costs) | 380 | (28.8) |
| Medical facility is too far away | 40 | (3.0) |
| Difficulty with mobility and difficulty visiting due to health reasons | 98 | (7.4) |
| There is no one to care for the children | 22 | (1.7) |
| Symptoms are minor | 361 | (27.3) |
| Do not know where to go (lack of information) | 9 | (0.7) |
| Lack of time to visit | 357 | (27.0) |
| Appointments cannot be made in a timely manner | 1 | (0.1) |
| There is no attending physician | 2 | (0.2) |
| Other | 50 | (3.8) |
| Total | 1320 | (100.0) |
Table A3.
Factors affecting unmet needs.
| Variables | Odds Ratio (95% Confidence Interval) | ||||||||
|---|---|---|---|---|---|---|---|---|---|
| Model 1: Unadjusted OR | Model 2: Adjusted OR | ||||||||
| OR | p | OR | p | ||||||
| Gender | Male | 1.00 | 1.00 | ||||||
| Female | 1.29 | 1.15 | 1.46 | 0.000 | 1.09 | 0.96 | 1.25 | 0.185 | |
| Age (years) | 20–29 | 1.00 | 1.00 | ||||||
| 30–39 | 1.47 | 1.04 | 2.09 | 0.029 | 1.72 | 1.19 | 2.47 | 0.004 | |
| 40–49 | 1.76 | 1.28 | 2.41 | 0.000 | 1.99 | 1.41 | 2.82 | 0.000 | |
| 50–59 | 1.88 | 1.37 | 2.56 | 0.000 | 1.76 | 1.23 | 2.52 | 0.002 | |
| 60–69 | 1.92 | 1.41 | 2.62 | 0.000 | 1.53 | 1.05 | 2.23 | 0.026 | |
| 70≦ | 2.66 | 1.97 | 3.58 | 0.000 | 1.43 | 0.97 | 2.10 | 0.067 | |
| Education | Graduate university graduate | 1.00 | 1.00 | ||||||
| College or university graduate | 1.30 | 1.12 | 1.52 | 0.001 | 1.09 | 0.92 | 1.30 | 0.334 | |
| Middle and high school graduate | 1.89 | 1.64 | 2.18 | 0.000 | 1.09 | 0.88 | 1.35 | 0.424 | |
| Marital status | Married | 1.00 | 1.00 | ||||||
| Unmarried | 1.47 | 1.30 | 1.65 | 0.000 | 1.42 | 1.23 | 1.63 | 0.000 | |
| Economic activity | Current worker | 1.00 | 1.00 | ||||||
| Non-worker | 1.07 | 0.95 | 1.21 | 0.250 | 1.24 | 1.06 | 1.46 | 0.007 | |
| Income (quintiles) | 5Q (highest) | 1.00 | 1.00 | ||||||
| 4Q | 1.22 | 0.97 | 1.55 | 0.095 | 1.19 | 0.93 | 1.51 | 0.171 | |
| 3Q | 1.57 | 1.25 | 1.97 | 0.000 | 1.43 | 1.13 | 1.81 | 0.003 | |
| 2Q | 1.50 | 1.19 | 1.89 | 0.001 | 1.11 | 0.87 | 1.42 | 0.408 | |
| 1Q (lowest) | 1.97 | 1.63 | 2.40 | 0.000 | 1.41 | 1.14 | 1.75 | 0.001 | |
| Medical insurance type | NHI | 1.00 | 1.00 | ||||||
| Medicaid | 1.95 | 1.56 | 2.44 | 0.000 | 1.48 | 1.22 | 1.78 | 0.000 | |
| Others | 0.90 | 0.79 | 1.02 | 0.104 | 1.11 | 0.87 | 1.43 | 0.404 | |
| Private insurance | Yes | 1.00 | 1.00 | ||||||
| No | 1.55 | 1.37 | 1.75 | 0.000 | 1.06 | 0.91 | 1.23 | 0.488 | |
| Non-covered treatment | No | 1.00 | 1.00 | ||||||
| Yes | 1.17 | 0.97 | 1.41 | 0.100 | 1.24 | 1.08 | 1.42 | 0.002 | |
| Chronic Disease | No | 1.00 | 1.00 | ||||||
| Yes | 1.68 | 1.46 | 1.93 | 0.000 | 1.09 | 0.91 | 1.30 | 0.342 | |
| Disability | Yes | 1.00 | 1.00 | ||||||
| No | 1.59 | 1.32 | 1.92 | 0.000 | 0.99 | 0.80 | 1.22 | 0.932 | |
| Regular exercise | Yes | 1.00 | 1.00 | ||||||
| No | 1.18 | 1.02 | 1.37 | 0.025 | 1.23 | 1.02 | 1.48 | 0.027 | |
| Pain | No | 1.00 | 1.00 | ||||||
| Yes | 3.19 | 2.84 | 3.59 | 0.000 | 2.29 | 1.97 | 2.66 | 0.000 | |
| Self-rated health status | Good | 1.00 | 1.00 | ||||||
| Moderate | 1.83 | 1.58 | 2.12 | 0.000 | 1.46 | 1.25 | 1.71 | 0.000 | |
| Bad | 4.06 | 3.47 | 4.76 | 0.000 | 2.29 | 1.89 | 2.79 | 0.000 | |
| Depression | Light | 1.00 | 1.00 | ||||||
| Moderate | 3.01 | 2.64 | 3.43 | 0.000 | 1.79 | 1.54 | 2.07 | 0.000 | |
| Severe | 4.75 | 2.77 | 8.14 | 0.000 | 2.46 | 1.39 | 4.35 | 0.002 | |
| AUC * | 0.700 | ||||||||
Notes: A logistic regression analysis with complex sampling design was performed after adjusting for all covariates. Abbreviations: NHI, National Health Insurance; OR, odds ratio; 95% CI, 95% confidence intervals.
References
- Hwang, B.-D.; Choi, R. The prevalence and association factors of unmet medical needs by age group in the elderly. Korean J. Health Serv. Manag. 2015, 9, 81–93. [Google Scholar] [CrossRef]
- Aday, L.; Anderson, R. Access to Medical Care; A Day Access to Medical Care; Health Administration Press, University of Michigan: Ann Arbor, MI, USA, 1975. [Google Scholar]
- Smith, S.; Connolly, S. Re-thinking unmet need for health care: Introducing a dynamic perspective. Health Econ. Policy Law 2019, 25, 1–18. [Google Scholar] [CrossRef] [PubMed]
- Reeves, A.; McKee, M.; Stuckler, D. The attack on universal health coverage in Europe: Recession, austerity and unmet needs. Eur. J. Public Health 2015, 25, 364–365. [Google Scholar] [CrossRef] [PubMed]
- OECD. Health at a Glance: Europe 2018; OECD: Paris, France, 2018. [Google Scholar]
- The Commonwealth Fund. The Commonwealth Fund 2010 International Health Policy Survey in Eleven Countries; Chartbook; Commonwealth Fund: New York, NY, USA, 2010. [Google Scholar]
- Reinhardt, U.E.; Cheng, T.-M. The World Health Report 2000-Health Systems: Improving Performance; Bulletin of the World Health Organization; World Health Organization Publishing: Geneva, Switzerland, 2000; Volume 78, p. 1064. [Google Scholar]
- Jones, R.S. Health-Care Reform in Korea; OECD: Paris, France, 2010. [Google Scholar]
- Health Insurance Review & Assessment Service. Available online: https://www.hira.or.kr/eng/main.do (accessed on 21 February 2019).
- Oh, J.; Ko, Y.; Baer Alley, A.; Kwon, S. Participation of the lay public in decision-making for benefit coverage of national health insurance in South Korea. Health Syst. Reform 2015, 1, 62–71. [Google Scholar] [CrossRef]
- Kim, J.; Kim, T.H.; Park, E.-C.; Cho, W.H. Factors influencing unmet need for health care services in Korea. Asia Pac. J. Public Health 2015, 27, NP2555–NP2569. [Google Scholar] [CrossRef] [PubMed]
- Han, K.-T.; Park, E.-C.; Kim, S.J. Unmet healthcare needs and community health center utilization among the low-income population based on a nationwide community health survey. Health Policy 2016, 120, 630–637. [Google Scholar] [CrossRef]
- Detollenaere, J.; Hanssens, L.; Vyncke, V.; De Maeseneer, J.; Willems, S. Do we reap what we sow? Exploring the association between the strength of European primary healthcare systems and inequity in unmet need. PLoS ONE 2017, 12, e0169274. [Google Scholar] [CrossRef]
- Fjær, E.L.; Stornes, P.; Borisova, L.V.; McNamara, C.L.; Eikemo, T.A. Subjective perceptions of unmet need for health care in Europe among social groups: Findings from the European social survey (2014) special module on the social determinants of health. Eur. J. Public Health 2017, 27, 82–89. [Google Scholar] [CrossRef] [Green Version]
- Bryant, T.; Leaver, C.; Dunn, J. Unmet healthcare need, gender, and health inequalities in Canada. Health Policy 2009, 91, 24–32. [Google Scholar] [CrossRef]
- Huh, S.; Kim, S. Unmet needs for health care among Korean adults: Differences across age groups. Korean J. Health Econ. Policy 2007, 13, 1–16. [Google Scholar]
- Ronksley, P.E.; Sanmartin, C.; Quan, H.; Ravani, P.; Tonelli, M.; Manns, B.; Hemmelgarn, B.R. Association between chronic conditions and perceived unmet health care needs. Open Med. 2012, 6, e48. [Google Scholar] [PubMed]
- Kim, Y.-S.; Lee, J.; Moon, Y.; Kim, K.J.; Lee, K.; Choi, J.; Han, S.-H. Unmet healthcare needs of elderly people in Korea. BMC Geriatr. 2018, 18, 98. [Google Scholar] [CrossRef] [PubMed]
- Pryor, W.; Nguyen, L.; Islam, Q.; Jalal, F.; Marella, M. Unmet Needs and Use of Assistive Products in Two Districts of Bangladesh: Findings from a Household Survey. Int. J. Environ. Res. Public Health 2018, 15, 2901. [Google Scholar] [CrossRef] [PubMed]
- Ha, R.; Jung-Choi, K.; Kim, C.-Y. Employment Status and Self-Reported Unmet Healthcare Needs among South Korean Employees. Int. J. Environ. Res. Public Health 2019, 16, 9. [Google Scholar] [CrossRef] [PubMed]
- Park, S.J.; Lee, W.J. An Analysis of Convergence Factors on the Unmet Health Needs of the Indigent Elderly. J. Korea Converg. Soc. 2017, 8, 221–229. [Google Scholar] [CrossRef] [Green Version]
- Jung, Y.; Seo, N.; Go, S.; Han, E. A Report on the Korea Health Panel Survey of 2008; Institute for Health and Social Affairs: Seoul, Korea, 2010; p. 38. [Google Scholar]
- Korea Institute for Health and Social Affairs. Introduction of Korea Health Panel Survey (KHPS). Available online: http://www.khp.re.kr/eng/survey/weights.do (accessed on 23 February 2019).
- Babitsch, B.; Gohl, D.; von Lengerke, T. Re-revisiting Andersen’s Behavioral Model of Health Services Use: A systematic review of studies from 1998–2011. GMS PsychoSoc. Med. 2012, 9. [Google Scholar] [CrossRef]
- Cavalieri, M. Geographical variation of unmet medical needs in Italy: A multivariate logistic regression analysis. Int. J. Health Geogr. 2013, 12, 27. [Google Scholar] [CrossRef]
- von Lengerke, T.; Gohl, D.; Babitsch, B. Re-revisiting the Behavioral Model of Health Care Utilization by Andersen: A review on theoretical advances and perspectives. In Health Care Utilization in Germany; Springer: Berlin/Heidelberg, Germany, 2014; pp. 11–28. [Google Scholar]
- Ko, H. Unmet healthcare needs and health status: Panel evidence from Korea. Health Policy 2016, 120, 646–653. [Google Scholar] [CrossRef]
- Hwang, J. Understanding reasons for unmet health care needs in Korea: What are health policy implications? BMC Health Serv. Res. 2018, 18, 557. [Google Scholar] [CrossRef]
- Lim, E.J.; Kim, S.Y.; Sohn, M.S.; Choe, P.N.; Oh, B.S. Research on the conflicts and future direction of integrative medicine in Korea. J. Physiol. Pathol. Korean Med. 2012, 28, 243–250. [Google Scholar] [CrossRef]
- Lee, S.H.; Kim, S.; Lee, W.K. The Trend in Household Catastrophic Medical Expenditure according to Healthcare Coverage Types and Its Associated Factors. J. Korea Acad. Ind. Coop. Soc. 2015, 16, 4067–4076. [Google Scholar] [Green Version]
- World Health Organization. Regional Office for the Western Pacific 2015. Republic of Korea Health System Review. Available online: http://www.who.int/iris/handle/10665/208215 2015 (accessed on 4 July 2019).
- Lahelma, E.; Martikainen, P.; Laaksonen, M.; Aittomäki, A. Pathways between socioeconomic determinants of health. J.Epidemiol. Comm. Health 2004, 58, 327–332. [Google Scholar] [CrossRef] [PubMed] [Green Version]
- Park, E.H.; Park, E.-C.; Oh, D.H.; Cho, E. The Effect of Stress and Depression on Unmet Medical Needs. Korean J. Clin. Pharm. 2017, 27, 44–54. [Google Scholar] [CrossRef] [Green Version]
- Song, H.-Y.; Choi, J.-W.; Park, E.-C. The Effect of Economic Participatory Change on Unmet Needs of Health Care among Korean Adults. Health Policy Manag. 2015, 25, 11–21. [Google Scholar] [CrossRef]
- OECD Indicators. Health at a Glance 2011; OECD Indicators, OECD Publishing: Paris, France, 2019. [Google Scholar] [CrossRef]
- Yang, J. The Longitudinal Trend and Association Factors of Unmet Medical Need; Graduate School of Public Health, Korea University: Seoul, Korea, 2010. [Google Scholar]
- Pappa, E.; Kontodimopoulos, N.; Papadopoulos, A.; Tountas, Y.; Niakas, D. Investigating unmet health needs in primary health care services in a representative sample of the Greek population. Int. J. Environ. Res. Public Health 2013, 10, 2017–2027. [Google Scholar] [CrossRef] [PubMed]
- Baert, K.; De Norre, B. Perception of Health and Access to Health Care in the EU-25 in 2007; Eurostat Statistics in Focus 24/2009; Eurostat Statistics: Brussels, Belgium, 2009; pp. 1–12.
- Lee, J.Y.; Yun, J. What Else Is Needed in the Korean Government’s Master Plan for People with Developmental Disabilities? J. Prev. Med. Public Health 2019, 52, 200. [Google Scholar] [CrossRef]
- OECD. Organisation for Economic Co-Operation and Development. OECD Health Statistics 2015. Available online: https://www.oecd.org/unitedstates/Country-Note-UNITED%20STATES-OECD-Health-Statistics-2015.pdf (accessed on 4 July 2019).
- Hyung Ho, K. Implications of Recent Trends in Uncoverd Medical Expenses. Health Insur. Rev. Assess. Serv. 2016, 10, 7–19. [Google Scholar]
- Shin, Y.; Shon, J. The prevalence and association factors of unmet medical need-using the 1st and 2nd Korea welfare panel data. Health Soc. Welf. Rev. 2009, 29, 111–142. [Google Scholar]
- Miroševič, Š.; Prins, J.B.; Selič, P.; Zaletel Kragelj, L.; Klemenc Ketiš, Z. Prevalence and factors associated with unmet needs in post-treatment cancer survivors: A systematic review. Eur. J. Cancer Care 2019, 28, e13060. [Google Scholar] [CrossRef]
- Kim, J. The Impact of Health Care Coverage on Changes in Self-Rated Health: Comparison between the Near Poor and the Upper Middle Class. Health Policy Manag. 2016, 26, 390–398. [Google Scholar] [CrossRef] [Green Version]
- Clignet, F.; Houtjes, W.; van Straten, A.; Cuijpers, P.; van Meijel, B. Unmet care needs, care provision and patient satisfaction in patients with a late life depression: A cross-sectional study. Aging Ment. Health 2019, 23, 491–497. [Google Scholar] [CrossRef] [PubMed]
- Rafael, B.; Konkolÿ, B.T.; Kovács, P.; Balog, P. Anxiety, depression, health-related control beliefs, and their association with health behavior in patients with ischemic heart disease. Orv. Hetil. 2015, 156, 813–822. [Google Scholar] [CrossRef] [PubMed]
- Leone, T.; Coast, E.; Narayanan, S.; de Graft Aikins, A. Diabetes and depression comorbidity and socio-economic status in low and middle income countries (LMICs): A mapping of the evidence. Glob. Health 2012, 8, 39. [Google Scholar] [CrossRef] [PubMed]
- Angstman, K.B.; Doganer, Y.C.; DeJesus, R.S.; Rohrer, J.E. Increased medical cost metrics for patients 50 years of age and older in the collaborate care model of treatment for depression. Psychogeriatrics. 2016, 16, 102–106. [Google Scholar] [CrossRef] [PubMed]
- Weathers, A.; Minkovitz, C.; O’Campo, P.; Diener-West, M. Access to care for children of migratory agricultural workers: Factors associated with unmet need for medical care. Pediatrics 2004, 113, e276–e282. [Google Scholar] [CrossRef] [PubMed]
- Kim, Y.; Kim, S.; Jeong, S.; Cho, S.G.; Hwang, S. Poor People and Poor Health: Examining the Mediating Effect of Unmet Healthcare Needs in Korea. J. Prev. Med. Public Health Yebang Uihakhoe Chi 2019, 52, 51–59. [Google Scholar] [CrossRef] [PubMed] [Green Version]
Figure 1.
Flowchart of the study population. Abbreviations: KHPS = Korea Health Panel Survey.

Table 1.
Presence of unmet medical needs according to sociodemographic characteristics of participants.
Table 1.
Presence of unmet medical needs according to sociodemographic characteristics of participants.
| Variables | Class | Total | Unmet Medical Needs | p | ||||
|---|---|---|---|---|---|---|---|---|
| No | Yes | |||||||
| N | % | n | % | n | % | |||
| Total | 11,378 | (100.0) | 10,058 | (88.4) | 1320 | (11.6) | ||
| Sex | Male | 4816 | (42.3) | 4329 | (43.0) | 487 | (36.9) | 0.000 |
| Female | 6562 | (57.7) | 5729 | (57.0) | 833 | (63.1) | ||
| Age (years) | 20–29 | 826 | (7.3) | 774 | (7.7) | 52 | (3.9) | 0.000 |
| 30–39 | 1087 | (9.6) | 989 | (9.8) | 98 | (7.4) | ||
| 40–49 | 2018 | (17.7) | 1805 | (17.9) | 213 | (16.1) | ||
| 50–59 | 2127 | (18.7) | 1889 | (18.8) | 238 | (18.0) | ||
| 60–69 | 2341 | (20.6) | 2073 | (20.6) | 268 | (20.3) | ||
| 70≦ | 2979 | (26.2) | 2528 | (25.1) | 451 | (34.2) | ||
| Education | Middle and high school graduate | 3988 | (34.0) | 3385 | (33.7) | 603 | (45.7) | 0.000 |
| College or university graduate | 3518 | (30.9) | 3134 | (31.2) | 384 | (29.1) | ||
| Graduate university graduate | 3872 | (35.1) | 3539 | (35.2) | 333 | (25.2) | ||
| Marital status | Married | 8176 | (71.9) | 7323 | (72.8) | 853 | (64.6) | 0.000 |
| Unmarried | 3202 | (28.1) | 2735 | (27.2) | 467 | (35.4) | ||
| Economic activity | Current worker | 4267 | (37.5) | 3791 | (37.7) | 476 | (36.1) | 0.250 |
| Non-worker | 7111 | (62.5) | 6267 | (62.3) | 844 | (63.9) | ||
| Monthly income (quintiles) | 1Q (lowest) | 4420 | (38.8) | 3792 | (37.7) | 628 | (47.6) | 0.000 |
| 2Q | 1709 | (15.0) | 1518 | (15.1) | 191 | (14.5) | ||
| 3Q | 1720 | (15.1) | 1520 | (15.1) | 200 | (15.2) | ||
| 4Q | 1772 | (15.6) | 1607 | (16.0) | 165 | (12.5) | ||
| 5Q (highest) | 1757 | (15.4) | 1621 | (16.1) | 136 | (10.3) | ||
| Medical insurance type | NHI | 7426 | (65.3) | 6571 | (65.3) | 855 | (64.8) | 0.000 |
| Medicaid | 528 | (4.6) | 421 | (4.2) | 107 | (8.1) | ||
| Others | 3424 | (30.1) | 3066 | (30.5) | 358 | (27.1) | ||
| Private insurance | No | 3140 | (27.6) | 2667 | (26.5) | 473 | (35.8) | 0.000 |
| Yes | 8238 | (72.4) | 7391 | (73.5) | 847 | (64.2) | ||
| Non-covered treatment | No | 3928 | (34.5) | 3462 | (34.4) | 466 | (35.3) | 0.526 |
| Yes | 7450 | (65.5) | 6596 | (65.6) | 854 | (64.7) | ||
| Chronic disease | No | 3280 | (28.8) | 3012 | (29.9) | 268 | (20.3) | 0.000 |
| Yes | 8098 | (71.2) | 7046 | (70.1) | 1052 | (79.7) | ||
| Disability | No | 10,510 | (92.4) | 9335 | (92.8) | 1175 | (89.0) | 0.000 |
| Yes | 868 | (7.6) | 723 | (7.2) | 145 | (11.0) | ||
| Regular Exercise | No | 1576 | (78.7) | 1257 | (12.5) | 319 | (24.2) | 0.000 |
| Yes | 9802 | (21.3) | 8801 | (87.5) | 1001 | (75.8) | ||
| Pain | No | 7832 | (68.8) | 7243 | (72.0) | 589 | (44.6) | 0.000 |
| Yes | 3546 | (31.2) | 2815 | (28.0) | 731 | (55.4) | ||
| Self-rated health status | Good | 4434 | (39.0) | 4137 | (41.1) | 297 | (22.5) | 0.000 |
| Moderate | 4978 | (43.8) | 4399 | (43.7) | 579 | (43.9) | ||
| Bad | 1966 | (17.3) | 1522 | (15.1) | 444 | (33.6) | ||
| Depression | Light | 9599 | (84.4) | 8705 | (86.5) | 894 | (67.7) | 0.000 |
| Moderate | 1718 | (15.1) | 1312 | (13.0) | 406 | (30.8) | ||
| Severe | 61 | (0.5) | 41 | (0.4) | 20 | (1.5) | ||
| Type of medical care | TM & WM | 2299 | (20.2) | 1985 | (19.7) | 314 | (23.8) | 0.002 |
| TM | 80 | (0.7) | 68 | (0.7) | 12 | (0.9) | ||
| WM | 8761 | (77.0) | 7787 | (77.4) | 974 | (73.8) | ||
| Other | 238 | (2.1) | 218 | (2.2) | 20 | (1.5) | ||
Notes: A chi-square test was used to determine differences in presence of unmet medical needs according to general characteristics. Abbreviations: NHI, National Health Insurance; TM, traditional Korean medicine; WM, Western medicine.
Table 2.
Unmet medical needs according to sociodemographic characteristics, stratified by age.
| Variables | Class | 20–39 Years Old | 40–59 Years Old | 60 Years Old≦ | |||||||||||||||
|---|---|---|---|---|---|---|---|---|---|---|---|---|---|---|---|---|---|---|---|
| Total | Unmet | p | Total | Unmet | p | Total | Unmet | p | |||||||||||
| No | Yes | No | Yes | No | Yes | ||||||||||||||
| N | N | % | n | % | N | n | % | n | % | N | n | % | n | % | |||||
| Total | 1913 | 1763 | (92.2) | 150 | (7.8) | 4145 | 3694 | (89.1) | 451 | (10.9) | 5320 | 4601 | (86.5) | 719 | (13.5) | ||||
| Sex | Male | 786 | 727 | (41.2) | 59 | (39.3) | 0.649 | 1787 | 1605 | (43.4) | 182 | (40.4) | 0.210 | 2243 | 1997 | (43.4) | 246 | (34.2) | 0.000 |
| Female | 1127 | 1036 | (58.8) | 91 | (60.7) | 2358 | 2089 | (56.6) | 269 | (59.6) | 3077 | 2604 | (56.6) | 473 | (65.8) | ||||
| Education | Graduate university graduate | 16 | 15 | (0.9) | 1 | (0.7) | 0.267 | 434 | 372 | (10.1) | 62 | (13.7) | 0.031 | 3538 | 2998 | (65.2) | 540 | (75.1) | 0.000 |
| College or university graduate | 364 | 328 | (18.6) | 36 | (24.0) | 1916 | 1705 | (46.2) | 211 | (46.8) | 1238 | 1101 | (23.9) | 137 | (19.1) | ||||
| Middle or high school graduate | 1533 | 1420 | (80.5) | 113 | (75.3) | 1795 | 1617 | (43.8) | 178 | (39.5) | 544 | 502 | (10.9) | 42 | (5.8) | ||||
| Marital status | Married | 731 | 661 | (37.5) | 70 | (46.7) | 0.026 | 3645 | 3278 | (88.7) | 367 | (81.4) | 0.000 | 3800 | 3384 | (73.5) | 416 | (57.9) | 0.000 |
| Unmarried | 1182 | 1102 | (62.5) | 80 | (53.3) | 500 | 416 | (11.3) | 84 | (18.6) | 1520 | 1217 | (26.5) | 303 | (42.1) | ||||
| Economic activity | Current worker | 438 | 391 | (22.2) | 47 | (31.3) | 0.010 | 1874 | 1664 | (45.0) | 210 | (46.6) | 0.541 | 1955 | 1736 | (37.7) | 219 | (30.5) | 0.000 |
| Non-worker | 1475 | 1372 | (77.8) | 103 | (68.7) | 2271 | 2030 | (55.0) | 241 | (53.4) | 3365 | 2865 | (62.3) | 500 | (69.5) | ||||
| Monthly income (quintiles) | 1Q (lowest) | 531 | 497 | (28.2) | 34 | (22.7) | 0.000 | 1256 | 1097 | (29.7) | 159 | (35.3) | 0.000 | 2633 | 2198 | (47.8) | 435 | (60.5) | 0.000 |
| 2Q | 203 | 184 | (10.4) | 19 | (12.7) | 448 | 395 | (10.7) | 53 | (11.8) | 1058 | 939 | (20.4) | 119 | (16.6) | ||||
| 3Q | 342 | 294 | (16.7) | 48 | (32.0) | 699 | 627 | (17.0) | 72 | (16.0) | 679 | 599 | (13.0) | 80 | (11.1) | ||||
| 4Q | 417 | 385 | (21.8) | 32 | (21.3) | 849 | 767 | (20.8) | 82 | (18.2) | 506 | 455 | (9.9) | 51 | (7.1) | ||||
| 5Q (highest) | 420 | 403 | (22.9) | 17 | (11.3) | 893 | 808 | (21.9) | 85 | (18.8) | 444 | 410 | (8.9) | 34 | (4.7) | ||||
| Medical insurance type | NHI | 795 | 725 | (41.1) | 70 | (46.7) | 0.384 | 2375 | 2119 | (57.4) | 256 | (56.8) | 0.006 | 4256 | 3727 | (81.0) | 529 | (73.6) | 0.000 |
| Medicaid | 21 | 19 | (1.1) | 2 | (1.3) | 109 | 87 | (2.4) | 22 | (4.9) | 398 | 315 | (6.8) | 83 | (11.5) | ||||
| Others | 1097 | 1019 | (57.8) | 78 | (52.0) | 1661 | 1488 | (40.3) | 173 | (38.4) | 666 | 559 | (12.1) | 107 | (14.9) | ||||
| Private insurance | Yes | 244 | 219 | (12.4) | 25 | (16.7) | 0.135 | 451 | 386 | (10.4) | 65 | (14.4) | 0.011 | 2445 | 2062 | (44.8) | 383 | (53.3) | 0.000 |
| No | 1669 | 1544 | (87.6) | 125 | (83.3) | 3694 | 3308 | (89.6) | 386 | (85.6) | 2875 | 2539 | (55.2) | 336 | (46.7) | ||||
| Non-covered treatment | No | 912 | 841 | (47.7) | 71 | (47.3) | 0.931 | 1612 | 1423 | (38.8) | 180 | (39.9) | 0.638 | 1404 | 1189 | (25.8) | 215 | (29.9) | 0.022 |
| Yes | 1001 | 922 | (52.3) | 79 | (52.7) | 2533 | 2262 | (61.2) | 271 | (60.1) | 3916 | 3412 | (74.2) | 504 | (70.1) | ||||
| Chronic disease | No | 1322 | 1222 | (69.3) | 100 | (66.7) | 0.501 | 1630 | 1492 | (40.4) | 138 | (30.6) | 0.000 | 328 | 298 | (6.5) | 30 | (4.2) | 0.017 |
| Yes | 591 | 541 | (30.7) | 50 | (33.3) | 2515 | 2202 | (59.6) | 313 | (69.4) | 4992 | 4303 | (93.5) | 689 | (95.8) | ||||
| Disability | Yes | 1878 | 1731 | (98.2) | 147 | (98.0) | 0.871 | 3978 | 3561 | (96.4) | 417 | (92.5) | 0.000 | 4654 | 4043 | (87.9) | 611 | (85.0) | 0.029 |
| No | 35 | 32 | (1.8) | 3 | (2.0) | 167 | 133 | (3.6) | 34 | (7.5) | 666 | 558 | (12.1) | 108 | (15.0) | ||||
| Regular exercise | Yes | 18 | 15 | (0.9) | 3 | (2.0) | 0.162 | 138 | 112 | (3.0) | 26 | (5.8) | 0.002 | 1420 | 1130 | (24.6) | 290 | (40.3) | 0.000 |
| No | 1895 | 1748 | (99.1) | 147 | (98.0) | 4007 | 3582 | (97.0) | 425 | (94.2) | 3900 | 3471 | (75.4) | 429 | (59.7) | ||||
| Pain | No | 1758 | 1635 | (92.7) | 123 | (82.0) | 0.000 | 3350 | 3083 | (83.5) | 267 | (59.2) | 0.000 | 2724 | 2525 | (54.9) | 199 | (27.7) | 0.000 |
| Yes | 155 | 128 | (7.3) | 27 | (18.0) | 795 | 611 | (16.5) | 184 | (40.8) | 2596 | 2076 | (45.1) | 520 | (72.3) | ||||
| Self-rated health status | Good | 1163 | 1097 | (62.2) | 66 | (44.0) | 0.000 | 1837 | 1706 | (46.2) | 131 | (29.0) | 0.000 | 1434 | 1334 | (29.0) | 100 | (13.9) | 0.000 |
| Moderate | 633 | 571 | (32.4) | 62 | (41.3) | 1930 | 1697 | (45.9) | 233 | (51.7) | 2415 | 2131 | (46.3) | 284 | (39.5) | ||||
| Bad | 117 | 95 | (5.4) | 22 | (14.7) | 378 | 291 | (7.9) | 87 | (19.3) | 1471 | 1136 | (24.7) | 335 | (46.6) | ||||
| Depression | Light | 1760 | 1636 | (92.8) | 124 | (82.7) | 0.000 | 3656 | 3305 | (89.5) | 351 | (77.8) | 0.000 | 4183 | 3764 | (81.8) | 419 | (58.3) | 0.000 |
| Moderate | 146 | 121 | (6.9) | 25 | (16.7) | 476 | 379 | (10.3) | 97 | (21.5) | 1096 | 812 | (17.6) | 284 | (39.5) | ||||
| Severe | 7 | 6 | (0.3) | 1 | (0.7) | 13 | 10 | (0.3) | 3 | (0.7) | 41 | 25 | (0.5) | 16 | (2.2) | ||||
| Type of medical care | TM & WM | 228 | 206 | (11.7) | 22 | (14.7) | 0.434 | 728 | 621 | (16.8) | 107 | (23.7) | 0.001 | 1343 | 1158 | (25.2) | 185 | (25.7) | 0.853 |
| TM | 22 | 19 | (1.1) | 3 | (2.0) | 45 | 38 | (1.0) | 7 | (1.6) | 13 | 11 | (0.2) | 2 | (0.3) | ||||
| WM | 1590 | 1469 | (83.3) | 121 | (80.7) | 3266 | 2935 | (79.5) | 331 | (73.4) | 3905 | 3383 | (73.5) | 522 | (72.6) | ||||
| EM | 73 | 69 | (3.9) | 4 | (2.7) | 106 | 100 | (2.7) | 6 | (1.3) | 59 | 49 | (1.1) | 10 | (1.4) | ||||
Notes: A chi-square test was used to determine differences in presence of unmet medical needs according to general characteristics and age. Abbreviations: NHI, National Health Insurance; TM, Korean traditional medicine; WM, Western medicine; EM, Etc. medicine.
Table 3.
Regression analysis of the factors related to unmet medical needs.
| Variables | Odds Ratio (95% Confidence Interval) | ||||||||||||
|---|---|---|---|---|---|---|---|---|---|---|---|---|---|
| Model 1 | Model 2 | Model 3 | |||||||||||
| OR | p-Value | OR | p-Value | OR | p-Value | ||||||||
| Gender | Male | 1.00 | 1.00 | 1.00 | |||||||||
| Female | 1.13 | 1.00 | 1.28 | 0.059 | 1.18 | 1.04 | 1.34 | 0.011 | 1.09 | 0.96 | 1.25 | 0.185 | |
| Age (years) | 20–29 | 1.00 | 1.00 | 1.00 | |||||||||
| 30–39 | 1.93 | 1.35 | 2.75 | 0.000 | 1.90 | 1.32 | 2.71 | 0.000 | 1.72 | 1.19 | 2.47 | 0.004 | |
| 40–49 | 2.48 | 1.77 | 3.47 | 0.000 | 2.40 | 1.32 | 3.36 | 0.000 | 1.99 | 1.41 | 2.82 | 0.000 | |
| 50–59 | 2.43 | 1.72 | 3.42 | 0.000 | 2.42 | 1.32 | 3.42 | 0.000 | 1.76 | 1.23 | 2.52 | 0.002 | |
| 60–69 | 2.14 | 1.50 | 3.05 | 0.000 | 2.17 | 1.32 | 3.10 | 0.000 | 1.53 | 1.05 | 2.23 | 0.026 | |
| 70≦ | 2.51 | 1.78 | 3.56 | 0.000 | 2.28 | 1.32 | 3.28 | 0.000 | 1.43 | 0.97 | 2.10 | 0.067 | |
| Education | Graduate university graduate | 1.00 | 1.00 | 1.00 | |||||||||
| College or universitygraduate | 1.21 | 1.02 | 1.43 | 0.027 | 1.17 | 0.98 | 1.38 | 0.076 | 1.09 | 0.92 | 1.30 | 0.334 | |
| Middle and high school graduate | 1.51 | 1.24 | 1.85 | 0.000 | 1.39 | 1.13 | 1.71 | 0.002 | 1.09 | 0.88 | 1.35 | 0.424 | |
| Marital status | Married | 1.00 | 1.00 | 1.00 | |||||||||
| Unmarried | 1.63 | 1.42 | 1.86 | 0.000 | 1.52 | 1.33 | 1.75 | 0.000 | 1.42 | 1.23 | 1.63 | 0.000 | |
| Economic | Current worker | 1.00 | 1.00 | ||||||||||
| activity | Non-worker | 1.07 | 0.92 | 1.24 | 0.382 | 1.24 | 1.06 | 1.46 | 0.007 | ||||
| Monthly income (quintiles) | 5Q (highest) | 1.00 | 1.00 | ||||||||||
| 4Q | 1.19 | 0.93 | 1.51 | 0.162 | 1.19 | 0.93 | 1.51 | 0.171 | |||||
| 3Q | 1.42 | 1.12 | 1.79 | 0.003 | 1.43 | 1.13 | 1.81 | 0.003 | |||||
| 2Q | 1.18 | 0.93 | 1.50 | 0.172 | 1.11 | 0.87 | 1.42 | 0.408 | |||||
| 1Q (lowest) | 1.49 | 1.21 | 1.84 | 0.000 | 1.41 | 1.14 | 1.75 | 0.001 | |||||
| Medical insurance type | NHI | 1.00 | 1.00 | ||||||||||
| Medicaid | 1.43 | 1.13 | 1.82 | 0.003 | 1.48 | 1.22 | 1.78 | 0.000 | |||||
| Others | 1.12 | 0.94 | 1.34 | 0.206 | 1.11 | 0.87 | 1.43 | 0.404 | |||||
| Private insurance | Yes | 1.00 | 1.00 | ||||||||||
| No | 1.17 | 1.01 | 1.36 | 0.033 | 1.06 | 0.91 | 1.23 | 0.488 | |||||
| Non-covered treatment | No | 1.00 | 1.00 | ||||||||||
| Yes | 1.11 | 0.97 | 1.26 | 0.120 | 1.24 | 1.08 | 1.42 | 0.002 | |||||
| Chronic disease | No | 1.00 | |||||||||||
| Yes | 1.09 | 0.91 | 1.30 | 0.342 | |||||||||
| Disability | No | 1.00 | |||||||||||
| Yes | 0.99 | 0.80 | 1.22 | 0.932 | |||||||||
| Regular Exercise | Yes | 1.00 | |||||||||||
| No | 1.23 | 1.02 | 1.48 | 0.027 | |||||||||
| Pain | No | 1.00 | |||||||||||
| Yes | 2.29 | 1.97 | 2.66 | 0.000 | |||||||||
| Self-rated Health Status | Good | 1.00 | |||||||||||
| Moderate | 1.46 | 1.25 | 1.71 | 0.000 | |||||||||
| Bad | 2.29 | 1.89 | 2.79 | 0.000 | |||||||||
| Depression | Light | 1.00 | |||||||||||
| Moderate | 1.79 | 1.54 | 2.07 | 0.000 | |||||||||
| Severe | 2.46 | 1.39 | 4.35 | 0.002 | |||||||||
| AUC * | 0.600 | 0.612 | 0.700 | ||||||||||
Notes: A logistic regression analysis with a complex sampling design was performed after adjusting for covariates. OR, odds ratio; 95% CI, 95% confidence interval. Model 1 was adjusted for sex, age, and marital status. Model 2 was adjusted for the Model 1 variables + economic activity, monthly income, medical insurance type, private insurance and non-covered treatment. Model 3 was adjusted for the Model 2 variables + chronic disease, disability, regular exercise, pain, self-rated health status, and depression. * The AUC (area under the receiver operating characteristic curve) indicates the discrimination ability of the prediction model. Abbreviations: NHI, National Health Insurance; OR, Odds Ratio; 95% CI, 95% confidence interval.
Table 4.
Regression analysis of the factors that affect unmet medical needs according to age group.
| Variables | 19–39 Years Old | 40–59 Years Old | ≥60 Years Old | ||||||||||
|---|---|---|---|---|---|---|---|---|---|---|---|---|---|
| OR | p | OR | p | OR | p | ||||||||
| Gender | Male | 1.00 | 1.00 | 1.00 | |||||||||
| Female | 0.98 | 0.68 | 1.41 | 0.921 | 1.14 | 0.92 | 1.41 | 0.248 | 1.00 | 0.82 | 1.21 | 0.960 | |
| Education | Graduate university graduate | 1.00 | 1.00 | 1.00 | |||||||||
| College or university graduate | 0.56 | 0.07 | 4.68 | 0.590 | 1.00 | 0.70 | 1.43 | 0.991 | 1.31 | 0.91 | 1.88 | 0.142 | |
| Middle and high school graduate | 1.19 | 0.79 | 1.81 | 0.405 | 1.01 | 0.80 | 1.26 | 0.956 | 1.30 | 0.89 | 1.90 | 0.170 | |
| Marital status | Married | 1.00 | 1.00 | 1.00 | |||||||||
| Unmarried | 0.82 | 0.52 | 1.29 | 0.395 | 1.41 | 1.06 | 1.87 | 0.018 | 1.59 | 1.31 | 1.92 | 0.000 | |
| Economic activity | Current worker | 1.00 | 1.00 | 1.00 | |||||||||
| Non-worker | 1.97 | 1.15 | 3.35 | 0.013 | 1.37 | 0.99 | 1.90 | 0.057 | 1.12 | 0.91 | 1.37 | 0.283 | |
| Monthly income (quintiles) | 5Q (highest) | 1.00 | 1.00 | 1.00 | |||||||||
| 4Q | 1.91 | 1.03 | 3.54 | 0.039 | 1.05 | 0.75 | 1.45 | 0.789 | 1.14 | 0.71 | 1.82 | 0.599 | |
| 3Q | 3.83 | 2.12 | 6.91 | 0.000 | 1.05 | 0.74 | 1.48 | 0.800 | 1.30 | 0.84 | 2.01 | 0.246 | |
| 2Q | 2.32 | 1.14 | 4.71 | 0.020 | 1.03 | 0.70 | 1.51 | 0.897 | 1.07 | 0.70 | 1.62 | 0.767 | |
| 1Q (lowest) | 1.54 | 0.84 | 2.85 | 0.165 | 1.20 | 0.89 | 1.61 | 0.228 | 1.51 | 1.02 | 2.23 | 0.040 | |
| Medical insurance type | NHI | 1.00 | 1.00 | 1.00 | |||||||||
| Medicaid | 1.13 | 0.23 | 5.43 | 0.882 | 1.55 | 1.09 | 2.21 | 0.015 | 1.84 | 1.41 | 2.42 | 0.000 | |
| Others | 1.30 | 0.77 | 2.20 | 0.335 | 0.88 | 0.49 | 1.57 | 0.662 | 1.15 | 0.87 | 1.53 | 0.330 | |
| Private insurance | Yes | 1.00 | 1.00 | 1.00 | |||||||||
| No | 1.36 | 0.84 | 2.21 | 0.214 | 1.10 | 0.80 | 1.51 | 0.548 | 0.97 | 0.80 | 1.17 | 0.734 | |
| Non-covered treatment | No | 1.00 | 1.00 | 1.00 | |||||||||
| Yes | 1.22 | 0.83 | 1.80 | 0.312 | 1.19 | 0.95 | 1.50 | 0.123 | 1.31 | 1.08 | 1.58 | 0.006 | |
| Chronic disease | No | 1.00 | 1.00 | 1.00 | |||||||||
| Yes | 0.92 | 0.63 | 1.35 | 0.656 | 1.22 | 0.96 | 1.55 | 0.098 | 1.01 | 0.66 | 1.53 | 0.972 | |
| Disability | No | 1.00 | 1.00 | 1.00 | |||||||||
| Yes | 0.54 | 0.14 | 2.02 | 0.360 | 1.62 | 1.04 | 2.55 | 0.035 | 0.89 | 0.70 | 1.14 | 0.361 | |
| Regular exercise | Yes | 1.00 | 1.00 | 1.00 | |||||||||
| No | 0.90 | 0.22 | 3.79 | 0.887 | 1.68 | 1.02 | 2.77 | 0.041 | 1.21 | 0.98 | 1.49 | 0.074 | |
| Pain | No | 1.00 | 1.00 | 1.00 | |||||||||
| Yes | 1.43 | 0.80 | 2.53 | 0.226 | 2.82 | 2.22 | 3.59 | 0.000 | 2.14 | 1.73 | 2.64 | 0.000 | |
| Self-rated health status | Good | 1.00 | 1.00 | 1.00 | |||||||||
| Moderate | 1.52 | 1.04 | 2.23 | 0.033 | 1.46 | 1.15 | 1.85 | 0.002 | 1.47 | 1.15 | 1.90 | 0.002 | |
| Bad | 2.43 | 1.32 | 4.48 | 0.004 | 2.23 | 1.57 | 3.16 | 0.000 | 2.34 | 1.77 | 3.08 | 0.000 | |
| Depression | Light | 1.00 | 1.00 | 1.00 | |||||||||
| Moderate | 2.26 | 1.31 | 3.91 | 0.003 | 1.43 | 1.08 | 1.89 | 0.013 | 1.97 | 1.63 | 2.39 | 0.000 | |
| Severe | 1.62 | 0.18 | 14.73 | 0.667 | 1.22 | 0.31 | 4.86 | 0.779 | 3.68 | 1.87 | 7.21 | 0.000 | |
Notes: A logistic regression analysis with a complex sampling design was performed, adjusting for all covariates. Abbreviations: NHI, National Health Insurance; OR, odds ratio; 95% CI, 95% confidence interval.
Table 5.
Association between non-covered treatment and unmet medical needs according to sex, age, and medical type.
Table 5.
Association between non-covered treatment and unmet medical needs according to sex, age, and medical type.
| Class | Category | Model 1 | Model 2 | Model 3 | |||||||||||
|---|---|---|---|---|---|---|---|---|---|---|---|---|---|---|---|
| OR | 95% CI | p | OR | 95% CI | p | OR | 95% CI | p | |||||||
| Sex | Male | Non-covered treatment | Yes | 1.37 | 1.13 | 1.66 | 0.002 | 1.30 | 1.06 | 1.59 | 0.011 | 1.47 | 1.19 | 1.82 | 0.000 |
| No | 1.00 | 1.00 | 1.00 | ||||||||||||
| Female | Non-covered treatment | Yes | 1.00 | 0.85 | 1.18 | 0.969 | 0.99 | 0.83 | 1.18 | 0.915 | 1.11 | 0.93 | 1.33 | 0.244 | |
| No | 1.00 | 1.00 | 1.00 | ||||||||||||
| Age | 19–39 | Non-covered treatment | Yes | 1.05 | 0.75 | 1.48 | 0.768 | 1.15 | 0.79 | 1.67 | 0.481 | 1.22 | 0.83 | 1.80 | 0.312 |
| No | 1.00 | 1.00 | 1.00 | ||||||||||||
| 40–59 | Non-covered treatment | Yes | 1.07 | 0.88 | 1.32 | 0.499 | 1.08 | 0.87 | 1.34 | 0.512 | 1.19 | 0.95 | 1.50 | 0.123 | |
| No | 1.00 | 1.00 | 1.00 | ||||||||||||
| 60≦ | Non-covered treatment | Yes | 1.23 | 1.03 | 1.47 | 0.020 | 1.15 | 0.96 | 1.38 | 0.041 | 1.31 | 1.08 | 1.58 | 0.006 | |
| No | 1.00 | 1.00 | 1.00 | ||||||||||||
| Type of medical | TM | Non-covered treatment | Yes | 0.91 | 0.68 | 1.22 | 0.554 | 0.83 | 0.61 | 1.14 | 0.261 | 0.9 | 0.65 | 1.23 | 0.517 |
| No | 1.00 | 1.00 | 1.00 | ||||||||||||
| WM | Non-covered treatment | Yes | 1.22 | 1.06 | 1.40 | 0.004 | 1.19 | 1.02 | 1.37 | 0.019 | 1.33 | 1.15 | 1.55 | 0.000 | |
| No | 1.00 | 1.00 | 1.00 | ||||||||||||
Notes: Logistic regression analysis with complex sampling design was performed by adjusting for covariates. Odds ratios indicates odds ratio; 95% CI, 95% confidence interval. Model 1 was adjusted for sex, age, and marital status. Model 2 was adjusted by Model 1 variables + economic activity, monthly income, medical insurance type, private insurance, and non-covered treatment. Model 3 was adjusted by Model 2 variables + chronic disease, disability, regular exercise, pain, self-rated health status, and depression. Abbreviations: TM, Korean traditional medicine; WM, Western medicine; OR, odds ratio; 95% CI, 95% confidence interval.
© 2019 by the authors. Licensee MDPI, Basel, Switzerland. This article is an open access article distributed under the terms and conditions of the Creative Commons Attribution (CC BY) license (http://creativecommons.org/licenses/by/4.0/).
Share and Cite
MDPI and ACS Style
Yoon, Y.S.; Jung, B.; Kim, D.; Ha, I.-H. Factors Underlying Unmet Medical Needs: A Cross-Sectional Study. Int. J. Environ. Res. Public Health 2019, 16, 2391. https://doi.org/10.3390/ijerph16132391
AMA Style
Yoon YS, Jung B, Kim D, Ha I-H. Factors Underlying Unmet Medical Needs: A Cross-Sectional Study. International Journal of Environmental Research and Public Health. 2019; 16(13):2391. https://doi.org/10.3390/ijerph16132391
Chicago/Turabian StyleYoon, Young Suk, Boyoung Jung, Dongsu Kim, and In-Hyuk Ha. 2019. "Factors Underlying Unmet Medical Needs: A Cross-Sectional Study" International Journal of Environmental Research and Public Health 16, no. 13: 2391. https://doi.org/10.3390/ijerph16132391
Note that from the first issue of 2016, this journal uses article numbers instead of page numbers. See further details here.