Health Benefits of Physical Activity Related to an Urban Riverside Regeneration

 , , , , and
Abstract
:1. Introduction
2. Methods
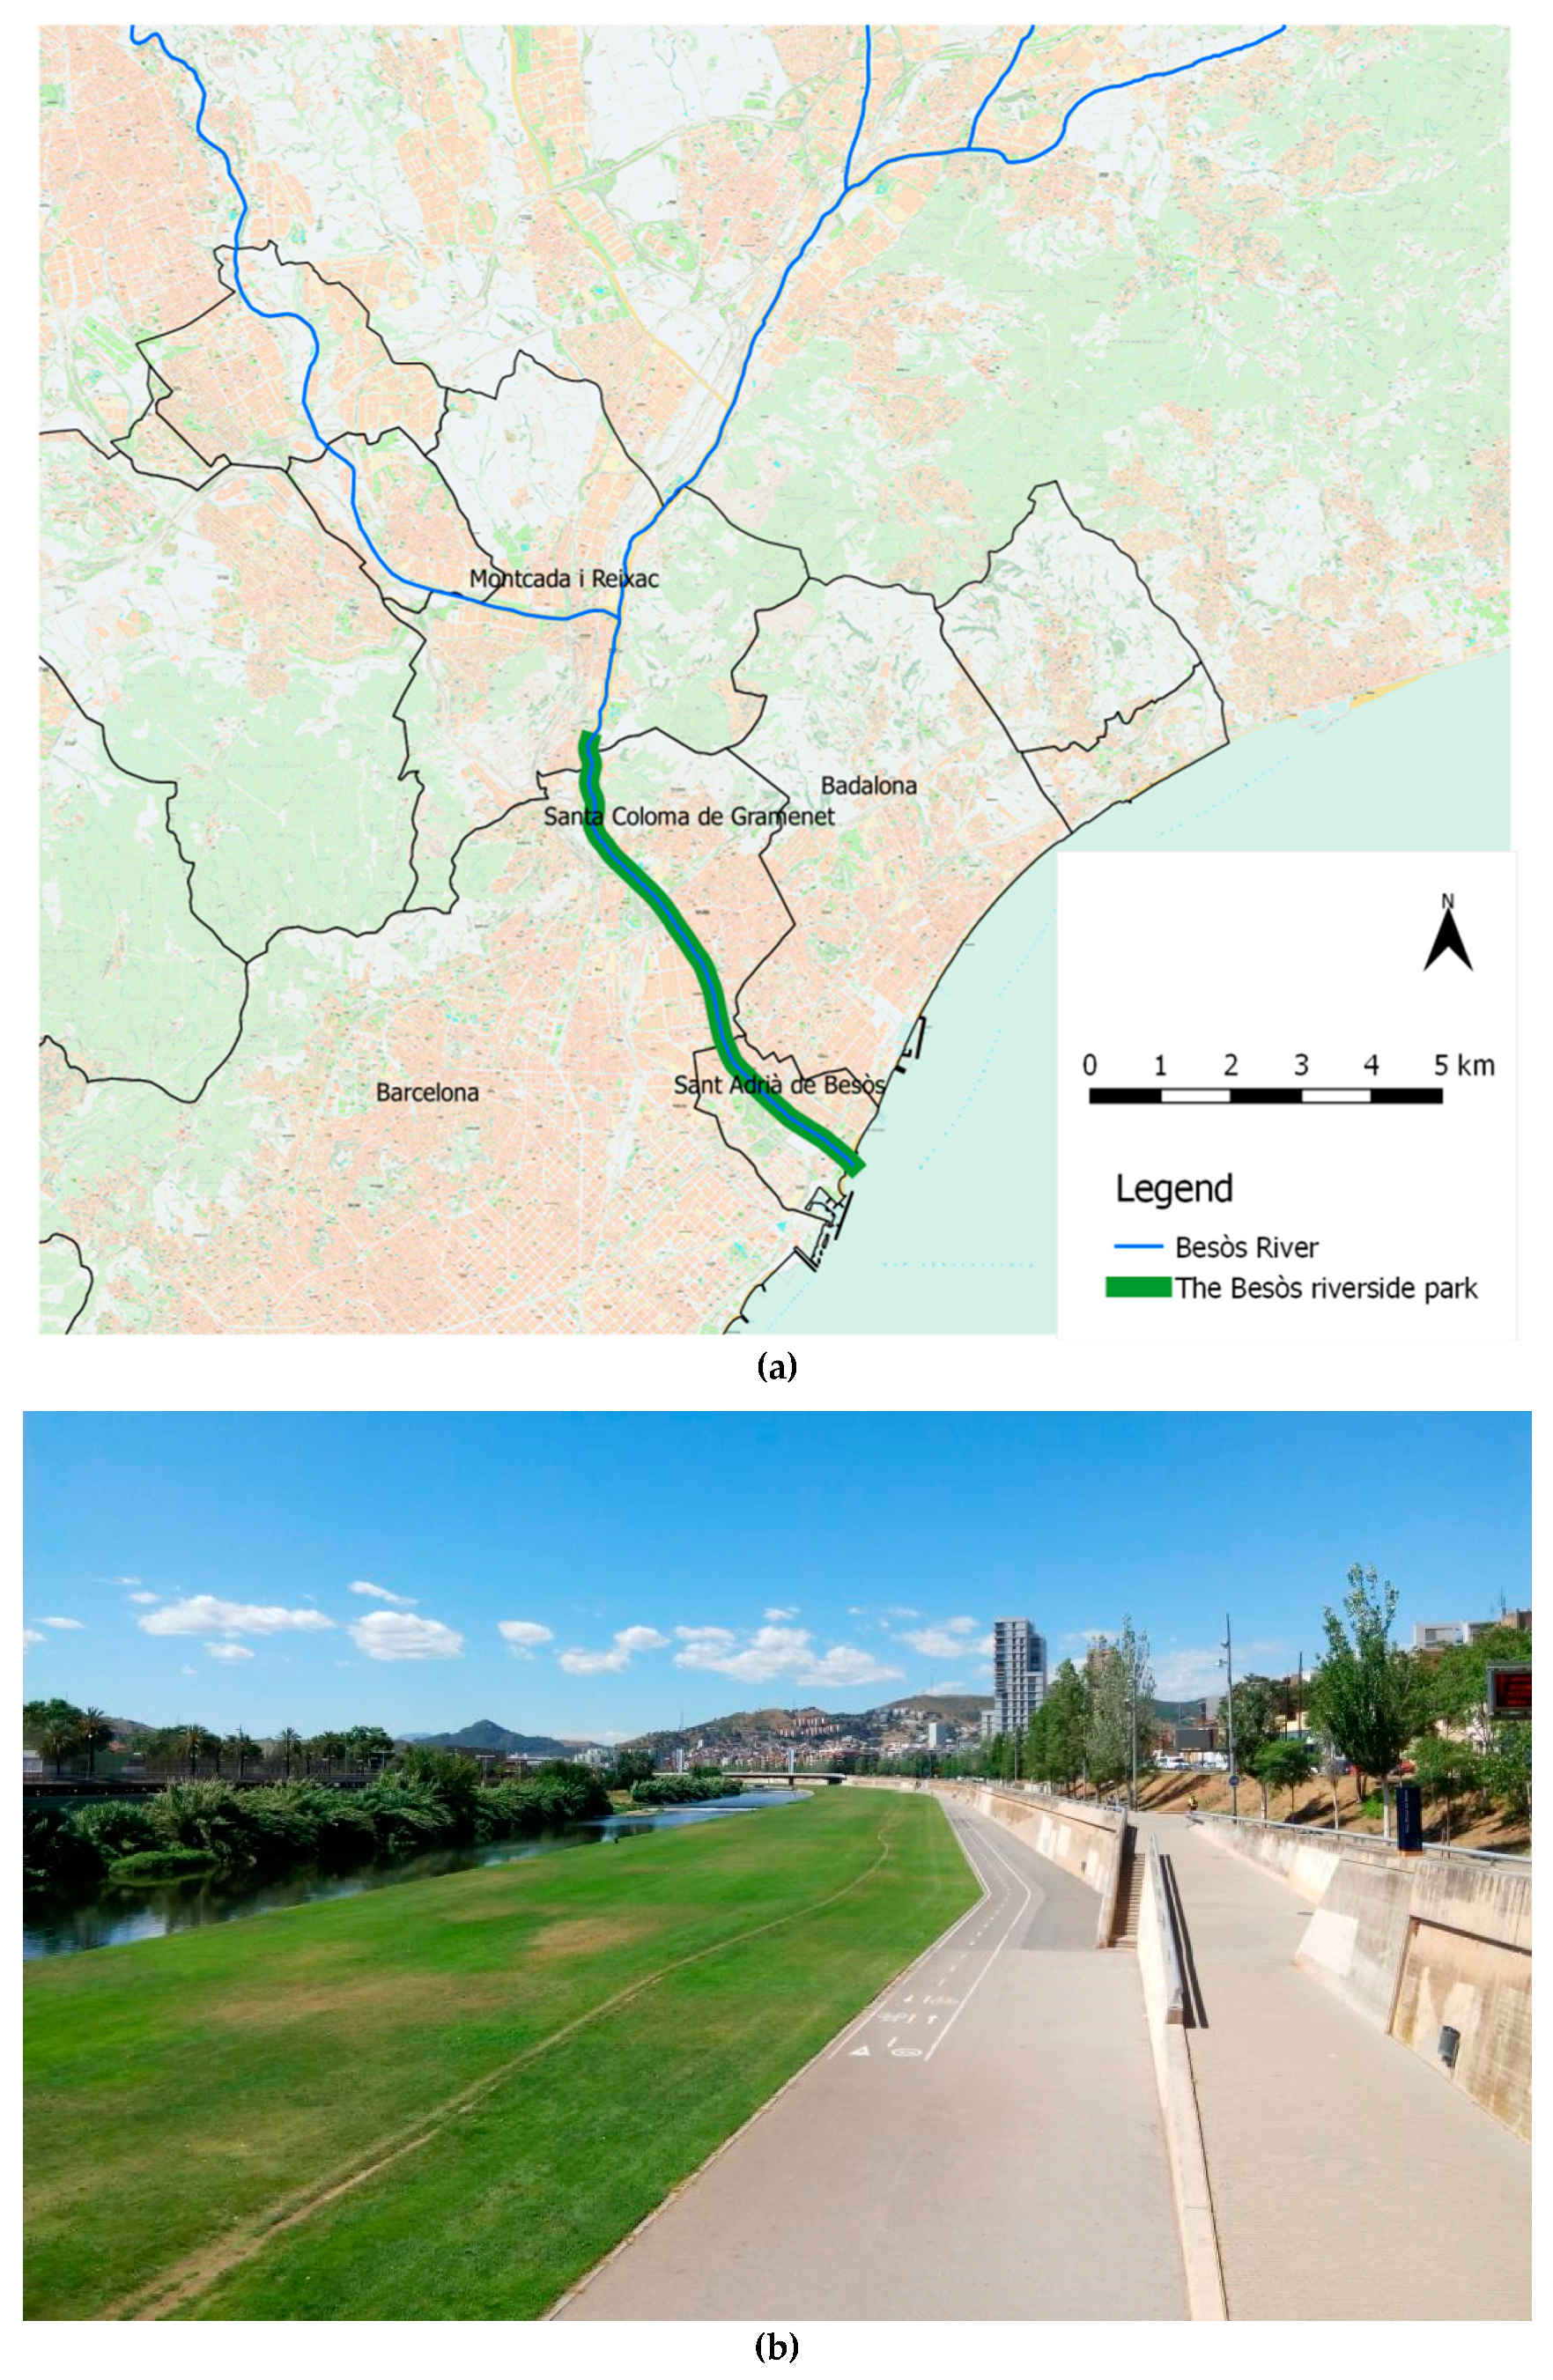
2.1. Input Data
2.2. Study Design and the “Blue Active Tool”
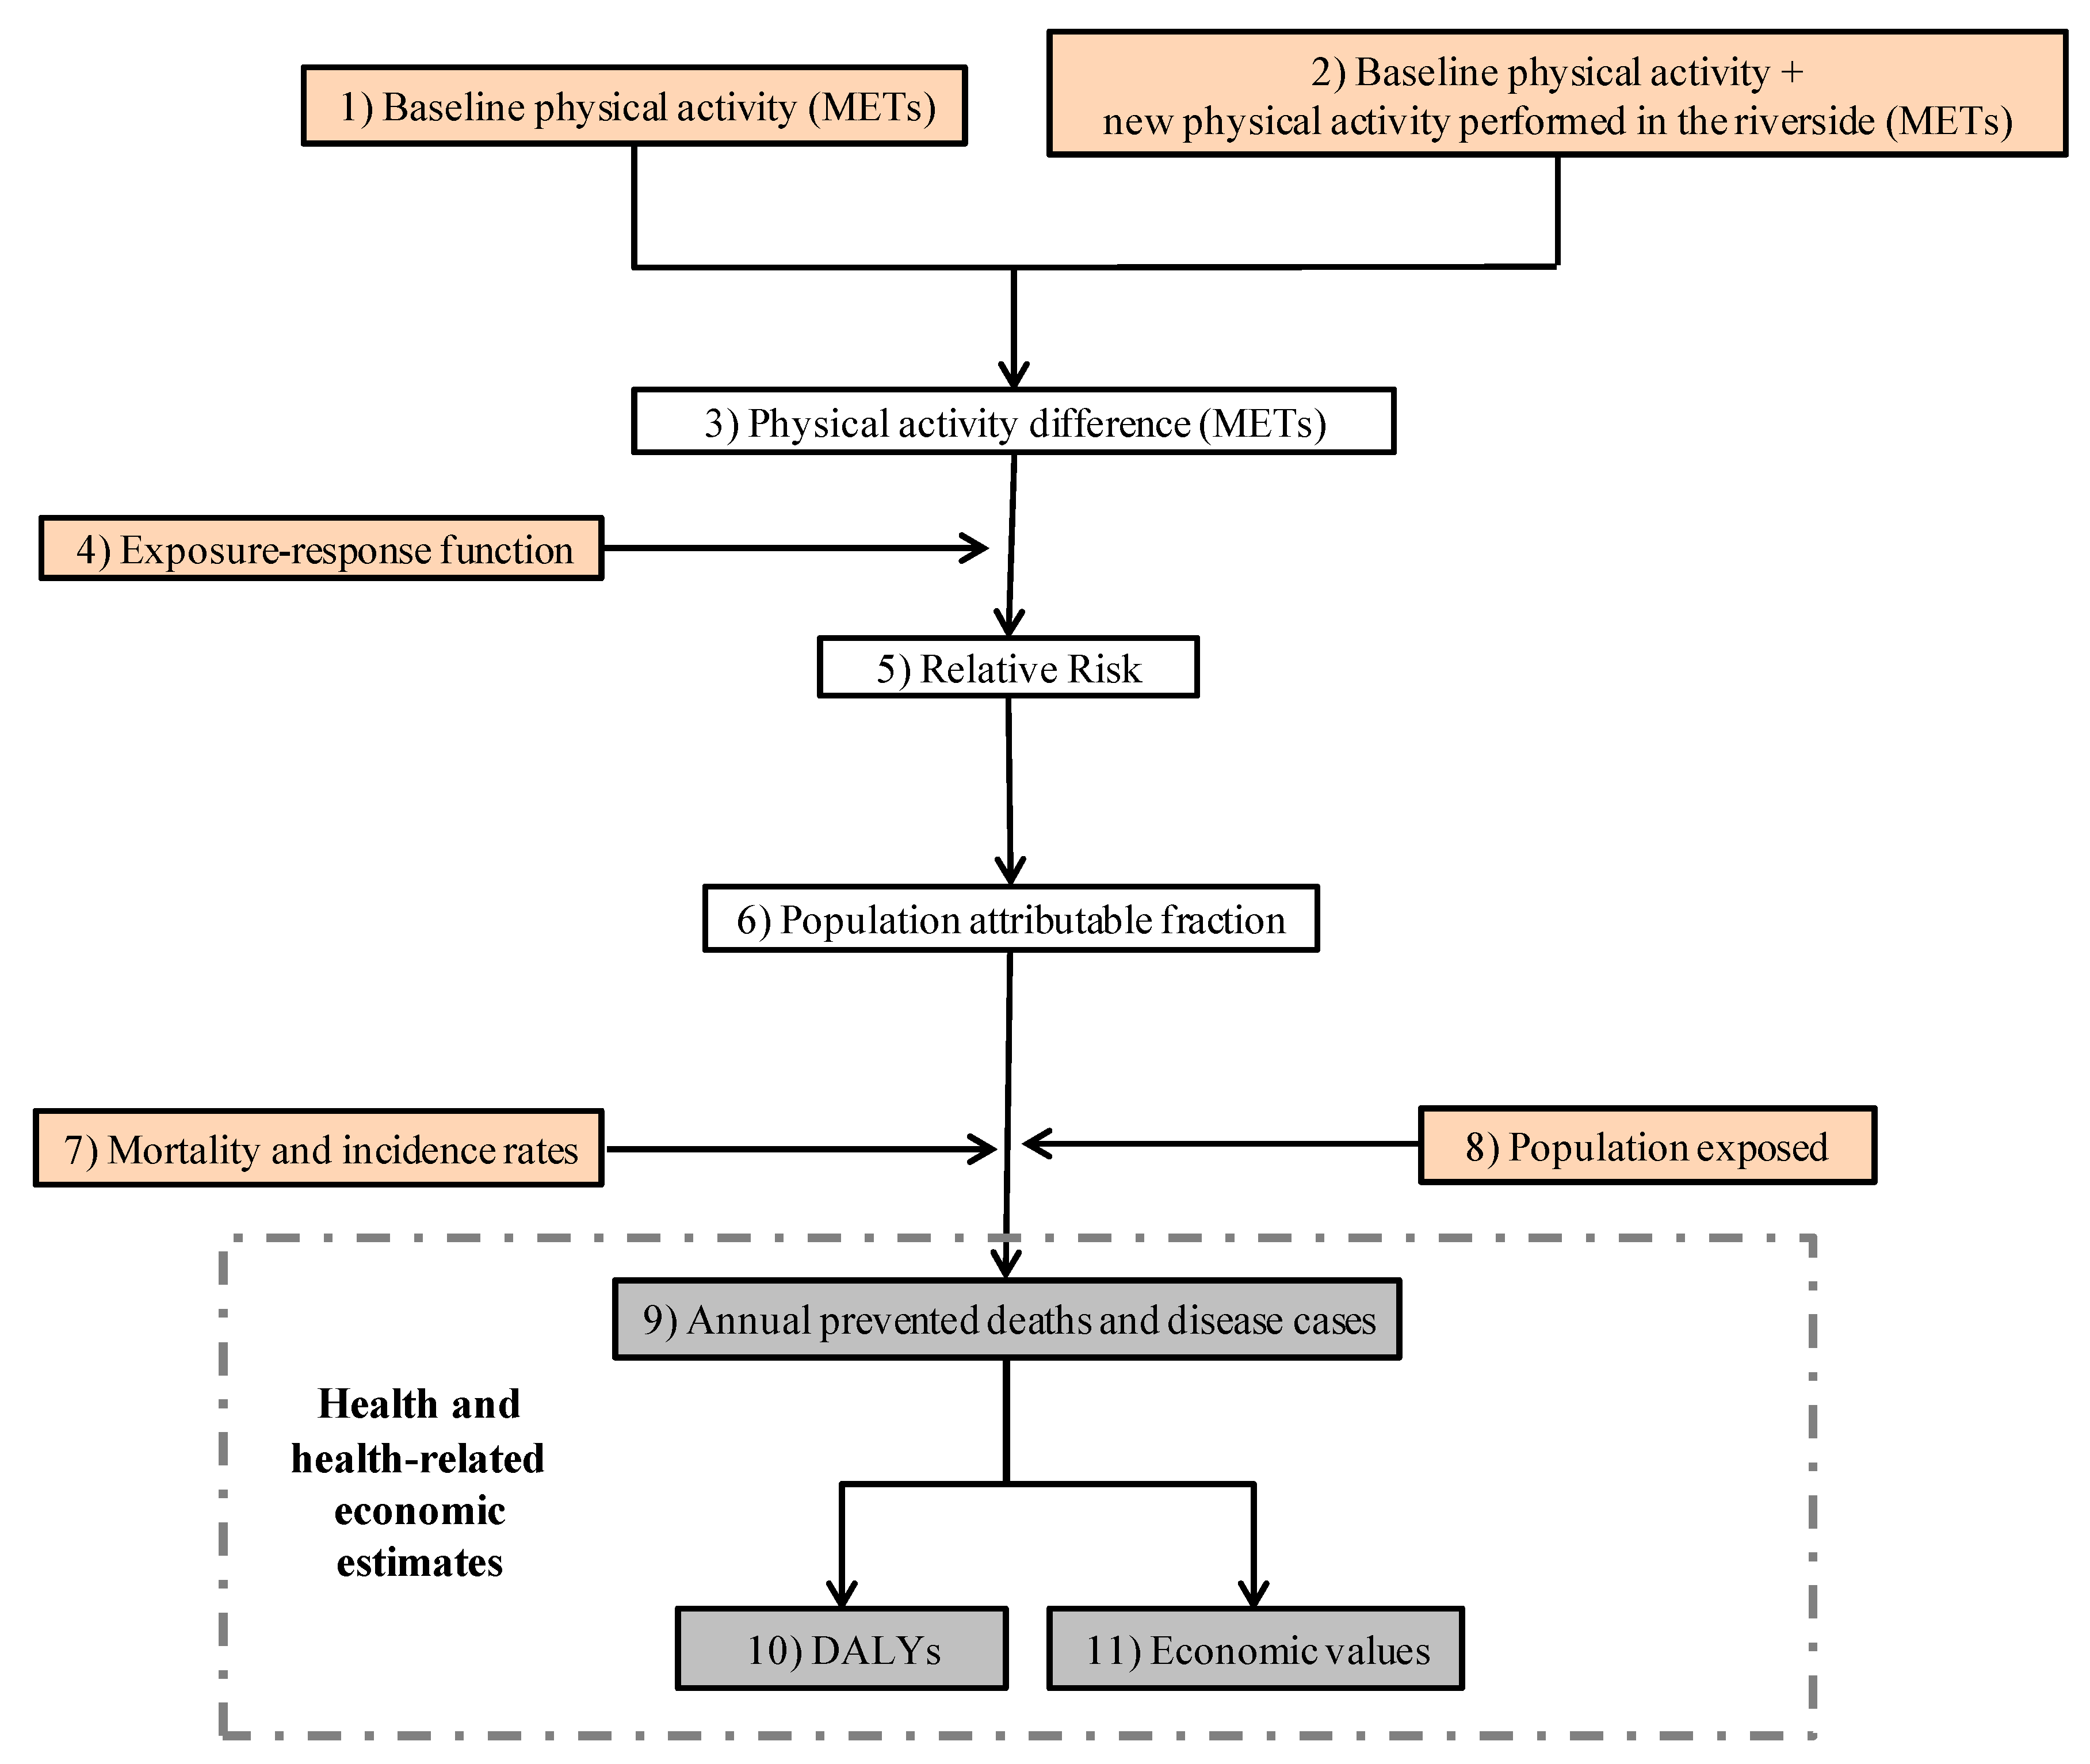
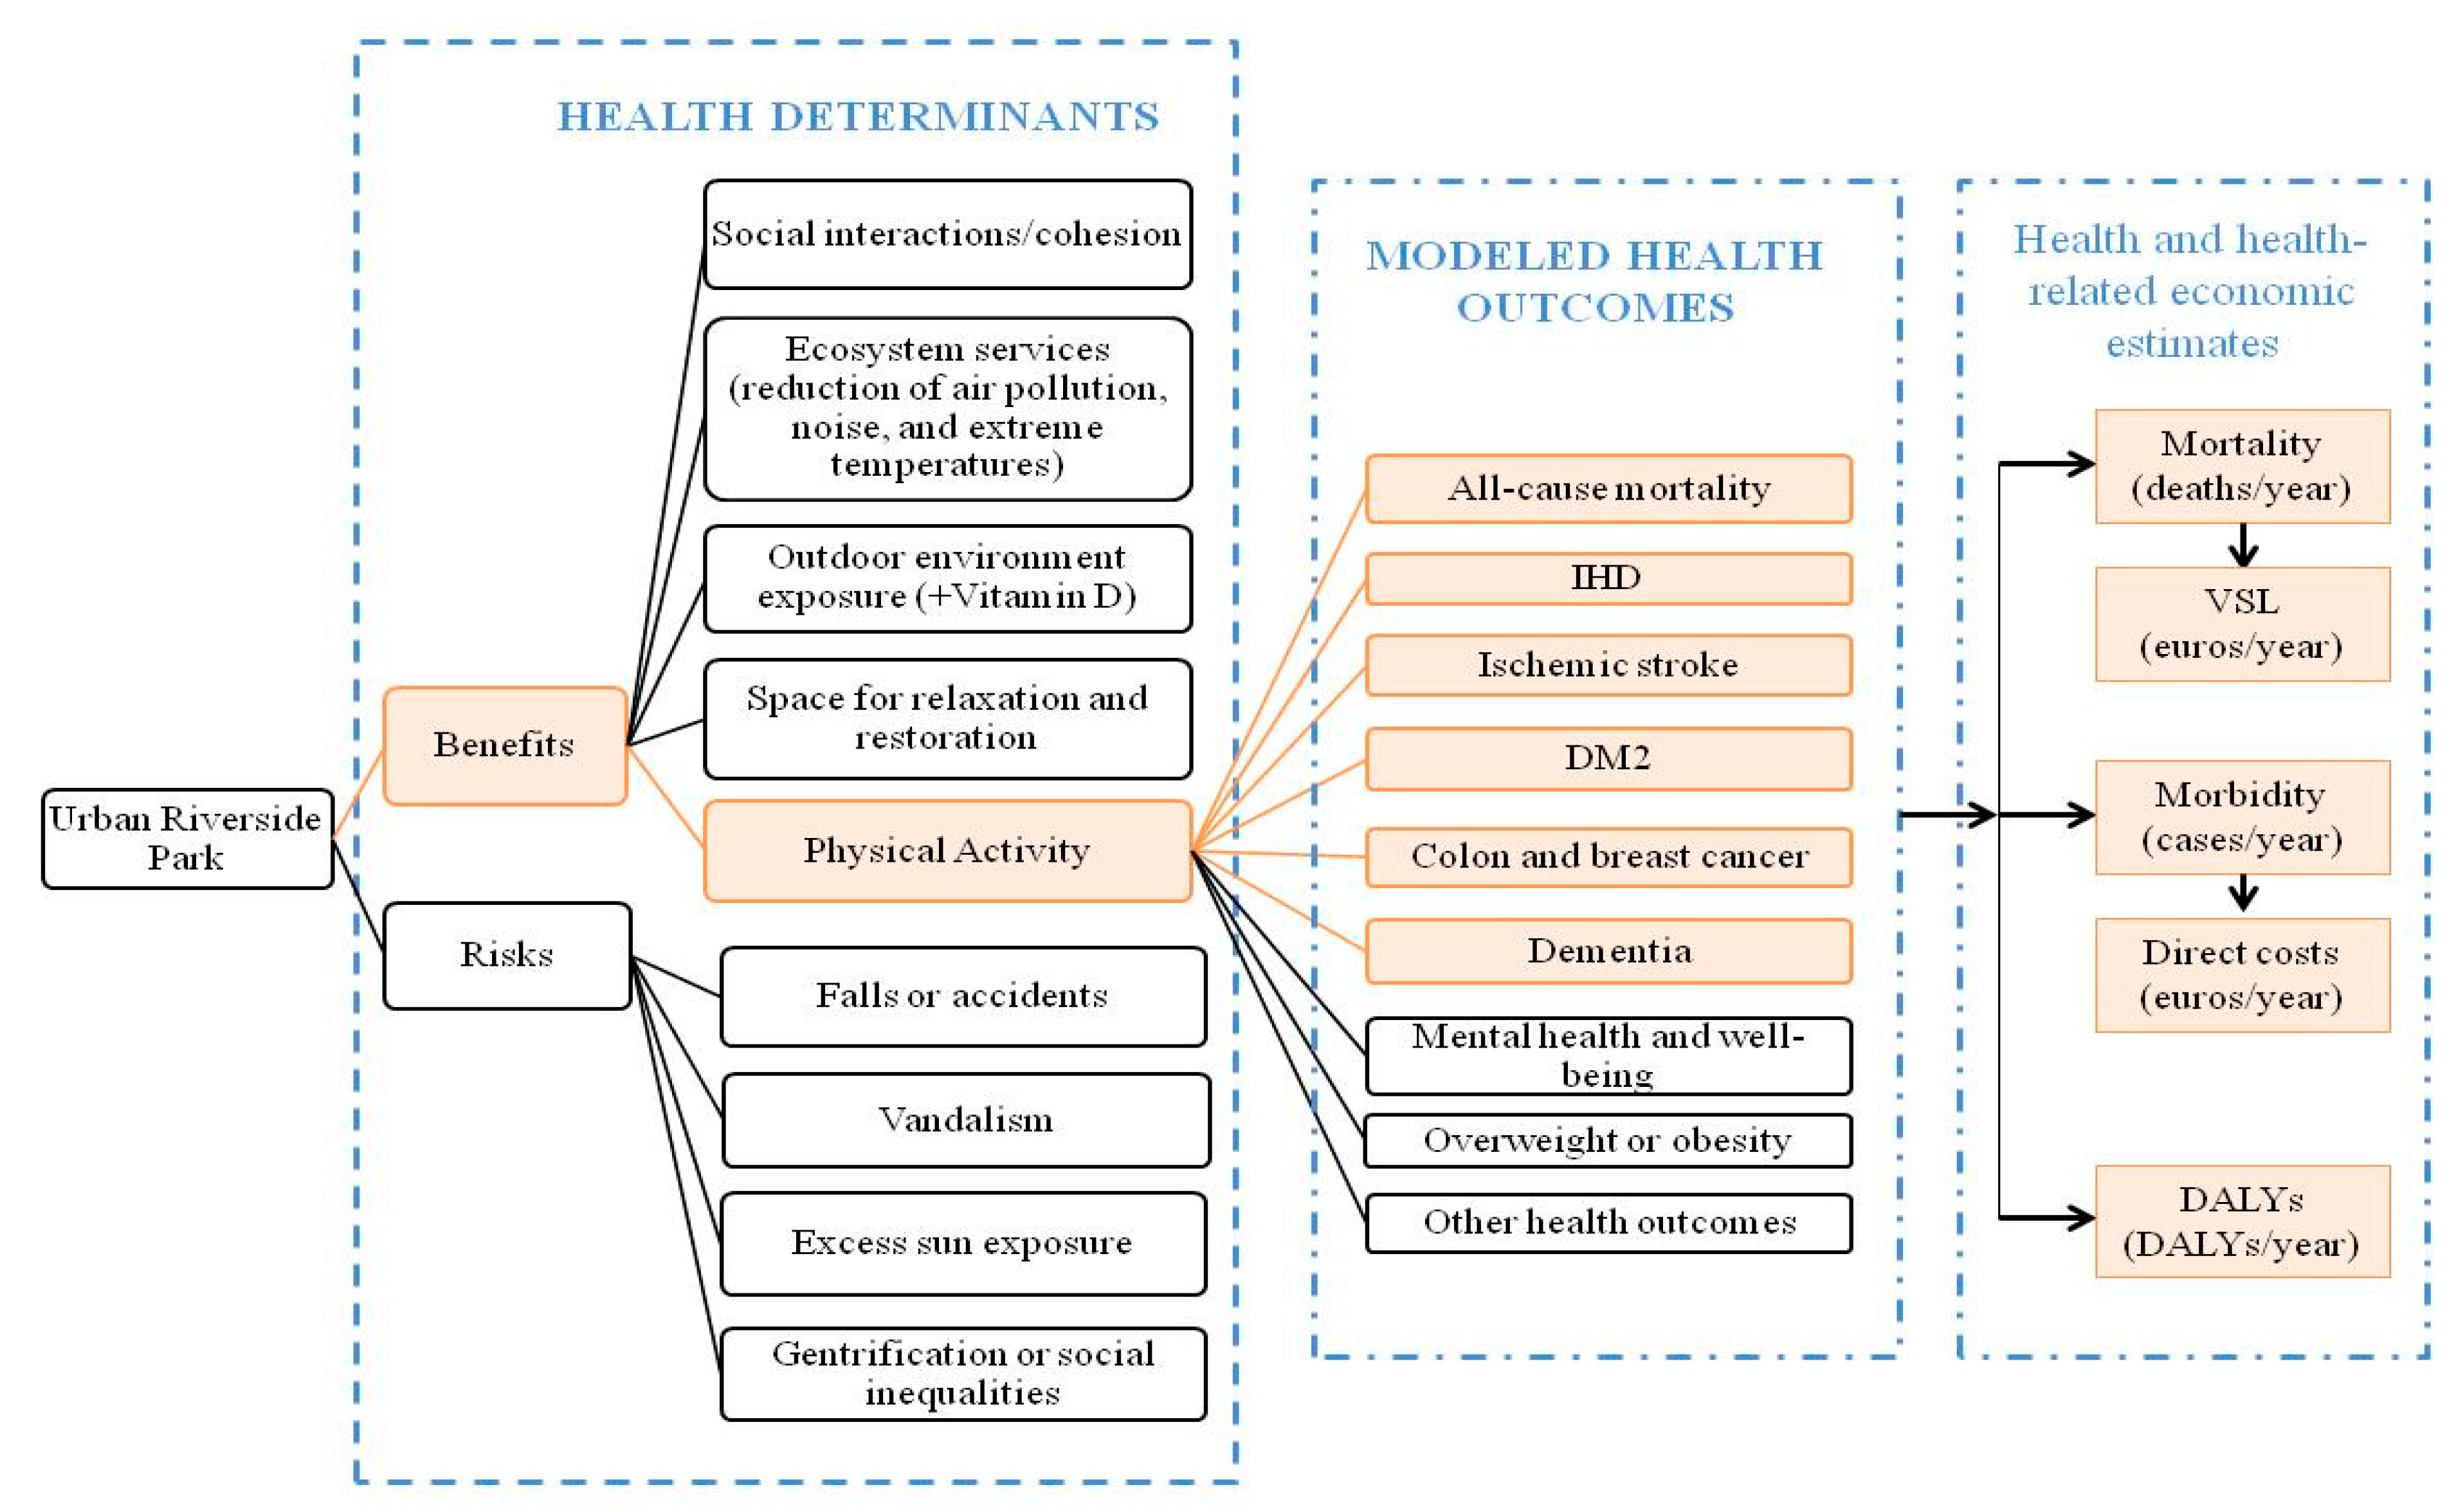
2.2.1. The “Blue Active Tool”: Physical Activity and Health Outcomes Modelling
2.2.2. The “Blue Active Tool”: Health Economic Assessment
3. Results
3.1. Characteristics of the Study Population
3.2. Health and Health-Related Economic Impacts
3.3. Sensitivity Analysis
4. Discussion
4.1. Principal Findings
4.2. Strengths and Limitations
4.3. Implications and Recommendations
5. Conclusions
Supplementary Materials
Author Contributions
Funding
Acknowledgments
Conflicts of Interest
References
- WHO Regional Office for Europe. Urban Green Space and Health: Intervention Impacts and Effectiveness; Meeting Report; WHO Regional Office for Europe: Bonn, Germany, 20–21 September 2016. [Google Scholar]
- De Vries, S.; Verheij, R.A.; Groenewegen, P.P.; Spreeuwenberg, P. Natural environments—Healthy environments? An exploratory analysis of the relationship between greenspace and health. Environ. Plan. A 2003, 35, 1717–1731. [Google Scholar] [CrossRef]
- Triguero-Mas, M.; Dadvand, P.; Cirach, M.; Martínez, D.; Medina, A.; Mompart, A.; Basagaña, X.; Gražulevičiene, R.; Nieuwenhuijsen, M.J. Natural outdoor environments and mental and physical health: Relationships and mechanisms. Environ. Int. 2015, 77, 35–41. [Google Scholar] [CrossRef] [PubMed]
- Pun, V.C.; Manjourides, J.; Suh, H.H. Association of neighborhood greenness with self-perceived stress, depression and anxiety symptoms in older U.S. adults. Environ. Health 2018, 17, 1–11. [Google Scholar] [CrossRef] [PubMed]
- De Keijzer, C.; Tonne, C.; Basagaña, X.; Valentín, A.; Singh-Manoux, A.; Alonso, J.; Antó, J.M.; Nieuwenhuijsen, M.J.; Sunyer, J.; Dadvand, P. Residential surrounding greenness and cognitive decline: A 10-year follow-up of the Whitehall II cohort. Environ. Health Perspect. 2018, 126, 077003. [Google Scholar] [CrossRef] [PubMed]
- Crouse, D.L.; Pinault, L.; Balram, A.; Hystad, P.; Peters, P.A.; Chen, H.; van Donkelaar, A.; Martin, R.V.; Ménard, R.; Robichaud, A.; et al. Urban greenness and mortality in Canada’s largest cities: A national cohort study. Lancet Planet. Health 2017, 1, e289–e297. [Google Scholar] [CrossRef]
- Gascon, M.; Triguero-Mas, M.; Martínez, D.; Dadvand, P.; Rojas-Rueda, D.; Plasència, A.; Nieuwenhuijsen, M.J. Residential green spaces and mortality: A systematic review. Environ. Int. 2016, 86, 60–67. [Google Scholar] [CrossRef] [PubMed]
- Coldwell, D.F.; Evans, K.L. Visits to urban green-space and the countryside associate with different components of mental well-being and are better predictors than perceived or actual local urbanisation intensity. Landsc. Urban Plan. 2018, 175, 114–122. [Google Scholar] [CrossRef]
- Van den Berg, M.; Van Poppel, M.; Van Kamp, I.; Andrusaityte, S.; Balseviciene, B.; Cirach, M.; Danileviciute, A.; Ellis, N.; Hurst, G.; Masterson, D.; et al. Visiting green space is associated with mental health and vitality: A cross-sectional study in four european cities. Health Place 2016, 38, 8–15. [Google Scholar] [CrossRef]
- White, M.P.; Pahl, S.; Wheeler, B.W.; Depledge, M.H.; Fleming, L.E. Natural environments and subjective wellbeing: Different types of exposure are associated with different aspects of wellbeing. Health Place 2017, 45, 77–84. [Google Scholar] [CrossRef]
- Fong, K.C.; Hart, J.E.; James, P. A Review of Epidemiologic Studies on Greenness and Health: Updated Literature Through 2017. Curr. Environ. Health Reports 2018, 5, 77–87. [Google Scholar] [CrossRef]
- Grellier, J.; White, M.P.; Albin, M.; Bell, S.; Elliott, L.R.; Gascón, M.; Gualdi, S.; Mancini, L.; Nieuwenhuijsen, M.J.; Sarigiannis, D.A.; et al. BlueHealth: A study programme protocol for mapping and quantifying the potential benefits to public health and well-being from Europe’s blue spaces. BMJ Open 2017, 7, e016188. [Google Scholar] [CrossRef] [PubMed]
- Gascon, M.; Zijlema, W.; Vert, C.; White, M.P.; Nieuwenhuijsen, M.J. Outdoor blue spaces, human health and well-being: A systematic review of quantitative studies. Int. J. Hyg. Environ. Health 2017, 220, 1207–1221. [Google Scholar] [CrossRef] [PubMed]
- Bauman, A.; Smith, B.; Stoker, L.; Bellew, B.; Booth, M. Geographical influeneces upon physical activity participation: Evidence of a “coastal effect”. Aust. N. Z. J. Public Health 1999, 23, 322–324. [Google Scholar] [CrossRef]
- Edwards, N.; Giles-Corti, B.; Larson, A.; Beesley, B. The effect of proximity on park and beach use and physical activity among rural adolescents. J. Phys. Act. Health 2014, 11, 977–984. [Google Scholar]
- White, M.P.; Wheeler, B.W.; Herbert, S.; Alcock, I.; Depledge, M.H. Coastal proximity and physical activity: Is the coast an under-appreciated public health resource? Prev. Med. 2014, 69, 135–140. [Google Scholar] [CrossRef] [PubMed]
- National Institute for Health and Clinical Excellence. Walking and Cycling: Local Measures to Promote Walking and Cycling as Forms of Traffic or Recreation; National Institute for Health and Clinical Excellence: Manchester, UK, 2012. [Google Scholar]
- Mitchell, R. Is physical activity in natural environments better for mental health than physical activity in other environments? Soc. Sci. Med. 2013, 91, 130–134. [Google Scholar] [CrossRef]
- Pasanen, T.P.; Tyrväinen, L.; Korpela, K.M. The relationship between perceived health and physical activity indoors, outdoors in built environments, and outdoors in nature. Appl. Psychol. Health Well-Being 2014, 6, 324–346. [Google Scholar] [CrossRef]
- White, M.P.; Elliott, L.R.; Taylor, T.; Wheeler, B.W.; Spencer, A.; Bone, A.; Depledge, M.H.; Fleming, L.E. Recreational physical activity in natural environments and implications for health: A population based cross-sectional study in England. Prev. Med. 2016, 91, 383–388. [Google Scholar] [CrossRef]
- WHO Regional Office for Europe: Copenhagen. Urban Green Spaces and Health; WHO Regional Office for Europe: Copenhagen, Denmark, 2016. [Google Scholar]
- Physical Activity Guidelines Advisory Committee. Physical Activity Guidelines Advisory Committee Report; Department of Health and Human Services: Washington, DC, USA, 2008; Volume 67.
- United Nations, Department of Economic and Social Affairs, Population Division. The World’s Cities in 2016—Data Booklet (ST/ESA/SER.A/392); United Nations: New York, NY, USA, 2016. [Google Scholar]
- Nieuwenhuijsen, M.J.; Khreis, H.; Triguero-Mas, M.; Gascon, M.; Dadvand, P. Fifty Shades of Green. Epidemiology 2017, 28, 63–71. [Google Scholar] [CrossRef]
- Hartig, T.; Kahn, P.H., Jr. Living in cities naturally. Science 2016, 352, 938–940. [Google Scholar] [CrossRef]
- Chokshi, D.A.; Farley, T.A. The Cost-Effectiveness of Environmental Approaches to Disease Prevention. N. Engl. J. Med. 2012, 367, 292–295. [Google Scholar] [CrossRef] [PubMed]
- Nieuwenhuijsen, M.J. Urban and transport planning, environmental exposures and health-new concepts, methods and tools to improve health in cities. Environ. Health 2016, 15, 38. [Google Scholar] [CrossRef] [PubMed]
- Sarkar, C.; Webster, C. Urban environments and human health: Current trends and future directions. Curr. Opin. Environ. Sustain. 2017, 25, 33–44. [Google Scholar] [CrossRef]
- Gascon, M.; Triguero-Mas, M.; Martínez, D.; Dadvand, P.; Forns, J.; Plasència, A.; Nieuwenhuijsen, M.J. Mental health benefits of long-term exposure to residential green and blue spaces: A systematic review. Int. J. Environ. Res. Public Health 2015, 12, 4354–4379. [Google Scholar] [CrossRef] [PubMed]
- Rydin, Y.; Bleahu, A.; Davies, M.; Davila, J.D.; Friel, S.; di Grandis, G.; Groce, N.; Hallal, P.C.; Hamilton, I.G.; Howden-Chapman, P.; et al. Shaping Cities for Health: The complexities of planning urban environments in the 21st century. Lancet 2012, 379, 2079–2108. [Google Scholar] [CrossRef]
- Droomers, M.; Jongeneel-Grimen, B.; Bruggink, J.W.; Kunst, A.; Stronks, K. Is it better to invest in place or people to maximize population health? Evaluation of the general health impact of urban regeneration in Dutch deprived neighbourhoods. Health Place 2016, 41, 50–57. [Google Scholar] [CrossRef] [PubMed]
- Egan, M.; Lawson, L.; Kearns, A.; Conway, E.; Neary, J. Neighbourhood demolition, relocation and health. A qualitative longitudinal study of housing-led urban regeneration in Glasgow, UK. Health Place 2015, 33, 101–108. [Google Scholar] [CrossRef]
- Serrano, E.; Larranaga, I.; Morteruel, M.; Baixas de Ros, M.D.; Basterrechea, M.; Martinez, D.; Aldasoro, E.; Bacigalupe, A. Urban regeneration as population health intervention: A health impact assessment in the Bay of Pasaia (Spain). Int. J. Equity Health 2016, 15, 145. [Google Scholar] [CrossRef]
- Venegas-Sánchez, J.; Rivadeneyra-Sicilia, A.; Bolívar-Muñoz, J.; López-Fernández, L.A.; Martín-Olmedo, P.; Fernández-Ajuria, A.; Daponte-Codina, A.; Artundo-Purroy, C.; Ruiz-Fernández, J. Evaluación del impacto en la salud del proyecto de reurbanización de la calle San Fernando en Alcalá de Guadaíra (Sevilla). Gac Sanit 2013, 27, 233–240. [Google Scholar] [CrossRef]
- Ruijsbroek, A.; Wong, A.; Kunst, A.E.; Van Den Brink, C.; Van Oers, H.A.M.; Droomers, M.; Stronks, K. The impact of urban regeneration programmes on health and health-related behaviour: Evaluation of the Dutch District Approach 6.5 years from the start. PLoS ONE 2017, 12, e0177262. [Google Scholar] [CrossRef]
- Mohan, G.; Longo, A.; Kee, F. Evaluation of the health impact of an urban regeneration policy: Neighbourhood Renewal in Northern Ireland. J. Epidemiol. Community Health 2017, 71, 919–927. [Google Scholar] [CrossRef]
- Branas, C.C.; Cheney, R.A.; MacDonald, J.M.; Tam, V.W.; Jackson, T.D.; Ten Havey, T.R. A difference-in-differences analysis of health, safety, and greening vacant urban space. Am. J. Epidemiol. 2011, 174, 1296–1306. [Google Scholar] [CrossRef]
- Idescat Web de l’estadística Oficial de Catalunya. Available online: https://www.idescat.cat (accessed on 12 March 2018).
- Diputació de Barcelona, Parcs de Catalunya, Xarxa de Parcs Naturals; Parc Fluvial del Besòs. Available online: https://parcs.diba.cat/web/fluvial/el-parc-fluvial (accessed on 25 January 2019).
- QGIS Development Team (2016). QGIS Geographic Information System. Open Source Geospatial Foundation Project. Available online: http://qgis.org (accessed on 25 January 2019).
- Consorci Besòs. Estudi de caracterització de l’ usuari del Parc Fluvial del Besòs; Consorci Besòs: Sant Adrià de Besòs, Spain, 2015. [Google Scholar]
- Hamer, M.; Chida, Y. Physical activity and risk of neurodegenerative disease: A systematic review of prospective evidence. Psychol. Med. 2009, 39, 3–11. [Google Scholar] [CrossRef] [PubMed]
- Kyu, H.H.; Bachman, V.F.; Alexander, L.T.; Mumford, J.E.; Afshin, A.; Estep, K.; Veerman, J.L.; Delwiche, K.; Iannarone, M.L.; Moyer, M.L.; et al. Physical activity and risk of breast cancer, colon cancer, diabetes, ischemic heart disease, and ischemic stroke events: Systematic review and dose-response meta-analysis for the Global Burden of Disease Study 2013. BMJ 2016, 354, i3857. [Google Scholar] [CrossRef]
- Woodcock, J.; Franco, O.H.; Orsini, N.; Roberts, I. Non-vigorous physical activity and all-cause mortality: Systematic review and meta-analysis of cohort studies. Int. J. Epidemiol. 2011, 40, 121–138. [Google Scholar] [CrossRef]
- Ainsworth, B.E.; Haskell, W.L.; Herrmann, S.D.; Meckes, N.; Bassett, D.R.; Tudor-Locke, C.; Greer, J.L.; Vezina, J.; Whitt-Glover, M.C.; Leon, A.S. 2011 compendium of physical activities: A second update of codes and MET values. Med. Sci. Sports Exerc. 2011, 43, 1575–1581. [Google Scholar] [CrossRef] [PubMed]
- Bartoll, X.; Salvador, M.; Allué, N.; Borrell, C. Enquesta de Salut de Barcelona 2011; Agència de Salut Pública de Barcelona: Barcelona, Spain, 2013; Available online: http://www.aspb.cat/documents/enquesta-salut-barcelona-2011-resultats-detallats/ (accessed on 25 January 2019).
- Idescat Padró Municipal d’habitants. Available online: http://www.idescat.cat/pub/?id=pmh (accessed on 12 March 2018).
- Rodríguez-Sanz, M.C.; Borrell, C.; Martos, D.; Ricart, M. Manual d’elaboració i explotació del registre de mortalitat de Barcelona; Agència de Salut Pública de Barcelona: Barcelona, Spain, 2011. [Google Scholar]
- Sistema de Información para el desarollo de la Investigación en Atención Primaria. Morbidity Incidence Rates Barcelona; SIDIAP: Barcelona, Spain, 2016. [Google Scholar]
- Rojas-Rueda, D.; de Nazelle, A.; Teixidó, O.; Nieuwenhuijsen, M.J. Replacing car trips by increasing bike and public transport in the greater Barcelona metropolitan area: A health impact assessment study. Environ. Int. 2012, 49, 100–109. [Google Scholar] [CrossRef] [PubMed]
- Woodcock, J.; Givoni, M.; Morgan, A.S. Health Impact Modelling of Active Travel Visions for England and Wales Using an Integrated Transport and Health Impact Modelling Tool (ITHIM). PLoS ONE 2013, 8, e51462. [Google Scholar] [CrossRef]
- Rojas-Rueda, D.; De Nazelle, A.; Andersen, Z.J.; Braun-Fahrlander, C.; Bruha, J.; Bruhova-Foltynova, H.; Desqueyroux, H.; Praznoczy, C.; Ragettli, M.S.; Tainio, M.; et al. Health impacts of active transportation in Europe. PLoS ONE 2016, 11, e0149990. [Google Scholar] [CrossRef]
- Ezzati, M.; Rodgers, A.; Lopez, A.D.; Hoorn, S.V.; Murray, C.J.L. Mortality and Burden of Disease Attributable to Individual Risk Factors. In Comparative Quantification of Health Risks: Global and Regional Burden of Disease Attributable to Selected Major Risk Factors; World Health Organization: Geneva, Switzerland, 2004; pp. 2141–2166. [Google Scholar]
- Hänninen, O.; Knol, A.B.; Jantunen, M.; Lim, T.-A.; Conrad, A.; Rappolder, M.; Carrer, P.; Fanetti, A.-C.; Kim, R.; Buekers, J.; et al. Environmental Burden of Disease in Europe: Assessing Nine Risk Factors in Six Countries. Environ. Health Perspect. 2014, 122, 439–446. [Google Scholar] [CrossRef]
- Hay, S.I.; Abajobir, A.A.; Abate, K.H. GBD 2016 DALYs and HALE Collaborators Global, regional, and national disability-adjusted life-years (DALYs) for 333 diseases and injuries and healthy life expectancy (HALE) for 195 countries and territories, 1990–2016: A systematic analysis for the Global Burden of Disease Study 2016. Lancet 2017, 390, 1260–1344. [Google Scholar]
- OECD (2012). Mortality Risk Valuation in Environment, Health and Transport Policies; OECD Publishing. Available online: http://dx.doi.org/10.1787/9789264130807-en (accessed on 25 January 2019).
- Ding, D.; Lawson, K.D.; Kolbe-Alexander, T.L.; Finkelstein, E.A.; Katzmarzyk, P.T.; van Mechelen, W.; Pratt, M. The economic burden of physical inactivity: A global analysis of major non-communicable diseases. Lancet 2016, 388, 1311–1324. [Google Scholar] [CrossRef]
- Parés-Badell, O.; Barbaglia, G.; Jerinic, P.; Gustavsson, A.; Salvador-Carulla, L.; Alonso, J. Cost of disorders of the brain in Spain. PLoS ONE 2014, 9, e105471. [Google Scholar] [CrossRef] [PubMed]
- Rojas-Rueda, D.; de Nazelle, A.; Teixidó, O.; Nieuwenhuijsen, M.J. Health impact assessment of increasing public transport and cycling use in Barcelona: A morbidity and burden of disease approach. Prev. Med. 2013, 57, 573–579. [Google Scholar] [CrossRef] [PubMed]
- De Hartog, J.J.; Boogaard, H.; Nijland, H.; Hoek, G. Do the Health Benefits of Cycling Outweigh the Risks? Os benefícios à saúde em andar de bicicleta superam os riscos? Cien. Saude Colet. 2011, 16, 4731–4745. [Google Scholar] [CrossRef]
- Mueller, N.; Rojas-Rueda, D.; Cole-Hunter, T.; de Nazelle, A.; Dons, E.; Gerike, R.; Götschi, T.; Int Panis, L.; Kahlmeier, S.; Nieuwenhuijsen, M. Health impact assessment of active transportation: A systematic review. Prev. Med. 2015, 103–114. [Google Scholar] [CrossRef] [PubMed]
- Mueller, N.; Rojas-Rueda, D.; Salmon, M.; Martinez, D.; Ambros, A.; Brand, C.; de Nazelle, A.; Dons, E.; Gaupp-Berghausen, M.; Gerike, R.; et al. Health impact assessment of cycling network expansions in European cities. Prev. Med. 2018, 62–70. [Google Scholar] [CrossRef]
- Donaire-Gonzalez, D.; De Nazelle, A.; Cole-Hunter, T.; Curto, A.; Rodriguez, D.A.; Mendez, M.A.; Garcia-Aymerich, J.; Basagaña, X.; Ambros, A.; Jerrett, M.; et al. The Added Benefit of Bicycle Commuting on the Regular Amount of Physical Activity Performed. Am. J. Prev. Med. 2015, 49, 842–849. [Google Scholar] [CrossRef]
- Dzhambov, A.; Dimitrova, D. Urban green spaces’ effectiveness as a psychological buffer for the negative health impact of noise pollution: A systematic review. Noise Health 2014, 16, 157–165. [Google Scholar] [CrossRef]
- McDonald, R.; Kroeger, T.; Boucher, T.; Longzhou, W.; Salem, R.; Adams, J.; Bassett, S.; Edgecomb, M.; Garg, S. Planting Healthy Air. A Global Analysis of the Role of Urban Trees in Addressing Particulate Matter Pollution and Extreme Heat; The Nature Conservancy, 2016. Available online: www.nature.org/healthyair (accessed on 25 January 2019).
- Formoso, D.; Weber, R.N.; Atkins, M.S. Gentrification and Urban Children’s Well-Being: Tipping the Scales from Problems to Promise. Am. J. Community Psychol. 2010, 46, 395–412. [Google Scholar] [CrossRef]
- McCartney, G.; Hearty, W.; Taulbut, M.; Mitchell, R.; Dryden, R.; Collins, C. Regeneration and health: A structured, rapid literature review. Public Health 2017, 148, 69–87. [Google Scholar] [CrossRef] [PubMed]
- Cole, H.V.S.; Garcia Lamarca, M.; Connolly, J.J.T.; Anguelovski, I. Are green cities healthy and equitable? Unpacking the relationship between health, green space and gentrification. J. Epidemiol. Community Health 2017, 71, 1–4. [Google Scholar] [CrossRef] [PubMed]
- Àrea Metropolitana de Barcelona. Sistema d’Indicadors Metropolitans de Barcelona SIMBA. Preu mitjà de lloguer. Available online: https://iermbdb.uab.cat/index.php?ap=0&id_ind=1660&id_cat=402 (accessed on 17 January 2019).
- Dallat, M.A.T.; Soerjomataram, I.; Hunter, R.F.; Tully, M.A.; Cairns, K.J.; Kee, F. Urban greenways have the potential to increase physical activity levels cost-effectively. Eur. J. Public Health 2013, 24, 190–195. [Google Scholar] [CrossRef] [PubMed]


| Types of Physical Activity | METs per Type of Physical Activity a | Mean Duration of Visits to the Park b (min/Day) | Mean Frequency of Visits to the Park c (Days/Week) | Estimated Visits/Day d | Estimated METs Hour/Week per Subject e | Estimated Park Users/Day f (N) | ||
|---|---|---|---|---|---|---|---|---|
| Scenario 1 | Scenario 2 | Scenario 1 | Scenario 2 | |||||
| Walking for leisure | ||||||||
| ≥18 and ≤64 years old | 3.5 | 59 | 5 | 2.5 | 1 | 17 | 9 | 1566 |
| ≥65 years old | 3.5 | 63 | 5 | 2.5 | 1 | 18 | 9 | 619 |
| Cycling | ||||||||
| ≥18 and ≤64 years old | 7.5 | 65 | 5 | 2.5 | 1 | 41 | 20 | 535 |
| ≥65 years old | 7.5 | 65 | 5 | 2.5 | 1 | 41 | 20 | 2287 |
| Running | ||||||||
| ≥18 and ≤64 years old | 7.0 | 58 | 5 | 2.5 | 1 | 34 | 17 | 686 |
| Walking for commuting | ||||||||
| ≥18 and ≤64 years old | 4.0 | 98 | 5 | 2.5 | 2 | 65 | 33 | 60 |
| Total (all users) | 5753 | |||||||
| ≥18 and ≤64 years old | 2848 | |||||||
| ≥65 years old | 2905 | |||||||
| Health Outcomes | Scenario 1 | Scenario 2 | ||||
|---|---|---|---|---|---|---|
| Cases/Year (95% CI) | DALYs/Year (95% CI) | Euros/Year (95% CI) | Cases/Year (95% CI) | DALYs/Year (95% CI) | Euros/Year (95% CI) | |
| All-cause mortality | −7.3 (−10.2, −5.4) | − | −23,403,186 (−32,787,354, −17,148,033) | −4.8 (−6.7, −3.6) | − | −15,524,195 (−21,541,777, −11,414,915) |
| Diseases | ||||||
| IHD (W) | −0.1 (−0.1, 0.0) | −1.8 (−3.1, −0.6) | −61 (−105, −22) | 0.0 (−0.1, 0.0) | −1.2 (−2.1, −0.4) | −41 (−70, −15) |
| IHD (M) | −0.4 (−0.6, −0.1) | −3.3 (−5.7, −1.2) | −421 (−727, −151) | −0.3 (−0.4, −0.1) | −2.2 (−3.8, −0.8) | −282 (−485, −102) |
| Stroke (W) | −0.1 (−0.3, 0.0) | −0.1 (−0.3, 0.0) | −271 (−590, 0) | −0.1 (−0.2, 0.0) | −0.1 (−0.2, 0.0) | −182 (−393, 0) |
| Stroke (M) | −0.8 (−1.8, 0.0) | −0.5 (−1.1, 0.0) | −1790 (−3903, 0) | −0.5 (−1.2, 0.0) | −0.4 (−0.8, 0.0) | −1206 (−2601, 0) |
| DM2 (W) | −0.1 (−0.1, 0.0) | −0.1 (−0.2, 0.0) | −199 (−336, −39) | 0.0 (−0.1, 0.0) | −0.1 (−0.2, 0.0) | −135 (−227, −26) |
| DM2 (M) | −0.1 (−0.2, 0.0) | −0.3 (−0.4, −0.1) | −365 (−615, −71) | −0.1 (−0.1, 0.0) | −0.2 (−0.3, 0.0) | −247 (−416, −48) |
| Colon C (W) | 0.0 (0.0, 0.0) | −0.1 (−0.4, 0.1) | −21 (−60, 14) | 0.0 (0.0, 0.0) | −0.1 (−0.3, 0.1) | −14 (−41, 10) |
| Colon C (M) | 0.0 (−0.1, 0.0) | −0.3 (−0.8, 0.2) | −70 (−204, 48) | 0.0 (0.0, 0.0) | −0.2 (−0.5, 0.1) | −47 (−137, 33) |
| Breast C (W) | 0.0 (0.0, 0.0) | 0.0 (−0.1, 0.0) | −11 (−25, 2) | 0.0 (0.0, 0.0) | 0.0 (−0.1, 0.0) | −7 (−17, 2) |
| Dementia (W) | −1.1 (−2.1, −0.4) | −1.0 (−1.8, −0.4) | −6573 (−11,980, −2589) | −0.7 (−1.3, −0.2) | −0.7 (−1.2, −0.2) | −4350 (−7795, −1235) |
| Dementia (M) | −3.5 (−6.3, −1.4) | −3.5 (−6.4, −1.4) | −20,154 (−36,733, −940) | −2.3 (−4.1, −0.6) | −2.3 (−4.2, −0.7) | −13,337 (−23,903, −3788) |
| All diseases | −6.2 (−11.6, −2.0) | −11.1 (−20.5, −3.4) | −29,934 (−55,278, −10,748) | −4.1 (−7.6, −1.0) | −7.4 (−13.5, −1.9) | −19,849 (36,085, −5171) |
| Total (euros/year) | −23,433,120 (−32,842,631, −17,158,781) | −15,544,044 (−21,577,862, −11,420,085) | ||||
| Types of Physical Activity | Scenario 1 | Scenario 2 | ||||
|---|---|---|---|---|---|---|
| DALYs/Year (95% CI) | Direct Costs (Euros/Year) (95% CI) | VSL (Euros/Year) (95% CI) | DALYs/Year (95% CI) | Direct Costs (Euros/Year) (95% CI) | VSL (Euros/Year) (95% CI) | |
| Cycling | −7.9 (−14.6, −2.4) | −25,284 (−46,826, −9108) | −15,629,701 (−21,916,593, −11,401,939) | −5.3 (−9.7, −1.3) | −16,818 (−30,648, −4090) | −10,426,408 (−14,505,355, −7,651,506) |
| Walking for leisure | −2.4 (−4.3, −0.7) | −4487 (−8154, −1608) | −7,255,016 (−10,144,657, −5,367,509) | −1.6 (−2.8, −0.5) | −2920 (−5236, −1059) | −4,753,055 (−6,557,344, −3,510,218) |
| Running | −0.8 (−1.4, −0.2) | −146 (−264, −28) | −460,256 (−643,971, −336,315) | −0.5 (−0.9, −0.1) | −99 (−178, −19) | −305,284 (−423,907, −224,357) |
| Walking to work | −0.1 (−0.2, 0.0) | −18 (−33, −3) | −58,213 (−82,133, −42,271) | −0.1 (−0.1, 0.0) | −13 (−23, −2) | −39,448 (−55,172, −28,834) |
| TOTAL | −11.1 (−20.5, −3.4) | −29,934 (−55,278, −10,748) | −23,403,186 (−32,787,354, −17,148,033) | −7.4 (−13.5, −1.9) | −19,849 (−36,085, −5171) | −15,524,195 (−21,541,777, −11,414,915) |
© 2019 by the authors. Licensee MDPI, Basel, Switzerland. This article is an open access article distributed under the terms and conditions of the Creative Commons Attribution (CC BY) license (http://creativecommons.org/licenses/by/4.0/).
Share and Cite
Vert, C.; Nieuwenhuijsen, M.; Gascon, M.; Grellier, J.; Fleming, L.E.; White, M.P.; Rojas-Rueda, D. Health Benefits of Physical Activity Related to an Urban Riverside Regeneration. Int. J. Environ. Res. Public Health 2019, 16, 462. https://doi.org/10.3390/ijerph16030462
Vert C, Nieuwenhuijsen M, Gascon M, Grellier J, Fleming LE, White MP, Rojas-Rueda D. Health Benefits of Physical Activity Related to an Urban Riverside Regeneration. International Journal of Environmental Research and Public Health. 2019; 16(3):462. https://doi.org/10.3390/ijerph16030462
Chicago/Turabian StyleVert, Cristina, Mark Nieuwenhuijsen, Mireia Gascon, James Grellier, Lora E. Fleming, Mathew P. White, and David Rojas-Rueda. 2019. "Health Benefits of Physical Activity Related to an Urban Riverside Regeneration" International Journal of Environmental Research and Public Health 16, no. 3: 462. https://doi.org/10.3390/ijerph16030462