Article

Transcriptomic and Chemical Analyses Reveal the Hub Regulators of Flower Color Variation from Camellia japonica Bud Sport

State Key Laboratory of Tree Genetics and Breeding, Research Institute of Subtropical Forestry, Chinese Academy of Forestry, Hangzhou 311400, China
*
Author to whom correspondence should be addressed.
Horticulturae 2022, 8(2), 129; https://doi.org/10.3390/horticulturae8020129
Submission received: 24 December 2021 / Revised: 25 January 2022 / Accepted: 28 January 2022 / Published: 30 January 2022

Abstract

:
Camellia japonica is a woody ornamental plant with multiple flower color variations caused by bud sport; however, the molecular mechanism remains unclear. Here, chemical and transcriptomic analyses of C. japonica were performed with white, pink, red, and dark red flowers caused by bud sport. Seven anthocyanins were detected in these samples, except in C. japonica ‘YuDan’ (white petals). The total anthocyanin content of C. japonica ‘JinBiHuiHuang’ was the highest, and cyanidin 3-O-β-glucoside (Cy3G) was the main anthocyanin affecting the redness of petals. Furthermore, the ratio of Cy3G and cyanidin-3-O-(6-O-(E)-p-coumaroyl)-B-glucoside) was significantly correlated with the red petal phenotype. In total, 5673 genes were identified as differentially expressed genes (DEGs). The potential co-expression modules related to anthocyanin accumulation were established, which featured transcription factors, anthocyanin biosynthesis, and plant hormone signal transduction. Thirteen structural genes in the anthocyanin biosynthetic pathway were identified as DEGs, most of them were upregulated with deepening of flower redness. An integrated promoter and cluster analysis suggested that CjMYB62, CjMYB52, and CjGATA may play important roles in anthocyanin accumulation. These results provide insight and candidate genes for the transcriptional mechanism responsible for the bud sport phenotype.

1. Introduction

Bud sport is a common somatic mutation that occurs in leaves, flowers, and fruits [1] and leads to qualitative and quantitative changes in plant phenotypes [2] but retains the original qualities of the parent plant. Thus, many new plant cultivars have been obtained by breeding mutant buds with good characters. The mutants caused by bud sport often display changes in the anthocyanin content of different tissues. The bud sport induces changes in phenotypic colors in periclinal chimeras of carnation [3].
Bud sport contributes to different expression levels of genes in the anthocyanin synthesis pathway between red and white flowers of peach trees [4]. In addition, the induction of anthocyanin biosynthesis in grapevine fruit [5] and the mutations in some branches lead to a loss of color in leaves and stems in pear [6]. However, the transcriptional mechanism remains unclear.
Pigments are the most critical factor affecting the floral color. Pigments are divided into three groups, including flavonoids, betalains, and carotenoids. Anthocyanins are mainly the red-colored flavonoids in petals. The floral color turns white when anthocyanins degrade, and the floral color turns red when anthocyanins accumulate [7].
It has been reported that anthocyanin contents play the main role in the floral color of herbaceous peony cultivars [8]. In addition, seven anthocyanins (cyanidin 3-O-β-glucopyranoside, and others) have been isolated from the red petals of C. saluenensis [9]. The anthocyanin synthesis pathway involves the regulation of several genes [10], including PAL, C4H, 4CL, CHS, and CHI, which promote naringenin synthesis.
The formation of various flavonoids is regulated by the FLS, FNS, F3H, F3′H, and F3′5′H genes, and DFR, ANS, and LAR promote anthocyanidin biosynthesis. Moreover, UDP-glucose transferase further stabilizes anthocyanin by glycosylation. Interestingly, some transcription factors (TFs) (MYB, bHLH, and MADS-box) regulate the structural genes in the anthocyanin biosynthesis pathway by binding to the cis-acting element [11]. Although studies on flower color have been carried out, few are available on changes in anthocyanin content caused by bud sport.
Camellia japonica is an important ornamental flowering plant, and the flower color is a major characteristic of ornamental value. Due to a lack of molecular resources, the breeding of new cultivars mainly depends on bud sport and cross-breeding. Bud sport causes rich flower color in C. japonica [9]. C. japonica is considered an excellent model plant for research on flower color, as flowers range from white to dark red in C. japonica ‘ChiDan’.
Initially, two novel C. japonica cultivars with pink or dark red petals were obtained by budding sport (C. japonica ‘FenDan’ and C. japonica ‘JinBiHuiHuang’). Then, a novel C. japonica cultivar with white petals was obtained by budding sport (C. japonica ‘YuDan’) (Figure 1A). This greatly improved the ornamental value of C. japonica. The bud sport transcriptional regulatory mechanism is of great significance for understanding the different C. japonica color phenotypes; however, the molecular mechanisms have not been adequately explored.
To understand the molecular mechanism of flower color variation from C. japonica bud sport, seven anthocyanins were identified from four C. japonica cultivars formed by bud sport using high-performance liquid chromatography (HPLC). Correlation analysis of petal color and pigment content was performed. Moreover, the traditional divergence of anthocyanin accumulation in C. japonica was inferred by RNA-seq, which provided candidate genes involved in the bud sport floral color phenotypes and valuable information for the color diversity of C. japonica.

2. Materials and Methods

2.1. Plant Materials and Chroma Measurements

All camellias used in this experiment were obtained from the Germplasm Resource Center of the Institute of Subtropical Forestry, Chinese Academy of Forestry (Daqiao Road, Hangzhou City, Zhejiang Province, China). The annual rainfall is approximately 1500 mm, and the frost-free period is approximately 320 days. The soil at the test site is sandy loam soil, and the soil pH is 5.5–6.5. The irrigation and drainage conditions are good.
C. japonica were used as the control (CJ), C. japonica ‘ChiDan’ with red petals (CD), C. japonica ‘JinBiHuiHuang’ with dark red petals (JH), C. japonica ‘FenDan’ with pink petals (FD), and C. japonica ‘YuDan’ with white petals (YD) were selected as the experimental subjects, and their petals were collected. The camellias used in the experiment were all 6 years old. The petals were divided into five groups according to color and species, with three biological replicates in each group.
The chroma values were measured using a spectroscopic colorimeter (NF555, Spectrophotometer, TRISUM) according to the CIE L* a* b* method. Position was measured at the central part of the upper epidermis of the petals, and the light source was C/2°. Each measurement had three biological replicates.

2.2. Extraction and Quantitative and Qualitative Analyses of the Anthocyanins

Fresh petals (2 g) were ground in liquid N2. Flowers were extracted in buffer (methanol: water: formic acid: trifluoroacetic acid = 70:27:2:1, v/v) for 24 h under a shaded condition. Then, the supernatants were filtered through a 0.22 µm membrane. Three biological replicates were collected and stored at −20 °C.
The chromatographic analysis was performed using HPLC-PDA (Waters-Alliance 2695, Milford, MA, USA). The chromatographic column was a TSK gel ODS-100Z (150 mm × 4.6 mm, 5 um, Tosoh Co. Ltd., Kyoto, Japan). The experimental conditions were determined by Li et al. [12]: elution gradient: 0 min, 22% B; 15 min, 28% B; 35 min, and 68% B at a temperature of 40 °C. The detection wavelength was 525 nm.
The structure of anthocyanin was analyzed using ultra-performance liquid chromatography to quadrupole time-of-flight mass spectrometry (liquid chromatographic system: Waters Corp. and mass spectrometry system: Waters Corp., Manchester, UK) [13]. The cyanidin-3-0-β-glucoside (Cy3G) standard substance (Sigma, St. Louis, MO, USA) was used to calculate the anthocyanin content [14]. The mass spectrometry conditions were the total ion scanning mass (m/z) 50–1000 u, dry gas (N2): 450 °C, 600 L/h, and capillary voltage: 4500 V.

2.3. Library Construction for Next-Generation Sequencing (NGS) and RNA Extraction

The 15 samples of total RNA from the five groups (CJ, CD, JH, FD, and YD) were extracted using the DP441 plant kit (TIAGEN, Beijing, China), following the manufacturer’s instructions. Each treatment was comprised of three replications. RNA quality was determined using the NanoDrop1000 (ThermoFisher, Waltham, MA, USA) and Agilent 2100 instruments (Agilent Technologies, Palo Alto, CA, USA). A NGS RNA library was constructed. Oligo (dT) magnetic beads were used for mRNA enrichment by AT complementary pairing with the poly-A tail of the mRNA. Polymerase chain reaction (PCR) enrichment was performed to obtain the cDNA library [15], and then libraries were sequenced on an Illumina HiSeq 2000 platform. All the clean reads were assembled using a de novo assembly program Trinity.

2.4. Functional Annotation and Identification of the Open Reading Frames

The data were compared with the following databases: the NR [16] (ncbi.nlm.nih.gov/blast/db/FASTA/) (accessed on 29 June 2019); the Pfam [17] (http://pfam.xfam.org) (accessed on 29 June 2019); the KOG [18], the COG [19] (http://www.ncbi.nlm.nih.gov/COG/) (accessed on 29 June 2019); the Swiss-Prot [20] (http://www.ebi.ac.uk/uniprot/) (accessed on 29 June 2019); the Kyoto Encyclopedia of Genes and Genomes [21] (KEGG); and the Gene Ontology (GO) databases [22]. TFs were predicted using iTAK [23]. TransDecoder software was used to identify potential coding sequences in the transcripts.

2.5. Identification of DEGs and the Weighted Gene Co-Expression Network Analysis (WGCNA)

The expression levels of the transcripts were quantified based on the location of the mapped reads in the transcripts [24] and were calculated using the Fragments Per Kilobase of transcriptome per Million mapped reads method. DESeq [25] was used for the differential expression analyses between the sample groups. The DEG screening conditions were fold change ≥2 and a false discovery rate (FDR) <0.01. Genes with the highest contribution to 25% of the variance were set as targets, and the R package WGCNA (The R Foundation for Statistical Computing, Vienna, Austria) was used to identify co-expression modules related to anthocyanin accumulation.

2.6. Cloning and Cis-Element Analysis of the Promoter

DNA was extracted using the CTAB method [26]. According to the genome sequences of related species, PCR-specific primers were designed with Primer 5.0 software (Supplementary Table S1). The sequence was connected to the 18 T vector for Sanger sequencing. The cis-acting elements were identified using PlantCARE [27].

2.7. qRT-PCR Analysis

Primer Premier v6.0 was used to design the gene-specific primers (Supplementary Table S1). The RNA extracted from the sequencing samples was reverse transcribed to cDNA using the PrimeScript RT Reagent Kit + gDNA Eraser (Takara, Shiga, Japan). The qRT-PCR reactions were carried out according to the instructions for TB Green® Premix Ex Taq II (Takara, Shiga, Japan) using the ABI 7500 Fast Real-Time PCR System (ABI, Foster City, CA, USA) instrument. Gene expression was quantified by the 2△△CT method, and 18 s rRNA was used as the internal reference gene.

2.8. Statistical Analysis

All data were analyzed with three biological replicates. The statistical analysis was conducted using SPSS (v22.0) software (SPSS Inc., Chicago, IL, USA). A p-value < 0.05 was considered significant between mean values based on one-way analysis of variance and Tukey’s test. The data are presented as the mean ± standard deviation of three independent experiments.

3. Results

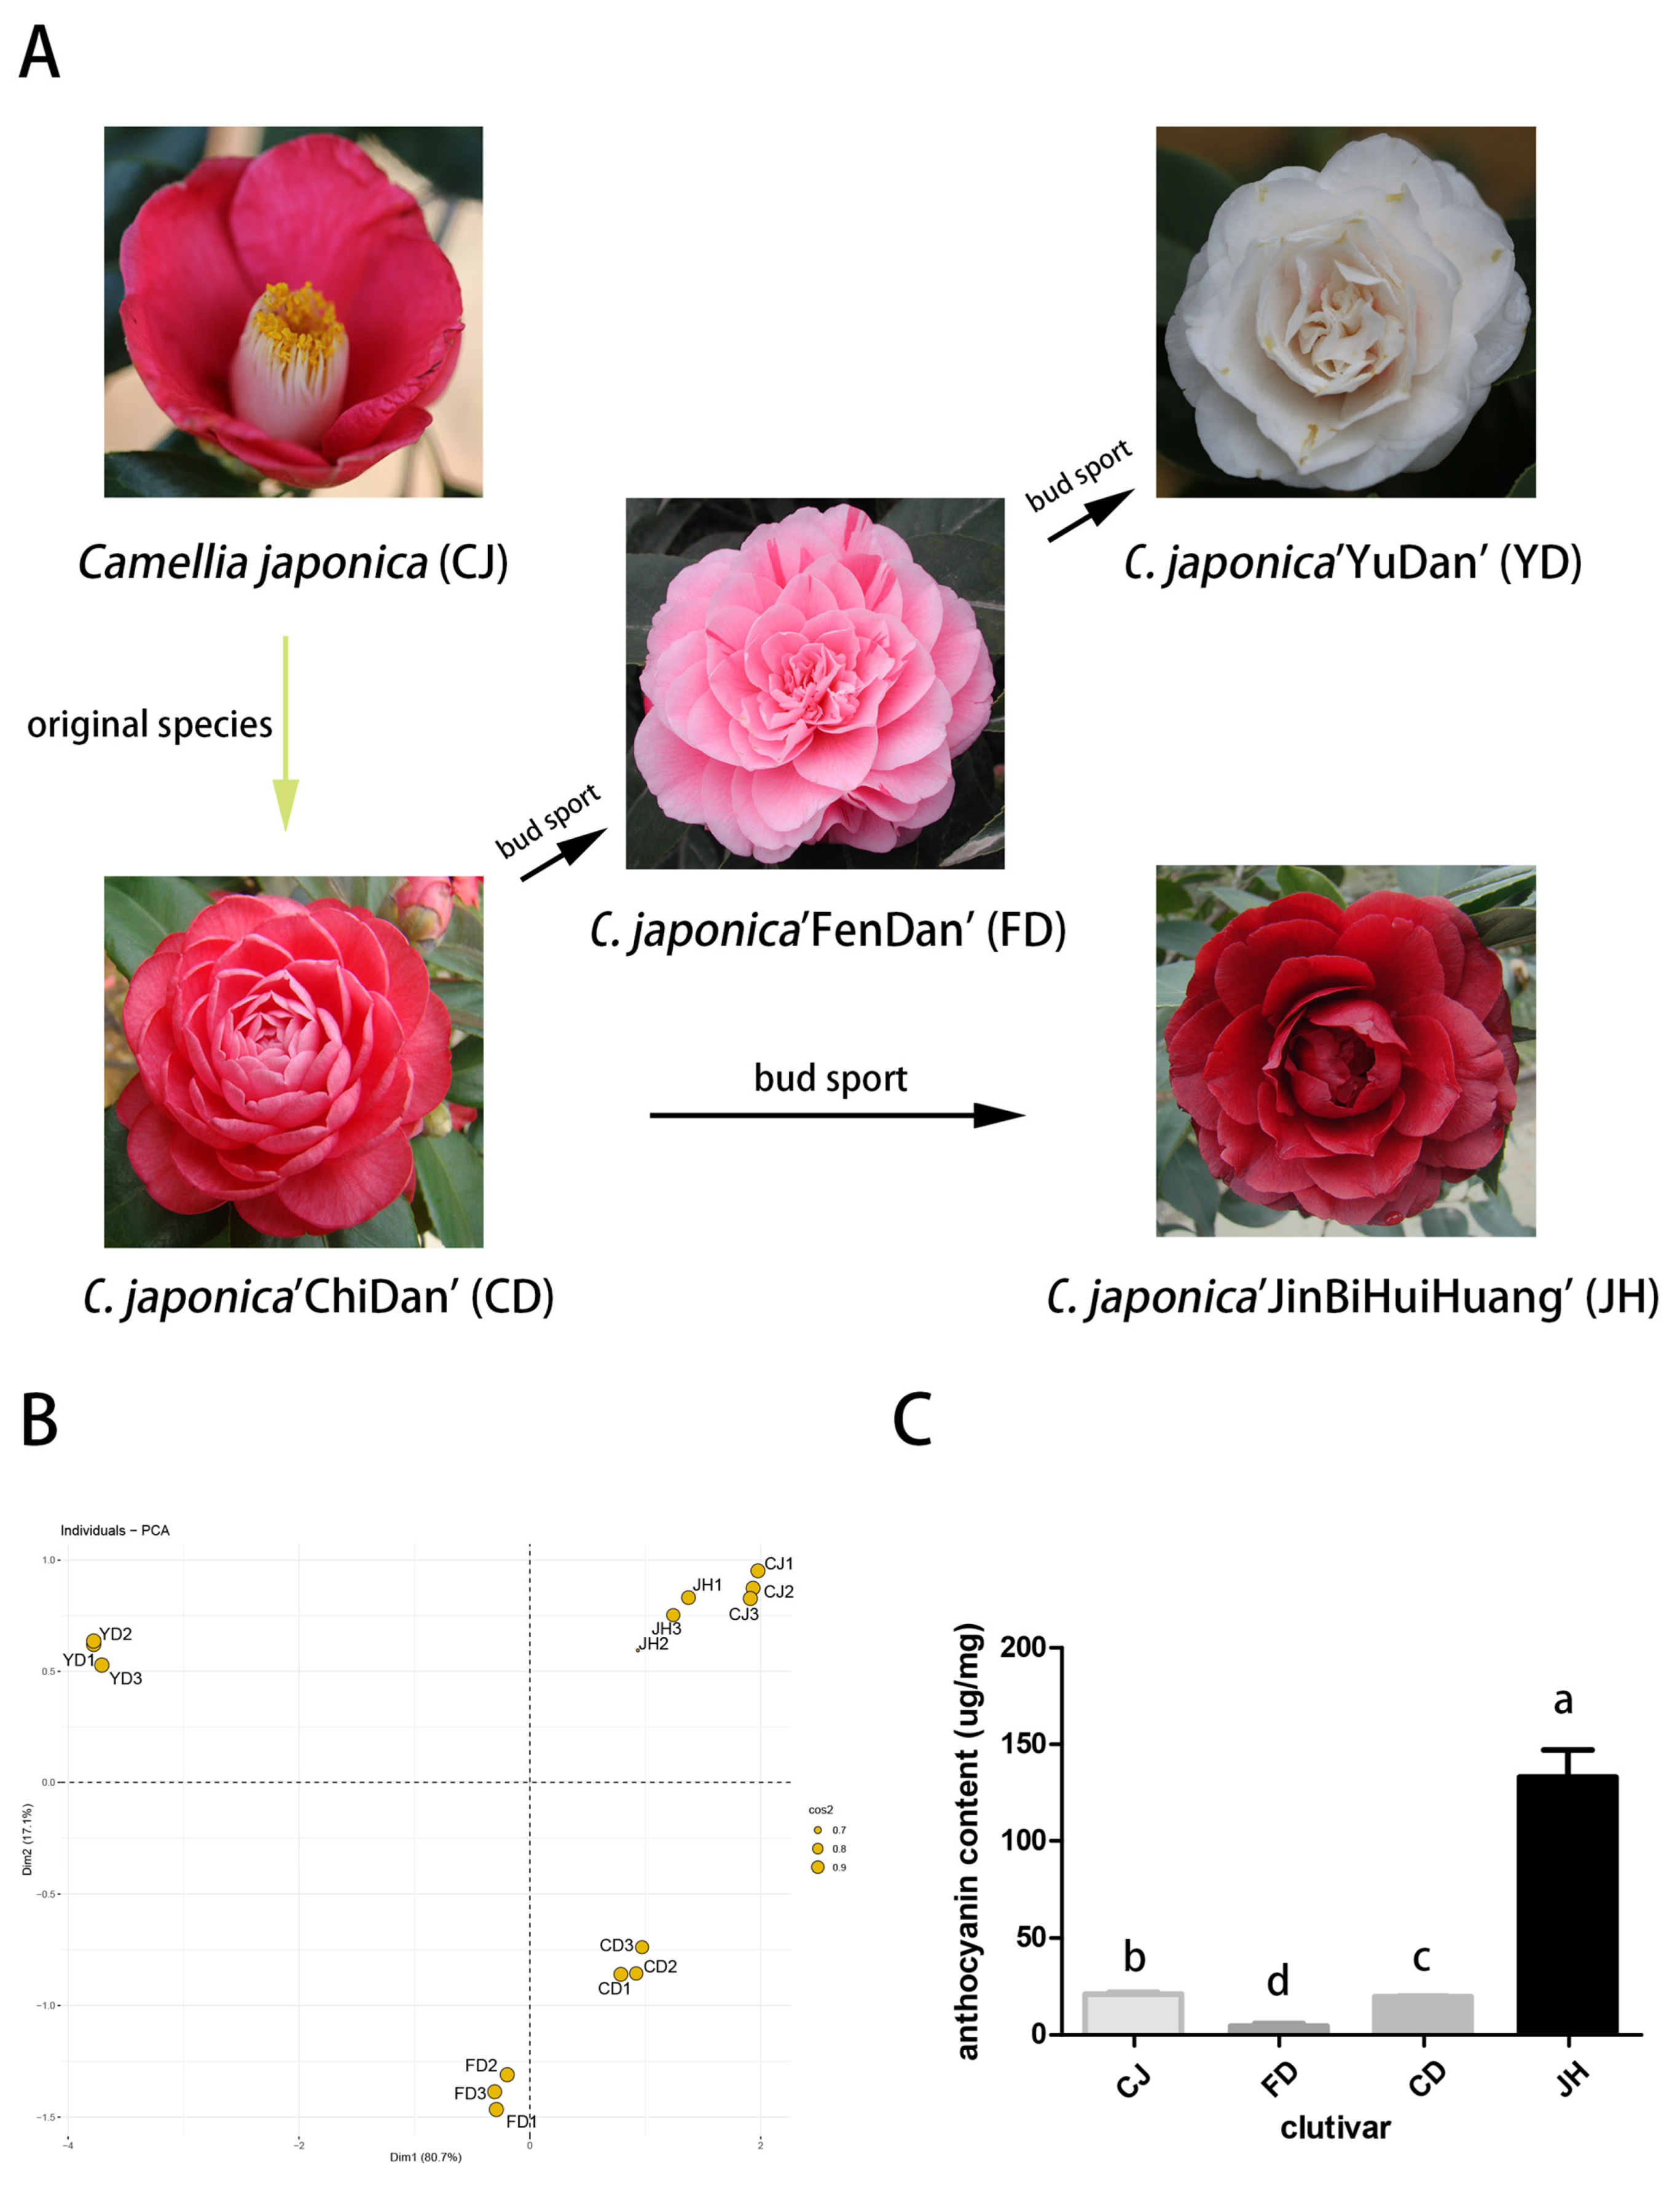
3.1. The Chroma Values of the Different Petals

The chroma value is used to scientifically represent the floral color phenotype. The a* value indicates redness and greenness, ranging from −0.74 (YD) to 53.63 (CJ), whereas the b* value indicates blueness and yellowness, ranging from 1.66 (FD) to 18.28 (CJ). The L* value indicates lightness, ranging from 35.21 (JH) to 91.49 (YD) (Supplementary Table S2). The color index of these samples was significantly different, which was consistent with the PCA results for the chroma values (Figure 1B).

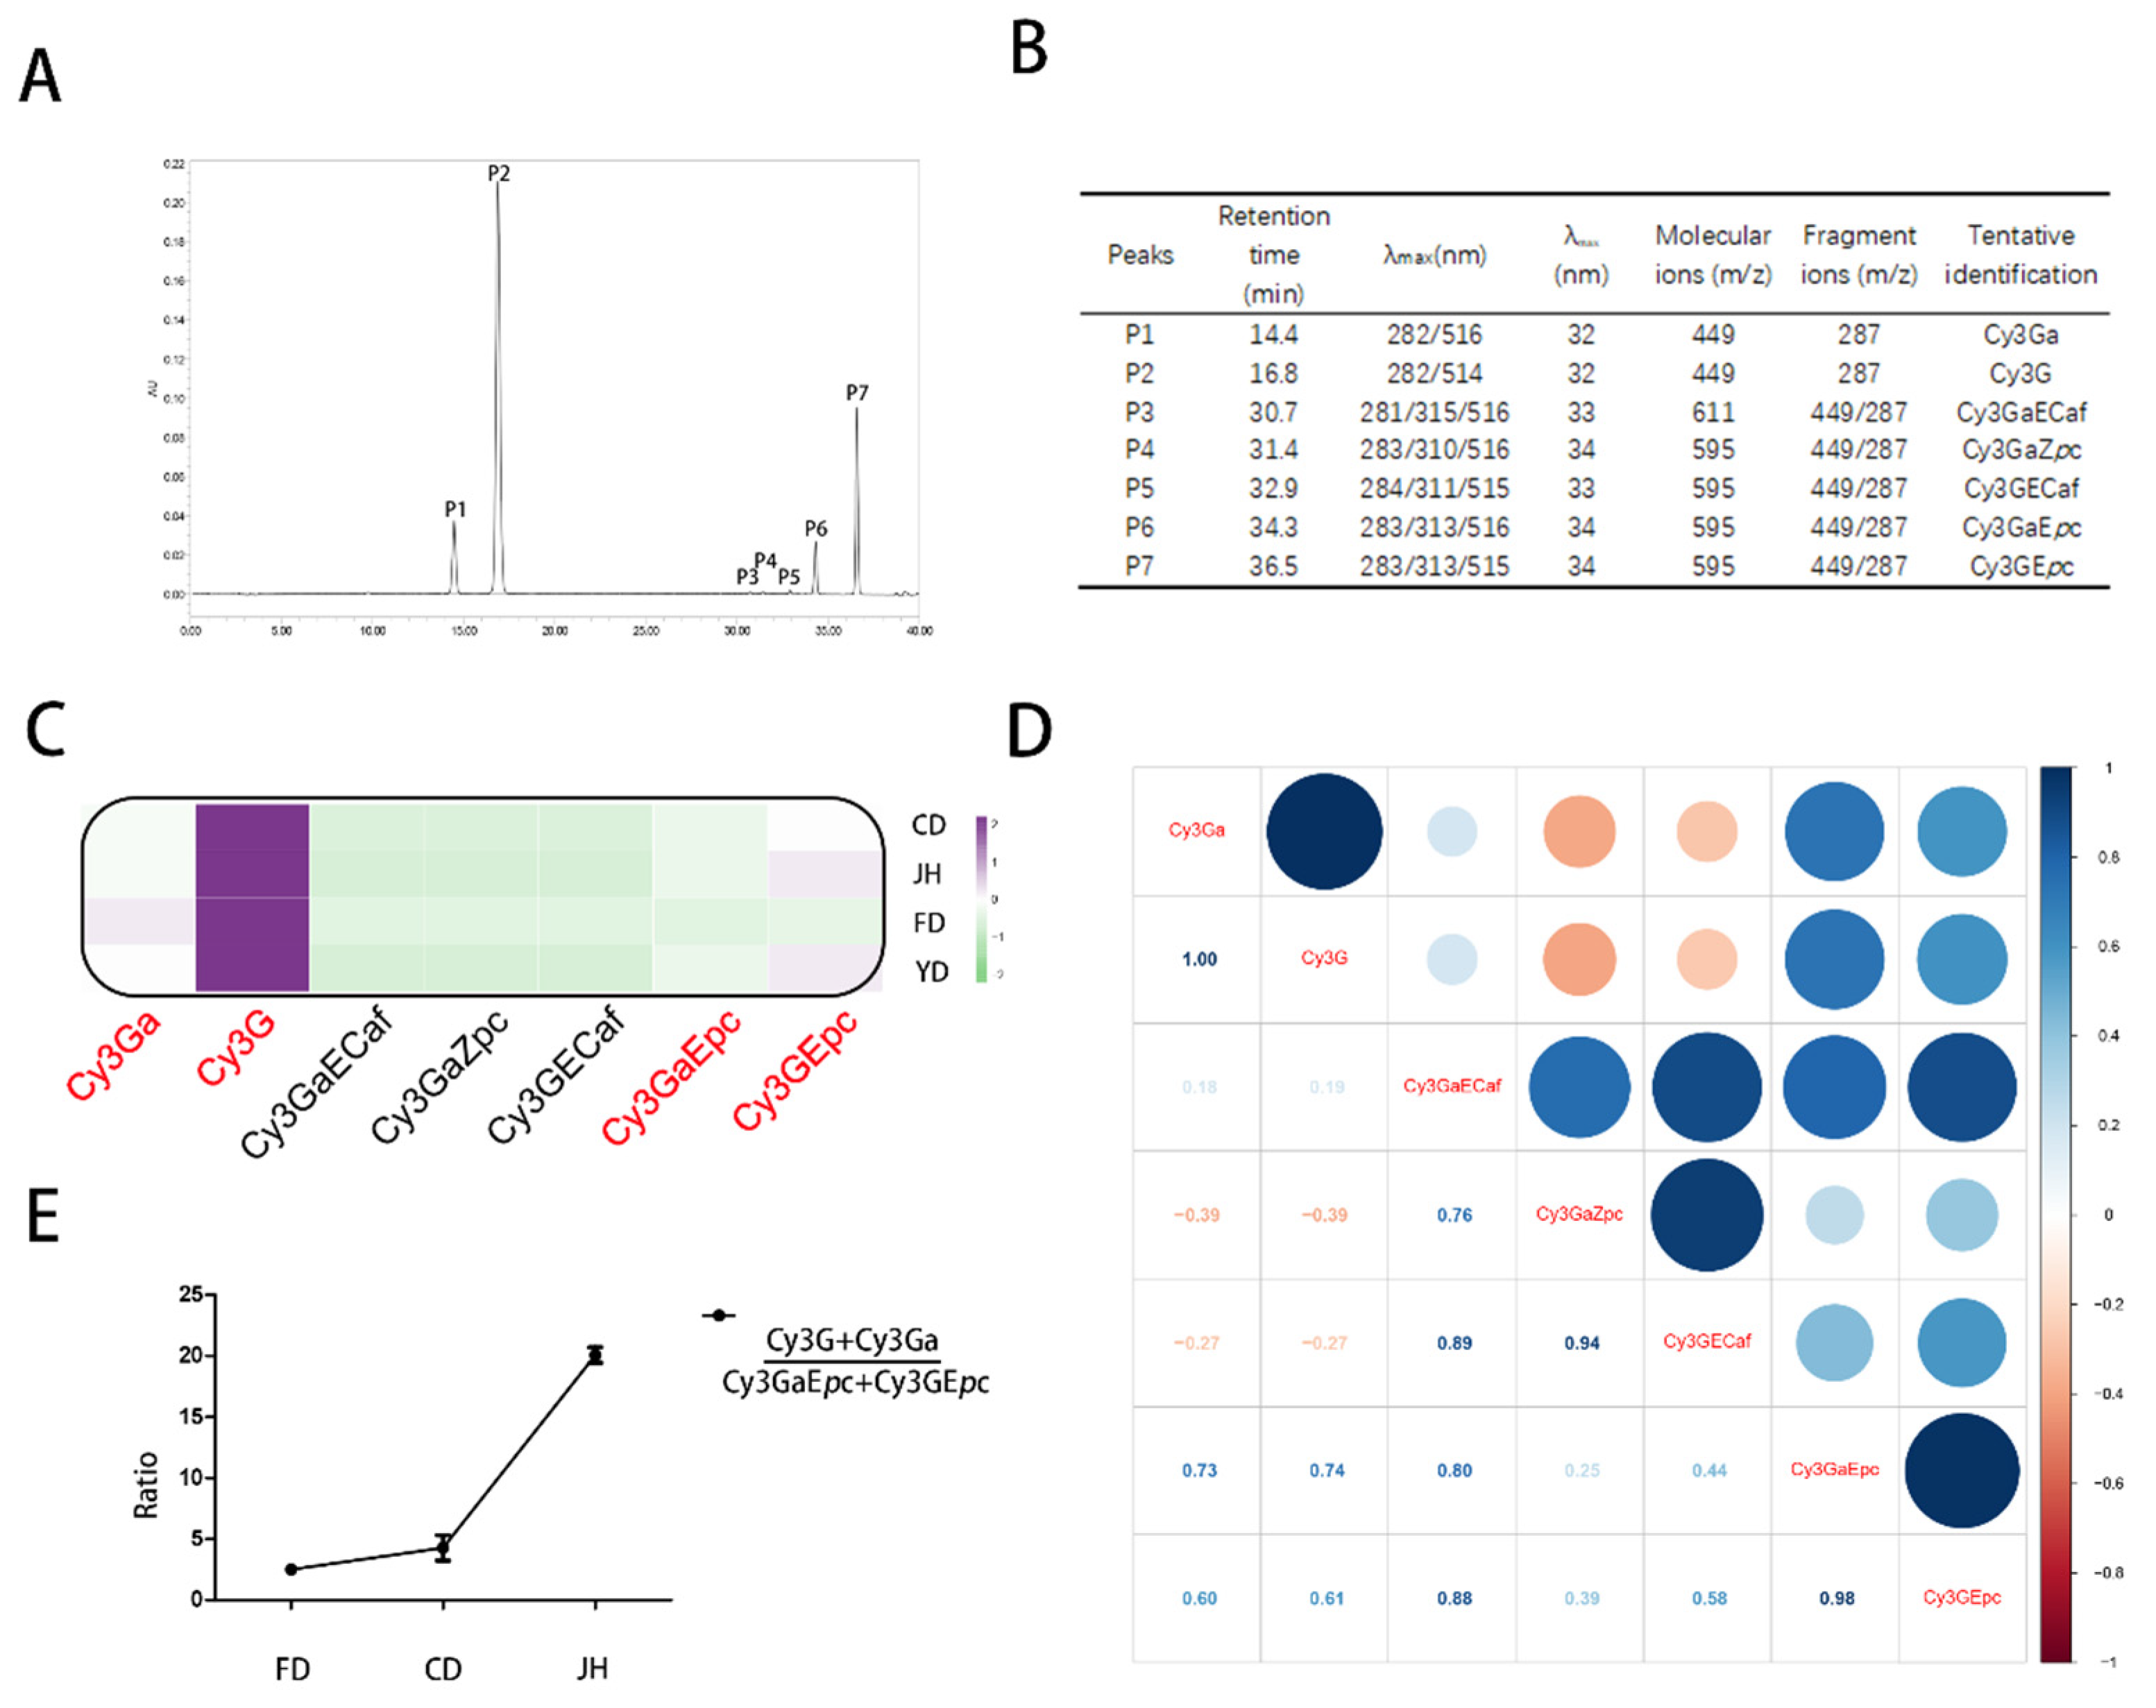
3.2. Qualitative and Quantitative Analyses of the Anthocyanins

Seven anthocyanin peaks were detected in the samples, except in YD (Figure 2A). The anthocyanins were identified by referencing published data of retention time, elution order, UV-vis spectrum, and the MS fragmentation pattern. The absorption peak of the UV-vis spectrum (513–520 nm) and the fragment ions (287 u) showed that the seven anthocyanins were cyanidin-based [28]. The A440/Avis-max ranged from 32% to 34%. All anthocyanins were the 3-O-glycoside type [29]. The molecular ions P1 and P2 were 449 u, and the difference between m/z 449 u to m/z 287 u was 162 u, e.g., glucoside (Figure 2B).
The elution time of anthocyanin galactose is less than that of anthocyanin glucoside. Overall, P1 and P2 were tentatively identified as cyanidin 3-O-β-glucoside and cyanidin 3-O-β-galactopyranoside, respectively. Similarly, five anthocyanins were established, including cyanidin-3-O-(6-O-(E)-caffeoyl)-β-galactoside (P3), cyanidin- 3-O-(6-O-(Z)-p-coumaroyl)-β-galactoside (P4), cyanidin-3-O-(6-O-(E)-caffeoyl)-β- glucoside (P5), cyanidin-3-O-(6-O-(E)-p-coumaroyl)-β-galactoside (P6), and cyanidin- 3-O-(6-O-(E)-p-coumaroyl)-β-glucoside (P7).
The total anthocyanin content was the highest in JH, which was more than 29 times that in FD and six times that in CD. The anthocyanin content in YD was not measured (Figure 1C and Supplementary Table S3), which was consistent with the chroma measurements. Interestingly, despite the total anthocyanin content, Cy3G was the main contributor to red petals (Figure 2C).
Furthermore, the correlation analysis of seven anthocyanins was performed, indicating that the Cy3G and Cy3GaEpC contents were positively related (R = 0.74) (Figure 2D). In addition, the proportion of different anthocyanins is another important factor affecting flower color; the redness of the petals deepened along with the increase in the proportion of Cy3Ga and Cy3G. Moreover, the proportion of Cy3GaEpC and Cy3GEpC decreased along with the deepening of the red color and was the lowest in JH (Figure 2E).

3.3. Overview of the Transcriptome Data

To further study the molecular mechanism of anthocyanin biosynthesis in camellia bud sport cultivars, a transcriptome analysis was performed based on the Illumina sequencing platform. Fifteen samples were divided into five groups, including CJ, YD, FD, CD, and JH. The number of raw reads in each library ranged from 22 to 28 million. After the low-quality reads were removed, and the high quantity sequences were trimmed, 107.23 Gb of clean data were generated with Q30 ≥ 92.50% and a GC content of 45.15–46.13%.
The average reads of all samples were 7.14 Gb of data, the average number of reads was 25,657,417 (Supplementary Table S4). The sequencing data were sufficient for further analysis. In total, 102,021 transcripts and 44,356 unigenes were generated using the Trinity sequence assembler. The average length of a transcript was 1136 bases, and the mapped ratio was 59.29%. The N50 length was 1638 bp.

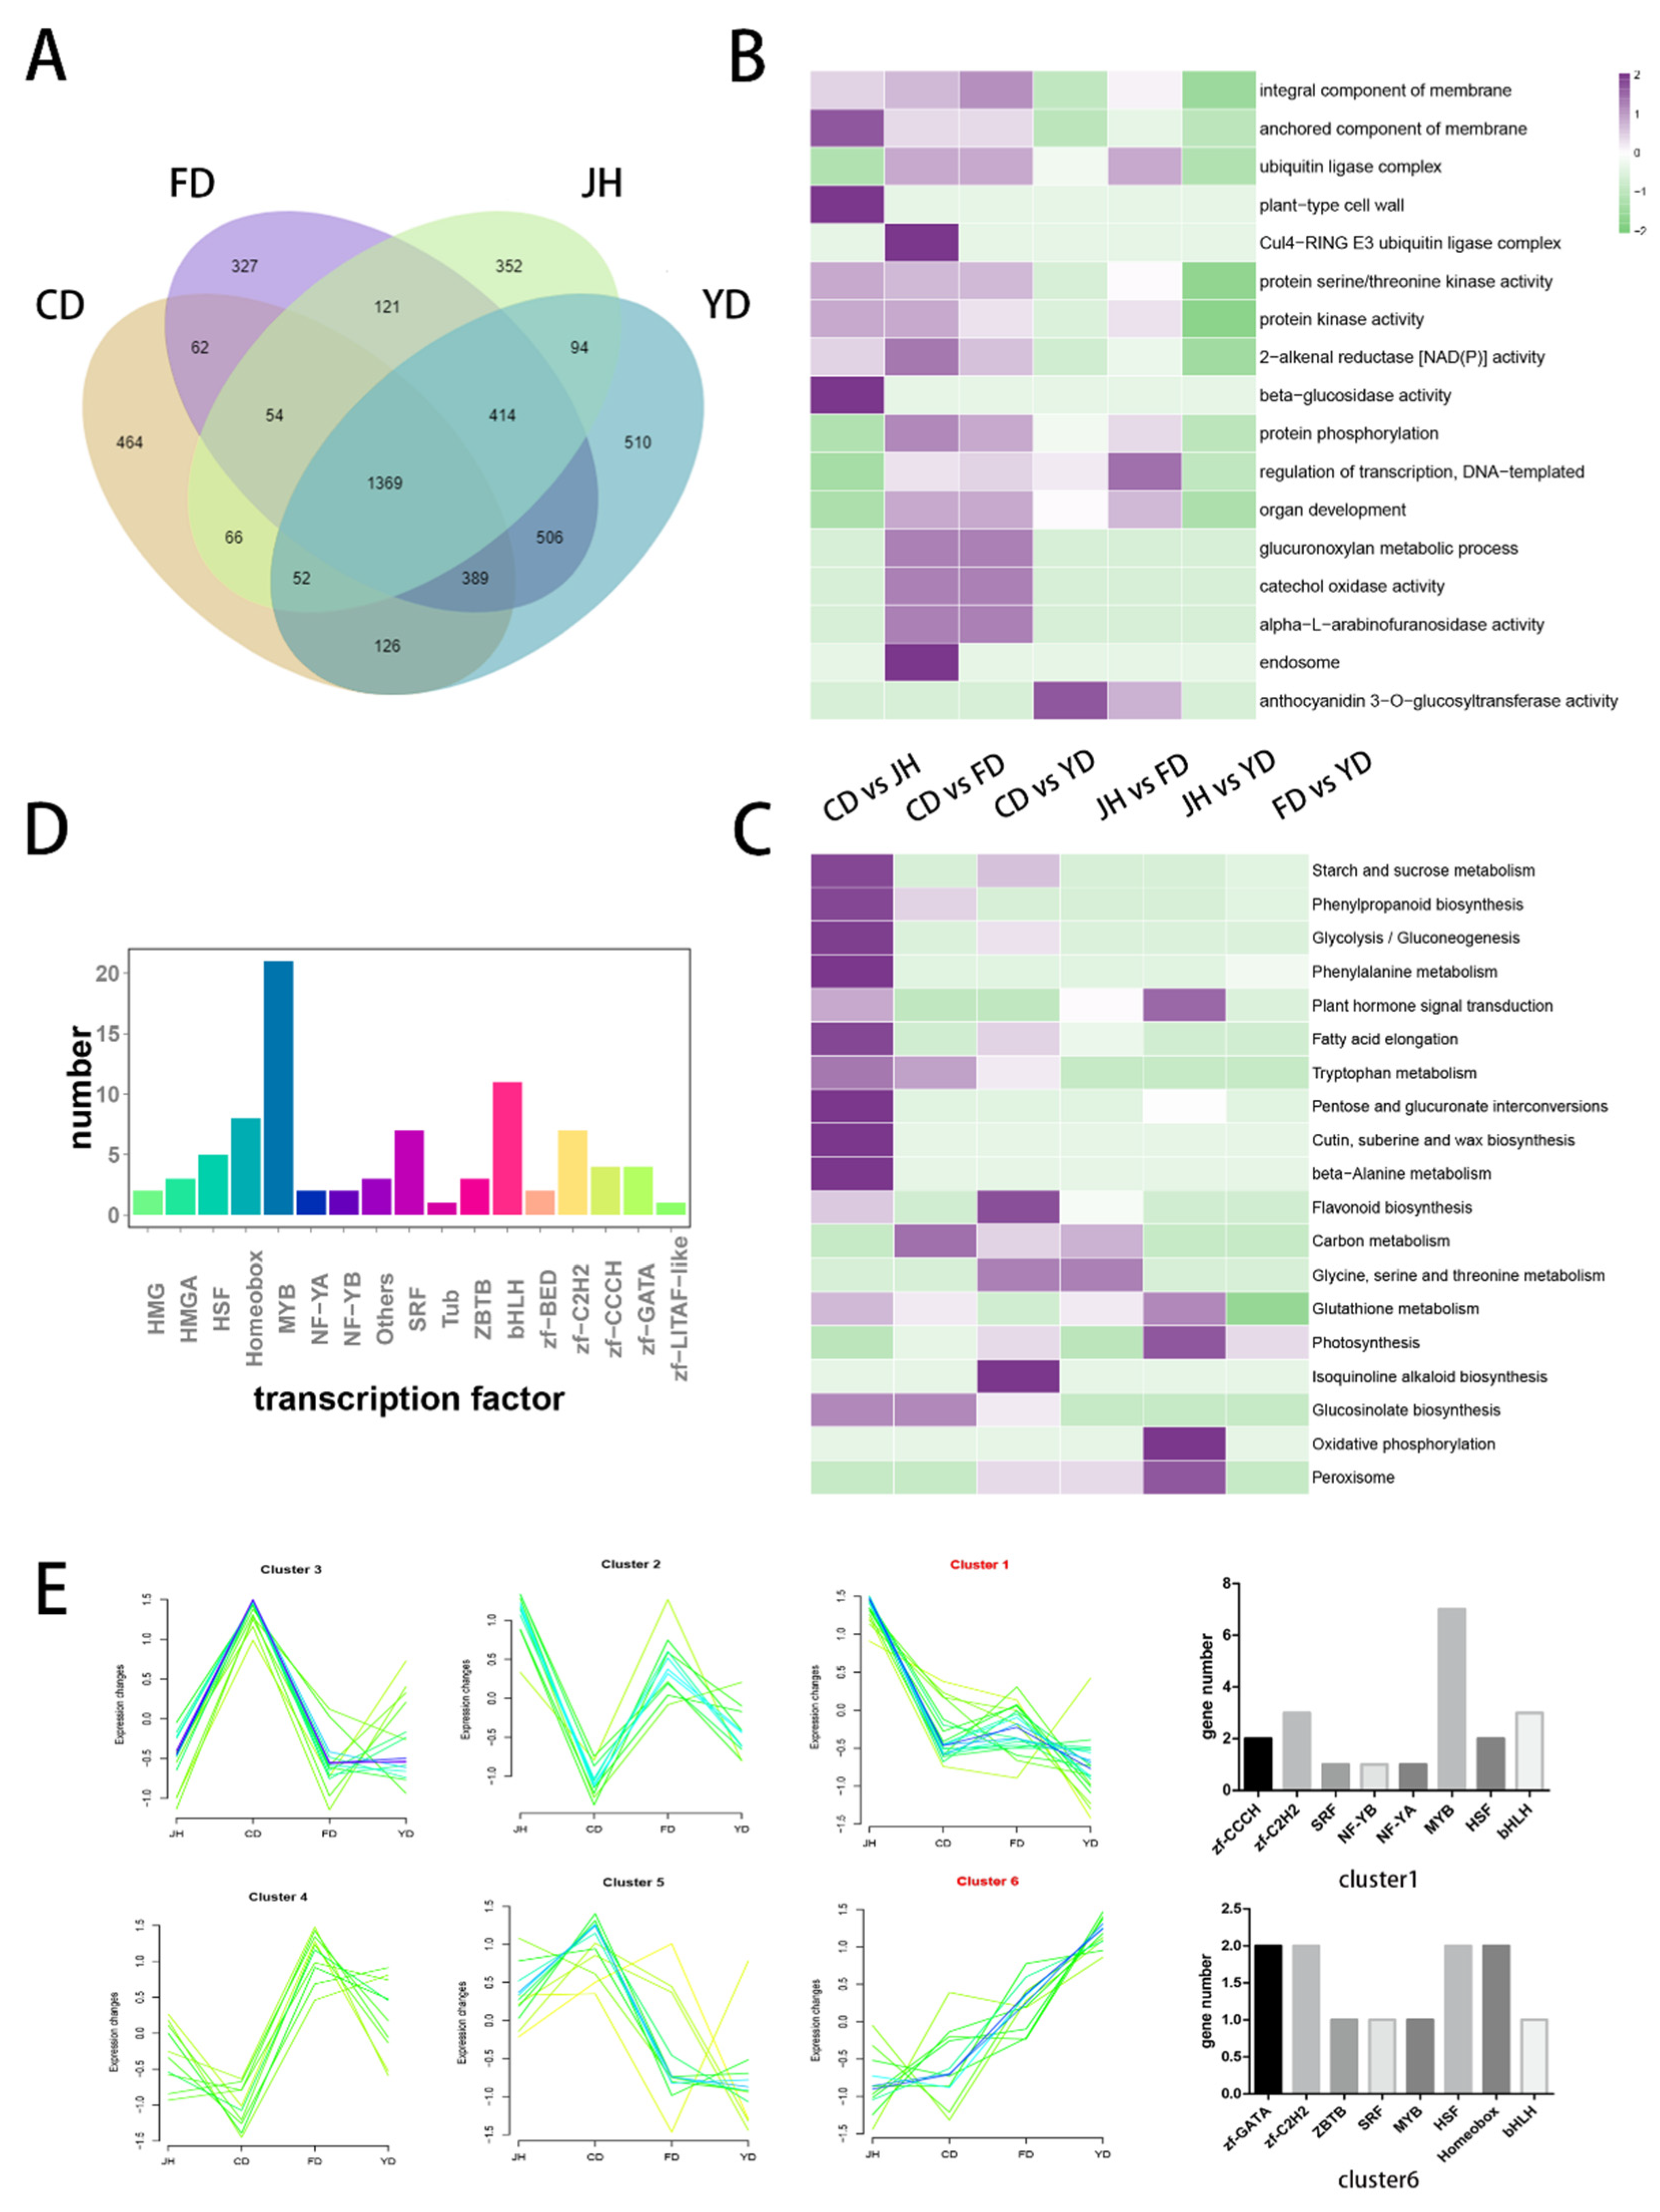
3.4. Identification of DEGs among Camellias of Different Flower Colors

The screening conditions were set to fold change ≥2 and an FDR < 0.01 to identify the DEGs. The CJ group was the control group, and 5673 genes were identified as DEGs. We identified 464 DEGs specific to the CJ vs. CD comparison; 327 DEGs were specific to the CJ vs. FD comparison; 352 DEGs were specific to the CJ vs. JH comparison, and 510 DEGs were specific to the CJ vs. YD comparison.
A total of 1653 DEGs were specific in the four groups. In addition, 1369 DEGs were shared by the four groups. The maximum number of DEGs (1531) was found in the JH vs. YD comparison (Figure 2B), suggesting that the number of DEGs was positively correlated with the color difference. The heatmap of all DEGs is shown in Figure 2C. These genes may play an important role in petal color mutations, indicating that the transcriptional mechanism of flower color change is a complex integrated network in C. japonica.
To explore the molecular mechanism for the formation of different flower colors (dark red, red, pink, and white) in C. japonica, the functional categories of the DEGs were classified into three groups (cellular components, molecular functions, and biological processes) in GO analysis. The first 17 enriched GO terms of the CD vs. JH, FD vs. YD, and CD vs. FD comparisons are shown in Figure 3B and suggest that the DEGs were primarily enriched in “catalytic activity”, “protein phosphorylation”, “regulation of transcription”, “transferase activity”, “integral components of the membrane”, and “binding” (Figure 3A and Supplementary Table S5).
These results indicate that TFs play an important role in the flower color mutation. A KEGG enrichment analysis was performed, and the top 19 pathways are shown in Figure 3B (Supplementary Table S6). The results show that the phenylalanine metabolism and flavonoid biosynthesis were significantly enriched, which are key pathways related to the formation of red petals.
Plant hormone signal transduction and glycolysis/gluconeogenesis metabolism were significantly enriched, indicating that hormones and glycosylation play a key role in white petals turning red. Glutathione metabolism and oxidative phosphorylation were other terms in the analysis. Overall, the results indicate that the formation of red petals involves complex transcription and metabolic pathways.

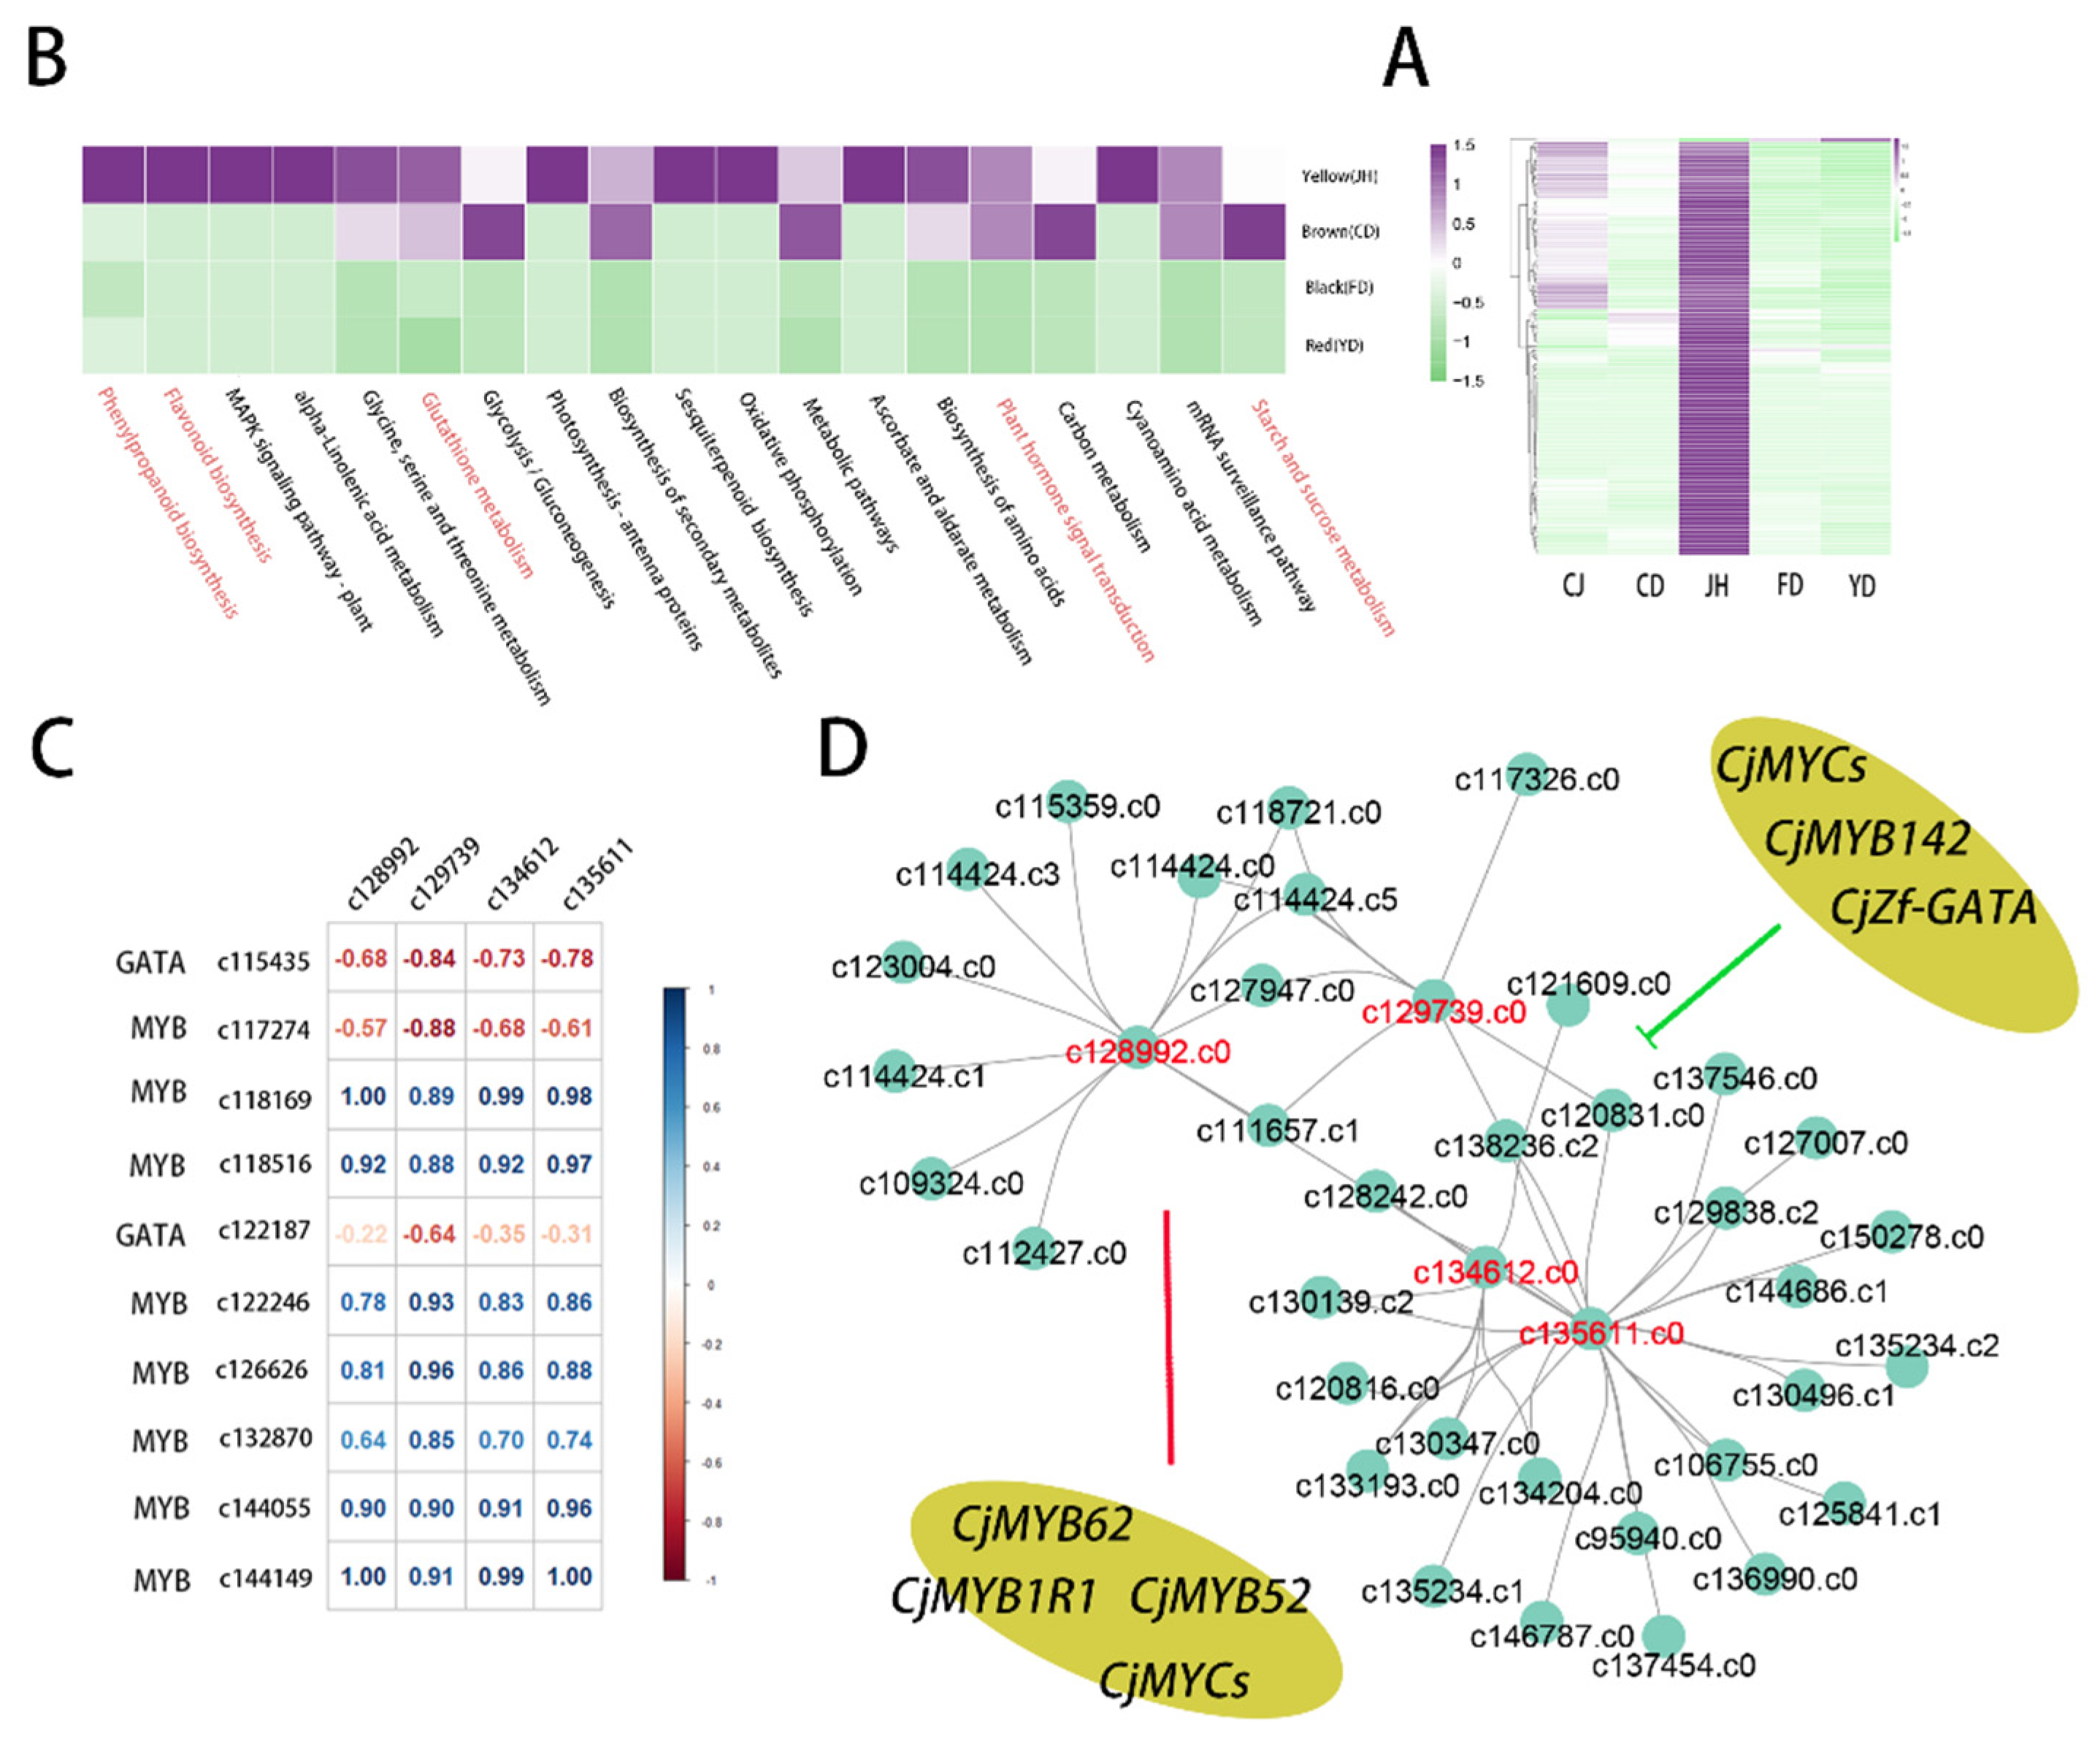
3.5. Identification and Cluster Analysis of the Transcription Factors

TFs play a key role in regulating gene expression [30]. Here, 774 transcripts were annotated as TFs. MYB was the most abundant TF family (190 TFs), followed by the bHLH family (80 TFs) (Supplementary Table S7). A total of 83 differentially expressed transcription factors (DETs) were identified in the RNA-seq data. The number of MYB-like TFs was 21. These results indicate that MYB TFs play an important role in the flower color mutation. A cluster analysis of the 87 DETs was performed using the R package ‘Mfuzz’. The number of clusters was set to six (Figure 3E), and the results showed that the number of genes in cluster 1 was the highest.
The expression patterns of clusters 1 and 6 were significantly correlated with flower color. Twenty-one TFs in cluster 1 and 12 TFs in cluster 6 were upregulated and downregulated along with anthocyanin accumulation, respectively (Figure 3E). The top three gene families in Cluster 1 were “MYB”, “bHLH”, and “HSF”. The top three gene families in Cluster 6 were “MYB”, “Homeobox”, and “HSF”.

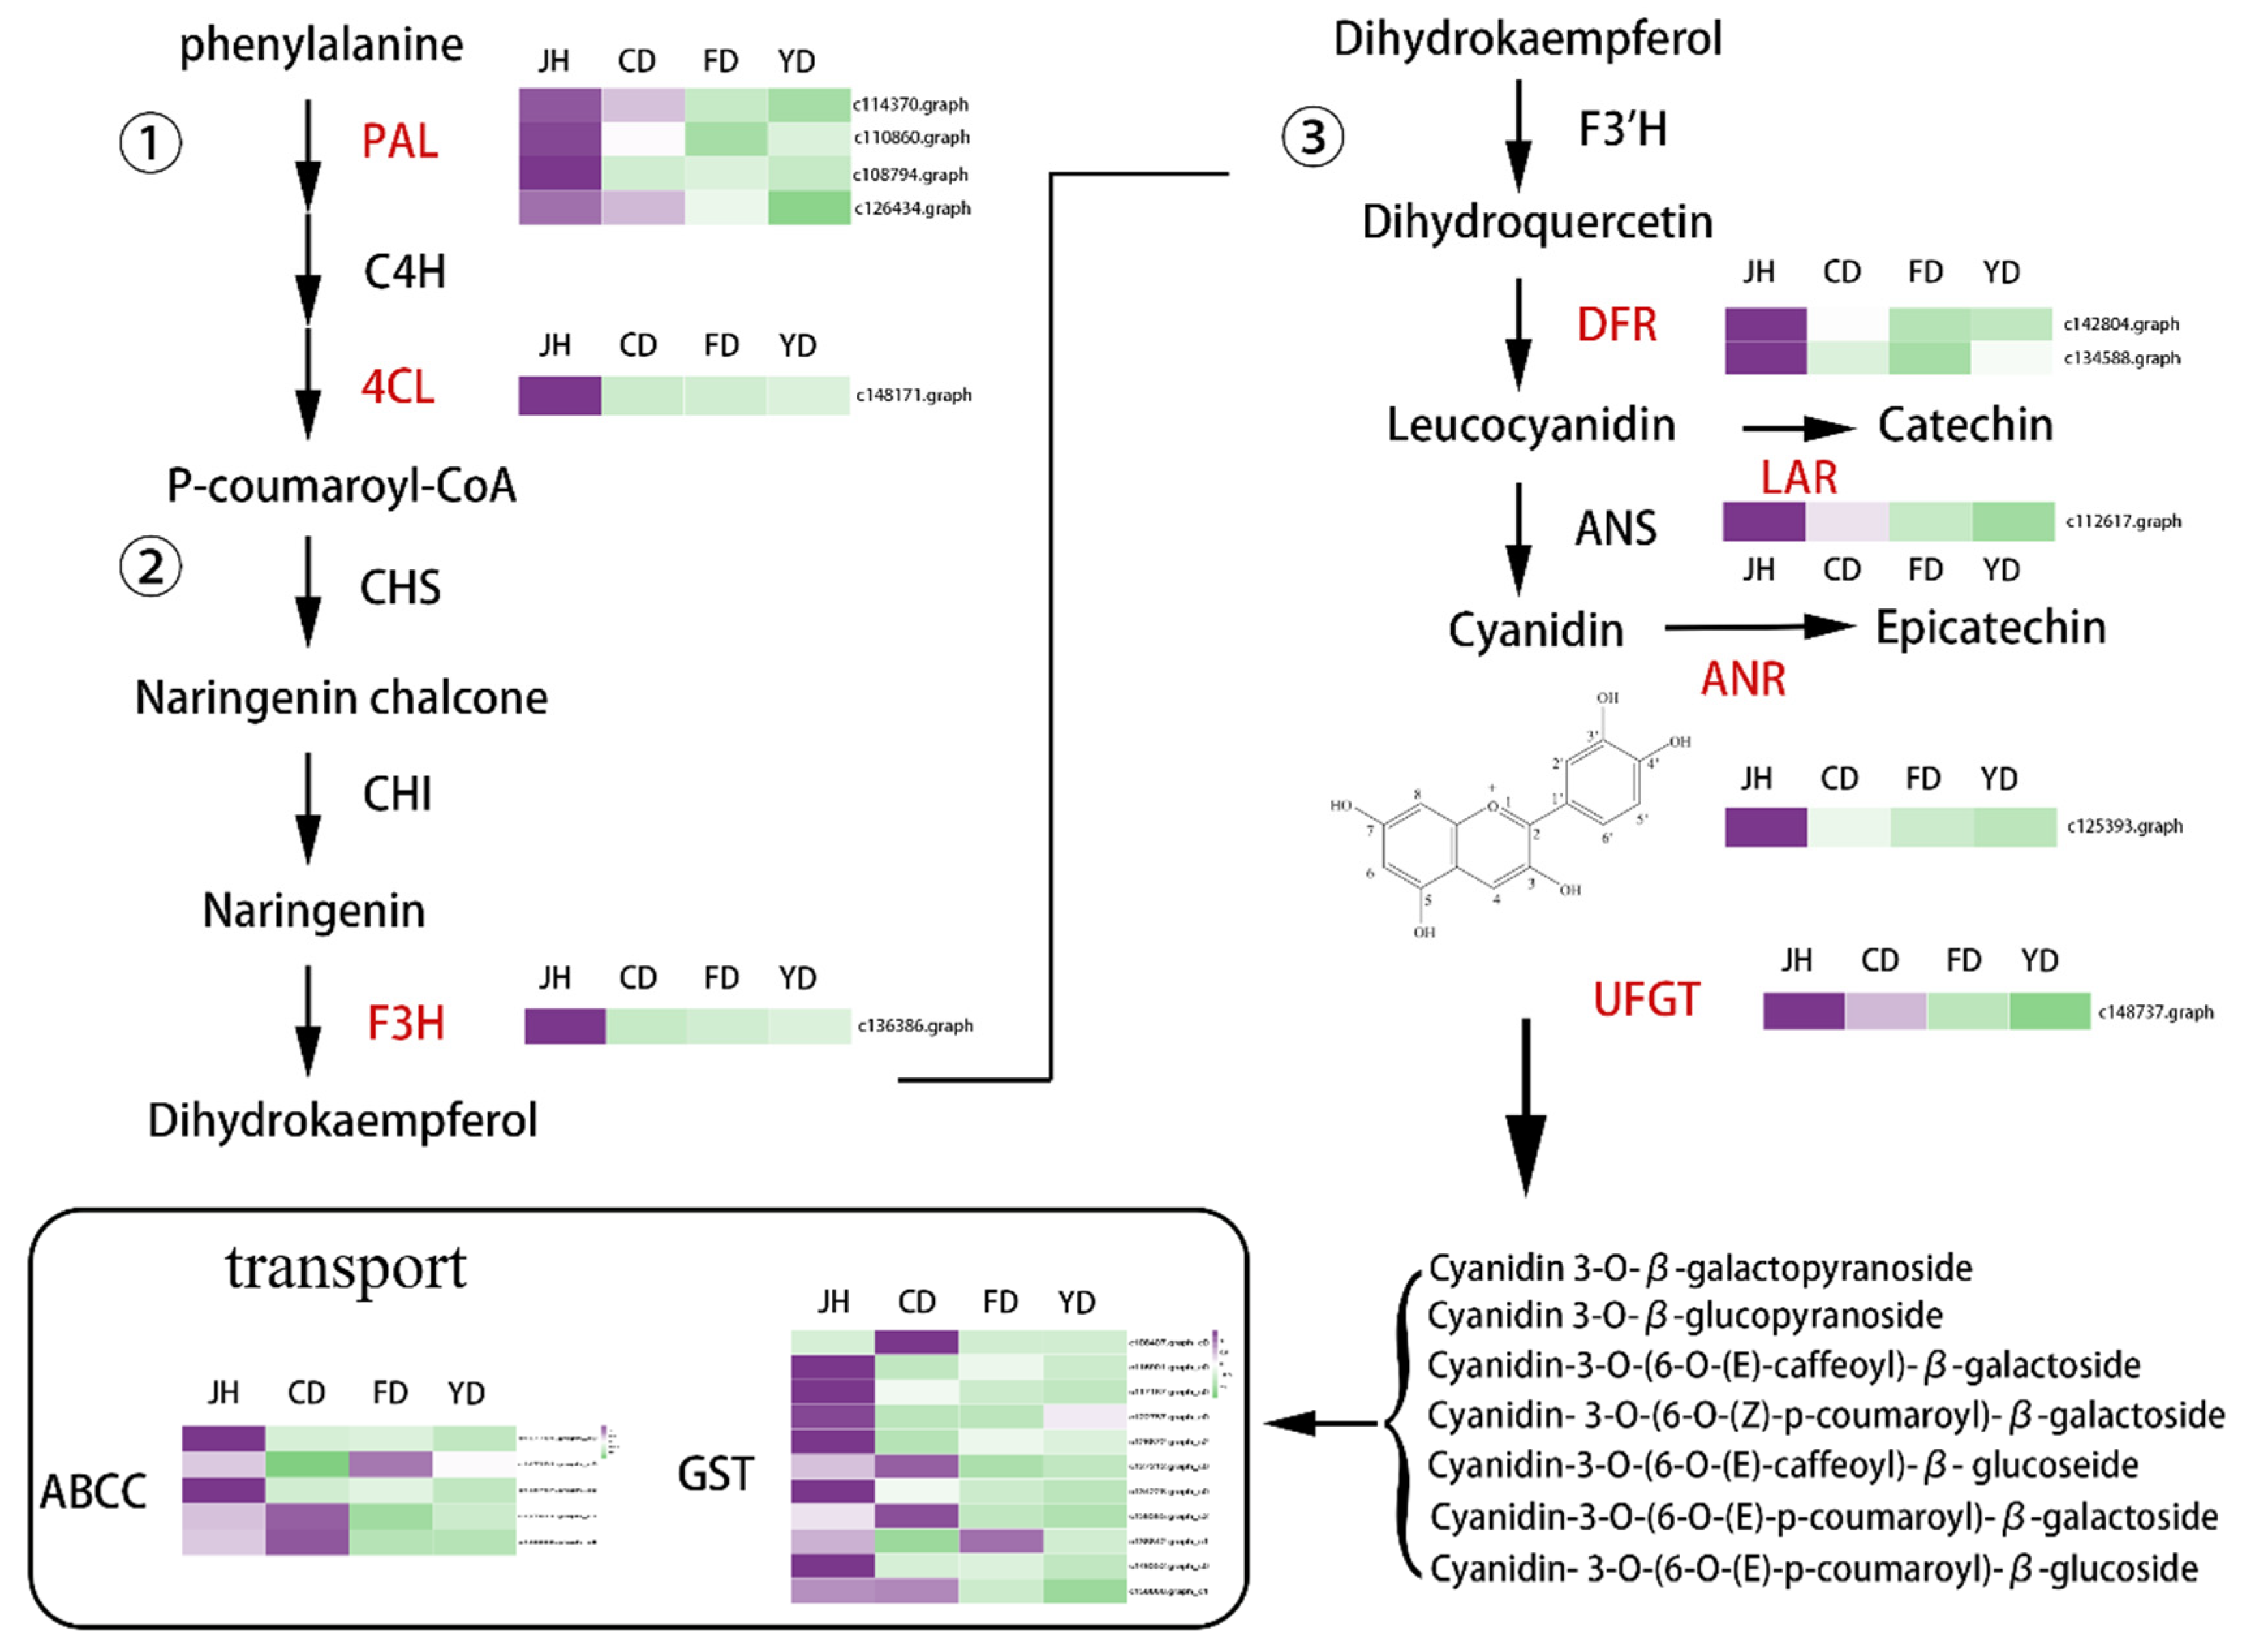
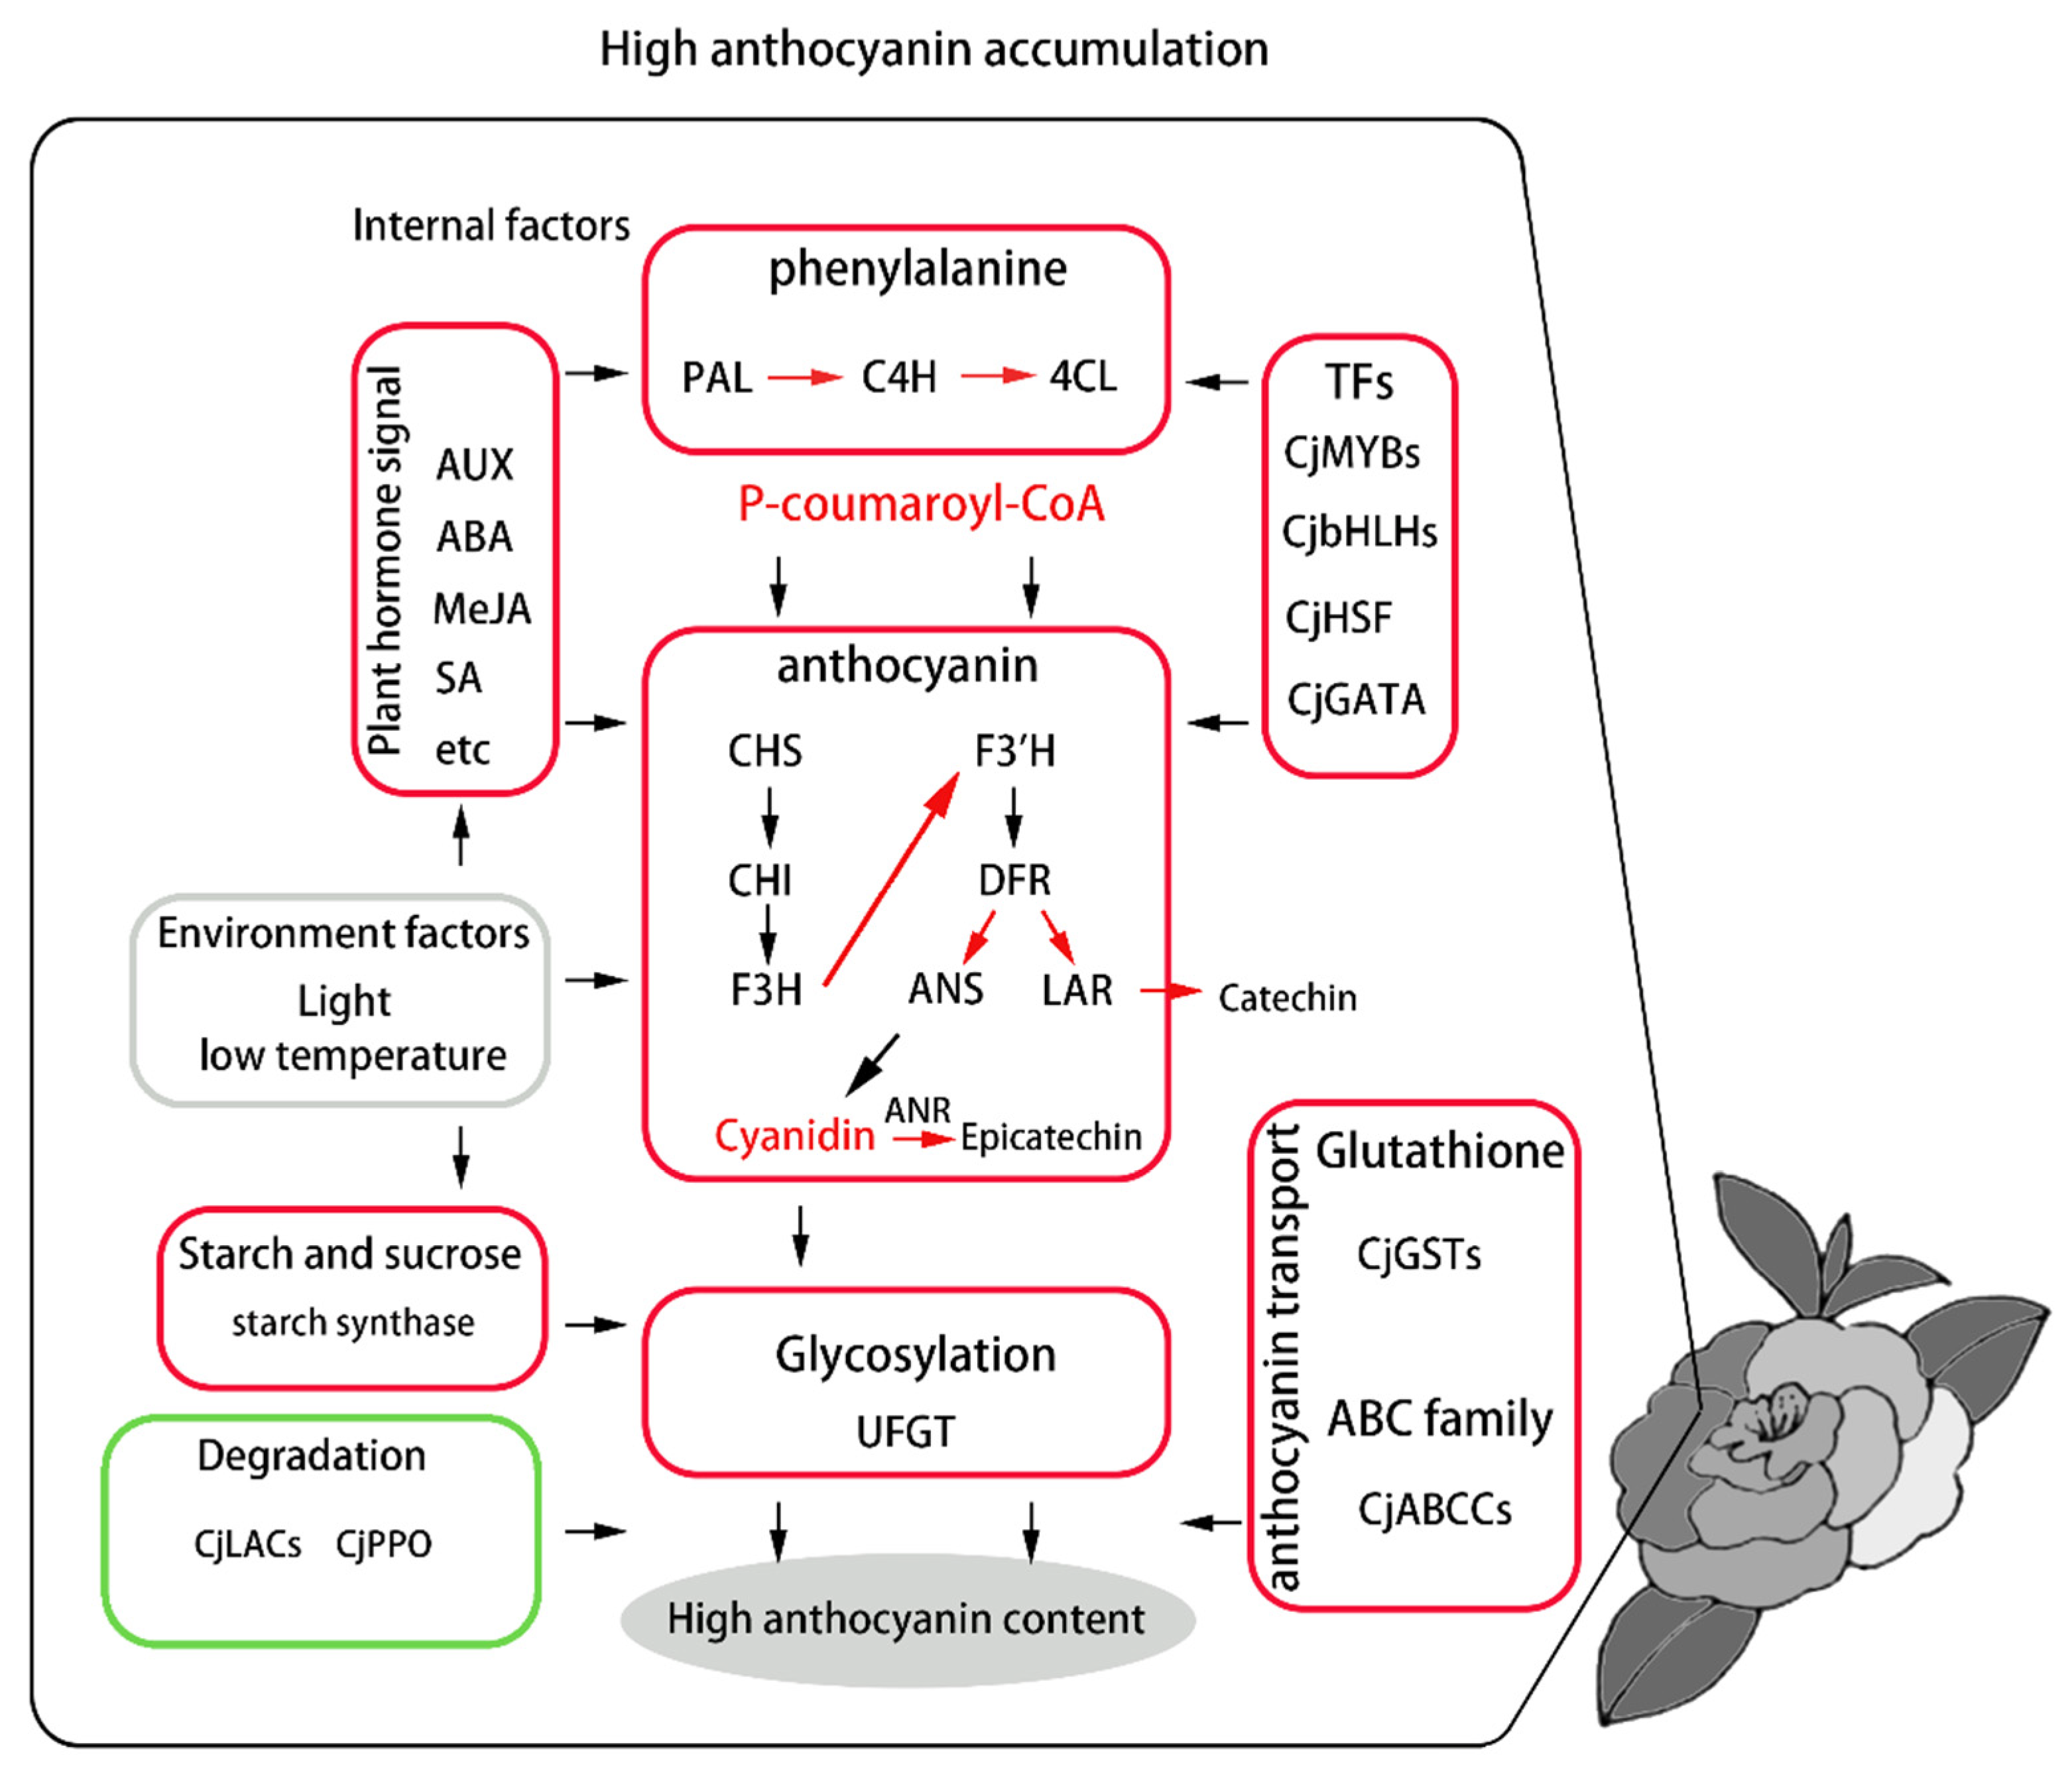
3.6. Identification of Candidate Genes Involved in Anthocyanin Biosynthesis

The anthocyanin biosynthetic pathway mainly involves the flavonoid synthetic pathway and phenylalanine metabolism. Our results show that the DEGs participating in the anthocyanin biosynthetic pathway changed as shown in the pattern diagram (Figure 4). The RNA-seq results revealed that 13 structural genes were identified as DEGs. Based on the chemical data, these genes were related to cyanidin biosynthesis, and four CjPAL (c114370, c110860, c108794, and c126434) genes, Cj4CL (c148171), two CjDFR (c142804 and c134588) genes, and one CjLAR (c125393) gene were significantly differentially expressed, which decreased along with the fading of flower color.
In addition, CjF3H (c136386) was upregulated in the CD vs. JH comparison, whereas CjLAR (c125393) was downregulated in the CD vs. YD comparison. These genes might be important structural genes that affect anthocyanin biosynthesis. Moreover, 11 CjGSTs and five CjABCCs were identified. These genes participate in anthocyanin transport, and most were highly expressed in JH. The degradation of anthocyanins plays an important role in flower color variations, and the related genes were identified, including CjLAC and CjPPO. Most of these genes decreased as anthocyanin accumulated. Overall, these genes correlated with the flower color variations.
To further explore the candidate genes related to anthocyanin synthesis, we cloned and analyzed the promoters of the above genes, and the MYB, MYC, and GATA binding sites were identified (Supplementary Table S8). CjMYBs (c118169.graph_c0, c144149.graph_c3, and c144055.graph_c0) and Cjzf-GATA (c122187.graph_c0) were identified as candidate TFs involved in the anthocyanin pathway according to the integrative promoter and correlation analyses, indicating that TFs plays an important role in anthocyanin biosynthesis (Supplementary Figure S1).
Furthermore, methyl jasmonate (MeJA)-responsiveness, the auxin-responsive element, and the anaerobic induction element were identified, providing evidence for hormones participating in anthocyanin biosynthesis. For the biosynthesis of salicylic acid (SA), two CjTGA (c128839.graph_c1 and c89768.graph_c0) genes and one CjPR (c124349.graph_c0) gene increased with deepening of the flower color.
One CjAUX (c87388.graph_c0) gene, three CjSAUR (c135789.graph_c1, c105513.graph_c0, and c147957.graph_c0) genes, and four CjGH3 (c126080.graph_c1, c123358.graph_c1, c120150.graph_c0, and c134550.graph_c3) genes involved in the auxin pathway were identified as DEGs. Furthermore, one CjPP2C (c89768.graph_c0) in the abscisic acid (ABA) pathway decreased as flower color deepened. These genes provide evidence for hormones participating in the changes in flower color.

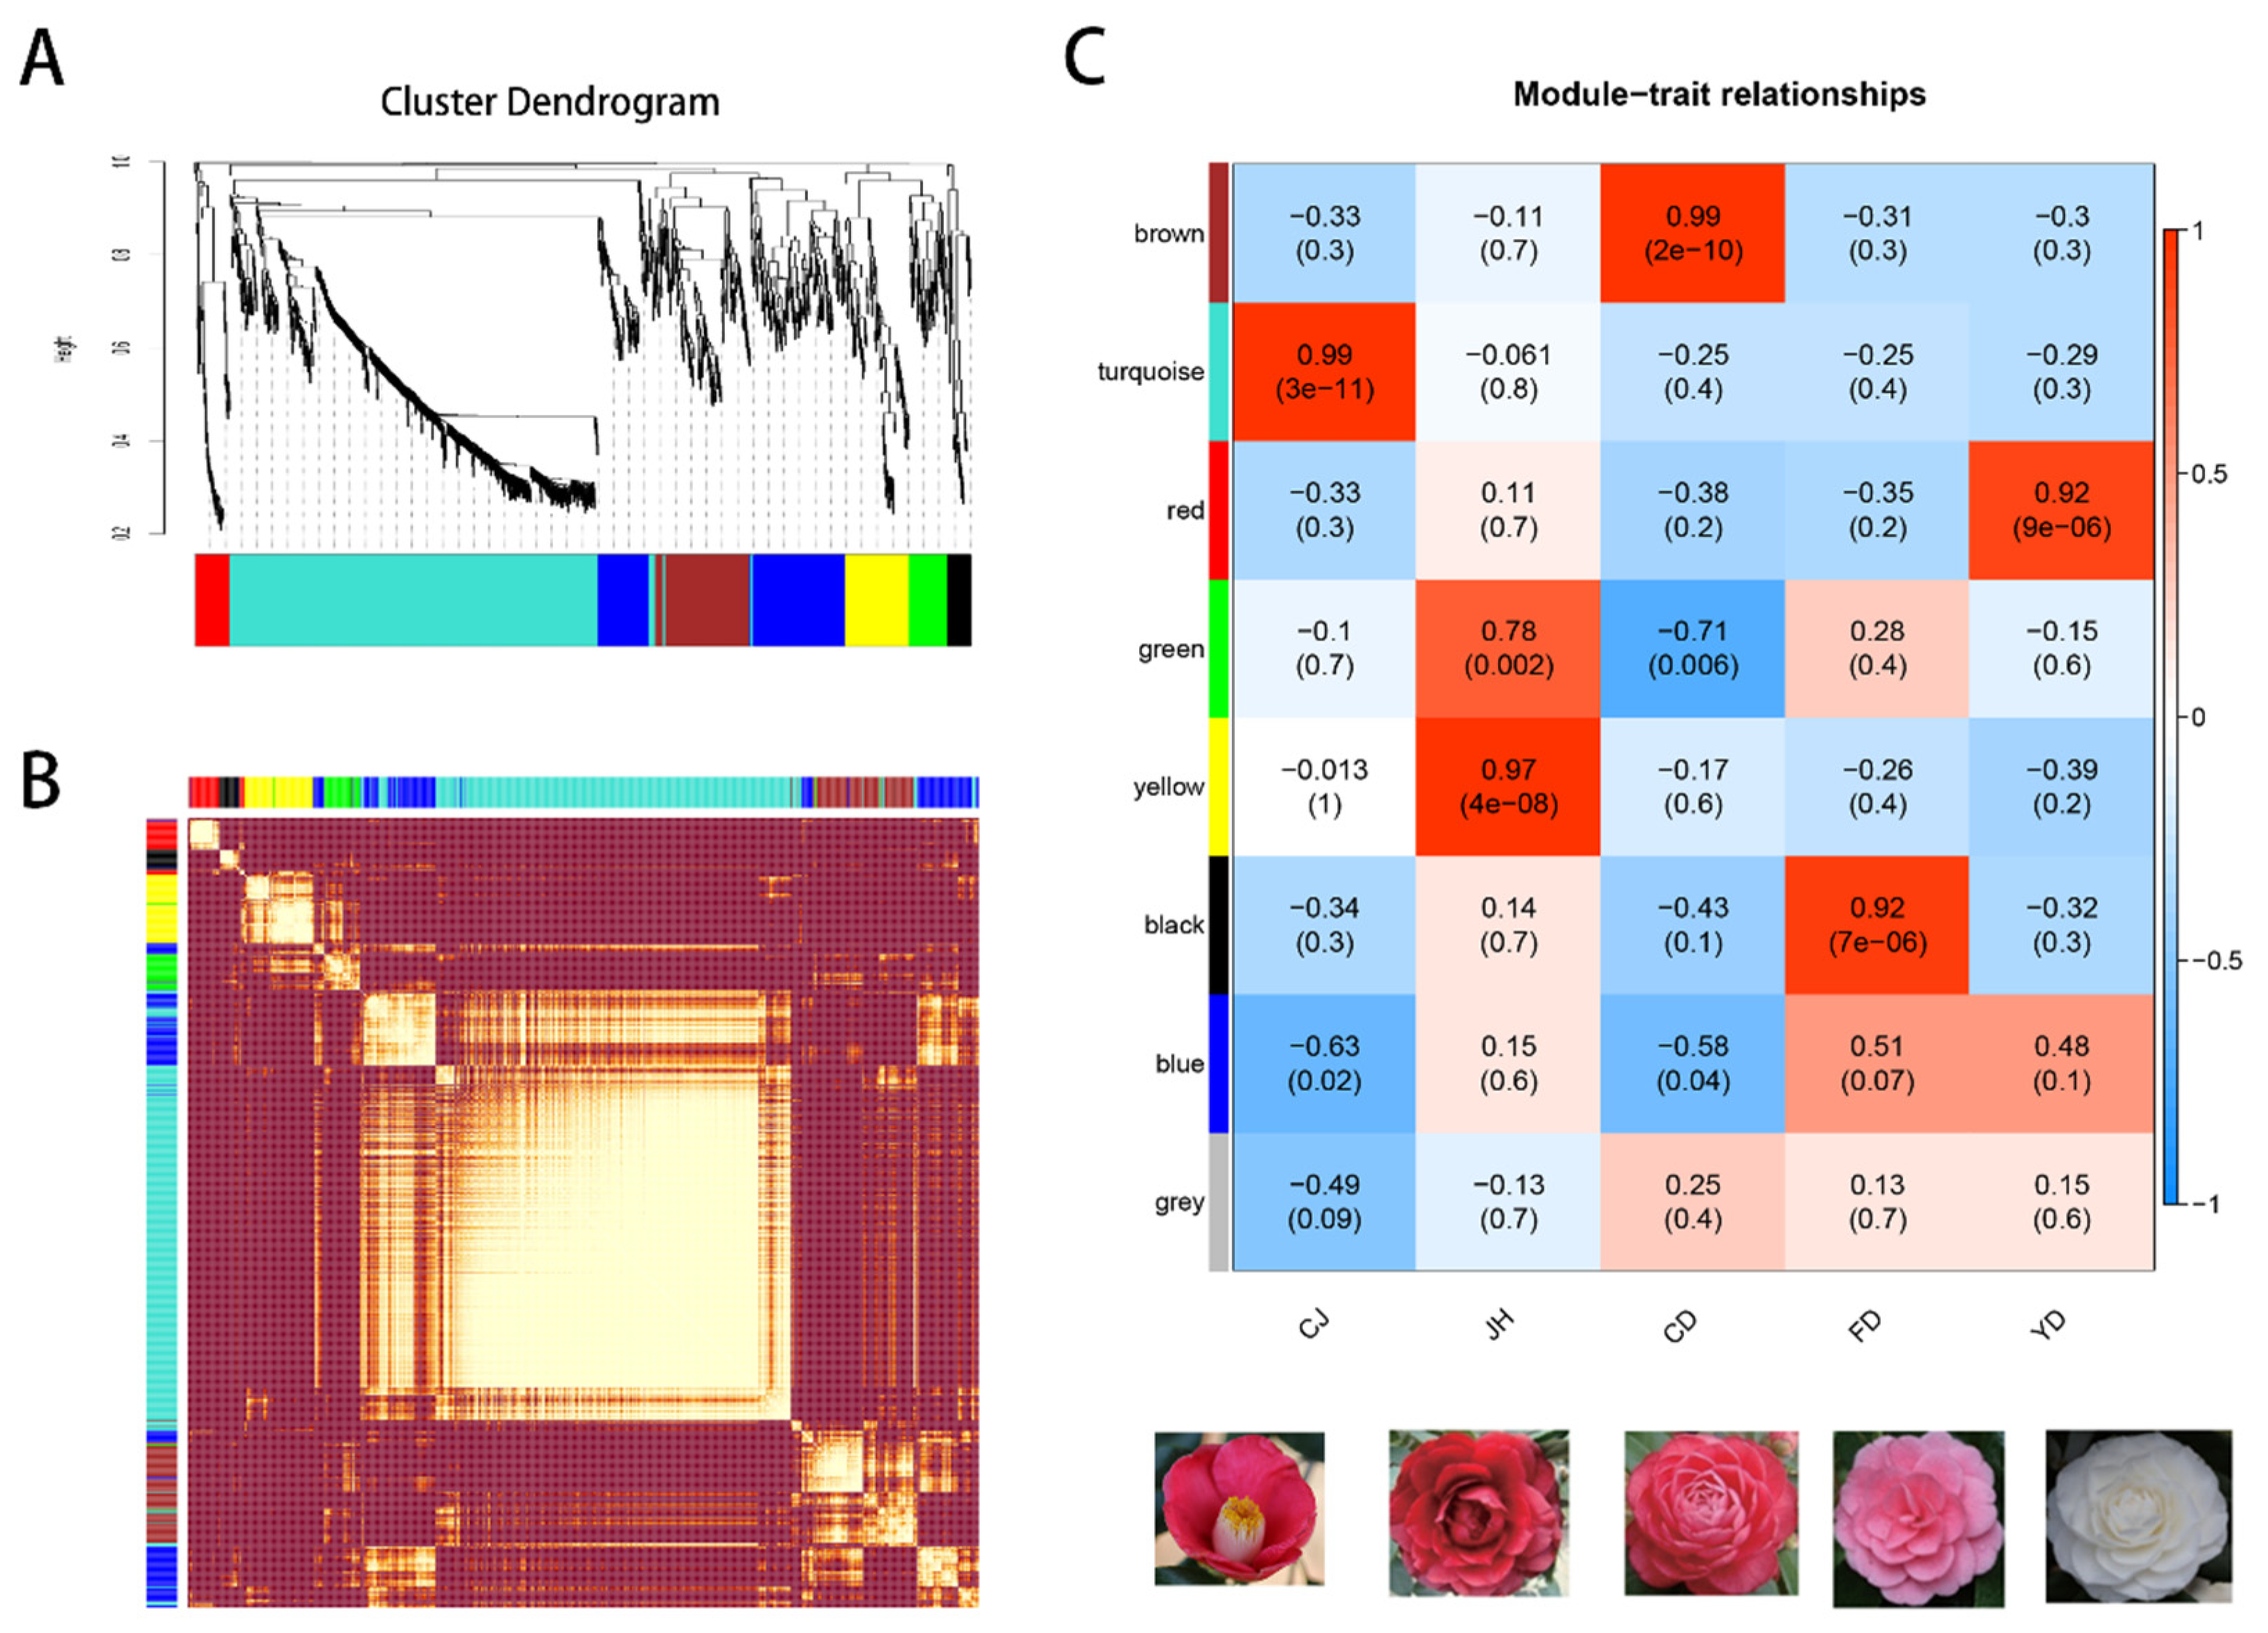
3.7. The Co-Expression Modules Related to High-Anthocyanin Accumulation in Petals

A WGCNA was performed to identify the hub network related to high anthocyanin accumulation. A total of 1418 genes made the largest contributions to 25% of the variance and were screened from 5673 DEGs to construct the modules. Power 18 was settled to obtain relatively balanced scale independence and connectivity of the results. Eight modules (brown, turquoise, red, green, yellow, black, blue, and grey) were identified (Figure 5A).
The TOM plot suggested almost no correlation among these modules but a high correlation within modules (Figure 5B). Thus, our results are reliable. The yellow module was significantly positively correlated with JH (the highest anthocyanin content in the five samples) (r = 0.97, p = 4 × 10⁻⁸; Figure 5C). In contrast, the negative correlation between the yellow module and petal redness increased as anthocyanin content decreased, indicating that the yellow module contained a hub genetic component related to anthocyanin accumulation.
The expression trend of the genes in the yellow module is shown in Figure 6A. These genes were only overexpressed in JH, suggesting that genes in the yellow module are related to a high anthocyanin content. The 19 enriched KEGG pathways are shown in Figure 6B, ‘Phenylpropanoid biosynthesis’, ‘flavonoid biosynthesis’, ‘plant hormone signal transduction’, and ‘starch and sucrose metabolism’ were enriched.
In addition, one gene (c136386.graph_c0) from the flavonoid biosynthetic pathway and six genes (c135611.graph_c0, c144556.graph_c0, c128992.graph_c0, c134612.graph_c0, c129739.graph_c0, c120831.graph_c0, and c137350.graph_c0) involved in the phenylpropanoid biosynthetic pathway were highly enriched in the yellow module, indicating that these genes are possible regulators of high anthocyanin accumulation.
To further explore the traditional mechanism of anthocyanin accumulation, the promoters of some genes were cloned to predict the cis-acting element and identify the binding site of traditional factors. The results suggested some of the binding sites, such as the MYB and MYC binding sites (Supplementary Table S8). CjMYB62 (c118169.graph_c0), CjMYB1R1 (c118516.graph_c1), CjMYBs (c122246.graph_c0, c132870.graph_c0, and c144055.graph_c0), CjMYB52 (c144149.graph_c3), and CjMYB142 (c117274.graph_c0) were tentatively screened by integrative binding site and expression pattern analyses. Finally, the potential co-expression network related to anthocyanin accumulation was constructed using genes from the yellow module (Figure 6C).

3.8. Quantitative Real-Time PCR Verification of the Transcriptome Data

To check the validity of the RNA-seq results, the expression patterns of six candidate genes were determined in all samples by qRT-PCR (Supplementary Figure S2). The expression levels of starch synthase 4 (c137365) and UDP-glucosyl transferase 74B1 (c139663) decreased dramatically along with the reduction of redness in the petals, indicating that starch synthase 4 and UDP-glucosyl transferase 74B1 regulate the biosynthesis of anthocyanins by affecting glycosylation. Similarly, aquaporin protein 9 (c119563) was expressed at the highest level in C. japonica ‘JinBiHuiHuang’. In addition, the expression level of GATA TF 24 increased along with anthocyanin accumulation. The qRT-PCR results were consistent with the RNA-seq data, demonstrating that our transcriptome data of C. japonica petals are reliable.

4. Discussion

Bud sport is a common reason for color variations in plants. Most azalea varieties are color sports, which may be the result of transposon-mediated changes in pigment genes [3]. A series of bud sport cultivars from C. japonica, e.g., JH, CD, FD, and YD, with colors ranging from white to dark red, provided the material to explore the bud sport phenotype. Flower color is an important ornamental evaluation index. The contents and components of pigments are key factors that affect the brightness of petals [31].
Flavones and flavonols provide yellowness [32], while anthocyanins are correlated with redness [33], such as the red leaves in Eucommia ulmoides [34], purple-fleshed sweet potato [35], and grape berries [36]. In our results, red petals formed due to anthocyanin accumulation. The anthocyanin content was positively correlated with the a* value within a certain range (0–40.6).
Interestingly, the continual increase of anthocyanin content in JH significantly raised the h* value, but the a* value did not change significantly. These results are consistent with a previous study reporting that reducing anthocyanin content decreases the a* value [37], and the h* value describes seven color tones (red, orange, yellow, green, cyan, blue, and purple) [38].
Six common anthocyanins are pelargonidin, cyanidin, delphinidin, peonidin, petunidin, and malvidin [39]. Cyanidin correlates with redness, and delphinidin contributes to a blue-purple color [40]. Our biochemistry data suggested that only cyanidins were detected in the C. japonica samples, corroborating our previous result [13], e.g., the red petals of C. japonica mainly contain cyanidins. Furthermore, the stability of anthocyanins increases by binding to glycosides [41]. Here, seven cyanidin molecular structures were identified, which were involved in the binding of glucoside, glucopyranoside, caffeoyl, and coumaroyl.
Cy3G contributed the most to the pink, red, and crimson phenotypes in all C. japonica used in the experiment. The proportion of Cy3Ga in CD was not significantly different from that in FD but was significantly enhanced in JH, indicating that Cy3Ga plays an important role in the formation of the crimson phenotype. The proportion of Cy3GaEpc and Cy3GEpc decreased along with the deepening of petal redness. We speculate that the importance of Cy3GaEpc and Cy3GEpc is lower than that of Cy3Ga and Cy3G in the crimson phenotype. This result was consistent with a previous study reporting that Cy3G is the main anthocyanin in the red petals of peach [42].
The anthocyanin biosynthetic pathway was reported [43], and a transcriptomic analysis showed that 13 candidate structural genes involved in anthocyanin biosynthesis were identified as DEGs. Most of these genes were downregulated along with a reduction in anthocyanin content. Cyanidin-like glucoside biosynthesis in camellias occurs as follows. The first step is phenylalanine ammonia-lyase (PAL), cinnamate-4-hydroxylase (C4H), and 4-coumarate-CoA ligase (4Cl) promote the conversion of phenylalanine to coumarate-CoA [44].
In our results, four PAL and one 4CL gene were identified as DEGs. Unlike previous studies, C4H is not differentially expressed in Malus halliana [45], indicating that CjPAL and Cj4CL are the main DEGs affecting phenylalanine biosynthesis in C. japonica. The second step is that chalcone synthase (CHS) and chalcone isomerase (CHI) promote the conversion of 4-coumaroyl-CoA to naringenin and flavanone 3-hydroxylase (F3H) promotes the synthesis of dihydrokaempferol. The transcriptome analysis of Paeonia petals revealed that the PsCHS and PsF3H genes are differentially expressed and related to flower color [46].
In our results, CjF3H was upregulated, while CjCHS was not significantly upregulated. The third step is the formation of dihydroquercetin catalyzed by flavonoid-3′-monooxyg- enase (F3′H). Then, cyanidin is synthesized by dihydroflavonol 4-reductase (DFR) and anthocyanidin synthase (ANS). Lastly, cyanidins bind to glucosides under the action of UDP-glucose transferase (UFGT). In our results, one F3′H, two DFR, and one UFGT were identified as DEGs.
These results combined with our chemical data indicate that the expression pattern of these DEGs was consistent with the seven types of cyanidin synthesis, particularly that of Cy3G. Furthermore, CjANR and CjLAR were significantly downregulated in C. japonica ‘YuDan’. Catechin and epicatechin are often considered colorless substances, while previous studies have shown that catechins affect the transcriptional balance of F3′H and F3′5′H in the white leaves of Camellia sinensis [32], and higher concentrations of catechins accelerate the anthocyanin coloring reaction [47].
In addition, catechins have strong antioxidant properties [48]. Our GO enrichment analysis of the DEGs revealed that oxidation reactions play an important role in flower color variations. GST may be involved in anthocyanin transport in Petunia hybrida [49]. We found that the expression levels of seven CjGSTs and two CjABCCs were significantly higher in JH, indicating that these genes promote the transport of anthocyanins.
The degradation of anthocyanins affects their content [50], which involves laccase (LAC) [51]. In our results, the expression patterns of three LAC and four PPO coding genes were negatively correlated with the deepening of the red flower color, as these genes are critical regulators of anthocyanin degradation.
Although hormones play an important role in flower development, their effect on flower color is largely unknown. In our results, some genes involved in ABA, indole acetic acid (IAA), and SA signal transduction were identified as DEGs, including CjSAUR, CjAUX, CjTGA, CjGH3, and CjPP2C. High expression levels of auxin-responsive genes promote the biosynthesis of anthocyanins [52].
The expression level of CjAUX increased in the crimson petal phenotype. Treating green fruit with exogenous ABA promotes anthocyanin accumulation [53]. Similarly, we observed that one CjPP2C gene was downregulated as the flowers faded. The SA signaling pathway mediates anthocyanin synthesis in A. thaliana [54]. The changes in genes in the hormone signal transduction pathways may regulate the variations in flower color.
TFs play important roles in regulating anthocyanin biosynthesis [55]. Many studies have shown that MYB-like transcription factors directly regulate anthocyanin biosynthesis [56]. AtMYB12 is a flavanol-specific regulator of phenylpropanoid biosynthesis in A. thaliana [57]. The expression level of MhMYB10 is downregulated during the flower color fading period and is related to the expression of anthocyanin biosynthetic genes in the petals of Malus halliana [45], thus, indicating its important role in the anthocyanin biosynthetic pathway by regulating the expression of MpDFR and MpANS in Malus pumila [58].
Our results show that 21 MYB TFs were identified as DETs, and the expression levels of six CjMYBs were upregulated with deepening flower color (CjMYB62, CjMYB1R1, and CjMYB85). Furthermore, a previous study showed that bHLH TFs regulate ANS expression by forming the MBW complex [59]. Here, cluster analysis showed that the expression patterns of four CjbHLHs (CjbHLH51, CjBEE3, CjbHLH75, and CjbHLH117) were significantly correlated with anthocyanin accumulation. bHLH1 and bHLH2 control different pigments pattern by regulating structural genes of anthocyanin biosynthesis [60]. These results reveal that CjMYB and CjbHLH TFs play important roles in regulating anthocyanin biosynthesis in C. japonica.
High anthocyanin accumulation involves different metabolic pathways, such as glycosylation and oxidation [61]. In this study, the regulatory network for the formation of the crimson phenotype in JH was predicted. MYB and GATA interacted with the binding sites on the promoters of genes related to phenylpropanoid synthesis. Furthermore, ARE, MeJA, light, and IAA were also identified. Auxin inhibits the biosynthesis of anthocyanins in apple [52], and anthocyanin content increases after a MeJA treatment [62]. Overall, anthocyanin accumulation may be regulated by hormones and environmental factors.

5. Conclusions

In summary, the chemical and transcriptomic analyses provided evidence for the pigment composition and genes related to anthocyanin biosynthesis in C. japonica. Among the seven anthocyanins identified, Cy3G was the main pigment. The 13 structural genes (e.g., CjPAL, Cj4CL, CjF3′H, CjDFR, CjANR, and CjLAR) and 33 TFs (MYB, HSF, bHLH, GATA, and others) were hub regulators affecting the variations in flower color.
In addition, a predicted potential module (Figure 7) explained the high anthocyanin accumulation in C. japonica ‘JinBiHuiHuang’, indicating that increased phenylpropanoid promoted the deepening of redness in petals and that a high expression level of beta-glucosidase promoted anthocyanin glycosylation. This genetic information will be helpful for breeding studies of C. japonica floral color.

Supplementary Materials

The following supporting information can be downloaded at: https://www.mdpi.com/article/10.3390/horticulturae8020129/s1. Figure S1. The correlation analysis of TFs and candidate genes, Figure S2. The expression level analysis of RT-qPCR and transcriptome, Table S1. The primer of promoter cloned and RT-qPCR, Table S2. The raw data of chroma values, Table S3. The raw data of anthocyanin content, Table S4. Summary of sequencing quality, Table S5. The GO enrichment analysis of DEGs, Table S6. The KEGG enrichment analysis of DEGs, Table S7. The classification of transcription factors, Table S8. The identified cis-acting element.

Author Contributions

M.F. conducted the data analysis and wrote the manuscript; X.L. and H.Y. conceived and designed the experiments; Y.Z. and M.Y. performed the experiments; S.W. and J.L. contributed plant material. All authors have read and agreed to the published version of the manuscript.

Funding

This work was supported by National Key R&D Program of China [2020YFD1000500] and Zhejiang Basic and Public Welfare Research Program [LGN20C160006].

Institutional Review Board Statement

Not applicable.

Informed Consent Statement

Not applicable.

Data Availability Statement

The datasets generated and/or analyzed during this study are included in this article, its supplementary information files, or the [NCBI] repository with Accession number: PRJNA757193 [https://www.ncbi.nlm.nih.gov/sra/PRJNA757193] (accessed on 20 December 2021).

Acknowledgments

The authors are grateful to the editors and referees for their valuable comments to improve our manuscript. In addition, Menglong Fan wants to thank the invaluable support received from Rui Zhou.

Conflicts of Interest

The authors declare no conflict of interest.

References

  1. Farcuh, M.; Toubiana, D.; Sade, N.; Rivero, R.M.; Doron-Faigenboim, A.; Nambara, E.; Sadka, A.; Blumwald, E. Hormone balance in a climacteric plum fruit and its non-climacteric bud mutant during ripening. Plant Sci. 2019, 280, 51–65. [Google Scholar] [CrossRef] [PubMed]
  2. Lu, C.F.; Pu, Y.; Liu, Y.T.; Li, Y.J.; Qu, J.P.; Huang, H.; Dai, S.L. Comparative transcriptomics and weighted gene co-expression correlation network analysis (WGCNA) reveal potential regulation mechanism of carotenoid accumulation in Chrysanthemum × morifolium. Plant Physiol. Biochem. 2019, 142, 415–428. [Google Scholar] [CrossRef] [PubMed]
  3. Morimoto, H.; Narumi-Kawasaki, T.; Takamura, T.; Fukai, S. Flower color mutation caused by spontaneous cell layer displacement in carnation (Dianthus caryophyllus). Plant Sci. 2020, 299, 110598. [Google Scholar] [CrossRef] [PubMed]
  4. Chen, Y.; Mao, Y.; Liu, H.; Yu, F.; Li, S.; Yin, T. Transcriptome analysis of differentially expressed genes relevant to variegation in peach flowers. PLoS ONE 2014, 9, e90842. [Google Scholar] [CrossRef] [PubMed]
  5. Zhao, Y.; Zhao, X.; Zhao, S.; Han, N. A novel bud sport from the ‘Benitaka’ table grape cultivar (Vitis vinifera L.) improves sugar and anthocyanin accumulation at the berry ripening stage. S. Afr. J. Bot. 2015, 97, 111–116. [Google Scholar] [CrossRef]
  6. Qian, M.; Sun, Y.; Allan, A.C.; Teng, Y.; Zhang, D. The red sport of ‘Zaosu’ pear and its red-striped pigmentation pattern are associated with demethylation of the PyMYB10 promoter. Phytochemistry 2014, 107, 16–23. [Google Scholar] [CrossRef]
  7. Wessinger, C.A.; Hileman, L.C.; Rausher, M.D. Identification of major quantitative trait loci underlying floral pollination syndrome divergence in Penstemon. Philos. Trans. R. Soc. B Biol. Sci. 2014, 369, 20130349. [Google Scholar] [CrossRef] [Green Version]
  8. Zhao, D.Q.; Wei, M.R.; Liu, D.; Tao, J. Anatomical and biochemical analysis reveal the role of anthocyanins in flower coloration of herbaceous peony. Plant Physiol. Biochem. 2016, 102, 97–106. [Google Scholar] [CrossRef]
  9. Li, X.; Wang, J.; Yin, H.; Fan, Z.; Li, J. Variation of flower colors and their relationships with anthocyanins in cultivars of camellia japonica. J. Ecol. Rural. Environ. 2019, 35, 1307–1313. [Google Scholar]
  10. Xie, R.; Zheng, L.; He, S.; Zheng, Y.; Deng, L. Anthocyanin biosynthesis in fruit tree crops: Genes and their regulation. Afr. J. Biotechnol. 2014, 10, 19890–19897. [Google Scholar] [CrossRef]
  11. Rodrigues, J.A.; Espley, R.V.; Allan, A.C. Genomic analysis uncovers functional variation in the C-terminus of anthocyanin-activating MYB transcription factors. Hortic. Res. 2021, 8, 77. [Google Scholar] [CrossRef] [PubMed]
  12. Li, J.B.; Hashimoto, F.; Shimizu, K.; Sakata, Y. A new acylated anthocyan inform the red flowers of Camellia hongkongensis and characterization of anthocyanins in the Section Camellia species. J. Plant Ecol. 2009, 51, 545–552. [Google Scholar] [CrossRef]
  13. Li, J.B.; Hashimoto, F.; Shimizu, K.; Sakata, Y. Anthocyanins from the red flowers of Camellia saluenensis Stapf ex Bean. J. Jpn. Soc. Hortic. Sci. 2008, 77, 75–79. [Google Scholar] [CrossRef] [Green Version]
  14. Wang, L.S.; Shiraishi, A.; Hashimoto, F.; Aoki, N.; Shimizu, K.; Sakata, Y. Analysis of petal anthocyanins to investigate flower coloration of Zhongyuan (Chinese) and Daikon Island (Japanese) tree peony cultivars. J. Plant Res. 2001, 114, 33–43. [Google Scholar] [CrossRef]
  15. Huang, B.; Rong, H.; Ye, Y.; Ni, Z.; Xu, M.; Zhang, W.; Xu, L.A. Transcriptomic analysis of flower color variation in the ornamental crabapple (Malus spp.) half-sib family through Illumina and PacBio Sequel sequencing. Plant Physiol. Biochem. 2020, 149, 27–35. [Google Scholar] [CrossRef]
  16. Deng, Y.; Li, J.; Wu, S.; Zhu, Y.; Chen, Y.; He, F. Integrated NR Database in Protein Annotation System and Its Localization. Comput. Eng. 2006, 32, 71–74. [Google Scholar]
  17. Finn, R.D.; Bateman, A.; Clements, J.; Coggill, P.; Eberhardt, R.Y.; Eddy, S.R.; Heger, A.; Hetherington, K.; Holm, L.; Mistry, J.; et al. Pfam: The protein families database. Nucleic Acids Res. 2014, 42, D222-30. [Google Scholar] [CrossRef] [Green Version]
  18. Koonin, E.V.; Fedorova, N.D.; Jackson, J.D.; Jacobs, A.R.; Krylov, D.M.; Makarova, K.S.; Mazumder, R.; Mekhedov, S.L.; Nikolskaya, A.N.; Rao, B.S.; et al. A comprehensive evolutionary classification of proteins encoded in complete eukaryotic genomes. Genome Biol. 2014, 5, R7. [Google Scholar] [CrossRef] [PubMed] [Green Version]
  19. Tatusov, R.L.; Galperin, M.Y.; Natale, D.A.; Koonin, E.V. The COG database: A tool for genome-scale analysis of protein functions and evolution. Nucleic Acids Res. 2000, 28, 33–36. [Google Scholar] [CrossRef] [Green Version]
  20. Apweiler, R.; Bairoch, A.; Wu, C.H.; Barker, W.C.; Boeckmann, B.; Ferro, S.; Gasteiger, E.; Huang, H.; Lopez, R.; Magrane, M.; et al. UniProt: The Universal Protein knowledgebase. Nucleic Acids Res. 2004, 32, D115–D119. [Google Scholar] [CrossRef]
  21. Kanehisa, M.; Goto, S.; Kawashima, S.; Okuno, Y.; Hattori, M. The KEGG resource for deciphering the genome. Nucleic Acids Res. 2004, 32, D277-80. [Google Scholar] [CrossRef] [PubMed] [Green Version]
  22. Ashburner, M.; Ball, C.A.; Blake, J.A.; Botstein, D.; Butler, H.; Cherry, J.M.; Davis, A.P.; Dolinski, K.; Dwight, S.S.; Eppig, J.T.; et al. Gene ontology: Tool for the unification of biology. The Gene Ontology Consortium. Nat. Genet. 2000, 25, 25–29. [Google Scholar] [CrossRef] [PubMed] [Green Version]
  23. Zheng, Y.; Jiao, C.; Sun, H.; Rosli, H.G.; Pombo, M.A.; Zhang, P.; Banf, M.; Dai, X.; Martin, G.B.; Giovannoni, J.J.; et al. iTAK: A Program for Genome-wide Prediction and Classification of Plant Transcription Factors, Transcriptional Regulators, and Protein Kinases. Mol. Plant 2016, 9, 1667–1670. [Google Scholar] [CrossRef] [PubMed] [Green Version]
  24. Li, B.; Dewey, C.N. RSEM: Accurate transcript quantification from RNA-Seq data with or without a reference genome. BMC Bioinform. 2011, 12, 323. [Google Scholar] [CrossRef] [Green Version]
  25. Anders, S.; Huber, W. Differential expression analysis for sequence count data. Genome Biol. 2010, 11, R106. [Google Scholar] [CrossRef] [Green Version]
  26. Doyle, J.J.; Doyle, J.L. A rapid DNA isolation procedure from small quantities of fresh leaf tissues. Phytochem. Bull. 1987, 19, 11–15. [Google Scholar]
  27. Lescot, M.; Déhais, P.; Thijs, G.; Marchal, K.; Moreau, Y.; Van de Peer, Y.; Rouzé, P.; Rombauts, S. Plant CARE, a database of plant cis-acting regulatory elements and a portal to tools for in silico analysis of promoter sequences. Nucleic Acids Res. 2002, 30, 325–327. [Google Scholar] [CrossRef]
  28. Lopes-da-Silva, F.; Escribano-Bailón, M.T.; Pérez-Alonso, J.J.; Perez-Alonso, J.J.; Santos-Buelga, C. Anthocyanin pigments in strawberry. LWT Food Sci. Technol. 2007, 40, 374–382. [Google Scholar] [CrossRef]
  29. Harborne, J.B. Spectral methods of characterizing anthocyanins. Biochem. J. 1958, 70, 22–28. [Google Scholar] [CrossRef]
  30. Fan, M.; Yang, K.; Zhou, R.; Liu, Q.; Guo, X.; Sun, Y. Temporal transcriptome profiling reveals candidate genes involved in cold acclimation of Camellia japonica (Naidong). Plant Physiol. Biochem. 2021, 167, 795–805. [Google Scholar] [CrossRef]
  31. Li, J.B.; Hashimoto, F.; Shimizu, K.; Sakata, Y. Anthocyanins from red flowers of Camellia cultivar ‘Dalicha’. Phytochemistry 2008, 69, 3166–3171. [Google Scholar] [CrossRef] [PubMed]
  32. Liu, W.; Feng, Y.; Yu, S.; Fan, Z.; Li, X.; Li, J.; Yin, H. The Flavonoid Biosynthesis Network in Plants. Int. J. Mol. Sci. 2021, 22, 12824. [Google Scholar] [CrossRef] [PubMed]
  33. Liu, L.; Zhang, L.Y.; Wang, S.L.; Niu, X.Y. Analysis of anthocyanins and flavonols in petals of 10 Rhododendron species from the Sygera Mountains in Southeast Tibet. Plant Physiol. Biochem. 2016, 104, 250–256. [Google Scholar] [CrossRef] [PubMed]
  34. Yang, Y.; Chen, M.; Liu, Y.; Ding, H.; Du, H.; Sun, Z.; Zhu, J. Metabolome and Transcriptome Analyses Reveal Different Flavonoid Biosynthesis and Chlorophyll Metabolism Profiles between Red Leaf and Green Leaf of Eucommia ulmoides. Forests 2021, 12, 1260. [Google Scholar] [CrossRef]
  35. Li, Q.; Kou, M.; Li, C.; Zhang, Y.G. Comparative transcriptome analysis reveals candidate genes involved in anthocyanin biosynthesis in sweetpotato (Ipomoea batatas L.). Plant Physiol. Biochem. 2021, 158, 508–517. [Google Scholar] [CrossRef] [PubMed]
  36. Boss, P.K.; Davies, C.; Robinson, S.P. Expression of anthocyanin biosynthesis pathway genes in red and white grapes. Plant Mol. Biol. 1996, 32, 565–569. [Google Scholar] [CrossRef] [PubMed]
  37. Yang, Q.; Yuan, H.H.; Sun, X.B. Preliminary studies on the changes of flower color during the flowering period in two tree peony cultivars. Acta Hortic. Sin. 2015, 42, 930–938. [Google Scholar] [CrossRef]
  38. Byamukama, R.; Jordheim, M.; Kiremire, B.; Namukobe, J.; Andersen, Ø.M. Anthocyanins from flowers of Hippeastrum cultivars. Sci. Hortic. 2006, 109, 262–266. [Google Scholar] [CrossRef]
  39. Brugliera, F.; Tao, G.Q.; Tems, U.; Kalc, G.; Mouradova, E.; Price, K.; Stevenson, K.; Nakamura, N.; Stacey, I.; Katsumoto, Y.; et al. Violet/Blue Chrysanthemums—Metabolic Engineering of the Anthocyanin Biosynthetic Pathway Results in Novel Petal Colors. Plant and Cell Physiology. 2013, 54, 1696–1710. [Google Scholar] [CrossRef] [Green Version]
  40. Khoo, H.E.; Azlan, A.; Tang, S.T.; Lim, S.M. Anthocyanidins and anthocyanins: Colored pigments as food, pharmaceutical ingredients, and the potential health benefits. Food Nutr. Res. 2017, 61, 1361779. [Google Scholar] [CrossRef] [Green Version]
  41. Oh, Y.S.; Lee, J.H.; Yoon, S.H.; Oh, C.H.; Choi, D.S.; Choe, E.; Jung, M.Y. Characterization and quantification of anthocyanins in grape juices obtained from the grape cultivated in Korea. J. Food Sci. 2008, 73, 378–389. [Google Scholar] [CrossRef] [PubMed]
  42. Cheng, J.; Wei, G.; Zhou, H.; Gu, C.; Vimolmangkang, S.; Liao, L.; Han, Y. Unraveling the mechanism underlying the glycosylation and methylation of anthocyanins in peach. Plant Physiol. 2014, 166, 1044–1058. [Google Scholar] [CrossRef] [PubMed] [Green Version]
  43. Wang, Y.; Zhou, L.J.; Wang, Y.; Liu, S.; Geng, Z.; Song, A.; Jiang, J.; Chen, S.; Chen, F. Functional identification of a flavone synthase and a flavonol synthase genes affecting flower color formation in Chrysanthemum morifolium. Plant Physiol. Biochem. 2021, 166, 1109–1120. [Google Scholar] [CrossRef] [PubMed]
  44. Oren-Shamir, M. Does anthocyanin degradation play a significant role in determining pigment concentration in plants? Plant Sci. 2009, 177, 310–316. [Google Scholar] [CrossRef]
  45. Han, M.L.; Yin, J.; Zhao, Y.H.; Sun, X.W.; Meng, J.X.; Zhou, J.; Shen, T.; Li, H.H.; Zhang, F. How the Color Fades from Malus halliana Flowers: Transcriptome Sequencing and DNA Methylation Analysis. Front. Plant Sci. 2020, 11, 576054. [Google Scholar] [CrossRef] [PubMed]
  46. Guo, L.P.; Wang, Y.J.; Teixeira da Silva, J.A.; Fan, Y.M.; Yu, X.N. Transcriptome and chemical analysis reveal putative genes involved in flower color change in Paeonia ‘Coral Sunset’. Plant Physiol. Biochem. 2019, 138, 130–139. [Google Scholar] [CrossRef]
  47. Zou, H.; Ma, Y.; Liao, X.; Wang, Y. Effects of high-pressure processing on the copigmentation reaction of pelargonidin-3-glucoside and catechin. LWT 2019, 108, 240–246. [Google Scholar] [CrossRef]
  48. Grzesik, M.; Naparło, K.; Bartosz, G.; Sadowska-Bartosz, I. Antioxidant properties of catechins: Comparison with other antioxidants. Food Chem. 2018, 241, 480–492. [Google Scholar] [CrossRef]
  49. Mueller, L.A.; Goodman, C.D.; Silady, R.A.; Walbot, V. AN9, a petunia glutathione S-transferase required for anthocyanin sequestration, is a flavonoid-binding protein. Plant Physiol. 2000, 123, 1561–1570. [Google Scholar] [CrossRef] [Green Version]
  50. Zipor, G.; Duarte, P.; Carqueijeiro, I.M.; Shahar, L.; Ovadia, R.; Teper-bamnolker, P.; Eshel, D.; Levin, Y.; Faigenboim, A.; Sottomayor, M.; et al. In planta anthocyanin degradation by a vacuolar class III peroxidase in Brunfelsia calycina flowers. New Phytol. 2015, 205, 653–665. [Google Scholar] [CrossRef]
  51. Fang, F.; Zhang, X.; Luo, H.; Zhou, J.; Gong, Y.; Li, W.; Shi, Z.; He, Q.; Wu, Q.; Li, L.; et al. Anintracellular laccase is responsible for the epicatechin mediated anthocyanin degradation in litchi fruit pericarp. Plant Physiol. 2015, 169, 2391–2408. [Google Scholar] [CrossRef] [PubMed] [Green Version]
  52. Ji, X.H.; Zhang, R.; Wang, N.; Yang, L.; Chen, X. Transcriptome profiling reveals auxin suppressed anthocyanin biosynthesis in red-fleshed apple callus (Malus sieversii f. niedzwetzkyana). Plant Cell Tissue Organ Cult. 2015, 123, 389–404. [Google Scholar] [CrossRef]
  53. Katja, K.; Pinja, T.; Hely, H.; Laura, J. Abscisic Acid Regulates Anthocyanin Biosynthesis and Gene Expression Associated with Cell Wall Modification in Ripening Bilberry (Vaccinium myrtillus L.) Fruits. Front. Plant Sci. 2018, 9, 1259. [Google Scholar] [CrossRef]
  54. Liu, Y.J.; Li, M.; Li, T.; Chen, Y.J.; Zhang, L.J.; Zhao, G.F.; Zhuang, G.H.; Zhao, W.Y.; Gao, L.P.; Xia, T. Airborne fungus-induced biosynthesis of anthocyanins in Arabidopsis thaliana via jasmonic acid and salicylic acid signaling. Plant Sci. 2020, 300, 110635. [Google Scholar] [CrossRef]
  55. Xu, W.; Dubos, C.; Lepiniec, L. Transcriptional control of flavonoid biosynthesis by MYB-bHLH-WDR complexes. Trends Plant Sci. 2014, 20, 176–185. [Google Scholar] [CrossRef]
  56. Stracke, R.; Werber, M.; Weisshaar, B. The r2r3-myb gene family in Arabidopsis thaliana. Curr. Opin. Plant Biol. 2011, 4, 447–456. [Google Scholar] [CrossRef]
  57. Mehrtens, F.; Kranz, H.; Bednarek, P.; Weisshaar, B. The Arabidopsis transcription factor MYB12 is a flavonol-specific regulator of phenylpropanoid biosynthesis. Plant Physiol. 2005, 138, 1083–1096. [Google Scholar] [CrossRef] [Green Version]
  58. Espley, R.V.; Hellens, R.P.; Putterill, J.; Stevenson, D.E.; Kutty-Amma, S.; Allan, A.C. Red colouration in apple fruit is due to the activity of the MYB transcription factor, MdMYB10. Plant J. 2006, 49, 414–427. [Google Scholar] [CrossRef] [Green Version]
  59. Schaart, J.G.; Dubos, C.; Romero De La Fuente, I.; van Houwelingen, A.M.M.L.; de Vos, R.C.H.; Jonker, H.H.; Xu, W.; Routaboul, J.M.; Lepiniec, L.; Bovy, A.G. Identification and characterization of MYB-bHLH-WD40 regulatory complexes controlling proanthocyanidin biosynthesis in strawberry (Fragaria × ananassa) fruits. New Phytol. 2013, 197, 454–467. [Google Scholar] [CrossRef]
  60. Albert, N.W.; Butelli, E.; Moss, S.M.A.; Piazza, P.; Waite, C.N.; Schwinn, W.K.E.; Davies, K.M.; Martin, C. Discrete bHLH transcription factors play functionally overlapping roles in pigmentation patterning in flowers of Antirrhinum majus. New Phytol. 2020, 231, 849–863. [Google Scholar] [CrossRef]
  61. Jing, N.; Song, J.; Liu, Z.; Wang, L.; Jiang, G. Glycosylation of anthocyanins enhances the apoptosis of colon cancer cells by handicapping energy metabolism. BMC Complement. Med. Ther. 2020, 20, 312. [Google Scholar] [CrossRef] [PubMed]
  62. Huang, X.; Li, J.; Shang, H.; Meng, X. Effect of methyl jasmonate on the anthocyanin content and antioxidant activityof blueberries during cold storage. J. Sci. Food Agric. 2015, 95, 337–343. [Google Scholar] [CrossRef] [PubMed]
Figure 1. The materials used in the experiment. (A) The petals of C. japonica (CJ), C. japonica ‘ChiDan’(CD), C. japonica ‘FenDan’ (FD), C. japonica ‘YuDan’ (YD), and C. japonica ‘JinBiHuiHuang’ (JH) at the full-bloom stage. (B) The PCA of the chroma values; the cos2 values were used to estimate the quality of the representation. The higher the cos2 value, the more important the component. (C) The total anthocyanin content of the samples; the data are the mean ± SD of three independent replicates, different letters indicate a significant difference between groups using Tukey’s Honest Significant Difference test at p < 0.05 after one-way ANOVA.
Horticulturae 08 00129 g001
Figure 2. Identification and analysis of the anthocyanin components. (A) HPLC chromatograms of the anthocyanins identified in C. japonica ‘YuDan’. (B) Anthocyanin chromatograms and spectral data. (C) Heatmap of anthocyanin contents after horizontal standardization. Purple and green indicate high and low contents, respectively. (D) Pearson’s correlation analysis of the seven anthocyanins. (E) The change trend analysis of the ratio of different anthocyanins in the samples.
Horticulturae 08 00129 g002
Figure 3. Transcriptome analysis of the differentially expressed genes (DEGs). (A) Venn diagram showing the overlapping DEGs between the CD, FD, JH, and YD groups. (B) The top 17 significantly enriched GO terms. (C) The top 19 significantly enriched KEGG pathway terms. (D) Classification of differentially expressed transcription factors (TFs). The Y-axis indicates the number of genes. (E) The six sub−classes of TFs in which expression differed during the change in flower color according to the cluster analysis. The bar plot represents the gene family classification of TFs in clusters 1 and 6.
Horticulturae 08 00129 g003
Figure 4. The DEGs involved in the cyanidin biosynthetic pathway. Genes marked in red had significant differences in expression. The expression patterns of DEGs in the CD, FD, JH, and YD groups using the RNA data. Blue and pink indicate upregulated and downregulated, respectively. PAL: phenylalanine ammonia lyase. C4H: cinnamate 4-hydroxylase. CHS: chalcone synthase. CHI: chalcone isomerase. F3H: flavanone 3-hydroxylase. F3′H: flavonoid 3′-monooxyfenase. DFR: dihydroflavonol-4-reductase. ANS: anthocyanidin synthase. LAR: leucoanthocyanidin reductase. ANR: anthocyanidin reductase. GST: glutathione S-transferase. ABCC: ATP binding cassette.
Horticulturae 08 00129 g004
Figure 5. The WGCNA of the differentially expressed genes. (A) Eight co-expression modules are shown on a hierarchical cluster tree. (B) Verification of the correlation between modules; yellow and red indicate high and low correlations, respectively. (C) Correlation analysis of the co-expression modules and the five kinds of camellias. The p-values and correlation coefficients are indicated in each cell.
Horticulturae 08 00129 g005
Figure 6. Transcriptional regulatory network of the yellow module related to anthocyanin accumulation. (A) The heatmap of genes in the yellow module. (B) KEGG enrichment analysis of the yellow module. The enriched KEGG pathway in modules based on the number of genes and p-values. (C) Pearson’s correlation analysis of the candidate genes and TFs (D) A potential DEG regulatory network with TFs related to anthocyanin accumulation in the yellow module. Co−expressed genes with weights >0.5 were screened as candidate genes, and TFs were screened via integrative cis-acting element and expression pattern analyses.
Horticulturae 08 00129 g006
Figure 7. A potential module for high anthocyanin accumulation. A series of TFs, transporters, and glycosylation promotes the phenylalanine and anthocyanin metabolism, and anthocyanin accumulation is regulated by signaling factors. AUX: auxin. ABA: abscisic acid. MeJA: methyl jasmonate. SA: salicylic acid.
Horticulturae 08 00129 g007
Publisher’s Note: MDPI stays neutral with regard to jurisdictional claims in published maps and institutional affiliations.

