Article

Nanotechnology in Roman Opaque Red Glass from the 2nd Century AD. Archaeometric Investigation in Red Sectilia from the Decoration of the Lucius Verus Villa in Rome

1
VICARTE, Research Unit Vidro e Ceramica para as Artes, FCT/UNL, Campus Caparica, 2829-516 Caparica, Portugal
2
Depepartamento de Conservacao e Restauro, FCT/UNL, Campus Caparica, 2829-516 Caparica, Portugal
3
C2RMF, Centre de Reserch e de Restauration do Musee de France, Palais du Louvre—Porte des Lions 14, 75001 quai François Mitterrand, Paris
4
Laboratorio Analisi Materiali Antichi, Sistema dei Laboratori, IUAV University, Palazzo Badoer, San Polo 2468/B, 30125 Venice, Italy
5
Centro de Ciencias e Tecnologias Nucleares, C2TN, Campus Tecnologico e Nuclear, Instituto Superiore Tecnico, Universidade de Lisboa, EN10 km 139, 2685-066 Bobadela, Portugal
*
Author to whom correspondence should be addressed.
Heritage 2019, 2(3), 2597-2611; https://doi.org/10.3390/heritage2030159
Submission received: 26 July 2019 / Revised: 30 August 2019 / Accepted: 1 September 2019 / Published: 3 September 2019
(This article belongs to the Special Issue Cultural Heritage—Science, Materials and Technologies)

Abstract

:
This work aims to characterise the chemical composition of Roman opaque red glass sectilia dated to the 2nd century A.D and to shed light on Roman glassmaking production of different shades of red, from red to reddish-brown. Due to the lack of technical historical sources for this period many questions about technological aspects still remain. In this project a multi-disciplinary approach is in progress to investigate the red glass sectilia with several red hues from the Imperial Villa of Lucius Verus (161–169 A.D.) in Rome. First, colorimetric measurements were taken to identify the various red hues. The second step was chemical characterization of the samples and the identification of crystalline colouring phases. Particle Induced X-Ray Emission (PIXE) analysis was used to investigate the chemical composition of these glass samples, while the crystalline phases were identified by Raman Spectroscopy and Scanning Electrons Microscope with Energy Dispersive X-ray Spectrometry (SEM-EDS). Using SEM-EDS nanoparticles were detected as a colouring agent, the chemical composition and the morphology of which has been studied in depth. This information has been compared with the colorimetric analysis to establish any correlation with the different colour hues.

1. Introduction

The 2nd century AD imperial villa of Lucius Verus is situated along the Via Appia near Rome, and a large number of its rooms were decorated with the opus sectile technique, with monochrome and polychrome glass pieces (sectilia) of different colours [1]. The aim of using these pieces of glass to substitute specific types of marble commonly used in Roman architecture is not fully clear [1]. Unfortunately, the decoration of this villa was destroyed and more than 30,000 glass pieces of different sizes, shapes and colours became part of the private collection of the Italian tenor Evangelista Gorga, between the end of the 19th and the beginning of the 20th century. As result of financial problems, part of his huge collection was sold to the Italian government. Nowadays the sectilia are stored in the Soprintendenza Archeologica di Roma (more than 30,000 glass pieces of different sizes, shapes and colours) [1,2].
The large amount of well dated monochrome Roman opaque red glass sectilia in this collection provides a unique opportunity to investigate this glassmaking technology and enrich our knowledge of Roman opaque red glass. The first step of this work established a preliminary colour-based classification of more than 8000 monochrome red sectilia, 10 of which were then selected for their different hues and analysed by a multi-analytical approach. The polychrome sectilia, in which opaque red glass was used with other colours, were not considered in this study.
The aim of this work is to investigate different red hues, found in the Gorga collection, through a multi-analytical approach. The results will be used to highlight the specific features of Roman opaque red glass, and to distinguish one hue from another.

Formation of Colour

The use of copper as a colouring agent dates back to the beginning of glassmaking technology [3,4]. Copper in cupric form (Cu2+) produces a turquoise-blue glass, while the strong reducing condition in the melt or in the furnace atmosphere, during the melting and working stages, leads to copper precipitation in form of cuprous oxide (cuprite crystals, Cu2O) or metallic copper (Cu°) generating red glass [5]. The formation of cuprous oxide or metallic copper depends on the glass composition and on the partial pressure of oxygen which affects the oxidation state of copper. Indeed, cuprous oxide is formed more easily than metallic copper, which requires much stronger reducing conditions to precipitate [5,6,7,8,9,10]. The addition of reducing agents, such as iron, tin and antimony compounds is fundamental to facilitate this process [5,6,7,8,9,10]. It is generally accepted that the formation of red colour (striking) occurs during the cooling phase. At this stage, if the correct redox conditions to achieve the precipitation of cuprous oxide or metallic copper are obtained, micrometric or nanometric particles start to form in the glass [9,10,11]. Once the particles are formed, their interaction with the visible light causes the absorption and the scattering phenomena of light which determine the colour of the glass and its transparency or opacity [12]. When the concentration and size of particles increase (>50 nm) the scattering effect is the prevailing phenomenon and an opaque red glass is obtained [5,12,13].
Doubts about the true colouring agent of opaque red glass emerged in recent decades leading to two theories: some authors support the hypothesis that cuprite (Cu2O) is responsible for the red colour [11,14,15], while others defend the idea that metallic copper is the true colouring agent for red glass [5,8,16,17].
In historical glass both cuprite and elemental copper were found in opaque red glass. They were the results of different types of technological production processes, and they were generated in glasses with different chemical compositions [13,18]. Micrometric cuprite crystals (50–150 μm) are formed in glass which is rich in copper (CuO 5–12%) and lead (PbO 15–40%), and require specific heat-treatment in order to grow to dendritic micrometric sizes [19]. This glass, called sealing wax, was identified for the first time by Turner in Egyptian red glass [20]. Sealing wax is a bright red glass; as far as we know, it was widely used from the 4th century BC until the 1st century AD in Ancient Egypt, as well as in La Tène and Celtic cultures until the Hellenistic Empire [3,4,14,18,21,22].
Red glass coloured by nanoparticles of metallic copper shows low content of copper (CuO 0.6–5%) and lead oxide (PbO 0.1–15%); iron or tin oxide were intentionally added in the glass composition as reducing agents [23,24]. Since this type of red glass is duller than sealing wax, in literature it is frequently called red-brown. It has been produced from the Roman age to the current day especially for mosaic tesserae [25].
A third glass resulting from this technology is the aventurine glass characterized by sparkling flakes of metallic copper of visible size formed by slowly cooling the melt. As far as we know, aventurine glass was invented at the end of the 16th century AD by Venetian glassmakers [25,26,27,28].

2. Materials and Methods

2.1. Materials

About 8000 opaque red sectilia [1], stored in 8 boxes grouped by colour and shape (Figure 1), were inspected in order to identify different red hues.
Some sectilia covered by a green, white or black corroded layer, could be not studied. Sampling was based on sectilia showing recent fractures or polished by the dealers before becoming part of the Gorga collection or freshly broken. In the end, 10 samples showing various red hues were collected (Figure 2).

2.2. Equipment and Characterization Methods

2.2.1. OM (Optical Microscope)

Images were collected using a Zeiss Axioplan 2 Imaging system (HAL 100) coupled to a Nikon DXM1200F digital camera and ACT-1 software. Different illumination modes (bright field and dark field) were used.

2.2.2. FORS (Fibre Optics Reflectance Spectroscopy)

MAYA 200 PRO from Ocean Optics spectrophotometer with a single beam dispersive optical fibre was used, at the scientific laboratory in DCR Lisbon, together with a 2048 CCD Si detector that allows operating in the 200–1050 nm range. The light source is a HL-200-HP 20 W halogen from Ocean Optics, with a single optical path between 360 and 2500 nm. The spectra were taken directly on the glass surface of the objects, in reflectance (R) mode, with a 45°/45° configuration (illumination angle/acquisition) and a ca. 2 mm diameter of the area analysed. Spectra were obtained between 380 and 1050 nm, with an integration time of 8 ms per scan and 15 scans. A Spectralon® surface was used as a reference for calibration.
By means of the reflectance spectra, it is possible to calculate the band gap energies of semiconductor materials using the following equation proposed in the literature [29,30,31,32,33]:
( α h v ) n = A ( h v E g )
where α is the absorption coefficient, hv is the energy of incident photon, Eg is the band gap energy, A is a proportionality constant and n is an exponent which is related to the optical transition. As mentioned by Rosi [29], it was necessary to convert the FORS spectra into Kubelka-Munk values which are proportional to the absorption coefficient. Afterwards a band gap energy was calculated by extrapolating the linear region of a plot of (αhv)2 vs. hv [29,30,31,32,33].

2.2.3. Colorimetric Measurements

Colorimetric measurements were made at the Stazione Sperimentale del Vetro (SSV), Murano Venice, with a UV-VIS-NIR spectrophotometer Perkin-Elmer Lambda 900 with a Spectralon 15 mm diameter integrating sphere Pela1000. Ceramic tile certificated NIST (SRM2019) was used as standard for the measurements in reflection.
Because of the small sizes of the samples a specific protocol was adopted. An area of 3 × 3 mm was measured by applying a mask on the sample, made of carbon paper, to avoid any interference.
These analyses were taken and elaborated by the procedure indicated in Publication of Commision Internationale de l’Eclairage (CIE) n°15:2004 “colorimetrie”, with D65 illuminant (CIE n°15) and 2° observer (CIE 1931)—5 nm.

2.2.4. Reference Standards

To calculate the oxide concentration in the semi-quantitative and quantitative chemical analysis calibration of instruments with glass reference standard was carried out. Standard Corning A, B, C, D were used. These standards have a well-known and certificated composition with different concentrations of several oxides to reproduce the chemical composition of historical glass [34].

2.2.5. PIXE (Particle Induced X-Ray Emission)

Quantitative chemical compositions were achieved with a μ-PIXE ion beam analytical technique, at C2TN (Center for Nuclear Science and Technology in Lisbon, using an Oxford Microbeams OM150 type scanning nuclear microprobe setup, either with the in-vacuum or with the external beam configuration. To allow efficient detection of low energy X-rays the fragments were irradiated in vacuum with a focused 1 MeV proton beam. The X-rays were collected by an 8 μm thick Be windowed SDD detector with 145 eV resolution. X-ray imaging (2D elemental distribution) and spectra were obtained from an irradiated sample area of 750 × 750 μm2. For trace elements quantification (typically elements with atomic number above the one of Fe), a 2 MeV proton beam was used. In this case, the external beam setup was chosen in order to prevent sample beam-charging and consequently X-ray spectra degradation. X-rays were collected with an SDD detector with 145 eV resolution from a sample area of 800 × 800 μm2. Operation and basic data manipulation, including elemental distribution mapping, was achieved through the OMDAQ software code, and quantitative analysis with GUPIX program.

2.2.6. SEM-EDS (Scanning Electrons Microscope with Energy Dispersive X-ray Spectrometry)

A field emission electron Gun Scanning Electron Microscope (FEG-SEM, JEOL 7800F), at C2RMF (Centre de Recherche et de Restauration des Musées de France, Paris), was used for the analysis. To limit the charge effects on the surface, a platinum coating of about 1 nm was deposited to make the glass surface conductive and moderate accelerating tensions were used (2–15 kV). For the platinum coating and the SEM observation, samples were submitted to a vacuum of about 1Pa and 5.10−5Pa respectively. At the same time as SEM observations, EDS analysis was carried out on the glass samples, using a BRUKER Quantax 400 system. The intensity of the electronic beam current was 1 nA during the analysis it was scanned on a surface area, larger than 2 μm, to prevent alkali drift.

2.2.7. μ-Raman Microscopy

Raman microscopy was carried out at a scientific laboratory in DCR Lisbon using a Labram 300 Jobin Yvon spectrometer, equipped with a solid state 50-mW laser operating at 532 nm. Spectra were recorded as an extended scan. The system was calibrated using a silicon standard. The laser beam was focused either with a 50× or a 100× Olympus objective lens. The laser power at the surface of the samples was controlled with neutral density filters (optical densities 0.3 and 0.6). Raman data analysis was performed using LabSpec 5 software. All spectra are presented as acquired without any baseline correction or other treatment.

3. Results

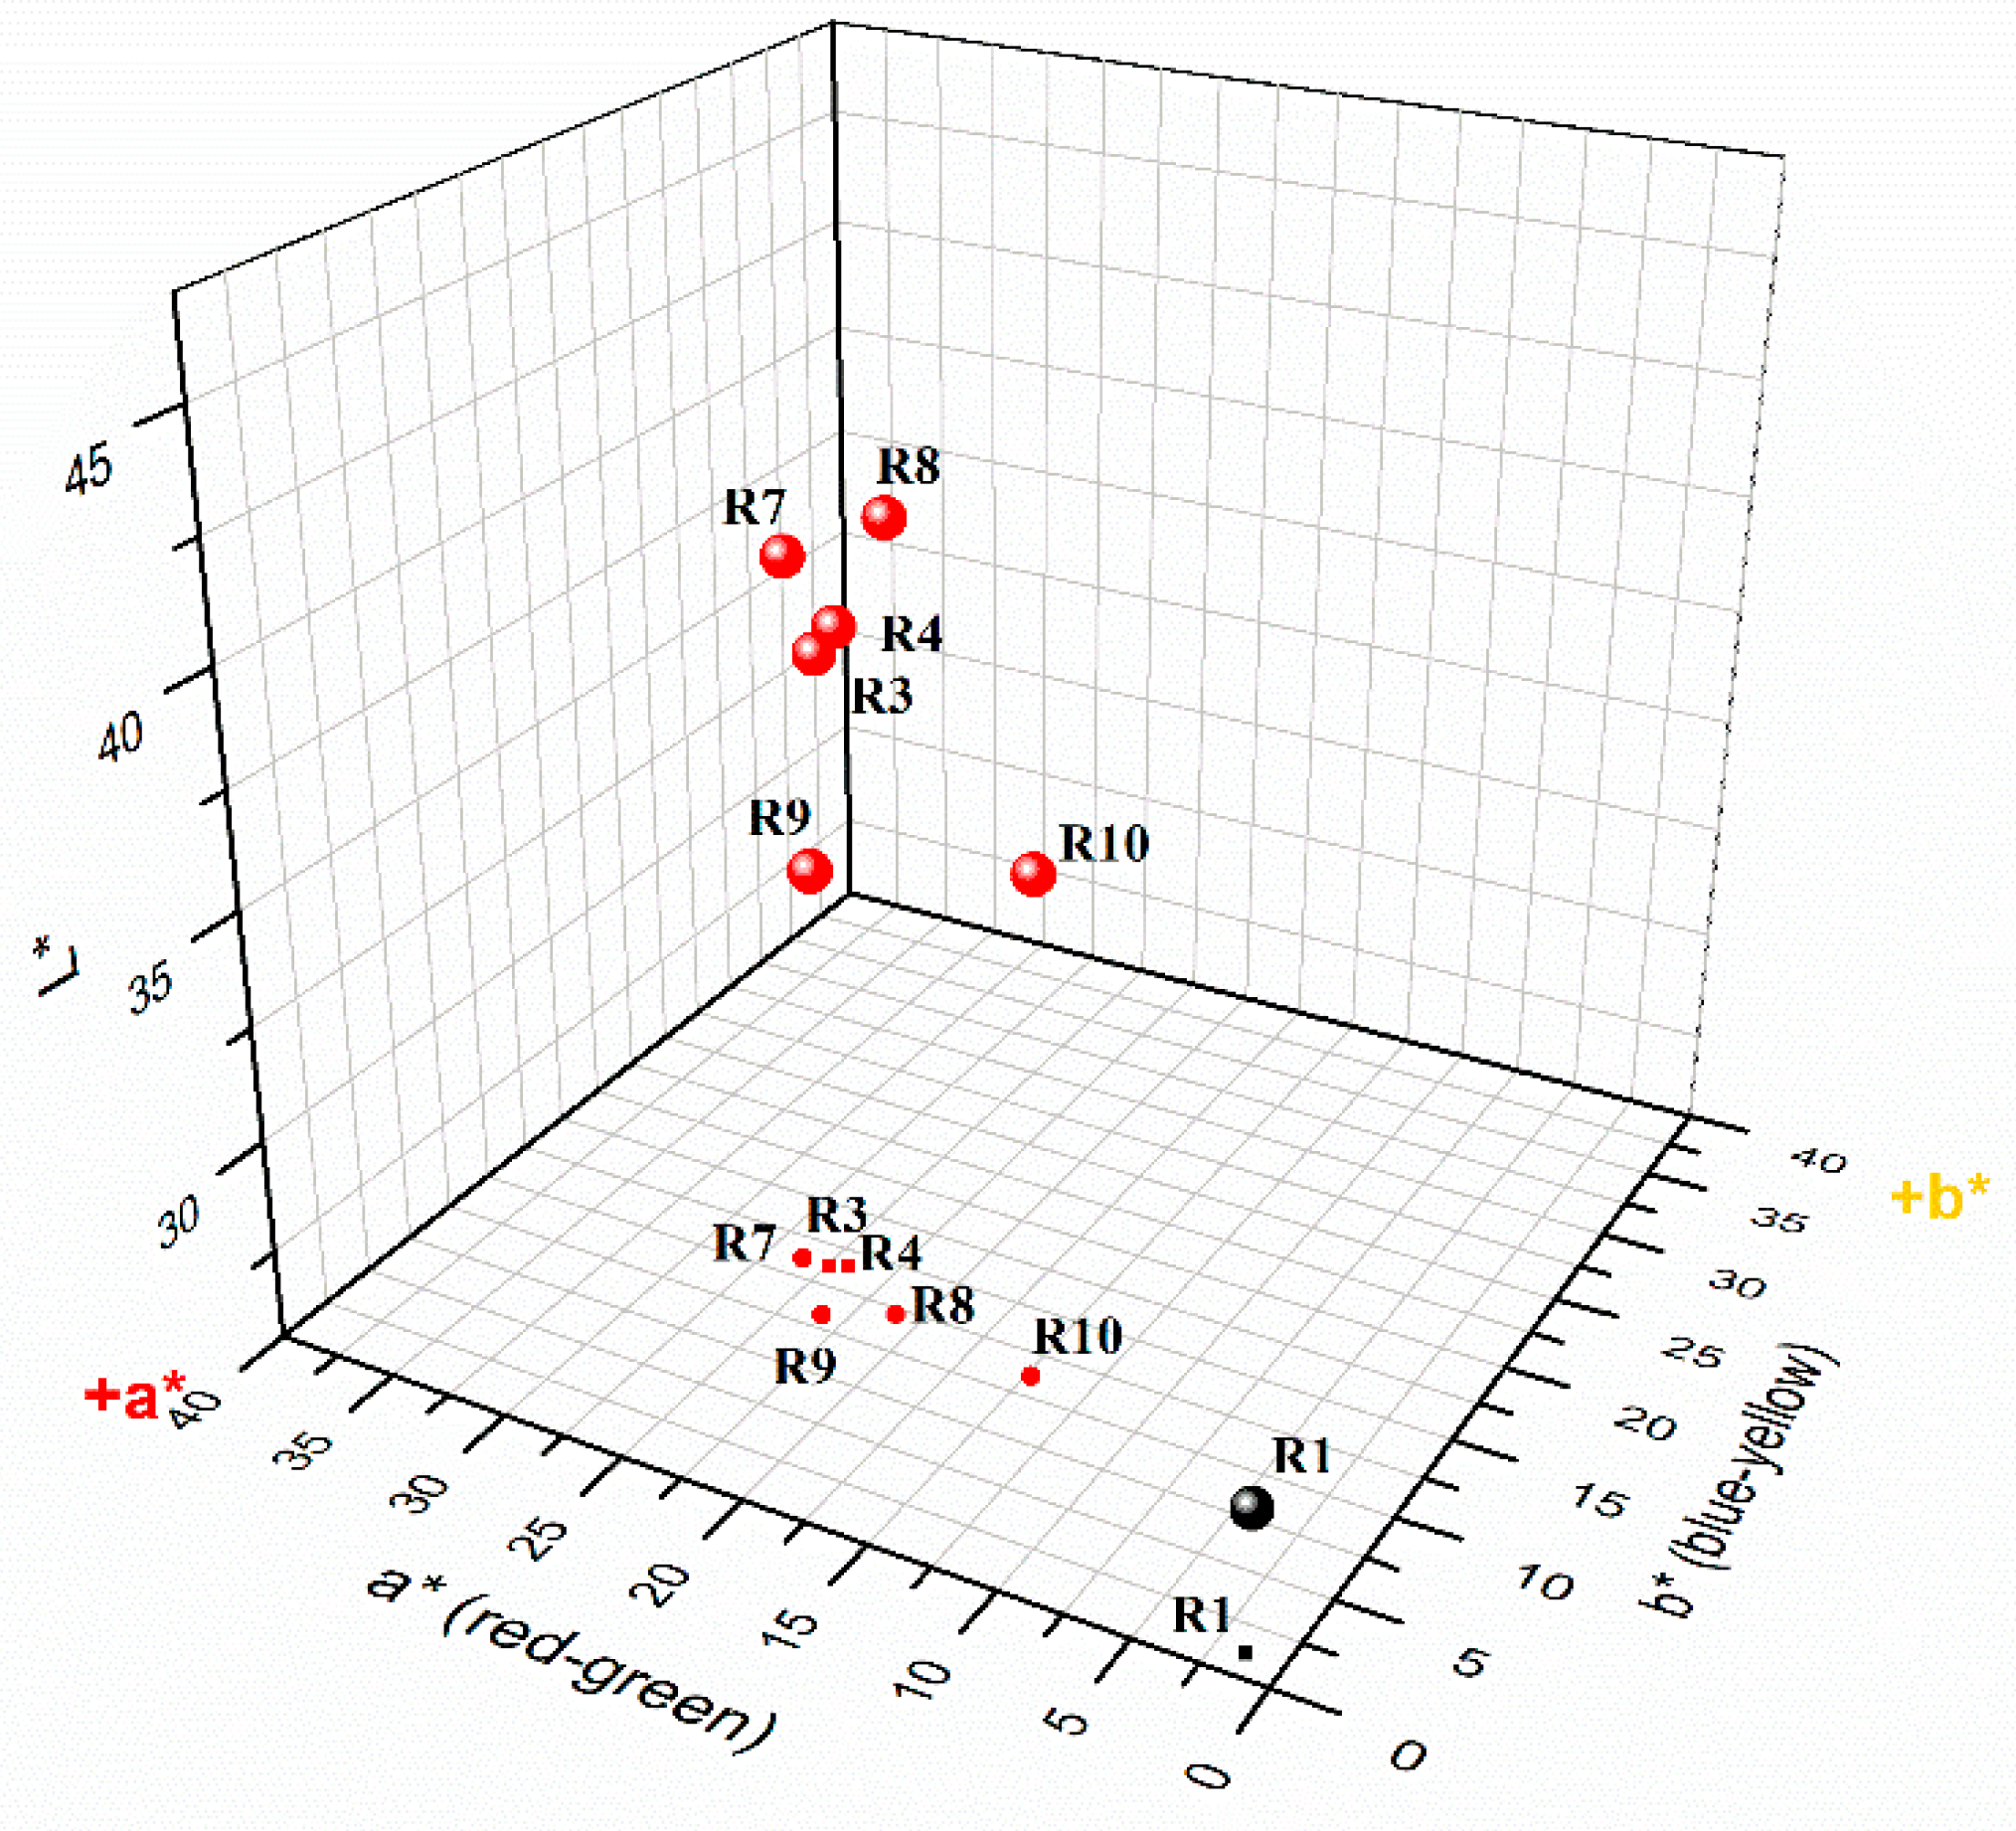
3.1. Colorimetric Measurements

Because of the small size of the samples, it was possible to perform colorimetric measurements only on samples R1-R3-R4-R6-R7-R8-R9-R10. Colorimetric coordinates (Table 1) identified four main red hues which can be observed in the 3D chart of Figure 3. Samples R3-R4-R7-R8 seem to compose a homogeneous group, which will hereafter be referred to as: Red-group. Of the other samples: R1 is very, dark almost black, with low values in the colorimetric coordinates. Minimal differences in colorimetric coordinate a* and b* were observed between the Red-group and sample R9 explaining why it was so difficult to distinguish them by visual observation alone. Sample R10 shows a lower value of the coordinate a* which makes it darker than both the Red-group and R9.

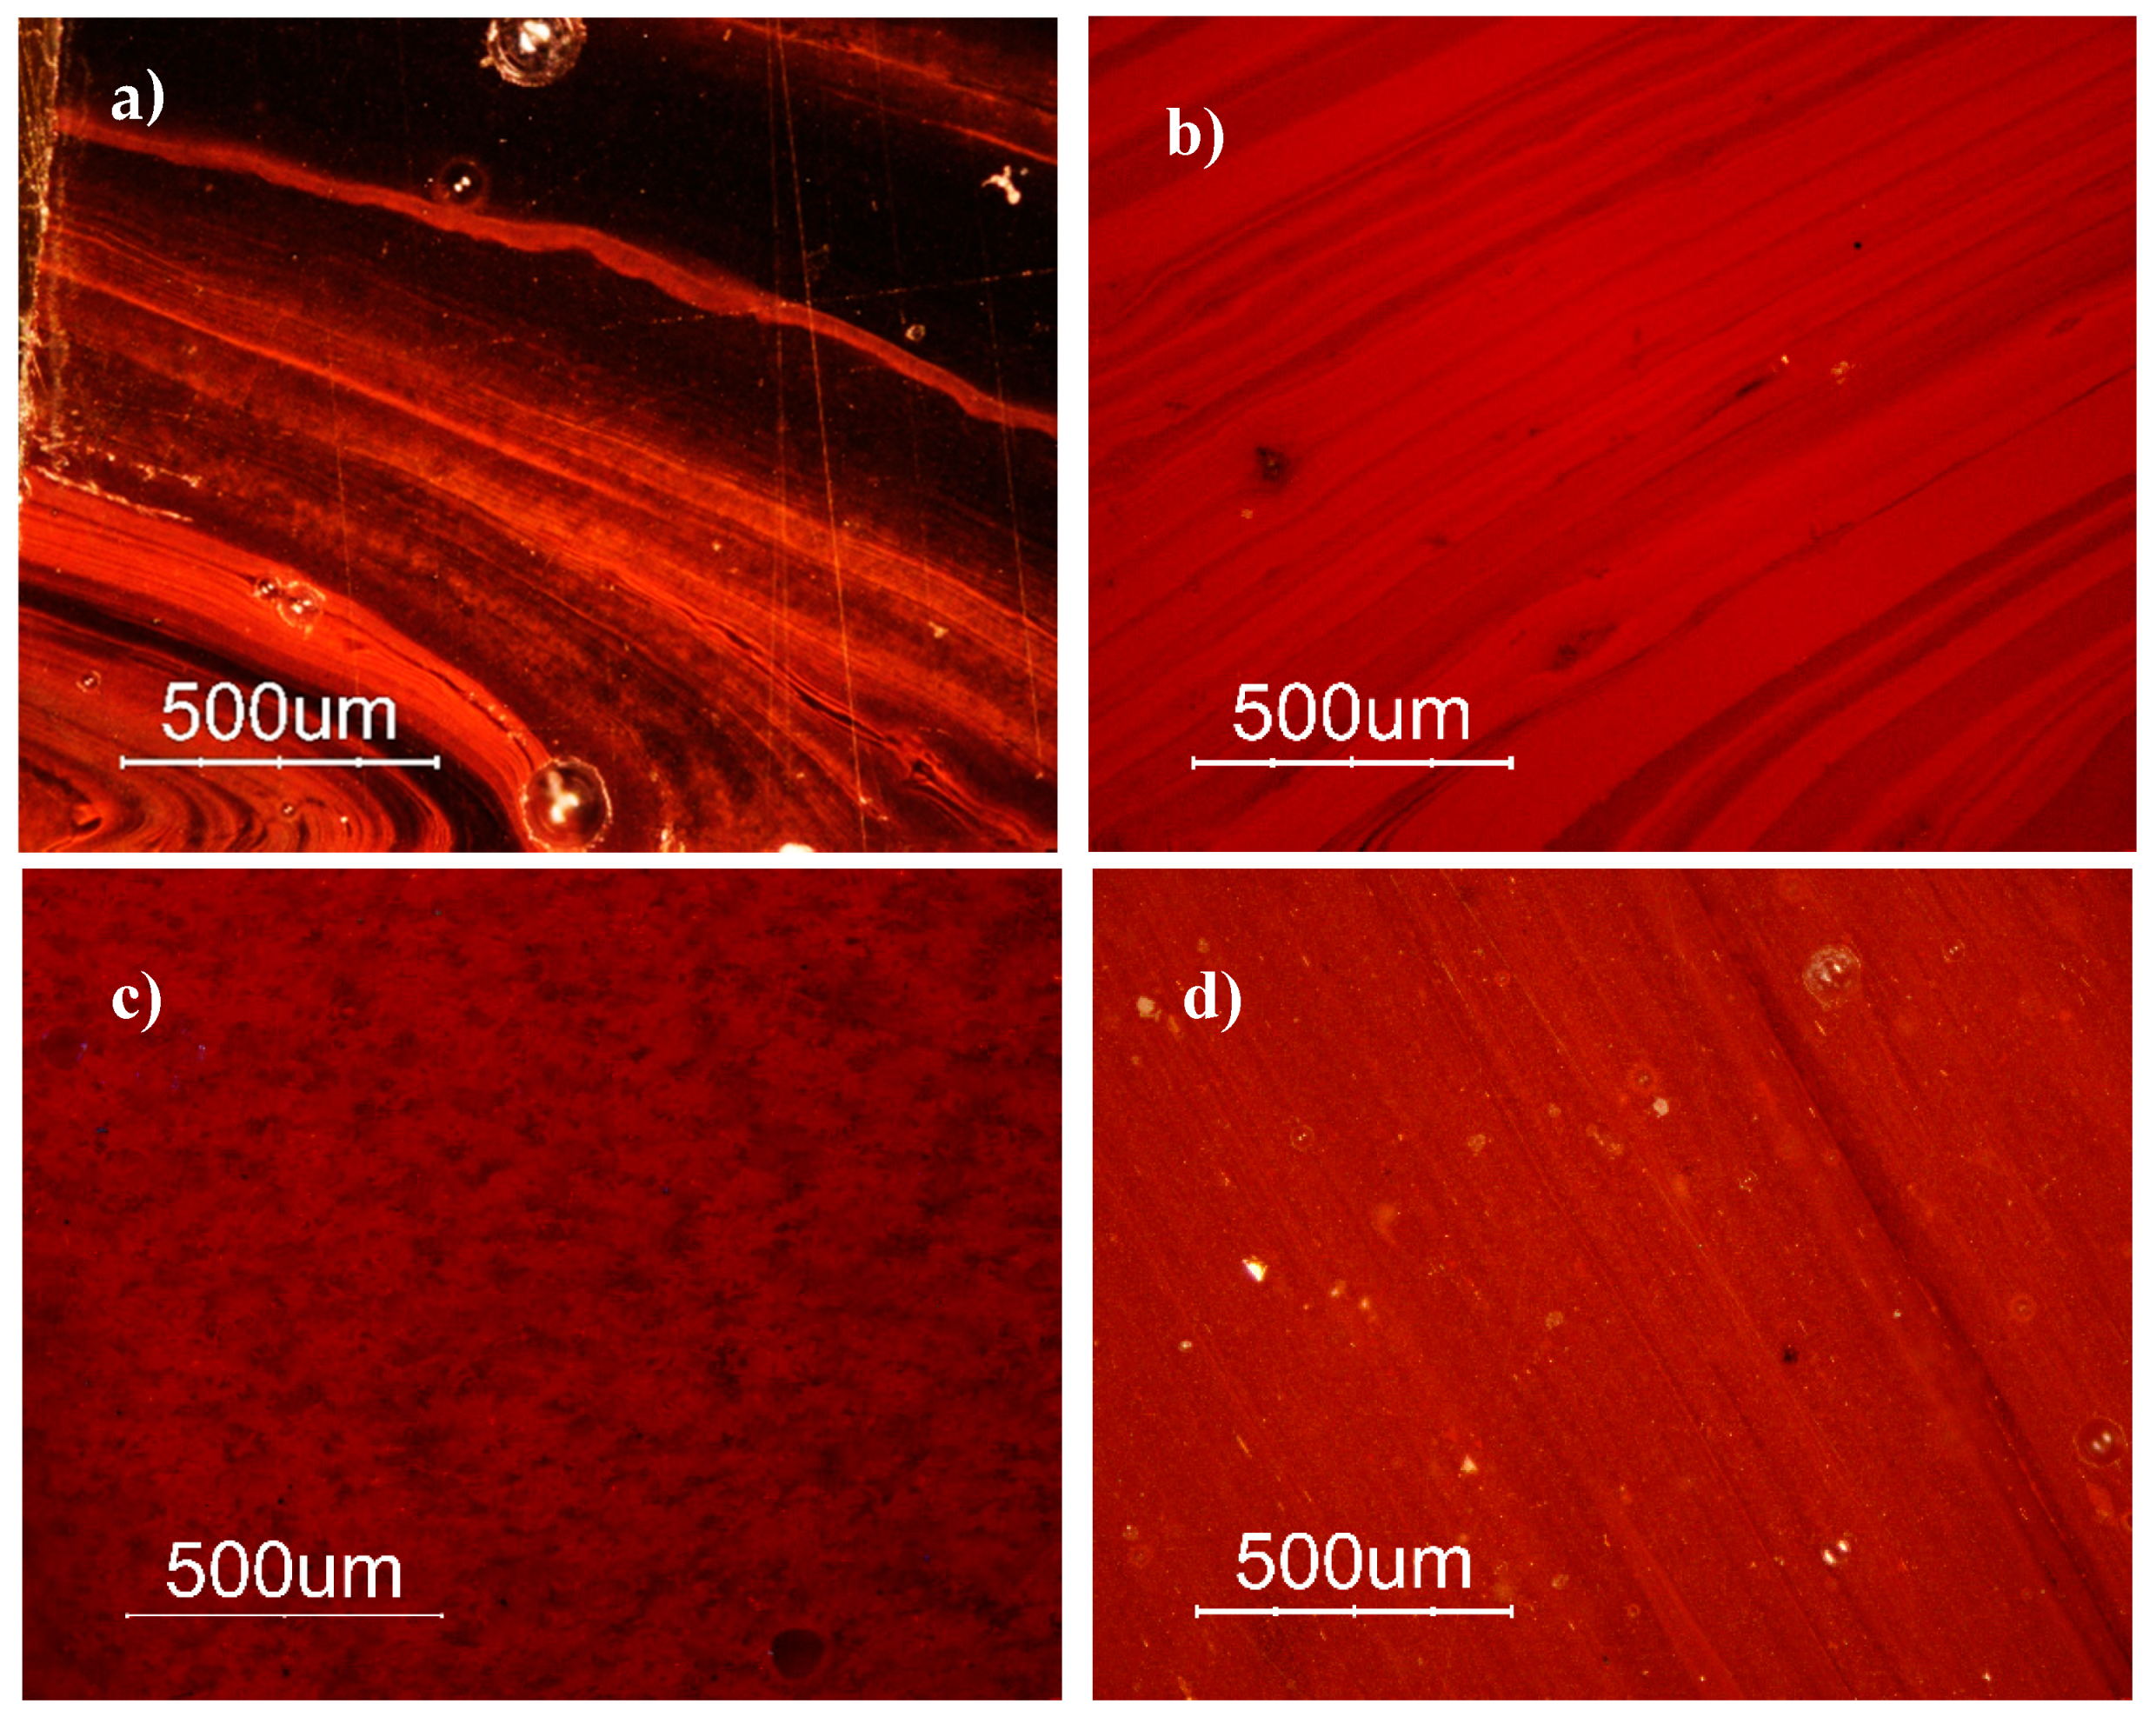
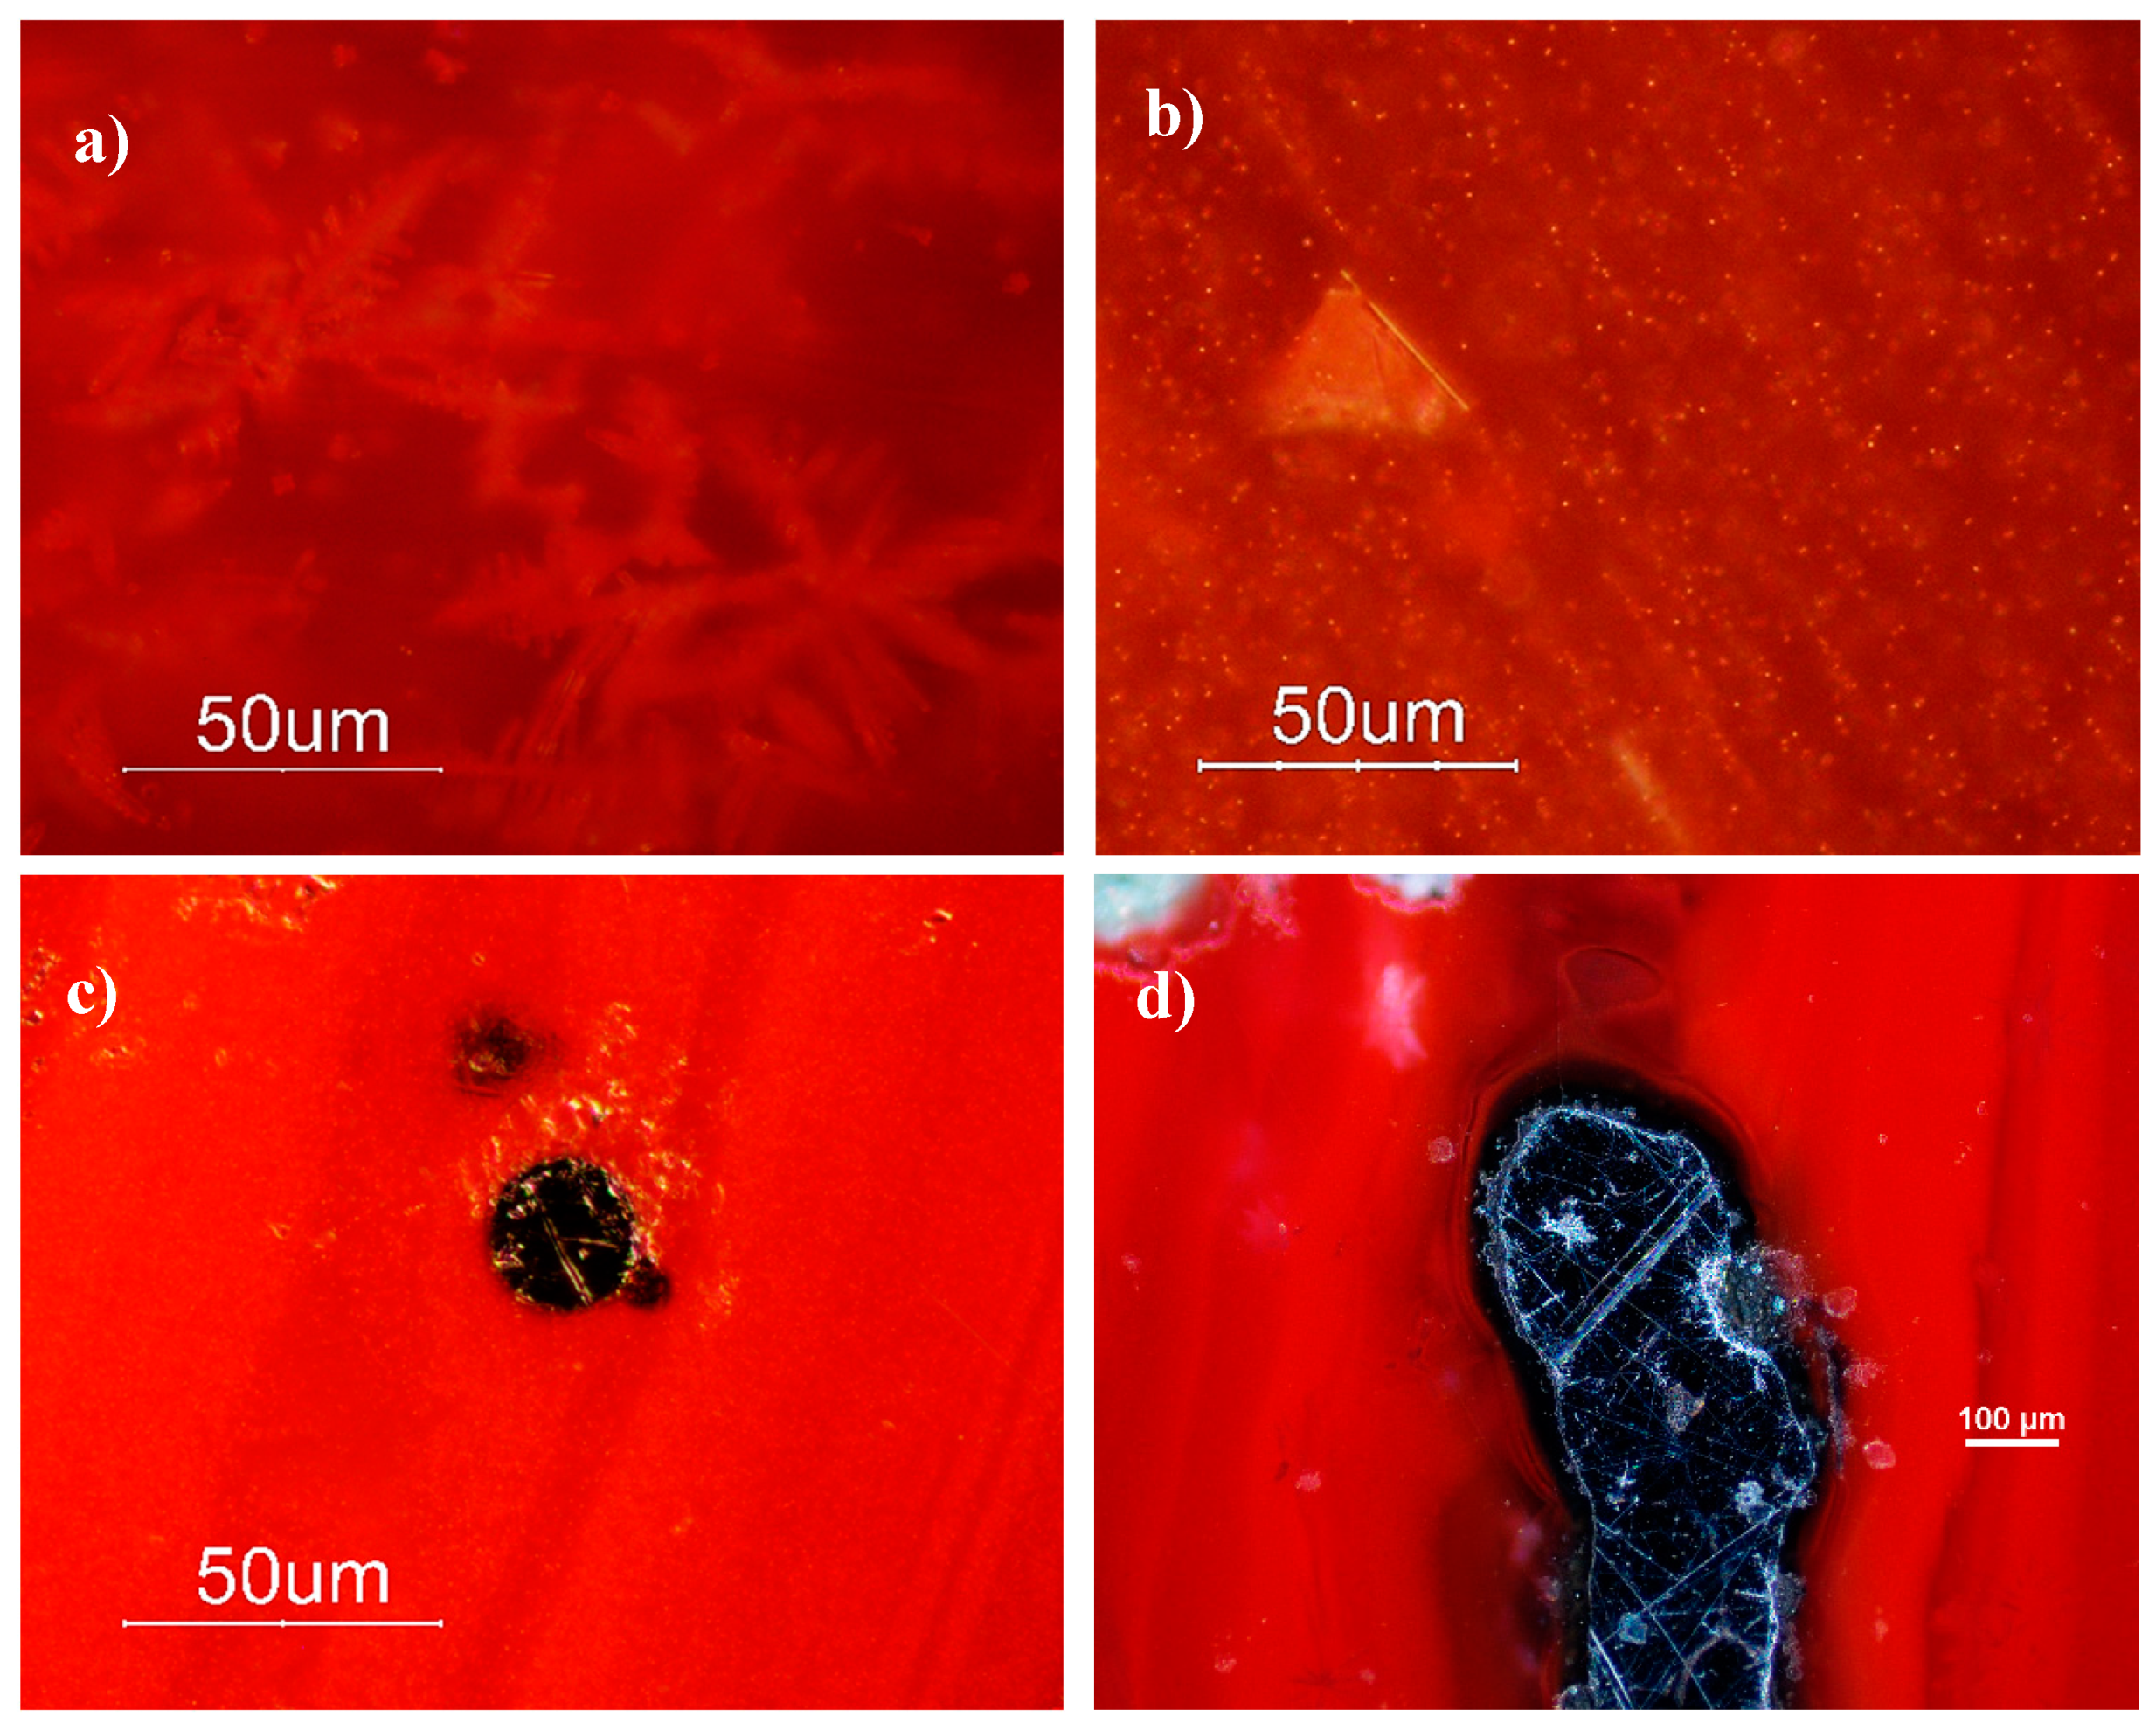
3.2. Optical Microscope
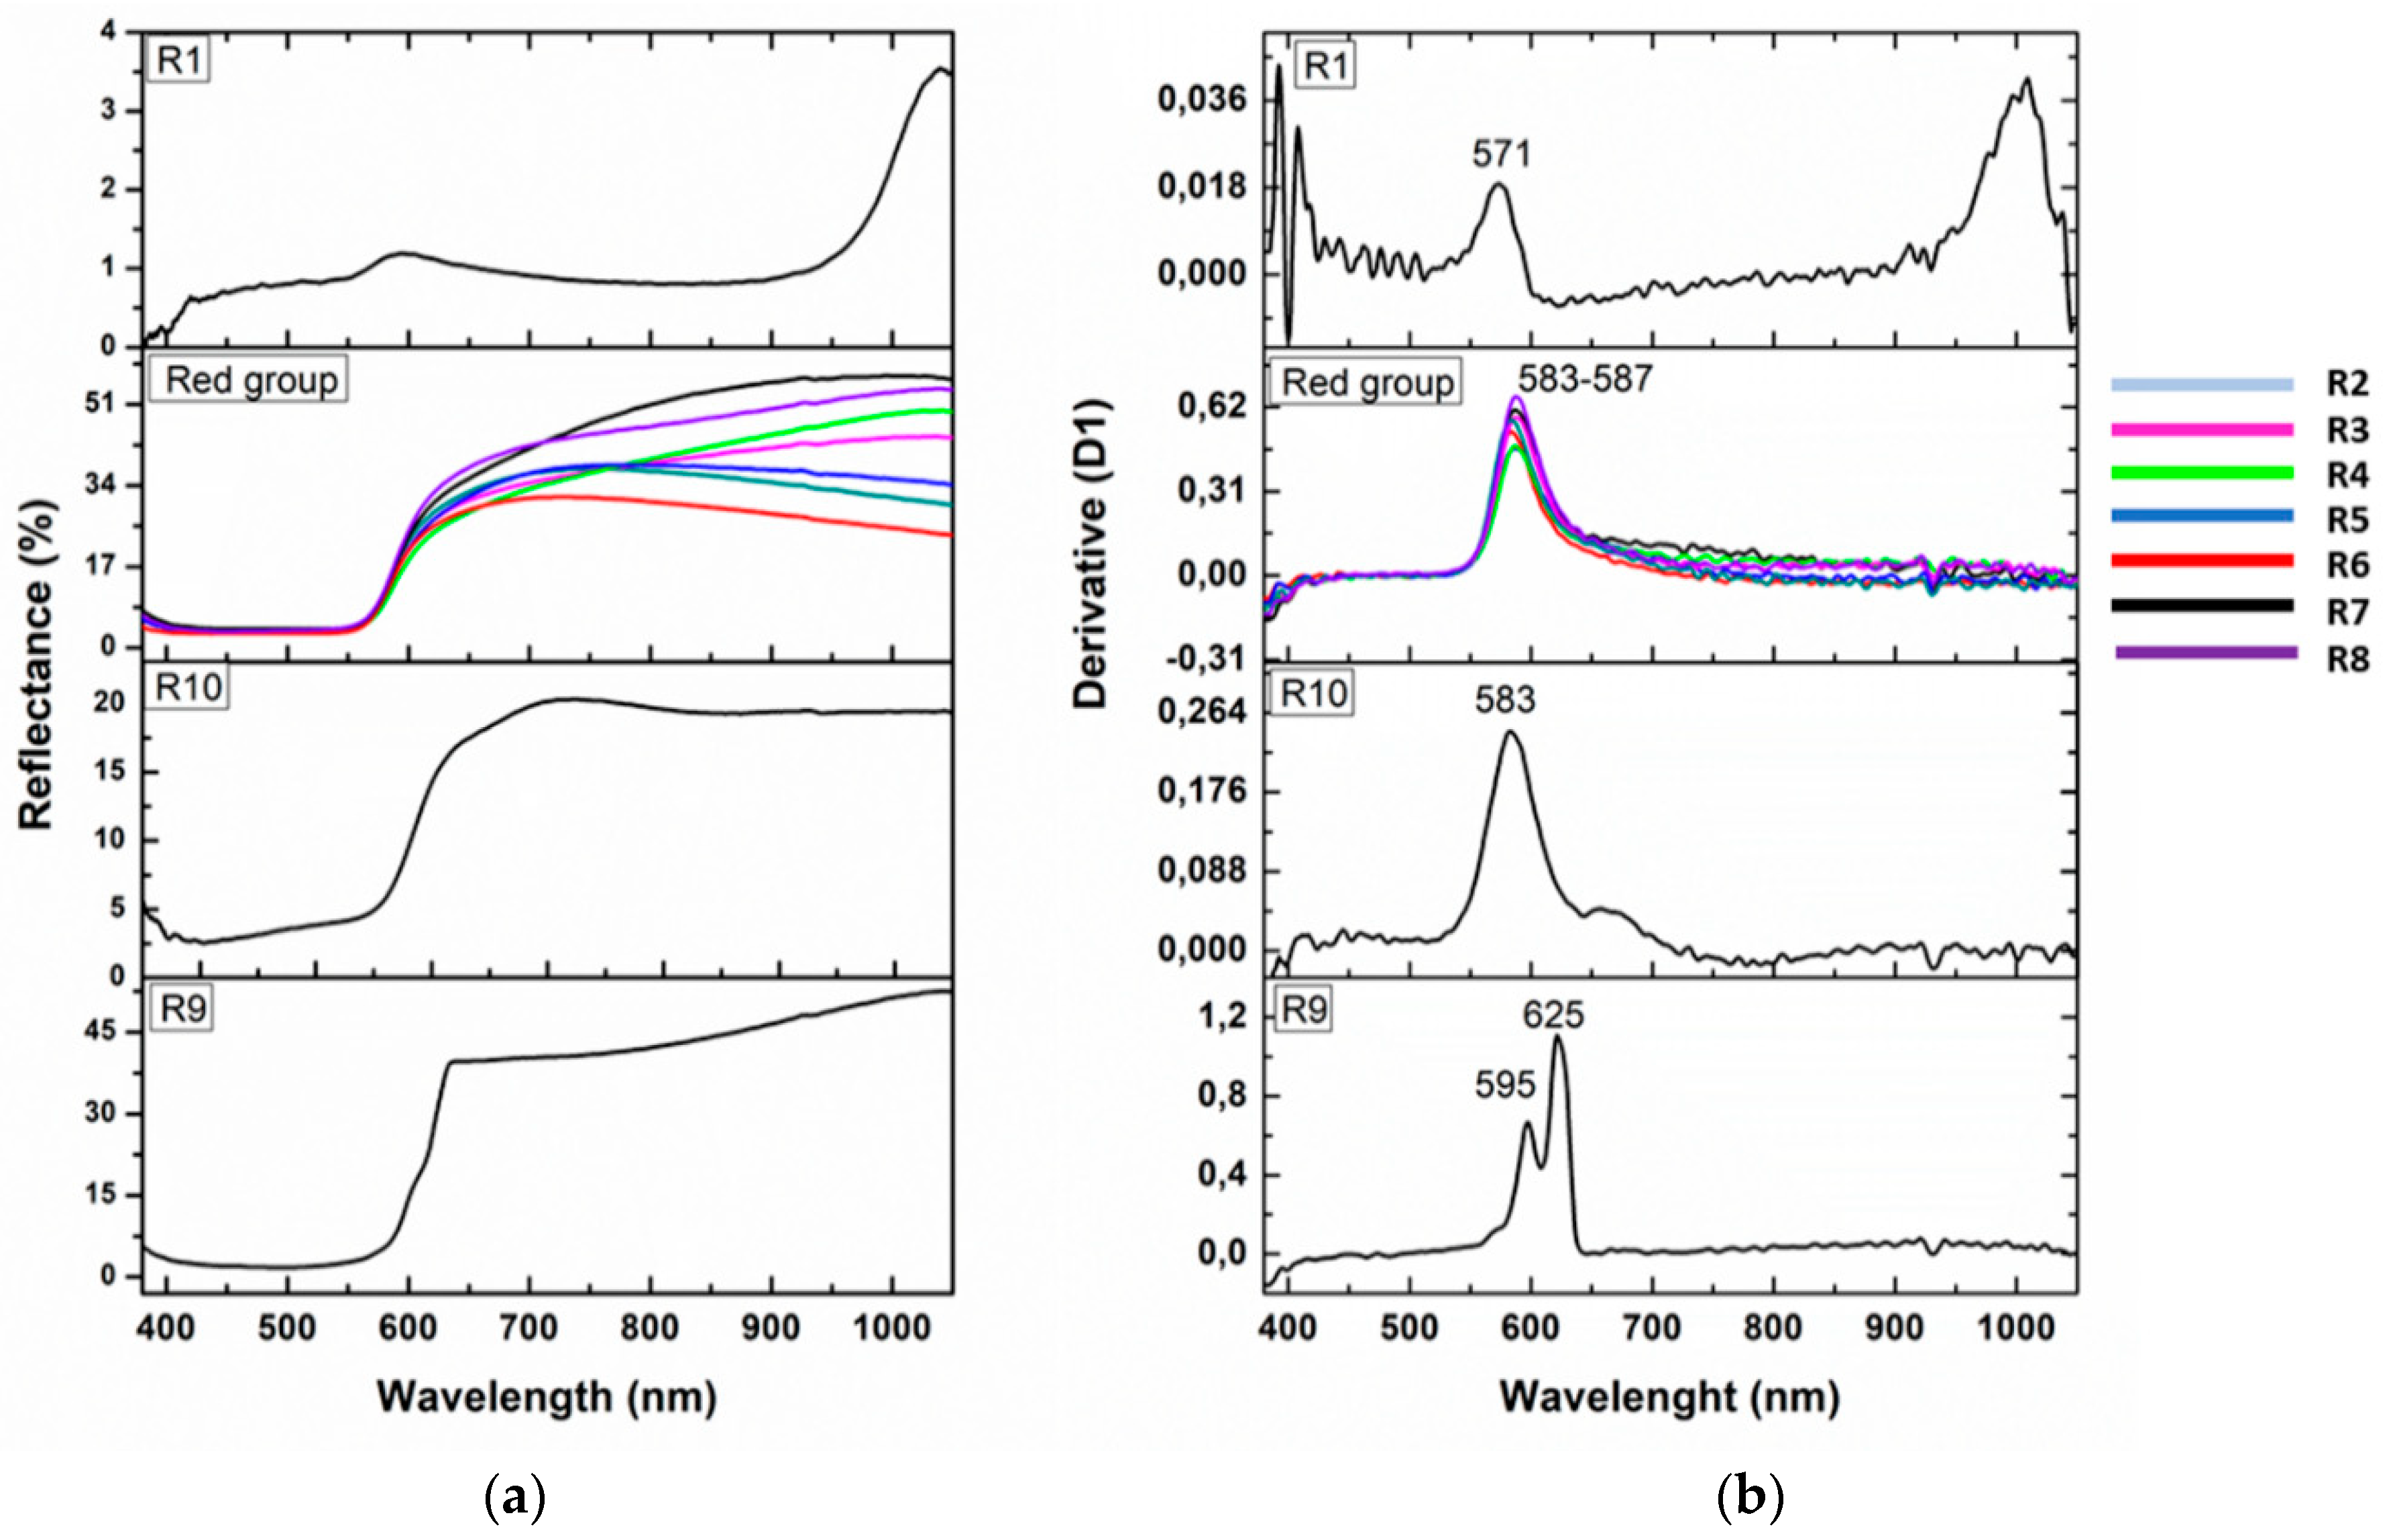
Observation by optical microscope confirmed the four red hues found by colorimetric measurements, showing four different textural features, as is shown in Figure 4. Sample R1 (Figure 4a) is very dark with an alternance of red opaque and black translucent layers. Samples R2-R3-R4-R5-R6-R7-R8 are similar to each other showing a heterogeneous pattern where light red layers alternate with dark red layers (Figure 4b); furthermore, some black translucent veins were observed. Sample R9 exhibits high concentrations of large dendritic crystals (sizes 50–150 μm) in a translucent colourless glass matrix (Figure 4c and Figure 5a); sample R10 is relatively homogenous with the presence of several euhedral crystals (triangle, hexagons) around 50 μm in size (Figure 4d and Figure 5b). Few large metallic inclusions were detected in the samples, usually of spherical shape and up to 50 μm in diameter such as in R3 (Figure 5c), except in sample R8 which shows a large metallic inclusion of more than 100 μm in size (Figure 5d).

3.3. FORS Spectra

Reflectance spectra (Figure 6) confirmed the grouping of samples in four hues showing correspondences with colorimetric measurements and OM observations. Sample R1 is characterized by an inflection point at 571 nm due to metallic copper (Cu0) nanoparticles [35,36,37,38].
Metallic copper is the main colouring agent in the Red-group (R2-R3-R4-R5-R6-R7-R8) and in sample R10, as indicated by the inflection point at 583-587 nm [38,39]. These two hues are distinguished by different reflectance values that apparently make sample R10 darker than the Red-group, which correlates with the colorimetric measurements. Furthermore, the slight inflection point at ca. 650 nm seems to indicate the presence of several iron oxides which could affect the hue of sample R10.
Sample R9 exhibits the characteristic sigmoidal form of semiconductor materials, with two band gaps of 1.98 and 2.08 eV corresponding to an absorption bands at 625 nm and 595 nm respectively, due to the presence of cuprite crystals (Cu2O) of two different sizes [32,33].

3.4. Chemical Analyses

Bulk Composition

The average quantitative chemical composition of the colouring elements of the selected red samples is reported in Table 2. Silica, sodium and calcium oxides are the main glass components (soda-lime-silica glass) except in sample R9 in which high contents of lead (PbO 28.3%) and copper (CuO 9.0%) were observed. Samples R2-R3-R4-R5-R6-R7-R8 show high contents of magnesium (MgO from 1.6% to 3%) and potassium (K2O from 1.8% to 3.4%), and a high concentration of phosphorus (P2O5 from 0.24% to 0.93%). Lower concentrations of MgO and K2O were detected in samples R1 (MgO: 0.74%; K2O: 0.64%) and R10 (MgO: 0.83%; K2O: 0.81%).
A high content of iron was detected in samples R1 and R10 (Fe2O3 3.9 and 4.20% respectively), while in the other samples this varies between 0.42 and 1.50%. A high content of tin oxide was detected in samples R2 and R5 (SnO2 1.32 and 0.94% respectively) while in the other samples it is lower than 1%. Antimony is present in some samples in low concentrations (Sb2O3 <0.5%) except in sample R9 (Sb2O3 1.6%).

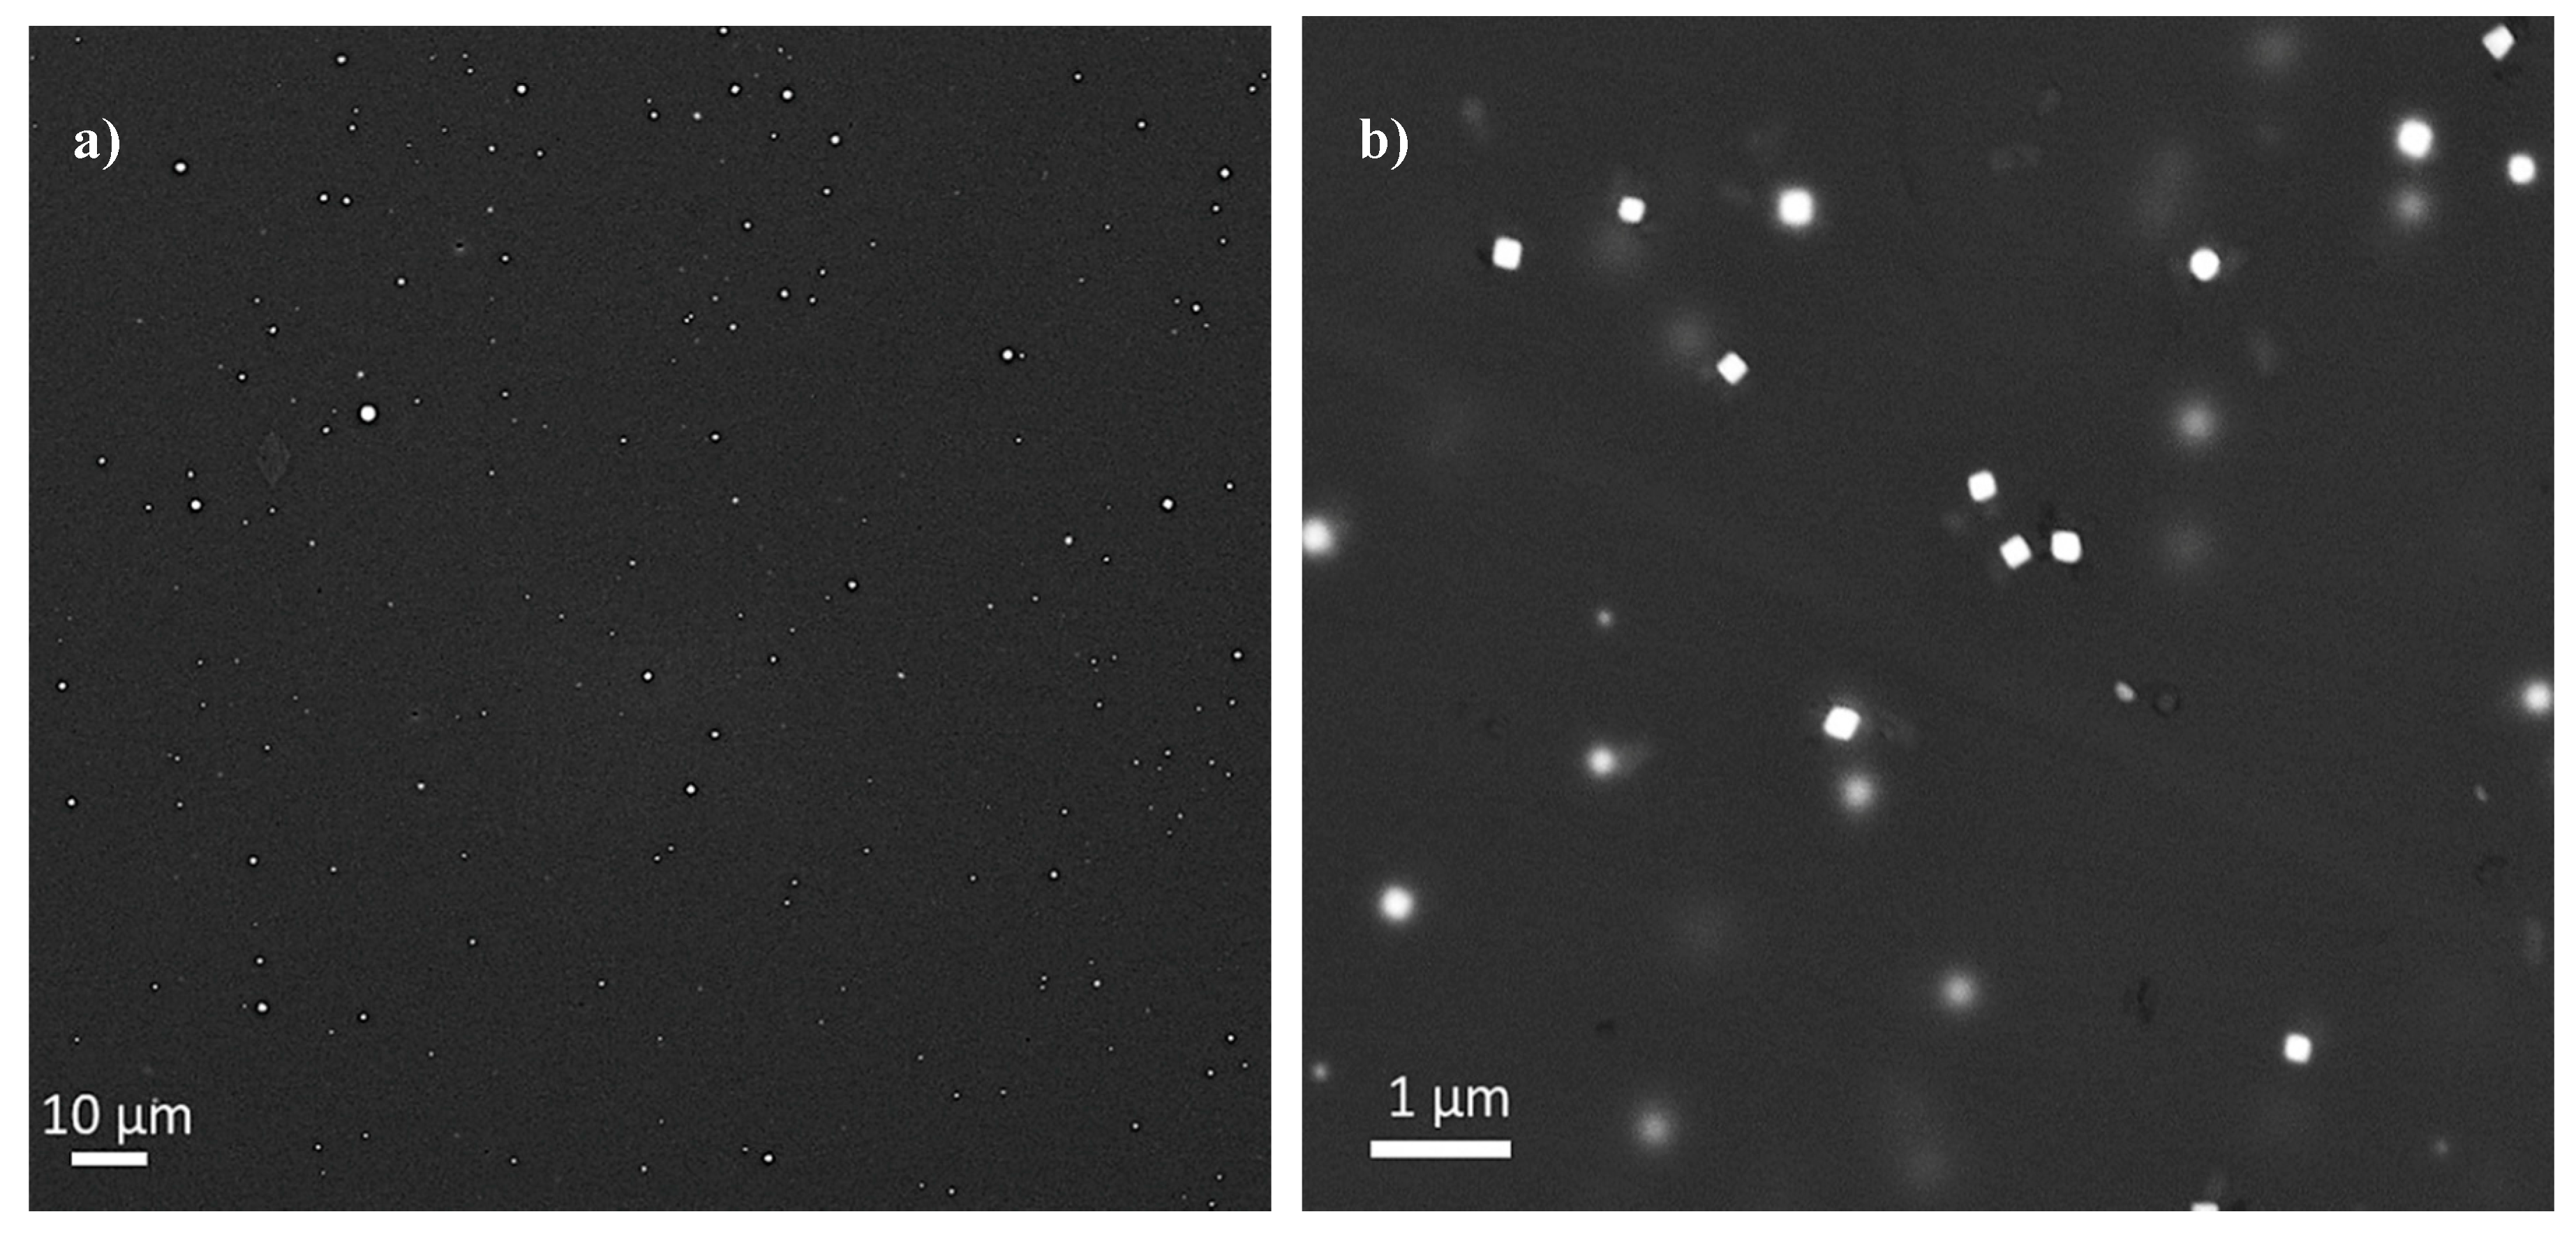
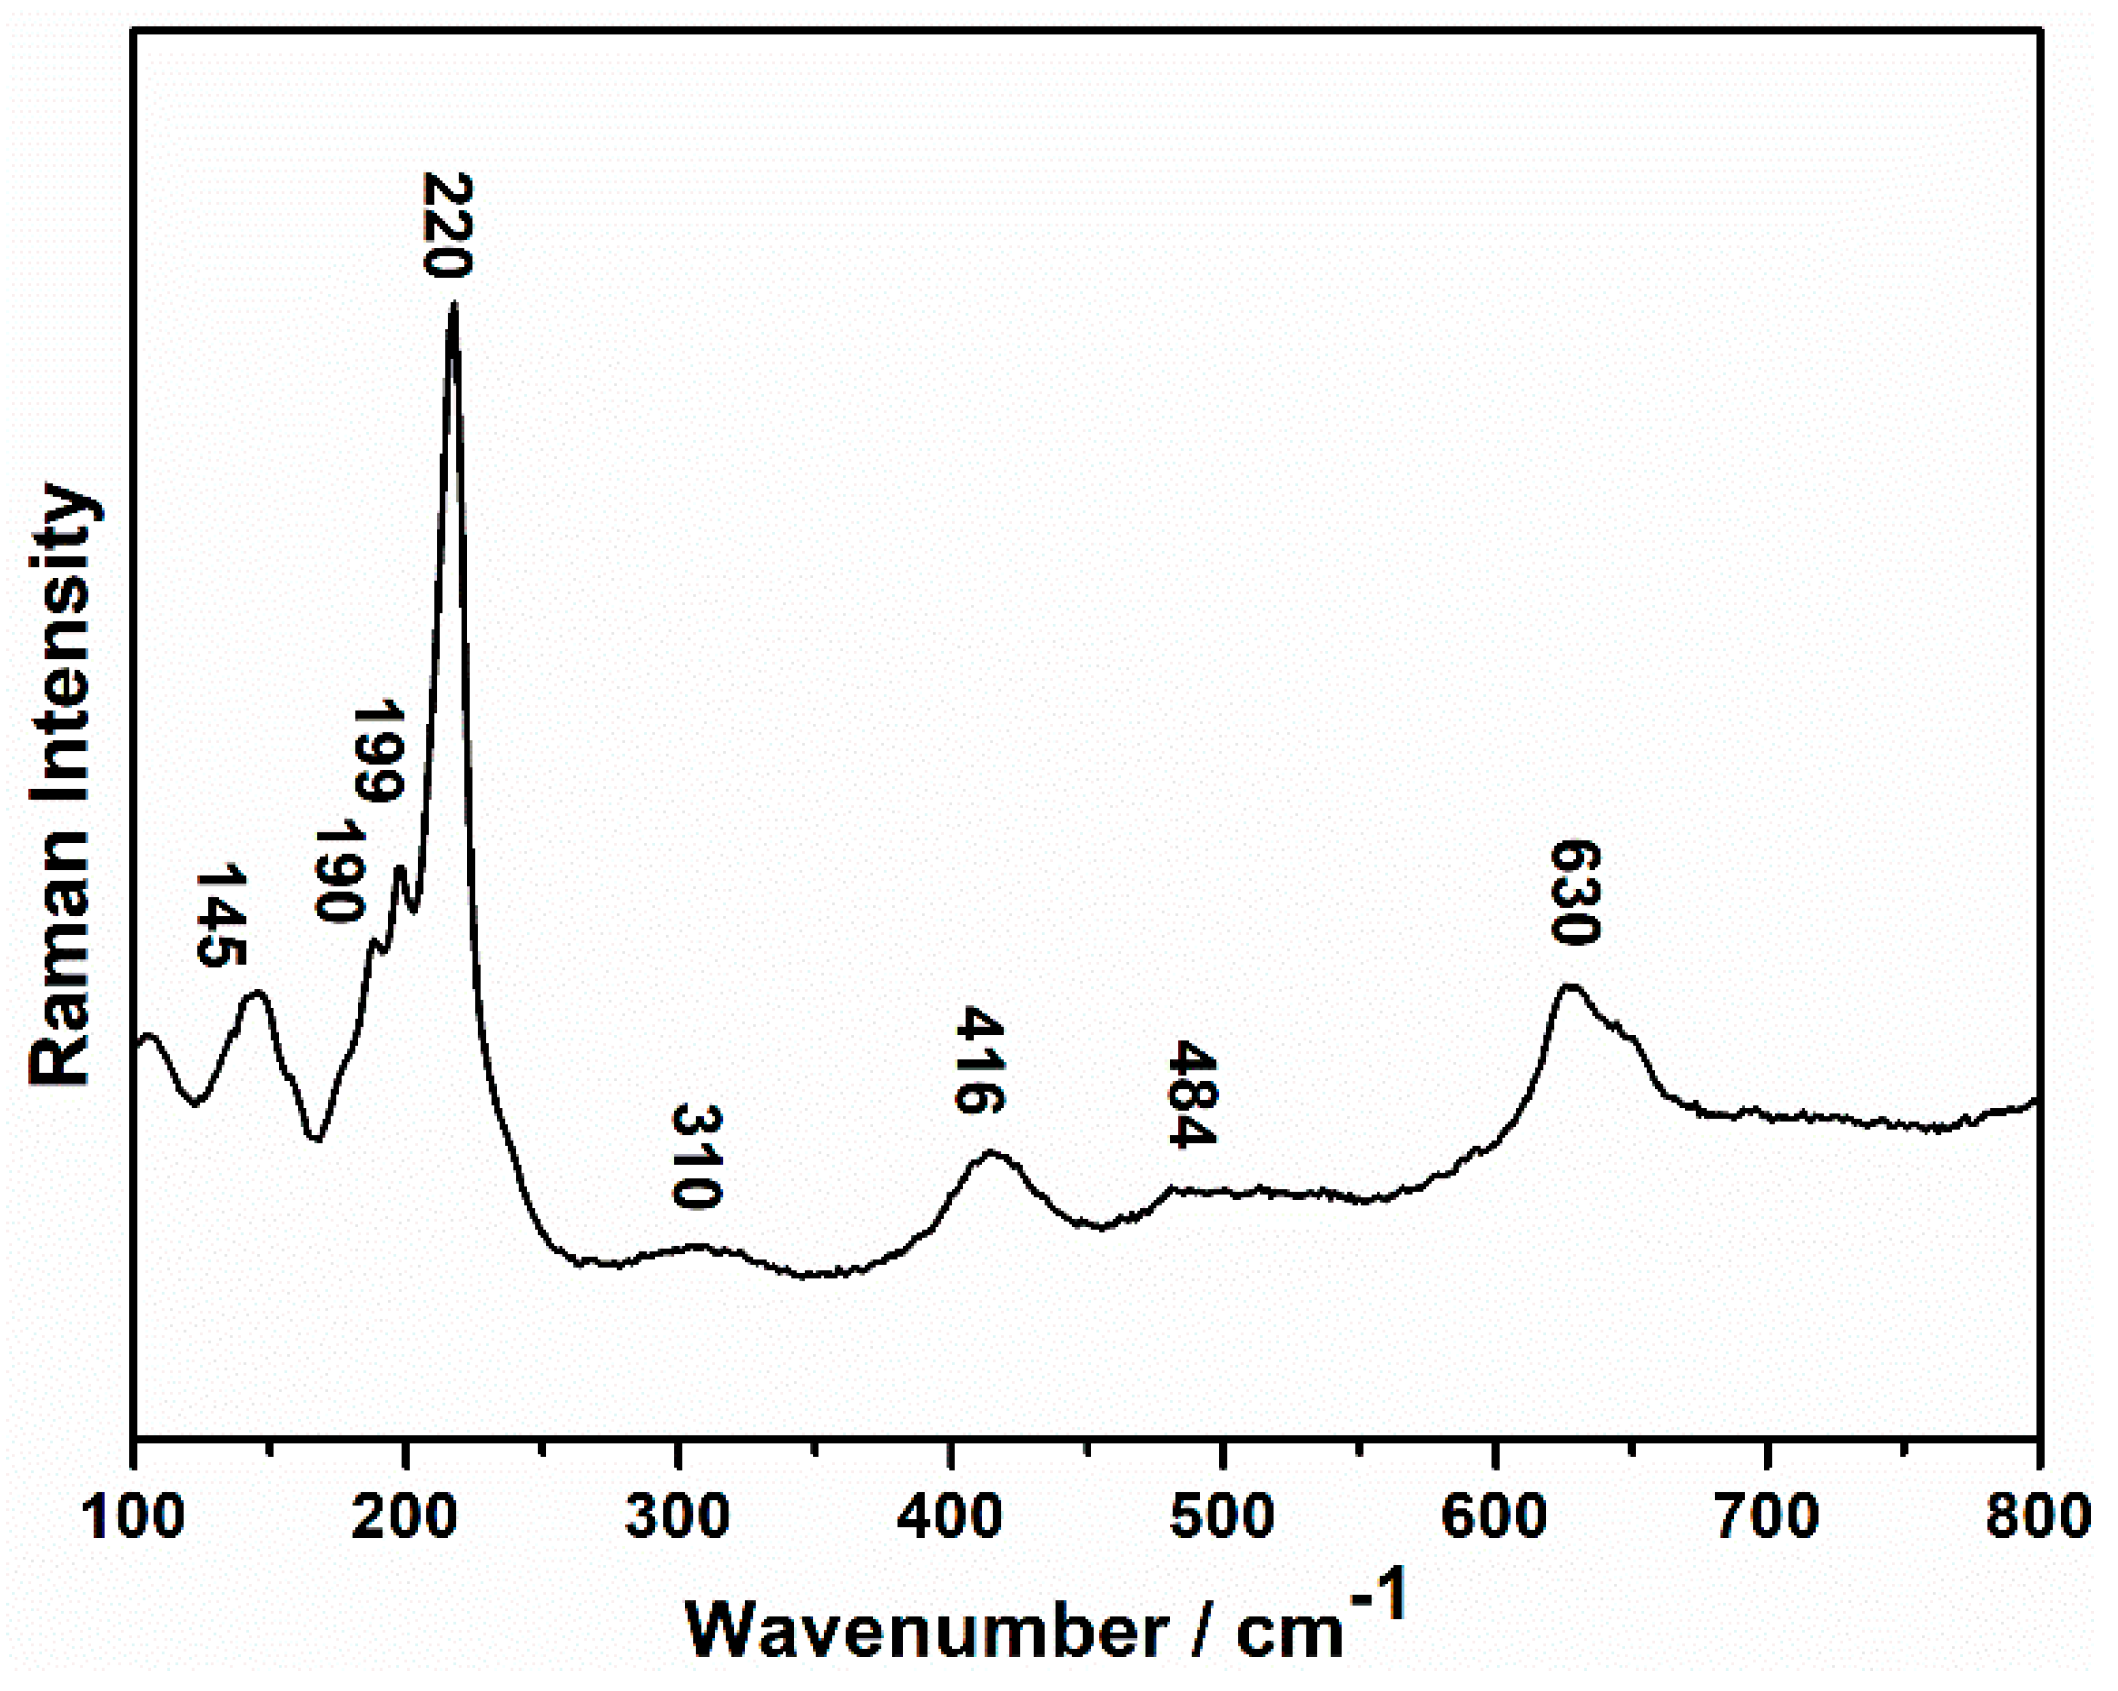
3.5. Crystalline Phases

Copper-rich spherical nanoparticles have been revealed by SEM in samples R1-R2-R5-R6 (Figure 7a). Sizes vary from 60 nm to 200 nm, as shown in Table 3. Following the FORS measurements and low energy EDS analyses, those nanoparticles were identified as metallic copper. In samples R3–R4, the larger metallic copper nanoparticles (between 100–400 nm) have cubic shape (Figure 7b), while particles less than 100 nm in size have spherical shapes. Samples R7-R8 showed copper-rich nanoparticles measuring up to 200 nm of both spherical and cubic shapes. The presence of particles smaller than 60 nm is not excluded in the samples of the Red-group and in sample R1; however it is not possible to detect particles less than 60 nm by FEG-EDS. Sample R10 exhibits hexagonal and cubic rich copper crystals bigger than 1 μm (Figure 7d), which are metallic copper as confirmed by the SEM-EDS investigation and the FORS spectrum. Sample R9 (Figure 7c) contains dendritic crystals identified as cuprite crystals by Raman spectroscopy (Figure 8); moreover, some globular metallic copper particles were also detected by SEM (up to 1 μm).

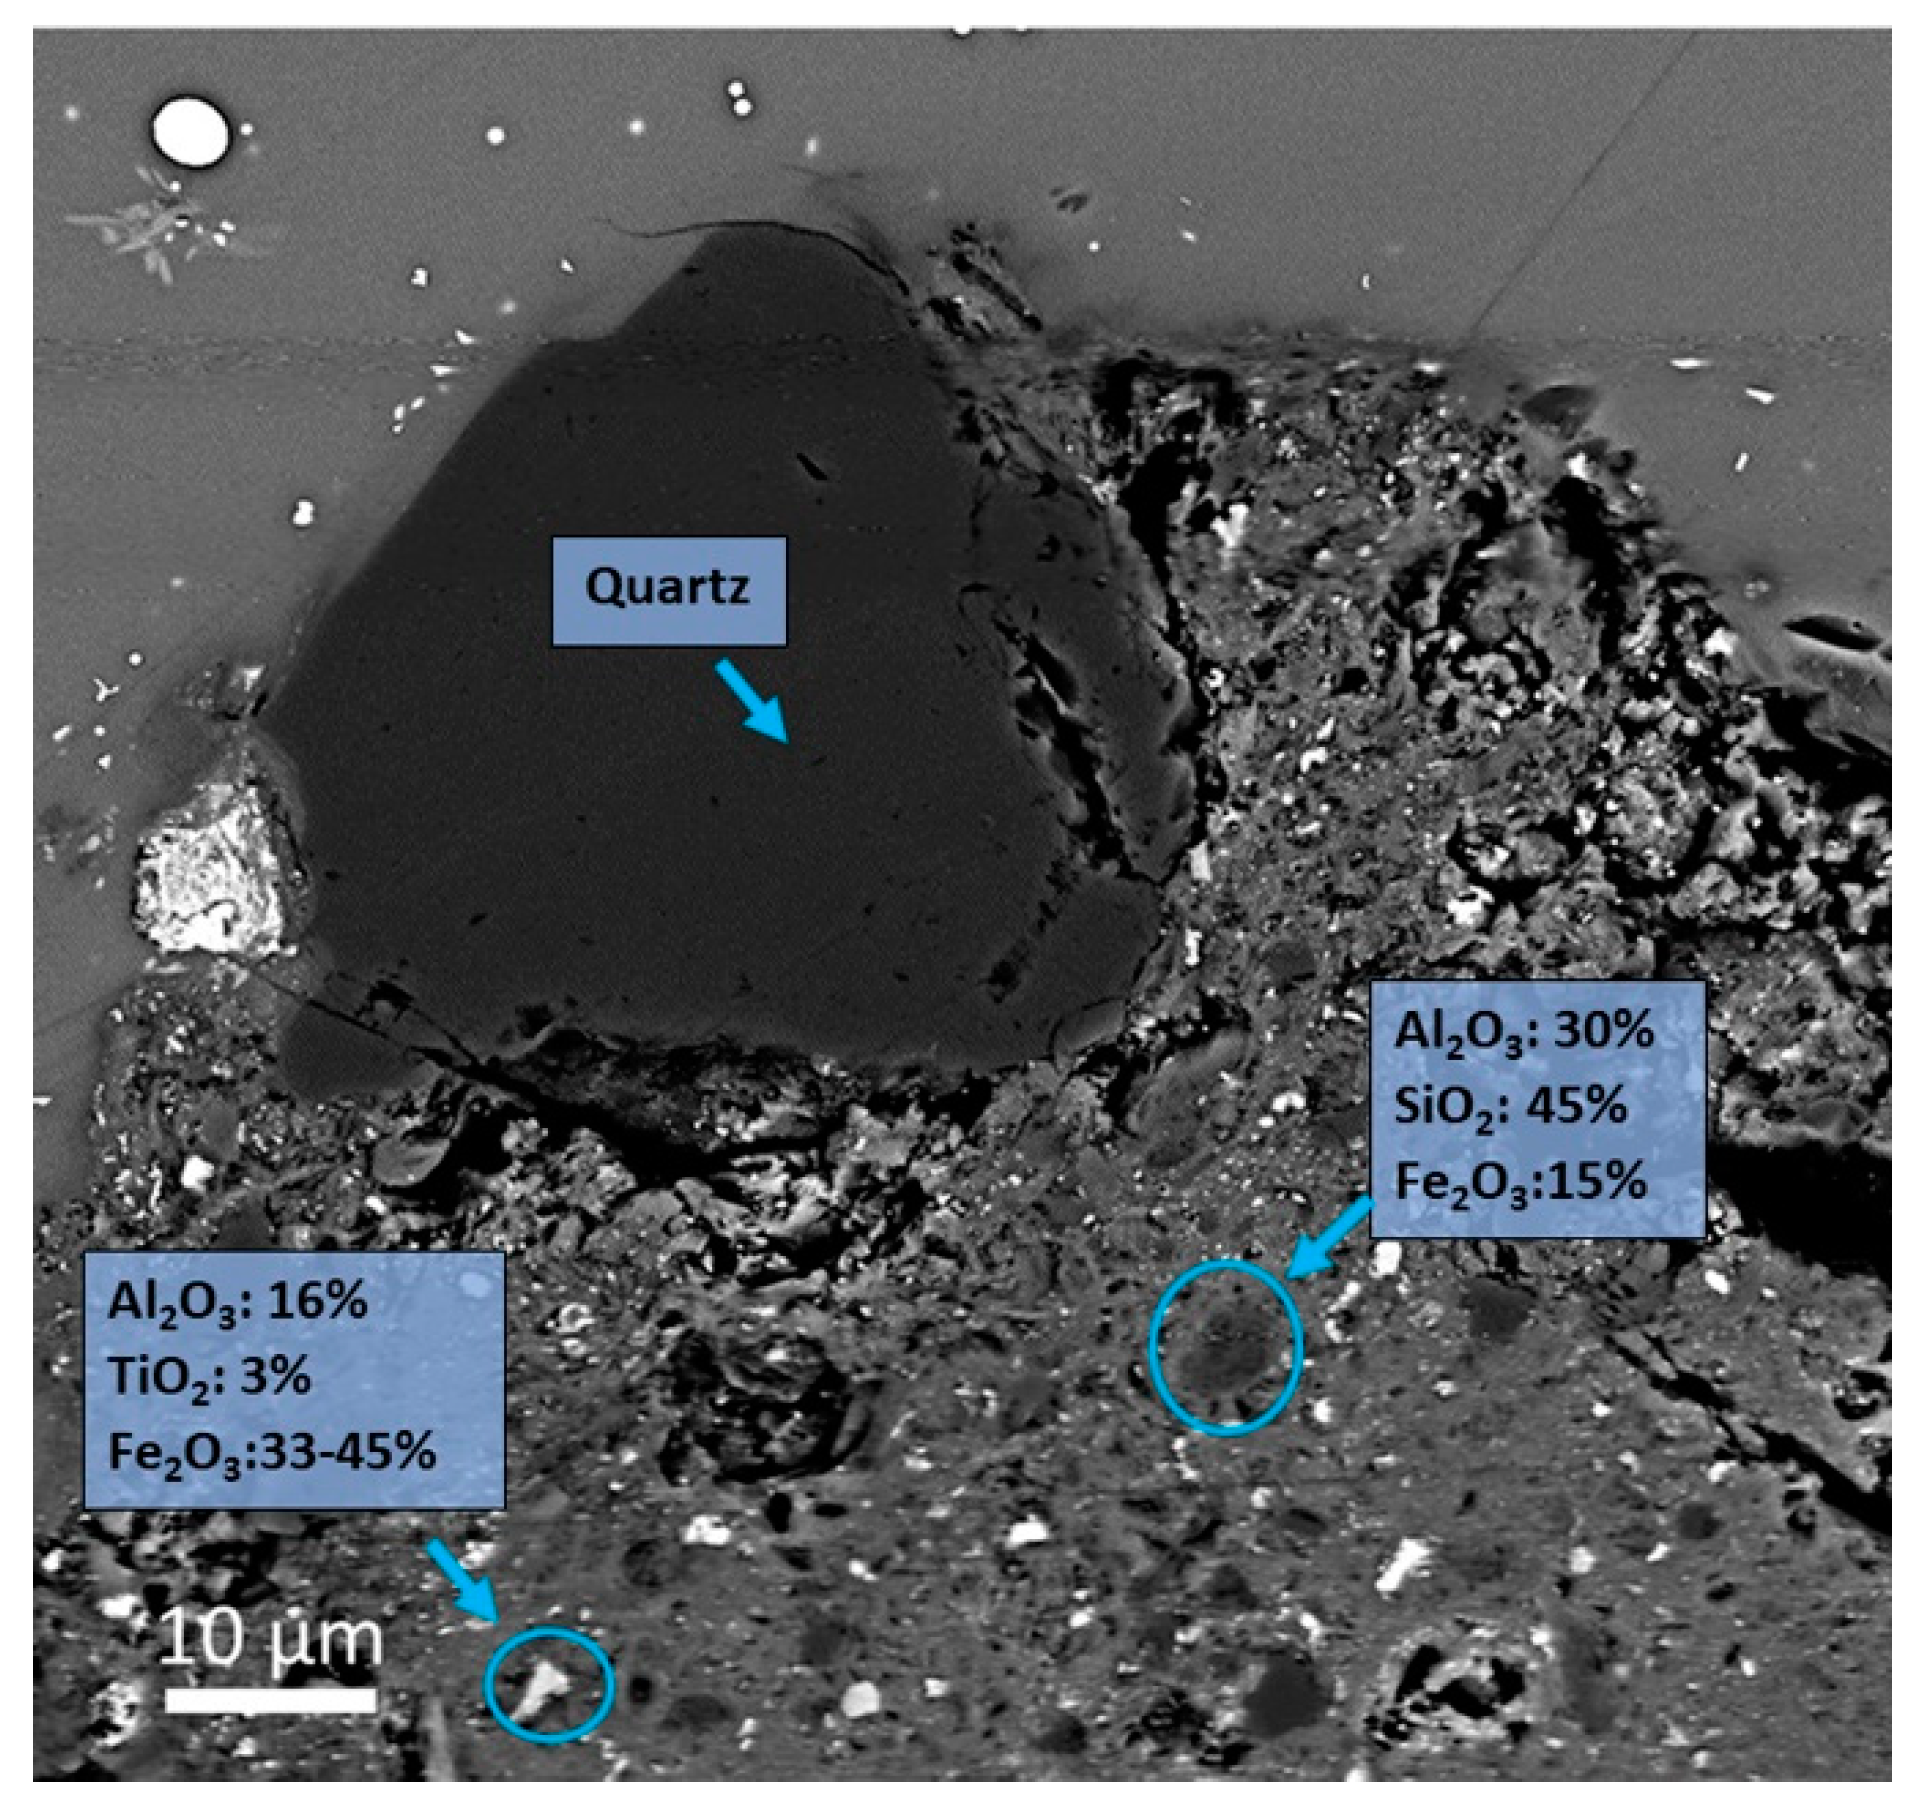
3.6. Other Crystalline Phases and Inclusions

Euhedral crystalline phases rich in Na-Si-Ca or in Si-Ca were detected in almost all samples; their compositions are compatible with devitrite or wollastonite crystals respectively, which are devitrification products formed in soda-lime glass melt during the cooling phase [7].
Different types of inclusions were detected in the samples through SEM-EDS analysis. Few inclusions rich in Fe2O3, SiO2, Al2O3 and TiO2 were revealed in sample R10 (Figure 9) which may be either clay or ceramic. Several polyphase products with high contents of Na2O, SiO2, Al2O3 and Fe2O3 were found in sample R3. Finally, numerous crystalline phases rich in calcium and phosphorus (probably calcium phosphate) were identified in sample R6. Few metallic inclusions in sample R8 composed of copper, lead and sulphur (probably copper sulphide and lead sulphide) were also detected.

4. Discussion

By means of several analytical investigation, four hues have been identified in the red opaque sectilia from the Gorga Collection. Metallic copper is the colouring agent in nine of the samples, while in sample R9, characterized by large concentrations of copper and lead, cuprite crystals are responsible for the red colour.
In samples R2-R3-R4-R5-R6-R7-R8 and R10 a voluntary addition of iron, probably as a reducing agent to support the precipitation of metallic copper particles, was detected [6]. It is still not clear in which form the iron was added, probably as Fe° or Fe2+ or a mixture of both to encourage the redox reaction, in order to obtain metallic copper.
The production technology behind these samples is based on the appropriate chemical composition of the glass melt, which leads to the redox reaction, as well as a fast cooling process to prevent the excessive growth of the metallic copper nanoparticles [5].
The samples in the Red-group (R2-R3-R4-R5-R6-R7-R8) have similar chemical compositions, with high contents of magnesium (MgO > 1.5%) and potassium (K2O > 1.5%) and almost the same concentration of copper (CuO around 2%) and iron (Fe2O3 from 1.10% to 1.6%). The values of MgO, K2O and P2O5, present in these samples suggest the use of soda plant ash as fluxing agent which was uncommon during the Roman age [40]. Although there is still not a clear explanation for this unusual composition, it could be that specific coloured glass was made by specialized workshops which used distinct practices.
Some slight differences were observed through colorimetric measurements and FORS spectra analyses. This could be related to the different sizes of the metallic copper particles detected by SEM. Indeed, samples R3 and R4 revealed larger metallic copper particles (up to 400 nm) than samples R2-R5-R7-R8 (up to 200 nm), which in turn changed the colour of samples R3 and R4 to a more brownish red hue. Moreover, the samples of the Red-group are characterized by a pronounced heterogeneity with red layers of different hues, and in some cases black translucent veins, as observed by OM. Through SEM-FEG analyses no copper particles were detected in the black veins while no significant differences in the chemical composition between black veins and red layers were detected by PIXE and EDS analyses. Therefore, it is probable that the formation of black veins is due to the absence of the correct redox condition in some areas of the melt, preventing the precipitation of metallic copper and producing a translucent glass in which copper ions are dissolved [10]. Although the presence of layers with different red hues is probably due to differences in concentration and in size of metallic copper particles, as observed by OM and SEM-FEG, the causes that led to this pattern are still unclear.
In sample R6, crystalline particles rich in Ca and P, probably calcium phosphate, were found. It is possible that this compound entered the melt through bone ash which was extensively used in the Byzantine and in the early Islamic period as an opacifier for mosaic glass tesserae [41,42].
A High content of iron (Fe2O3 3.9%) was revealed in sample R1, which shows the lowest copper concentration (CuO 0.3%). This glass is made of large translucent dark areas and thin red opaque strips. This pattern was probably intentionally manufactured by Roman glassmakers to imitate natural marbles [43].
Sample R10 differs from the previous group due to its higher content of iron (Fe2O3 4.20%) and copper (CuO 2.85%), and because of the presence of relatively large euhedral metallic copper crystals (flakes) (50 μm) in triangular and hexagonal shapes. In contrast to the technique used to produce the samples of the Red-group, it seems likely that a specific heat treatment was applied (the melt was maintained at a high temperature for a long time, after which it could be slowly cooled) to produce this colour [6]. Sample R10 looks very similar to the aventurine glass invented by Venetian glassmakers at the end of the 16th century AD [28]. The chemical composition establishes that sample R10 is genuine Roman natron glass, with low concentrations of potassium (K2O < 1.5%) and magnesium (MgO < 1.5%) [40], which distinguishes it from the Venetian soda ash glass which has a high content of potassium (K2O > 2.5%) and magnesium (MgO > 2.5%) [44].
It is known that Roman sectilia were designed to imitate specific marbles [1,43]; therefore, it is possible that Roman glassmakers intended to obtain this effect, suggesting that they knew how to manufacture aventurine glass more than thirteen centuries before the Venetian glassmakers. It is also possible that this production was the unexpected result of an occasional melt since up to now only few sectilia of aventurine type were found. Further investigations are under way to clarify this aspect.
Tin and lead are considered other crucial elements in ancient red glass production [23]. They are present in low concentrations in most of the analysed samples (SnO2 0.10–1.32%; PbO 0.11–8.7%) and probably entered the melt as components of copper-rich metal scraps such as brass or bronze used to introduce copper [14,23].
Sealing wax red glass (R9) revealed a chemical composition drastically different from the other red samples, with high concentrations of copper (CuO 8.9%), lead (PbO 28.3%) and antimony (Sb2O3 1.6%). The high lead content in this glass probably serves two main purpose: to decrease the viscosity of glass melt and consequently the working temperature, and to contribute to the redox reaction which leads to the formation of cuprite [5,7,11]. The high concentration of antimony could suggest that it was intentionally added as Sb2O3 to work as a reducing agent. In this sample, the amount of iron is low (Fe2O3 0.45%), probably introduced by the silica source used to make the glass. As suggested by some experimental reproductions [19,45] it is likely that sealing wax was the result of a specific long heat treatment in order to allow the slow formation and growth of dendritic cuprite crystals [19,45]. The presence of some metallic copper particles in this sample, detected by SEM-FEG, could be due to the strong reducing conditions in the furnace during the heat treatment, which promoted a further reduction of cuprous oxide [45].

5. Conclusions

In this work, the nature and chemical compositions and the crystalline phases present in 10 Roman opaque red samples from the sectilia of the Gorga collection, were investigated through several analytical techniques in order to understand the origin of the colour and of different red hues. The multi-analytical approach allowed the detection of four red hues which are the results of specific production processes. Different chemical compositions, and probably different heat treatments, were applied to modify the size of metallic copper crystals and consequently the final colour of the sectilia.
Metallic copper is the colouring agent in samples R1-R2-R3-R4-R5-R6-R7-R8-R10, in which the sizes of the particles and the amount of iron distinguish the three shades of red of this red-brown group. Metallic copper particles in the range of 60 to 400 nm were found in these samples, except in sample R10 where metallic copper flakes larger than 1 μm, similar to the Venetian aventurine glass were detected. Further investigation is in progress to characterize other similar Roman glass samples.
Sample R1 is characterized by a high content of iron and low content of copper oxides, and by the presence of stripes of translucent black and red opaque glass.
Cuprite crystal of micrometric sizes were detected in sample R9 confirming that the sealing wax red colour was still produced in Roman glass factories during the 2nd century AD. The literature identifies sealing wax red glass as the brightest opaque red glass and red-brown as the duller one; however, this study showed that this distinction is not always exact as Roman glass sectilia coloured by cuprite are very difficult to distinguish from these coloured by metallic copper through visual inspection and colourimetric analysis. This shows the skill of Roman glassmakers in the production of glass colour.
Highly specialized glassmakers produced the red samples for the opus sectile decoration of Lucius Verus villa. Further investigation will help to understand the production technology and shed light on the process used to create these specific effects and the colours that this work has revealed.

Author Contributions

Conceptualization M.B. and M.V. (Marco Verità); Data curation, M.B., P.L., M.V. (Marco Verità) and L.A.; Formal analysis, M.B., P.L., M.V. (Marco Verità) and L.A.; Investigation, M.B., P.L. and M.V. (Marco Verità); Methodology, M.B., P.L. and M.V. (Marco Verità); Resources, I.B.; Supervision, M.V. (Marco Verità) and M.V. (Marcia Vilarigues); Visualization, I.B.; Writing – original draft, M.B.; Writing – review & editing, M.V. (Marco Verità) and M.V. (Marcia Vilarigues)

Funding

This research was funded by the Portuguese Foundation for Science and Technology (FCT-MCTES), for PhD grant PD/BD/135053/2017.

Acknowledgments

The authors acknowledge the Portuguese Foundation for Science and Technology (FCT-MCTES) for PhD grant PD/BD/135053/2017, the Research Units VICARTE (UID/EAT/00729/2019) for supporting this project. L. Saguì and Soprintendenza Archeologica di Roma gave us access to the glass samples studied. Daneo (Stazione Sperimentale del Vetro, Murano) for the colorimetric measurements; C2TN (Center for Nuclear Science and Technology) for PIXE analyses, Eva Mariasole Angelin for the FORS analyses at scientific laboratory in DCR Lisbon and Prof. M. Bacci for his personal suggestions on the interpretation of FORS spectra.

Conflicts of Interest

The authors declare no conflict of interest.

References

  1. Saguì, L.; Santopadre, P.; Verità, M. Technology, Colours, Forms, and Shapes in the 2nd Century Glass Opus Sectile Materials from the Villa of Lucius Verus in Rome. In Proceedings of the Annales du 18e Congrès de l’Association International pour l’Histoire du Verre, Thessaloniki, Greece, 20–25 September 2009; Ignatiadou, D., Antonaras, A., Eds.; ZITI Publishing: Thessaloniki, Greece, 2012; pp. 133–138. [Google Scholar]
  2. Saguí, L. La villa di Lucio Vero sulla via Clodia e le sue decorazioni in vetro. In Proceeding of Emergenze Storico-Archeologiche di un Settore del Suburbio di Roma: La Tenuta Dell’acqua Traversa; Vistoli, F., Ed.; Atti Della Giornata di Studio: Rome, Italy, 2003; pp. 211–228. [Google Scholar]
  3. Hughes, M.J. A technology study of opaque red glass of the Iron Age in Britain. Proc. Prehist. Soc. 1972, 38, 98–107. [Google Scholar] [CrossRef]
  4. Bimson, M. Opaque red glass: A review. In Early Vitreous Materials; British Museum Occasional Paper 56; Bimson, M., Freestone, I.C., Eds.; British Museum: London, UK, 1987; pp. 165–171. ISBN 978-0861590568. [Google Scholar]
  5. Weyl, W.A. Coloured Glasses; Society of Glass Technology: Sheffield, UK, 1951; ISBN 9780900682063. [Google Scholar]
  6. Ahmed, A.A.; Ashour, G.M.; El-Shamy, T.M. The effect of melting conditions on the crystallization of cuprous oxide and copper in glass. In Proceedings of the 11th international Congress of Glass, Prague, Czechoslovakia, 4–8 July 1977; pp. 177–187. [Google Scholar]
  7. Volf, M.B. Chemical Approach to Glass; Elsevier Science Publishing Company Inc.: Amsterdam, The Netherlands, 1984; Volume 7, ISBN 0-444-99635-4. [Google Scholar]
  8. Brown, S.F.; Norton, F.H. Constitution of Copper-Red Glazes. J. Am. Ceram. Soc. 1959, 42, 499–503. [Google Scholar] [CrossRef]
  9. Tress, H.J. Ruby glass and related glasses from standpoint of the chemical potential of oxygen in glass. Part 1, Physics and Chemistry of Glasses. Glass Technol. 1962, 3, 28–36. [Google Scholar]
  10. Tress, H.J. Ruby glass and related glasses from standpoint of the chemical potential of oxygen in glass. Part 2, Gold and copper glasses. Glass Technol. 1962, 3, 95–106. [Google Scholar]
  11. Cable, M.; Smedley, J.W. The Replication of an opaque red glass from Nimrud. In Early Vitreous Materials; British Museum Occasional Paper 56; Bimson, M., Freestone, I.C., Eds.; British Museum: London, UK, 1987; pp. 151–164. ISBN 978-0861590568. [Google Scholar]
  12. Bamford, C.R. Colour Generation and Control in Glass; Elsevier Scientific Publishing Company: Amsterdam, The Netherlands, 1977; Volume 3, ISBN 1520-6378. [Google Scholar]
  13. Brun, N.; Mazerolles, L.; Pernot, M. Microstructure of opaque red glass containing copper. J. Mater. Sci. Lett. 1991, 10, 1418–1420. [Google Scholar] [CrossRef]
  14. Brill, R.H.; Cahill, N.D. A Red Opaque Glass from Sardis and Some Thoughts on Red Opaque in General. J. Glass Stud. 1988, 30, 16–27. [Google Scholar]
  15. Ishida, S.; Takeuchi, N.; Hayashi, M.; Wakamatsu, M. Role of Sn2+ in development of red colour during reheating of copper glass. J. Non-Cryst. Solids 1987, 95, 793–800. [Google Scholar] [CrossRef]
  16. Padovani, S.; Sada, C.; Mazzoldi, P.; Brunetti, B.; Borgia, I.; Sgamellotti, A.; Giulivi, A.; D’Acapito, F.; Battaglin, G. Copper in glazes of Renaissance luster pottery: Nanoparticles, ions, and local environment. Appl. Phys. 2003, 93, 10058–10063. [Google Scholar] [CrossRef]
  17. Nakai, I.; Numako, C.; Hosono, H.; Yamasaki, K. Origin of the red colour of Satsuma copper-ruby glass as determined by EXAFS and optical absorption Spectroscopy. J. Am. Ceram. Soc. 1999, 82, 689–784. [Google Scholar] [CrossRef]
  18. Freestone, I.C. Composition and microstructure of opaque red glass, in Bismon and Freestone. In Early Vitreous Materials; British Museum Occasional Paper 56; Bimson, M., Freestone, I.C., Eds.; British Museum: London, UK, 1987; pp. 173–191. ISBN 978-0861590568. [Google Scholar]
  19. Ahmed, A.A.; Ashour, G.M. Effect of heat treatment on the crystallisation of cuprous oxide in glass. Glass Technol. 1981, 22, 24–33. [Google Scholar]
  20. Turner, W.E.S. Glass Fragments from Nimrud of the Eighth to the Sixth Century BC. Iraq 1955, 17, 57–68. [Google Scholar] [CrossRef]
  21. Brun, N.; Pernot, M. The Opaque Red Glass of Celtic Enamels from Continental Europe. Archaeometry 1992, 34, 235–252. [Google Scholar] [CrossRef]
  22. Davis, M. Sealing wax red glass in Late Iron Age Britain. PAST 2017, 86, 5–7. [Google Scholar]
  23. Freestone, I.C.; Stapleton, C.P.; Rigby, V. The production of red glass and enamel in the Late Iron Age, Roman and Byzantine periods. In Through a Glass Brightly: Studies in Byzantine and Medieval Art and Archaeology; Presented to David Buckton; Entwistle, C., Buckton, D., Eds.; Oxbow Books: Oxford, UK, 2003; pp. 142–154. ISBN 978-1785702518. [Google Scholar]
  24. Fiori, C. Production technology of Byzantine red mosaic glasses. Ceram. Int. 2015, 41, 3152–3157. [Google Scholar] [CrossRef]
  25. Moretti, C.; Gratuze, B. Vetri rossi al rame e avventurina. Confronto di analisi e ricette. Rivista Stazione Sperimentale del Vetro 1999, 3, 147–160. [Google Scholar]
  26. Zecchin, L. Vetro e Vetrai di Murano; Arsenale: Venice, Italy, 1989; Volume 2, pp. 327–333. ISBN 88-7743-048-6. [Google Scholar]
  27. Moretti, C.; Gratuze, B. I vetri rossi al rame. Confronto di analisi e ricette. In Proceedings of the Annales du 14e Congrès de l’Association International pour l’Histoire du Verre, Venezia-Milano, Italy, 27 October–1 November 1998; pp. 227–232. [Google Scholar]
  28. Moretti, C.; Gratuze, B.; Hreglich, S. L’avventurina: (II parte) la tecnologia e le analisi. Rivista Stazione Sperimentale del Vetro 2010, 6, 29–47. [Google Scholar]
  29. Rosi, F.; Grazia, C.; Gabrieli, F.; Romani, A.; Paolantoni, M.; Vivani, R.; Brunetti, B.G.; Colomban, P.; Miliani, C. UV–Vis-NIR and micro-Raman spectroscopies for the no destructive identification of Cd1—xZnxS solid solutions in cadmium yellow pigments. Microchem. J. 2016, 124, 856–867. [Google Scholar] [CrossRef]
  30. Tauc, J.; Grigorovici, R.; Vancu, A. Optical properties and electronic structure of amorphous germanium. Phys. Status Solidi 1966, 15, 627–637. [Google Scholar] [CrossRef]
  31. Murphy, A.B. Band-gap determination from diffuse reflectance measurements of semiconductor films, and application to photoelectrochemical water-splitting. Sol. Energy Mater. Sol. Cells 2007, 91, 1326–1337. [Google Scholar] [CrossRef]
  32. Jiang, X.; Zhang, M.; Shi, S.; He, G.; Song, X.; Sun, Z. Microstructure and optical properties of nanocrystalline Cu2O thin films prepared by electrodeposition. Nanoscale Res. Lett. 2014, 9, 219. [Google Scholar] [CrossRef]
  33. Theja, G.S.; Lowrence, R.C.; Ravi, V.; Nagarajan, S.; Anthony, S.P. Synthesis of Cu2O micro/nanocrystals with tunable morphologies using coordinating ligands as structure controlling agents and antimicrobial studies. CrystEngComm 2014, 16, 9866–9872. [Google Scholar] [CrossRef]
  34. Wagner, B.; Nowak, A.; Bulska, E.; Hametner, K.; Günther, D. Critical assessment of the elemental composition of Corning archeological reference glasses by LA-ICP-MS. Anal. Bioanal. Chem. 2012, 402, 1667–1677. [Google Scholar] [CrossRef] [PubMed]
  35. Bacci, M.; Corallini, A.; Orlando, A.; Picollo, M.; Radicati, B. The ancient stained windows by Nicolò di Pietro Gerini in Florence. A novel diagnostic tool for non-invasive in situ diagnosis. J. Cult. Herit. 2007, 8, 235–241. [Google Scholar] [CrossRef]
  36. Nagao, H.; Misonou, M.; Kawahara, H. Mechanism of Coloration in Copper-Stained Float Glass. J. Non-Cryst. Solids 1990, 120, 199–206. [Google Scholar] [CrossRef]
  37. Capatina, C. The study of copper ruby glass. Ceram. Silikàty 2005, 49, 283–286. [Google Scholar]
  38. Möncke, D.; Palles, D.; Palamara, E.; Papageorgiou, M.; Kamitsos, E.I.; Zacharias, N. Coloring Vitreous Materials: Pigments, Colloids, and Ions in Glasses and Glazes from the Mycenaean to Medieval Periods-Probed by Spectroscopic Techniques. In Proceedings of the Conference: 3rd ARCH_RNT Archaeological Research and New Technologies, Kalamata, Greece, 22–23 October 2010; pp. 153–164. [Google Scholar]
  39. Aceto, M.; Agostino, A.; Fenoglio, G.; Idone, A.; Gulmini, M.; Picollo, M.; Ricciardi, P.; Delaney, J.K. Characterisation of colourants on illuminated manuscripts by portable fibre optic UV-visible-NIR, reflectance spectrophotometry. Anal. Method 2014, 6, 1488–1500. [Google Scholar] [CrossRef]
  40. Sayre, E.V.; Smith, R.W. Compositional categories of ancient glass. Science 1961, 133, 1824–1826. [Google Scholar] [CrossRef] [PubMed]
  41. Marii, F.; Rehren, T. Opaque Glass Cakes from the Petra Church and Their Interpretation. In Proceedings of the 36th International Symposium on Archaeometry, Quebec, QC, Canada, 2–6 May 2006; pp. 339–347. [Google Scholar]
  42. Verità, M.; Santopadre, P.; De Palma, G. Scientific investigation of Glass Mosaic tesserae from the 8th Century AD archaeological Site of Qusayr’amra (Jordan). Boll. ICR 2016, 32, 5–20. [Google Scholar]
  43. Tessera, E.; Verità, M.; Lazzarini, L.; Falcone, R.; Saguì, L.; Antonelli, F. Glass in imitation of exotic marbles: An analytical investigation of 2nd century AD Roman sectilia from the Gorga collection. J. Cult. Herit. 2019, in press. [Google Scholar] [CrossRef]
  44. Verità, M.; Renier, A.; Zecchin, S. Chemical analyses of ancient glass findings excavated in the Venetian lagoon. J. Cult. Herit. 2002, 34, 261–271. [Google Scholar] [CrossRef]
  45. Welham, K.; Jackson, C.M.; Smedley, J.W. Colour formation in sealing wax red glass. In Proceedings of the Annales du 14e Congrès de l’Association International pour l’Histoire du Verre, Venezia-Milano, Italy, 27 October–1 November 1998; pp. 11–15. [Google Scholar]
Figure 1. Boxes of opaque red sectilia in the Gorga collection.
Heritage 02 00159 g001
Figure 2. Red sectilia selected from the Gorga Collection: (a) R1; (b) R2; (c) R3; (d) R4; (e) R5; (f) R6; (g) R7; (h) R8; (i) R9; (j) R1.
Heritage 02 00159 g002
Figure 3. CIELab graphic representation of L*a*b* chromatic coordinate, projection on a* b* space.
Heritage 02 00159 g003
Figure 4. Optical micrographs in dark field objective: (a) sample R1; (b) sample R4; (c) sample R9; (d) sample R10.
Heritage 02 00159 g004
Figure 5. Optical micrographs in dark field objective: (a) dendric crystals in sample R9; (b) euhedric copper crystal in sample R10; (c) metallic inclusion in sample R3; (d) metallic inclusion in sample R8.
Heritage 02 00159 g005
Figure 6. Fibre Optics Reflectance Spectroscopy (FORS) spectra (a) and derivative (b) of sample R1, R9, R10 and the Red-group.
Heritage 02 00159 g006
Figure 7. Field emission electron Gun Scanning Electron Microscope (FEG-SEM) micrographs of red samples: (a) sample R1, copper spherical nanoparticles; (b) copper-cubic nanoparticles in sample R7; (c) dendritic crystals of cuprite in sample R9; (d) euhedral micrometric crystals of metallic copper in sample R10.
Heritage 02 00159 g007aHeritage 02 00159 g007b
Figure 8. Raman spectrum of sample R9 in which cuprite crystals were identified.
Heritage 02 00159 g008
Figure 9. Inclusion rich in Fe2O3, SiO2, Al2O3 and TiO2 in samples R10 unclear if it is ceramic or clay.
Heritage 02 00159 g009
Table 1. Chromatic and colorimetric coordinates.
SampleColorimetric CoordinateDominant Wavelength (nm)
L *a *b *Ch
R128.61.31.21.840.6591.6
R339.125.013.728.428.7604.1
R439.724.314.028.030.0603.5
R741.026.113.629.427.6606.9
R842.521.112.224.430.0602.7
R935.423.510.825.824.7609.1
R1036.414.811.218.537.0596.8
Table 2. Average quantitative Particle Induced X-Ray Emission (PIXE) chemical analysis of the elements potentially involved in the colour formation, expressed in wt% oxide. n.d. elements not detected (LOD Sb2O3 estimated: 0.13%).
SampleColourFe2O3CuOPbOSnO2Sb2O3
R-1 3.900.310.390.100.48
R-2Red-group1.302.131.401.320.50
R-3Red-group1.502.098.650.54n.d
R-4Red-group1.120.540.110.280.14
R-5Red-group1.071.801.200.94n.d
R-6Red-group1.001.870.600.25n.d.
R-7Red-group1.101.670.620.300.17
R-8Red-group1.052.270.520.57n.d.
R-9Sealing wax0.429.028.30.231.60
R-10 4.202.851.000.25n.d.
Table 3. Description of the range of size and shapes of the particles observed by FEG-SEM in the samples.
SampleSize (μm)Shape
R10.06–0.1 Heritage 02 00159 i001     (Cu°)
R20.06–0.2 Heritage 02 00159 i001     (Cu°)
R30.1–0.4 Heritage 02 00159 i001 Heritage 02 00159 i004   (Cu°)
R40.1–0.4 Heritage 02 00159 i001 Heritage 02 00159 i004   (Cu°)
R50.06–0.2 Heritage 02 00159 i001     (Cu°)
R60.06 –0.15 Heritage 02 00159 i001     (Cu°)
R70.06–0.2 Heritage 02 00159 i001 Heritage 02 00159 i004   (Cu°)
R80.06–0.2 Heritage 02 00159 i001 Heritage 02 00159 i004   (Cu°)
R950–150Dendritic (Cu2O)
R90.5–1 Heritage 02 00159 i001     (Cu°)
R100.5–1 Heritage 02 00159 i002 Heritage 02 00159 i003 Heritage 02 00159 i004  (Cu°)

