
Efficiency Comparison of Public Hospitals under Different Administrative Affiliations in China: A Pilot City Case


Department of Health Administration, School of Medicine and Health Management, Tongji Medical College, Huazhong University of Science and Technology, Wuhan 430000, China
*
Author to whom correspondence should be addressed.
Healthcare 2021, 9(4), 437; https://doi.org/10.3390/healthcare9040437
Submission received: 1 March 2021
/
Revised: 2 April 2021
/
Accepted: 5 April 2021
/
Published: 8 April 2021
(This article belongs to the Special Issue Health Care Management and Cost Estimation)
Abstract
:This study seeks to measure the efficiency disparity and productivity change of tertiary general public hospitals in Wuhan city, central China from the perspective of administrative affiliations by using panel data from 2013 to 2017. Sample hospitals were divided into three categories, namely provincial hospitals, municipal hospitals, and other levels of hospitals. Data envelopment analysis with bootstrapping technique was used to estimate efficiency scores, and a sensitive analysis was performed by varying the specification of model by considering undesirable outputs to test robustness of estimation, and efficiency evolution analysis was carried out by using the Malmquist index. The results indicated that the average values of provincial hospitals and municipal hospitals have experienced efficiency improvement over the period, especially after the initiation of Pilot Public Hospital Reform, but hospitals under other affiliations showed an opposite trend. Meanwhile, differences of administrative subordination in technical efficiency of public hospitals emerged, and the disparity was likely to grow over time. The higher efficiency of hospitals affiliated with municipality, as compared with those governed by province and under other administrative affiliations, may be attributed to better governance and organization structure.
1. Introduction
Public medical institutions are considered to be an essential part of a country’s health service system worldwide. In recent years, efficiency of public hospitals has become a concern for policymakers and researchers dealing with health expenditure growth in both developed and developing countries [1,2,3,4,5,6]. In China, this issue has long drawn scholars’ attention, and several articles have been published [7,8,9,10,11,12,13,14,15]. Generally, Chinese public hospitals are classified according to three standards, namely service capacity (i.e., primary, secondary, and tertiary hospitals), service items (i.e., general and specialized hospitals), and administrative subordination by government agencies in accordance with regulations. However, a great number of studies only involve the first two classification criteria, but the last one has not been fully explored. Although public hospitals now enjoy considerably more autonomy regarding their revenues than during the planned economy era, policies for the public health sector still face certain constraints left over by government hierarchy [16,17]. In light of classification based on administrative subordination, the ownership of public hospitals in China can be roughly divided into two categories: government-owned and public institution-owned. Among them, government-owned hospitals can be mainly divided into three types, namely county, municipal, and provincial hospitals. They are consistent with the administrative level of government hierarchy in China (county, city, and province). As a small part of public hospitals, public institution-owned hospitals are often generally inferior in administrative status to their government-owned counterparts, but they have higher autonomy and independence in governance. On the one hand, the classification based on administrative subordination in public hospitals is in line with the system of public institution in China. It determines that governments have high governance over public facilities in human resources, financial budget, and medical business [16]. On the other hand, degrees of different governmental levels’ involvement in a specific public medical institution are not exactly the same. For instance, senior leaders of public hospitals with a higher administrative status will be able to be assigned and moved directly by higher levels of government. Consequently, it is reasonable to assume that there are certain gaps in efficiency among public hospitals under different relationships of administrative subordination. It remains to be seen whether public hospitals with higher administrative status are more efficient.
In the past decade, the Chinese government has made a series of efforts to improve the condition of difficulty and high cost in terms of getting medical service in the nation. The New Medical and Health System Reform (NMHSR), which aims to guarantee fair access to basic medical and health service and was launched in 2009, has been a great success, partly improving residents’ accessibility to medical care [18,19,20]. As one of the five key pillars in the 2009 project, Pilot Public Hospital Reform (PPHR) was popularized in 2011 by the Chinese government. It is committed to implementing a new version of medical service prices, canceling drug price addition, and increasing financial subsidies in public health facilities, with focuses on operation efficiency, service quality, essential functions, and social responsibilities of medical units [21,22,23]. Wuhan (WH), as a representative city in central China and the capital of Hubei province, was identified as a member of the third cluster of PPHR in 2014. Undoubtedly, identifying the efficiency status of local public health sector can help design policy measures by highlighting factors which policymakers can act on.
In terms of literature for hospital efficiency, the Data Envelopment Analysis (DEA) method has been widely used by scholars around the world when measuring efficiency and productivity of healthcare units and large-scale hospitals in particular. From the perspective of a research framework, relevant research work can be roughly divided into three categories:
(1) Research evaluating facilities’ efficiency in the regional or cross-regional level. Area classification methods for administrative division [24,25,26,27,28,29,30,31], geographical location [32,33], and economic development level [34,35] are frequently used. (2) Research comparing the efficiency variance among different types of units. Public and private hospitals [36,37,38,39,40,41], and profitable and non-profit hospitals [42,43,44] are often compared, which is especially obvious in research by European and American scholars. Comparison in diverse hospital management systems [45,46] and scales of hospital [37,47] have also been adopted in recent years. (3) Research estimating the efficiency difference of hospitals before and after an event occurs, such as economic crisis [47,48], system reform [49,50,51,52,53,54,55], competitive context [56,57], institutions merger [58], project implementation [59,60], or privatization [61].
Through the aforementioned literature review, we can draw a conclusion that studies of efficiency comparison among public hospitals under different administrative subordination are still insufficient. For the framework of this research, 25 public hospitals affiliated with three levels of administrative organs were selected in WH during 2013–2017. DEA–Malmquist models were applied along with the bootstrapping method used for correction of efficiency values. This research sheds light on public hospital governance mode (i.e., autonomous or centralized) from the perspective of operational efficiency. The results of this study may help policymakers better understand efficiency changes among hospitals with different affiliations. It is conducive to the formulation of health reform policies in China.
The rest of the study is organized as follows. Section 2 introduces the theoretical basis of analysis methods used, and explains selection of samples, indicators, model specifications, and analysis tools. Section 3 reports results of descriptive statistics, technical efficiency, and Malmquist index. Section 4 discusses findings from the aspects of efficiency variance, average efficiency, efficiency distribution, and productivity indices. Section 5 concludes those findings and clarifies limitations.
2. Materials and Methods
2.1. Data Envelopment Analysis of Hospital Efficiency in China
At present, the most common methods to evaluate the efficiency of a healthcare system are DEA, Stochastic Frontier Analysis (SFA), and Ratio Analysis (RA). DEA method is a typical nonparametric approach in efficiency estimation developed by Charnes, Cooper, and Rhodes in 1978, which does not require relative price information and a specific functional form for a production possibility frontier [62,63]. Meanwhile, the procedure of applying DEA considers a multidimensional perspective of the input and output for the healthcare sector [43]. Therefore, the DEA method is widely used in the efficacy estimation of medical treatment units.
The concept of Technical Efficiency (TE), developed by Farrell in 1957, describes the capacity of a Decision-Making Unit (DMU) to produce the maximum amount of output from a given amount of input or, alternatively, to produce a given output with a minimum quantity of input [64,65]. As for the hospital sector, TE can be represented as producing a given level of medical service outputs with the least medical resource inputs. The area surrounded by the curve formed by DMUs, which composes the efficiency frontier, envelops the relatively inefficient DMUs. TE scores range from 0 to 1, respectively representing inefficiency and full efficiency. Generally, there are two orientations in the process of DEA, namely input orientation and output orientation. If DMU can freely adjust the number or proportion of its input indicators according to the needs of the market, it is suitable to adopt the input orientation model. However, it is hard for leaders in Chinese public hospitals to decide the number of doctors or nurses on their own. At the same time, the phenomenon of difficulty in getting medical service is common in Chinese public medical institutions, and the supply of medical services is not adequate for demand. Therefore, output-orientated Constant Returns to Scale (CRS) DEA method was adopted to obtain the TE scores for each healthcare sector in this study. [54] Suppose there are n DMUs’ TE (DMUj, j = 1, 2, …, n) need to be measured, and each DMU has m inputs (xi, i = 1, 2, …, m) and q outputs (yr, r = 1, 2, …, q). Please note that the weight of inputs and outputs as vi (i = 1, 2, …, m) and ur (r = 1, 2, …, q) respectively. The DMU currently measured was noted as DMUk. The output orientation Charnes Cooper Rhodes (CCR) model can be described as the following formula:
Its dual model can be described as the following formula:
Dual model means that each output can measure inefficiency with equal proportion growth based on the fixed input. Hence, it is called output-orientated CCR model. The optimal solution of the model is φ*. Under the condition of no increase of inputs, the maximum proportion of outputs growth of DMUk is φ* − 1. The larger φ* is, the greater the output can be increased and the lower the efficiency is. 1/φ* was used to represent efficiency score since φ* ≥ 1 [66].
2.2. Bias Correction of Efficiency with Bootstrapping Method
Based on the application of the classic DEA model, bootstrapping method is a popular statistical method in modern nonparametric statistics put forward by Efron in 1979, which performs interval estimation via estimating the variance of statistics and adopting repeated sampling to simulate the data generation process [67]. Meanwhile, this method approximately obtains the sample distribution and variance of the original estimator by using the original estimator in the simulation sample [68,69,70]. The bootstrapping method can be divided into the following steps:
Step 1: The original scores of each was calculated by traditional DEA model. Then extracting a naive sample of the scale n by bootstrapping method. Where denotes the number of iterations of bootstrap sampling:
Step 2: The Kernel density estimation method was used to smooth the samples obtained by naive bootstrap to get . The input indexes of the original sample were modified according to . The adjusted indexes were as follows:
According to the bootstrap adjusted inputs and initial outputs as new samples, the traditional DEA method was used to recalculate the efficiency value as follows:
Step 3: were obtained after repeating steps 1 and 2 with B times. The bias, corrected efficiency scores and the confidence interval (with the confidence level α) can be described as the following formula:
In this research, bootstrapping method was introduced into DEA model and corrected original DEA efficiency value by taking the influence of interference factors with 2000 replications into account.
2.3. Estimation of Malmquist Index for Productivity Change
Malmquist Index (MI) measures the change of productivity by calculating the geometric mean of the productivity indexes between t and t + 1 period (i.e., Adjacent Malmquist). The formula can be expressed as follows:
where x denotes the input indexes, y denotes the output indexes, is defined as the output distance function, and MI measures the total productivity changes between t and t + 1 period. [30] When MI > 1, it signifies increased productivity; when MI < 1, it signifies declined productivity; when MI = 1, it signifies constant productivity. The change can be decomposed into Technical Efficiency Change (EC) and Technological Change (TC) as follows:
2.4. Study Population
The data used in this study was extracted from the Wuhan Health and Family Planning Yearbook (2014-2018). The sample under this study was all tertiary general public hospitals in WH. By considering the good comparability between samples, specialized hospitals, maternal and child health hospitals, traditional Chinese medicine hospitals, and army hospitals, and those affiliations and levels that were altered during the analyzed period were excluded. Finally, 25 public hospitals were included in the study. All the selected hospitals are officially classified as tertiary general public hospitals to meet the basic requirement in applying the DEA approach, namely the homogeneity of DMUs.
More specifically, the National Health Administration had strict requirements on the Evaluation of Tertiary General Hospitals, including number of beds, department settings, number of medical staff, and medical equipment, which could ensure the similarity of sample hospitals in this research.
The number of sample hospitals in the analysis model conforms to the basic principles of DEA method [10,11,12,59,71] as the following formula:
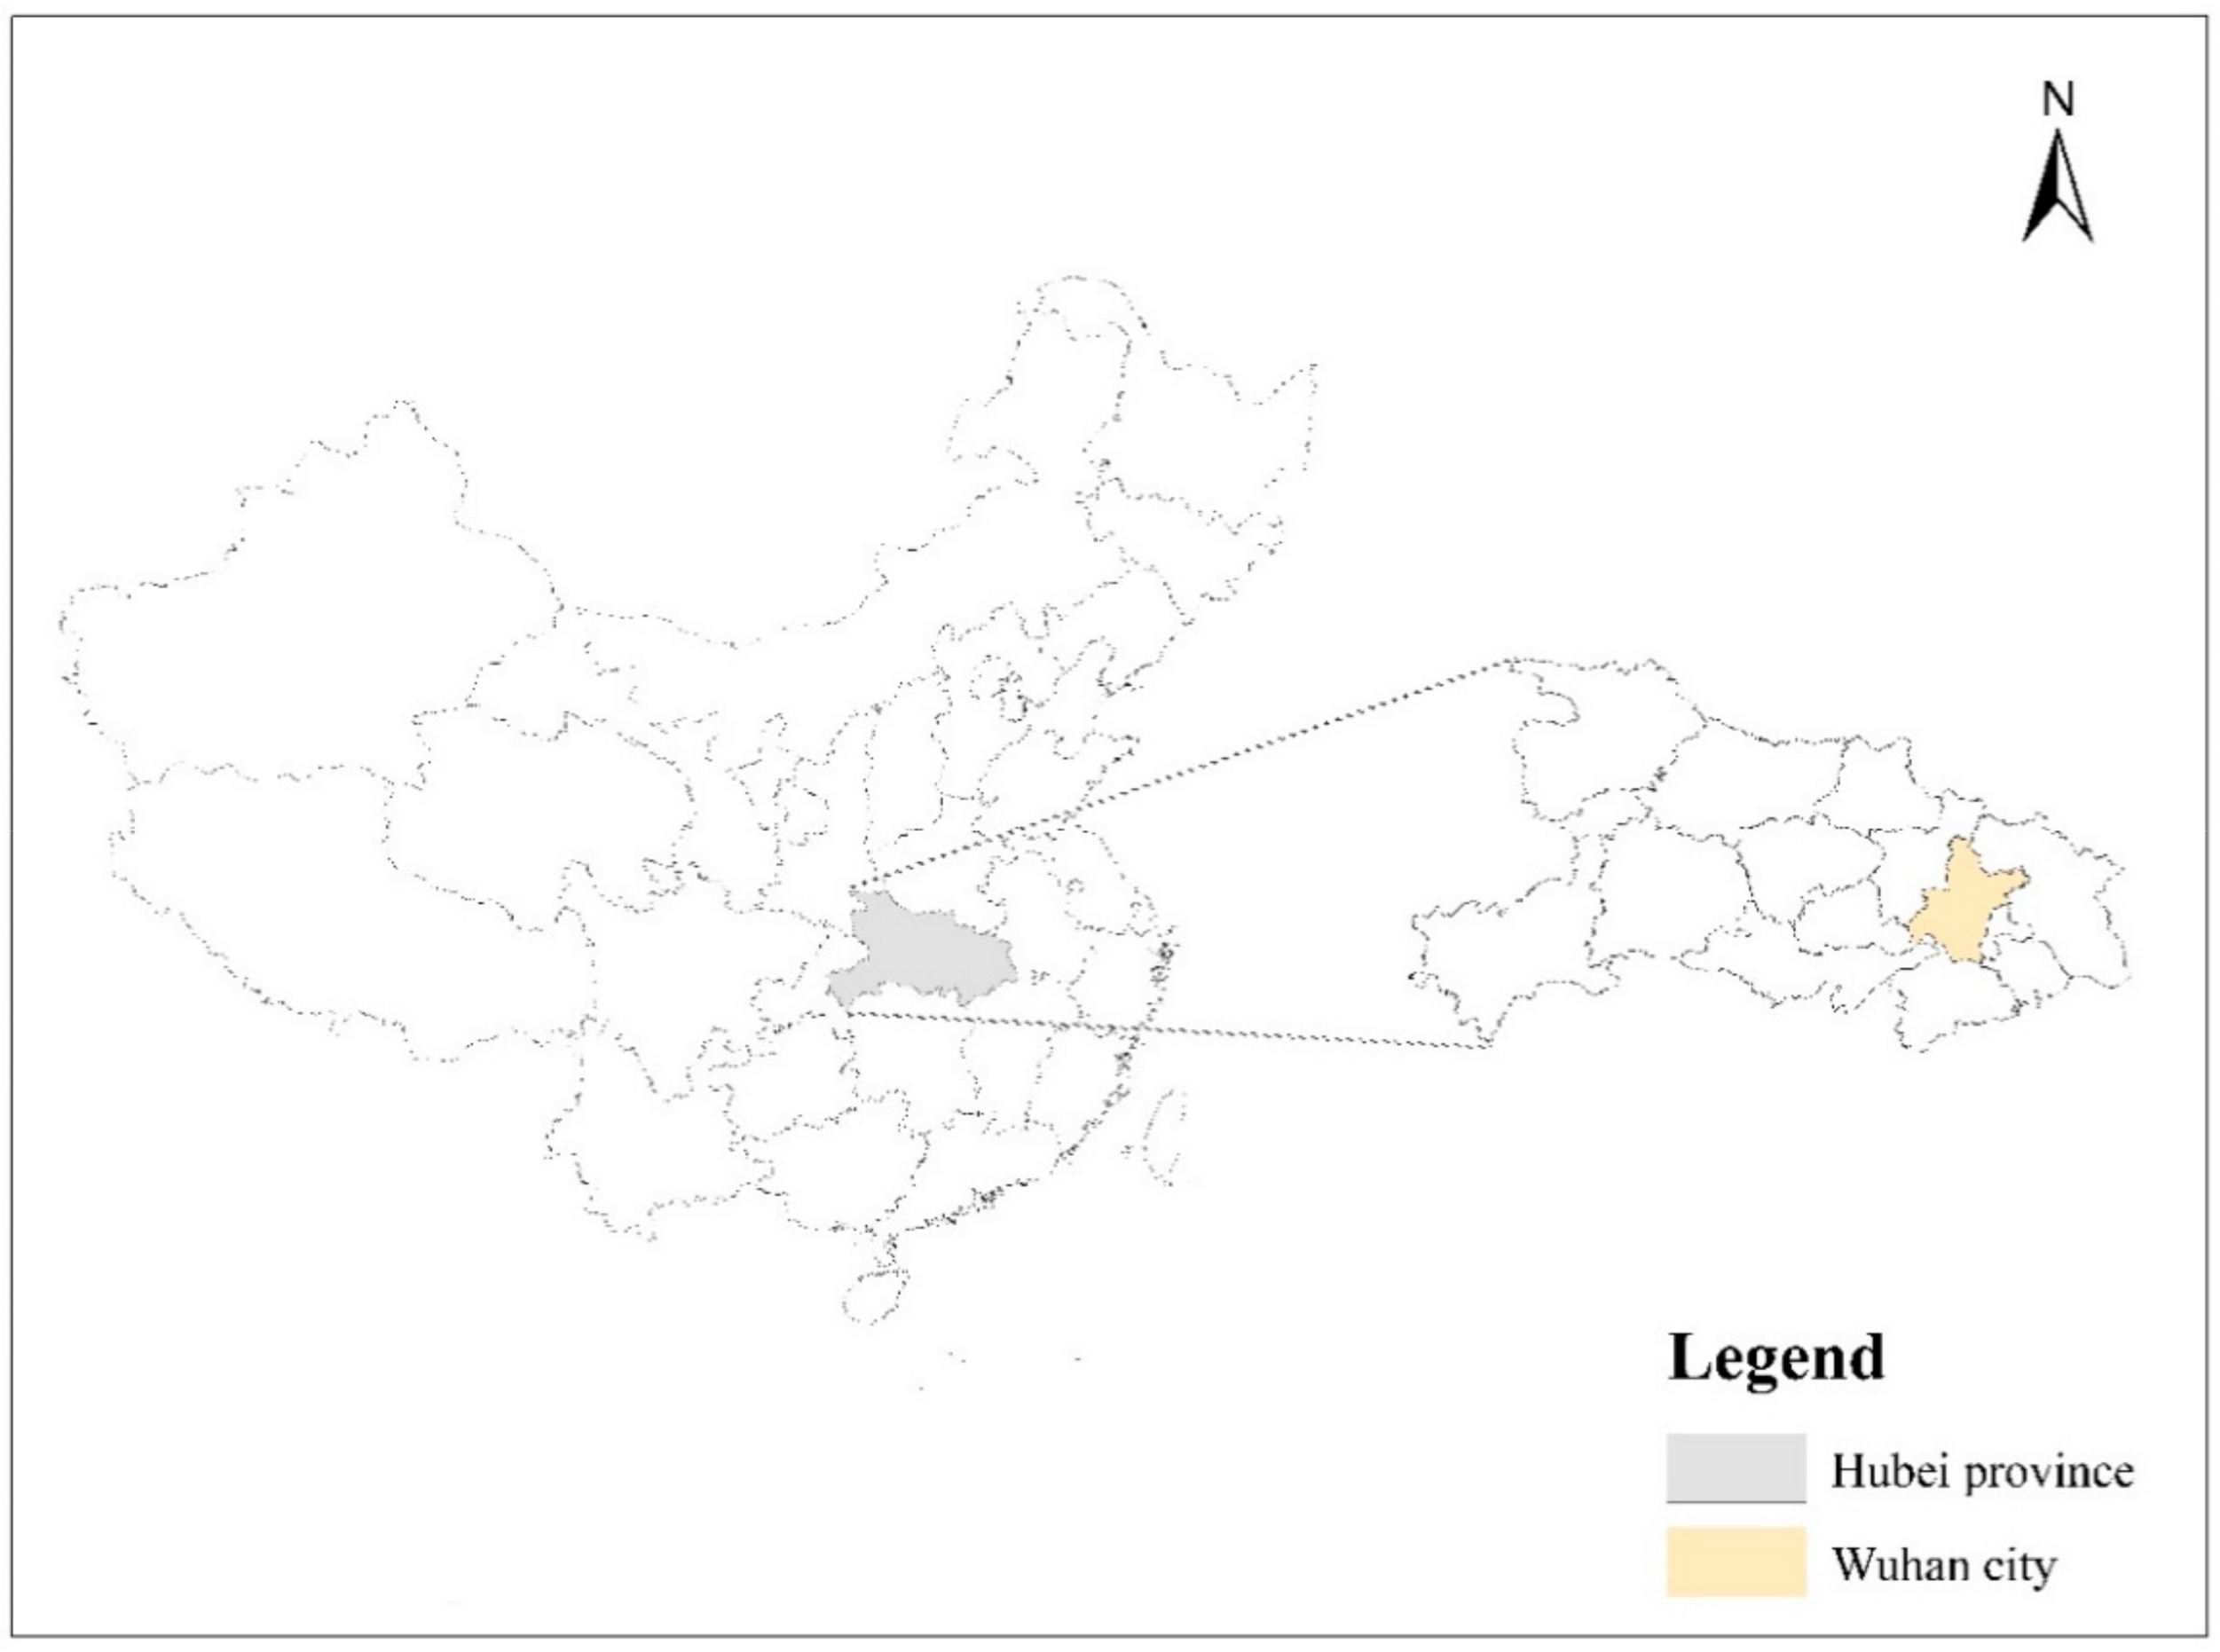
where x denotes the input variables number, y denotes the output variables number and Z denotes the sample number used in DEA model. Sample hospitals can be divided into three categories based on differences in administrative subordination (Table 1). The geographical location of WH is illustrated in Figure 1.
2.5. Input–Output Variable Selection
In this study, the selection of input and output variables was guided by previous studies [7,8,9,10,11,12,13,14,30,31,32,33,34,35,36,37,38] and the Delphi method [72,73]. The reason for using Delphi was to keep social distance during COVID-19. The most commonly used indicators for evaluating hospital efficiency were screened out after literature search. Web of Science, PubMed, and China National Knowledge Infrastructure were searched. The search strategy consisted of combined terms of hospital, data envelopment analysis, efficiency, and productivity.
Next, Delphi technique was employed in this study. Five experts in hospital management and five professors in the field of Health Economics were invited to select candidate variables independently and anonymously from alternative indicators. The members of Delphi panel are from the following institutions: Dabieshan Medical Group (Huanggang, China), Tongji Medical College (Wuhan, China), Hainan Medical University (Haikou, China), and Hubei University (Wuhan, China). The whole process was conducted in November 2020 through the Tencent Meeting mobile application. All members responded to the designed questionnaire in three rounds. In the first round, all variables identified after review were submitted to the members of the Delphi team in the form of electronic files to determine the classification of variables (input variables, output variables, and undesirable variables). In the second round, a 5-point Likert scale questionnaire was used for scoring each variable based on its importance in the efficiency evaluation of tertiary hospital [72]. Each member of the Delphi panel rated variables on a scale of one (not important) to five (very important). Table 2 presents the Delphi findings of each variable in this round. In the third round, we provided the experts with the opportunity to think and rate again to make the results consistent. Results of the questionnaire were analyzed by median score and Interquartile Range (IQR) [73]. Median was calculated for the importance of how each item was scored. IQR was used to assess the success of the members’ agreement. Finally, indexes for four inputs, four outputs, and two undesirable outputs were selected. Figure 2 demonstrates the selection process of the variables.
Regarding the input variables, most scholars consider both medical human resources and material capital as the main aspects in public hospitals [33,36,37,38,39,40]. Three variables were concentrated on human resources: Number of doctors (NoD), including full time equivalent (FTE) doctors and assistant doctors; Number of nurses (NoN), namely FTE registered nurses; Number of other medical professionals (NoOMP), consisting of FTE pharmacists, laboratory technicians, and other medical staff. Meanwhile, given the fact that extra and temporary beds are common in Chinese hospitals, Number of average actual open beds (NoAAOB) was used on behalf of material capital input. The statistical approach of NoAAOB was calculated through dividing the actual available bed days by the number of days in a year.
In terms of output variables, relevant research to hospital efficiency is prone to define diagnosis and treatment as the main output of hospitals [74,75]. Four variables have been considered in this research: Number of outpatient and emergency visits (NoOEV); Number of discharged patients (NoDP); Number of surgical operations for inpatient (NoSOI), and bed occupancy rate (BOR). BOR was calculated by dividing actual occupied bed days by actual available bed days in a year. At the same time, Mortality rate of inpatients (MRoI) and Number of medical disputes (NoMD) as undesired output were considered. MRoI was calculated by dividing the number of death cases of inpatients by the number of inpatients visits in a year.
2.6. Robustness of Estimation
To avoid the possibility of bias in index selection and to test the robustness of results in the estimation, three models depending on different variables were adopted. This is considering the verification of the sensitivity of technical efficiency changing in composition. Since the optimal production frontier is distinct from diverse variable selection, results of each DMU will be discrepant too [8,9]. Moreover, the efficiency frontier is only a measurement, exerting no influence on true reflection of each DMU’s relative technical efficiency. Therefore, the results of multiple models are not only contradictory but also mutually verifiable, reflecting various aspects of reality and thus providing strong evidence for decision-making. Meanwhile, the advantage of the procedure is its suitability of measuring limited samples.
Model A was defined as the basic model incorporating the essential efficiency function. It was the most used in research of hospital efficiency, irrespective of undesirable outputs. Two additional models (Model B and Model C) performed as auxiliary tools. In these two models, normal variables diminished in comparison with Model A (Table 3) based on the importance of variables in findings of Delphi method. According to Seiford L’s study [76], undesirable outputs were dealt with in this research as follows: Model B treated undesirable outputs as normal inputs. [59] Model C used linear transformation to deal with undesirable outputs. [59,76] Both were designed to strengthen the robustness of the basic model’s results.
2.7. Analysis Tools
Sample data were analyzed by SPSS (Version 19.0, IBM Corp, New York, NY, USA) for statistical description. MaxDEA Ultra (Version 7.9, Realworld Corp, Beijing, China), a powerful piece of DEA software that contains thousands of DEA models for various combinations was therefore employed to perform the DEA and Malmquist Index. Furthermore, a sensitive analysis was performed by bootstrapping with 2000 replications, providing the corrected efficiency indices of the analyzed model. Meanwhile, the significance of results was contrasted by Kruskal–Wallis test.
3. Results
3.1. Description of DMUs
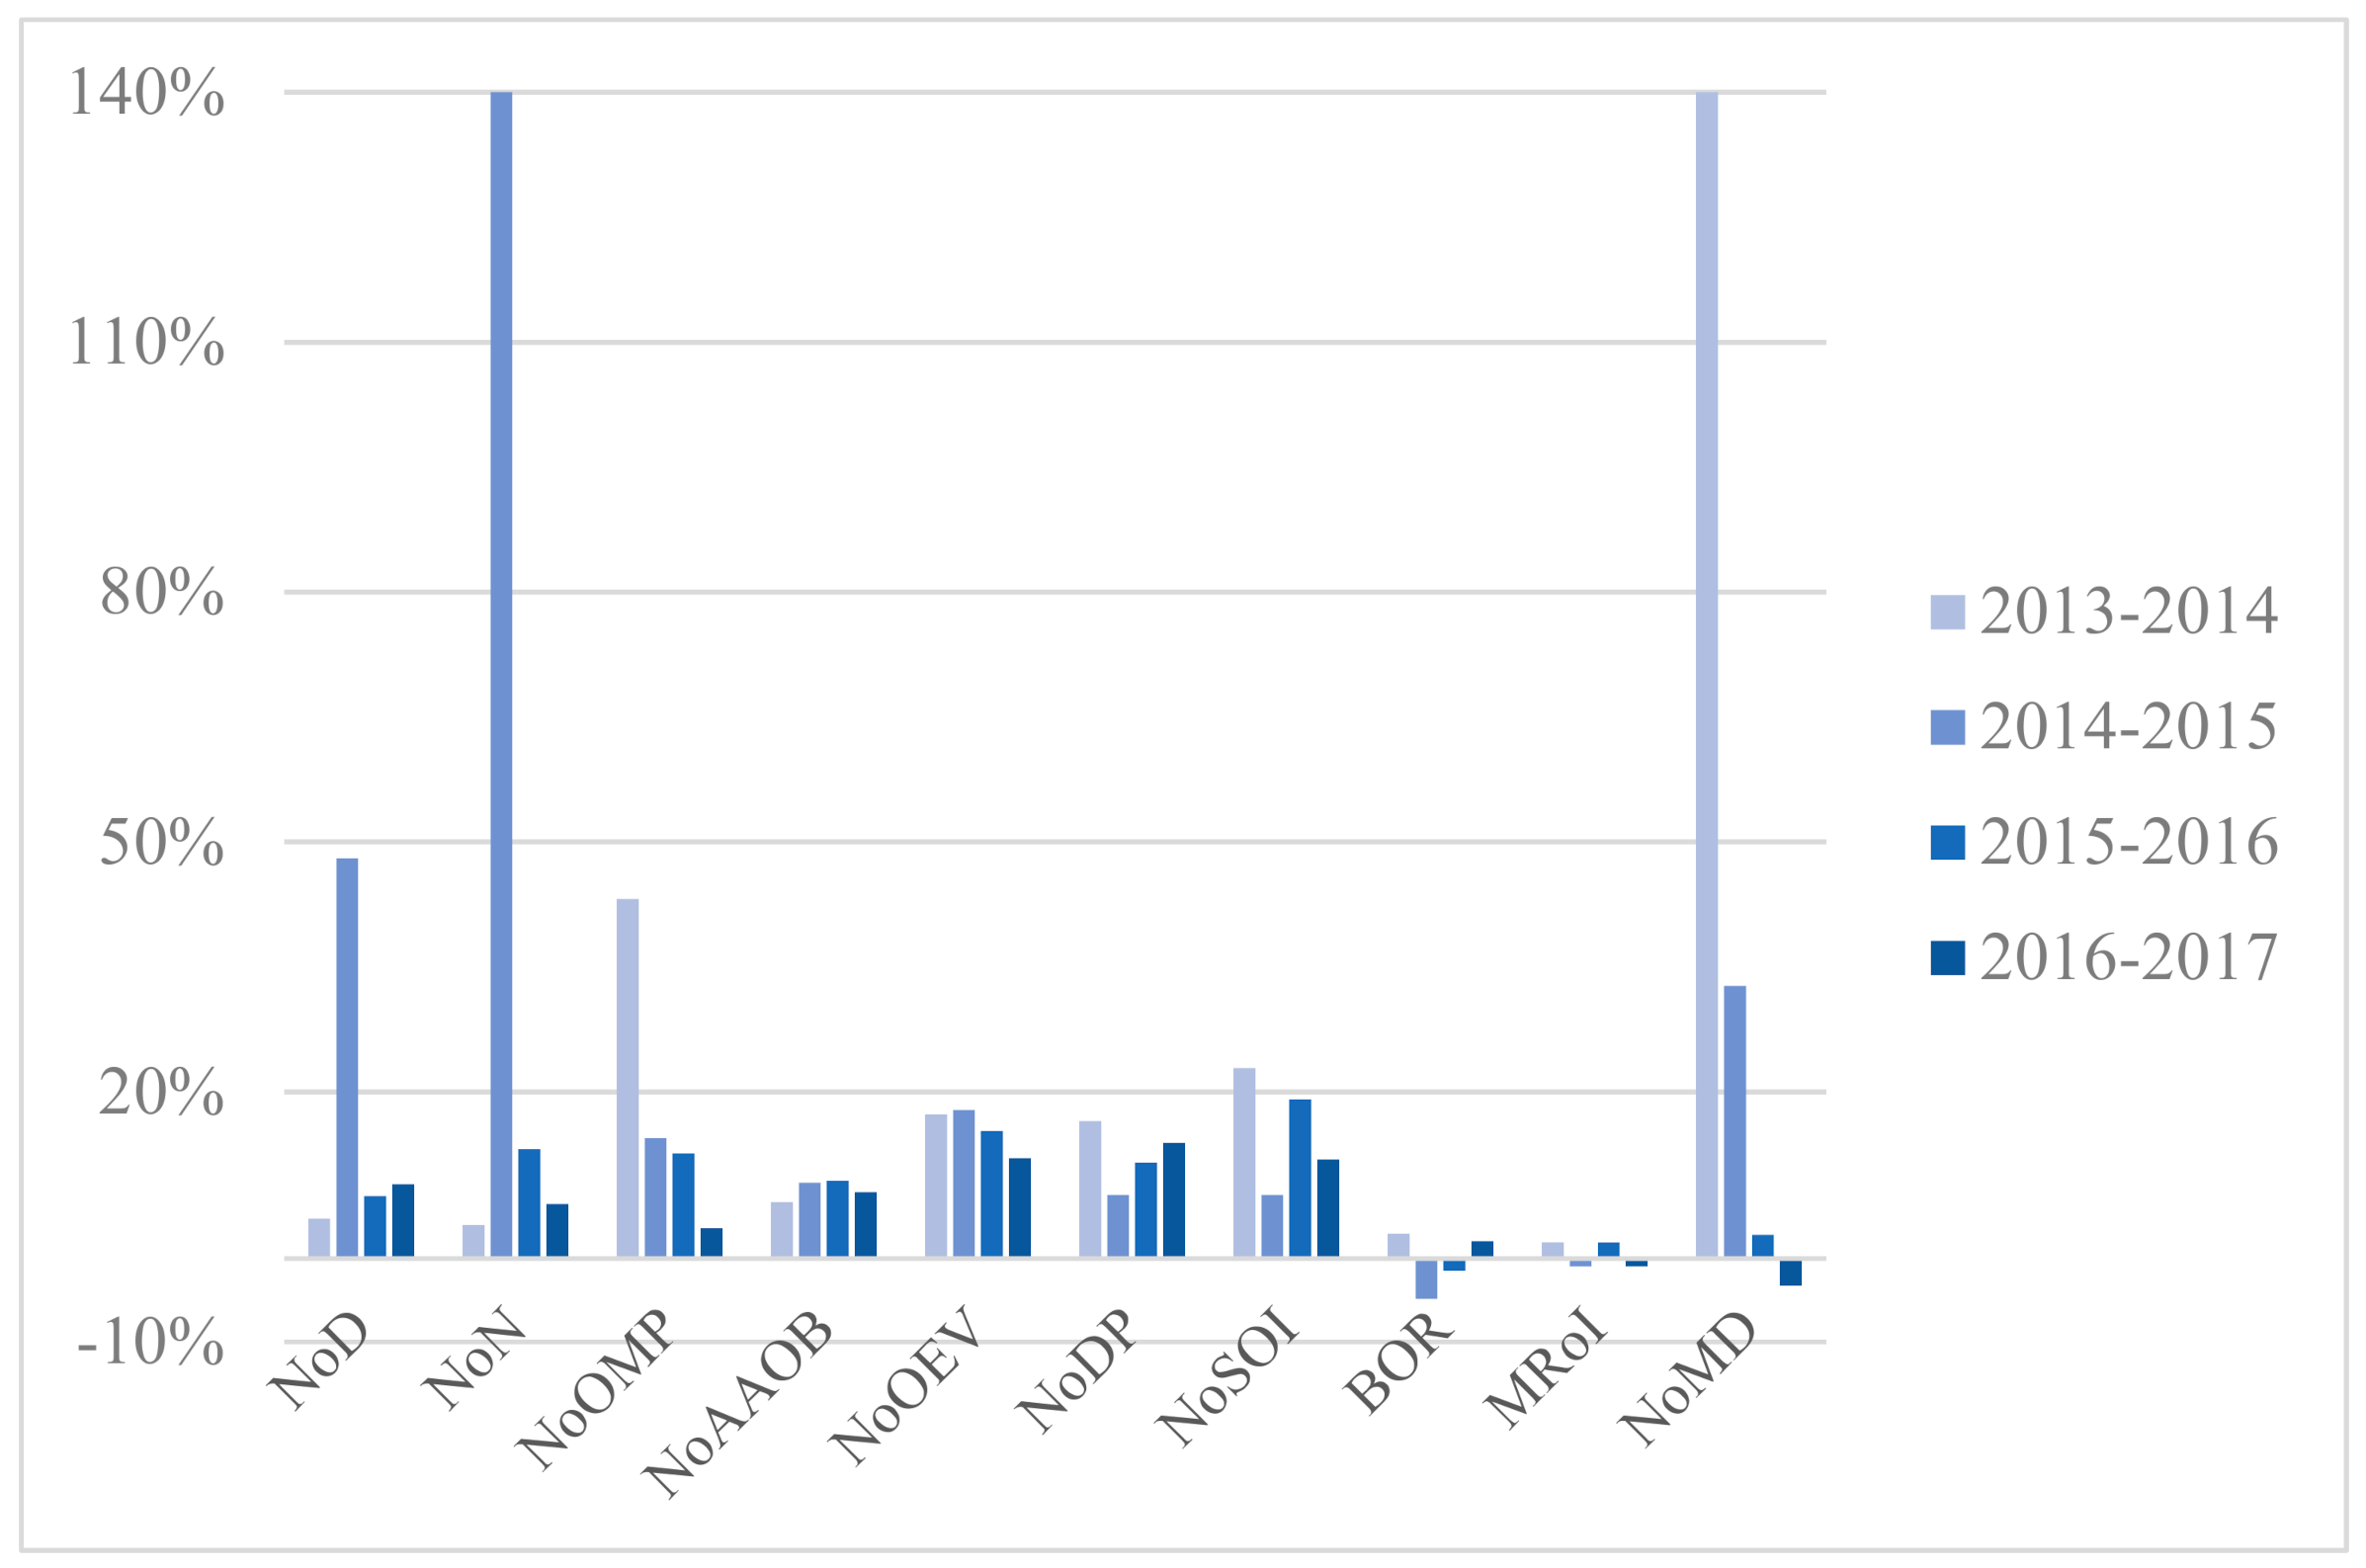
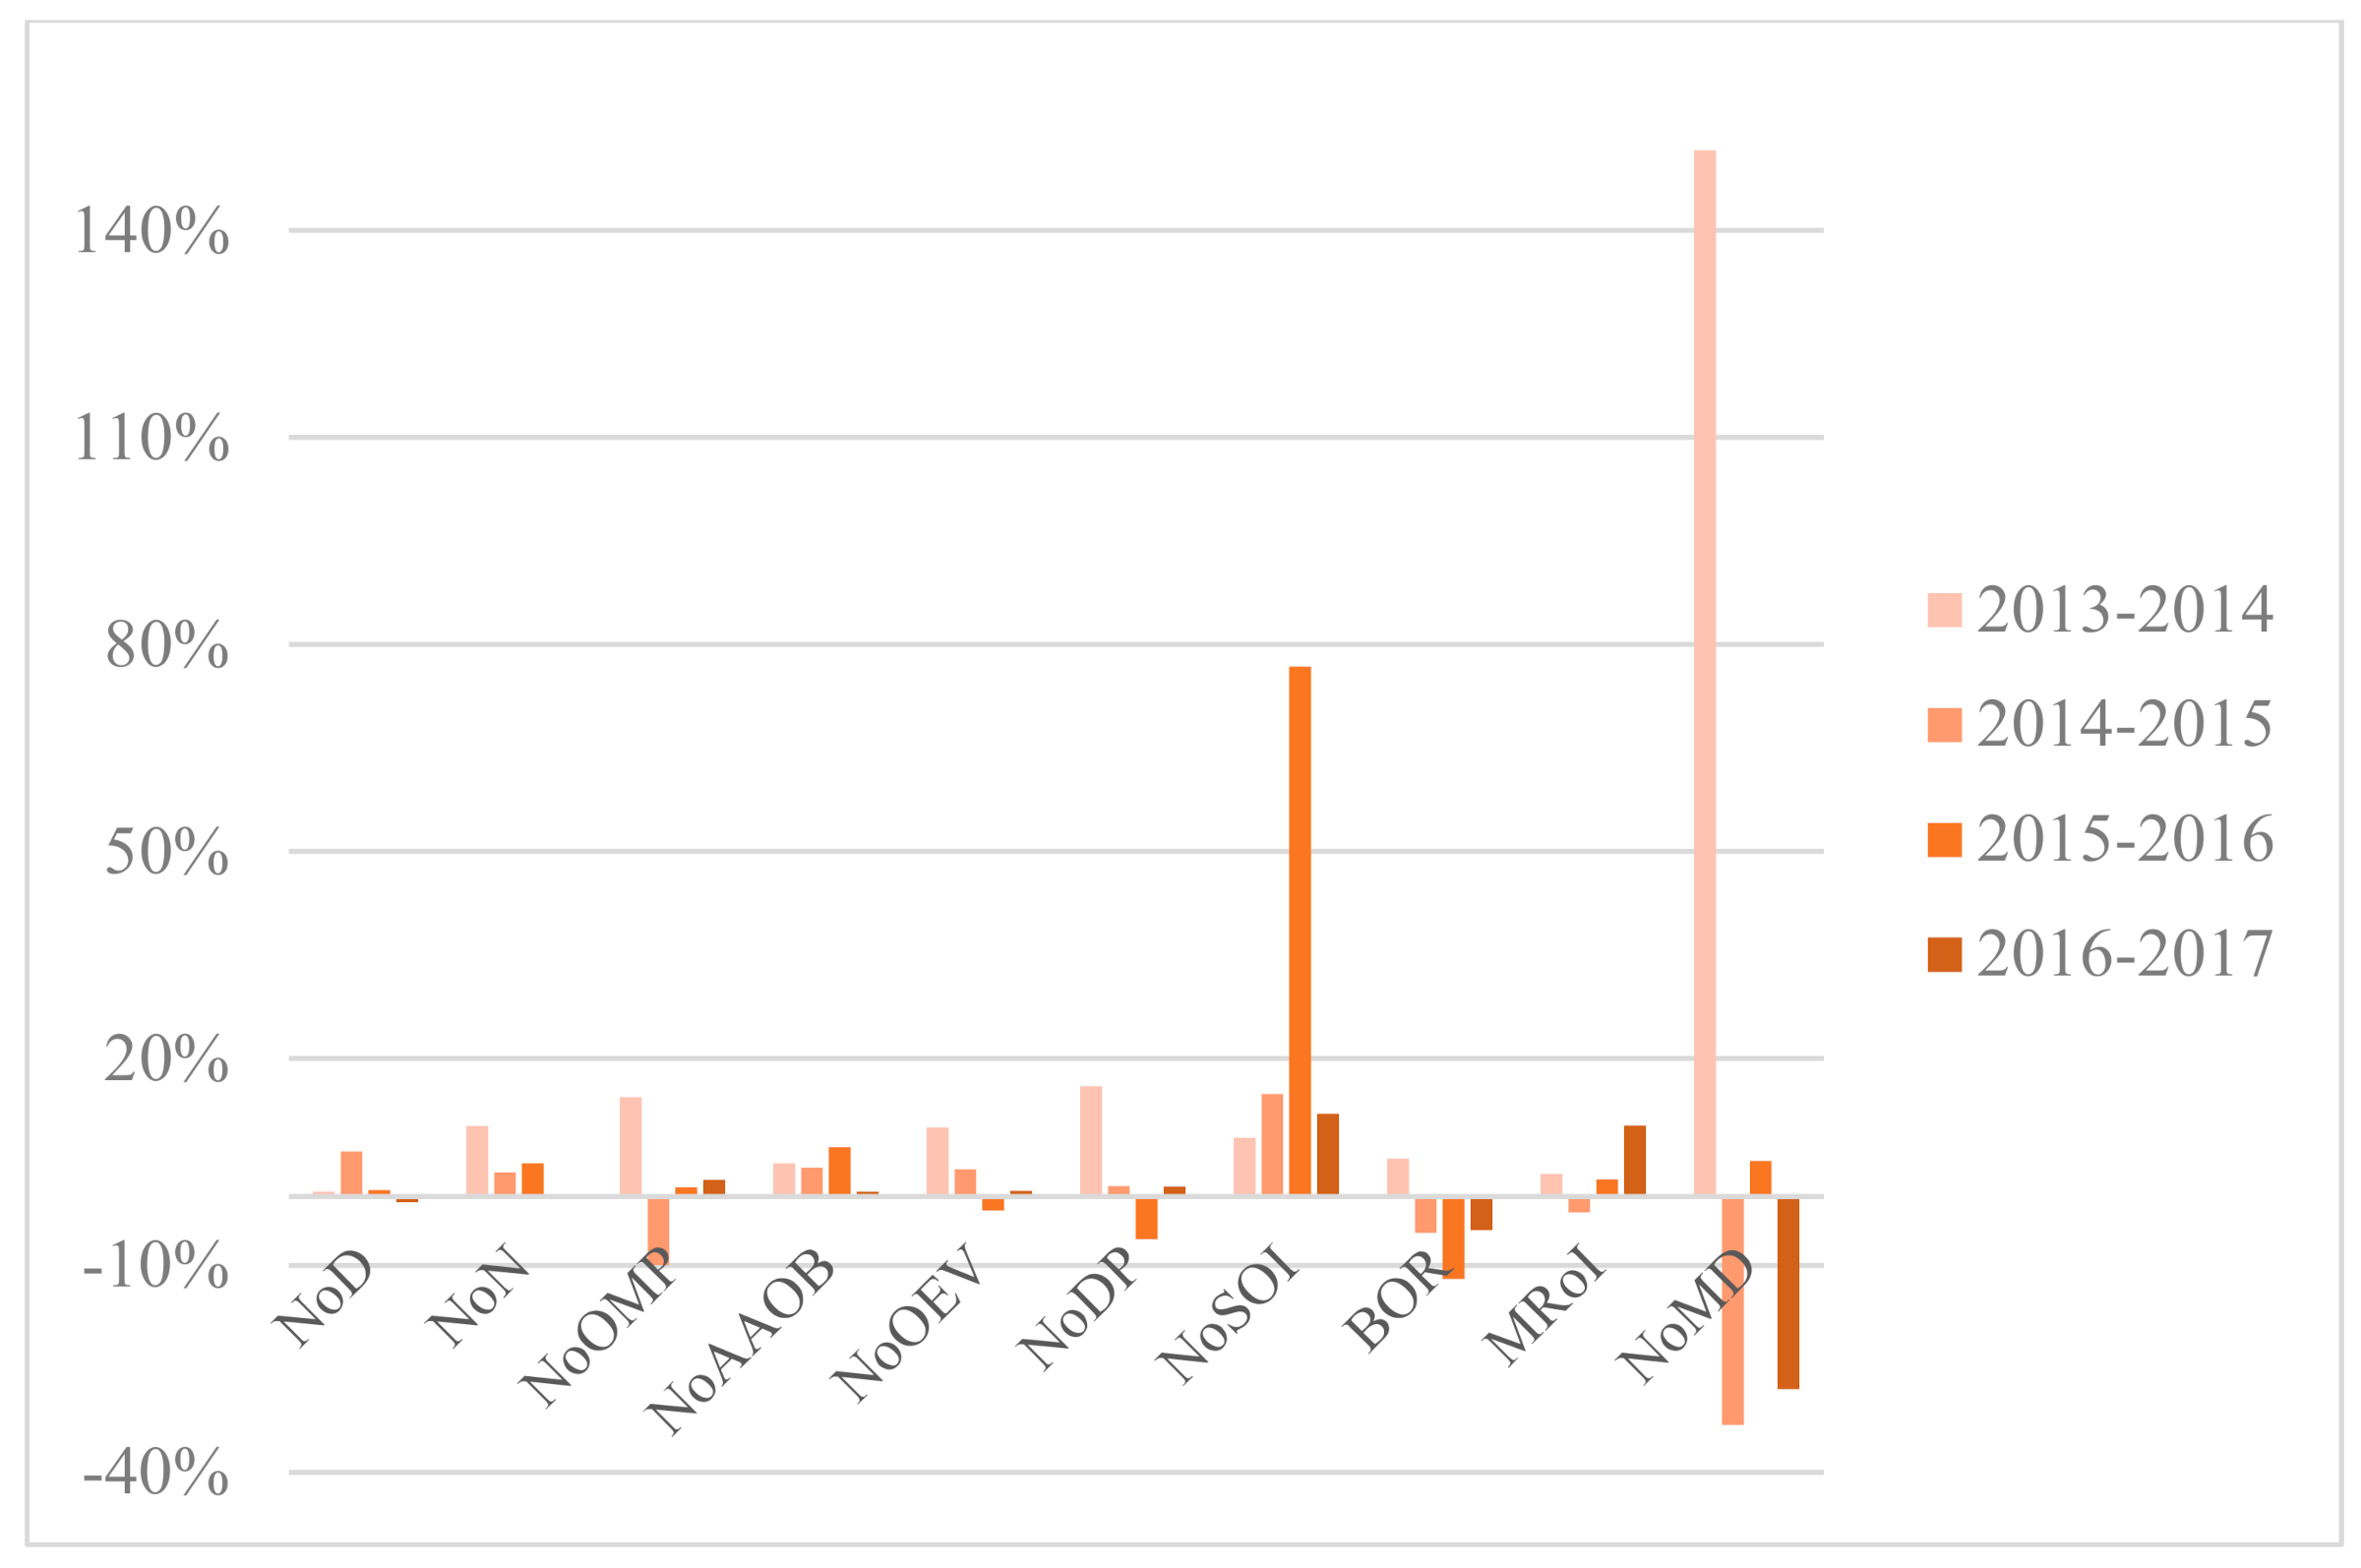
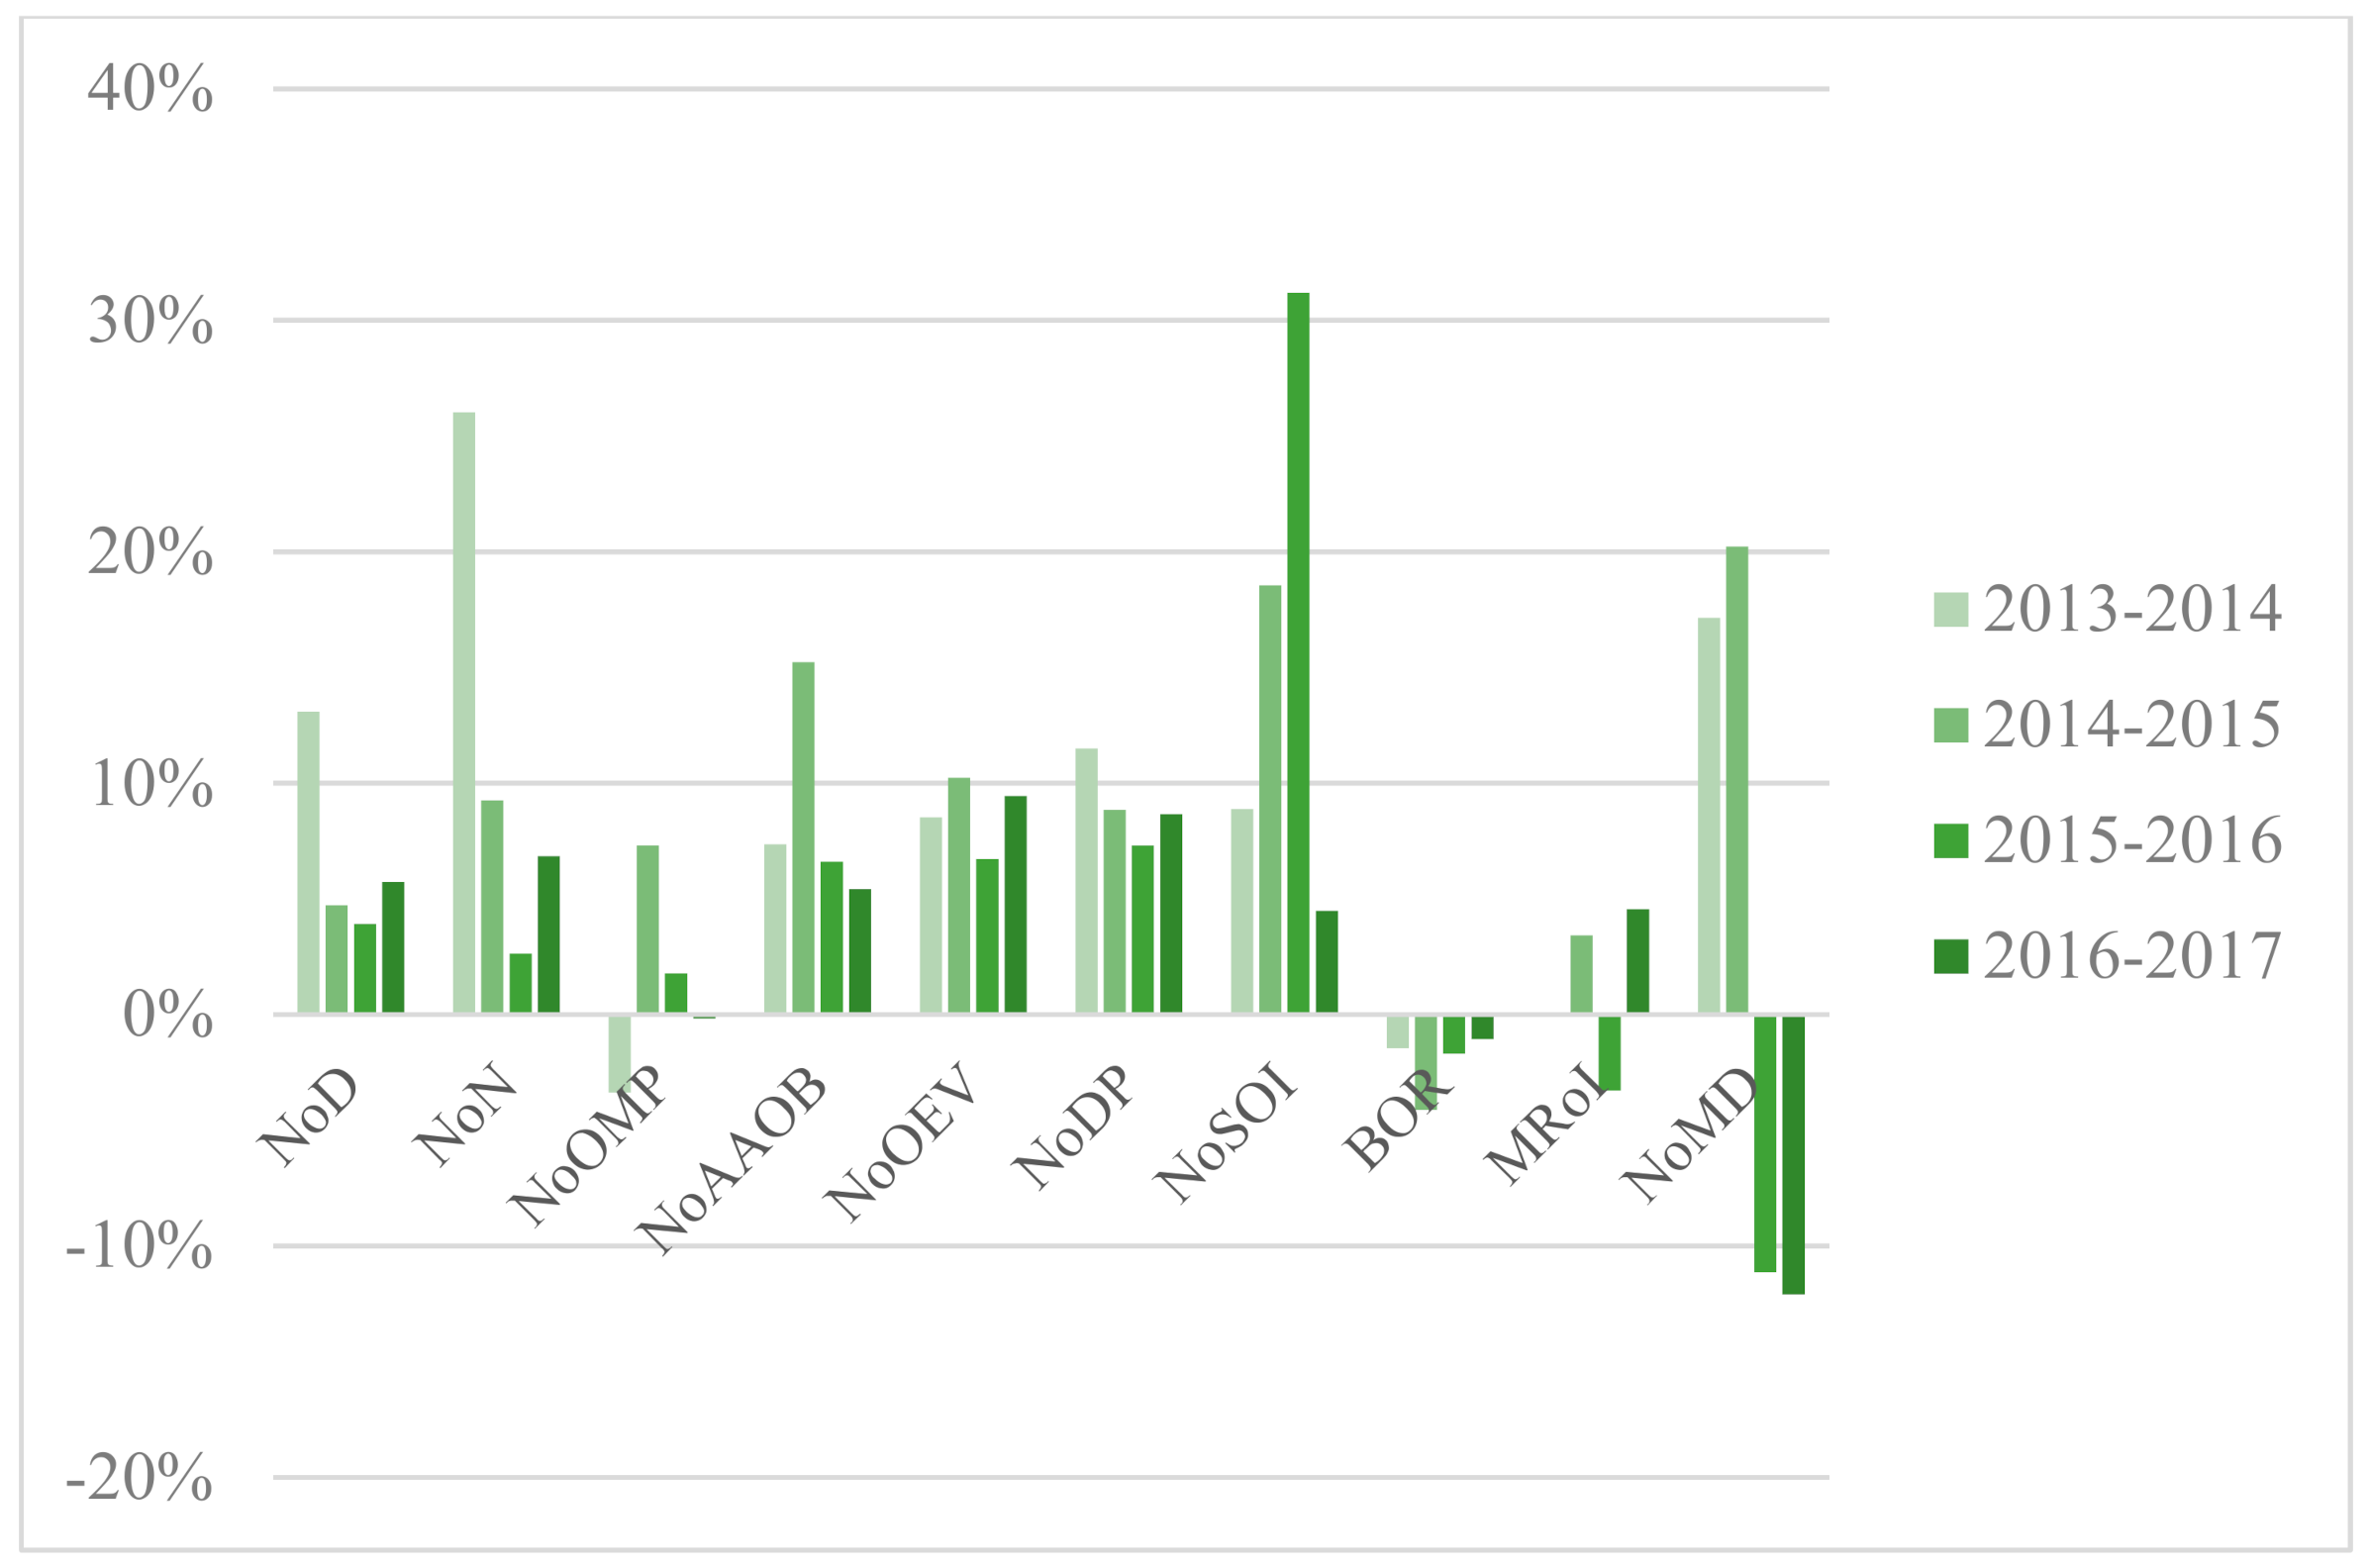
Situated in central China, Wuhan is the largest city in this region with 10.89 million permanent residents and 81.16 million hospital visits in 2017 [77,78]. As one of the fastest-growing cities in China, Wuhan has 354 hospitals, 61 of which are tertiary hospitals [78]. The annual growth rates of variables regarding the three types of hospital are illustrated in Figure 3, Figure 4 and Figure 5. Appendix A presents yearly description statistics of input–output variables spanning from 2013 to 2017.
Overall, the average of NoD in sample hospitals increased by 45.81% and NoN increased by 93.30% from 2013 to 2017. As for NoOEV, the growth rate reached 55.88%. Both the mean and SD of the inputs and outputs indicators grew year by year except for some fluctuations in NoOMP and BOR. However, the value of SD manifested huge disparities among sample hospitals, especially in variables such as NoOEV and NoDP. That is to say, the growth and diversity of indicators showed market potential but unbalanced development of tertiary public healthcare sector in WH at the same time.
On the one hand, the average of NoD, NoN, and NoOMP in PH achieved 1016.14, 1880.71, and 415.14 respectively in 2017, surpassing Municipal Hospitals (MH) and Other Hospitals (OH). That signified PH possessed more resources in medical personnel compared with MH and OH. Furthermore, the average of NoAAOB in Provincial Hospitals (PH), MH, and OH respectively stood at 2805.00, 1385.42, and 1000.33 in 2017. From the statistics, it is clear that PH scored significantly higher on average of NoAAOB than MH and OH due to ampler resources of inpatient beds.
On the other hand, the mean of NoOEV and NoDP in PH, MH, and OH experienced a remarkable increase over the period. Meanwhile, the average NoSOI differed greatly among PH, MH, and OH and grew incrementally over the time horizon. However, the variable BOR showed a slight fluctuation and presented a relatively stable tendency between 2013 and 2015.
As for undesirable outputs, the average of MRoI for each type of hospital fluctuated within their respective ranges. The mean of NoMD among three kinds of sectors had an upward trend from 2013 to 2016, which reminds us that communication and contact between doctors and patients in hospital evolvement should be paid attention to.
3.2. Technical Efficiency Comparison
Generally, the average efficiency in PH and MH showed an increasing tendency over the period. However, regarding OH, the reverse seems to be the case. Table 4 summarized the mean and Standard Deviation (SD) of original scores for CCR model orientated to outputs among Model A, Model B, and Model C. The analysis results of three models showed that public hospitals governed by municipal administration achieved higher mean scores than those affiliated with other levels of administrations. Under different subordinate relations, original score of sample hospitals did not significantly differ from 2013 to 2015 based on three models. However, the scores in 2016 and 2017 were statistically significant.
Moreover, as we can see in Table 5, the results with bootstrapping in 2000 replications indicated an overall decline of efficiency score under three levels of affiliations owing to the corrected efficiency indices of the analyzed model. As for the mean scores with bootstrapping in Model A, Model B, and Model C, the efficiency value of MH was also higher than that of PH, and OH was the lowest over the period, except result of Model C in 2015 (PH scored the highest). Under different subordinate relations, score with bootstrapping of sample hospitals also did not significantly differ from 2013 to 2015 based on three models. However, the scores in 2016 and 2017 were statistically significant, except result of Model B in 2016.
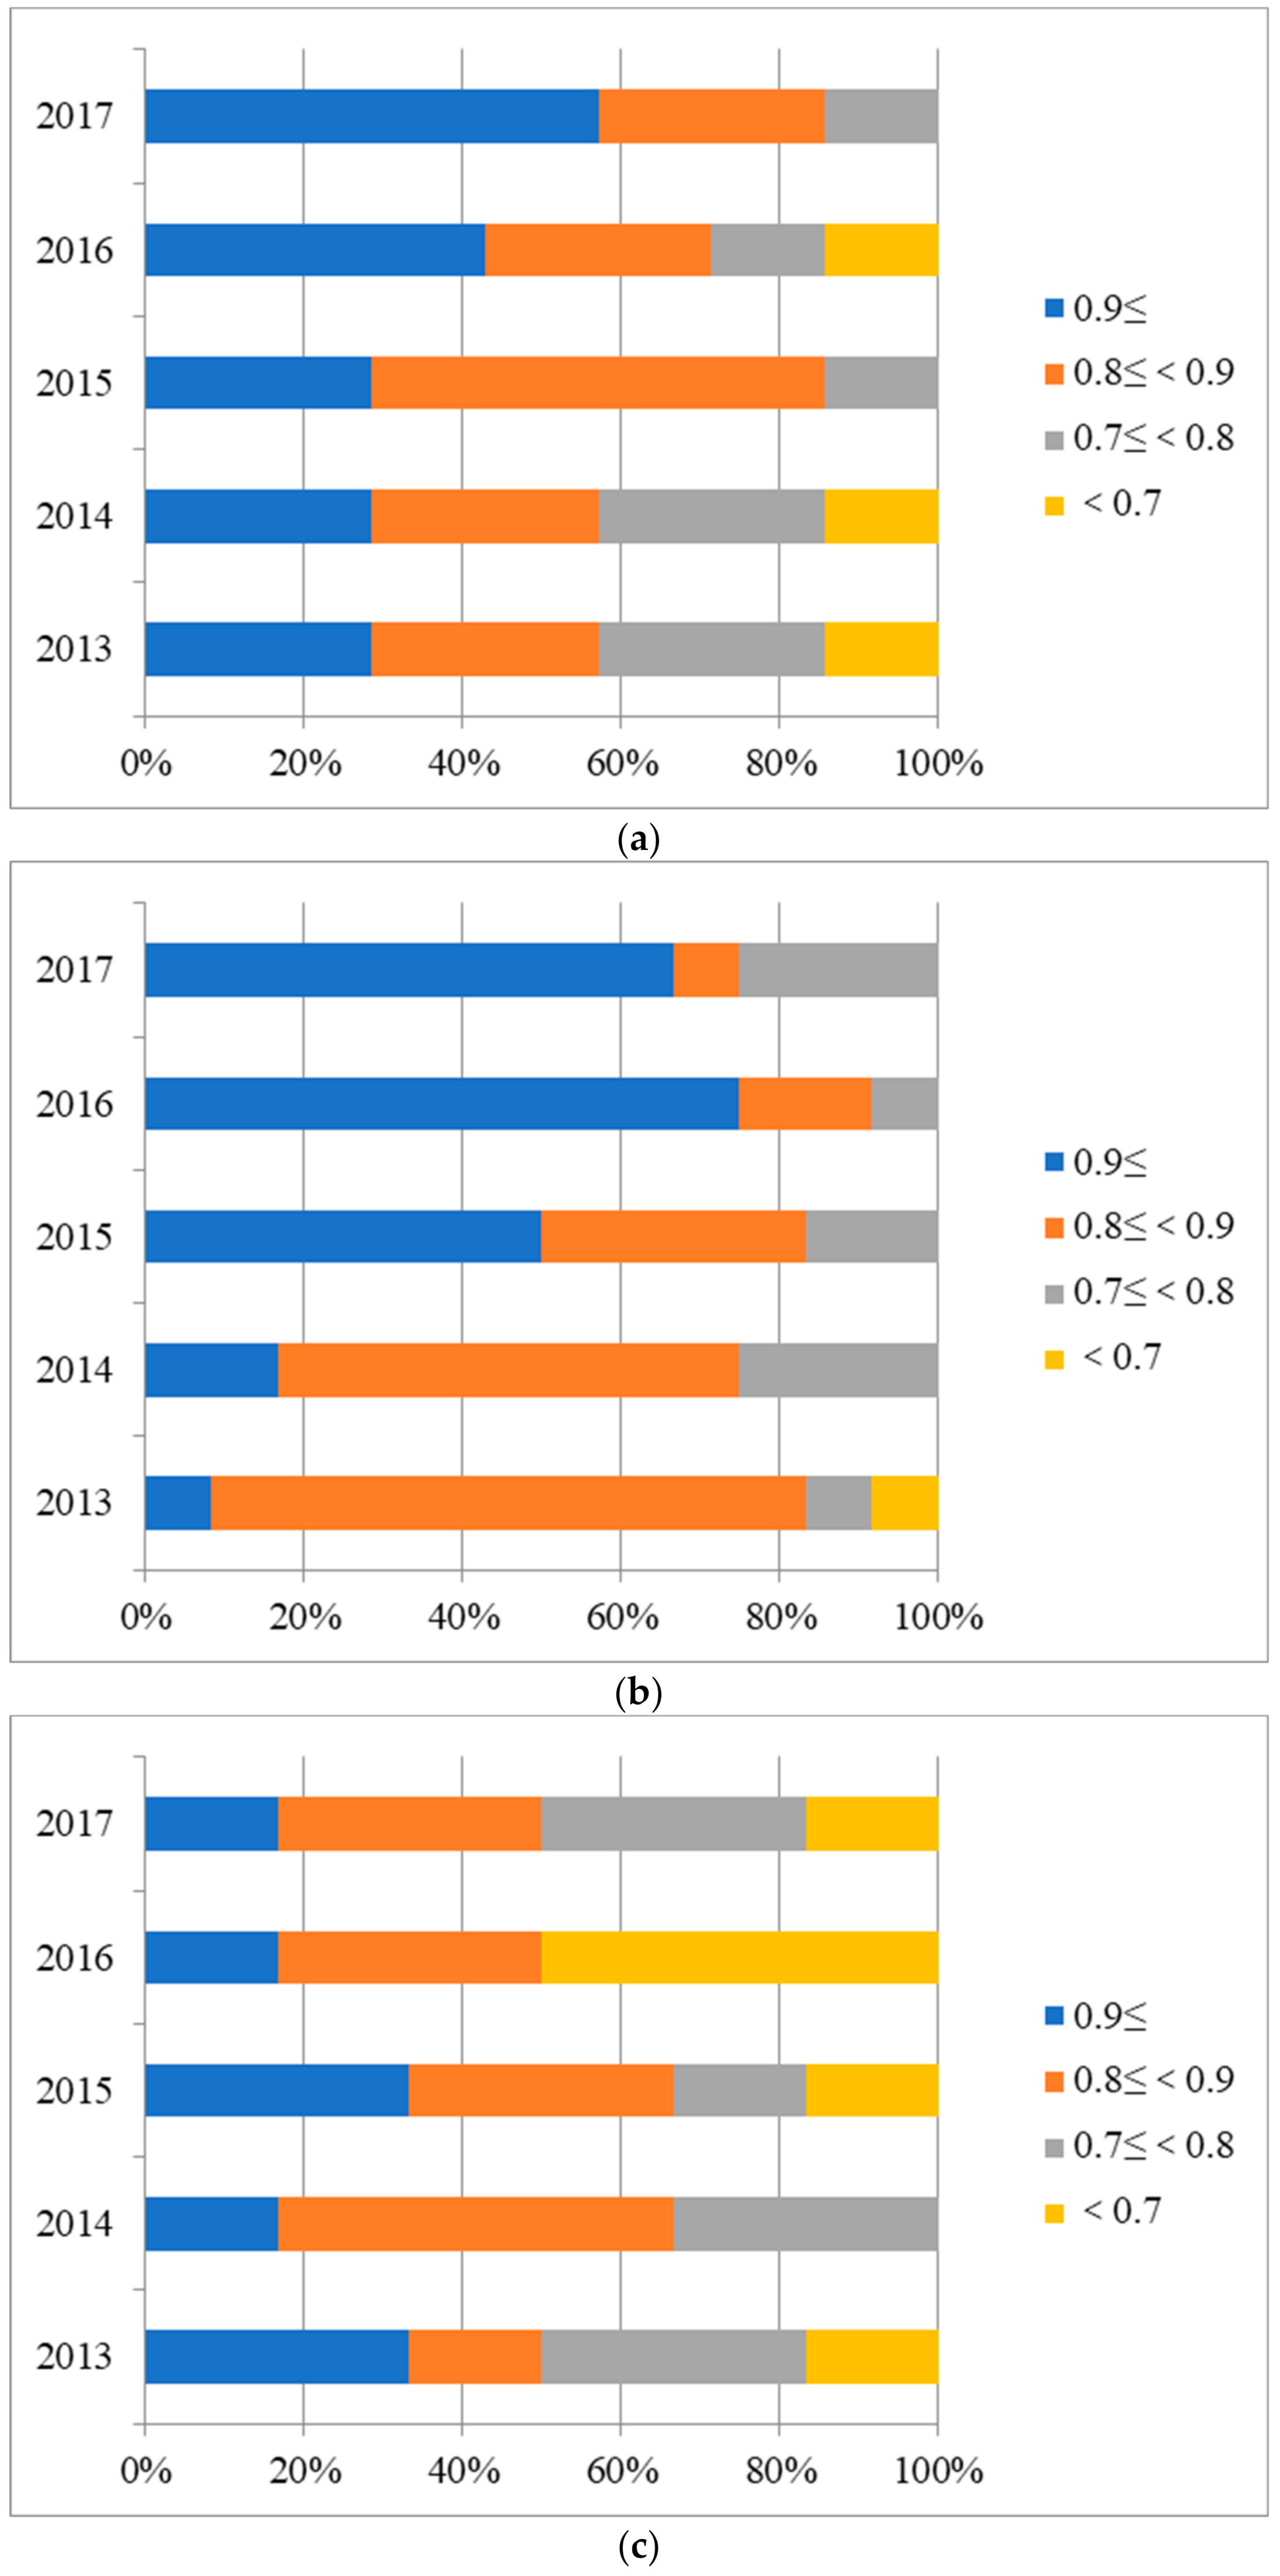
Next, distribution analysis of scores for hospitals under three affiliations were conducted. Given the limited space of the paper, only results of Model A with bootstrapping are shown in Figure 6. As we can see from it, some hospitals were apparently operating inefficiently and there were obvious differences in distribution of values among hospitals affiliated under different subordination.
As described in Figure 6, the distribution of scores with bootstrapping among PH, MH, and OH was exhibited in four ranges. In the first place, the distribution of score (>0.9) for PH kept increasing over the period, accounting for 57.14% in 2017 from Figure 6a. In addition, there was no efficiency value (<0.7) in the distribution of 2015 and 2017, reflecting a steady improvement of efficiency value in PH. Meanwhile, Figure 6b reported a remarkable efficiency growth in MH whose value (>0.9) made up a significant share of 75.00% in 2016 and the value (<0.7) has disappeared since 2013. Moreover, it can be found in Figure 6c that in OH, the proportion of value (>0.9) and value (0.9>, ≥0.8) was respectively 16.67% and 33.33% in 2017, and a downward trend took place.
3.3. Mamlquist Index Change and Decomposition
The results for productivity change levels via MI with CRS from 2013 to 2017 are reported in Table 6. As shown in the table, the geometric means of DMUs indicated a slight increase of 0.54% in productivity from 2015–2016 but a decrease in 2013–2014, 2014–2015, and 2016–2017 (1.52%, 12.01%, and 0.07%, respectively). The OH was the only category that has been diminishing constantly in productivity from 2013 to 2017, while PH and MH showed fluctuations over the period.
Focusing on the rise and fall of productivity variation between the Technological Change (TC) and Technical Efficiency Change (EC) in DMUs, we observed that the increase of MI was caused by the ascent of either EC or TC at different periods. Thus, it is challenging to figure out whether there is a clear demonstration of changes in public hospital productivity that can be attributed to EC or TC. Additionally, under different subordinate relations, MI, EC, and TC in sample hospitals did not significantly differ based on Model A, except the results for MI and TC in 2013–2014, MI and EC in 2016–2017.
4. Discussion
Public hospitals serve as the center of the healthcare delivery chain, playing an essential role in the health service system, especially in a socialist country such as China. Currently, Chinese public hospitals occupy 95% of national healthcare resources and undertake the major responsibility of state health security [16,23]. However, the inadequacy and lack of access to affordable healthcare have been lingering in the public medical sector [19,21]. Although this phenomenon is caused by many factors, the root cause lies in the uneven distribution and usage of medical resources. Supposing the efficiency of public medical institutions is fairly low, it is still hard for the government to solve this dilemma even if fiscal subsidies are increased. Therefore, evaluating the efficiency of hospitals cannot be ignored while carrying out the PPHR. Reforms in the government and management system of public hospitals are still evolving globally. It is indisputable that the hospital sector is characterized by huge differences in scale, type, function, affiliation, and integrated performance in China. Fundamentally, how to use limited resources to improve efficiency and maximize the economic and social benefits of hospitals is the top priority for policymakers. The empirical results of our research are as shown below.
First, efficiency variance of public hospitals under different affiliations has already been shown gradually. The tendency of efficiency growth curve indicates that the differences in public hospitals affiliated with different levels of administrative organs are likely to grow over time. To be specific, it is clear that MH and PH have seen an obvious efficiency improvement between 2013 and 2017. The great majority of MH and PH achieved efficiency gains, accounting for most of the highest efficiency values of DMU cluster. However, OH had lost efficiency over the research panel and took on a decreasing trend, posing a tremendous challenge to the improvement of overall efficiency in public health facilities. Part of the reason for this result is efficacy of healthcare delivery in MH and PH benefits from the PPHR to some degree since 2014, because the policy circumstance of medical care in WH was relatively stable over the period except during PPHR’s implementation. Generally, this reform policy package may exert active effects on efficiency of MH and PH. However, it is still an issue to be explored as for why PPHR did not bring improved efficiency of OH. To ensure government stewardship in effectively leading public hospital system through next phase of reform, relevant measures should start with OH and pilot initiatives need to be clearly defined and explicitly funded to assist OH in achieving a better performance.
Second, MH achieved better results of average efficiency scores than those of PH and OH, whether before or after the implementation of PPHR. To the best of our knowledge, the higher efficiency of hospitals affiliated with municipality, as compared with those governed by province and under other affiliations, may be attributed to better governance and organization structure, such as the establishment of the Urban Medical Association. This kind of flexibility is in line with the form of localized management of medical resources. In addition, the input of MH resource, such as site size, medical facilities, and human resources, is considered more from the aspect of city instead of region. However, PH input is usually considered from the aspect of province and OH considered from community. These reasons may have caused the low efficiency of PH and OH in city. Hence, to enhance the use level of input resources and reduce wastes, further reform measures should be taken to restructure the input–output patterns of public health facilities according to the functional localization. To improve the efficiency of tertiary general public hospital clusters in WH, the quantity and location of PH and OH need to be judged and reconsidered.
Third, the distribution analysis of efficiency scores showed that most of the inefficient DMUs came from OH. There is no doubt that OH has the highest degree of autonomy and independence among the three types of hospitals, but it also produced the most ineffective values. The reason for this is probably that the management mode in the OH cluster was more diversified than PH and MH. Therefore, relevant heterogeneity existed in OH and it should be taken into consideration. In China, OH (i.e., hospitals governed by state-owned enterprises, universities, social groups, and social organizations) vary in organizational structure, financial affairs, and management mechanism. This kind of decentralization gives enough responsibility and autonomy to the healthcare facilities, such as management trusteeship and service outsourcing. However, decentralization may have negative repercussions [79]. Due to the intervention of private capital, it is reasonable to suppose that when hospitals are autonomous and independent, they may pursue their specific interests in the first place by placing barriers to the implementation of measures related to regional or national priorities (e.g., system reform or project implementation) instead of considering how to improve efficiency [79,80,81]. Although autonomy in healthcare has been successful in some European countries, we still doubt whether autonomy and independence can improve the efficiency of Chinese public hospitals. However, it is still a very interesting issue whether to adopt a centralized or decentralized governmental practice when supervising public healthcare sectors. We look forward to follow-up evidence from China. Therefore, more efforts should be made in OH to enhance its efficiency and reduce disparities among public hospitals affiliated with different levels of administration varying in efficiency. It is advisable of the government and organizations to examine the least efficient OH to remedy the prevailing inefficiency. Measures may include reconsidering the number of facilities and their distribution, enhancing efficiency, and reducing duplication by closing or scaling down hospitals with performance values below a certain threshold. Meanwhile, multiple policy mechanisms could be used consistently to put pressure on hospitals to contain costs and use resources more effectively.
Fourth, the results of MI and its decomposition cannot attest to differences among hospitals under distinct affiliations during the research panel. However, as we can notice from the MI curve for each sector, most productivity indices were in a regression state (<1). This reminds us that we must continue to pay attention to the productivity change of public healthcare facilities. Although public institutions will remain a major supplier in Chinese healthcare system, private medical market in which doctors can practice and patients can obtain reimbursement with healthcare insurance could grow rapidly over the next ten years due to limitations eased by government. The private healthcare facilities in China should be encouraged to play a significant part by transferring pressure to the public health sector, thus promoting efficient performance and fostering a benign competition environment.
Finally, the results by bootstrapping in 2000 replications are indicative of a general decline of the efficiency score compared with original ones, reflecting an optimal precision in the assessment. According to the research conducted by Angeliki, the bootstrapping method allows for the conclusion whether a result indicates true states or is a coincidence due to sampling variation [47]. Specifically, as an effective way to avoid possibility of bias in the estimation, the bootstrapping method can help break the bottleneck by repeated sampling to amplify the number of DMUs, to make the estimated efficiency scores much closer to the real ones. Also, bootstrapping technique could correct the biased SD caused by dependency in the panel data used in the study. For those reasons, bootstrapping method is strongly recommended when applying DEA approach in hospital efficiency estimation.
5. Conclusions
This paper combined multiple approaches such as the Bootstrap-DEA and Malmquist method, and analyzed the disparity of efficiency scores and changes of productivity among public hospitals affiliated with different levels of administration in WH, through using panel data collected from 2013 to 2017. Our findings provided preliminary evidence that differences in public hospitals’ operation efficiency resulting from different administrative affiliations have emerged and are increasing year by year with the progress of PPHR. Based on DEA model, the average efficiency of MH ranked first among the three affiliations, and OH constituted the majority of inefficient DMUs. The higher efficiency of MH may be attributed to better governance and organization structure. Meanwhile, no evidence showed that there is a difference in productivity among hospitals under different affiliations. Moreover, we surmised that the PPHR, to a certain degree, may have exerted a positive influence on promoting the efficiency of PH and MH, but not OH. Thus, more effective measures should be initiated to help OH to alter their inefficient status. The challenge of boosting public hospital efficiency requires the implementation of reform in a more consistent, coordinated approach, to reengineer the process, especially in the administrative affiliations.
6. Strengths and Limitations
There have been previous studies evaluating public hospitals’ efficiency from the aspects of service capacity and facility type, but we explored a unique perspective—administrative affiliations. However, there are still some limitations in the study. First, based on the defects of DEA approach, the lack of revision for case-mix and evaluation for absolute efficiency implies that the outcome of our research must be interpreted scrupulously and served only as a window into the performance of Chinese public hospitals. Second, although this study employed a significance test and treated all tertiary general public hospitals in WH as a clustered sample of PPHR, there may be variance of certain concern due to limited cluster. Further studies are required to incorporate massive intercity samples to gain a comprehensive view of performance in the cluster cities of PPHR. Third, with the rapid development of China’s economy, the impact of environmental factors on the efficiency of medical institutions (e.g., GDP per capita) could be considered in future studies by using methods such as Four-Stage DEA.
Author Contributions
Conceptualization, G.Y., and H.T.; Methodology, G.Y. and H.T.; data extraction, G.Y.; statistical analysis, G.Y.; writing—original draft preparation, G.Y.; writing—review & editing, G.Y., C.C., L.Z. and Q.H.; supervision, H.T. All authors have read and agreed to the published version of the manuscript.
Funding
This research was supported by the National Natural Science Foundation of China (Grant Number: 71774061).
Institutional Review Board Statement
Ethical review and approval were waived for this study, due to no human or animal data were used.
Informed Consent Statement
Not applicable.
Data Availability Statement
The statistical data of the study used and analyzed were extracted from publications, a series of Wuhan Health and Family Planning Yearbook (2014–2018). Online purchase links for publications are available from the first author on request.
Acknowledgments
Thanks are due to Wei Lu from Hainan Medical University for the support in this research.
Conflicts of Interest
The author declared no potential conflict of interest with respect to the research.
Appendix A. Description Statistics of Input–Output Variables (2013–2017)

Table A1.
Description statistics of input–output variables (2013–2015).
| Category | Variables | 2013 | 2014 | 2015 | |||||||||
|---|---|---|---|---|---|---|---|---|---|---|---|---|---|
| Mean | SD | Max | Min | Mean | SD | Max | Min | Mean | SD | Max | Min | ||
| PH | NoD | 559.86 | 320.66 | 1256.00 | 169.00 | 586.57 | 366.17 | 1405.00 | 171.00 | 868.29 | 560.36 | 1626.00 | 175.00 |
| NoN | 620.57 | 223.32 | 1066.00 | 295.00 | 645.57 | 244.72 | 1165.00 | 299.00 | 1560.86 | 1157.02 | 3240.00 | 328.00 | |
| NoOMP | 217.14 | 94.56 | 363.00 | 94.00 | 310.86 | 213.84 | 667.00 | 95.00 | 355.71 | 249.91 | 815.00 | 101.00 | |
| NoAAOB | 2040.86 | 1211.66 | 3841.00 | 549.00 | 2178.43 | 1271.57 | 4165.00 | 598.00 | 2376.57 | 1497.98 | 4989.00 | 698.00 | |
| NoOEV | 1,583,595.43 | 1,310,464.21 | 3,513,216.00 | 73,244.00 | 1,857,237.43 | 1,591,916.68 | 4,285,597.00 | 93,461.00 | 2,187,820.71 | 1,853,284.48 | 4,829,868.00 | 110,391.00 | |
| NoDP | 75,648.71 | 53,985.43 | 158,426.00 | 6553.00 | 88,139.57 | 64,529.73 | 176,898.00 | 8760.00 | 94,864.57 | 71,565.41 | 195,593.00 | 9667.00 | |
| NoSOI | 26,225.71 | 21,879.51 | 54,725.00 | 892.00 | 32,217.43 | 26,407.06 | 71,308.00 | 1312.00 | 34,674.00 | 28,571.04 | 77,946.00 | 1524.00 | |
| BOR | 105.99 | 16.34 | 130.07 | 82.43 | 109.12 | 15.91 | 140.13 | 87.62 | 103.81 | 18.71 | 140.11 | 74.80 | |
| MRoI | 1.03 | 0.54 | 1.43 | 0.39 | 1.05 | 0.57 | 1.91 | 0.36 | 1.04 | 0.56 | 1.88 | 0.39 | |
| NoMD | 16.00 | 19.40 | 48.00 | 1.00 | 38.43 | 47.72 | 136.00 | 1.00 | 51.00 | 30.63 | 98.00 | 11.00 | |
| MH | NoD | 378.33 | 188.52 | 724.00 | 142.00 | 427.83 | 225.24 | 836.00 | 151.00 | 448.00 | 244.07 | 900.00 | 164.00 |
| NoN | 546.58 | 332.67 | 1109.00 | 158.00 | 688.75 | 398.12 | 1564.00 | 305.00 | 752.42 | 464.75 | 1805.00 | 323.00 | |
| NoOMP | 167.75 | 68.99 | 311.00 | 67.00 | 162.08 | 60.45 | 261.00 | 54.00 | 173.92 | 83.67 | 386.00 | 64.00 | |
| NoAAOB | 996.75 | 453.16 | 1759.00 | 467.00 | 1070.08 | 557.69 | 2388.00 | 498.00 | 1232.92 | 807.19 | 3350.00 | 498.00 | |
| NoOEV | 704,016.92 | 567,613.12 | 2,275,892.00 | 147,964.00 | 763,964.25 | 592,834.91 | 2,298,258.00 | 148,587.00 | 842,138.00 | 642,011.47 | 2,314,905.00 | 184,662.00 | |
| NoDP | 39,792.00 | 24,311.46 | 84,019.00 | 13,093.00 | 44,367.17 | 30,035.10 | 115,482.00 | 13,650.00 | 48,287.67 | 35,511.95 | 142,465.00 | 13,416.00 | |
| NoSOI | 10,859.25 | 6867.98 | 23,372.00 | 2380.00 | 11,823.42 | 8611.21 | 32,269.00 | 2108.00 | 14,015.50 | 10,394.95 | 40,048.00 | 2531.00 | |
| BOR | 106.22 | 16.60 | 136.45 | 74.43 | 104.67 | 13.38 | 126.10 | 79.03 | 100.34 | 10.31 | 113.20 | 83.07 | |
| MRoI | 0.88 | 0.54 | 1.76 | 0.20 | 0.88 | 0.56 | 1.87 | 0.10 | 0.91 | 0.60 | 1.94 | 0.10 | |
| NoMD | 29.17 | 26.76 | 82.00 | 1.00 | 34.17 | 33.71 | 115.00 | 1.00 | 41.08 | 35.45 | 105.00 | 2.00 | |
| OH | NoD | 295.67 | 93.43 | 452.00 | 146.00 | 297.67 | 88.91 | 420.00 | 181.00 | 317.00 | 79.56 | 416.00 | 187.00 |
| NoN | 448.50 | 101.99 | 575.00 | 276.00 | 494.17 | 117.12 | 676.00 | 346.00 | 511.33 | 89.83 | 639.00 | 413.00 | |
| NoOMP | 134.50 | 51.54 | 245.00 | 83.00 | 153.83 | 31.47 | 193.00 | 111.00 | 138.50 | 42.72 | 198.00 | 97.00 | |
| NoAAOB | 850.00 | 184.81 | 1193.00 | 630.00 | 890.67 | 203.82 | 1296.00 | 652.00 | 927.50 | 176.87 | 1296.00 | 794.00 | |
| NoOEV | 440,459.83 | 87,654.22 | 590,961.00 | 323,152.00 | 484,304.50 | 199,808.36 | 721,723.00 | 191,235.00 | 503,293.67 | 192,961.04 | 801,667.00 | 247,233.00 | |
| NoDP | 25,620.33 | 10,981.27 | 44,043.00 | 13,992.00 | 29,703.33 | 13,458.20 | 55,468.00 | 14,688.00 | 30,149.83 | 12,670.13 | 54,310.00 | 17,021.00 | |
| NoSOI | 4781.33 | 3142.49 | 10,354.00 | 839.00 | 5186.17 | 3814.95 | 12,418.00 | 753.00 | 5953.83 | 3814.79 | 12,315.00 | 581.00 | |
| BOR | 97.69 | 11.14 | 114.77 | 83.44 | 103.06 | 13.41 | 118.88 | 79.36 | 97.60 | 16.88 | 115.00 | 68.69 | |
| MRoI | 1.23 | 0.35 | 1.53 | 0.45 | 1.27 | 0.26 | 1.52 | 0.72 | 1.24 | 0.28 | 1.44 | 0.66 | |
| NoMD | 23.25 | 21.85 | 61.00 | 1.00 | 58.50 | 106.53 | 316.00 | 1.00 | 39.12 | 21.34 | 65.00 | 6.00 | |
Table A2.
Description statistics of input–output variables (2016–2017).
| Category | Variables | 2016 | 2017 | ||||||
|---|---|---|---|---|---|---|---|---|---|
| Mean | SD | Max | Min | Mean | SD | Max | Min | ||
| PH | NoD | 933.00 | 602.59 | 1775.00 | 183.00 | 1016.14 | 648.98 | 1907.00 | 193.00 |
| NoN | 1765.43 | 1351.86 | 4003.00 | 360.00 | 1880.71 | 1426.49 | 4226.00 | 381.00 | |
| NoOMP | 400.57 | 296.34 | 987.00 | 118.00 | 415.14 | 324.78 | 1054.00 | 117.00 | |
| NoAAOB | 2598.43 | 1683.93 | 5128.00 | 800.00 | 2805.00 | 1885.18 | 5461.00 | 798.00 | |
| NoOEV | 2,522,946.14 | 2,234,223.89 | 5,800,846.00 | 126,331.00 | 2,826,435.14 | 2,493,122.59 | 6,317,152.00 | 136,685.00 | |
| NoDP | 105,800.29 | 83,418.86 | 231,248.00 | 10,583.00 | 120,493.43 | 96,914.89 | 272,002.00 | 12,174.00 | |
| NoSOI | 41,287.57 | 34,350.85 | 97,017.00 | 2198.00 | 46,187.29 | 37,629.60 | 104,156.00 | 2805.00 | |
| BOR | 102.26 | 18.02 | 128.77 | 68.44 | 104.38 | 17.14 | 124.68 | 74.21 | |
| MRoI | 1.06 | 0.57 | 1.95 | 0.41 | 1.05 | 0.59 | 1.93 | 0.38 | |
| NoMD | 52.43 | 37.57 | 126.00 | 17.00 | 50.71 | 20.77 | 88.00 | 26.00 | |
| MH | NoD | 465.50 | 262.81 | 1004.00 | 164.00 | 492.17 | 278.25 | 1088.00 | 173.00 |
| NoN | 772.25 | 483.47 | 1921.00 | 339.00 | 825.08 | 523.99 | 2160.00 | 343.00 | |
| NoOMP | 177.00 | 73.92 | 298.00 | 71.00 | 176.67 | 70.55 | 317.00 | 85.00 | |
| NoAAOB | 1314.17 | 829.79 | 3378.00 | 499.00 | 1385.42 | 831.06 | 3369.00 | 497.00 | |
| NoOEV | 898,697.33 | 704,974.89 | 2,370,588.00 | 174,047.00 | 983,537.00 | 730,772.53 | 2,510,640.00 | 170,712.00 | |
| NoDP | 51,813.08 | 38,378.75 | 156,783.00 | 14,282.00 | 56,297.17 | 41,130.54 | 168,712.00 | 13,911.00 | |
| NoSOI | 18,386.33 | 14,840.15 | 45,257.00 | 2594.00 | 19,208.42 | 15,381.71 | 52,054.00 | 2627.00 | |
| BOR | 98.64 | 13.93 | 119.05 | 75.79 | 97.59 | 13.25 | 121.56 | 79.89 | |
| MRoI | 0.88 | 0.56 | 1.86 | 0.11 | 0.92 | 0.53 | 1.79 | 0.10 | |
| NoMD | 36.50 | 27.66 | 87.00 | 2.00 | 32.08 | 21.24 | 64.00 | 3.00 | |
| OH | NoD | 319.83 | 75.01 | 419.00 | 191.00 | 317.00 | 74.49 | 421.00 | 199.00 |
| NoN | 535.67 | 105.83 | 705.00 | 407.00 | 535.17 | 123.16 | 746.00 | 405.00 | |
| NoOMP | 140.33 | 32.72 | 190.00 | 103.00 | 143.67 | 34.34 | 187.00 | 100.00 | |
| NoAAOB | 993.67 | 196.20 | 1392.00 | 812.00 | 1000.33 | 179.18 | 1277.00 | 808.00 | |
| NoOEV | 493,043.00 | 220,460.27 | 796,440.00 | 196,035.00 | 496,947.67 | 214,440.90 | 808,992.00 | 194,081.00 | |
| NoDP | 28,265.00 | 10,539.60 | 45,706.00 | 15,597.00 | 28,663.67 | 10,005.96 | 43,535.00 | 15,543.00 | |
| NoSOI | 10,523.33 | 10,219.57 | 32,451.00 | 627.00 | 11,781.33 | 9927.97 | 32,232.00 | 544.00 | |
| BOR | 85.90 | 14.51 | 106.68 | 67.07 | 81.68 | 10.56 | 94.46 | 66.67 | |
| MRoI | 1.27 | 0.23 | 1.48 | 0.83 | 1.40 | 0.24 | 1.65 | 1.13 | |
| NoMD | 41.13 | 37.93 | 124.00 | 2.00 | 29.63 | 16.33 | 62.00 | 7.00 | |
Notes: 1. Data source: Wuhan Health and Family Planning Yearbook (2014–2018). 2. Abbreviation: SD, Standard Deviation; PH, Provincial Hospitals; MH, Municipal Hospitals; OH, Other Hospitals.
References
- Maria, M.; Iain, P.; Monika, R. Measuring hospital efficiency in Austria: A DEA approach. Health Care Manag. Sci. 2002, 5, 7–14. [Google Scholar]
- Butler, T.; Li, L. The utility of returns to scale in DEA programming: An analysis of Michigan rural hospitals. Eur. J. Oper. Res. 2005, 161, 469–477. [Google Scholar] [CrossRef]
- Cheng, Z.; Cai, M.; Tao, H.; He, Z.; Lin, X.; Lin, H.; Zuo, Y. Efficiency and productivity measurement of rural township hospitals in China: A bootstrapping data envelopment analysis. BMJ Open 2016, 6, e011911. [Google Scholar] [CrossRef] [PubMed] [Green Version]
- Kostas, K.; Fotis, P. How efficient are Greek hospitals? A case study using a double bootstrap DEA approach. Eur. J. Health Econ. 2013, 14, 979–994. [Google Scholar]
- Preethy, N.; Yasar, A. Data envelopment analysis comparison of hospital efficiency and quality. J. Med. Syst. 2008, 32, 193–199. [Google Scholar]
- Chang, H. Determinants of hospital efficiency the case of central government-owned hospitals in Taiwan. Omega 1998, 26, 307–317. [Google Scholar] [CrossRef]
- Yin, G.; Zhu, J.; Kong, Y.; Li, W. Empirical research on the operational efficiency of 36 public hospitals in Wuhan based on Bootstrap-DEA model. China Hosp. 2019, 23, 25–28. (In Chinese) [Google Scholar]
- Li, M.; Guo, S.; Dong, S. Correction on Chinese hospital efficiency and total factor productivity measurement based on Bootstrap-Malmquist-DEA. Health Econ. Res. 2019, 36, 63–68. (In Chinese) [Google Scholar]
- Liu, X.; Dong, S.; Li, H. Operational efficiency of county level public hospitals in Hubei: A bootstrap-data envelopment analysis. China J. Hosp. Admin. 2017, 33, 420–422. (In Chinese) [Google Scholar]
- Zhao, L.; Zhang, H. Research on relative efficiency of hospitals in 31 provinces and cities based on different index combination via DEA. Health Econ. Res. 2015, 36, 37–39. (In Chinese) [Google Scholar]
- Lin, K.; Shao, Y.; Ma, X.; Ye, H.; Li, N. The comprehensive technical efficiency and determinants of tertiary public hospitals in Zhejiang province: DEA and Tobit-based analysis. China J. Health Policy 2014, 7, 62–67. (In Chinese) [Google Scholar]
- Li, H.; Dong, S.; Liu, T. Relative efficiency and productivity: A preliminary exploration of public hospitals in Beijing, China. BMC Health Serv. Res. 2014, 14, 158. [Google Scholar] [CrossRef] [Green Version]
- Chen, S.; Wu, Y.; Chen, Y.; Zhu, H.; Wang, Z.; Feng, D.; Feng, Z.; Yao, L.; Xiang, L.; Wong, E.L.Y.; et al. Analysis of operation performance of general hospitals in Shenzhen, China: A super-efficiency data envelopment analysis. Lancet 2016, 388, S57. [Google Scholar] [CrossRef]
- Cheng, Z.; Tao, H.; Cai, M.; Lin, H.; Lin, X.; Shu, Q.; Zhang, R. Using two-stage data envelopment analysis to estimate the efficiency of county hospitals in China: A panel data study. Lancet 2015, 386, S64. [Google Scholar] [CrossRef]
- Liu, X.; Wang, Q.; Sara, B.; Yang, W.; Dong, S.; Li, H. The technical efficiency of community health service in Wuhan, China: Estimation and policy implications. Inq. J. Health Care 2018, 55, 0046958018812972. [Google Scholar] [CrossRef] [Green Version]
- The World Bank. China Health Policy Notes: Fixing the Public Hospital System in China (No.2); The World Bank: Washington, DC, USA, 2010; pp. 8–9. [Google Scholar]
- Xu, J.; Gorsky, M.; Mills, A. Historical roots of hospital centrism in China (1835–1949): A path dependence analysis. Soc. Sci. Med. 2019, 226, 56–62. [Google Scholar] [CrossRef]
- Yip, W.; Fu, H.; Chen, A.; Zhai, T.; Jian, W.; Xu, R.; Pan, J.; Hu, M.; Zhou, Z.; Chen, Q.; et al. 10 years of healthcare reform in China progress and gaps in Universal Health Coverage. Lancet 2019, 394, 1192–1204. [Google Scholar] [CrossRef]
- Ta, Y.; Zhu, Y.; Fu, H. Trends in access to health services, financial protection and satisfaction between 2010 and 2016: Has China achieved the goals of its health system reform? Soc. Sci. Med. 2020, 245, 112715. [Google Scholar] [CrossRef]
- Ramesh, M.; Wu, X. Health policy reform in China: Lessons from Asia. Soc. Sci. Med. 2009, 68, 2256–2262. [Google Scholar] [CrossRef]
- Yip, W.; Hsiao, W.; Chen, W.; Hu, S.; Ma, J.; Maynard, A. Early appraisal of China’s huge and complex health-care reforms. Lancet 2012, 239, 833–842. [Google Scholar] [CrossRef]
- Zhu, C. Launch of the health-care reform plan in China. Lancet 2009, 373, 1322–1323. [Google Scholar]
- Dyckerhoff, C.; Wang, J. China’s health care reform. McKinsey Health Int. 2010, 172, 313. [Google Scholar]
- Steinmann, L.; Dittrich, G.; Karmann, A.; Zweifel, P. Measuring and comparing the (in)efficieny of German and Swiss hospitals. Eur. J. Health Econ. 2004, 5, 216–226. [Google Scholar] [CrossRef] [PubMed]
- Miika, L.; Unto, H.; Jon, M. Comparing hospital cost efficiency between Norway and Finland. Health Policy 2006, 77, 268–278. [Google Scholar]
- Guo, H.; Zhao, Y.; Niu, T.; Tsui, K.L. Hong Kong hospital authority resource efficiency evaluation: Via a novel DEA-Malmquist model and Tobit regression model. PLoS ONE 2017, 12, e0184211. [Google Scholar] [CrossRef] [Green Version]
- Cheng, Z.; Tao, H.; Cai, M.; Lin, H.; Lin, X.; Shu, Q.; Zhang, R.N. Technical efficiency and productivity of Chinese county hospitals: An exploratory study in Henan province, China. BMJ Open 2015, 5, e007267. [Google Scholar] [CrossRef] [Green Version]
- Ding, J.; Hu, X.; Zhang, X.; Shang, L.; Yu, M.; Chen, H. Equity and efficiency of medical service systems at provincial level of China’s mainland: A comparative study from 2009 to 2014. BMC Public Health 2018, 18, 214. [Google Scholar] [CrossRef]
- Liu, Q.; Li, B.; Mohiuddin, M. Prediction and decomposition of efficiency differences in Chinese provincial community health services. Int. J. Environ. Res. Public Health 2018, 15, 2265. [Google Scholar] [CrossRef] [Green Version]
- Li, B.; Mohiuddin, M.; Liu, Q. Determinants and differences of township hospital efficiency among Chinese provinces. Int. J. Environ. Res. Public Health 2019, 16, 1601. [Google Scholar] [CrossRef] [Green Version]
- Campos, M.; Fernandez, A.; Gavilan, J.; Velasco, F. Public resource usage in health systems: A data envelopment analysis of the efficiency of health systems of autonomous communities in Spain. Public Health 2016, 138, 33–40. [Google Scholar] [CrossRef]
- Wang, M.; Fang, H.; Tao, H.; Cheng, Z.H.; Lin, X.J.; Cai, M.; Xu, C.; Jiang, S. Bootstrapping data envelopment analysis of efficiency and productivity of county public hospitals in eastern, central, and western China after public hospital reform. J. Huazhong Univ. Sci. Technol. Med. Sci. 2017, 37, 681–692. [Google Scholar] [CrossRef]
- Ng, Y. The productive efficiency of Chinese hospitals. China Econ. Rev. 2011, 22, 428–439. [Google Scholar] [CrossRef]
- Zhou, L.; Xu, X.; Antwi, H.A.; Wang, L. Towards an equitable healthcare in China: Evaluating the productive efficiency of community health centers in Jiangsu Province. Int. J. Equity Health 2017, 16, 89. [Google Scholar] [CrossRef] [Green Version]
- Wang, X.; Luo, H.; Qin, X.; Feng, J.; Gao, H.; Feng, Q. Evaluation of performance and impacts of maternal and child health hospitals services using data envelopment analysis in Guangxi Zhuang autonomous region, China: A comparison study among poverty and non-poverty county level hospitals. Int. J. Equity Health 2016, 15, 131. [Google Scholar] [CrossRef] [Green Version]
- Yang, J.; Wu, Z. The trade-offs between efficiency and quality in the hospital production: Some evidence from Shenzhen, China. China Econ. Rev. 2014, 31, 166–184. [Google Scholar] [CrossRef]
- Roh, C.; Moon, M.; Jung, K. Efficiency disparities among community hospitals in Tennessee: Do size, location, ownership, and network matter? J. Health Care Poor Underserved 2013, 24, 1816–1833. [Google Scholar] [CrossRef]
- James, F.; Paul, W. Hospital ownership and technical inefficiency. Manag. Sci. 1996, 42, 110–123. [Google Scholar]
- Chang, H.; Cheng, M.; Das, S. Hospital ownership and operating efficiency: Evidence from Taiwan. Eur. J. Oper. Res. 2004, 159, 513–527. [Google Scholar] [CrossRef]
- Jehu-Appiah, C.; Sekidde, S.; Adjuik, M.; Akazili, J.; Almeida, S.D.; Nyonator, F.; Baltussen, R.; Asbu, E.Z.; Kirigia, J.M. Ownership and technical efficiency of hospitals evidence from Ghana using data envelopment analysis. Cost Eff. Resour. Alloc. 2014, 12, 9. [Google Scholar] [CrossRef] [Green Version]
- Vivian, G. Ownership and technical efficiency of hospitals. Med. Care 1990, 28, 552–561. [Google Scholar]
- Ali, M.; Wang, W.; Chaudhry, N.; Geng, Y.; Ashraf, U. Assessing knowledge, performance, and efficiency for hospital waste management-a comparison of government and private hospitals in Pakistan. Environ. Monit. Assess. 2017, 189, 181. [Google Scholar] [CrossRef]
- Yasar, A.; Roice, D.; Cengiz, H. Ownership and organizational performance: A comparison of technical efficiency across hospital types. Med. Care 1992, 30, 781–794. [Google Scholar]
- Lee, K.; Yang, S.; Choi, M. The association between hospital ownership and technical efficiency in a managed care environment. J. Med. Syst. 2009, 33, 307–315. [Google Scholar] [CrossRef]
- Sun, M.; Jiang, W. Assessment and comparison of hospital operating efficiency under different management systems. J. Peking Univ. Health Sci. 2017, 49, 483–488. (In Chinese) [Google Scholar]
- Jose, L.; Carmen, F.; Antonio, R. Analysis of the technical efficiency of the forms of hospital management based on public-private collaboration of the Madrid Health Service, as compared with traditional management. Int. J. Health Plan M 2018, 34, 414–442. [Google Scholar]
- Angeliki, F.; Vassilis, A.; Dimitris, N. A window-DEA based efficiency evaluation of the public hospital sector in Greece during the 5-year economic crisis. PLoS ONE 2017, 12, e0177946. [Google Scholar]
- Chen, Y.; Wang, J.; Zhu, J.; Sherman, H.D.; Chou, S.Y. How the great recession affects performance: A case of Pennsylvania hospitals using DEA. Ann. Oper. Res. 2017, 278, 77–99. [Google Scholar] [CrossRef]
- Chen, Z.; Carlos, P.; Hou, X. Has the medical reform improved the cost efficiency of Chinese hospitals? Soc. Sci. J. 2016, 53, 510–520. [Google Scholar] [CrossRef] [PubMed]
- Giménez, V.; Prieto, W.; Prior, D.; Tortosa-Ausina, E. Evaluation of efficiency in Colombian hospitals: An analysis for the post-reform period. Socio Econ. Plan. Sci. 2019, 65, 20–35. [Google Scholar] [CrossRef]
- Yang, J.; Hong, Y.; Ma, S. Impact of the new health reform on hospital expenditure in China: A case study from a pilot city. China Econ. Rev. 2016, 39, 1–14. [Google Scholar] [CrossRef]
- Jiang, S.; Min, R.; Fang, P. The impact of healthcare reform on the efficiency of public county hospitals in China. BMC Health Serv. Res. 2017, 17, 838. [Google Scholar] [CrossRef] [PubMed] [Green Version]
- Audibert, M.; Mathonnat, J.; Pelissier, A.; Huang, X.X.; Ma, A. Health insurance reform and efficiency of township hospitals in rural China: An analysis from survey data. China Econ. Rev. 2013, 27, 326–338. [Google Scholar] [CrossRef] [Green Version]
- Zhang, L.; Cheng, G.; Song, S.; Yuan, B.; Zhu, W.; He, L.; Ma, X.; Meng, Q. Efficiency performance of China’s health care delivery system. Int. J. Health Plan. Manag. 2017, 32, 254–263. [Google Scholar] [CrossRef] [PubMed]
- Zhang, X.; Tone, K.; Lu, Y. Impact of the local public hospital reform on the efficiency of medium-sized hospitals in Japan: An improved slacks-based measure data envelopment analysis approach. Health Serv. Res. 2017, 53, 896–918. [Google Scholar] [CrossRef]
- Hacer, O.; Yasar, A.; Ismet, S.; Menderes, T.; Mustafa, N. An examination of competition and efficiency for hospital industry in Turkey. Health Care Manag. Sci. 2015, 18, 407–418. [Google Scholar]
- Lee, K.; Park, J.; Lim, S.; Park, S.C. Has competition increased hospital technical efficiency? Health Care Manag. 2015, 34, 106–112. [Google Scholar] [CrossRef]
- Kjekshus, L.; Hagen, T. Do hospital mergers increase hospital efficiency? Evidence from a National Health Service country. J. Health Serv. Res. Policy 2007, 12, 230–235. [Google Scholar] [CrossRef]
- Jose, M.; Judith, C.; Daniel, D. The impact of new public management on efficiency: An analysis of Madrid’s hospitals. Health Policy 2015, 119, 333–340. [Google Scholar]
- Chang, H.; Chang, W.; Das, S.; Li, S.H. Health care regulation and the operating efficiency of hospitals: Evidence from Taiwan. J. Account. Public Policy 2004, 23, 483–510. [Google Scholar] [CrossRef]
- Oliver, T.; Jonas, S. Changes in hospital efficiency after privatization. Health Care Manag. Sci. 2012, 15, 310–326. [Google Scholar]
- O’Neill, L.; Rauner, M.; Heidenberger, K.; Kraus, M. A cross-national comparison and taxonomy of DEA-based hospital efficiency studies. Socio Econ. Plan. Sci. 2008, 42, 158–189. [Google Scholar] [CrossRef]
- Yauheniya, V.; Jonas, S. International comparisons of the technical efficiency of the hospital sector panel data analysis of OECD countries using parametric and non-parametric approaches. Health Policy 2013, 112, 70–79. [Google Scholar]
- Luigi, S. Estimating technical efficiency in the hospital sector with panel data: A comparison of parametric and non-parametric techniques. Appl. Health Econ. Health Policy 2006, 5, 99–116. [Google Scholar]
- Rowena, J. Alternative methods to examine hospital efficiency Data Envelopment Analysis and Stochastic Frontier Analysis. Health Care Manag. Sci. 2001, 4, 103–115. [Google Scholar]
- Gang, C. Data Envelopment Analysis and MaxDEA Software; Intellectual Property Publishing House: Beijing, China, 2014; pp. 11–15. [Google Scholar]
- Simar, L.; Wilson, P. Sensitivity analysis of efficiency scores: How to bootstrap in nonparametric frontier models. Manag. Sci. 1998, 44, 49–61. [Google Scholar] [CrossRef] [Green Version]
- Mickael, L.; Magnus, T. Bootstrapping the data envelopment analysis Malmquist productivity index. Appl. Econ. 1999, 31, 417–425. [Google Scholar]
- Simar, L.; Wilson, P. A general methodology for bootstrapping in nonparametric frontier models. J. Appl. Stat. 2000, 27, 779–802. [Google Scholar] [CrossRef]
- Kneip, A.; Simar, L.; Wilson, P. Asymptotics and consistent bootstraps for DEA estimators in nonparametric frontier models. Economet. Theor. 2008, 24, 1663–1697. [Google Scholar] [CrossRef] [Green Version]
- Cooper, W.; Seiford, L.; Tone, K. Data Envelopment Analysis: A Comprehensive Text with Models, Applications, References and DEA-Solver Software; Springer: Dordrecht, The Netherlands, 2007; pp. 21–39. [Google Scholar]
- Rezapour, A.; Foroughi, Z.; Sadeghi, N. Identification of the most appropriate variables for measuring the efficiency of Iranian public hospitals: Using Delphi technique. J. Educ. Health Promot. 2019, 8, 140. [Google Scholar]
- Rayens, M.K.; Hahn, E.J. Building consensus using the policy Delphi method. Policy Polit. Nurs. Pract. 2000, 1, 308–315. [Google Scholar] [CrossRef]
- Li, H.; Dong, S. Measuring and benchmarking technical efficiency of public hospitals in Tianjin, China: A bootstrapping-data envelopment analysis approach. Inquiry J. Health Care 2015, 52, 0046958015605487. [Google Scholar] [CrossRef]
- Dong, S.; Zuo, Y.; Tao, H.; Li, M.; Guo, S.; He, L.; Li, H. Study on DEA-based Chinese hospital efficiency and applied indicators. China J. Health Policy 2014, 7, 40–45. (In Chinese) [Google Scholar]
- Seiford, L.; Zhu, J. Modeling undesirable factors in efficiency evaluation. Eur. J. Oper. Res. 2002, 142, 16–20. [Google Scholar] [CrossRef]
- Editorial Department for Wuhan Statistical Yearbook. General Survey: Land area, population density, households and population. In Wuhan Statistical Yearbook 2018; Meng, W., Chen, X., Eds.; China Statistical Press: Beijing, China, 2018; p. 15. [Google Scholar]
- Compilation Commission for Wuhan Health Yearbook. Hospital Work Statistics. In Wuhan Health Yearbook 2018; Peng, H., Ma, L., Xiang, Z., Eds.; Wuhan Press: Wuhan, China, 2018; pp. 409–411. [Google Scholar]
- Mosca, I. Is decentralisation the real solution? A three country study. Health Policy 2006, 77, 113–120. [Google Scholar] [CrossRef]
- Geyndt, W. Does autonomy for public hospitals in developing countries increase performance? Evidence-based case studies. Soc. Sci. Med. 2017, 179, 74–80. [Google Scholar] [CrossRef]
- Homedes, N.; Ugalde, A. Why neoliberal health reforms have failed in Latin America. Health Policy 2005, 71, 83–96. [Google Scholar] [CrossRef]
Figure 1.
The geographical location of Wuhan city in China.

Figure 2.
Flow chart for candidate variables selection of public hospital efficiency evaluation.

Figure 3.
Annual growth rates of variables, PH.

Figure 4.
Annual growth rates of variables, OH.

Figure 5.
Annual growth rates of variables, MH.

Figure 6.
Distribution of the scores with bootstrapping of public hospitals based on Model A: (a) Provincial hospitals; (b) Municipal hospitals; (c) Other hospitals.
Figure 6.
Distribution of the scores with bootstrapping of public hospitals based on Model A: (a) Provincial hospitals; (b) Municipal hospitals; (c) Other hospitals.

Table 1.
Category of public hospitals based on differences in administrative subordination in WH.
| Category | Affiliated with and Governed by | Ownership | Observations |
|---|---|---|---|
| Provincial Hospitals | Provincial government | Government agencies | 7 |
| Municipal Hospitals | Municipal government | 12 | |
| Other Hospitals | State-owned enterprises, Universities, Social groups, or Social organizations | Public institutions | 6 |
Notes: Category of public hospitals is based on Wuhan Health and Family Planning Yearbook (2014–2018).
Table 2.
Delphi results of candidate variables (2nd round).
| Variables | Frequency | Median | Interquartile Range |
|---|---|---|---|
| Inputs | |||
| Number of doctors | 10 | 5 | 0 |
| Number of nurses | 10 | 5 | 0 |
| Number of other medical professionals | 10 | 4.5 | 1 |
| Number of management personnel | 9 | 4 | 1 |
| Number of workers | 8 | 2 | 0.25 |
| Number of beds | 10 | 5 | 0 |
| Value of fixed assets | 9 | 3 | 1 |
| Value for spending on purchases and services | 9 | 3 | 1 |
| Value for spending on human resources | 9 | 4 | 3 |
| Outputs | |||
| Number of outpatient and emergency visits | 10 | 5 | 0 |
| Number of discharged patients | 10 | 5 | 0 |
| Number of surgical operations for inpatient | 10 | 4.5 | 1 |
| Number of laboratory tests | 10 | 3 | 0.75 |
| Average lengths of stay | 8 | 3.5 | 2.25 |
| Rate of patient satisfaction | 10 | 4 | 2 |
| Bed occupancy rate | 10 | 5 | 0 |
| Rate of use for operation table | 10 | 4.5 | 2 |
| Number of bed turnover times | 9 | 4 | 3 |
| Value for medical income | 8 | 3 | 3.25 |
| Undesirable outputs | |||
| Mortality rate of inpatients | 10 | 5 | 0.75 |
| Readmission rate related to the same disease | 9 | 5 | 0 |
| Number of medical disputes | 9 | 5 | 3 |
| Rate of nosocomial infection | 10 | 3.5 | 2.75 |
Table 3.
Model specifications.
| Indicators | Variables * | Definition | Unit | Model A | Model B | Model C |
|---|---|---|---|---|---|---|
| Inputs | NoD | Number of FTE doctors and assistant doctors | Number | X | X | X |
| NoN | Number of FTE registered nurses | X | X | X | ||
| NoOMP | Number of other FTE medical professionals | X | ||||
| NoAAOB | Number of average actual open beds | X | X | X | ||
| Outputs | NoOEV | Number of outpatient and emergency visits | Number | X | X | X |
| NoDP | Number of discharged patients | X | X | X | ||
| NoSOI | Number of surgical operations for inpatient | X | X | |||
| BOR | Bed occupancy rate | Percentage | X | X | X | |
| Undesirable Outputs | MRoI | Mortality rate of inpatients | Percentage | X | X | |
| NoMD | Number of medical disputes | Number | X |
Notes: 1. * Variable statistic was conducted by staff from local Health Administration at the end of the year. 2. Abbreviation: FTE, Full Time Equivalent. 3. X indicates that the variable is included in the model.
Table 4.
Scores for DEA CRS (CCR model) orientated to outputs.
| Panel | Original Scores | 2013 | 2014 | 2015 | 2016 | 2017 |
|---|---|---|---|---|---|---|
| Model A | ||||||
| PH | Mean | 0.8899 | 0.8922 | 0.9244 | 0.8814 | 0.9304 |
| SD | 0.1284 | 0.1185 | 0.0797 | 0.1267 | 0.0747 | |
| MH | Mean | 0.9323 | 0.9242 | 0.9437 | 0.9809 | 0.9514 |
| SD | 0.0925 | 0.0885 | 0.0793 | 0.0463 | 0.0794 | |
| OH | Mean | 0.8726 | 0.8658 | 0.8586 | 0.8131 | 0.8304 |
| SD | 0.1014 | 0.075 | 0.1268 | 0.1450 | 0.0939 | |
| Kruskal–Wallis test | p value | 0.375 | 0.332 | 0.311 | 0.033 ** | 0.050 * |
| Model B | ||||||
| PH | Mean | 0.8686 | 0.8623 | 0.9131 | 0.8689 | 0.9073 |
| SD | 0.1243 | 0.1260 | 0.0893 | 0.1314 | 0.0825 | |
| MH | Mean | 0.9203 | 0.9181 | 0.9362 | 0.9544 | 0.9420 |
| SD | 0.1055 | 0.0957 | 0.0937 | 0.0741 | 0.0826 | |
| OH | Mean | 0.8687 | 0.8630 | 0.8575 | 0.7878 | 0.7536 |
| SD | 0.0995 | 0.0782 | 0.1257 | 0.1412 | 0.0535 | |
| Kruskal–Wallis test | p value | 0.376 | 0.287 | 0.248 | 0.043 ** | 0.003 *** |
| Model C | ||||||
| PH | Mean | 0.8266 | 0.8565 | 0.8989 | 0.8439 | 0.8877 |
| SD | 0.1256 | 0.1336 | 0.0950 | 0.1397 | 0.0947 | |
| MH | Mean | 0.8902 | 0.9035 | 0.9106 | 0.8809 | 0.9063 |
| SD | 0.1372 | 0.1069 | 0.1166 | 0.1306 | 0.1007 | |
| OH | Mean | 0.7771 | 0.8272 | 0.8025 | 0.7064 | 0.7347 |
| SD | 0.1189 | 0.0524 | 0.1054 | 0.1259 | 0.0741 | |
| Kruskal–Wallis test | p value | 0.303 | 0.360 | 0.205 | 0.075 * | 0.012 ** |
Notes: 1. Data source: Own elaboration. 2. Single asterisk (*) denotes significant differences at 90%, double asterisk (**) denotes significant differences at 95% and triple asterisk (***) denotes significant differences at 99%. 3. Abbreviation: CRS, Constant Returns to Scale; CCR, Charnes Cooper Rhodes; SD, Standard Deviation; PH, Provincial Hospitals; MH, Municipal Hospitals; OH, Other Hospitals.
Table 5.
Scores with Bootstrapping for DEA CRS (CCR model) orientated to outputs.
| Panel | Scores with Bootstrapping | 2013 | 2014 | 2015 | 2016 | 2017 |
|---|---|---|---|---|---|---|
| Model A | ||||||
| PH | Mean | 0.8210 | 0.8243 | 0.8642 | 0.8262 | 0.8790 |
| SD | 0.1051 | 0.0982 | 0.0615 | 0.1068 | 0.0592 | |
| MH | Mean | 0.8516 | 0.8534 | 0.8761 | 0.9108 | 0.8797 |
| SD | 0.0643 | 0.0655 | 0.0631 | 0.0389 | 0.0632 | |
| OH | Mean | 0.8223 | 0.8261 | 0.8175 | 0.7678 | 0.7812 |
| SD | 0.0921 | 0.0710 | 0.1180 | 0.1291 | 0.0741 | |
| Kruskal-Wallis test | p value | 0.973 | 0.660 | 0.580 | 0.031 ** | 0.031 ** |
| Model B | ||||||
| PH | Mean | 0.8011 | 0.7938 | 0.8555 | 0.8066 | 0.8441 |
| SD | 0.1021 | 0.1039 | 0.0737 | 0.1087 | 0.0606 | |
| MH | Mean | 0.8322 | 0.8437 | 0.8674 | 0.8767 | 0.8600 |
| SD | 0.0750 | 0.0698 | 0.0760 | 0.0561 | 0.0644 | |
| OH | Mean | 0.8116 | 0.8197 | 0.8163 | 0.7482 | 0.7068 |
| SD | 0.0887 | 0.0729 | 0.1183 | 0.1365 | 0.0492 | |
| Kruskal-Wallis test | p value | 0.963 | 0.482 | 0.677 | 0.137 | 0.005 *** |
| Model C | ||||||
| PH | Mean | 0.7387 | 0.7826 | 0.8386 | 0.7636 | 0.8196 |
| SD | 0.0827 | 0.1066 | 0.0802 | 0.1109 | 0.0714 | |
| MH | Mean | 0.7859 | 0.8261 | 0.8354 | 0.7901 | 0.8217 |
| SD | 0.1026 | 0.0787 | 0.0964 | 0.1065 | 0.0748 | |
| OH | Mean | 0.7160 | 0.7769 | 0.7579 | 0.6551 | 0.6850 |
| SD | 0.0995 | 0.0497 | 0.0984 | 0.1251 | 0.0737 | |
| Kruskal-Wallis test | p value | 0.359 | 0.320 | 0.225 | 0.086 * | 0.014 ** |
Notes: 1. Data source: Own elaboration. 2. Single asterisk (*) denotes significant differences at 90%, double asterisk (**) denotes significant differences at 95% and triple asterisk (***) denotes significant differences at 99%. 3. Abbreviation: CRS, Constant Returns to Scale; CCR, Charnes Cooper Rhodes; SD, Standard Deviation; PH, Provincial Hospitals; MH, Municipal Hospitals; OH, Other Hospitals.
Table 6.
Malmquist index of Model A with bootstrapping and its decomposition (2013–2017).
| DMU | 2013–2014 | 2014–2015 | 2015–2016 | 2016–2017 | ||||||||
|---|---|---|---|---|---|---|---|---|---|---|---|---|
| MI | EC | TC | MI | EC | TC | MI | EC | TC | MI | EC | TC | |
| PH1 | 1.2098 | 0.9965 | 1.2141 | 0.5149 | 1.017 | 0.5063 | 1.0106 | 1.0056 | 1.005 | 0.9666 | 1.0227 | 0.9451 |
| PH2 | 1.175 | 0.999 | 1.1761 | 0.4263 | 1.0271 | 0.4151 | 1.0606 | 1.0079 | 1.0523 | 1.0517 | 1.0232 | 1.0279 |
| PH3 | 1.0296 | 1.0078 | 1.0216 | 0.55 | 1.0077 | 0.5458 | 1.0771 | 1.0048 | 1.0719 | 1.099 | 0.9864 | 1.1142 |
| PH4 | 1.2443 | 1.1465 | 1.0854 | 0.8828 | 1.1587 | 0.7619 | 1.1678 | 1.006 | 1.1609 | 1.1157 | 1.0987 | 1.0155 |
| PH5 | 1.0468 | 1.0039 | 1.0427 | 0.7974 | 0.787 | 1.0131 | 0.853 | 0.8354 | 1.021 | 1.0355 | 1.267 | 0.8173 |
| PH6 | 0.9203 | 0.9356 | 0.9837 | 1.0641 | 1.3503 | 0.7881 | 0.9144 | 0.9342 | 0.9788 | 1.0228 | 0.9948 | 1.0281 |
| PH7 | 0.9689 | 0.9609 | 1.0083 | 1.0799 | 1.1106 | 0.9723 | 0.8391 | 0.8717 | 0.9627 | 1.1199 | 1.1335 | 0.988 |
| PH GM | 1.0787 | 1.0054 | 1.073 | 0.7173 | 1.0534 | 0.6809 | 0.9823 | 0.9497 | 1.0343 | 1.0574 | 1.0714 | 0.987 |
| MH1 | 0.9823 | 1.0094 | 0.9731 | 0.8094 | 1.0295 | 0.7863 | 1.0541 | 1.0091 | 1.0445 | 1.031 | 0.9836 | 1.0481 |
| MH2 | 0.9763 | 1.0209 | 0.9563 | 0.9596 | 1.0107 | 0.9494 | 1.0239 | 0.9862 | 1.0382 | 1.0306 | 1.0139 | 1.0165 |
| MH3 | 1.0756 | 1.1153 | 0.9644 | 0.8792 | 0.9452 | 0.9302 | 1.6326 | 1.311 | 1.2453 | 1.0044 | 0.961 | 1.0452 |
| MH4 | 1.0217 | 0.9569 | 1.0678 | 0.9084 | 1.115 | 0.8147 | 1.2535 | 1.0494 | 1.1944 | 0.8812 | 0.8364 | 1.0536 |
| MH5 | 0.9778 | 0.9244 | 1.0578 | 1.0348 | 1.1076 | 0.9343 | 1.007 | 1.1747 | 0.8573 | 0.8681 | 0.8552 | 1.0151 |
| MH6 | 0.9967 | 0.9964 | 1.0003 | 0.9581 | 1.0224 | 0.9371 | 0.7319 | 1.0238 | 0.7149 | 1.0352 | 1.0178 | 1.0171 |
| MH7 | 0.9655 | 1.0628 | 0.9084 | 0.9865 | 1.0251 | 0.9624 | 1.045 | 1.0425 | 1.0024 | 1.0601 | 0.9878 | 1.0732 |
| MH8 | 1.0169 | 0.9971 | 1.0198 | 0.9913 | 1.0109 | 0.9806 | 1.0038 | 0.9932 | 1.0106 | 0.9378 | 1.0027 | 0.9352 |
| MH9 | 0.91 | 1.0433 | 0.8722 | 0.9814 | 1.0164 | 0.9656 | 0.9821 | 1.001 | 0.9811 | 0.9415 | 0.9842 | 0.9566 |
| MH10 | 0.6845 | 0.9037 | 0.7575 | 1.0452 | 1.0276 | 1.0171 | 0.9718 | 0.9652 | 1.0068 | 0.9265 | 0.9414 | 0.9842 |
| MH11 | 0.8545 | 1.0102 | 0.8459 | 0.9523 | 1.0193 | 0.9342 | 1.0316 | 1.0037 | 1.0278 | 0.9786 | 0.9974 | 0.9811 |
| MH12 | 0.8191 | 1.0035 | 0.8163 | 1.0507 | 1.0046 | 1.0459 | 1.063 | 0.9851 | 1.0791 | 0.9491 | 1.0102 | 0.9395 |
| MH GM | 0.9338 | 1.0021 | 0.9318 | 0.9606 | 1.027 | 0.9354 | 1.0496 | 1.0415 | 1.0078 | 0.9685 | 0.9641 | 1.0045 |
| OH1 | 1.0036 | 0.9819 | 1.0221 | 0.9633 | 1.0506 | 0.9169 | 0.8992 | 1.0324 | 0.8709 | 0.9405 | 0.8831 | 1.065 |
| OH2 | 0.9674 | 0.9364 | 1.0331 | 1.2436 | 1.2583 | 0.9883 | 0.5745 | 0.6282 | 0.9144 | 1.1423 | 1.2667 | 0.9018 |
| OH3 | 0.9186 | 1.0739 | 0.8554 | 0.7989 | 0.7966 | 1.0029 | 1.1747 | 1.1755 | 0.9993 | 1.197 | 1.1923 | 1.004 |
| OH4 | 1.0925 | 1.1331 | 0.9642 | 0.9561 | 0.9884 | 0.9674 | 1.0093 | 1.0288 | 0.9811 | 0.8481 | 0.8509 | 0.9967 |
| OH5 | 0.9504 | 0.9255 | 1.027 | 0.8688 | 0.9153 | 0.9491 | 0.8247 | 0.8512 | 0.9688 | 0.9358 | 1.0269 | 0.9113 |
| OH6 | 0.9858 | 1.009 | 0.977 | 0.8523 | 0.9385 | 0.9082 | 1.436 | 1.012 | 1.4189 | 0.957 | 1.0111 | 0.9465 |
| OH GM | 0.9849 | 1.0073 | 0.9778 | 0.9372 | 0.9815 | 0.9548 | 0.9479 | 0.9367 | 1.0119 | 0.9961 | 1.0277 | 0.9692 |
| GM | 0.9848 | 1.0043 | 0.9806 | 0.8799 | 1.0231 | 0.86 | 1.0054 | 0.9894 | 1.0161 | 0.9993 | 1.0084 | 0.991 |
| p value | 0.083 * | 0.967 | 0.022 ** | 0.250 | 0.394 | 0.133 | 0.744 | 0.285 | 0.375 | 0.074 * | 0.042 ** | 0.512 |
Notes: 1. Data source: Own elaboration. 2. Single asterisk (*) denotes significant differences at 90% and double asterisk (**) denotes significant differences at 95%. 3. Abbreviation: DMU, Decision-Making Unit; MI, Malmquist Index; GM, Geometric Mean; EC, Technical Efficiency Change; TC, Technological Change; PH, Provincial Hospitals; MH, Municipal Hospitals; OH, Other Hospitals.
Publisher’s Note: MDPI stays neutral with regard to jurisdictional claims in published maps and institutional affiliations. |
© 2021 by the authors. Licensee MDPI, Basel, Switzerland. This article is an open access article distributed under the terms and conditions of the Creative Commons Attribution (CC BY) license (https://creativecommons.org/licenses/by/4.0/).
Share and Cite
MDPI and ACS Style
Yin, G.; Chen, C.; Zhuo, L.; He, Q.; Tao, H. Efficiency Comparison of Public Hospitals under Different Administrative Affiliations in China: A Pilot City Case. Healthcare 2021, 9, 437. https://doi.org/10.3390/healthcare9040437
AMA Style
Yin G, Chen C, Zhuo L, He Q, Tao H. Efficiency Comparison of Public Hospitals under Different Administrative Affiliations in China: A Pilot City Case. Healthcare. 2021; 9(4):437. https://doi.org/10.3390/healthcare9040437
Chicago/Turabian StyleYin, Gang, Chaoyi Chen, Lijun Zhuo, Qingjing He, and Hongbing Tao. 2021. "Efficiency Comparison of Public Hospitals under Different Administrative Affiliations in China: A Pilot City Case" Healthcare 9, no. 4: 437. https://doi.org/10.3390/healthcare9040437
Note that from the first issue of 2016, this journal uses article numbers instead of page numbers. See further details here.