Transport and Evolution of Supercritical Fluids During the Formation of the Erdenet Cu–Mo Deposit, Mongolia


Graduated School of Environmental Studies, Tohoku University, Sendai 980-8579, Japan
*
Author to whom correspondence should be addressed.
Geosciences 2020, 10(5), 201; https://doi.org/10.3390/geosciences10050201
Submission received: 4 March 2020
/
Revised: 7 May 2020
/
Accepted: 20 May 2020
/
Published: 25 May 2020
(This article belongs to the Special Issue Exploring and Modeling the Magma-Hydrothermal Regime)
Abstract
:Petrological and fluid inclusion data were used to characterize multiple generations of veins within the Erdenet Cu–Mo deposit, Mongolia, and constrain the evolution of fluids within the magmatic–hydrothermal system. Three types of veins are present (from early to late): quartz–molybdenite, quartz–pyrite, and quartz. The host rock was emplaced at temperatures of 700–750 °C, the first quartz was precipitated from magma-derived supercritical fluids at 650–700 °C, quartz–molybdenite and quartz–pyrite veins were formed at ~600 °C, and the quartz veins were precipitated in response to retrograde silica solubility caused by decreasing temperatures at <500 °C. We infer that over-pressured fluid beneath the cupola caused localized fluid injection, or that accumulated stress caused ruptures and earthquakes related to sector collapse; these events disrupted impermeable layers and allowed fluids to percolate through weakened zones.
1. Introduction
Studies of intrusive magmatism can provide insights into the fluid activity beneath volcanoes. Fluids derived from melts are important distributors of mass and energy in the upper crust. Such fluids form a link between magmatic and hydrothermal systems and provide valuable evidence of transport processes within the crust [1,2]. Slip events, or other external events that reduce principal stresses, induce transient pressure phenomena [3] (e.g., earthquakes, sector collapse) that cause the instantaneous precipitation of ore minerals. Over-pressured fluids can release energy to an overlying hydrostatic regime and generate a series of earthquakes within a relatively short period of time, known as swarm phenomena [4].
Studies of natural [5] and experimental [6,7] systems, including geophysical observations of hypocenter migration [8,9], confirm that transient pressure shifts are common occurrences in volcanic regions. This fluid behavior is also relevant to mineral and energy exploration because transient events such as ruptures can cause ore precipitation [10], and energy can be transported from the magma by high-enthalpy supercritical fluids to be utilized as enhanced geothermal systems [11,12,13].
However, there is limited access to active magmatic–hydrothermal systems, so we used a porphyry copper system as a natural analogue to constrain the evolution of magmatic–hydrothermal fluids. The Erdenet Cu–Mo porphyry copper deposit, Mongolia, become our case study of magmatic–hydrothermal processes within a supercritical geothermal system. Our interpretations of petrological and fluid inclusion data provide insights into the formation of the different generations of veins and their relationship to fluid activity within the Erdenet system.
2. Geological Setting
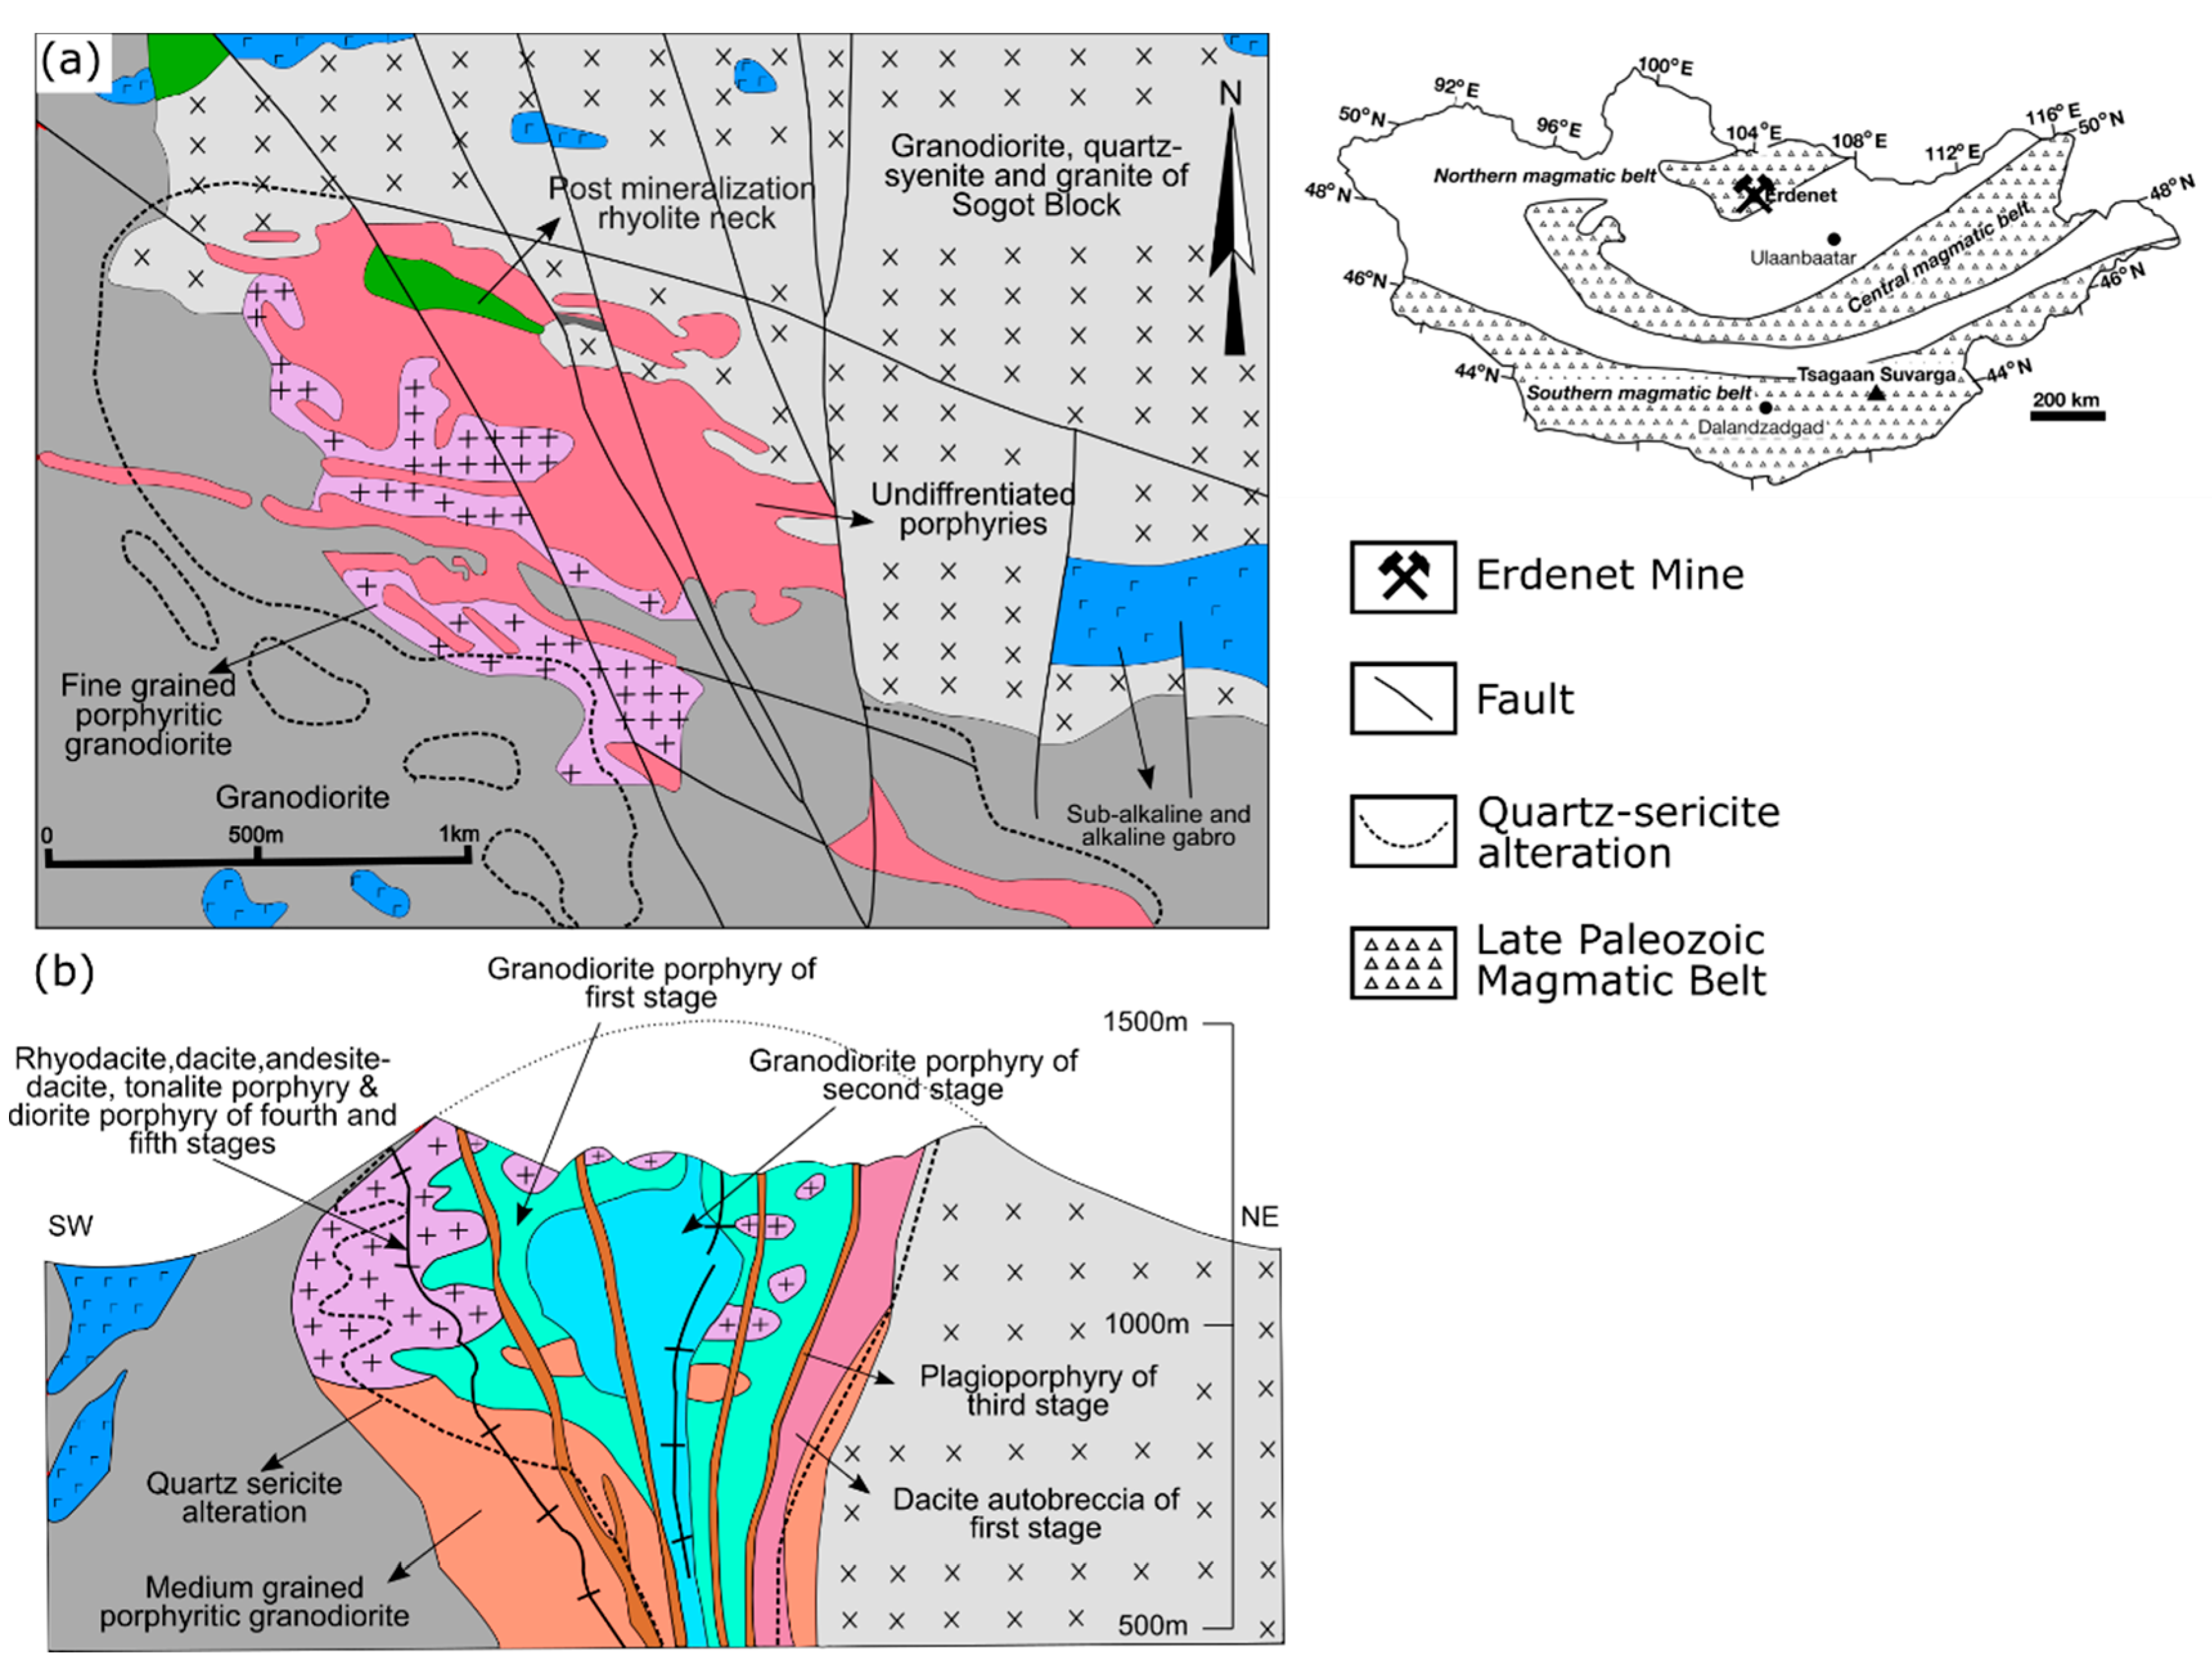
The Erdenet Cu–Mo deposit is located in northern Mongolia within the Permian–Triassic Selenge–Orkhon Trough, a volcanic–plutonic belt formed by the collision of the Siberian Craton in the north with the Central Mongolian Block in the south [14]. The volcanic activity was associated with voluminous intrusive magmatism, including the production of the Selenge Complex (SC) and the Erdenet porphyry complex.
The Erdenet porphyry complex consists of the Erdenet intrusive suites, referred to here as the porphyry association (PA), which is contained within the SC (Figure 1a). The SC consists of three phases—gabbroids, granitoids, and subalkaline granites and syenites—that were emplaced at 253–221 Ma [15]. The PA consists mainly of diorite and granodiorite porphyry and comprises five ore-related stages (Figure 1b). The first stage is syn-mineralization activity, followed by explosive events and brecciation. Field observations have documented two large explosion pipes of up to 250 m in diameter that are connected to the surface. The second stage porphyries are represented by granodiorite and granite porphyries. The granite porphyries are pink-grey and the granodiorite porphyries of the second stage are grey massive rocks with around 40% phenocrysts of plagioclase, hornblende, chloritized biotite, quartz, and very rare K feldspar, set in a fine-grained micropoikilitic and micrographic groundmass of K feldspar, plagioclase, quartz, and ore minerals. These porphyries crosscut both granodiorite porphyries and dacites of the first stage and quartz-sericite alteration. The third stage porphyries are represented by biotite plagioclase, plagiogranite, and granodiorite porphyries, which cut both first and second stages porphyries. The fourth stage consists of leucocratic porphyries and rhyodacite, truncating the last three stage porphyries as very rare dykes as well as the fifth stage. The fifth stage is described as diorite porphyries, andesite (amphibole-plagioclase), and granodiorite porphyry, which is associated with propylitic alteration [15].
K-Ar dating of the PA has yielded ages of 259–243 Ma [16], U-Pb zircon yielded ages of 245.9 ± 3.3–235.6 ± 4.4 Ma [17], and the latest obtained 40Ar/39Ar dates of 239.7 ± 1.6 and 240 ± 2 Ma for the emplacement of the intrusive sequences [18]. The ore formation at the Erdenet deposit occurred at ~240 ± 0.8–235.9 ± 1.9 Ma, based on molybdenum Re–Os [19] and sericite 40Ar/39Ar dating [16]. These ages indicate that mineralization is related to the intrusion of PA stocks and dikes, and that intrusions modified the wall rocks prior to mineralization. Three stages of alteration and mineralization are recognized at the Erdenet deposit. These stages, from the deep central parts of the deposit towards the shallower and outer parts, are (1) quartz–sericite, (2) chlorite–sericite alteration at the periphery of the ore-body, and (3) silica-rich and propylitic alteration, which is characterized by chloritized biotite [20,21].
3. Sampling and Analytical Methods
A total of 57 samples of granodiorite and associated porphyries were taken from a hole drilled by the Erdenet Mining Corporation and from the Erdenet open pit. Twenty-five representative samples were selected for study on the basis of hand specimen observations. Polished thin sections of these samples were examined in detail using an optical microscope. The veins in two samples from 567 m and 646 m depths show crosscutting relationships (Figure 2b); these veins represent different hydrothermal events [5]. Double-polished thick sections, ~100 µm thick, were prepared for fluid inclusion microthermometry. The homogenization temperatures (Th) were measured using a Linkam THMS600 heating stage, but the inclusions were too small (1–3 µm) to determine salinity from the ice-melting temperature (Tm-ice). The microthermometry data were combined with the Raman spectroscopy data to constrain the fluid composition of each vein type.
The textures of the quartz veins were characterized using a Hitachi-S3400N scanning electron microscope (SEM) equipped with an Oxford cathodoluminescence (CL) detector and photomultiplier at the Graduate School of Science, Tohoku University, Japan. Standard polished thin sections were analyzed at an accelerating voltage of 25 kV and a beam current of 90 µA. The textural characteristics of the different generations of veins are distinctive in SEM–CL, and qualitative differences in luminescence were used to classify the veins as CL-gray, CL-dark, and CL-bright [22].
The chemical compositions of minerals in the granodiorite and associated veins were analyzed by electron probe microanalysis (EPMA) on a JEOL JXA 8200 instrument at the Graduate School of Environmental Studies, Tohoku University, Japan. For most of the elements, the accelerating voltage was set to 15 kV, the beam current was set to 12 nA, and the counting time for each element was 20 s. The data were corrected using a ZAF correction method. Trace elements, including the Ti in quartz veins, were measured with an accelerating voltage of 20 kV, a beam current of 120 nA, and a beam diameter of 5 µm, to minimize specimen damage. The count times were 300 s on the relevant peak and 150 s for the high and low background measurements. These conditions corresponded to detection limits of 7 ppm and 22 ppm for Ti and Al, respectively. Element mapping for Ti, Al, and Fe was performed by EPMA on selected areas where SEM–CL data were acquired, using an accelerating voltage of 20 kV, a beam current of 120 nA, a focused beam, and dwell times of 1 s per pixel [23].
4. Petrography and Microstructure
4.1. Host Rocks
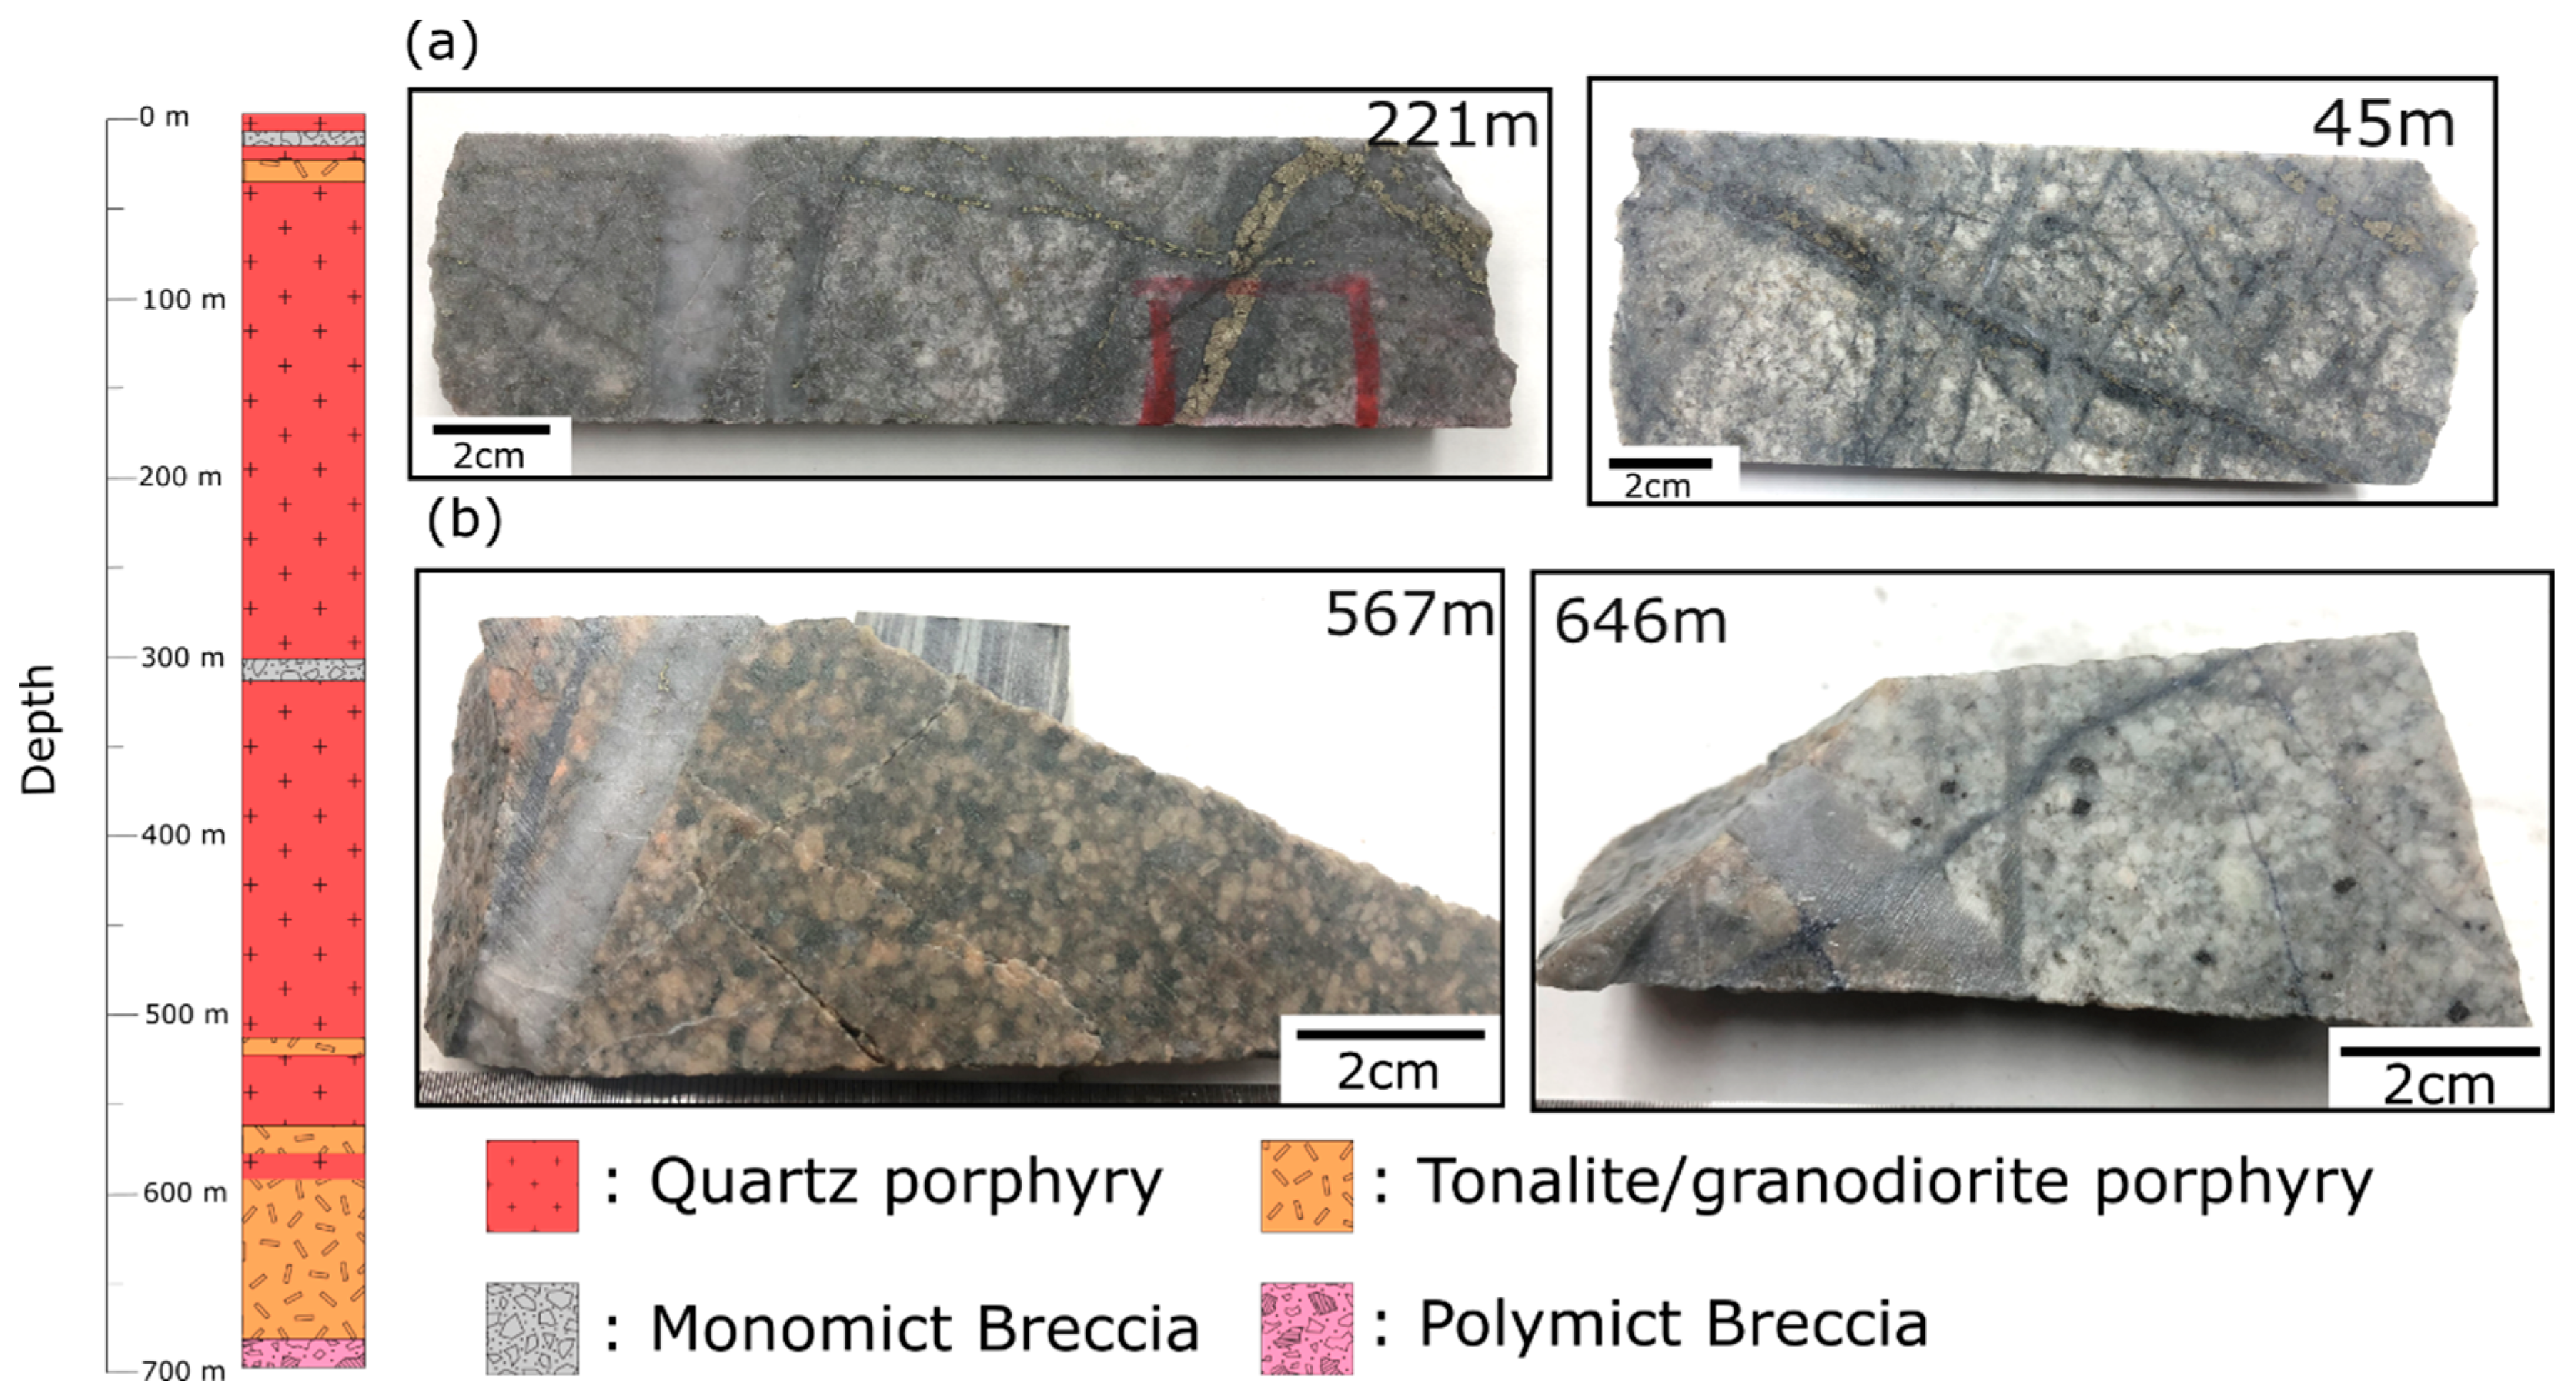
The drill core was brecciated locally and cut by a distinctive stockwork of veinlets that is typical of porphyry deposits (Figure 2). The rocks were divided into a gray-colored quartz porphyry (Figure 2a) and green-gray tonalite/granodiorite porphyries (Figure 2b); these rocks are referred to as the host rocks. The quartz porphyry occurred from the surface to the middle of the core (0–500 m), and the tonalite/granodiorite porphyries occurred at a >500 m depth.
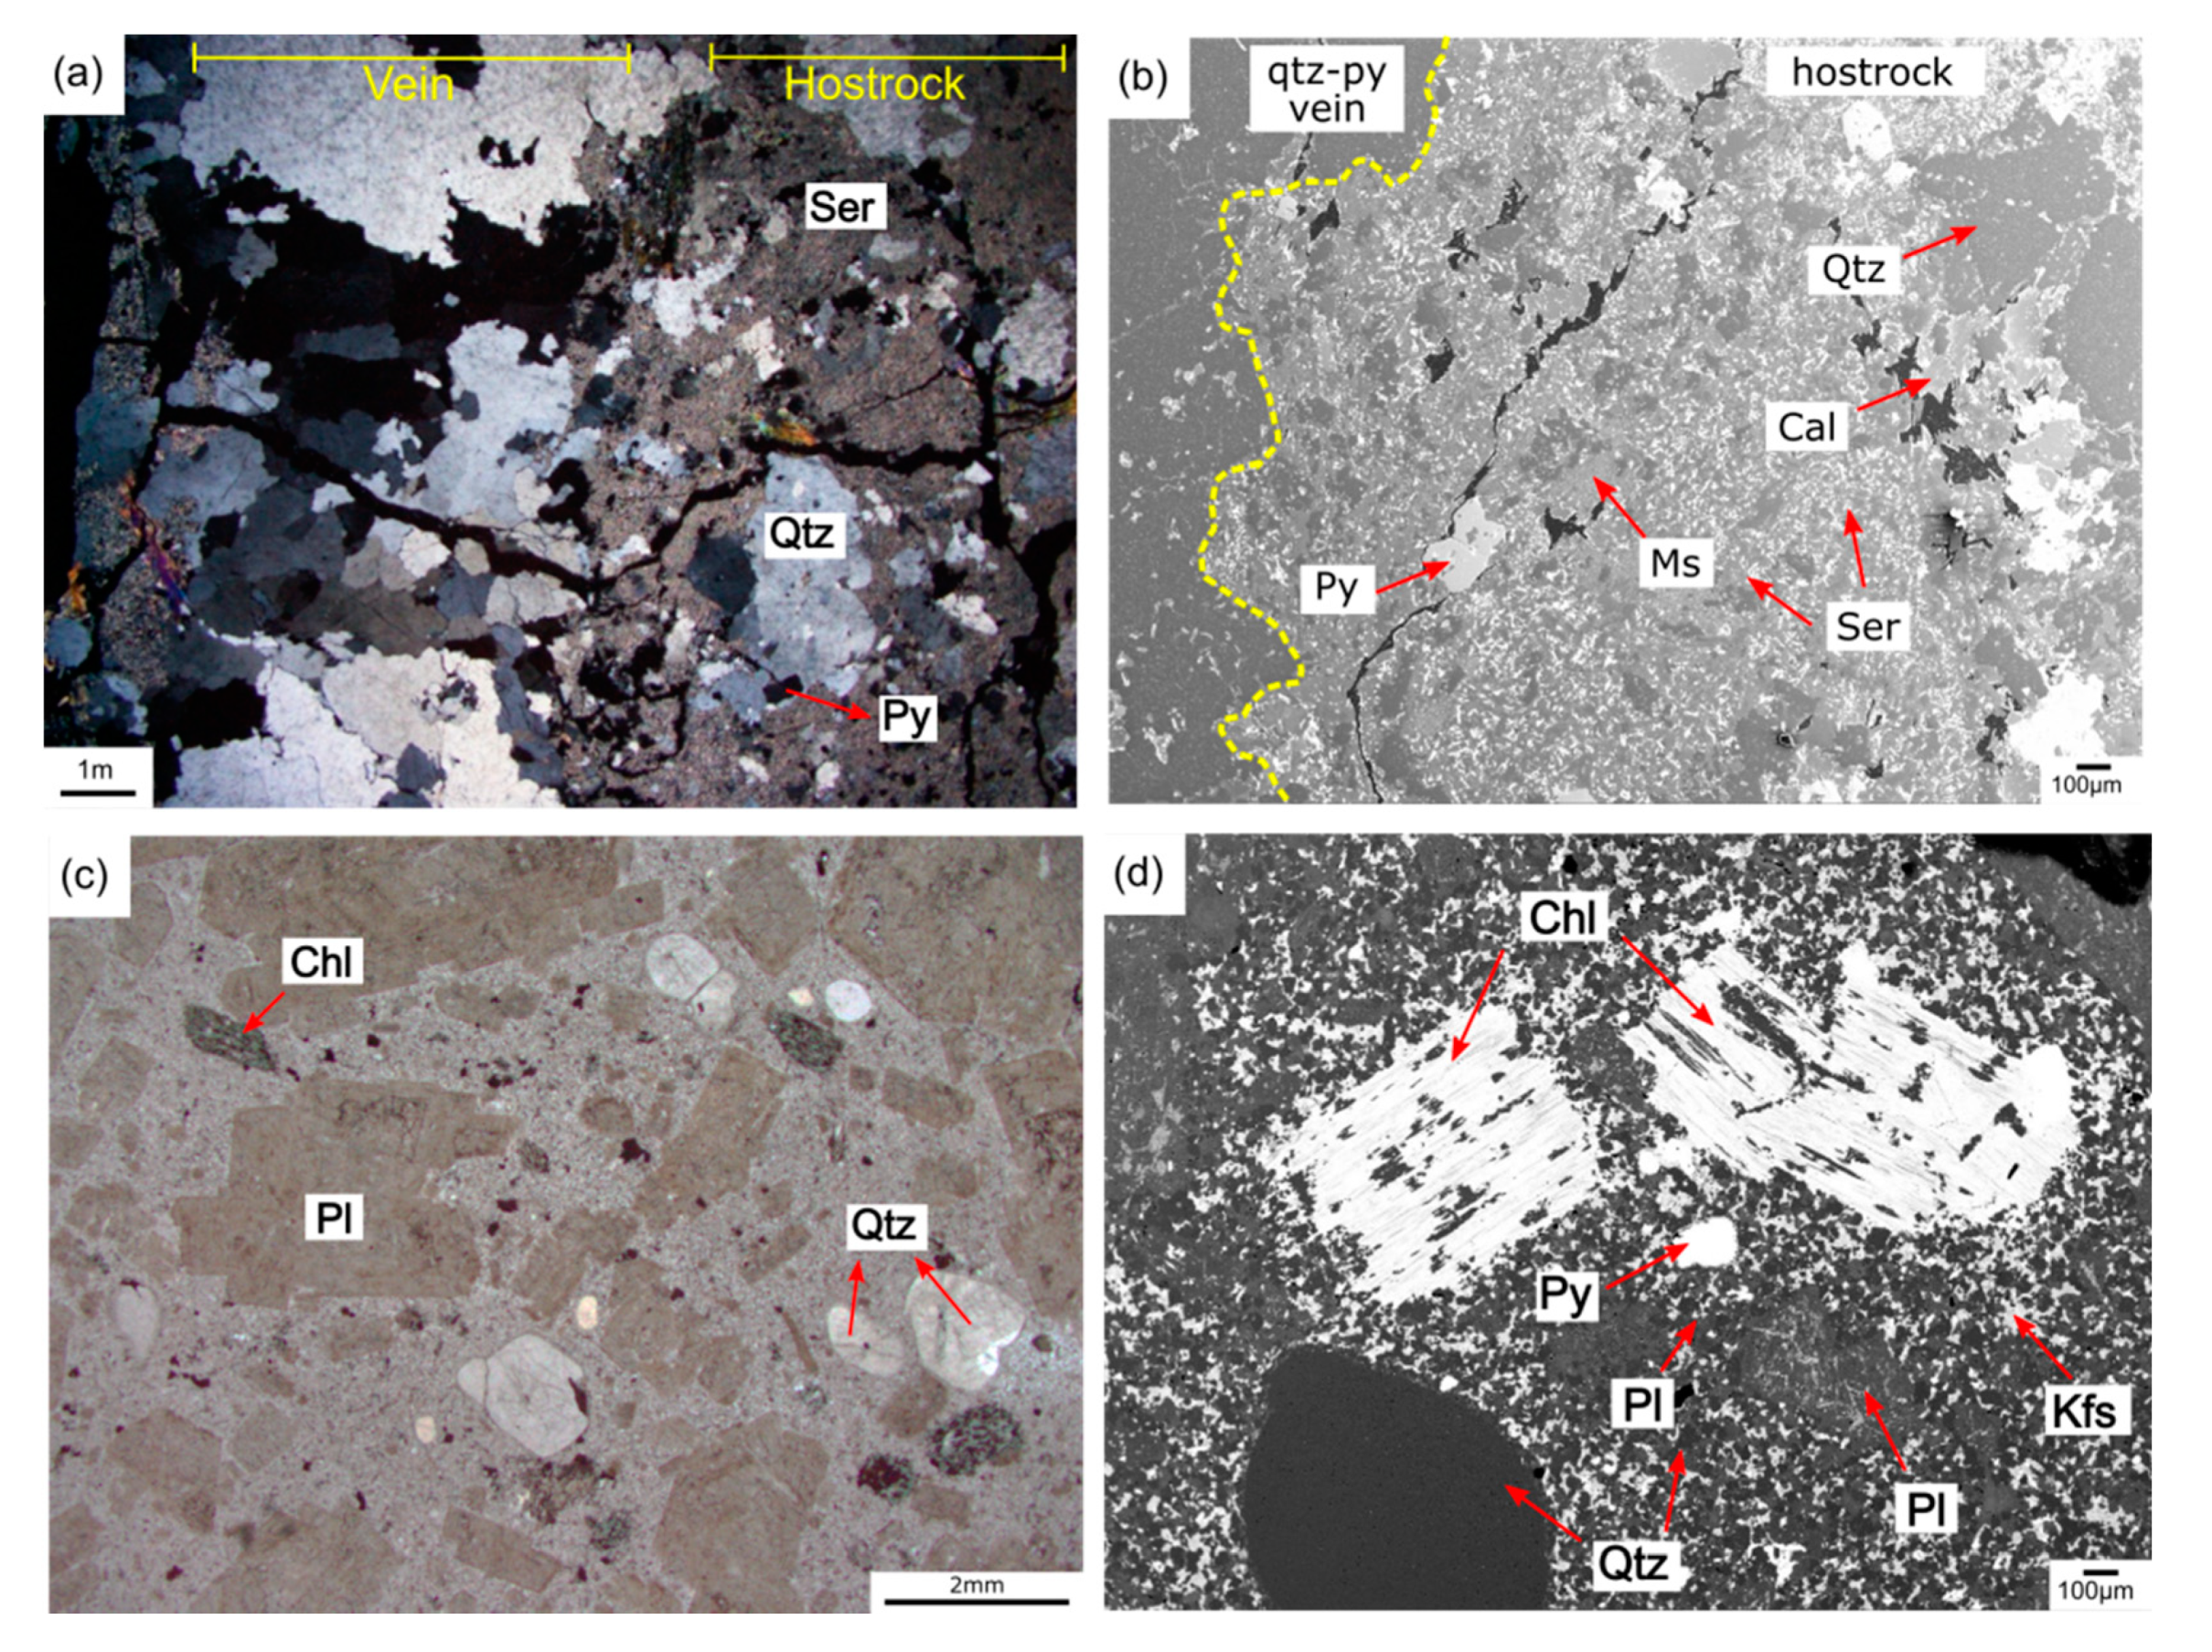
The quartz porphyry was pervasively sericitized with a sericite content of 40–60%; the quartz occurred as phenocrysts within the sericite groundmass (Figure 3a). Ore minerals, such as pyrite, chalcopyrite, and molybdenite, were disseminated within the host rock (Figure 3b), and ore minerals and other sulfides also occurred within the veins. The sericite-bearing samples contained pseudomorphs of plagioclase and chlorite, but the original texture of these minerals was commonly overprinted by white mica and sericite in the more intensely altered samples. The accessory minerals included rutile, anhydrite, and apatite.
The tonalite/granodiorite porphyry consisted mainly of plagioclase (~40 vol%), quartz (~30 vol%), minor chlorite, and rare biotite. These minerals occurred as phenocrysts within a groundmass of microcrystalline quartz, K-feldspar, and plagioclase (Figure 3c). The groundmass formed ~20% of the rock by volume and filled between the phenocrysts. The plagioclase showed cryptic zoning, had a dusty/cloudy appearance, and was partially altered to white mica (Figure 3d). The quartz grains were embayed, some were rounded, and CL-dark fractures were common. Biotite is considered indicative of the PA [15,18]. It occurred as relatively large crystals of up to ~2 mm diameter; included rutile, calcite, and quartz; and was partly altered to chlorite. Chlorite occurs as an alteration after mafic minerals (e.g., amphibole); chlorite rims were commonly altered to white mica/sericite and contained inclusions of apatite, quartz, calcite, and rare anhydrite.
4.2. Veins
4.2.1. Vein Types
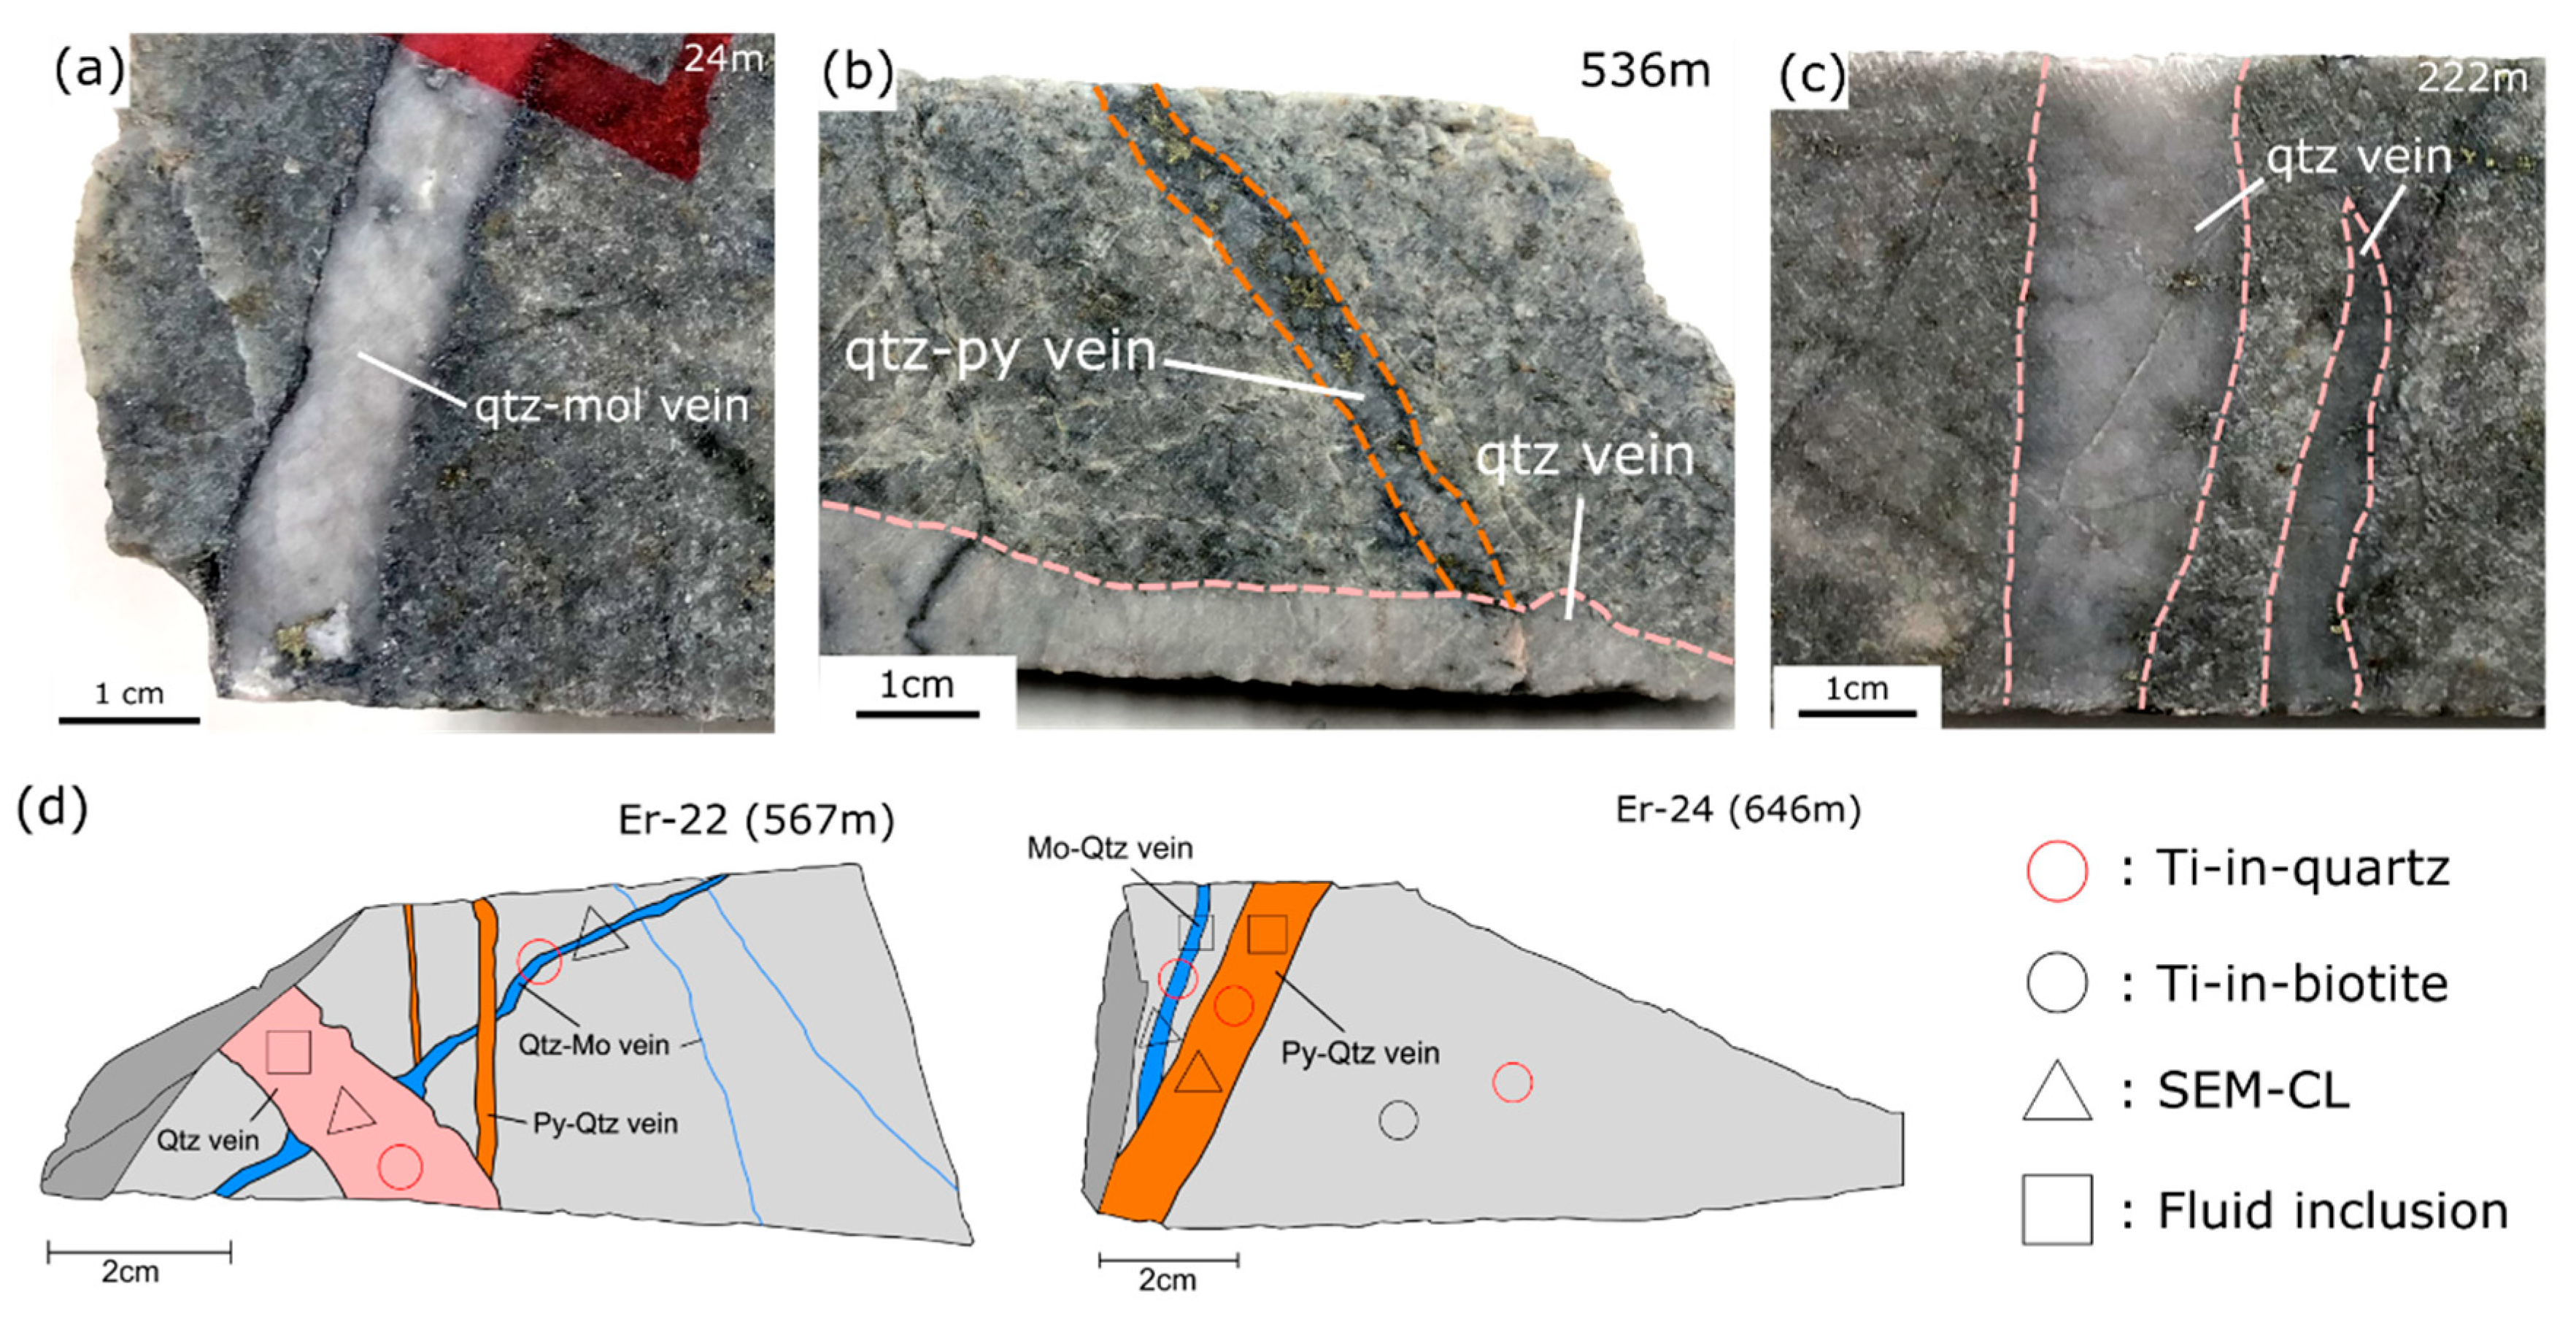
Veins occur throughout the Erdenet deposit as a stockwork within the quartz and tonalite/granodiorite porphyries. The veins are millimeters to centimeters wide and contain sulfide minerals such as molybdenite, pyrite, chalcopyrite, and bornite, with minor calcite and rutile. At least three types of vein were recognized on the basis of crosscutting relationships in the samples Er-22 (567 m) and Er-24 (646 m). The different vein generations recorded progressive stages of fluid movement and hydrothermal activity. From early to late, they were as follows (Figure 4d):
- Quartz–Molybdenite ± Calcite veins.
- Quartz–molybdenite ± calcite (qtz–mol) veins occurred within the tonalite/granodiorite and quartz porphyries. The veins were 10–15 mm wide in the shallow parts of the core and <5 mm wide in the deeper parts of the core. Molybdenite with a rectangular and platy shape occurred in the vein margins and vein walls (Figure 4a).
- Quartz–Pyrite ± Calcite veins.
- Pyrite was concentrated within the center of the quartz–pyrite ± calcite (qtz–py) veins and also occurred as euhedral grains that were disseminated in the host rock of quartz and tonalite/granodiorite porphyry. In the deeper part of the core, pyrite occurred in the walls of the veins and was disseminated throughout the vein. The pyrite-bearing veins were 20–25 mm wide. A veinlet of sericitized material was observed parallel to the vein wall. Most directions of elongation of the quartz grains were oriented perpendicular to the vein wall, but some quartz was oriented parallel to the vein wall (Figure 4b).
- Quartz ± Calcite.
- Quartz (qtz) veins cut the earlier vein types and represented the final stage of vein formation within the Erdenet deposit. This vein type was rare in all samples. The veins were 15–20 mm wide and occurred within the tonalite/granodiorite and quartz porphyry. These veins had a distinctive bright appearance, which was attributed to the quartz (Figure 4c)
4.2.2. Vein Textures
SEM–CL images reveal multiple generations of complex qtz veins that show textures that are not visible under an optical microscope and which record diverse processes (e.g., the dissolution of quartz grain cores, recrystallization, and fracturing). All three stages of veins are characterized by primary oscillatory zoning formed during initial quartz precipitation and the physicochemical changes of hydrothermal fluid cause precipitation of a secondary texture—for instance, recrystallization, fracturing, and the dissolution of quartz. These features crosscut or overgrow on the primary textures and can be distinguished from the primary quartz in the SEM–CL images [22].
The qtz–mol veins are the earliest generation of veins. The constituent grains have oscillatory zoning and are CL-gray in the SEM–CL images. The crystals grew from the vein wall towards the center of the vein, and calcite is common in the vein centers (Figure 5a,b). These features indicate that the quartz growth was syntaxial and that fractures provided voids for quartz precipitation from a silica-saturated fluid within the fluid conduit [25]. The zoned quartz grains are cut by interconnected CL-dark fractures knows as cobweb texture [22]; this texture records dissolution after the formation of the qtz–mol veins.
The qtz–py veins are associated with a dense fracture network and developed during the second stage of vein formation. Small euhedral crystals with vaguely defined oscillatory zoning occur on the walls of the veins. CL-dark quartz records a fracturing event after the formation of the initial qtz–py veins. Sulfides and calcite within the fractures and on the grain boundaries are associated with the CL-dark bands (Figure 5c,d). These veins are inferred to be syntaxial, based on the oscillatory zoning, crystallographic orientation, and presence of calcite.
Quartz veins, which represent the last stages of fluid activity on this system, are characterized by less CL-dark compared to the prior quartz veins. These veins contain a granular CL-bright quartz that contains a cobweb-like pattern of fractures filled with CL-dark quartz (Figure 5e,f). Primary textures, such as oscillatory zoning, are absent within this type of vein.
5. Estimation of Formation Temperatures
5.1. Application of Ti-in-Quartz and Ti-in-Biotite Geothermometers to the Host Rock
The crystallization temperature of the host rock was estimated using the Ti-in-quartz [26,27] and Ti-in-biotite [28] geothermometers (Figure 6). The biotite-bearing tonalite/granodiorite is part of the PA, which is associated with mineralization [15].
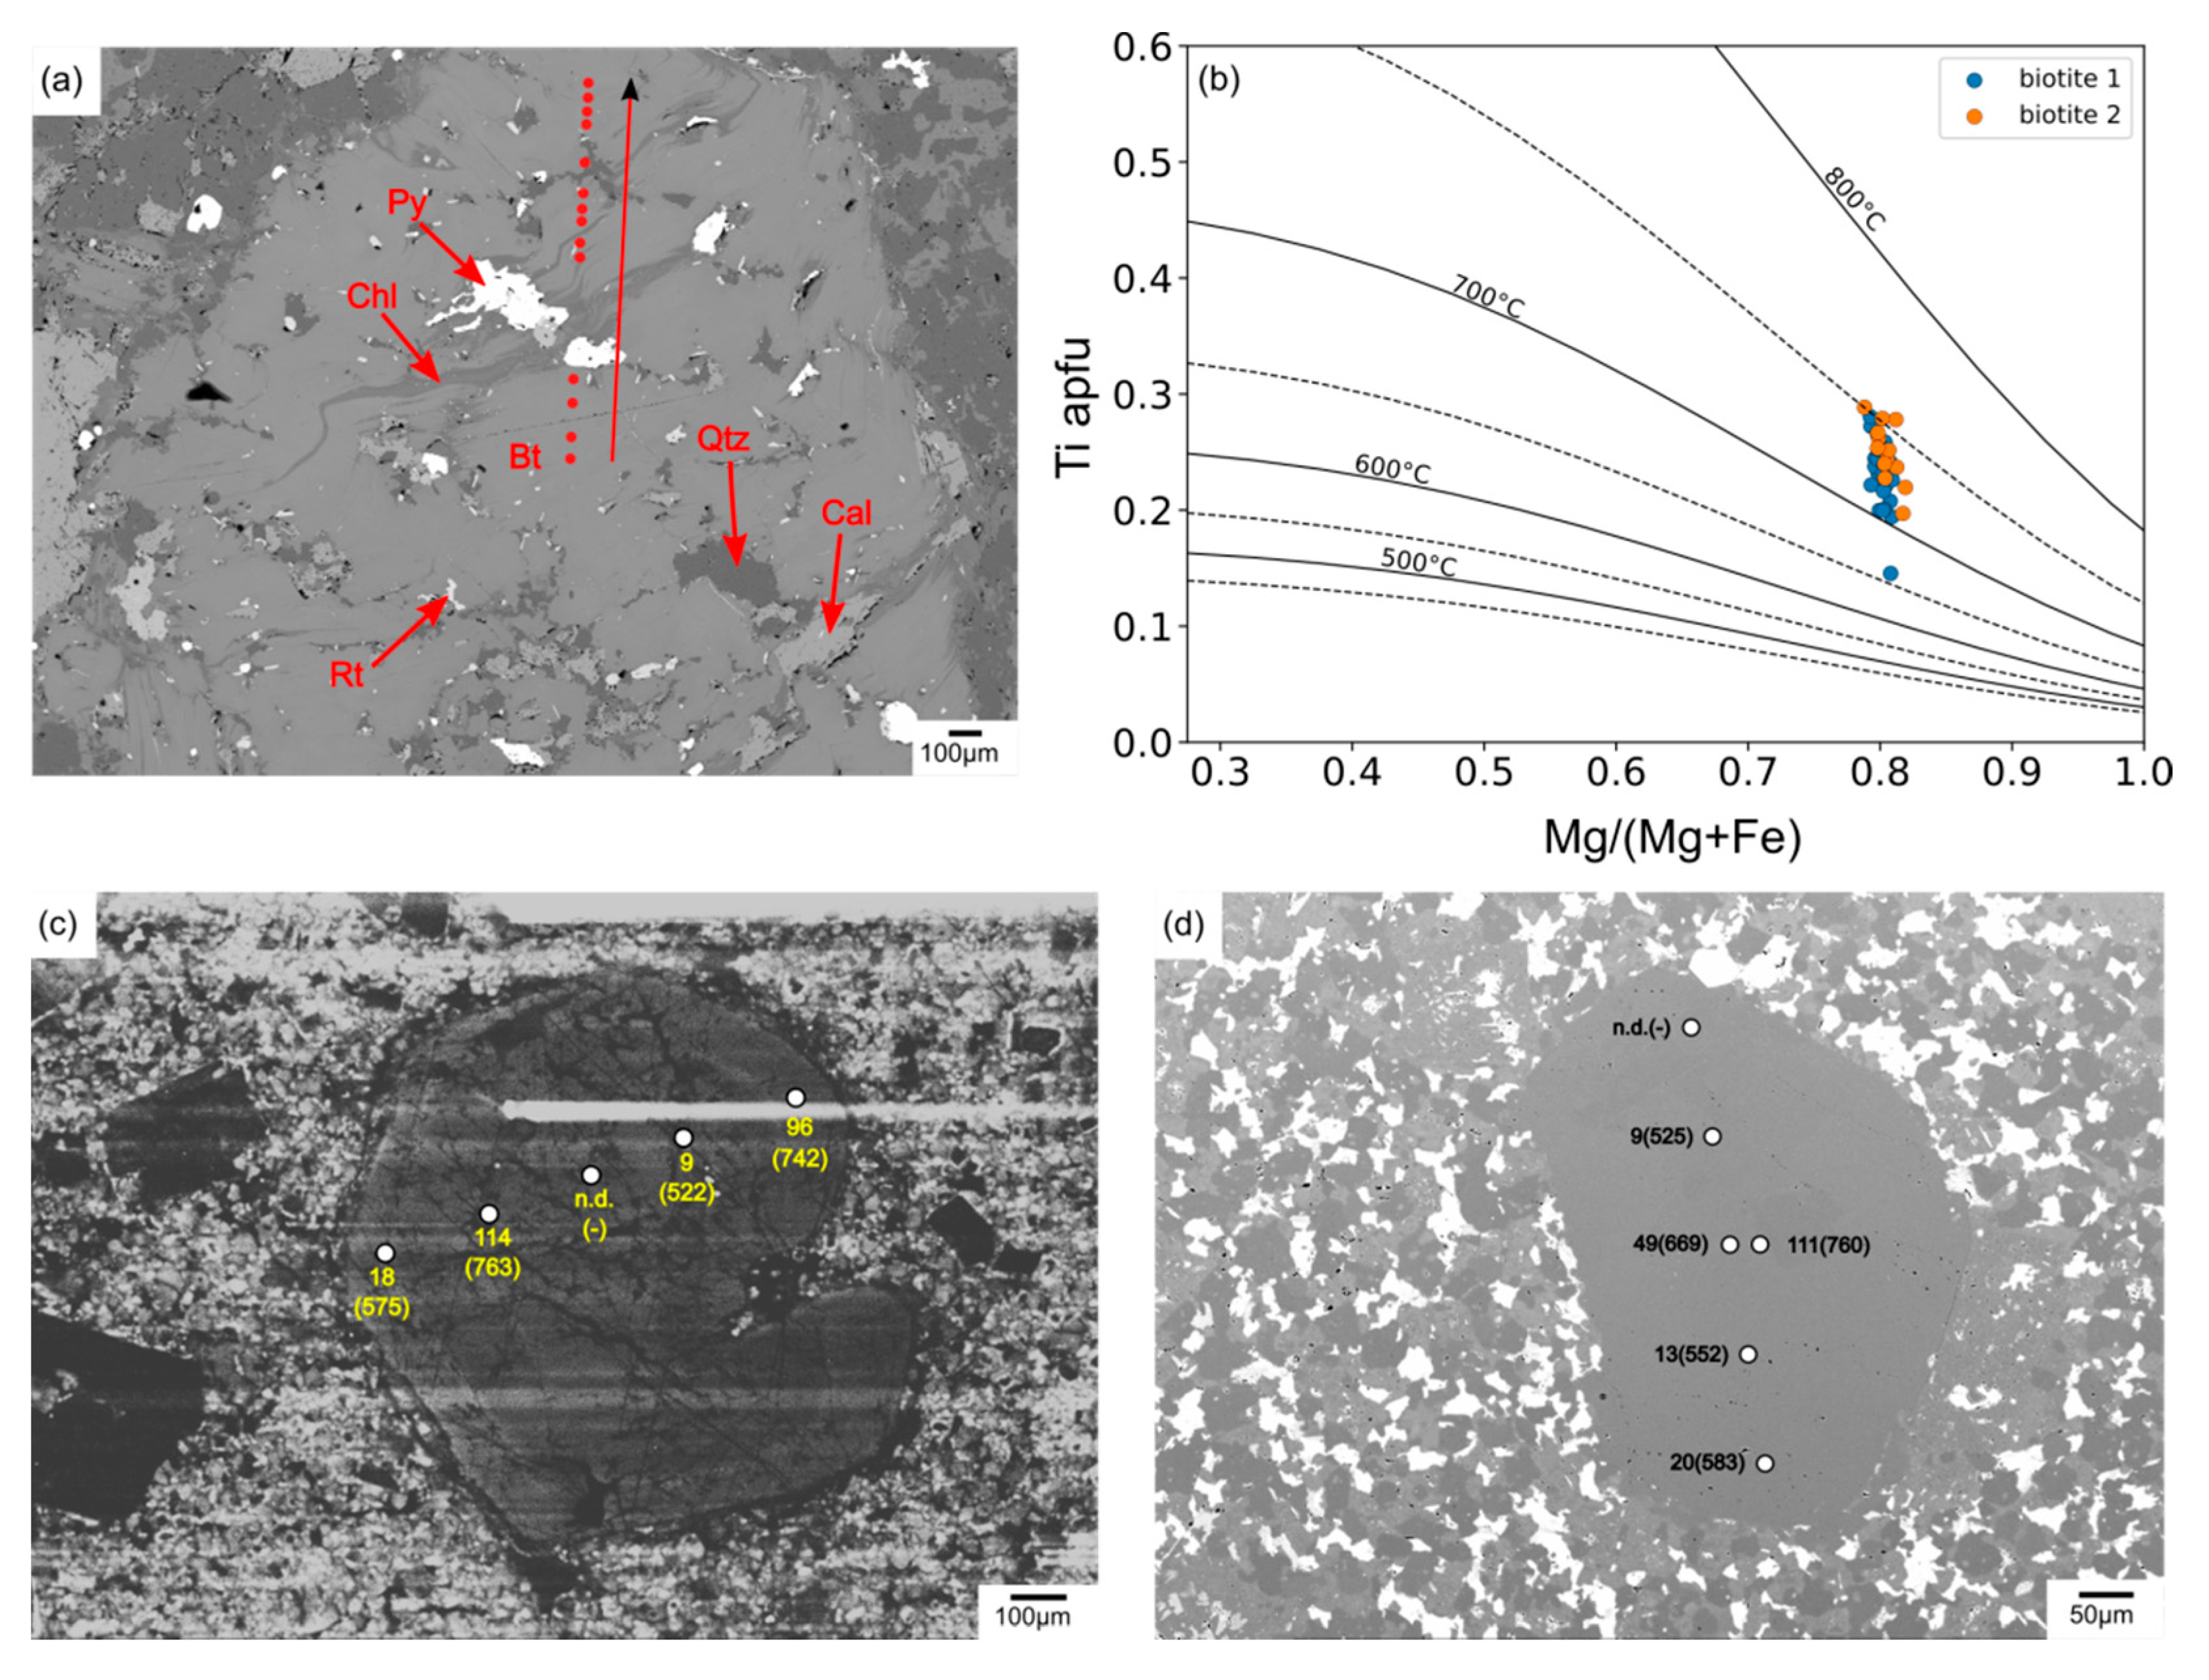
Application of the Ti-in-quartz geothermometer to two quartz phenocrysts from the granodiorite porphyry yielded temperatures of 520–760 °C (Table 1). The Ti content was measured for a profile across the quartz grains (rim to rim) to determine if there was a temperature gradient (e.g., high and low temperatures recorded by the core and rim, respectively). Quartz grain (QtzHr1) (Figure 6c) does not show a systematic pattern, and the measured temperatures range from 550 to 750 °C. The core and rim of grain QtzHr2 (Figure 6d) record higher and lower temperatures, respectively, and a wide range of temperatures. The temperature recorded by two biotite grains was estimated using the Ti-in-biotite thermometer, and this provided more consistent results than those of the Ti-in-quartz thermometer (Figure 6b). Measurements were taken at points located on a profile from the core to the rim of the biotite grains (Figure 6a). The calculated temperatures ranged from 700 to 750 °C, based upon the biotite compositions provided in Table 2. The maximum temperature of quartz phenocryst calculated using the Ti-in-quartz geothermometer is similar to the temperatures calculated using the Ti-in-biotite thermometer which represent initial quartz formation or nucleation. Therefore, we infer that the host rock was emplaced at a temperature of 700–750 °C.
5.2. Application of the Ti-in-Quartz Thermometer to Veins
Quartz is ubiquitous within the veins, so the Ti-in-quartz geothermometer from [26] was applied to constrain the vein formation temperatures and the pressure-dependent calibration of [27] was applied as a comparison. The pressure of ~1.6 kbar, at which the Diorite porphyry was (fifth stage) emplaced, was chosen to estimate the temperature [16]. The Ti activity (α) was assumed to be unity (α = 1), which provides a minimum estimate of the temperature of vein formation (from hereafter referred as quartz formation temperature); if α were assumed to be 0.5, then the calculated temperatures would be ~65 °C higher. The detection limit for Titanium (Ti) by EPMA is 7 ppm, a concentration that corresponds to 500 °C, and the uncertainties are exponentially larger for Ti concentrations of <7 ppm [29]. Ti measurement points were selected within areas of different CL intensities to investigate the different physicochemical and fluid dynamic properties of fluids that percolated through fractures in the rocks.
5.2.1. Quartz ± Molybdenite Veins
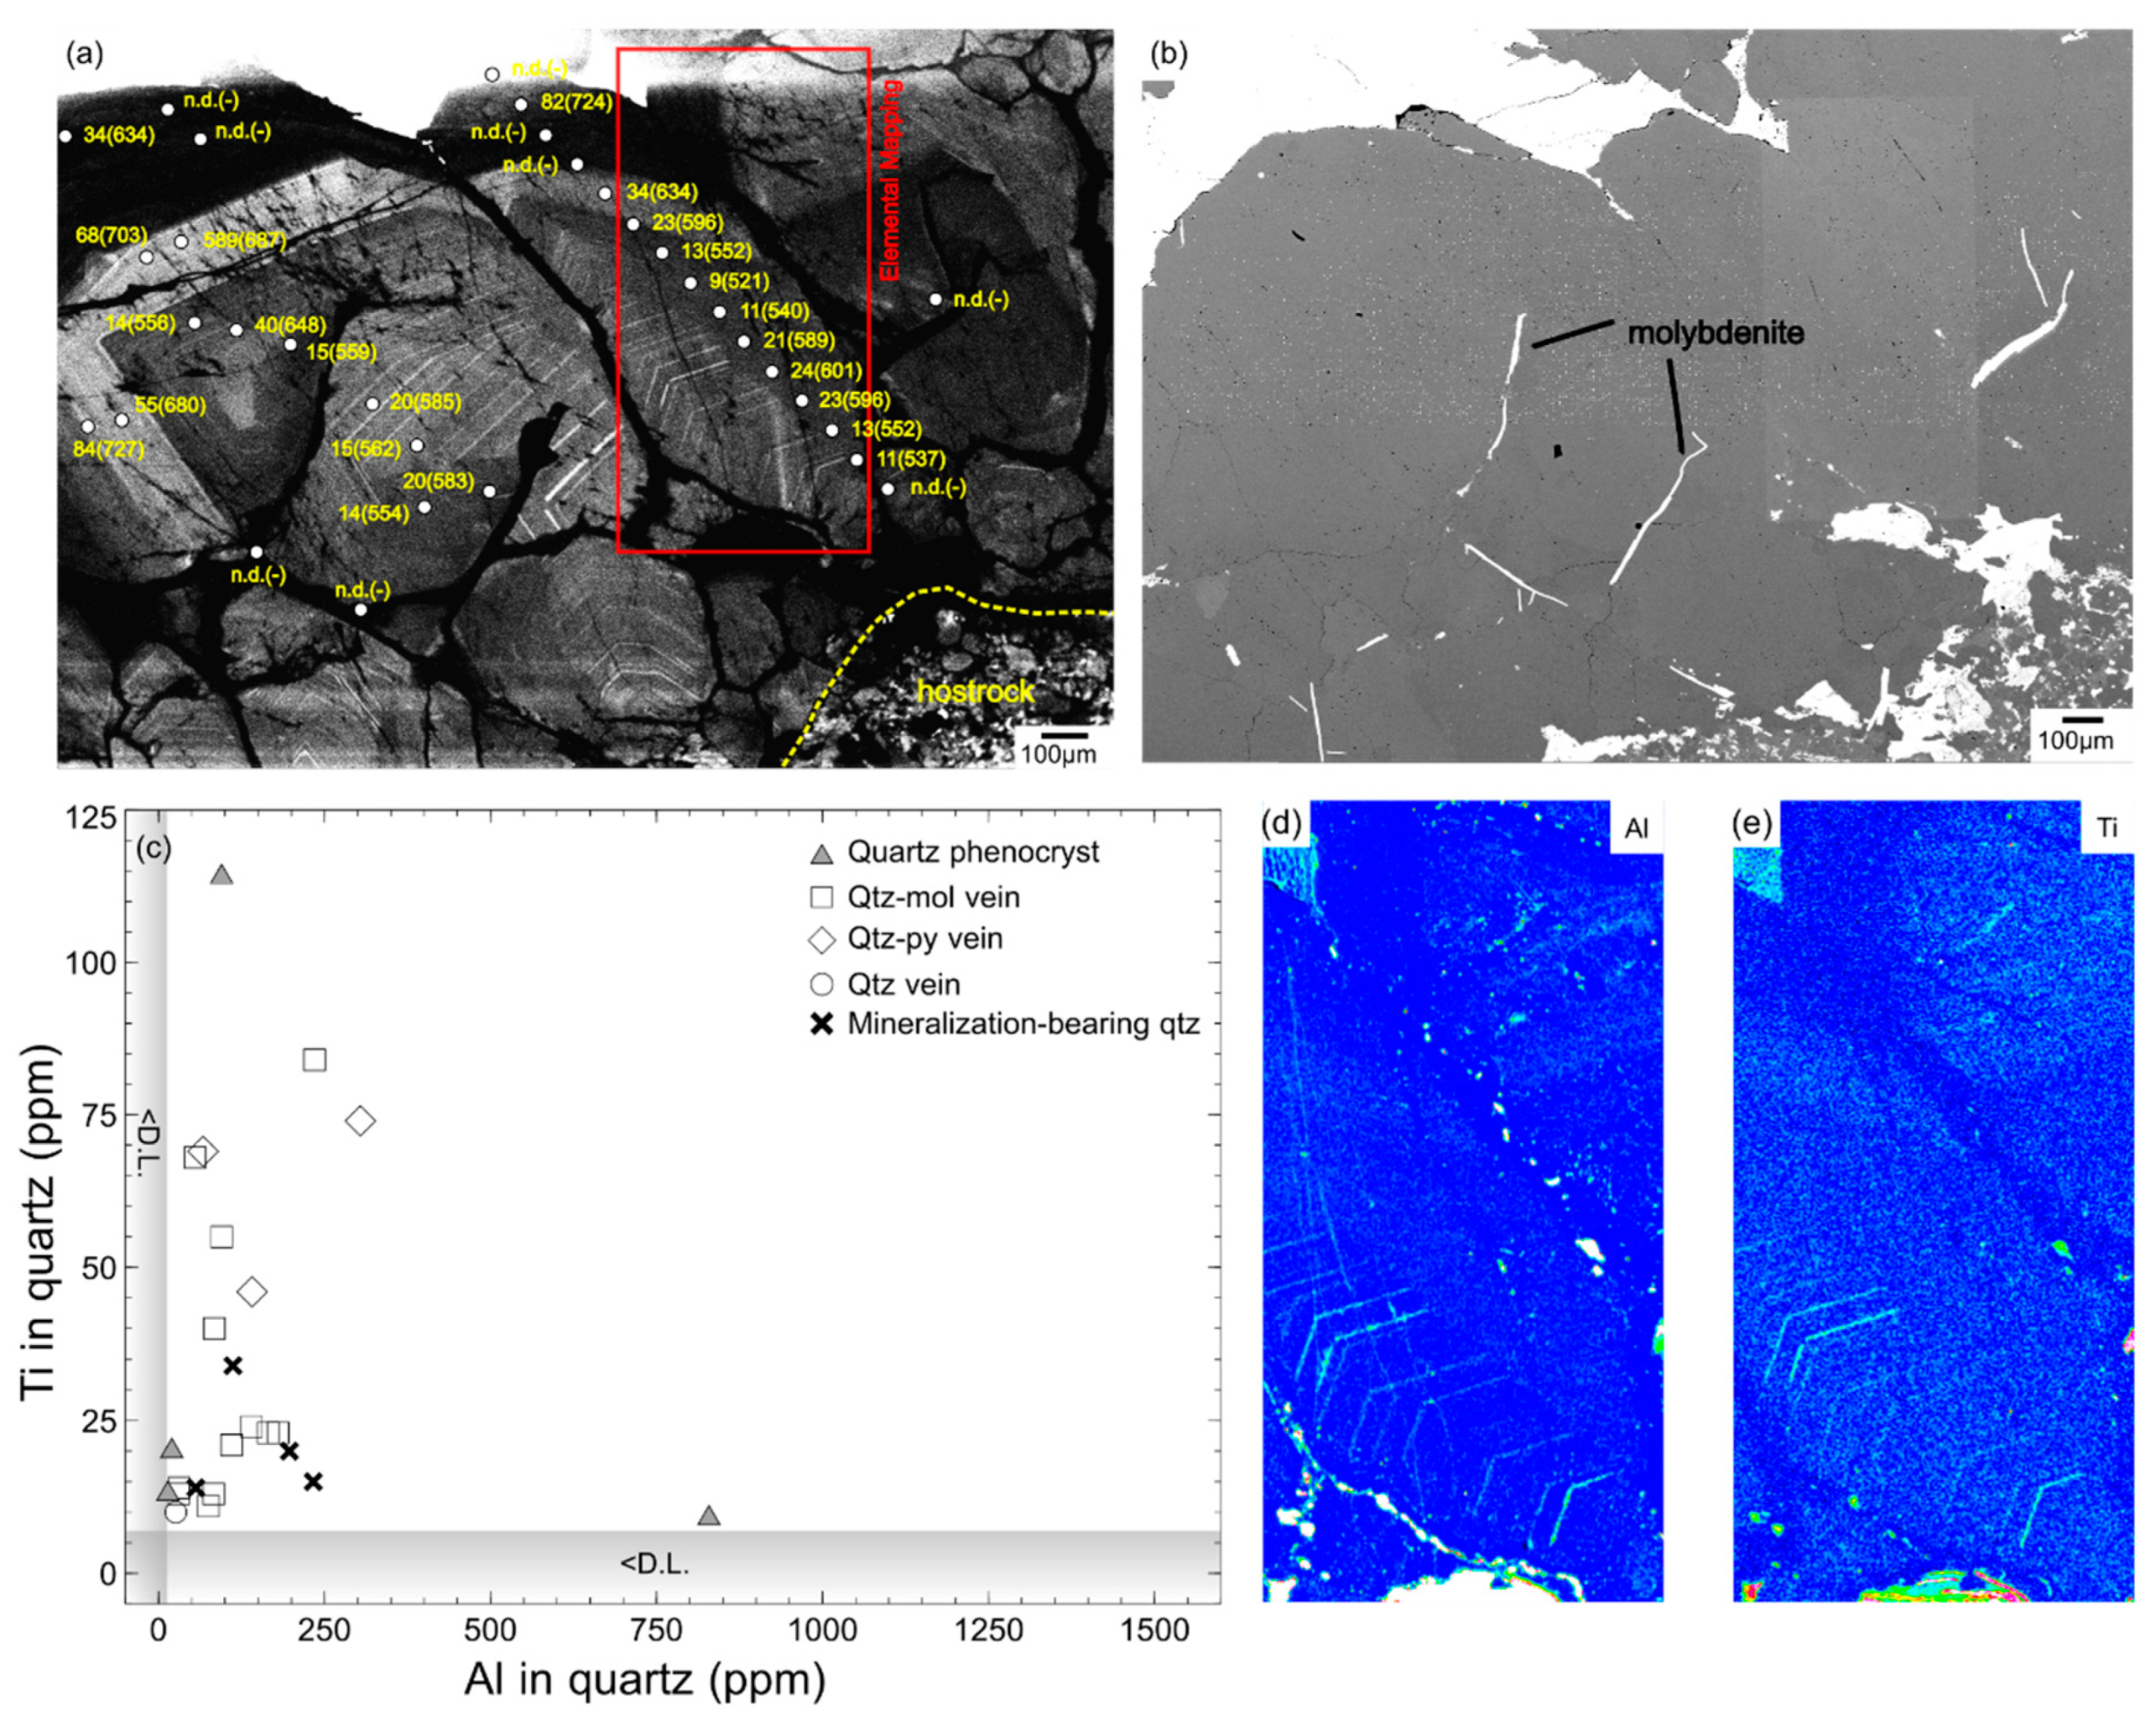
The qtz–mol veins are associated with the early and middle stages of mineralization within the Erdenet deposit [15,18]; the Ti content of quartz and estimated temperatures for these veins are shown in Figure 7a. In general, quartz within the qtz–mol veins has Ti contents of 6–82 ppm, which correspond to temperatures of 500–750 °C (Figure 8). The calculated temperature for barren CL-gray quartz with oscillatory zoning is consistent at ~500–600 °C. The CL-bright areas yield temperatures as high as 700 °C, whereas the CL-dark quartz associated with calcite has no Ti contents, so the temperature is inferred to be <500 °C. Molybdenite has a platy shape and is associated with CL-dark fractures. The CL-gray which is associated with molybdenite truncates the oscillatory zoning and yields temperatures of ~600 °C. Molybdenite is also associated with an interconnected fracture which cuts the CL-bright quartz.
Element maps show that the Ti and Al concentrations are proportional to the CL-brightness (Figure 7d,e), so it is assumed that these elements record the fluid conditions and diffusional states of Ti during quartz precipitation [30]. Therefore, the Ti concentration and temperature of CL-bright quartz are higher than those of CL-gray. Al content is positively correlated with Ti, and the Al concentrations are low (<250 ppm) relative to the average Al contents of other porphyry deposits (>2000 ppm), which show the negative correlations of Al and Ti contents with CL-brightness [23].
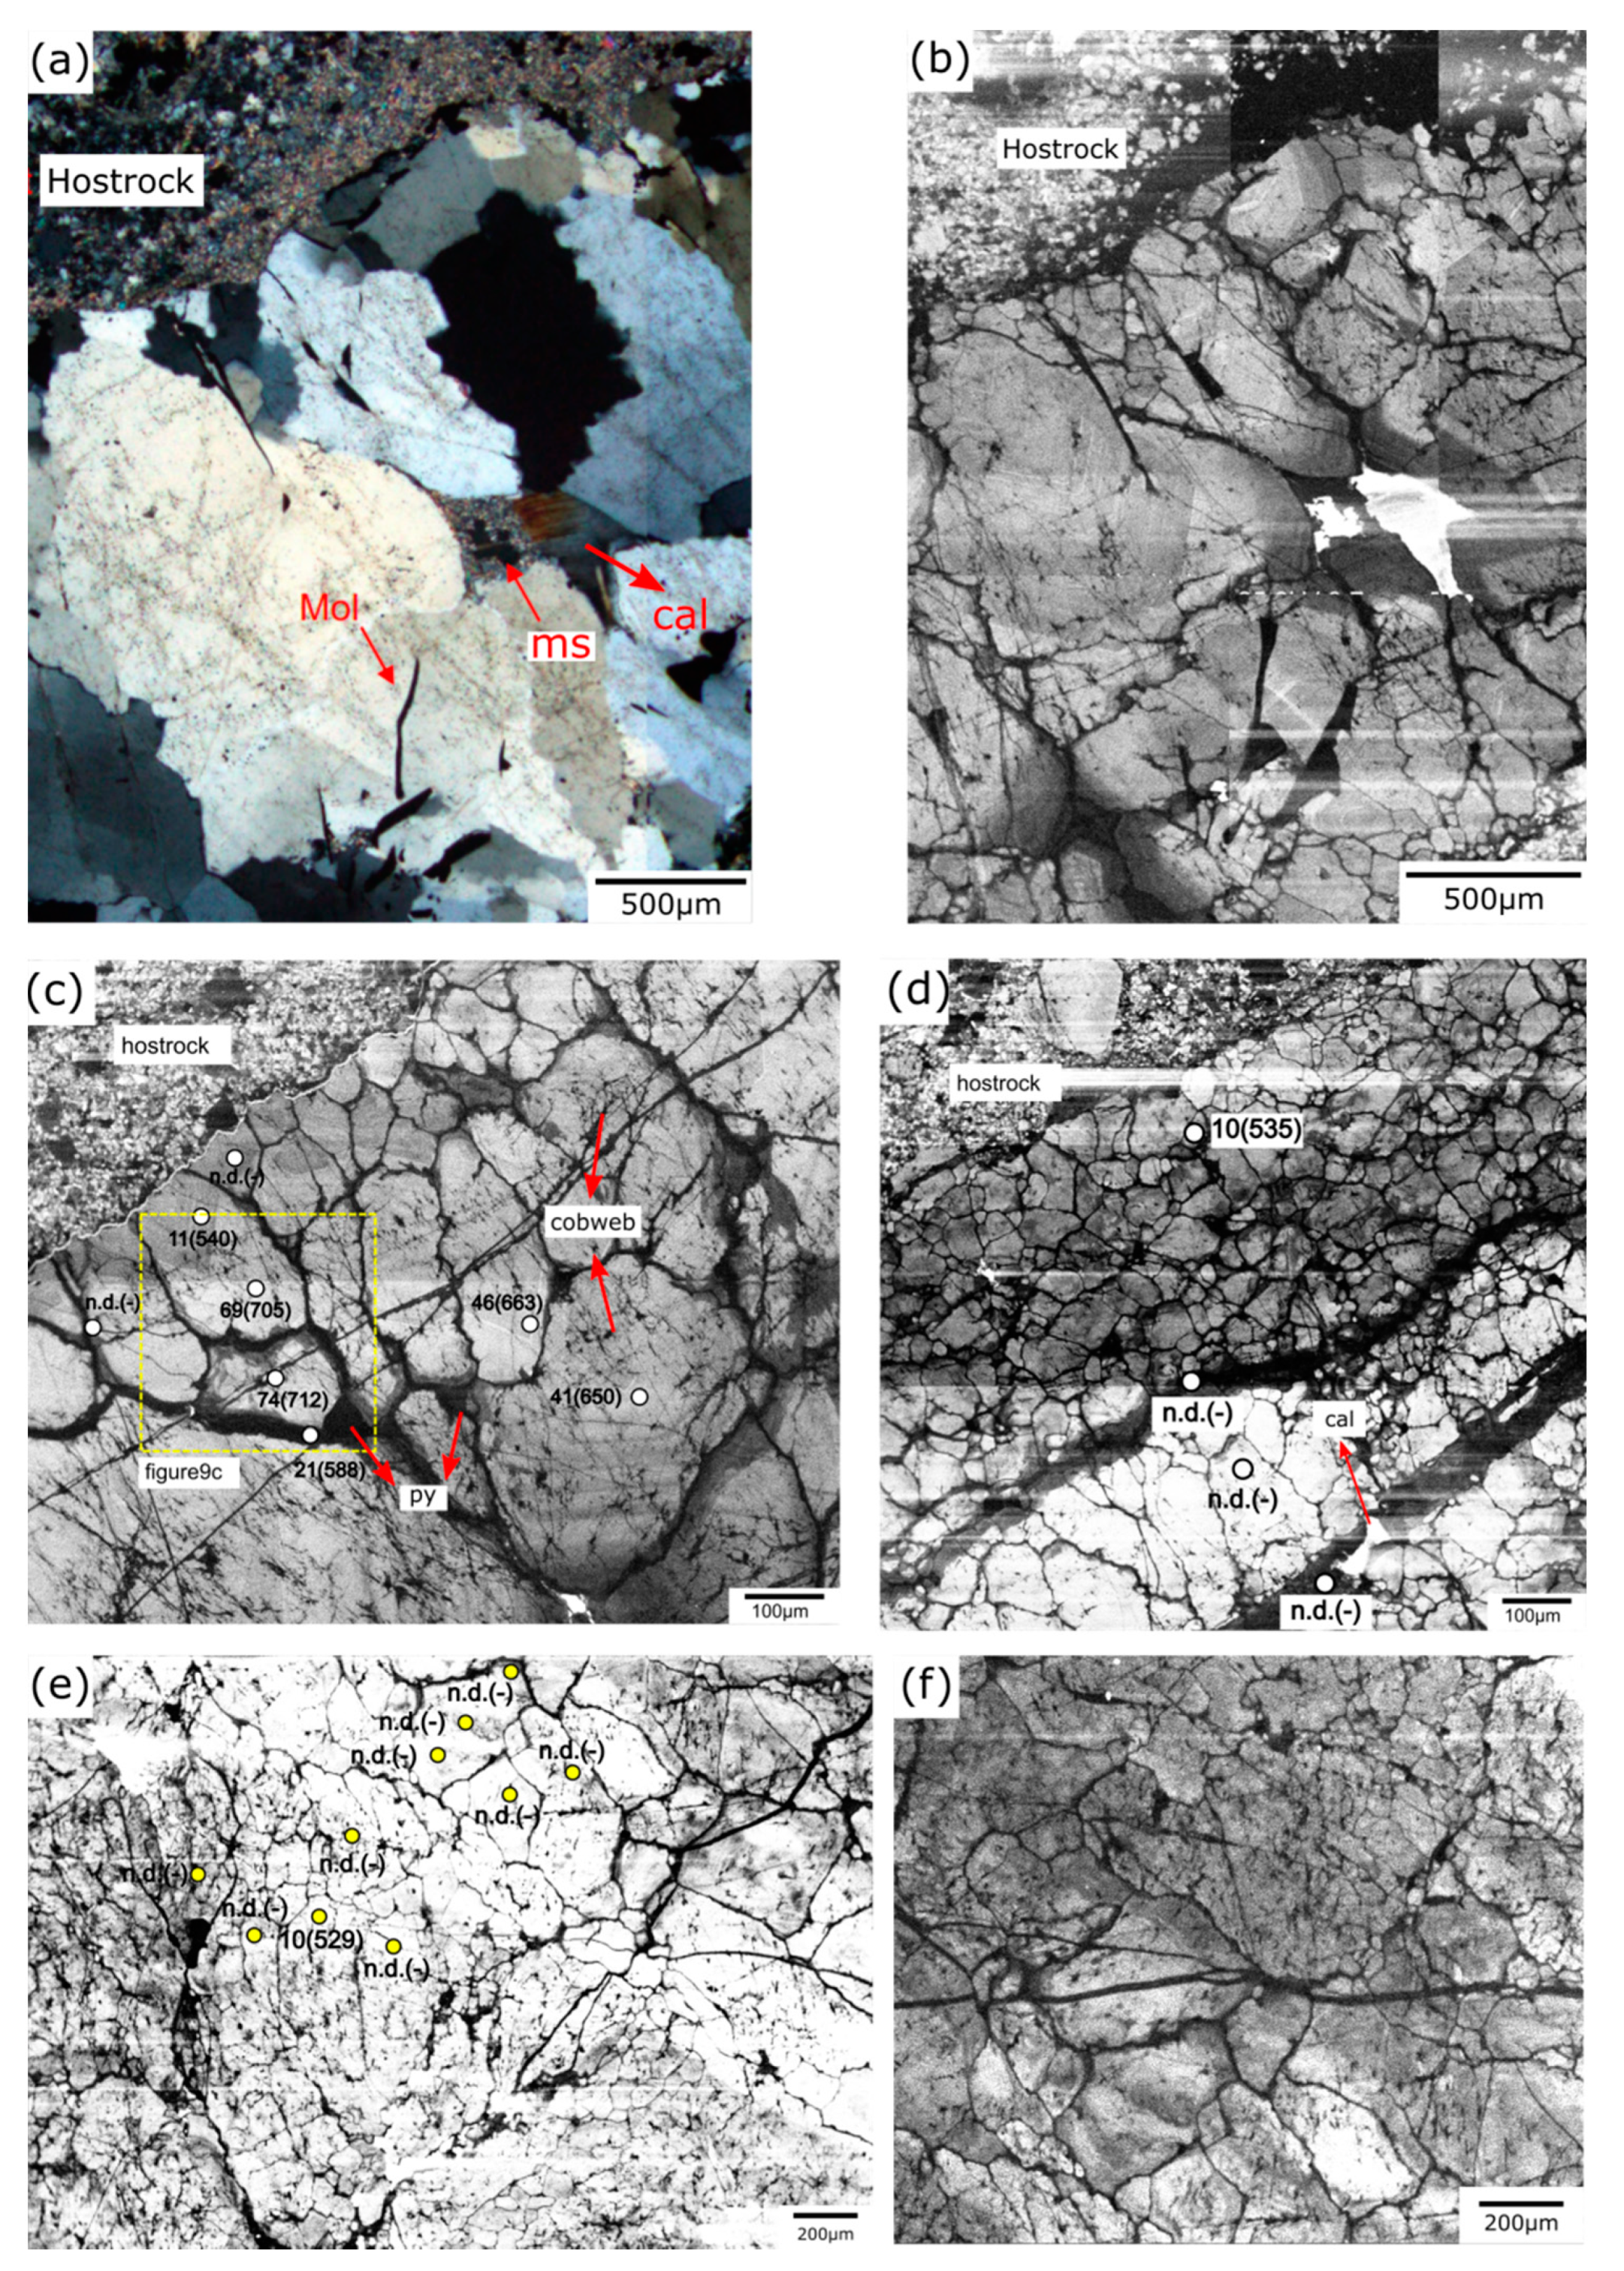
5.2.2. Quartz ± Pyrite Veins
The quartz–pyrite veins were formed during the early and middle stages of mineralization at the Erdenet deposit [15]. The middle stages of mineralization are also commonly associated with the formation of metasomatic sericite and low homogenization temperatures of fluid inclusions (<250 °C). Multiple measurements of the Ti content of primary quartz with oscillatory zoning and quartz in the CL-dark fractures associated with pyrite yielded Ti concentrations of 3–74 ppm, which correspond to temperatures of 450–700 °C (Figure 8). The relationship between the CL-brightness and Ti concentration is similar to that of the qtz–mol veins. The CL-gray quartz, which shows oscillatory zoning between the vein wall and vein center, yields temperatures of ~500–600 °C. The Ti concentration of CL-dark quartz have lies below the detection limit (Figure 5c,d), which suggests it occurs as low-temperature quartz. Pyrite occurs on margins of grains that record temperatures of ~600 °C and on fractures that connect to the calcite at the center of the vein.
5.2.3. Quartz Veins
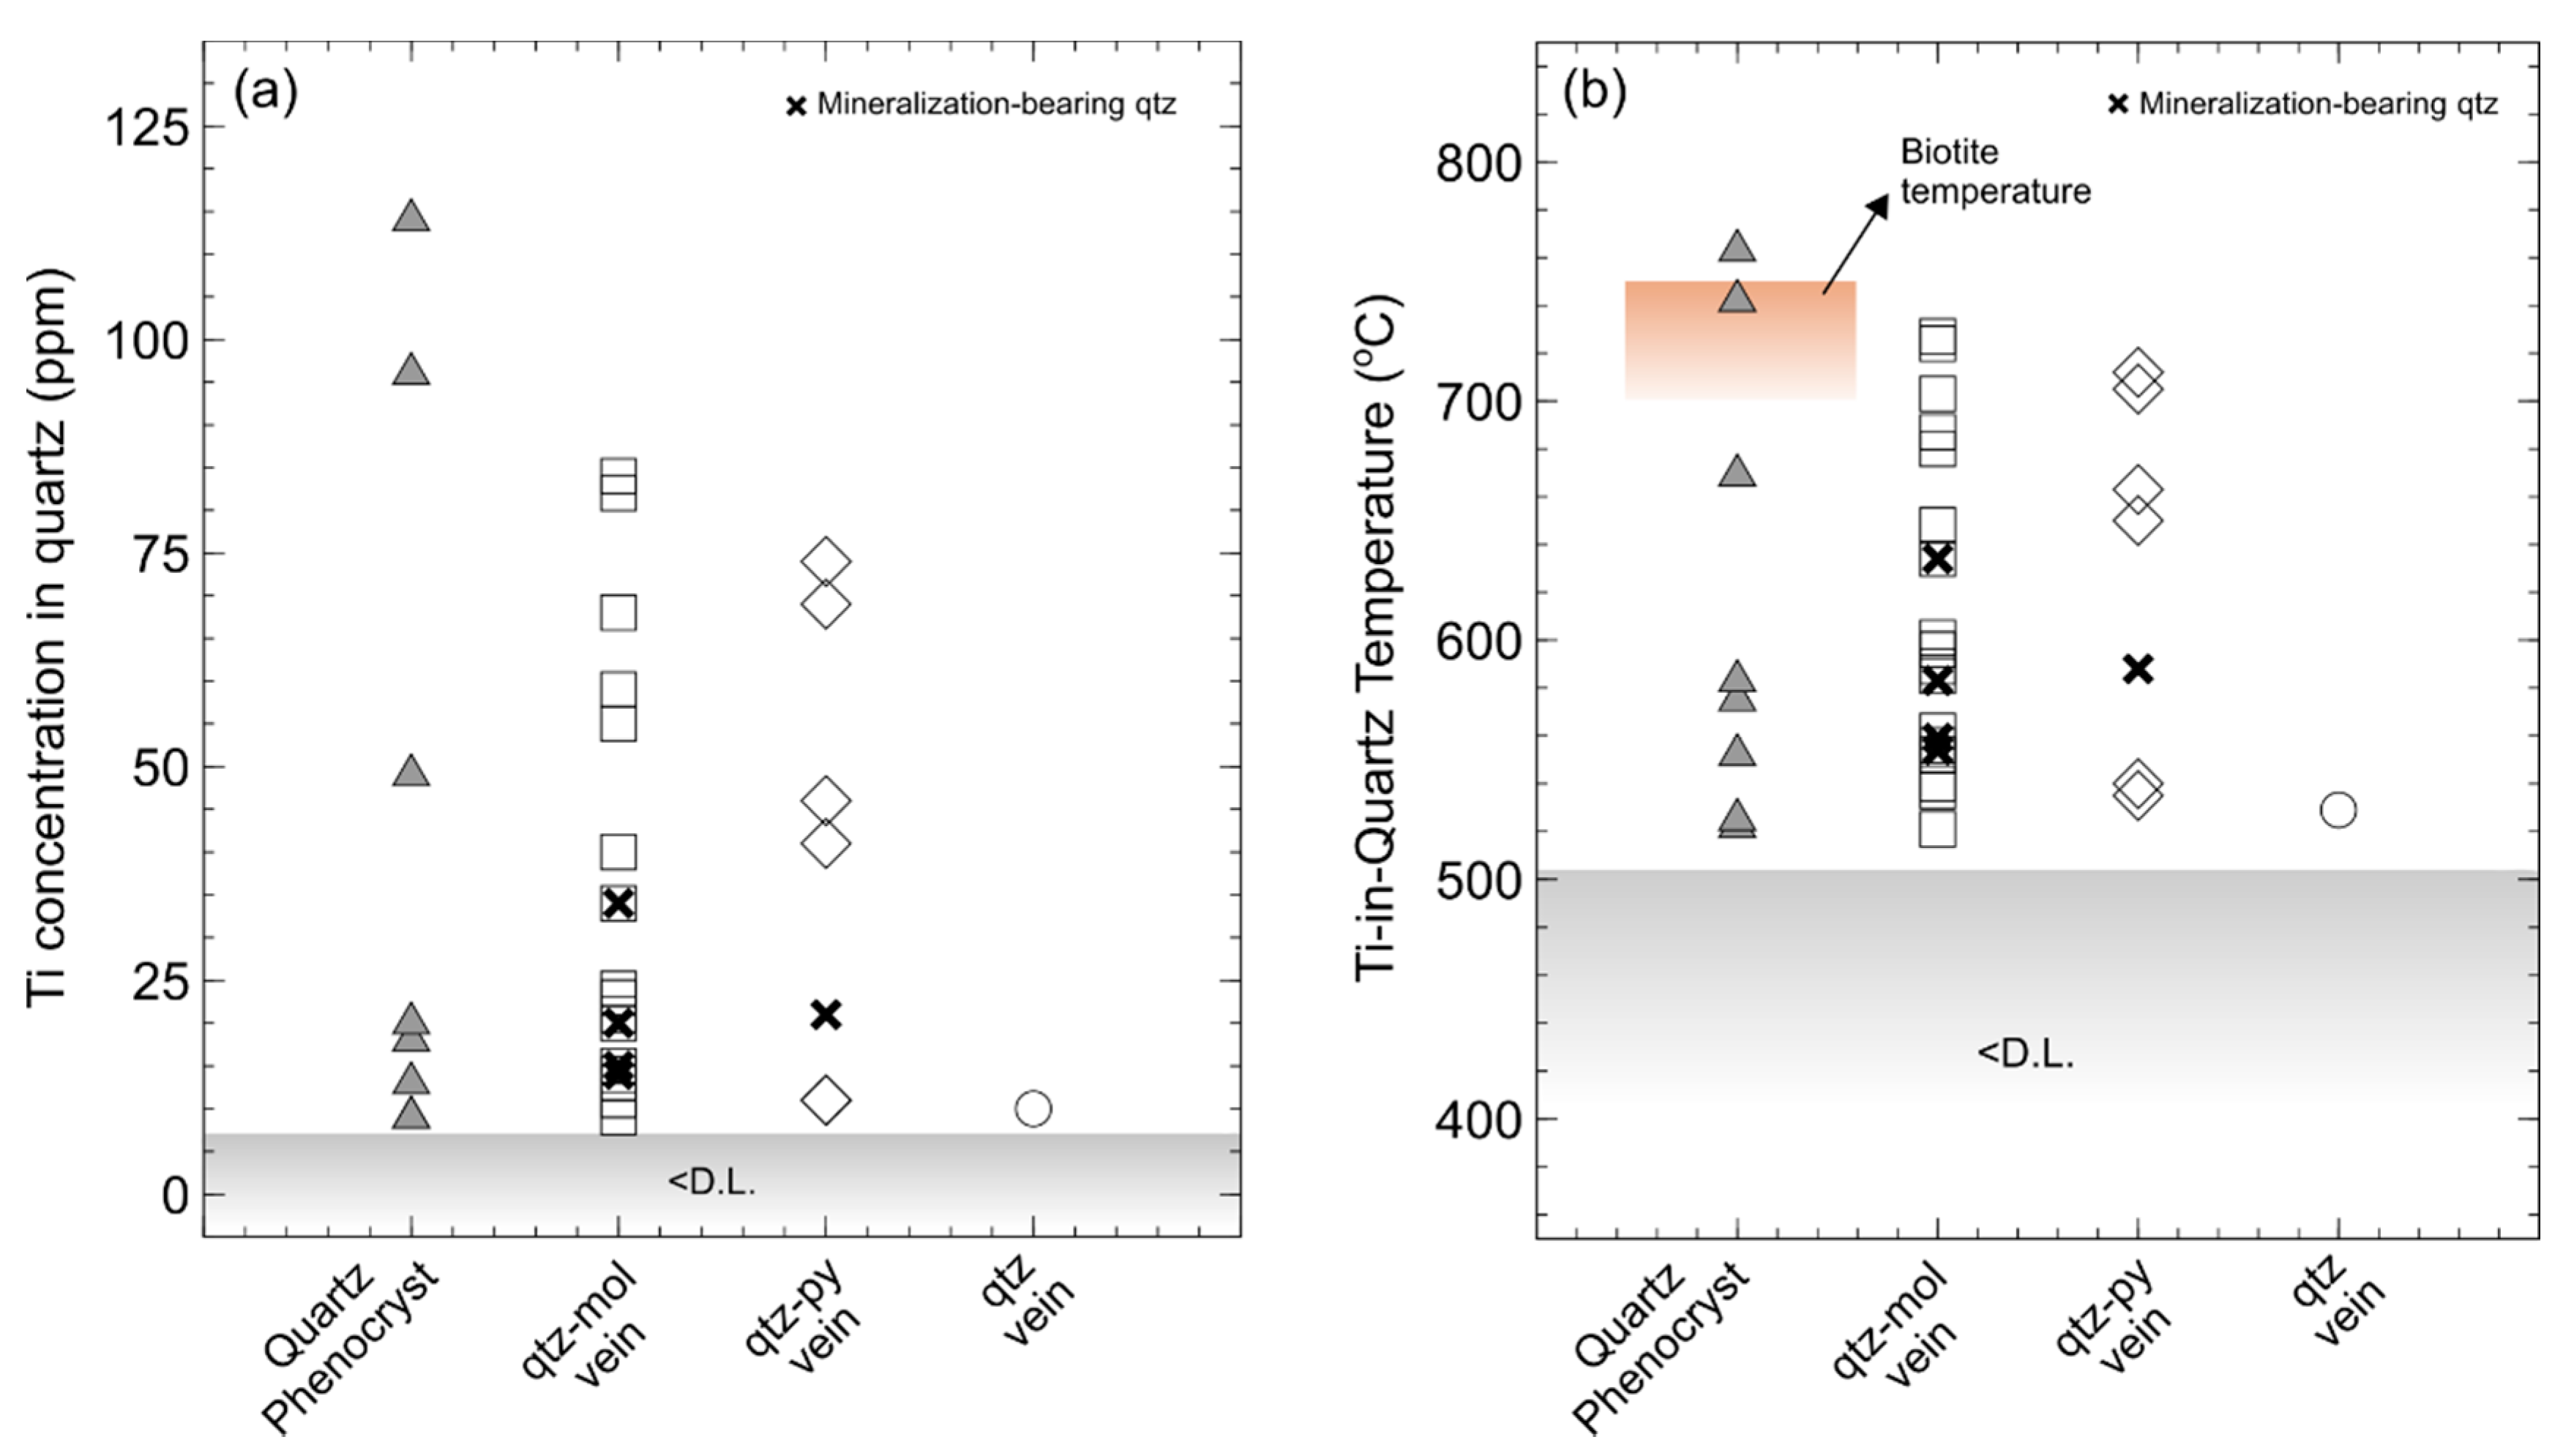
Only two points within the qtz veins yielded detectable Ti concentrations (Table 3, Figure 5e), which indicate temperatures of ~500 °C. However, most of the measured Ti concentrations were less than the detection limit. Thus, we suggest that th qtz veins formed at lower temperatures than those of the qtz–mol veins and qtz-py veins (Figure 8).
The moderate brightness of the CL signal indicates that the qtz veins formed under stable conditions and that the magmatic fluids mixed with lower-temperature fluids derived from meteoric water to produce a relatively low-temperature hydrothermal solution. This inference is supported by the fluid inclusion data (see below).
5.3. Fluid Inclusion Microthermometry and Compositions
5.3.1. Microthermometry
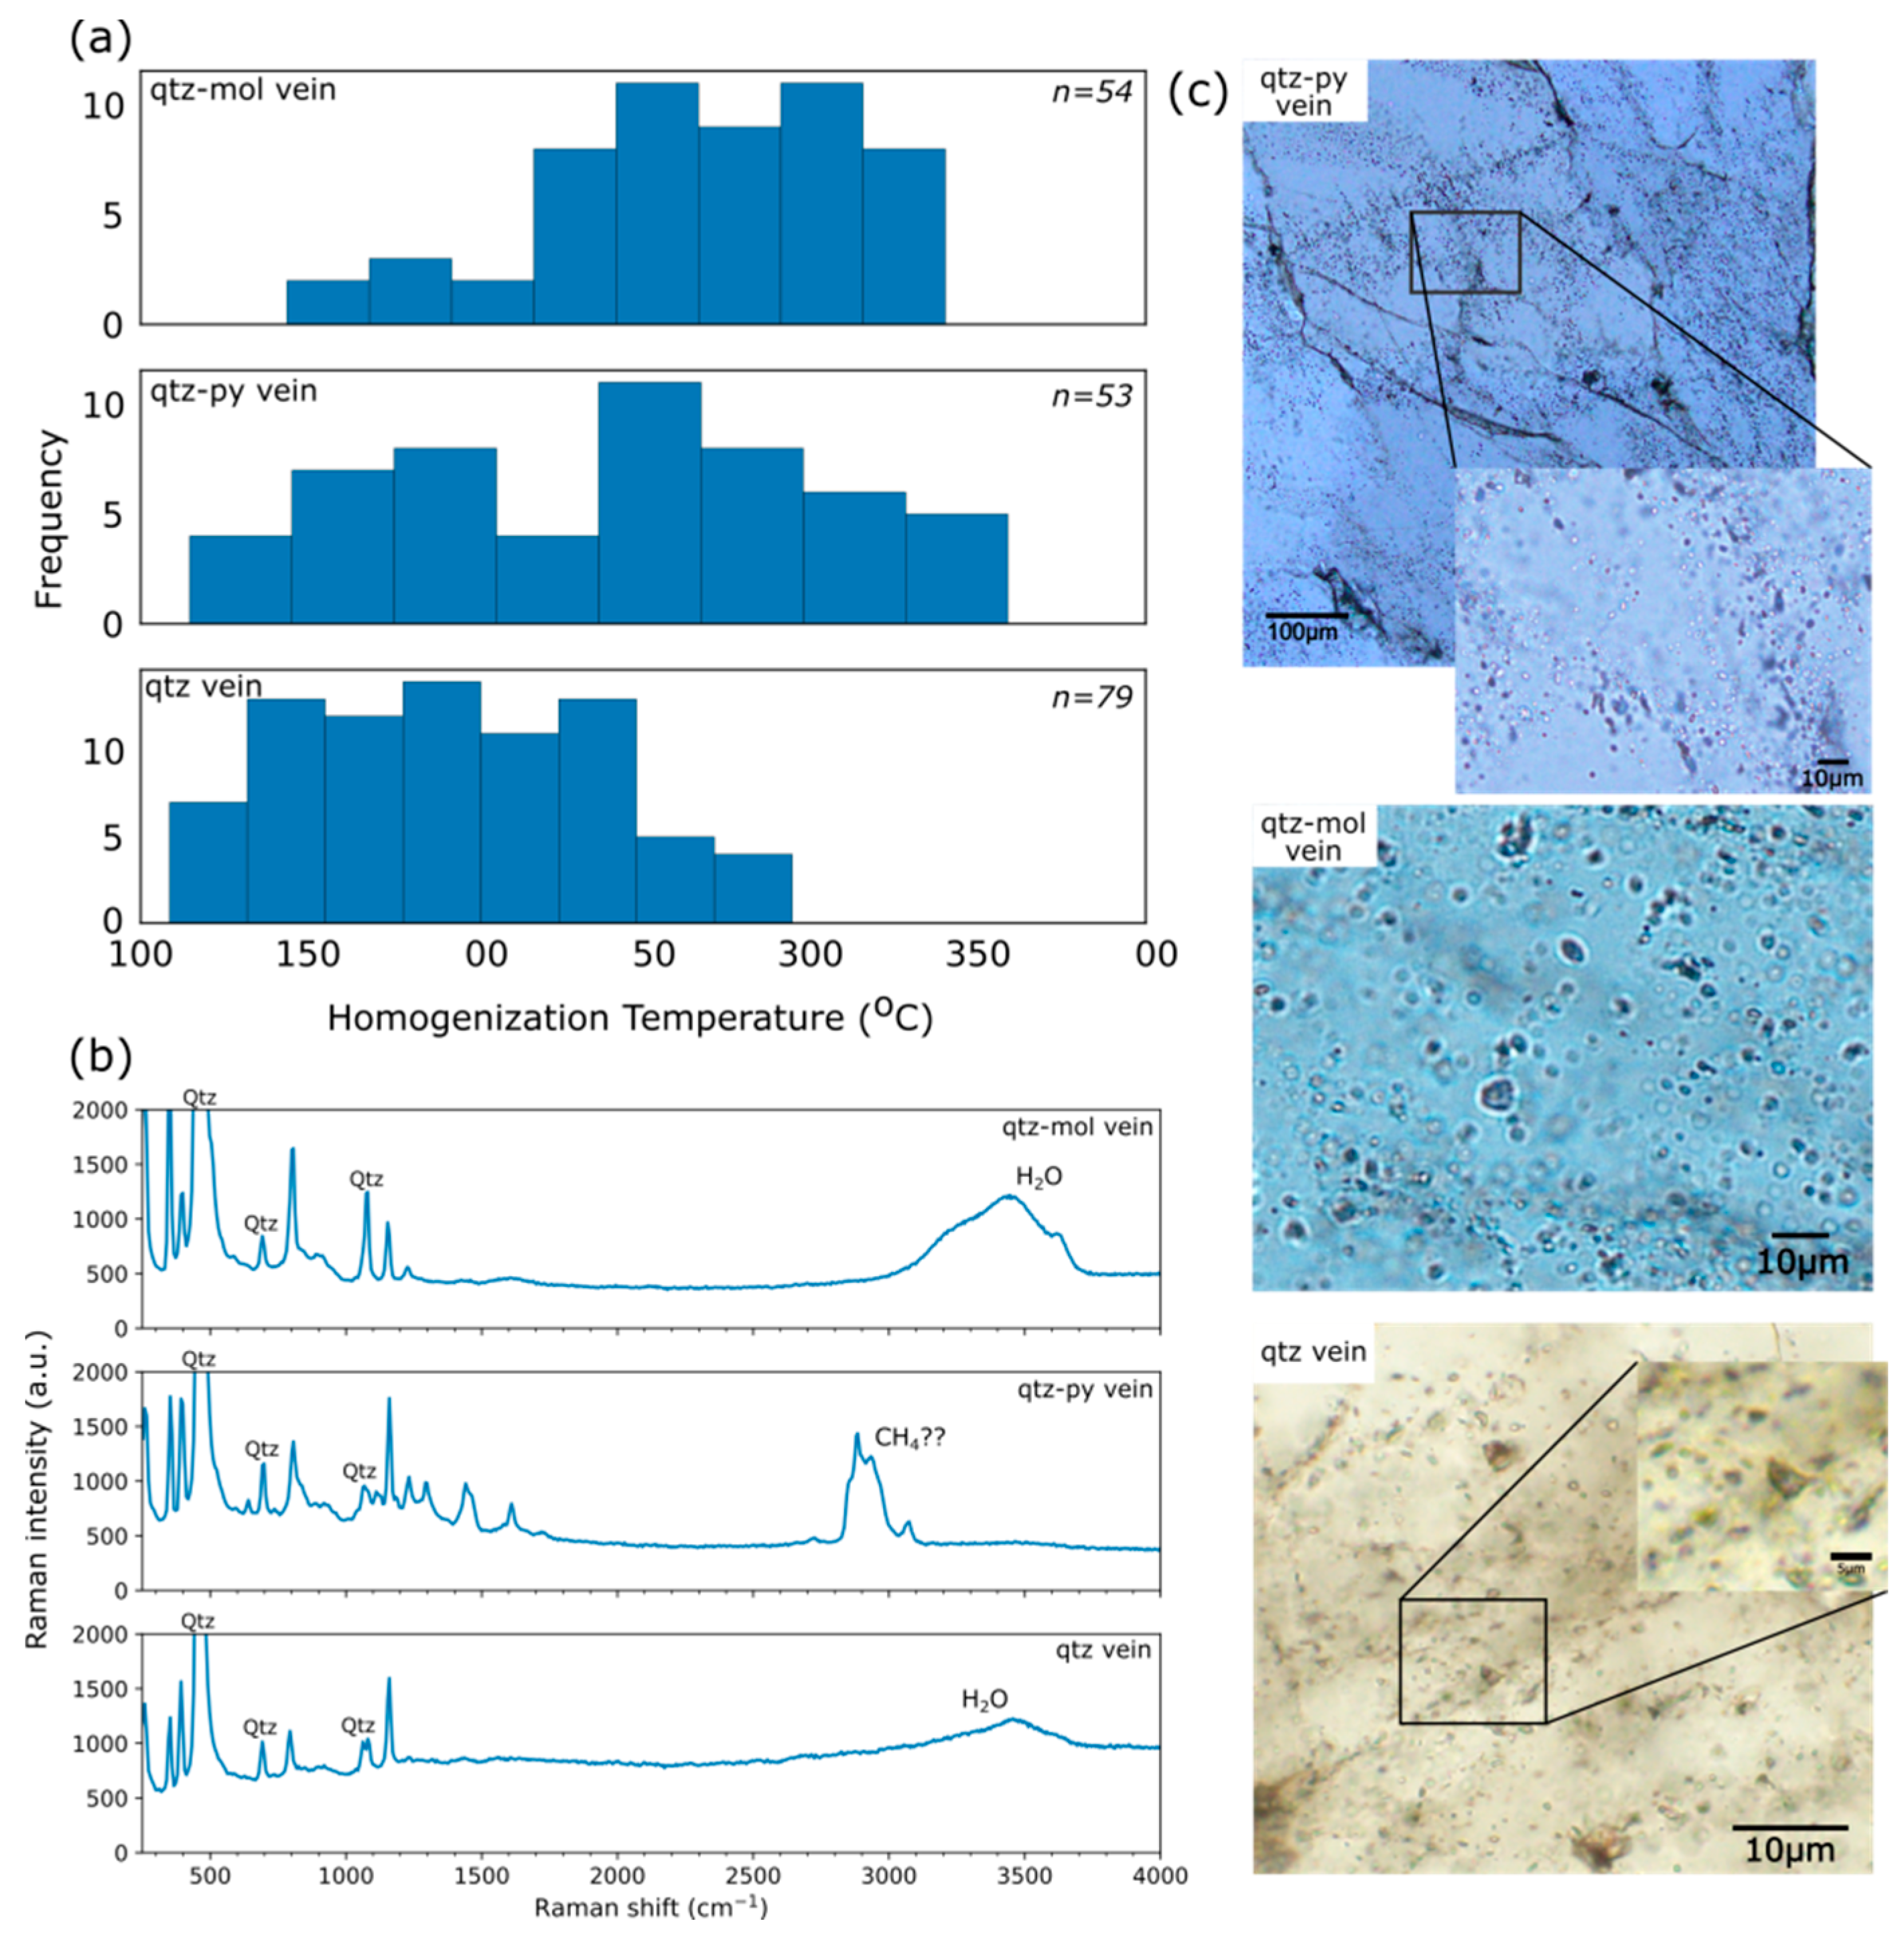
Fluid inclusion microthermometry was performed on all qtz vein stages. However, the vast majority of inclusions were too small for complete microthermometric analysis, so only the homogenization temperature (Th) was measured [34]. All the examined samples show dense populations of fluid inclusion (cloudy area), so the FIA (fluid inclusion assemblages) could not be determined and it could not be distinguished whether the inclusions were primary or secondary. The size of inclusions ranges from 1 to 3 µm (mean value 1.5 ± 0.5 µm). Fluid inclusion microthermometry was performed on several fields of interest along the vein and focused on single inclusion with a moving bubble at room temperature up to 200–300 °C; at temperatures >350 °C, the moving bubble can no longer be seen. Most fluid inclusions show liquid and vapor phases with dark to colorless appearances. Inclusions have rounded-elongate shapes and sometimes occur as trails or solitary inclusions (Figure 9c).
Fluid inclusions in the qtz–mol veins homogenize at 142–340 °C (mean value, 267 ± 46°C), and the Th of qtz–py veins span from 115 to 359 °C (mean value, 242 ± 65). The homogenization temperatures of fluid inclusions in the qtz veins are in range 108–295 °C (mean value, 194 ± 45) (Figure 9a and summary of microthermometric data is provided in Supplementary). The fluid inclusions exhibit a bimodal population, consisting of a low mean value of the qtz vein and a relatively higher value of the qtz-mol and qtz-py veins. This indicates that two different processes occurred in the Erdenet system. Later, we use the homogenization temperature (Th) value to estimate the minimum pressure condition of vein formation by using the isochore of Th and the Tm-ice of fluid inclusion in P-T space provided by [35,36].
5.3.2. Fluid Compositions
The compositions of the fluid inclusions within various veins were investigated by micro-Raman spectrometry using a Horiba XploRA PLUS instrument equipped with a 532 nm Ar laser and gratings set to 600 grooves mm−1 at Tohoku University, Japan. The qtz–mol and qtz veins are dominated by H2O, which might have occurred at the vapor or liquid phase, based on petrographic observations. Inclusions within the qtz–py veins that formed during the second stage might contain CH4 in the vapor phase (Figure 9b).
6. Discussion
6.1. Vein-Related Mineralization Processes
The vein formation temperatures and SEM–CL observations provide insights into the conditions that formed the quartz and ore/sulfide minerals of the Erdenet deposit. The qtz–mol veins were precipitated at high pressures and temperatures (500–700 °C) [37], and the relatively low Al content in the qtz-mol veins indicates that the veins formed at high temperatures [23]. Platy molybdenite occurs close to the CL-dark fractures. The sulfide mineralization was formed from fluids derived from intermediate–silicic magmas [38]; the CL-dark quartz associated with molybdenite formed at ~600 °C and crosscuts the oscillatory zoning. The molybdenite mineralization forms part of the first stage of mineralization at the Erdenet deposit. In contrast, the qtz–py veins show identical growing patterns, with the qtz-mol vein where the pyrite or chalcopyrite occur on the margins of the vein and grain boundary. The mineralization corresponds to CL-dark quartz that crosscuts primary quartz with oscillatory zoning and is oriented parallel or perpendicular to the vein wall. The formation temperature recorded by the pyrite-bearing quartz is ~600 °C. The qtz veins record the latest stage of quartz precipitation within this system and are relatively unmineralized, but some pyrite occurs within these veins in association with the CL-dark quartz. We infer that the barren quartz with oscillatory zoning formed at the beginning of the vein formation and that this quartz was precipitated on the vein wall. The molybdenite and pyrite mineralization formed after the initial quartz in association with the CL-dark fractures that cut the oscillatory zoning.
6.2. Estimated Fluid Pressures
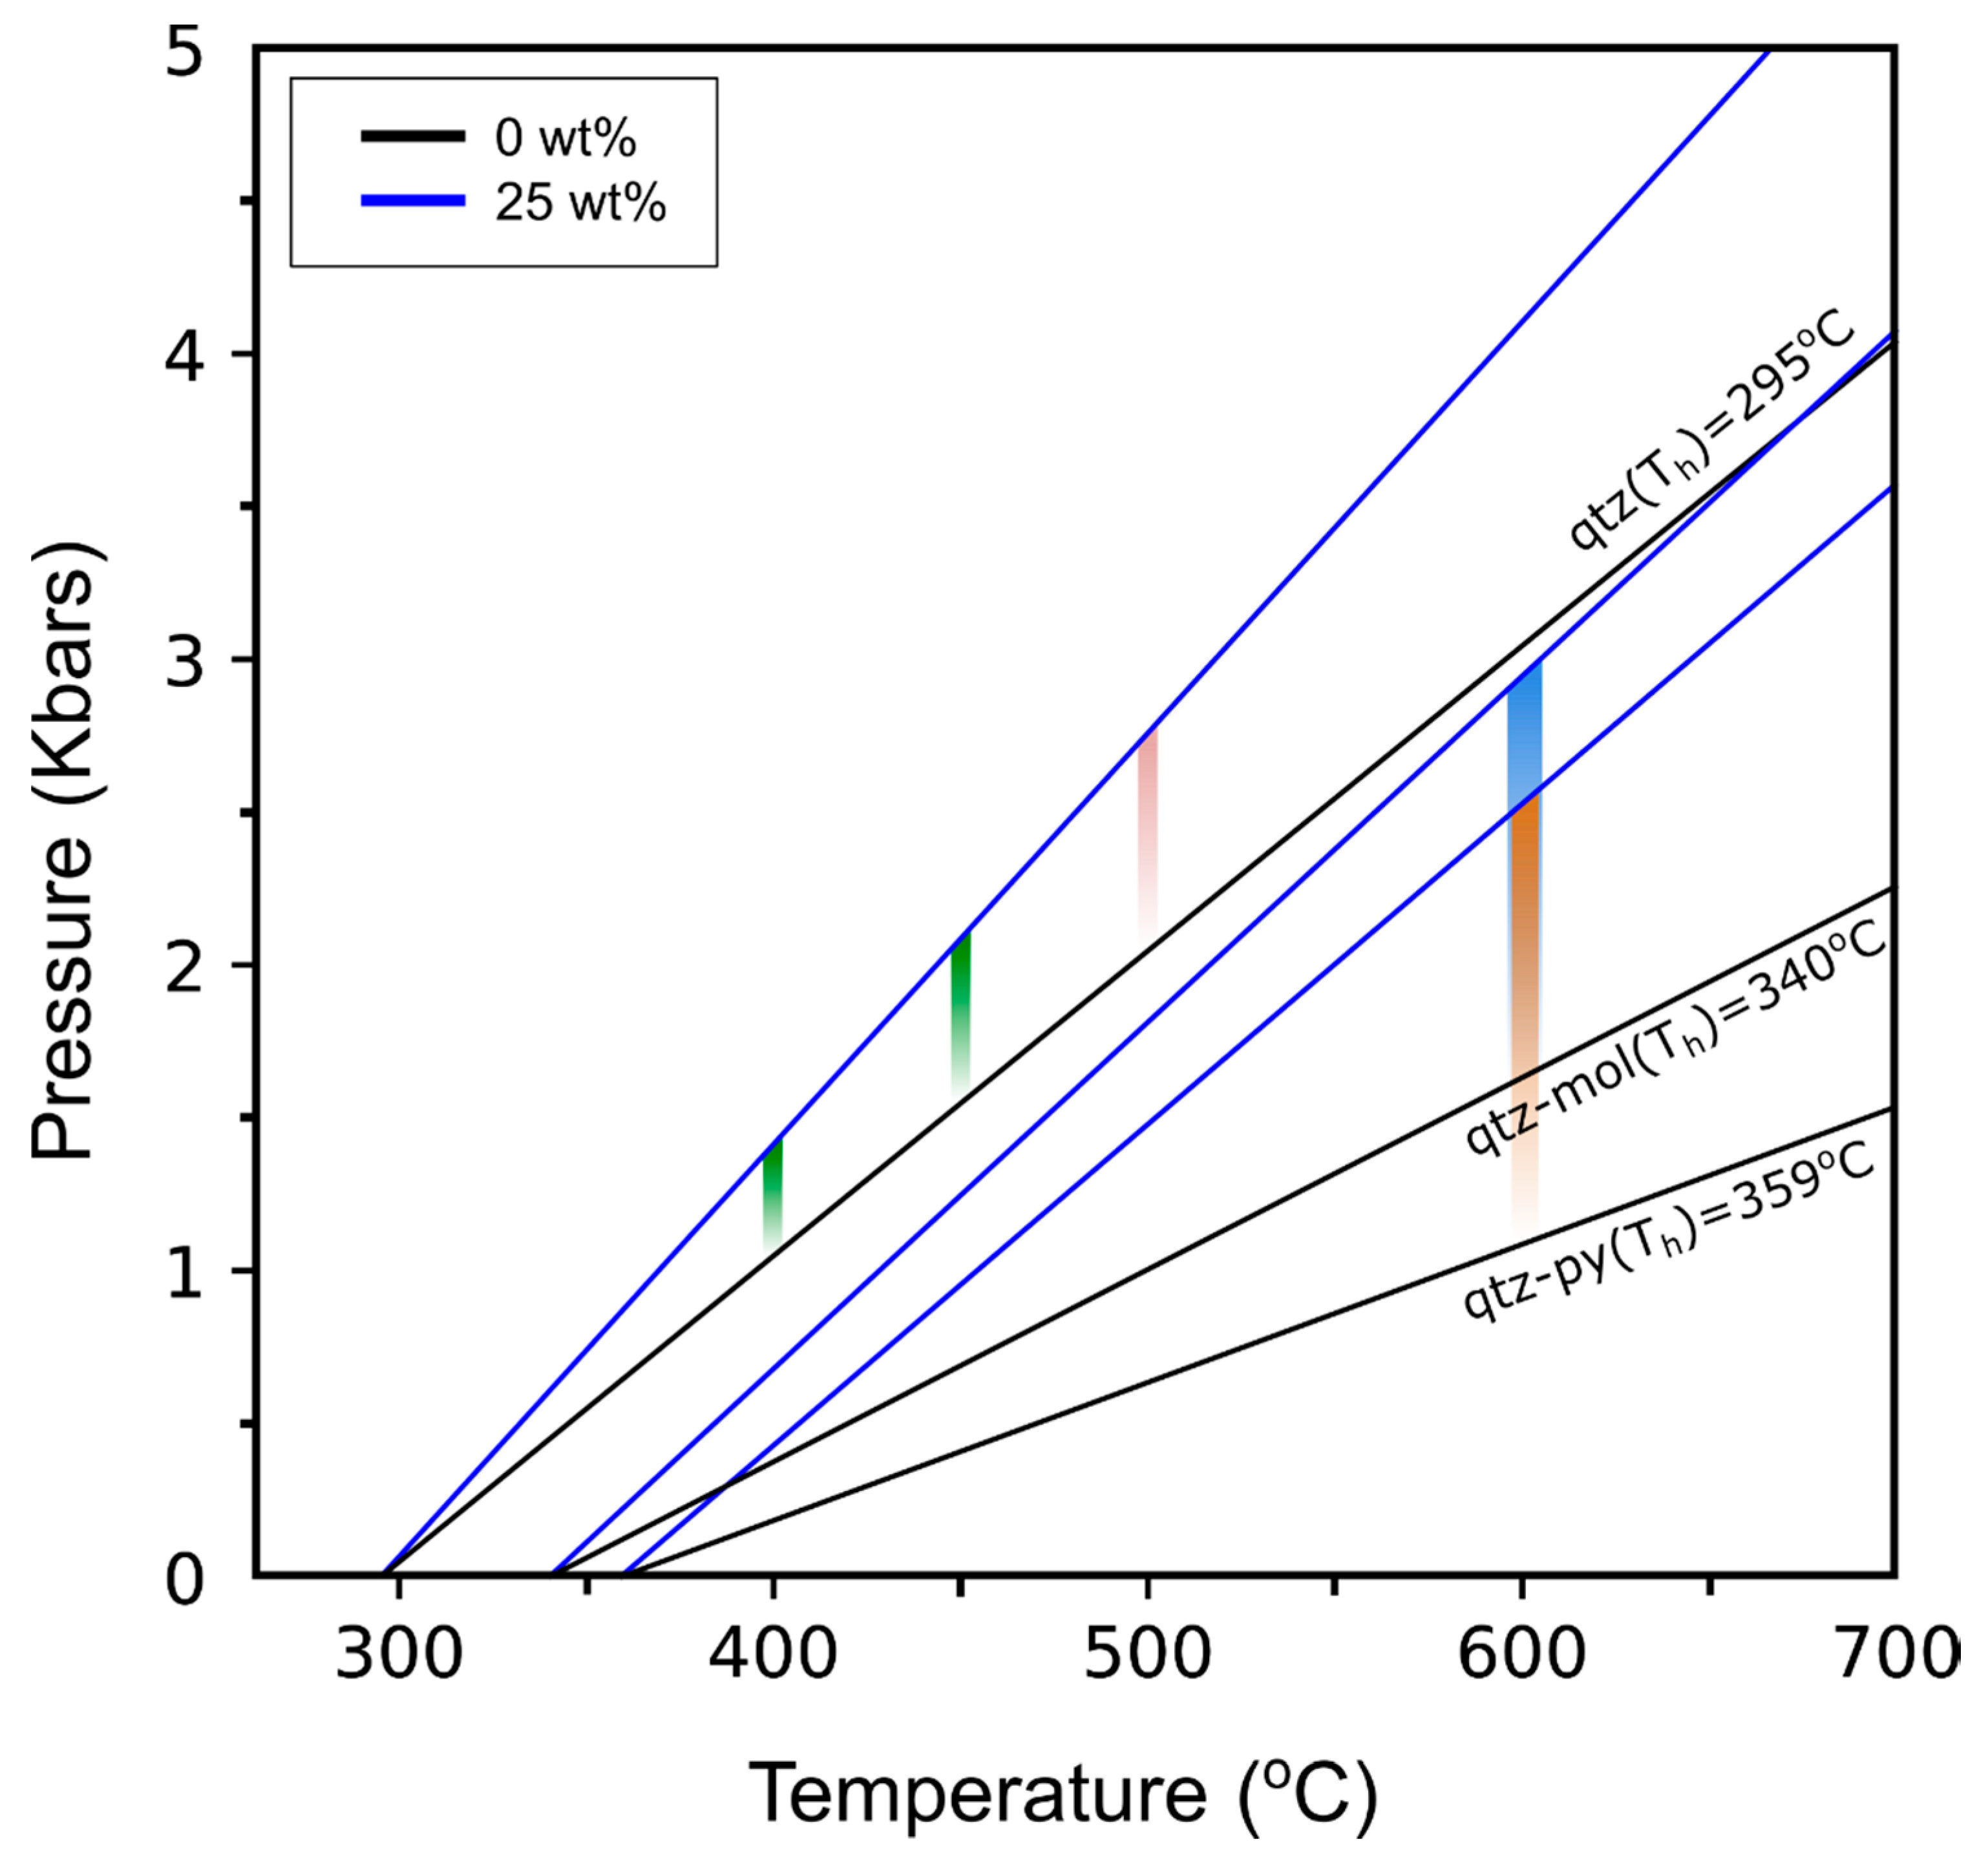
The fluid pressures were estimated by combining isochores calculated from the homogenization and ice-melting of fluid inclusion [35,36] with temperatures from the Ti-in-qtz thermometry. The maximum value of Th was used to construct the isochores to represent the minimum pressure condition. The temperature of ice melting could not be determined, but halite is not present within the inclusions, so the salinity was assumed to be 0–25 wt%. This assumption is consistent with previous reports of salinities of 5–25 wt% for fluid inclusions from surface samples [17]. The calculated pressure for the qtz–mol veins is 1.6–3.0 kbar, assuming a temperature of ~600 °C (Figure 10). A pressure of 1.1–2.5 kbar was estimated for the qtz–py veins, based on a Ti-in-quartz temperature of ~600 °C (Figure 10). A pressure of 2.1–2.8 kbar was calculated for the qtz veins, based on an assumed temperature of ~500 °C. However, the crosscutting relationships and the relatively lower Ti content as well as homogenization temperature (Th) of the fluid inclusion compared to other vein types indicate that qtz veins record the later fluid activity at the Erdenet deposit and were formed at considerably lower pressures. Therefore, we suggest that the qtz veins must have formed at temperatures of <500 °C, based on their low Ti concentrations. In this case, the estimated pressure is 1–2 kbar assuming temperatures of 400–450 °C, although it could be lower (green b, Figure 10).
6.3. Fluid Evolution at the Erdenet Porphyry Deposit
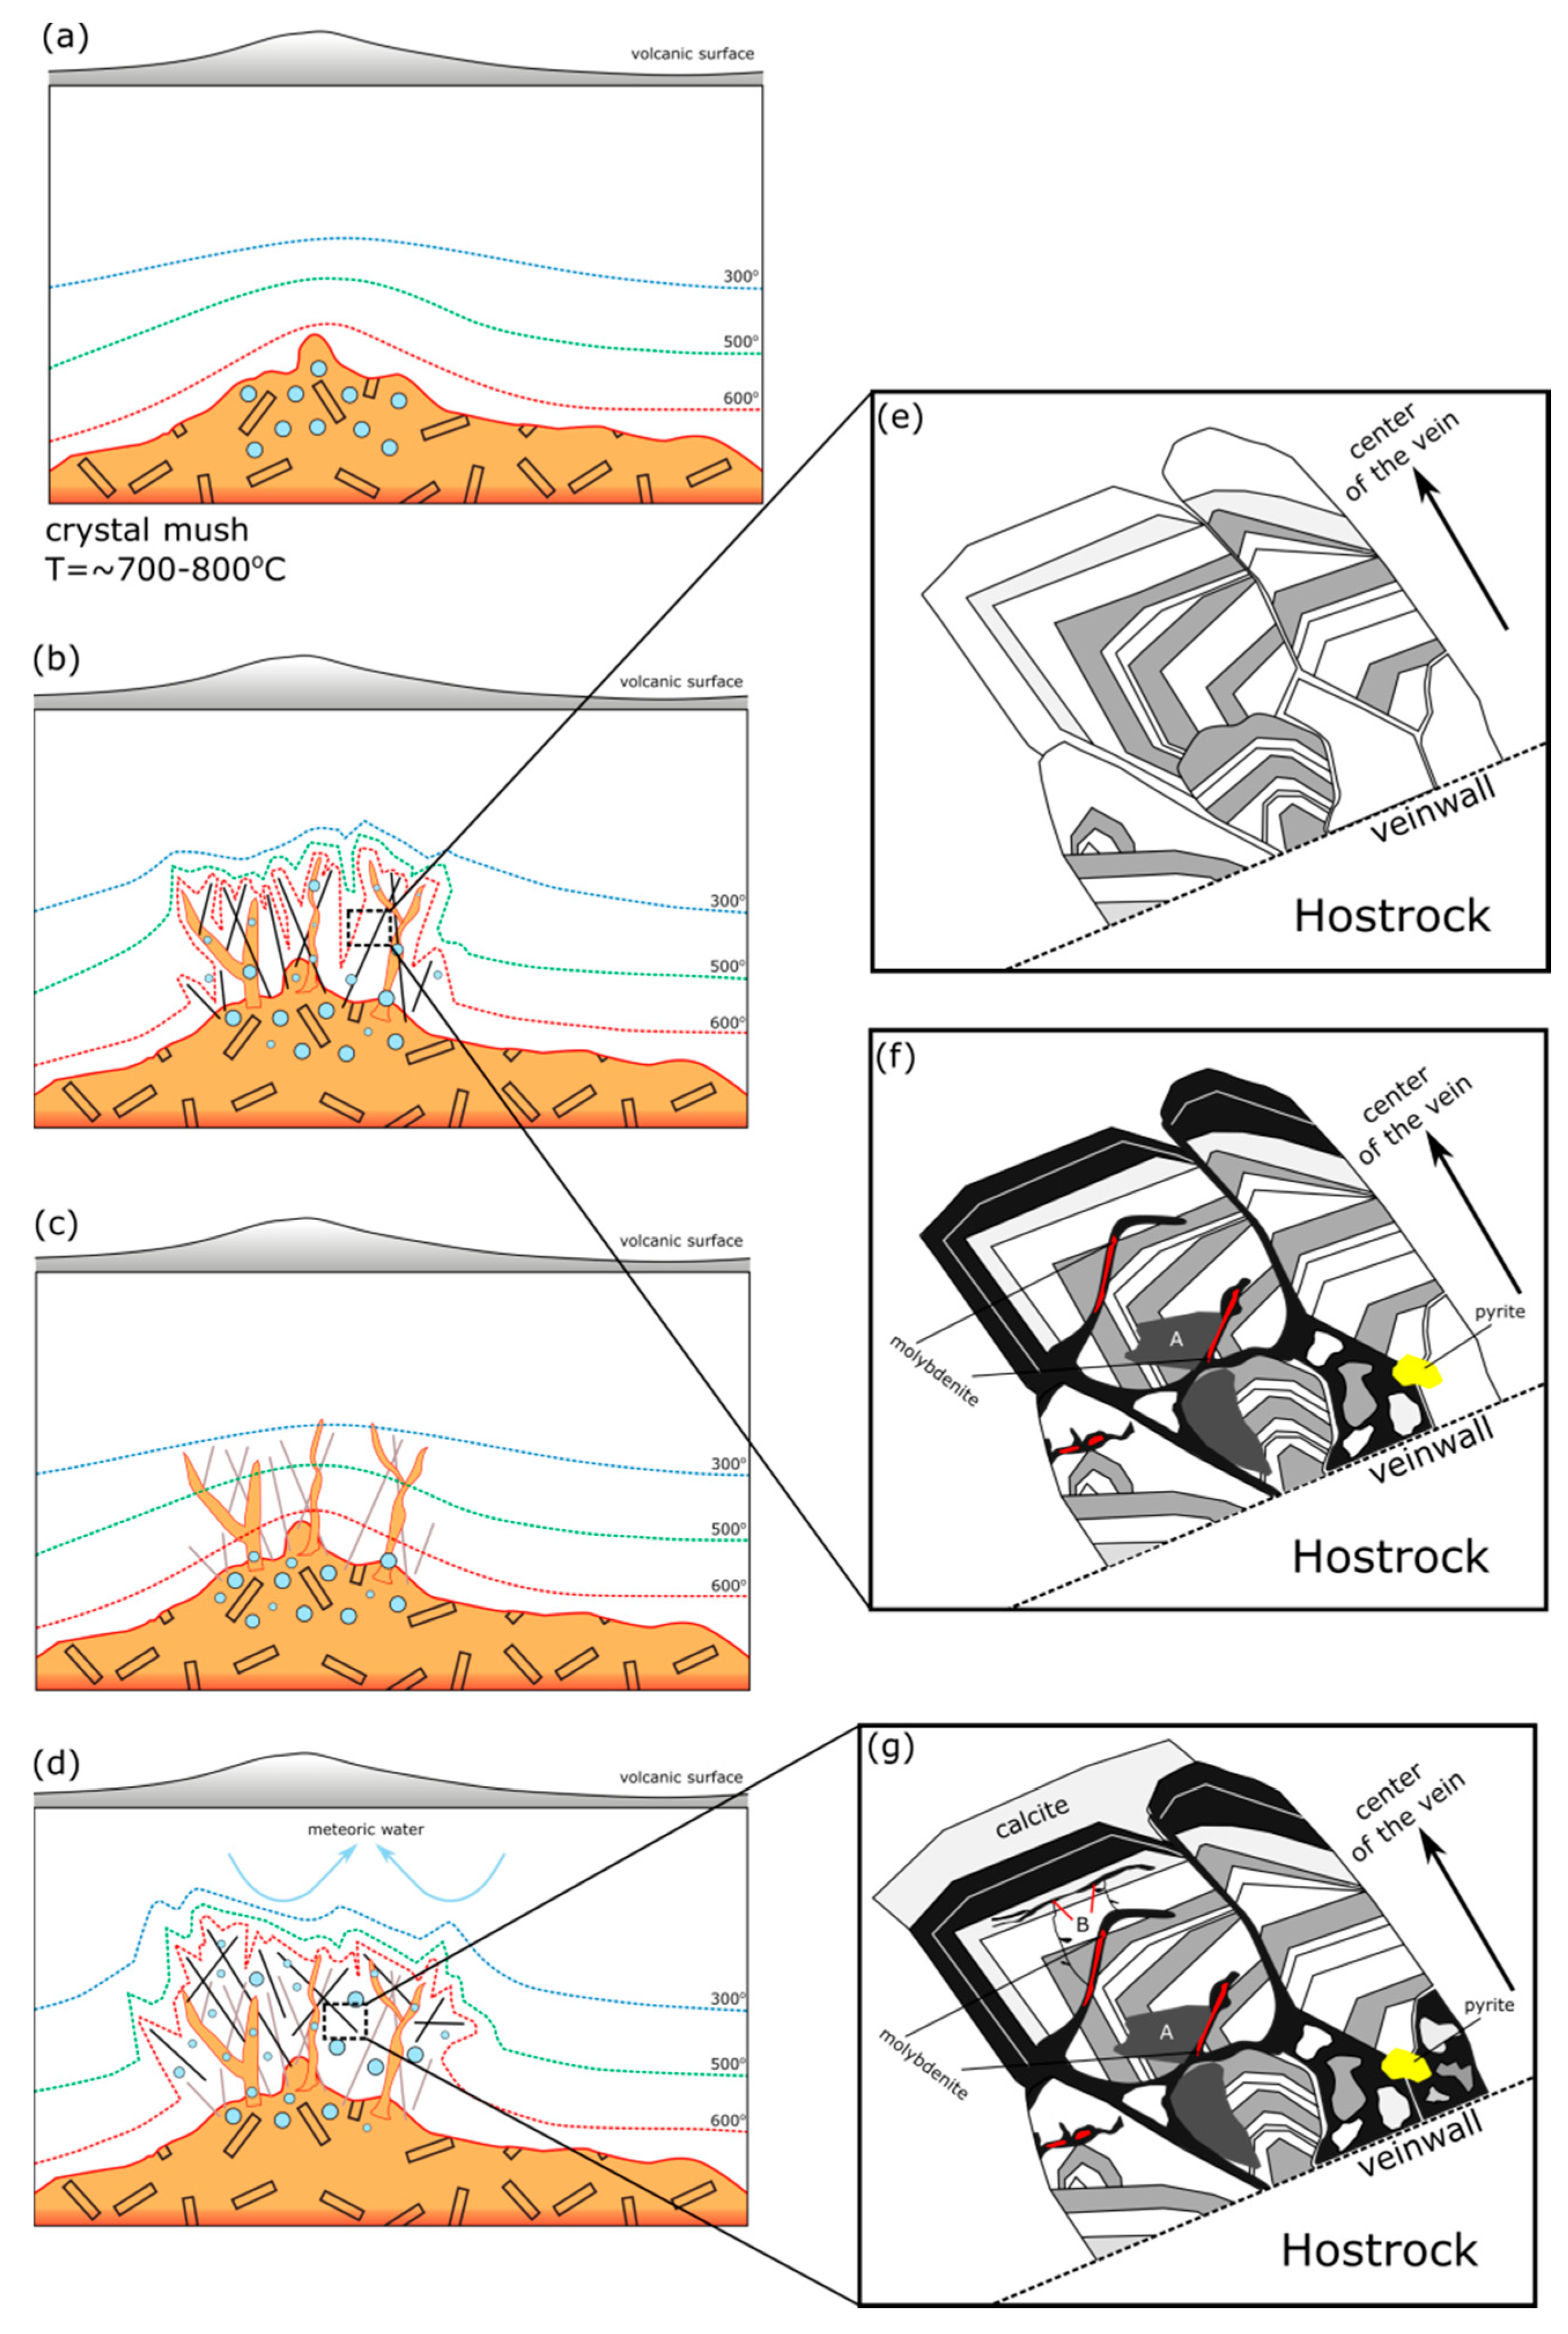
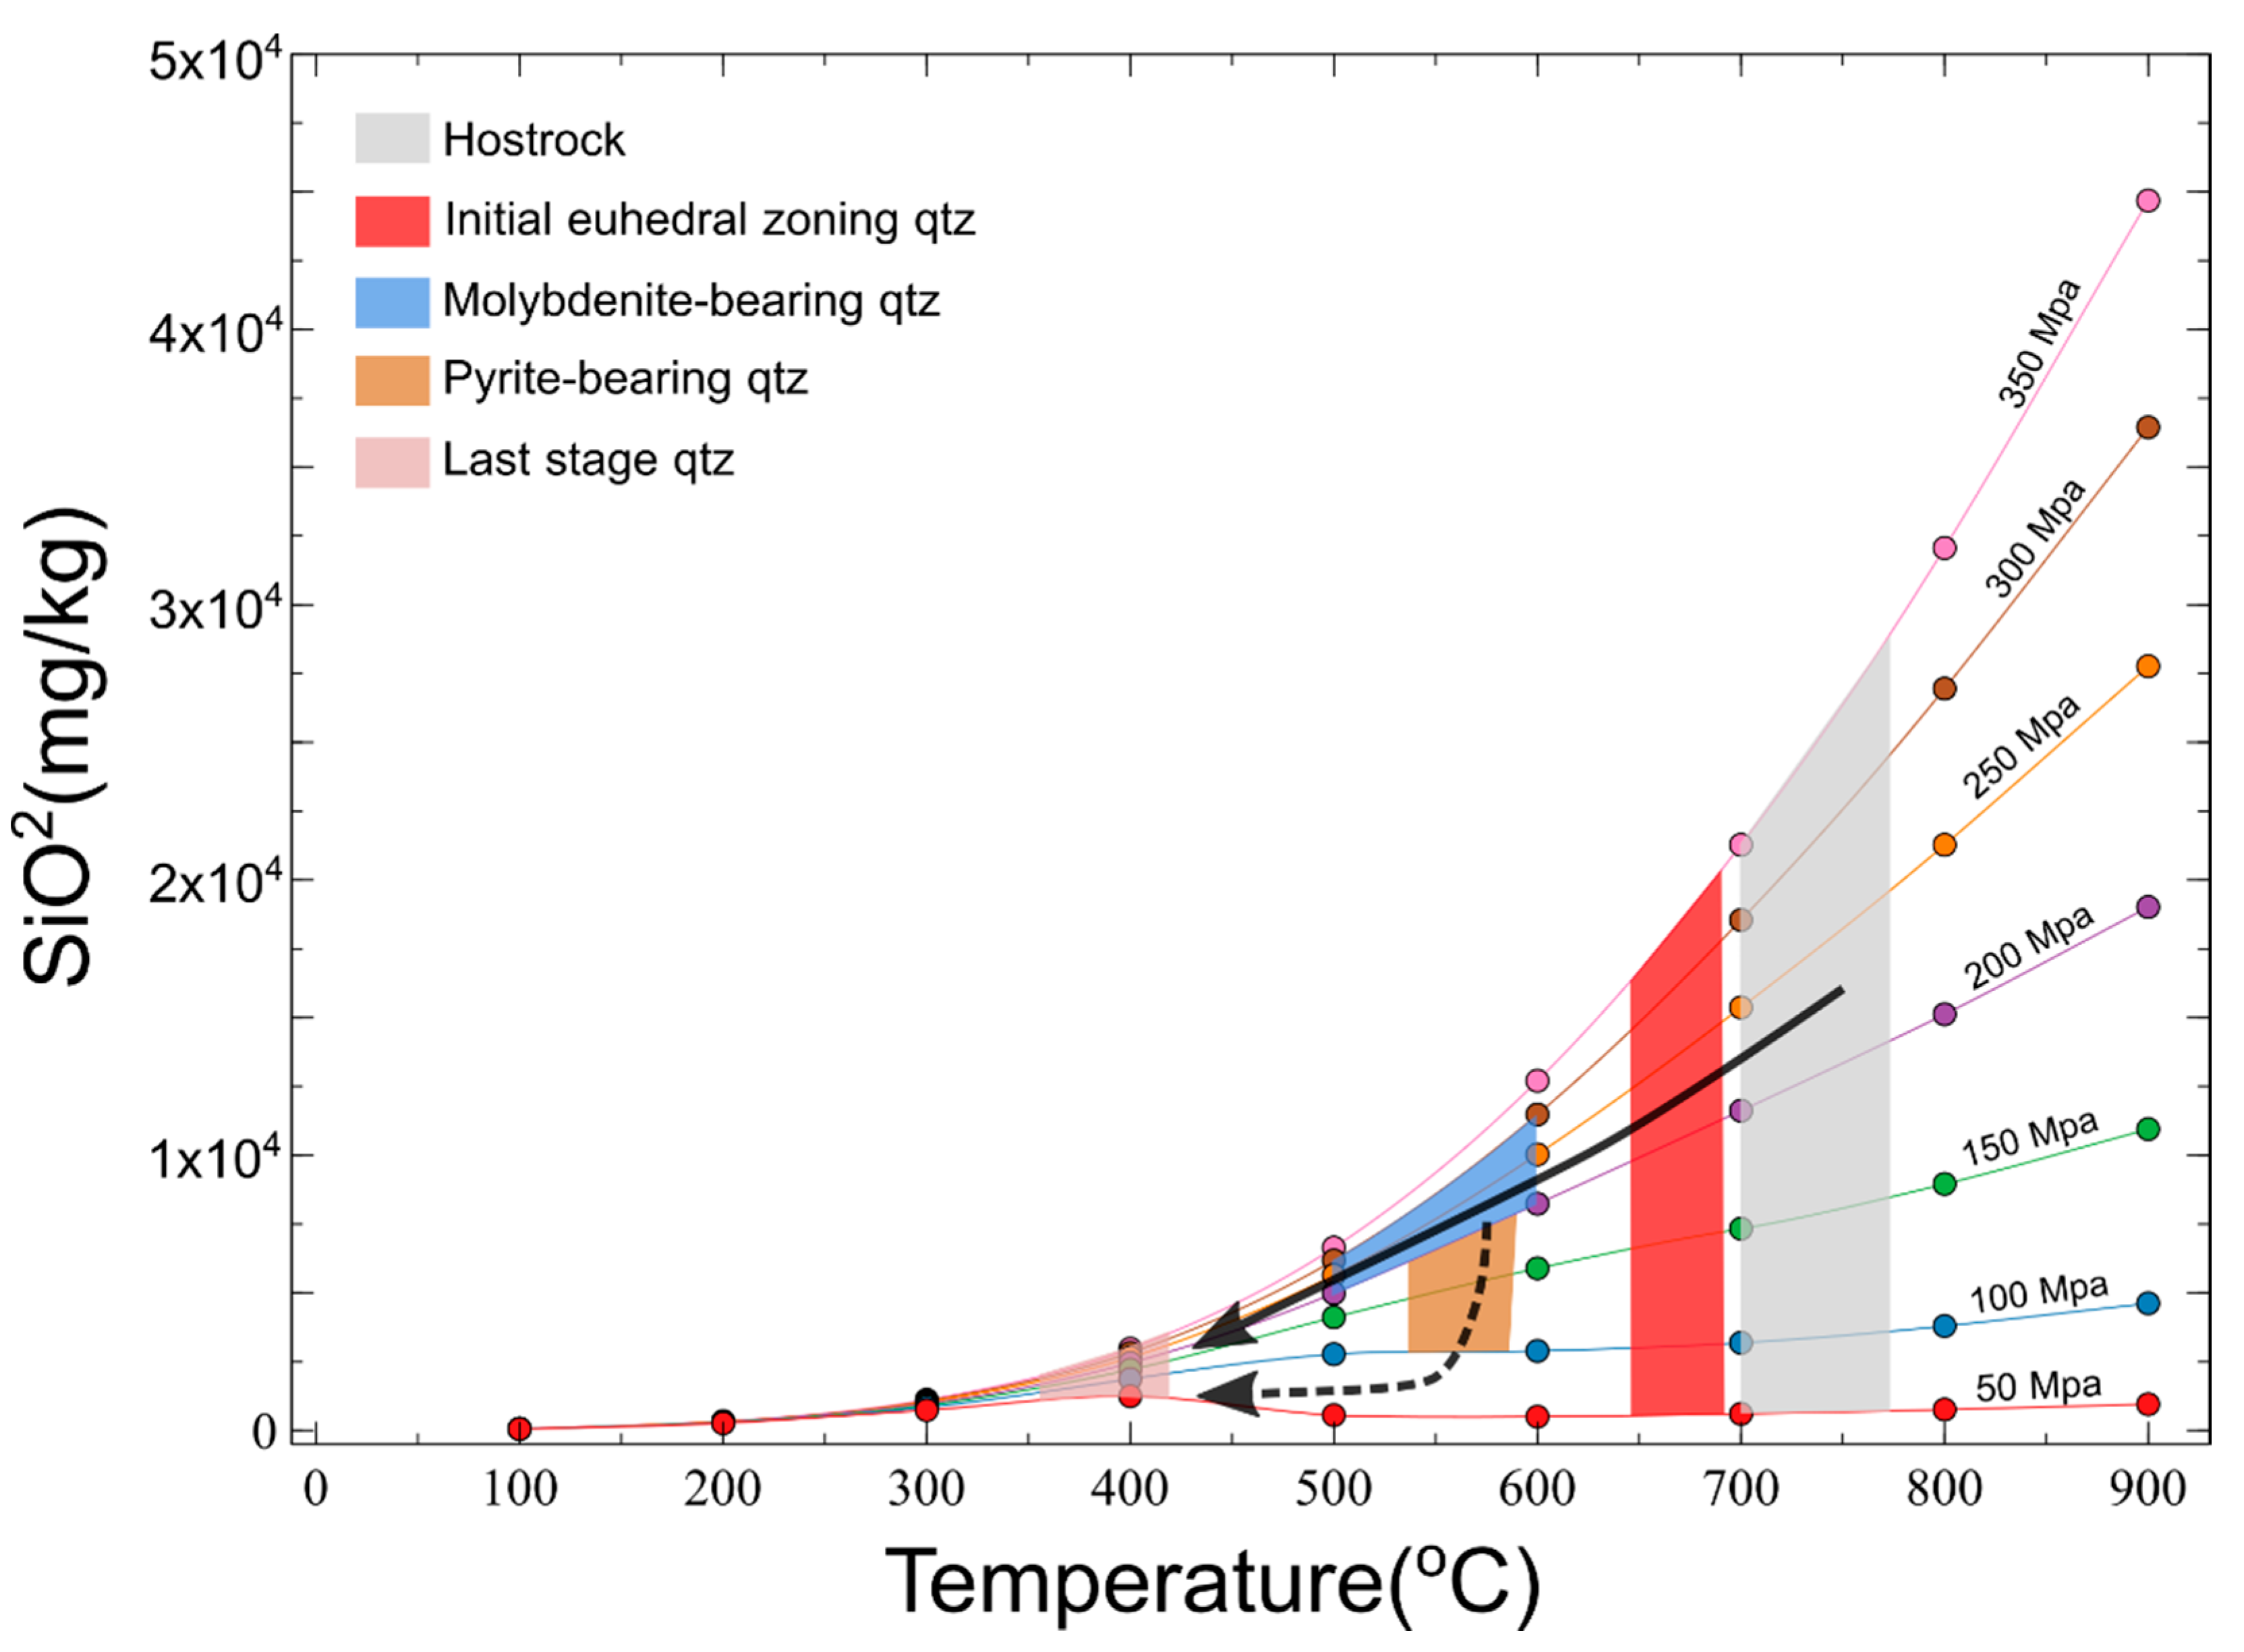
Porphyry copper deposits have distinctive characteristic veining and alteration patterns [31,32,33]. Systematic observations of the crosscutting relationships among veins the and textures within veins provide insights into fluid behavior, and quartz solubility models [39] have revealed fluid processes and evolution at individual porphyry deposits. At the Erdenet deposit, the magma chamber started to solidify and generate a crystal mush as the temperature decreased to ~700–800 °C after magma emplacement. Fluids released from crystallization processes (dehydration) moved upwards so that the cupola was saturated with fluid (Figure 11a). The initial pulses of magma injection caused fracturing in the host rock, and silica-saturated fluids percolated through these fractures to form the pre-mineralization quartz that grew from the vein walls (Figure 11b,e). This fluid might represent the magmatic fluid, based on the temperatures of 650–700 °C calculated for a high Ti activity (solid arrow in Figure 12).
The molybdenite and pyrite mineralization were formed from later fluids by one of two possible mechanisms as follows: (1) The mineralization of molybdenite and pyrite formed by later fluid processes possibly occurred in two scenarios. The first is that both molybdenite and pyrite were precipitated together. This mechanism is suggested by the occurrences of molybdenite and pyrite relating to fractures and grain boundaries (represent by CL-dark). Additionally, the fractures cut the primary oscillatory zoning of qtz, which we assume as the initial fluid activity in Erdenet. Moreover, the temperature inferred for the mineralization related to the CL-dark quartz is close to 600 °C (Figure 11f). Mineral precipitation might have been induced by fluid decompression after the initial pulse of magma. Meanwhile, the fluid temperature decreased and fluids were released episodically into the existing fracture network, where they precipitated quartz and sulfides (dashed arrow Figure 12). (2) Molybdenite was precipitated first from the cooling fluid, followed by pyrite. However, regardless of the precise mechanism, we infer that these minerals were precipitated within a lithostatic pressure regime from supercritical fluids.
The final stages of fluid activity in this system involved the precipitation of qtz veins. The continued cooling and retreat of the magmatic front away from the position of initial emplacement to deeper parts of the system [3,40] are associated with a shift towards a hydrostatic pressure regime. The prograde quartz solubility caused the precipitation of qtz veins and related CL-dark quartz ± calcite (Figure 11g). The CL images show that the fluid generated intense fractures within the veins and intact rock at all stages. Fracturing might record infiltration by over-pressured fluid, whereby the build-up of pressure within the cooling pluton generated additional fluids that were transported into the cupola (Figure 11c). This process caused the injection of fluids into the surrounding rocks, which was controlled by the existing fractures [41]. This mechanism was associated with transient fluid pressure changes during the shift from a lithostatic to a hydrostatic fluid pressure regime (Figure 11d) [5].
7. Conclusions
We investigated the magmatic–hydrothermal system recorded by a porphyry Cu–Mo deposit in the Erdenet area of northern Mongolia. The characteristic features of the vein systems are as follows.
- The veins of the Erdenet deposit are divided into three types: qtz–mol veins, qtz–py veins, and monomineralic qtz veins. Crosscutting relationships reveal that the order of formation was qtz–mol veins (stage 1), qtz–py veins (stage 2), and qtz veins (stage 3).
- Euhedral quartz grains with oscillatory zoning grew from both side walls of the qtz–mol and qtz–py veins. There is no clear zoning within the monomineralic qtz veins. All the vein types are cut by a network of late CL-dark quartz veins.
- Ti-in-quartz and Ti-in-biotite thermometry records temperatures of 700–750 °C for the host rock, 650–700 °C for the earliest quartz, and ~600 °C for the mineralization-bearing quartz. Fluid inclusion thermometry records homogenization temperatures of 180–325 °C for the qtz–mol veins, 147–360 °C for the qtz–py veins, and 108–245 °C for the monomineralic qtz veins. Assuming a salinity of 0–25%, the stage 1 veins are estimated to have formed at 2–3 kbar and the stage 2 veins at 1–2 kbar.
- Fluids within the Erdenet deposit evolved from high-temperature fluids at moderate pressures to low-temperature fluids at lower pressures.
- Transient fluid transport phenomena occurred within the Erdenet deposit as the fluid pressure regime shifted from lithostatic to near hydrostatic. The fluid injection was caused by the development of a fluid-saturated region under the cupola during the formation of the Erdenet deposit.
Supplementary Materials
Complete microprobe analysis used to calculate of Ti-in-quartz and Ti-in-biotite Geothermometers are available online at https://www.mdpi.com/2076-3263/10/5/201/s1.
Author Contributions
N.T. conducted the fieldwork and contributed to discussions during the manuscript preparation. G.A. prepared the samples and obtained petrological and geochemical data by EPMA, assisted by M.U., who also evaluated the data. A.O. assisted with the SEM–CL and fluid inclusion study. G.A. wrote the manuscript, supervised by N.T., A.O., and M.U. This paper is part of the first author’s Masters project. All authors have read and agreed to the published version of the manuscript.
Funding
This research was funded by SATREPS project by JICA-JST.
Acknowledgments
We thank Gerel Orchir, Baatar Munkhtsengel, and Batkhishig Bayaraa of the Mongolian University of Science and Technology for kindly providing us with samples from Erdenet and the surrounding area and for assistance with geological fieldwork.
Conflicts of Interest
The authors declare that there is no conflict of interest that could have influenced the work and results of this paper.
References
- Fournier, R.O. Hydrothermal processes related to movement of fluid from plastic into brittle rock in the magmatic-epithermal environment. Econ. Geol. 1999, 94, 1193–1211. [Google Scholar] [CrossRef]
- Foumier, R.O. The transition from hydrostatic to greater than hydrostatic fluid pressure in presently ac-tive continental hydrothermal systems in crystalline rock. Geophys. Res. Lett. 1991, 18, 955–958. [Google Scholar] [CrossRef]
- Burnham, C.W. Magmas and hydrothermal fluids. In Geochemistry of Hydrothermal Ore Deposits; Barnes, H.L., Ed.; John Wiley & Sons: New York, NY, USA, 1979; pp. 71–136. [Google Scholar]
- Cox, S. Injection-Driven Swarm Seismicity and Permeability Enhancement: Implications for the Dynamics of Hydrothermal Ore Systems in High Fluid-Flux, Overpressured Faulting Regimes—An Invited Paper. Econ. Geol. 2016, 111, 559–587. [Google Scholar] [CrossRef]
- Tsuchiya, N.; Yamada, R.; Uno, M. Supercritical geothermal reservoir revealed by a granite–porphyry sys-tem. Geothermics 2016, 63, 182–194. [Google Scholar] [CrossRef]
- Weatherley, D.K.; Henley, R.W. Flash vaporization during earthquakes evidenced by gold deposits. Nat. Geosci. 2013, 6, 294–298. [Google Scholar] [CrossRef]
- Amagai, T.; Okamoto, A.; Niibe, T.; Hirano, N.; Motomiya, K.; Tsuchiya, N. Silica nanoparticles produced by explosive flash vaporization during earthquakes. Sci. Rep. 2019, 9, 9738. [Google Scholar] [CrossRef] [PubMed]
- Yoshida, K.; Hasegawa, A. Sendai-Okura earthquake swarm induced by the 2011 Tohoku-Oki earthquake in the stress shadow of NE Japan: Detailed fault structure and hypocenter migration. Tectonophysics 2018, 733, 132–147. [Google Scholar] [CrossRef]
- Okada, T.; Matsuzawa, T.; Umino, N.; Yoshida, K.; Hasegawa, A.; Takahashi, H.; Yamada, T.; Kosuga, M.; Takeda, T.; Kato, A. Hypocenter migration and crustal seismic velocity distribution observed for the inland earthquake swarms induced by the 2011 Tohoku–Oki earthquake in NE Japan: Implications for crustal flu-id distribution and crustal permeability. Geofluids 2015, 15, 293–309. [Google Scholar] [CrossRef]
- Sibson, R.H. Earthquake rupturing as a mineralizing agent in hydrothermal systems. Geology 1987, 15, 701. [Google Scholar] [CrossRef]
- Manning, C.E.; Ingebritsen, S.E. Permeability of the continental crust: Implications of geothermal data and metamorphic systems. Rev. Geophys. 1999, 37, 127–150. [Google Scholar] [CrossRef]
- Friðleifsson, G.Ó.; Pálsson, B.; Stefánsson, B.; Albertsson, A.; Gunnlaugsson, E.; Ketilsson, J.; Lamarche, R.; Andersen, P.E. Iceland Deep Drilling Project. The first IDDP drill hole drilled and completed in 2009. In Proceedings of the World Geothermal Congress 2010, Bali, Indonesia, 25–30 April 2010. [Google Scholar]
- Weis, P.; Driesner, T.; Heinrich, C.A. Porphyry-Copper Ore Shells Form at Stable Pressure-Temperature Fronts Within Dynamic Fluid Plumes. Science 2012, 338, 1613–1616. [Google Scholar] [CrossRef] [PubMed] [Green Version]
- Khasin, R.A.; Marinov, N.A.; Khurtz, C.; Yakimov, L.I. The copper–molybdenum deposit at Erdenetiin Ovoo in northern Mongolia. Geol. Ore Depos. 1977, 6, 3–15. [Google Scholar]
- Gerel, O.; Munkhtsengel, B. Erdenetiin Ovoo Porphyry Copper—Molybdenum Deposit in Northern Mongo-Lia. Geodynamics and Metallogeny of Mongolia with a Special Emphasis on Copper and Gold Deposits; CERCAMS Natural History Museum: London, UK, 2005; Volume 85, p. 103. [Google Scholar]
- Sotnikov, V.I.; Ponomarchuk, V.A.; Shevchenko, D.O.; Berzina, A.P. The Erdenetiyn-Ovoo porphyry Cu–Mo deposit, Northern Mongolia: Ar-40/Ar-39 geochronology and factors of large-scale mineralization. Russ. Geol. Geophys. 2005, 46, 620–631. [Google Scholar]
- Munkhtsengel, B. Magmatic and Mineralization Processes of the Erdenetiin Ovoo Porphyry Copper-Molybdenum Deposit and Environmental Assessment, Northern Mongolia. Ph.D. Thesis, Tohoku University, Miyagi, Japan, 2007. [Google Scholar]
- Kavalieris, I.; Khashgerel, B.-E.; Morgan, L.E.; Undrakhtamir, A.; Borohul, A. Characteristics and 40Ar/39Ar Geochronology of the Erdenet Cu-Mo Deposit, Mongolia. Econ. Geol. 2017, 112, 1033–1054. [Google Scholar] [CrossRef]
- Watanabe, Y.; Stein, H.J. Re-Os ages for the Erdenet and Tsagaan Suvarga porphyry Cu–Mo deposits, Mongolia, and tectonic implications. Econ. Geol. 2000, 95, 1537–1542. [Google Scholar] [CrossRef]
- Dejidmaa, G.; Naito, K. Previous studies on the Erdenetiin ovoo porphyry copper-molybdenum deposit, Mongolia. Bull. Geol. Surv. Jpn. 1998, 49, 299–308. [Google Scholar]
- Berzina, A.P.; Sotnikov, V.I. Character of formation of the Erdenet-Ovoo porphyry Cu-Mo magmatic cen-ter (northern Mongolia) in the zone of influence of a Permo-Triassic plume. Russ. Geol. Geophys. 2007, 48, 141–156. [Google Scholar] [CrossRef]
- Rusk, B.; Reed, M. Scanning electron microscope–cathodoluminescence analysis of quartz reveals complex growth histories in veins from the Butte porphyry copper deposit, Montana. Geology 2002, 30, 727. [Google Scholar] [CrossRef]
- Rusk, B.G.; Lowers, H.A.; Reed, M.H. Trace elements in hydrothermal quartz: Relationships to cathodoluminescent textures and insights into vein formation. Geology 2008, 36, 547. [Google Scholar] [CrossRef]
- Kretz, R. Symbols for rock-forming minerals. Am. Mineral. 1983, 68, 277–279. [Google Scholar]
- Okamoto, A.; Sekine, K. Textures of syntaxial quartz veins synthesized by hydrothermal experiments. J. Struct. Geol. 2011, 33, 1764–1775. [Google Scholar] [CrossRef]
- Wark, D.A.; Watson, E.B. TitaniQ: A titanium-in-quartz geothermometer. Contrib. Mineral. Petrol. 2006, 152, 743–754. [Google Scholar] [CrossRef]
- Huang, R.; Audétat, A. The titanium-in-quartz (TitaniQ) thermobarometer: A critical examination and re-calibration. Geochim. Cosmochim. Acta 2012, 84, 75–89. [Google Scholar] [CrossRef]
- Henry, D.J.; Guidotti, C.V.; Thomson, J.A. The Ti-saturation surface for low-to-medium pressure metape-litic biotites: Implications for geothermometry and Ti-substitution mechanisms. Am. Mineral. 2005, 90, 316–328. [Google Scholar] [CrossRef]
- Mercer, C.N.; Reed, M.H. Porphyry Cu-Mo Stockwork Formation by Dynamic, Transient Hydrothermal Pulses: Mineralogic Insights from the Deposit at Butte, Montana. Econ. Geol. 2013, 108, 1347–1377. [Google Scholar] [CrossRef]
- Penniston-Dorland, S.C. Illumination of vein quartz textures in a porphyry copper ore deposit using scanned cathodoluminescence: Grasberg Igneous Complex, Irian Jaya, Indonesia. Am. Mineral. 2001, 86, 652–666. [Google Scholar] [CrossRef]
- Gustafson, L.B.; Hunt, J.P. The porphyry copper deposit at El Salvador, Chile. Econ. Geol. 1975, 70, 857–912. [Google Scholar] [CrossRef]
- Lowell, J.D.; Guilbert, J.M. Lateral and vertical alteration-mineralization zoning in porphyry ore depos-its. Econ. Geol. 1970, 65, 373–408. [Google Scholar] [CrossRef]
- Sillitoe, R.H. Porphyry Copper Systems. Econ. Geol. 2010, 105, 3–41. [Google Scholar] [CrossRef] [Green Version]
- Goldstein, H.R.; Reynolds, T.J. Systematics of Fluid Inclusions in Diagenetic Minerals; SEPM Short Course; SEPM Society for Sedimentary Geology: Tulsa, OK, USA, 1994; pp. 31–99. [Google Scholar]
- Bodnar, R.J.; Vityk, M.O. Fluid Inclusions in Minerals: Methods and Applications; Pontignano: Siena, Italy, 1994; pp. 117–130. [Google Scholar]
- Goldstein, R.H.; Samson, I. Petrographic analysis of fluid inclusions. In Fluid Inclusions: Analysis and InterPretation; Mineralogical Asscociation of Canada: Québec, QC, Canada, 2003; pp. 9–53. [Google Scholar]
- Wilkinson, J.J.; Johnston, J.D. Pressure fluctuations, phase separation, and gold precipitation during seismic fracture propagation. Geology 1996, 24, 395. [Google Scholar] [CrossRef]
- Yardley, B.W.; Bodnar, R.J. Fluids in the Continental Crust. Geochem. Perspect. 2014, 3, 1–127. [Google Scholar] [CrossRef] [Green Version]
- Akinfiev, N.N.; Diamond, L.W. A simple predictive model of quartz solubility in water–salt–CO2 sys-tems at temperatures up to 1000 C and pressures up to 1000 MPa. GCA 2009, 73, 1597–1608. [Google Scholar]
- Scott, S.; Driesner, T.; Weis, P. The thermal structure and temporal evolution of high-enthalpy geother-mal systems. Geothermics 2016, 62, 33–47. [Google Scholar] [CrossRef] [Green Version]
- Ingebritsen, S.E.; Manning, C.E. Permeability of the continental crust: Dynamic variations inferred from seismicity and metamorphism. Geofluids 2010, 10, 193–205. [Google Scholar] [CrossRef]
Figure 1.
Geology and structure of the Erdenet deposit, modified after [20]. Insert shows the location of Paleozoic magmatic belts and the study area within the outline of Mongolia. (a) Geological map. (b) Schematic cross-section through the deposit, showing multiple stages of intrusion.
Figure 1.
Geology and structure of the Erdenet deposit, modified after [20]. Insert shows the location of Paleozoic magmatic belts and the study area within the outline of Mongolia. (a) Geological map. (b) Schematic cross-section through the deposit, showing multiple stages of intrusion.

Figure 2.
Simplified core log and representative hand specimens, with sampling depths shown. (a) Quartz porphyry. (b) Tonalite/granodiorite porphyry.
Figure 2.
Simplified core log and representative hand specimens, with sampling depths shown. (a) Quartz porphyry. (b) Tonalite/granodiorite porphyry.

Figure 3.
(a) Photomicrograph of sericitized quartz porphyry (221 m depth), cross-polarized light. (b) Backscattered electron (BSE) image of quartz porphyry and vein. (c) Tonalite/granodiorite porphyry (567 m depth), plane-polarized light. (d) Representative BSE image of the sample shown in (c). Mineral abbreviations are after [24].

Figure 4.
Photographs of the three vein types of the Erdenet deposit. (a) Quartz–molybdenite vein cut by later veins, (b) Quartz–pyrite vein cut by the later qtz vein. (c) Quartz vein within the quartz porphyry. (d) Sketch of samples showing analytical spots and crosscutting relationships among vein generations on tonalite/granodiorite porphyry.

Figure 5.
Images of veins. (a) Crystallographic orientation in cross-polarized light of the qtz–mol vein. (b) SEM–cathodoluminescence (CL) image of the qtz–mol vein shown in (a). (c,d) SEM–CL images of the qtz–py veins showing Ti analyses and temperatures. (e,f) SEM–CL images of the qtz veins showing Ti analyses and temperatures.

Figure 6.
(a,b) Temperatures estimated using the Ti-in-biotite geothermometer of [26] (apfu = atom per formula unit). The host rock records temperatures of 700–750 °C. (c,d) Temperatures estimated using the Ti-in-quartz geothermometer. The quartz phenocrysts record temperatures of 400–750 °C.
Figure 6.
(a,b) Temperatures estimated using the Ti-in-biotite geothermometer of [26] (apfu = atom per formula unit). The host rock records temperatures of 700–750 °C. (c,d) Temperatures estimated using the Ti-in-quartz geothermometer. The quartz phenocrysts record temperatures of 400–750 °C.

Figure 7.
Representative qtz–mol vein. (a) SEM–CL image. (b) BSE image showing Ti analyses. The estimated temperature is shown in parentheses. (c) Ti and Al concentrations of quartz. (d,e) Trace element maps showing a positive relationship between CL-brightness, Ti, and Al.
Figure 7.
Representative qtz–mol vein. (a) SEM–CL image. (b) BSE image showing Ti analyses. The estimated temperature is shown in parentheses. (c) Ti and Al concentrations of quartz. (d,e) Trace element maps showing a positive relationship between CL-brightness, Ti, and Al.

Figure 8.
(a) Ti concentrations of quartz phenocrysts and vein quartz from the Erdenet deposit. (b) Minimum temperature of quartz vein formation calculated using the model of [28]. D.L. = detection limit.
Figure 8.
(a) Ti concentrations of quartz phenocrysts and vein quartz from the Erdenet deposit. (b) Minimum temperature of quartz vein formation calculated using the model of [28]. D.L. = detection limit.

Figure 9.
(a,b). Homogenization temperatures and fluid compositions of stage 1–3 veins. (c) Photomicrograph of representative fluid inclusions (plane-polarized light).
Figure 9.
(a,b). Homogenization temperatures and fluid compositions of stage 1–3 veins. (c) Photomicrograph of representative fluid inclusions (plane-polarized light).

Figure 10.
Estimated pressures of vein formation at the Erdenet deposit. Temperatures are derived from the Ti-in-quartz geothermometer, and the isochores correspond to salinities of 0–25 wt% [35].
Figure 10.
Estimated pressures of vein formation at the Erdenet deposit. Temperatures are derived from the Ti-in-quartz geothermometer, and the isochores correspond to salinities of 0–25 wt% [35].

Figure 11.
Schematic model of the evolution of magmatic–hydrothermal fluids at the Erdenet deposit and illustration of the crystallization of various quartz veins. Initial magmatic fluid accumulated at the cupola (a). Magmatic pulse (b) induced the precipitation of the initial euhedral zoning quartz, which has a temperature close to the host rock (e). Precipitation of the initial quartz sealed the fracture and increased the fluid pressure. Episodic transience occurred and the fluid was reinjected into the existing fracture, followed by the precipitation of mineralization-bearing quartz (f). In the final stages, the magmatic front descends (c,d) and the quartz veins precipitate and cut previous generations of veins with cooler temperatures (hydrothermal system) (g).

Figure 12.
Evolution of supercritical fluid based on inferred pressures and temperatures (solid and dashed arrow are the inferred P-T path) and the model of quartz solubility in H2O [40]. Two possible scenarios are presented here. The solid arrow represents the magmatic fluid upon gradual cooling that precipitated various quartz vein stages. The dashed arrow depicts a second scenario, where the decompression of the initial fluid takes place and induces the precipitation of mineralization-bearing quartz. Both mechanisms will tend to decrease at lower temperatures and precipitate the last stage of the qtz vein.


Table 1.
Compositions of quartz phenocrysts in the host granodiorite porphyry (number in parentheses next to each analysis represents 1σ and given in the term of the least unit cited; n.d. = not detected).
Table 1.
Compositions of quartz phenocrysts in the host granodiorite porphyry (number in parentheses next to each analysis represents 1σ and given in the term of the least unit cited; n.d. = not detected).
| Sample No. | SiO2 (wt%) | Al (ppm) | Ti (ppm) | Ti-in-Quartz (°C) | ||
|---|---|---|---|---|---|---|
| Wark & Watson | Huang & Audétat | |||||
| Er-24 | qtzHr1-1 | 100.23 | n.d. | 96 (5) | 742 (6) | 702 (6) |
| qtzHr1-2 | 99.77 | 829 (53) | 9 (5) | 522 (33) | 489 (32) | |
| qtzHr1-3 | 100.23 | n.d. | n.d. | - | - | |
| qtzHr1-4 | 98.72 | 95 (52) | 114 (5) | 763 (5) | 722 (5) | |
| qtzHr1-5 | 100.53 | n.d. | 18 (5) | 575 (21) | 539 (21) | |
| qtzHr2-1 | 100.29 | n.d. | n.d. | - | - | |
| qtzHr2-2 | 100.72 | n.d. | 9 (5) | 525 (33) | 492 (32) | |
| qtzHr2-3 | 100.72 | n.d. | 49 (5) | 669 (10) | 631 (10) | |
| qtzHr2-4 | 100.79 | 14 (50) | 13 (5) | 552 (26) | 518 (25) | |
| qtzHr2-5 | 100.60 | 20 (51) | 20 (5) | 583 (20) | 548 (19) | |
Table 2.
Representative biotite compositions (wt%) used for Ti-in-biotite geothermometry [28]. Numbers in parentheses next to each analysis represent 1σ and given in terms of least unit cited; n.d. = not detected.
Table 2.
Representative biotite compositions (wt%) used for Ti-in-biotite geothermometry [28]. Numbers in parentheses next to each analysis represent 1σ and given in terms of least unit cited; n.d. = not detected.
| Biotite_1-1 | Biotite_1-2 | Biotite_1-3 | Biotite_1-4 | Biotite_2-1 | Biotite_2-2 | Biotite_2-3 | Biotite_2-4 | |
|---|---|---|---|---|---|---|---|---|
| 39.09 (0.21) | 39.23 (0.21) | 39.72 (0.21) | 39.09 (0.21) | 39.30 (0.21) | 38.77 (0.21) | 39.40 (0.21) | 39.27 (0.21) | |
| 2.04 (0.07) | 2.26 (0.07) | 1.93 (0.07) | 1.80 (0.07) | 2.45 (0.08) | 2.18 (0.07) | 2.05 (0.07) | 2.26 (0.08) | |
| 17.14 (0.15) | 16.29 (0.15) | 17.28 (0.15) | 17.46 (0.15) | 16.45 (0.15) | 17.15 (0.15) | 17.86 (0.15) | 17.20 (0.15) | |
| 7.87 (0.12) | 7.97 (0.12) | 7.63 (0.12) | 7.69 (0.12) | 8.08 (0.13) | 7.47 (0.12) | 7.16 (0.12) | 7.77 (0.13) | |
| MnO | 0.54 (0.08) | 0.50 (0.08) | 0.44 (0.08) | 0.39 (0.07) | 0.33 (0.07) | 0.39 (0.08) | 0.47 (0.07) | 0.53 (0.07) |
| MgO | 17.85 (0.17) | 17.65 (0.17) | 17.96 (0.17) | 18.25 (0.17) | 17.88 (0.17) | 18.16 (0.17) | 18.20 (0.17) | 18.05 (0.17) |
| CaO | 0.01 | n.d. | 0.01 | n.d. | n.d. | n.d. | n.d. | n.d. |
| Na2O | 0.18 (0.04) | 0.16 (0.04) | 0.20 (0.04) | 0.12 (0.04) | 0.11 (0.04) | 0.12 (0.04) | 0.04 (0.04) | 0.17 (0.04) |
| K2O | 11.20 (0.13) | 10.91 (0.13) | 11.45 (0.13) | 11.37 (0.13) | 11.12 (0.13) | 11.17 (0.13) | 11.75 (0.13) | 10.83 (0.13) |
| Total | 95.91 | 95.00 | 96.64 | 96.25 | 95.71 | 95.44 | 96.91 | 96.08 |
| Si | 5.64 | 5.71 | 5.68 | 5.61 | 5.68 | 5.61 | 5.61 | 5.64 |
| Ti (apfu) | 0.22 | 0.25 | 0.21 | 0.19 | 0.27 | 0.24 | 0.22 | 0.24 |
| Al | 2.92 | 2.79 | 2.91 | 2.96 | 2.80 | 2.93 | 3.00 | 2.91 |
| Fe2+ | 0.95 | 0.97 | 0.91 | 0.92 | 0.98 | 0.90 | 0.85 | 0.93 |
| Mn | 0.07 | 0.06 | 0.05 | 0.05 | 0.04 | 0.05 | 0.06 | 0.06 |
| Mg | 3.84 | 3.83 | 3.82 | 3.91 | 3.85 | 3.92 | 3.86 | 3.86 |
| Ca | n.d. | n.d. | n.d. | n.d. | n.d. | n.d. | n.d. | n.d. |
| Na | 0.05 | 0.05 | 0.06 | 0.03 | 0.03 | 0.03 | 0.01 | 0.05 |
| K | 2.06 | 2.03 | 2.09 | 2.08 | 2.05 | 2.06 | 2.13 | 1.98 |
| 0.80 | 0.80 | 0.81 | 0.81 | 0.80 | 0.81 | 0.82 | 0.81 | |
| T °C | 716 (3) | 729 (3) | 710 (3) | 701 (3) | 739 (2) | 730 (3) | 723 (3) | 738 (2) |
Table 3.
Representative trace element contents of quartz veins and minimum temperatures calculated using Ti-in-quartz geothermometry (number in parentheses next to each analysis represents 1σ and given in the term of the least unit cited; n.d. = not detected).
Table 3.
Representative trace element contents of quartz veins and minimum temperatures calculated using Ti-in-quartz geothermometry (number in parentheses next to each analysis represents 1σ and given in the term of the least unit cited; n.d. = not detected).
| Sample No. | SiO2 (wt%) | Al (ppm) | Ti (ppm) | Ti-in-Quartz (°C) | ||
|---|---|---|---|---|---|---|
| Wark & Watson | Huang & Audétat | |||||
| Qtz-mol vein | ||||||
| Er-24 | qtz-mol-2 | 99.11 | n.d. | 34 (5) | 634 (12) | 596 (12) |
| qtz-mol-6 | 100.55 | 31 (49) | 14 (5) | 556 (25) | 521 (24) | |
| qtz-mol-7 | 100.67 | 84 (48) | 40 (5) | 648 (11) | 611 (11) | |
| qtz-mol-13 | 99.33 | 51 (49) | n.d. | - | - | |
| qtz-mol-14 | 99.33 | 1463 (56) | n.d. | - | - | |
| qtz-mol-17 | 100.03 | 97 (50) | 6 (5) | 493 (44) | 460 (43) | |
| (qtz-mol) Line 5 | 100.45 | 140 (49) | 24 (5) | 601 (17) | 564 (17) | |
| (qtz-mol) Line 9 | 100.45 | 30 (50) | 13 (5) | 552 (26) | 517 (25) | |
| (qtz-mol) Line 14 | 99.05 | n.d. | 82 (5) | 724 (7) | 684 (7) | |
| (qtz-mol) Line 15 | 100.84 | 167 (51) | n.d. | - | - | |
| Qtz-py vein | ||||||
| Er-24 | qtz-py-1 | 100.14 | 67 (49) | 69 (5) | 705 (8) | 666 (8) |
| qtz-py-3 | 100.07 | n.d. | 11 (5) | 540 (29) | 506 (28) | |
| qtz-py-6 | 99.94 | n.d. | 41 (5) | 650 (12) | 612 (11) | |
| qtz-py-10 | 100.05 | 49 (49) | n.d. | - | - | |
| qtz-py-13 | 100.21 | n.d. | 21 (5) | 588 (18) | 553 (17) | |
| Qtz vein | ||||||
| Er-22 | qtz-1 | 99.90 | 26 (49) | 10 (5) | 529 (32) | 495 (31) |
| qtz-5 | 100.01 | 34 (49) | n.d. | - | - | |
| qtz-7 | 99.92 | n.d. | n.d. | - | - | |
| qtz-9 | 100.15 | 56 (49) | n.d. | - | - | |
| qtz-11 | 99.91 | 654 (52) | n.d. | - | - | |
© 2020 by the authors. Licensee MDPI, Basel, Switzerland. This article is an open access article distributed under the terms and conditions of the Creative Commons Attribution (CC BY) license (http://creativecommons.org/licenses/by/4.0/).
Share and Cite
MDPI and ACS Style
Agroli, G.; Okamoto, A.; Uno, M.; Tsuchiya, N. Transport and Evolution of Supercritical Fluids During the Formation of the Erdenet Cu–Mo Deposit, Mongolia. Geosciences 2020, 10, 201. https://doi.org/10.3390/geosciences10050201
AMA Style
Agroli G, Okamoto A, Uno M, Tsuchiya N. Transport and Evolution of Supercritical Fluids During the Formation of the Erdenet Cu–Mo Deposit, Mongolia. Geosciences. 2020; 10(5):201. https://doi.org/10.3390/geosciences10050201
Chicago/Turabian StyleAgroli, Geri, Atsushi Okamoto, Masaoki Uno, and Noriyoshi Tsuchiya. 2020. "Transport and Evolution of Supercritical Fluids During the Formation of the Erdenet Cu–Mo Deposit, Mongolia" Geosciences 10, no. 5: 201. https://doi.org/10.3390/geosciences10050201
Note that from the first issue of 2016, this journal uses article numbers instead of page numbers. See further details here.