Understanding Historical Demographic Processes to Inform Contemporary Conservation of an Arid Zone Specialist: The Yellow-Footed Rock-Wallaby


Abstract
:1. Introduction
2. Methods
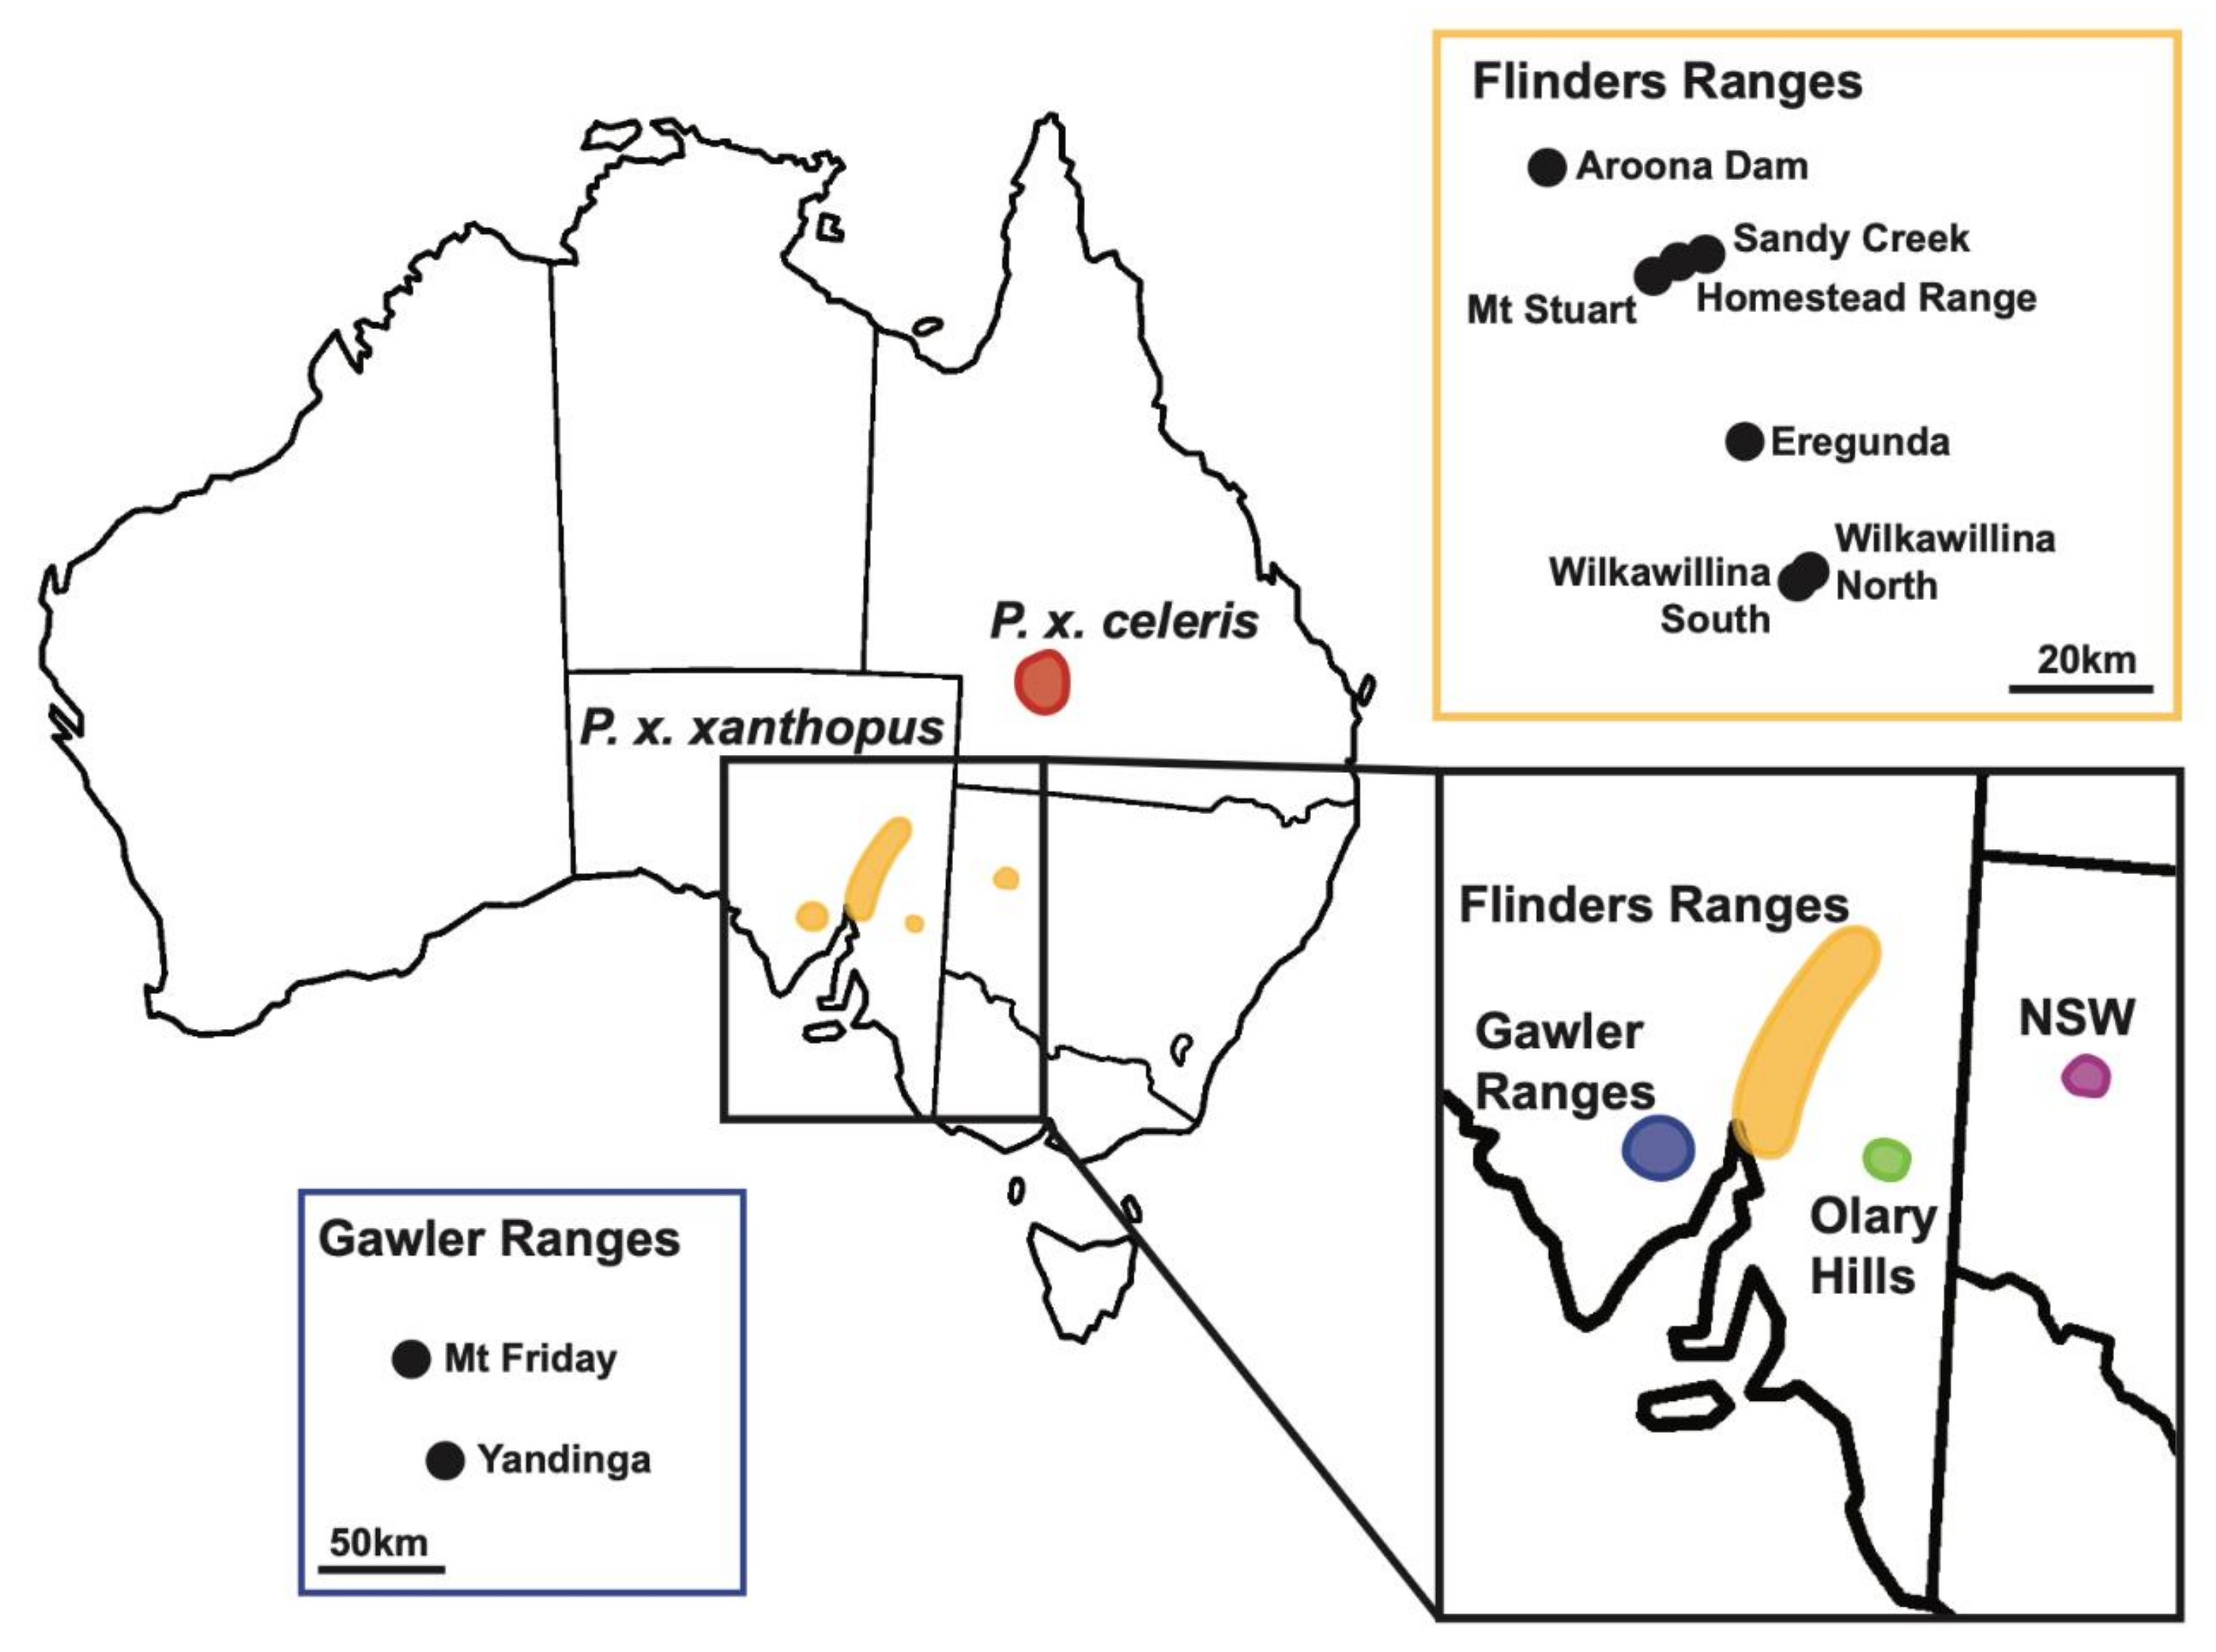
2.1. Study Area and Sampling
2.2. Molecular Analysis
2.2.1. Mitochondrial DNA (mtDNA)
2.2.2. Microsatellites
2.3. Data Analysis
2.3.1. Genetic Diversity and Population Structure
2.3.2. Relatedness Analyses
2.3.3. Population Differentiation
2.3.4. Demographic History Analyses
2.3.5. Migration Estimates and Connectivity
3. Results
3.1. Genetic Diversity and Population Structure
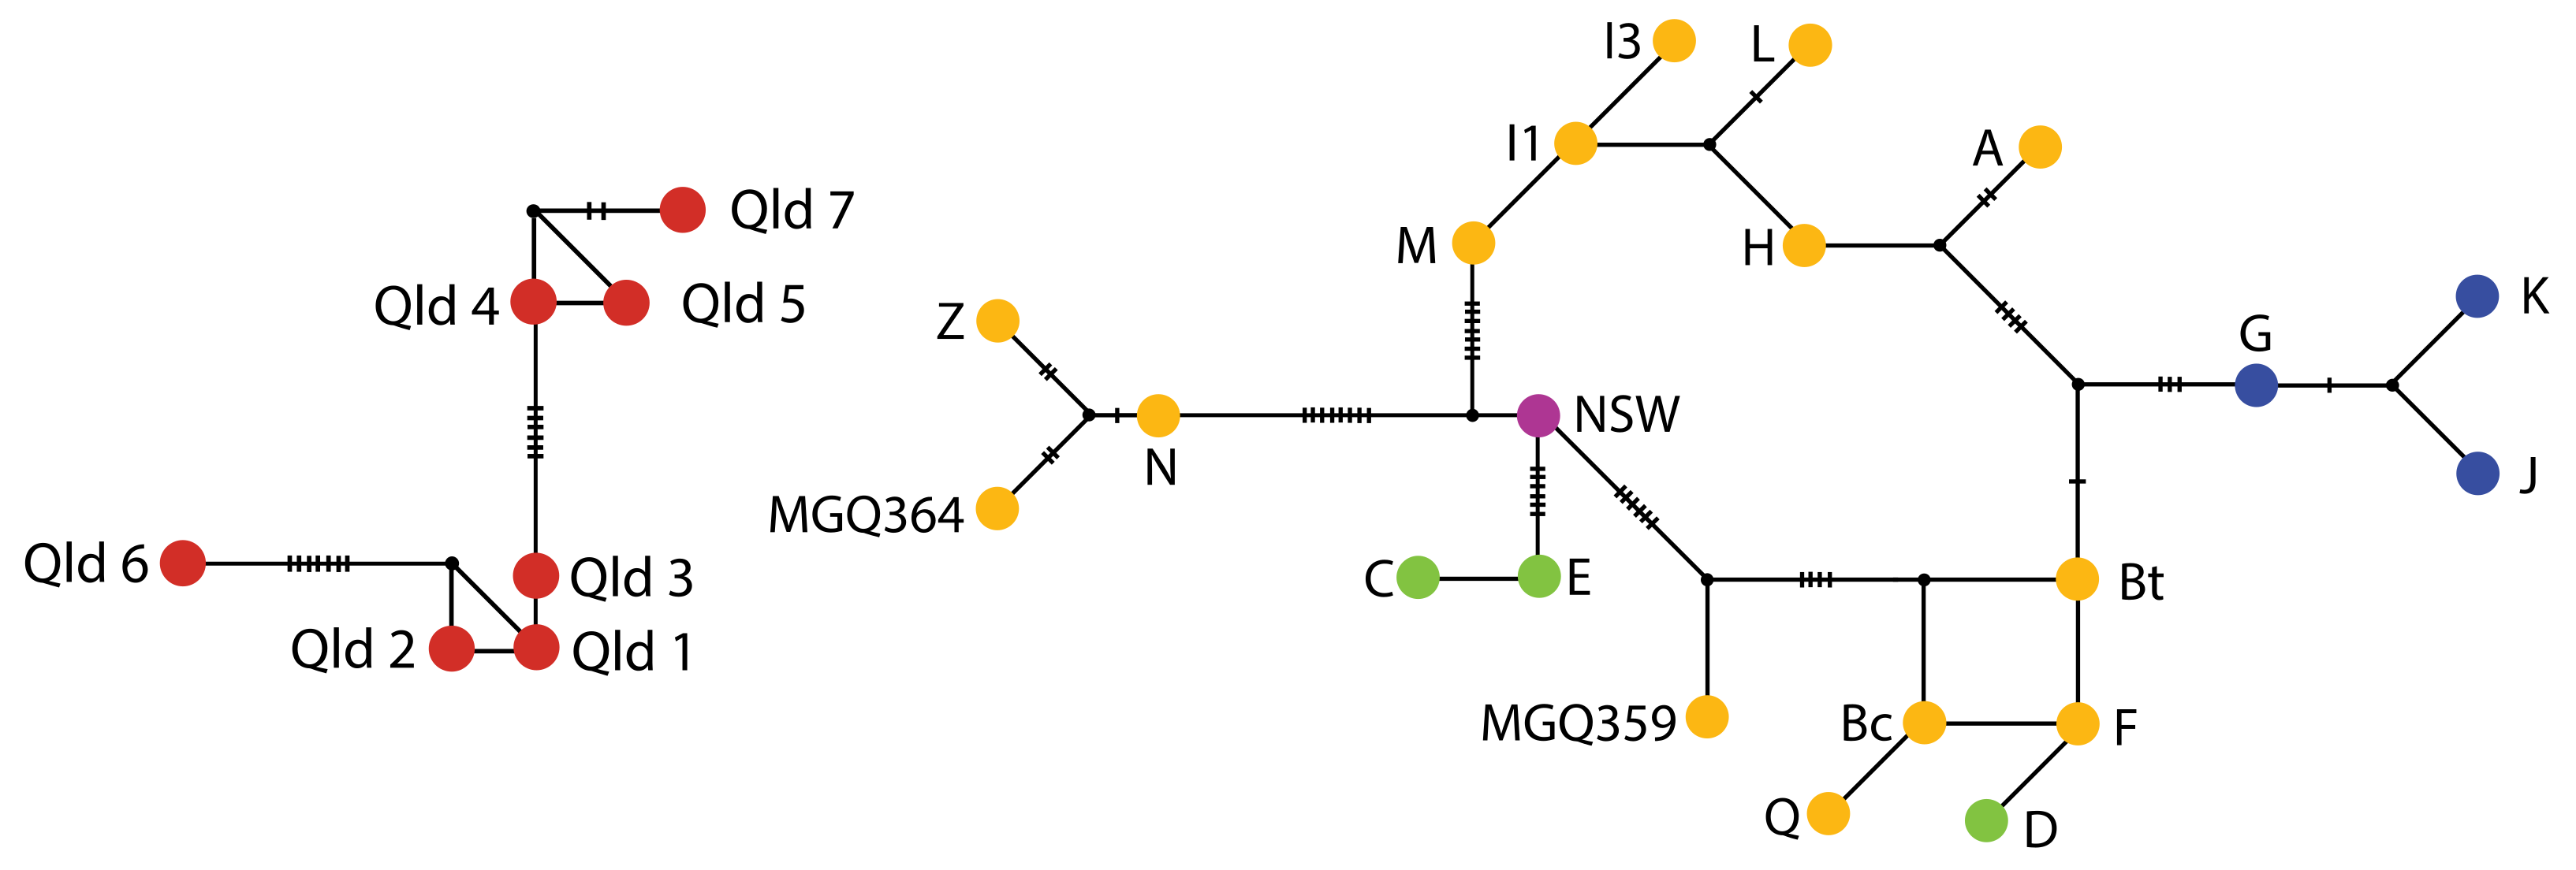
3.1.1. MtDNA
3.1.2. Microsatellites
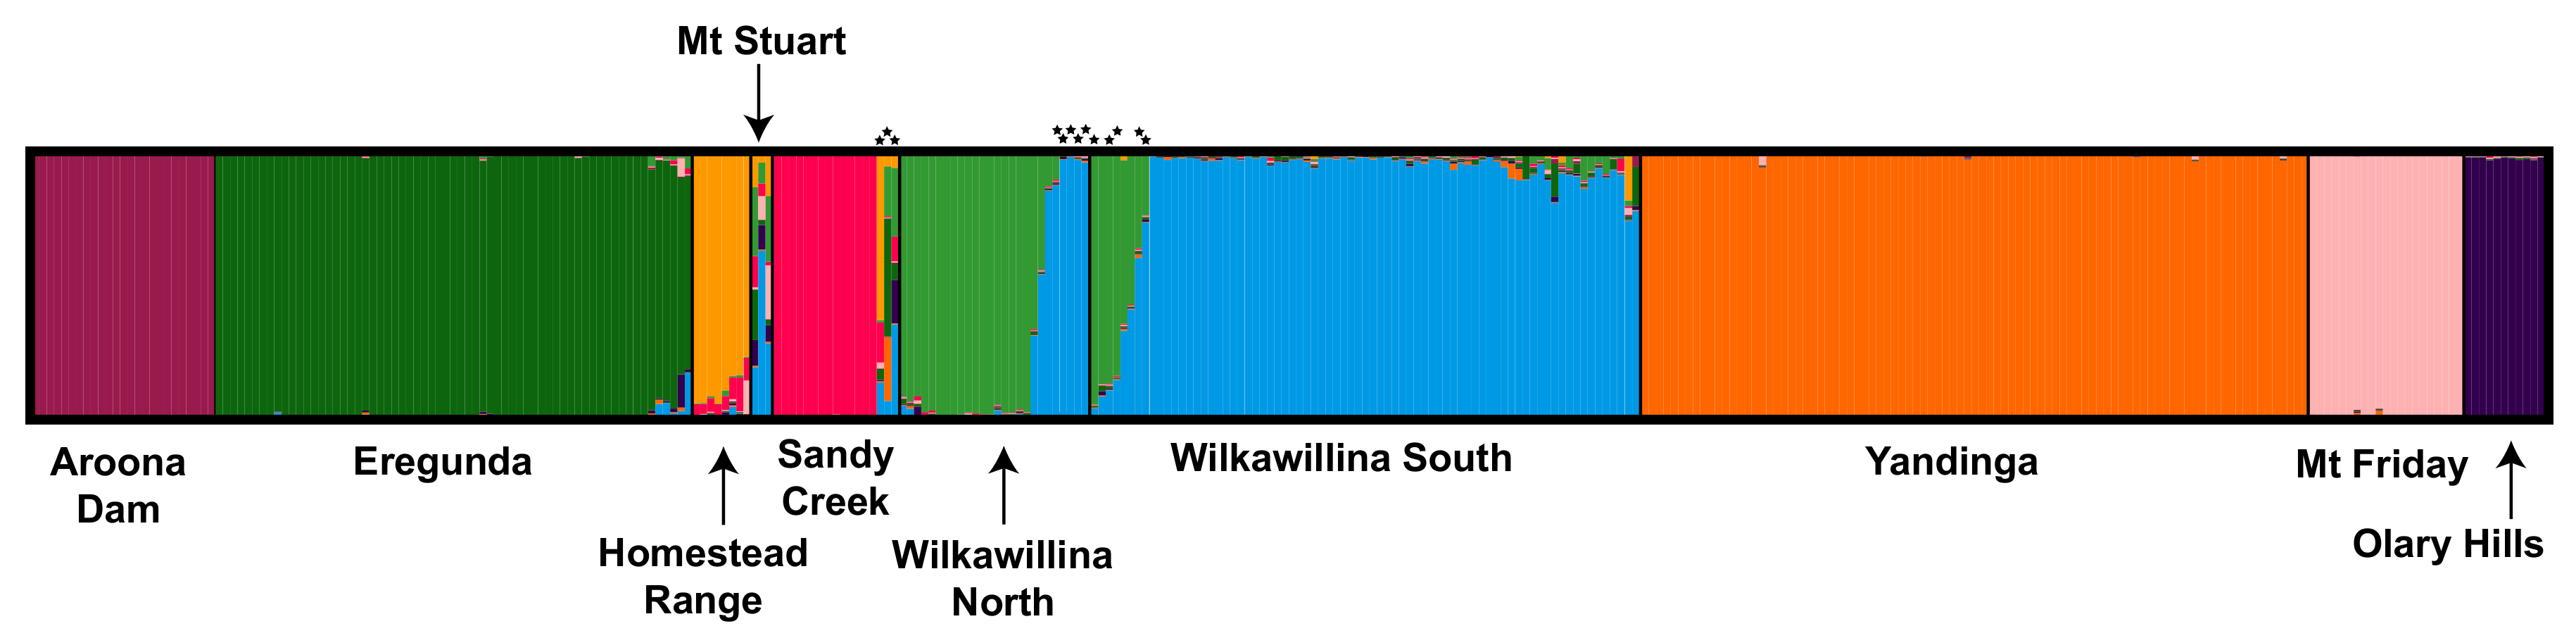
3.1.3. Population Structure
3.2. Relatedness
3.3. Population Differentiation
3.4. Demographic History
3.5. Migration and Connectivity
4. Discussion
4.1. Contemporary Population Structure and Genetic Diversity
4.2. Phylogeography and Historical Connectivity
4.3. Implications for Conservation Management of P. x. xanthopus
4.4. Moving Forward
5. Conclusions
Supplementary Materials
Author Contributions
Funding
Acknowledgments
Conflicts of Interest
Ethical Approval Code
References
- Wilson, M.C.; Chen, X.-Y.; Corlett, R.T.; Didham, R.K.; Ding, P.; Holt, R.D.; Holyoak, G.H.; Hughes, A.C.; Jiang, L.; Laurance, W.F.; et al. Habitat fragmentation and biodiversity conservation: Key findings and future challenges. Landscape Ecol. 2016, 31, 219–227. [Google Scholar] [CrossRef] [Green Version]
- Frankham, R. Genetics and extinction. Biol. Conserv. 2005, 126, 131–140. [Google Scholar] [CrossRef]
- Frankham, R.; Ballou, J.D.; Eldridge, M.D.B.; Lacy, R.C.; Ralls, K.; Dudash, M.R.; Fenster, C.B. Predicting the probability of outbreeding depression. Conserv. Biol. 2011, 25, 465–475. [Google Scholar] [CrossRef]
- Frankham, R.; Ballou, J.D.; Ralls, K.; Eldridge, M.D.B.; Dudash, M.R.; Fenster, C.B.; Lacy, R.C.; Sunnucks, P. Genetic Management of Fragmented Animal and Plant Populations; Oxford University Press: Oxford, UK, 2017; pp. 1–401. [Google Scholar]
- Carlson, S.M.; Cunningham, C.J.P.; Westley, P.A.H. Evolutionary rescue in a changing world. Trends Ecol. Evol. 2014, 29, 521–530. [Google Scholar] [CrossRef] [Green Version]
- Ralls, K.; Ballou, J.D.; Dudash, M.R.; Eldridge, M.D.B.; Fenster, C.B.; Lacy, R.C.; Sunnucks, P.; Frankham, R. Call for a paradigm shift in the genetic management of fragmented populations. Conserv. Lett. 2018, 11, e12412. [Google Scholar] [CrossRef]
- Pierson, J.C.; Coates, D.J.; Oostermeijer, J.G.B.; Beissinger, S.R.; Bragg, J.G.; Sunnucks, P.; Schumaker, N.H.; Young, A.G. Genetic factors in threatened species recovery plans on three continents. Front. Ecol. Environ. 2016, 14, 433–440. [Google Scholar] [CrossRef] [Green Version]
- Olsson, M.; Gullberg, A.; Tegelstrom, H.; Madsen, T.; Shine, R. Can female adders multiply? Nature 1994, 369, 528. [Google Scholar] [CrossRef]
- Taylor, A.C.; Horsup, A.; Johnson, C.N.; Sunnucks, P.; Sherwin, B. Relatedness structure detected by microsatellite analysis and attempted pedigree reconstruction in an endangered marsupial, the northern hairy-noosed wombat Lasiorhinus krefftii. Mol. Ecol. 1997, 6, 9–19. [Google Scholar] [CrossRef] [PubMed]
- Bull, C.M.; Cooper, S.J.B. Relatedness and avoidance of inbreeding in the lizard, Tiliqua rugosa. Behav. Ecol. Sociobiol. 1999, 46, 367–372. [Google Scholar] [CrossRef]
- Knight, M.E.; van Oppen, M.J.H.; Smith, H.L.; Rico, C.; Hewitt, C.R.; Turner, G.F. Evidence for male-biased dispersal in Lake Malawi cichlids from microsatellites. Mol. Ecol. 1999, 8, 1521–1527. [Google Scholar] [CrossRef] [PubMed]
- Hazlitt, S.L.; Eldridge, M.D.B.; Goldizen, A.W. Fine-scale spatial genetic correlation analyses reveal strong female philopatry within a brush-tailed rock-wallaby colony in southeast Queensland. Mol. Ecol. 2004, 13, 3621–3632. [Google Scholar] [CrossRef] [PubMed]
- Hoffman, A.A.; Sgrò, C.M. Climate change and evolutionary adaptation. Nature 2011, 470, 479–485. [Google Scholar] [CrossRef] [PubMed]
- Woinarski, J.C.Z.; Burbidge, A.A.; Harrison, P.L. Ongoing unravelling of a continental fauna: Decline and extinction of Australian mammals since European settlement. Proc. Natl. Acad. Sci. USA 2015, 112, 4531–4540. [Google Scholar] [CrossRef] [PubMed] [Green Version]
- McKenzie, N.L.; Burbidge, A.A.; Baynes, A.; Brereton, R.N.; Dickman, C.R.; Gordon, G.; Gibson, L.A.; Menkhorst, P.W.; Robinson, A.C.; Williams, M.R.; et al. Analysis of factors implicated in the recent decline of Australia’s mammal fauna. J. Biogeogr. 2007, 34, 597–611. [Google Scholar] [CrossRef]
- Woinarski, J.C.; Legge, S.; Fitzsimons, J.A.; Traill, B.J.; Burbidge, A.A.; Fisher, A.; Firth, R.S.; Gordon, I.J.; Griffiths, A.D.; Johnson, C.N.; et al. The disappearing mammal fauna of northern Australia: Context, cause, and response. Conserv. Lett. 2011, 4, 192–201. [Google Scholar] [CrossRef] [Green Version]
- Wayne, A.F.; Wilson, B.A.; Woinarski, J.C.Z. Falling apart? Insights and lessons from three recent studies documenting rapid and severe decline in terrestrial mammal assemblages of northern, south-eastern and south-western Australia. Wildlife Res. 2017, 44, 114–126. [Google Scholar] [CrossRef]
- Davies, H.F.; McCarthy, M.A.; Firth, R.S.; Woinarski, J.C.; Gillespie, G.R.; Andersen, A.N.; Rioli, W.; Puruntatameri, J.; Roberts, W.; Kerinaiua, C.; et al. Declining populations in one of the last refuges for threatened mammal species in northern Australia. Austral Ecol. 2018, 43, 602–612. [Google Scholar] [CrossRef]
- Lim, L.; Robinson, A.C.; Copley, P.B.; Gordon, G.; Canty, P.D.; Reimer, D. The Conservation and Management of the Yellow-Footed Rock Wallaby Petrogale xanthopus Gray 1854; South Australia Special Publication; Department of Environment and Planning: Adelaide, Australia, 1987; Volume 4, pp. 1–94.
- Eldridge, M.D.B. Rock-wallabies: Petrogale. In The Mammals of Australia; Van Dyck, S., Strahan, R., Eds.; Reed New Holland: Sydney, Australia, 2008; pp. 361–362. [Google Scholar]
- Eldridge, M.D.B. Restriction analysis of mitochondrial DNA from the yellow-footed rock-wallaby, Petrogale xanthopus: Implications for management. Wildlife Res. 1997, 24, 289–294. [Google Scholar] [CrossRef]
- Potter, S.; Cooper, S.J.B.; Metcalfe, C.J.; Taggart, D.A.; Eldridge, M.D.B. Phylogenetic relationships of rock-wallabies, Petrogale (Marsupialia: Macropodidae) and their biogeographic history within Australia. Mol. Phylogenet. Evol. 2012, 62, 640–652. [Google Scholar] [CrossRef]
- Byrne, M.; Yeates, D.K.; Joseph, L.; Kearney, M.; Bowler, J.; Williams, A.J.; Cooper, S.; Donnellan, S.C.; Keogh, J.S.; Leys, R.; et al. Birth of a biome: Insights into the assembly and maintenance of the Australian arid zone biota. Mol. Ecol. 2008, 17, 4398–4417. [Google Scholar] [CrossRef] [PubMed]
- Eldridge, M.D.B.; Piggott, M.P.; Hazlitt, S.L. Population genetic studies of the Macropodoidea: A review. In Macropods: The biology of kangaroos, wallabies and rat kangaroos; Coulson, G.M., Eldridge, M.D.B., Eds.; CSIRO Publishing: Collingwood, Australia, 2010; pp. 35–52. [Google Scholar]
- The IUCN Red List of Threatened Species. Version 2017-3. Available online: www.iucnredlist.org (accessed on 29 June 2018).
- Department of Environment and Resource Management. National Recovery Plan for the Proserpine Rock-Wallaby Petrogale persephone; Report to Department of Sustainability, Environment, Water, Population and Communities, Canberra; Queensland Department of Environment and Resource Management Brisbane: Brisbane, Australia, 2010.
- Menkhorst, P.; Hynes, E. National recovery plan for the brush-tailed rock-wallaby Petrogale penicillata; Department of Sustainability and Environment: East Melbourne, Australia, 2010.
- Pearson, D.J. Recovery plan for five species of rock wallabies: Black- footed rock wallaby (Petrogale lateralis), Rothschild rock wallaby (Petrogale rothschildi), Short-eared rock wallaby (Petrogale brachyotis), Monjon (Petrogale burbidgei) and Nabarlek (Petrogale concinna) 2012–2022. Department of Environment and Conservation: Perth, Australia, 2012. [Google Scholar]
- Brandle, R.; Mooney, T.; de Preu, N. Broad-scale feral predator and herbivore control for yellow-footed rock-wallabies: Improved resilience for plants and animals = Bounceback. In Recovering Australian threatened species: A book of hope; Garnett, S., Woinarski, J., Lindenmayer, D., Latch, P., Eds.; CSIRO Publishing: Clayton, Australia, 2018; pp. 135–145. [Google Scholar]
- Browning, T.L.; Taggart, D.A.; Rummery, C.; Close, R.L.; Eldridge, M.D.B. Multifaceted genetic analysis of the ‘Critically Endangered’ Brush-tailed Rock-wallaby in Victoria, Australia: Implications for management. Conserv. Genet. 2001, 2, 145–156. [Google Scholar] [CrossRef]
- Eldridge, M.D.B.; Rummery, C.; Bray, C.; Zenger, K.R.; Browning, T.L.; Close, R.L. Genetic analysis of a population crash in brush-tailed rock-wallabies (Petrogale penicillata) from Jenolan Caves, south-eastern Australia. Wildlife Res. 2004, 31, 229–240. [Google Scholar] [CrossRef]
- Eldridge, M.D.B.; King, J.M.; Loupis, A.K.; Spencer, P.B.S.; Taylor, A.C.; Pope, L.C.; Hall, G.P. Unprecedented low levels of genetic variation and inbreeding depression in an island population of the black-footed rock-wallaby. Conserv. Biol. 1999, 13, 531–541. [Google Scholar] [CrossRef]
- Eldridge, M.D.B.; Kinnear, J.E.; Onus, M.L. Source population of dispersing rock-wallabies (Petrogale lateralis) identified by assignment tests on multilocus genotypic data. Mol. Ecol. 2001, 10, 2867–2876. [Google Scholar] [CrossRef] [PubMed]
- West, R.; Potter, S.; Taggart, D.; Eldridge, M.D.B. Looking back to go forward: Genetics informs future management of captive and reintroduced populations of the black-footed rock-wallaby Petrogale lateralis. Conserv. Genet. 2018, 19, 235–247. [Google Scholar] [CrossRef]
- Pope, L.C.; Sharp, A.; Moritz, C. Population structure of the yellow-footed rock-wallaby Petrogale xanthopus (Gray, 1854) inferred from mtDNA sequences and microsatellite loci. Mol. Ecol. 1996, 5, 629–640. [Google Scholar] [CrossRef]
- Copley, P.B.; Alexander, P.J. Overview of the status of rock wallabies in South Australia. Aust. Mammal. 1997, 19, 153–162. [Google Scholar]
- Lim, T.L.; Giles, J.R. Studies of the yellow-footed rock-wallaby, Petrogale xanthopus Gray (Marsupialia: Macropodidae). 3. Distribution and management in western New South Wales. Aust. Wildlife Res. 1987, 14, 147–161. [Google Scholar] [CrossRef]
- Arkell, B. Flinders Ranges Bounceback; Department of Environment, Heritage and Aboriginal Affairs: Canberra, South Australia, 1999.
- De Preu, N.; Pearce, D. Bounceback report: Final report for the Department for the Environment and Heritage SA/National Heritage Trust Bounceback project for the period to December 2002; Department for Environment and Heritage, South Australia: Adelaide, Australia, 20 December 2003.
- Lethbridge, M.R.; Alexander, P.J. Comparing population growth rates using weighted bootstrapping: Guiding the conservation management of Petrogale xanthopus xanthopus (yellow-footed rock-wallaby). Biol. Conserv. 2008, 141, 1185–1195. [Google Scholar] [CrossRef]
- Department of the Environment and Energy. Department of the Environment and Energy. In Approved Conservation Advice for Petrogale xanthopus xanthopus (Yellow-footed Rock-wallaby (SA and NSW); Australian Government; Department of the Environment and Energy: Canberra, Australia, 2019. [Google Scholar]
- Woinarski, J.C.Z.; Burbidge, A.A.; Harrison, P.L. The Action Plan for Australian Mammals 2012; CSIRO Publishing: Clayton, Australia, 2014; pp. 1–1053. [Google Scholar]
- Lethbridge, M.R.; Strauss, J.C. A novel dispersal algorithm in individual-based, spatially-explicit population viability analysis: A new role for genetic measures in model testing? Environ. Modell. Softw. 2015, 68, 83–97. [Google Scholar] [CrossRef]
- Frankham, R.; Ballou, J.D.; Ralls, K.; Eldridge, M.D.B.; Dudash, M.R.; Fenster, C.B.; Lacy, R.C.; Sunnucks, P. A Practical Guide for Genetic Management of Fragmented Animal and Plant Populations; Oxford University Press: Oxford, UK, 2019; pp. 1–426. [Google Scholar]
- Barlow, S. Reintroduction of the Yellow-footed Rock-wallaby (Petrogale xanthopus xanthopus) to Aroona Sanctuary, northern Flinders Ranges, South Australia. Thylacinus 1999, 23, 12–16. [Google Scholar]
- Sunnucks, P.; Hales, D.F. Numerous transposed sequences of mitochondrial cytochrome oxidase I-II in aphids of the genus Sitobion (Hemiptera: Aphididae). Mol. Bio. Evol. 1996, 13, 510–524. [Google Scholar] [CrossRef] [PubMed]
- Fumagalli, L.; Pope, L.C.; Taberlet, P.; Moritz, C. Versatile primers for the amplification of the mitochondrial DNA control region in marsupials. Mol. Ecol. 1997, 6, 1199–1201. [Google Scholar] [CrossRef]
- Miller, E.J.; Eldridge, M.D.B.; Cooper, D.W.; Herbert, C.A. Dominance, body size and internal relatedness influence male reproductive success in eastern grey kangaroos (Macropus giganteus). Reprod. Fert. Develop. 2010, 22, 539–549. [Google Scholar] [CrossRef]
- Zenger, K.R.; Eldridge, M.D.B.; Pope, L.C.; Cooper, D.W. Characterisation and cross-species utility of microsatellite markers within kangaroos, wallabies and rat kangaroos (Macropodoidea: Marsupialia). Aust. J. Zool. 2003, 51, 587–596. [Google Scholar] [CrossRef]
- Spencer, P.B.S.; Odorico, D.M.; Jones, S.J.; Marsh, H.D.; Miller, D.J. Highly variable microsatellites in isolated colonies of the rock-wallaby (Petrogale assimilis). Mol. Ecol. 1995, 4, 523–525. [Google Scholar] [CrossRef]
- Taylor, A.C.; Cooper, D.W. A set of tammar wallaby (Macropus eugenii) microsatellites tested for genetic linkage. Mol. Ecol. 1998, 7, 925–926. [Google Scholar] [CrossRef] [PubMed]
- Zenger, K.R.; Cooper, D.W. A set of highly polymorphic microsatellite markers developed for the eastern grey kangaroo (Macropus giganteus). Mol. Ecol. 2001, 1, 98–100. [Google Scholar] [CrossRef]
- Tamura, K.; Peterson, D.; Peterson, N.; Stecher, G.; Nei, M.; Kumar, S. MEGA5: Molecular evolutionary genetics analysis using maximum likelihood, evolutionary distance, and maximum parsimony methods. Mol. Bio. Evol. 2011, 28, 2731–2739. [Google Scholar] [CrossRef] [Green Version]
- Pope, L.C.; Sharp, A.; Moritz, C. The genetic diversity and distinctiveness of the yellow-footed rock-wallaby Petrogale xanthopus (Gray, 1854) in New South Wales. Pacific Conservation Biology 1998, 4, 164–169. [Google Scholar] [CrossRef]
- Librado, P.; Rozas, J. DnaSP v5: A software for comprehensive analysis of DNA polymorphism data. Bioinformatics 2009, 25, 1451–1452. [Google Scholar] [CrossRef] [PubMed] [Green Version]
- Raymond, M.; Rousset, F. GENEPOP (ver. 1.2): Population genetics software for exact tests and ecumenicism. J. Hered. 1995, 86, 248–249. [Google Scholar] [CrossRef]
- Rice, W.R. Analyzing tables of statistical tests. Evolution 1989, 43, 223–225. [Google Scholar] [CrossRef]
- Peakall, R.; Smouse, P.E. GenAlEx 6: Genetic analysis in Excel. Population genetic software for teaching and research. Mol. Ecol. Notes 2006, 6, 288–295. [Google Scholar] [CrossRef]
- Peakall, R.; Smouse, P.E. GenAlEx 6.5: Genetic analysis in Excel. Population genetic software for teaching and research—An update. Bioinformatics 2012, 28, 2537–2539. [Google Scholar] [CrossRef] [Green Version]
- Goudet, J. FSTAT (ver. 1.2): A computer program to calculate F-statistics. J. Hered. 1995, 86, 485–486. [Google Scholar] [CrossRef]
- Weir, B.S.; Cockerham, C.C. Estimating F-statistics for the analysis of population structure. Evolution 1984, 38, 1358–1370. [Google Scholar] [CrossRef]
- Pritchard, J.K.; Stephens, M.; Donnelly, P. Inference of population structure using multilocus genotype data. Genetics 2000, 155, 945–959. [Google Scholar]
- Evanno, G.; Regnaut, S.; Goudet, J. Detecting the number of clusters of individuals using the software STRUCTURE: A simulation study. Mol. Ecol. 2005, 14, 2611–2620. [Google Scholar] [CrossRef] [Green Version]
- Kopelman, N.M.; Mayzel, J.; Jakobsson, M.; Roseberg, N.A.; Mayrose, I. CLUMPAK: A program for identifying clustering modes and packaging population structure inferences across K. Mol. Ecol. Resour. 2015, 15, 1179–1191. [Google Scholar] [CrossRef] [PubMed] [Green Version]
- Queller, D.C.; Goodnight, K.F. Estimating relatedness using genetic markers. Evolution 1989, 43, 258–275. [Google Scholar] [CrossRef] [PubMed]
- Lanfear, R.; Calcott, B.; Ho, S.Y.W.; Guindon, S. PartitionFinder: Combined selection of partitioning schemes and substitution models for phylogenetic analyses. Mol. Bio. Evol. 2012, 29, 1695–1701. [Google Scholar] [CrossRef] [PubMed] [Green Version]
- Stamatakis, A. RAxML-VI-HPC: Maximum likelihood-based phylogenetic analyses with thousands of taxa and mixed models. Bioinformatics 2006, 22, 2688–2690. [Google Scholar] [CrossRef]
- Stamatakis, A.; Hoover, P.; Rougemont, J. A rapid bootstrap algorithm for the RAxML web-servers. Syst. Biol. 2008, 57, 758–771. [Google Scholar] [CrossRef]
- Clement, M.; Posada, D.; Crandall, K.A. TCS: A computer program to estimate gene genealogies. Mol. Ecol. 2000, 9, 1657–1659. [Google Scholar] [CrossRef] [Green Version]
- Excoffier, L.; Lischer, H.E.L. Arlequin suite ver 3.5: A new series of programs to perform population genetics analyses under Linux and Windows. Mol. Ecol. Resour. 2010, 10, 564–567. [Google Scholar] [CrossRef]
- Smouse, P.E.; Long, J.C.; Sokal, R.R. Multiple regression and correlation extensions of the Mantel test of matrix correspondence. Syst. Zool. 1986, 35, 627–632. [Google Scholar] [CrossRef]
- Mantel, N. The detection of disease clustering and a generalized regression approach. Cancer Res. 1967, 27, 209–220. [Google Scholar]
- Tajima, F. Statistical method for testing the neutral mutation hypothesis by DNA polymorphism. Genetics 1989, 123, 585–595. [Google Scholar]
- Fu, Y.-X. Statistical tests of neutrality against population growth, hitchhiking and background selection. Genetics 1997, 147, 915–925. [Google Scholar]
- Ramos-Onsins, S.E.; Rozas, J. Statistical properties of new neutrality tests against population growth. Mol. Bio. Evol. 2002, 19, 2092–2100. [Google Scholar] [CrossRef] [PubMed] [Green Version]
- Piry, S.; Luikart, G.; Cornuet, J.-M. BOTTLENECK: A computer program for detecting recent reductions in the effective population size using allele frequency data. J. Hered. 1999, 90, 502–503. [Google Scholar] [CrossRef]
- Cornuet, J.-M.; Luikart, G. Description and power analysis of two tests for detecting recent population bottlenecks from allele frequency data. Genetics 1996, 144, 2001–2014. [Google Scholar]
- Di Rienzo, A.; Peterson, A.C.; Garza, J.C.; Valdes, A.M.; Slatkin, M.; Freimer, N.B. Mutational processes of simple sequence repeat loci in human populations. Proc. Natl. Acad. Sci. USA 1994, 91, 3166–3170. [Google Scholar] [CrossRef] [Green Version]
- Piry, S.; Alapetite, A.; Cornuet, J.M.; Paetkau, D.; Baudouin, L.; Estoup, A. GeneClass2: A software for genetic assignment and first-generation migrant detection. J. Hered. 2004, 95, 536–539. [Google Scholar] [CrossRef]
- Rannala, B.; Mountain, J.L. Detecting immigration by using multilocus genotypes. Proc. Natl. Acad. Sci. USA 1997, 94, 9197–9201. [Google Scholar] [CrossRef] [Green Version]
- Paetkau, D.; Slade, R.; Burden, M.; Estoup, A. Genetic assignment methods for the direct, real-time estimation of migration rate: A simulation-based exploration of accuracy and power. Mol. Ecol. 2004, 13, 55–65. [Google Scholar] [CrossRef]
- Janes, J.K.; Miller, J.M.; Dupuis, J.R.; Malenfant, R.M.; Gorrell, J.C.; Cullingham, C.I.; Andrew, R.L. The K=2 conundrum. Mol. Ecol. 2017, 26, 1–9. [Google Scholar] [CrossRef] [Green Version]
- Haddad, N.M.; Brudvig, L.A.; Clobert, J.; Davies, K.F.; Gonzalez, A.; Holt, R.D.; Lovejoy, T.E.; Sexton, J.O.; Austin, M.P.; Collins, C.D.; et al. Habitat fragmentation and its lasting impact on Earth’s ecosystems. Sci. Adv. 2015, 1, e1500052. [Google Scholar] [CrossRef] [Green Version]
- Hazlitt, S.L.; Goldizen, A.W.; Eldridge, M.D.B. Significant patterns of population genetic structure and limited gene flow in a threatened macropodid marsupial despite continuous habitat in southeast Queensland, Australia. Conserv. Genet. 2006, 7, 675–689. [Google Scholar] [CrossRef]
- Potter, S.; Eldridge, M.D.B.; Cooper, S.J.B.; Paplinska, J.Z.; Taggart, D.A. Habitat connectivity, more than species’ biology, influences genetic differentiation in a habitat specialist, the short-eared rock-wallaby (Petrogale brachyotis). Conserv. Genet. 2012, 13, 937–952. [Google Scholar] [CrossRef] [Green Version]
- Telfer, W.R.; Eldridge, M.D.B. High levels of mitochondrial DNA divergence within short-eared rock-wallaby (Petrogale brachyotis) populations in northern Australia. Aust. J. Zool. 2010, 58, 104–112. [Google Scholar] [CrossRef]
- Hazlitt, S.L.; Eldridge, M.D.B.; Goldizen, A.W. Strong matrilineal structuring in the brush-tailed rock-wallaby confirmed by spatial patterns of mitochondrial DNA. In Macropods: The biology of kangaroos, wallabies and rat-kangaroos; Coulson, G., Eldridge, M., Eds.; CSIRO Publising: Melbourne, Australia, 2010; pp. 87–95. [Google Scholar]
- Piggott, M.P.; Banks, S.C.; Taylor, A.C. Population structure of brush-tailed rock-wallaby (Petrogale penicillata) colonies inferred from analysis of faecal DNA. Mol. Ecol. 2006, 15, 93–105. [Google Scholar] [CrossRef]
- Greenwood, P.J. Mating systems, philopatry and dispersal in birds and mammals. Anim. Behav. 1980, 28, 1140–1162. [Google Scholar] [CrossRef]
- Dobson, F.S. Competition for mates and predominant juvenile male dispersal in mammals. Anim. Behav. 1982, 30, 1183–1192. [Google Scholar] [CrossRef]
- Lawson Handley, L.J.; Perrin, N. Advances in our understanding of mammalian sex-biased dispersal. Mol. Ecol. 2007, 16, 1559–1578. [Google Scholar] [CrossRef]
- Hazlitt, S.L.; Goldizen, A.W.; Nicholls, J.A.; Eldridge, M.D.B. Three divergent lineages within an Australian marsupial (Petrogale penicillata) suggest multiple major refugia for mesic taxa in southeast Australia. Ecol. Evol. 2014, 4, 1102–1116. [Google Scholar] [CrossRef]
- Hazlitt, S.L.; Sigg, D.P.; Eldridge, M.D.B.; Goldizen, A.W. Restricted mating dispersal and strong breeding group structure in a mid-sized marsupial mammal (Petrogale penicillata). Mol. Ecol. 2006, 15, 2997–3007. [Google Scholar] [CrossRef]
- Schneider, C.J.; Cunningham, M.; Moritz, C. Comparative phylogeography and the history of endemic vertebrates in the wet tropics rainforests of Australia. Mol. Ecol. 1998, 7, 487–498. [Google Scholar] [CrossRef]
- Byrne, M. Evidence for multiple refugia at different time scales during Pleistocene climatic oscillations in southern Australia inferred from phylogeography. Quaternary Sci. Rev. 2008, 27, 2576–2585. [Google Scholar] [CrossRef]
- Byrne, M.; Steane, D.A.; Joseph, L.; Yeates, D.K.; Jordan, G.J.; Crayn, D.; Aplin, K.; Cantrill, D.J.; Cook, L.G.; Crisp, M.D.; et al. Decline of a biome: Evolution, contraction, fragmentation extinction and invasion of the Australian mesic zone biota. J. Biogeogr. 2011, 38, 1635–1656. [Google Scholar] [CrossRef] [Green Version]
- Bryant, L.M.; Krosch, M.N. Lines in the land: A review of evidence for eastern Australia’s major biogeographical barriers to closed forest taxa. Biol. J. Linn. Soc. 2016, 119, 238–264. [Google Scholar] [CrossRef] [Green Version]
- Bowman, D.M.J.S.; Brown, G.K.; Braby, M.F.; Brown, J.R.; Cook, L.G.; Crisp, M.D.; Ford, F.; Haberle, S.; Hughes, J.; Isagi, Y.; et al. Biogeography of the Australian monsoon tropics. J. Biogeogr. 2010, 37, 201–216. [Google Scholar] [CrossRef]
- Blacket, M.J.; Adams, M.; Cooper, S.J.B.; Krajewski, C.; Westerman, M. Systematics and evolution of the dasyurid marsupial genus Sminthopsis: I. The macroura species group. J. Mamm. Evol. 2001, 8, 149–170. [Google Scholar] [CrossRef]
- Chapple, D.G.; Keogh, J.S.; Hutchinson, M.N. Molecular phylogeography and systematics of the arid-zone members of the Egernia whitii (Lacertilia: Scincidae) species group. Mol. Phylogenet. Evol. 2004, 33, 549–561. [Google Scholar] [CrossRef] [PubMed]
- Murphy, N.P.; Austin, C.M. Phylogeography of the widespread Australian freshwater prawn, Macrobrachium australiense (Decapoda, Palaemonidae). J. Biogeogr. 2004, 31, 1065–1072. [Google Scholar] [CrossRef]
- Pepper, M.; Doughty, P.; Arculus, R.; Keogh, J.S. Landforms predict phylogenetic structure on one of the world’s most ancient surfaces. BMC Evol. Biol. 2008, 8, 152. [Google Scholar] [CrossRef] [Green Version]
- Pepper, M.; Fujita, M.K.; Moritz, C.; Keogh, J.S. Palaeoclimate change drove diversification among isolated mountain refugia in the Australian arid zone. Mol. Ecol. 2011, 20, 1529–1545. [Google Scholar] [CrossRef]
- Oliver, P.M.; Adams, M.; Lee, M.S.Y.; Hutchinson, M.N.; Doughty, P. Cryptic diversity in vertebrates: Molecular data double estimates of species diversity in a radiation of Australian lizards (Diplodactylus, Gekkota). P. Roy. Soc. Lond. B Bio. 2009, 276, 2001–2007. [Google Scholar] [CrossRef] [Green Version]
- Oliver, P.M.; Smith, K.L.; Laver, R.J.; Doughty, P.; Adams, M. Contrasting patterns of persistence and diversification in vicars of a widespread Australian lizard lineage (the Oedura marmorata complex). J. Biogeogr. 2014, 41, 2068–2079. [Google Scholar] [CrossRef]
- Fujita, M.K.; McGuire, J.A.; Donnellan, J.C.; Moritz, C. Diversification and persistence at the arid-monsoonal interface: Australia-wide biogeography of the Bynoe’s gecko (Heternotia binoei; Gekkonidae). Evolution 2010, 64, 2293–2314. [Google Scholar] [CrossRef] [PubMed]
- Nguyen, T.T.T.; Austin, C.M.; Meewan, M.M.; Schultz, M.B.; Jerry, D.R. Phylogeography of the freshwater crayfish Cherax destructor Clark (Parastacidae) in inland Australia: Historical fragmentation and recent range expansion. Biol. J. Linn. Soc. 2004, 83, 539–550. [Google Scholar] [CrossRef] [Green Version]
- Kuch, U.; Keogh, J.S.; Weigel, J.; Smith, L.A.; Mebs, D. Phylogeography of Australia’s king brown snake (Pseudechis australis) reveals Pliocene divergence and Pleistocene dispersal of a top predator. Naturwissenschaften 2005, 92, 121–127. [Google Scholar] [CrossRef] [PubMed]
- Joseph, L.; Wilke, T. Molecular resolution of population history, systematics and historical biogeography of the Australian ringneck parrots Barnardius: Are we there yet? Emu 2006, 106, 49–62. [Google Scholar] [CrossRef]
- Joseph, L.; Wilke, T. Lack of phylogeographic structure in three widespread Australian birds reinforces emerging challenges in Australian historical biogeography. J. Biogeogr. 2007, 34, 612–624. [Google Scholar] [CrossRef]
- Toon, A.; Mather, P.; Baker, A.; Durrant, K.J.H. Pleistocene refugia in an arid landscape: Analysis of a widely distributed Australian passerine. Mol. Ecol. 2007, 16, 2525–2541. [Google Scholar] [CrossRef]
- Kearns, A.; Joseph, L.; Double, M.; Edwards, S. Inferring the phylogeography and evolutionary history of the splendid fairy-wren (Malurus splendens) from mitochondrial DNA and spectrophotometry. J. Avian Biol. 2009, 40, 7–17. [Google Scholar] [CrossRef]
- McClean, A.L.; Cooper, S.J.B.; Lancaster, M.L.; Gaikhorst, G.; Lambert, C.; Moseby, K.; Read, J.; Ward, M.; Carthew, S.M. Small marsupial, big dispersal? Broad- and fine-scale genetic structure of an endangered marsupial from the Australian arid zone. Aust. J. Zool. 2019, 66, 214–227. [Google Scholar] [CrossRef] [Green Version]
- Moritz, C. Strategies to protect biological diversity and the evolutionary processes that sustain it. Syst. Biol. 2002, 51, 238–254. [Google Scholar] [CrossRef]
- Vandergast, A.G.; Bohonak, A.J.; Hathaway, S.A.; Boys, J.; Fisher, R.N. Are hotspots of evolutionary potential adequately protected in southern California? Biol. Conserv. 2008, 141, 1648–1664. [Google Scholar] [CrossRef]
- Harrisson, K.A.; Magrath, M.J.L.; Yen, Y.D.L.; Pavlova, A.; Murray, N.; Quin, B.; Menkhorst, P.; Miller, K.A.; Cartwright, K.; Sunnucks, P. Lifetime fitness costs of inbreeding and being inbred in a critically endangered bird. Curr. Biol. 2019, 29, 2711–2717. [Google Scholar] [CrossRef] [PubMed]
- Weeks, A.R.; Sgrò, C.M.; Young, A.G.; Frankham, R.; Mitchell, N.J.; Miller, K.A.; Byrne, M.; Coates, D.J.; Eldridge, M.D.B.; Sunnucks, P.; et al. Assessing the benefits and risks of translocations in changing environments: A genetic perspective. Evol. Appl. 2011, 4, 709–725. [Google Scholar] [CrossRef] [PubMed] [Green Version]
- Westemeier, R.L.; Brawn, J.D.; Simpson, S.A.; Esker, T.J.; Jansen, R.W.; Walk, J.W.; Kershner, E.L.; Bouzat, J.L.; Paige, K.N. Tracking the long-term decline and recovery of an isolated population. Science 1998, 282, 1695–1698. [Google Scholar] [CrossRef] [Green Version]
- Hedrick, P.W.; Fredrickson, R. Genetic rescue guidelines with examples from Mexican wolves and Florida panthers. Conserv. Genet. 2010, 11, 615–626. [Google Scholar] [CrossRef]
- Short, J.; Bradshaw, S.D.; Giles, J.; Prince, R.I.T.; Wilson, G.R. Reintroduction of macropods (Marsupialia: Macropodoidea) in Australia—A review. Biol. Conserv. 1992, 62, 189–204. [Google Scholar] [CrossRef]
- Morris, K. Fauna translocations in Western Australia 1971-1999: An overview. In Biodiversity and the Reintroduction of Native Fauna at Uluru-Kata Tjuta National Park; Gillen, J.S., Hamilton, R., Low, W.A., Creagh, C., Eds.; Bureau of Rural Sciences: Canberra, Australia, 2000; pp. 64–74. [Google Scholar]
- Hedrick, P.W. Gene flow and genetic restoration: The Florida panther as a case study. Conserv. Biol. 1995, 5, 996–1007. [Google Scholar] [CrossRef]
- Lopez, S.; Rousset, F.; Shaw, F.; Shaw, R.; Ronce, O. Joint effects of inbreeding and local adaptation on the evolution of genetic load after fragmentation. Conserv. Biol. 2009, 23, 1618–1627. [Google Scholar] [CrossRef]
- Sgrò, C.M.; Low, A.J.; Hoffmann, A.A. Building evolutionary resilience for conserving biodiversity under climate change. Evol. Appl. 2011, 4, 326–337. [Google Scholar] [CrossRef]
- Reusch, T.B.H.; Ehlers, A.; Hämmerli, A.; Worm, B. Ecosystem recovery after climatic extremes enhanced by genotypic diversity. Proc. Natl. Acad. Sci. USA 2005, 102, 2826–2831. [Google Scholar] [CrossRef] [Green Version]
- McMahon, B.J.; Teeling, E.C.; Höglund, J. How and why should we implement genomics into conservation? Evol. Appl. 2014, 7, 999–1007. [Google Scholar] [CrossRef] [PubMed]


| Population | # Samples | # Haplotypes | Haplotypes | Haplotype Diversity | Nucleotide Diversity | # Polymorphic Sites |
|---|---|---|---|---|---|---|
| 1. Aroona Dam | 31 | 1 | Z | 0.000 ± 0.000 | 0.00000 | 0 |
| 2. Eregunda | 84 | 2 | A (80), F (4) | 0.092 ± 0.042 | 0.00158 | 11 |
| 3. Homestead Range | 8 | 1 | H | 0.000 ± 0.000 | 0.00000 | 0 |
| 4. Mt Stuart | 3 | 1 | H | 0.000 ± 0.000 | 0.00000 | 0 |
| 5. Sandy Creek | 23 | 4 | H (19), L (2), M (1), N (1) | 0.320 ± 0.121 | 0.00243 | 14 |
| 6. Wilkawillina North | 31 | 2 | Bt (26), Bc (5) | 0.280 ± 0.090 | 0.00087 | 2 |
| 7. Wilkawillina South | 92 | 6 | Bc (72), I3 (9), Bt (6), Q (2), I1 (2), I2 (1) | 0.376 ± 0.061 | 0.00493 | 14 |
| 8. Mt Friday | 37 | 2 | K (25), J (12) | 0.450 ± 0.057 | 0.00141 | 2 |
| 9. Yandinga | 125 | 1 | G | 0.000 ± 0.000 | 0.00000 | 0 |
| 10. Olary Hills | 11 | 3 | C (9), D (1), E (1) | 0.182 ± 0.144 | 0.00401 | 14 |
| 11. Middle Gorge | 2 | 2 | R, S | 1.000 ± 0.500 | 0.02184 | 14 |
| Population | # Samples | Allelic Diversity | Unique Alleles | % Rare Alleles | Allelic Richness | HO | HE | FIS |
|---|---|---|---|---|---|---|---|---|
| 1. Aroona Dam | 25 | 2.76 ± 0.25 | 0.18 ± 0.10 | 0.6 | 2.58 ± 0.82 | 0.52 ± 0.05 | 0.46 ± 0.05 | −0.095 |
| 2. Eregunda | 65 | 5.18 ± 0.38 | 0.35 ± 0.15 | 15.9 | 3.86 ± 1.01 | 0.65 ± 0.03 | 0.63 ± 0.03 | −0.030 |
| 3. Homestead Range | 8 | 3.94 ± 0.29 | 0.18 ± 0.13 | 0.0 | 3.94 ± 1.20 | 0.73 ± 0.05 | 0.62 ± 0.03 | −0.115 |
| 4. Mt Stuart | 3 | 2.53 ± 0.24 | 0.06 ± 0.06 | 0.0 | - | 0.65 ± 0.09 | 0.46 ± 0.06 | −0.234 |
| 5. Sandy Creek | 17 | 4.59 ± 0.32 | 0.12 ± 0.08 | 11.4 | 3.74 ± 0.93 | 0.62 ± 0.05 | 0.56 ± 0.03 | −0.070 |
| 6. Wilkawillina North | 26 | 5.12 ± 0.47 | 0.06 ± 0.06 | 14.0 | 4.02 ± 1.24 | 0.69 ± 0.03 | 0.63 ± 0.03 | −0.074 |
| 7. Wilkawillina South | 75 | 6.12 ± 0.49 | 0.18 ± 0.13 | 19.7 | 4.34 ± 1.25 | 0.69 ± 0.03 | 0.66 ± 0.03 | −0.027 |
| 8. Mt Friday | 21 | 3.06 ± 0.26 | 0.41 ± 0.15 | 3.8 | 2.77 ± 0.90 | 0.52 ± 0.06 | 0.46 ± 0.05 | −0.102 |
| 9. Yandinga | 91 | 2.71 ± 0.21 | 0.18 ± 0.13 | 5.7 | 2.23 ± 0.56 | 0.38 ± 0.05 | 0.37 ± 0.05 | −0.038 |
| 10. Olary Hills | 11 | 3.41 ± 0.21 | 0.35 ± 0.15 | 5.1 | 3.26 ± 0.82 | 0.65 ± 0.05 | 0.56 ± 0.03 | −0.110 |
| Aroona Dam | Eregunda | Homestead Range | Sandy Creek | Wilkawillina North | Wilkawillina South | Mt Friday | Yandinga | Olary Hills | |
|---|---|---|---|---|---|---|---|---|---|
| Aroona Dam | - | 0.300 | 0.333 | 0.365 | 0.324 | 0.272 | 0.390 | 0.498 | 0.369 |
| Eregunda | 0.959 | - | 0.182 | 0.236 | 0.126 | 0.101 | 0.271 | 0.379 | 0.196 |
| Homestead Range | 1.000 | 0.798 | - | 0.160 | 0.166 | 0.153 | 0.311 | 0.457 | 0.193 |
| Sandy Creek | 0.748 | 0.748 | 0.000 | - | 0.196 | 0.185 | 0.306 | 0.478 | 0.198 |
| Wilkawillina North | 0.980 | 0.911 | 0.946 | 0.865 | - | 0.050 | 0.330 | 0.397 | 0.175 |
| Wilkawillina South | 0.851 | 0.793 | 0.693 | 0.687 | 0.263 | - | 0.279 | 0.341 | 0.167 |
| Mt Friday | 0.973 | 0.926 | 0.935 | 0.886 | 0.898 | 0.735 | - | 0.446 | 0.280 |
| Yandinga | 1.000 | 0.828 | 1.000 | 0.969 | 0.982 | 0.828 | 0.885 | - | 0.442 |
| Olary Hills | 0.955 | 0.926 | 0.885 | 0.848 | 0.916 | 0.779 | 0.919 | 0.986 | - |
© 2020 by the authors. Licensee MDPI, Basel, Switzerland. This article is an open access article distributed under the terms and conditions of the Creative Commons Attribution (CC BY) license (http://creativecommons.org/licenses/by/4.0/).
Share and Cite
Potter, S.; Neaves, L.E.; Lethbridge, M.; Eldridge, M.D.B. Understanding Historical Demographic Processes to Inform Contemporary Conservation of an Arid Zone Specialist: The Yellow-Footed Rock-Wallaby. Genes 2020, 11, 154. https://doi.org/10.3390/genes11020154
Potter S, Neaves LE, Lethbridge M, Eldridge MDB. Understanding Historical Demographic Processes to Inform Contemporary Conservation of an Arid Zone Specialist: The Yellow-Footed Rock-Wallaby. Genes. 2020; 11(2):154. https://doi.org/10.3390/genes11020154
Chicago/Turabian StylePotter, Sally, Linda E. Neaves, Mark Lethbridge, and Mark D. B. Eldridge. 2020. "Understanding Historical Demographic Processes to Inform Contemporary Conservation of an Arid Zone Specialist: The Yellow-Footed Rock-Wallaby" Genes 11, no. 2: 154. https://doi.org/10.3390/genes11020154