
Occurrence and Chemistry of Tropane Alkaloids in Foods, with a Focus on Sample Analysis Methods: A Review on Recent Trends and Technological Advances


Abstract
:1. Introduction
2. Chemistry and Occurrence of TAs in Foods
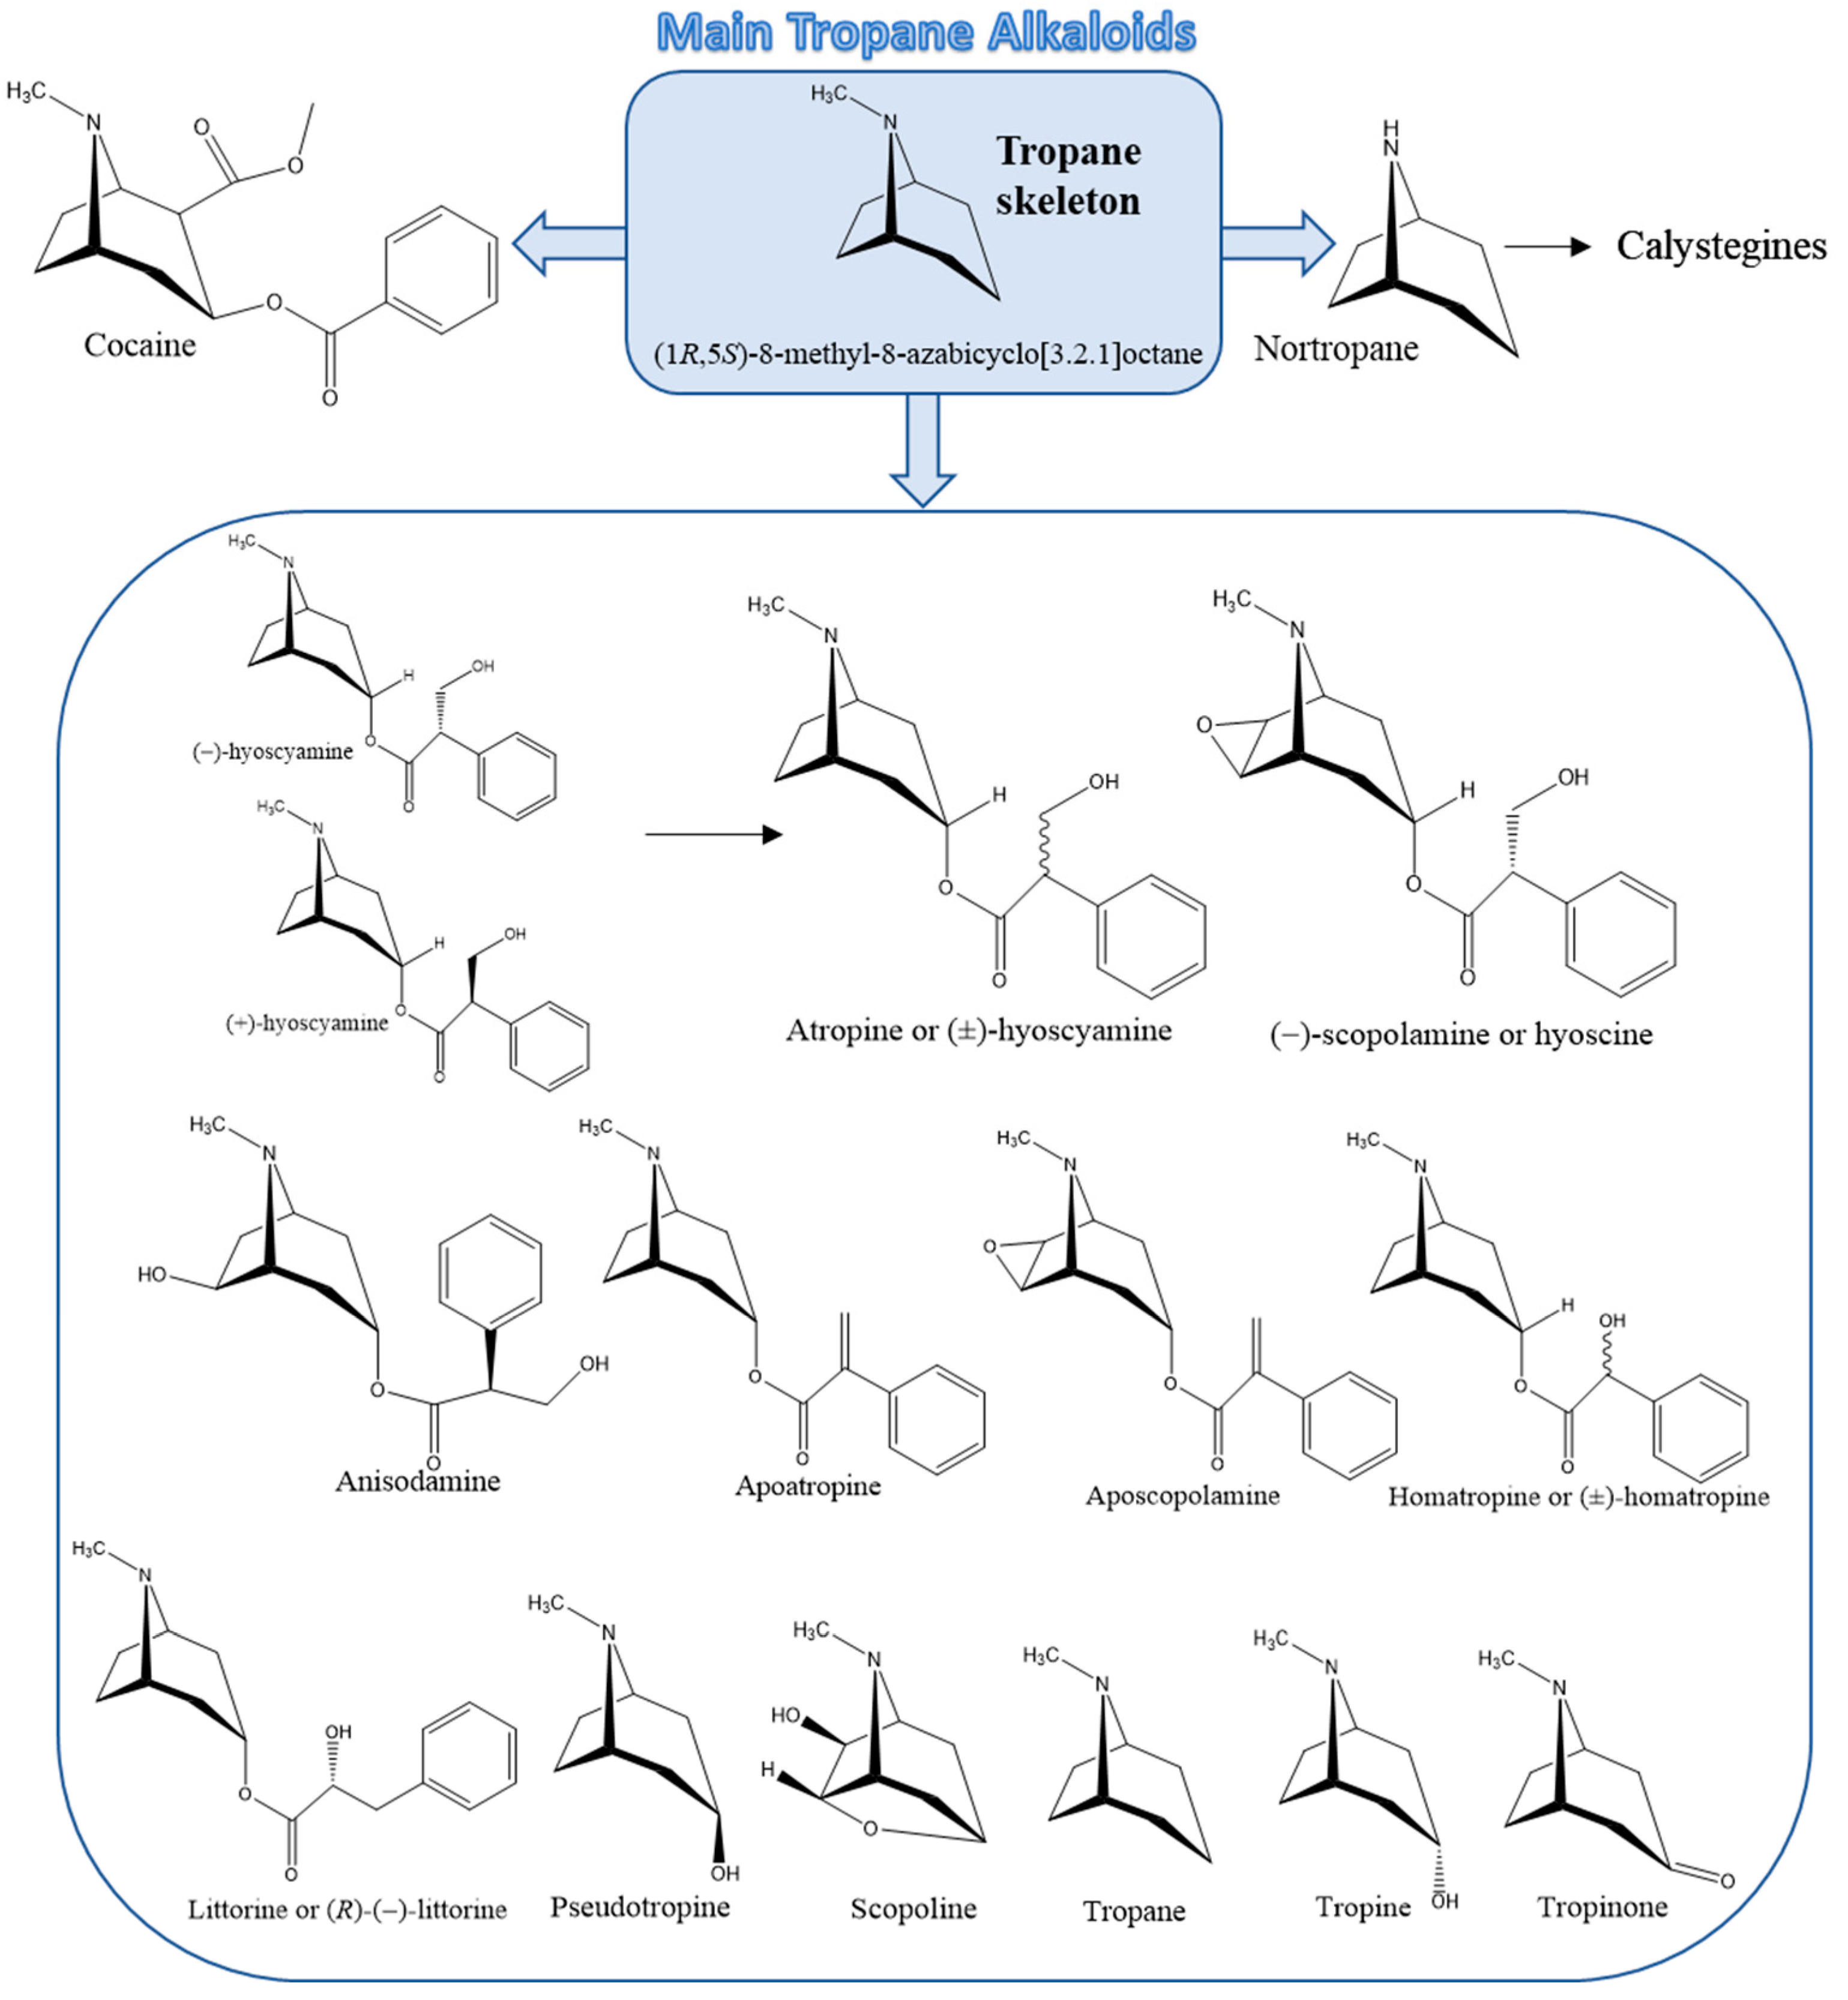
2.1. Chemistry
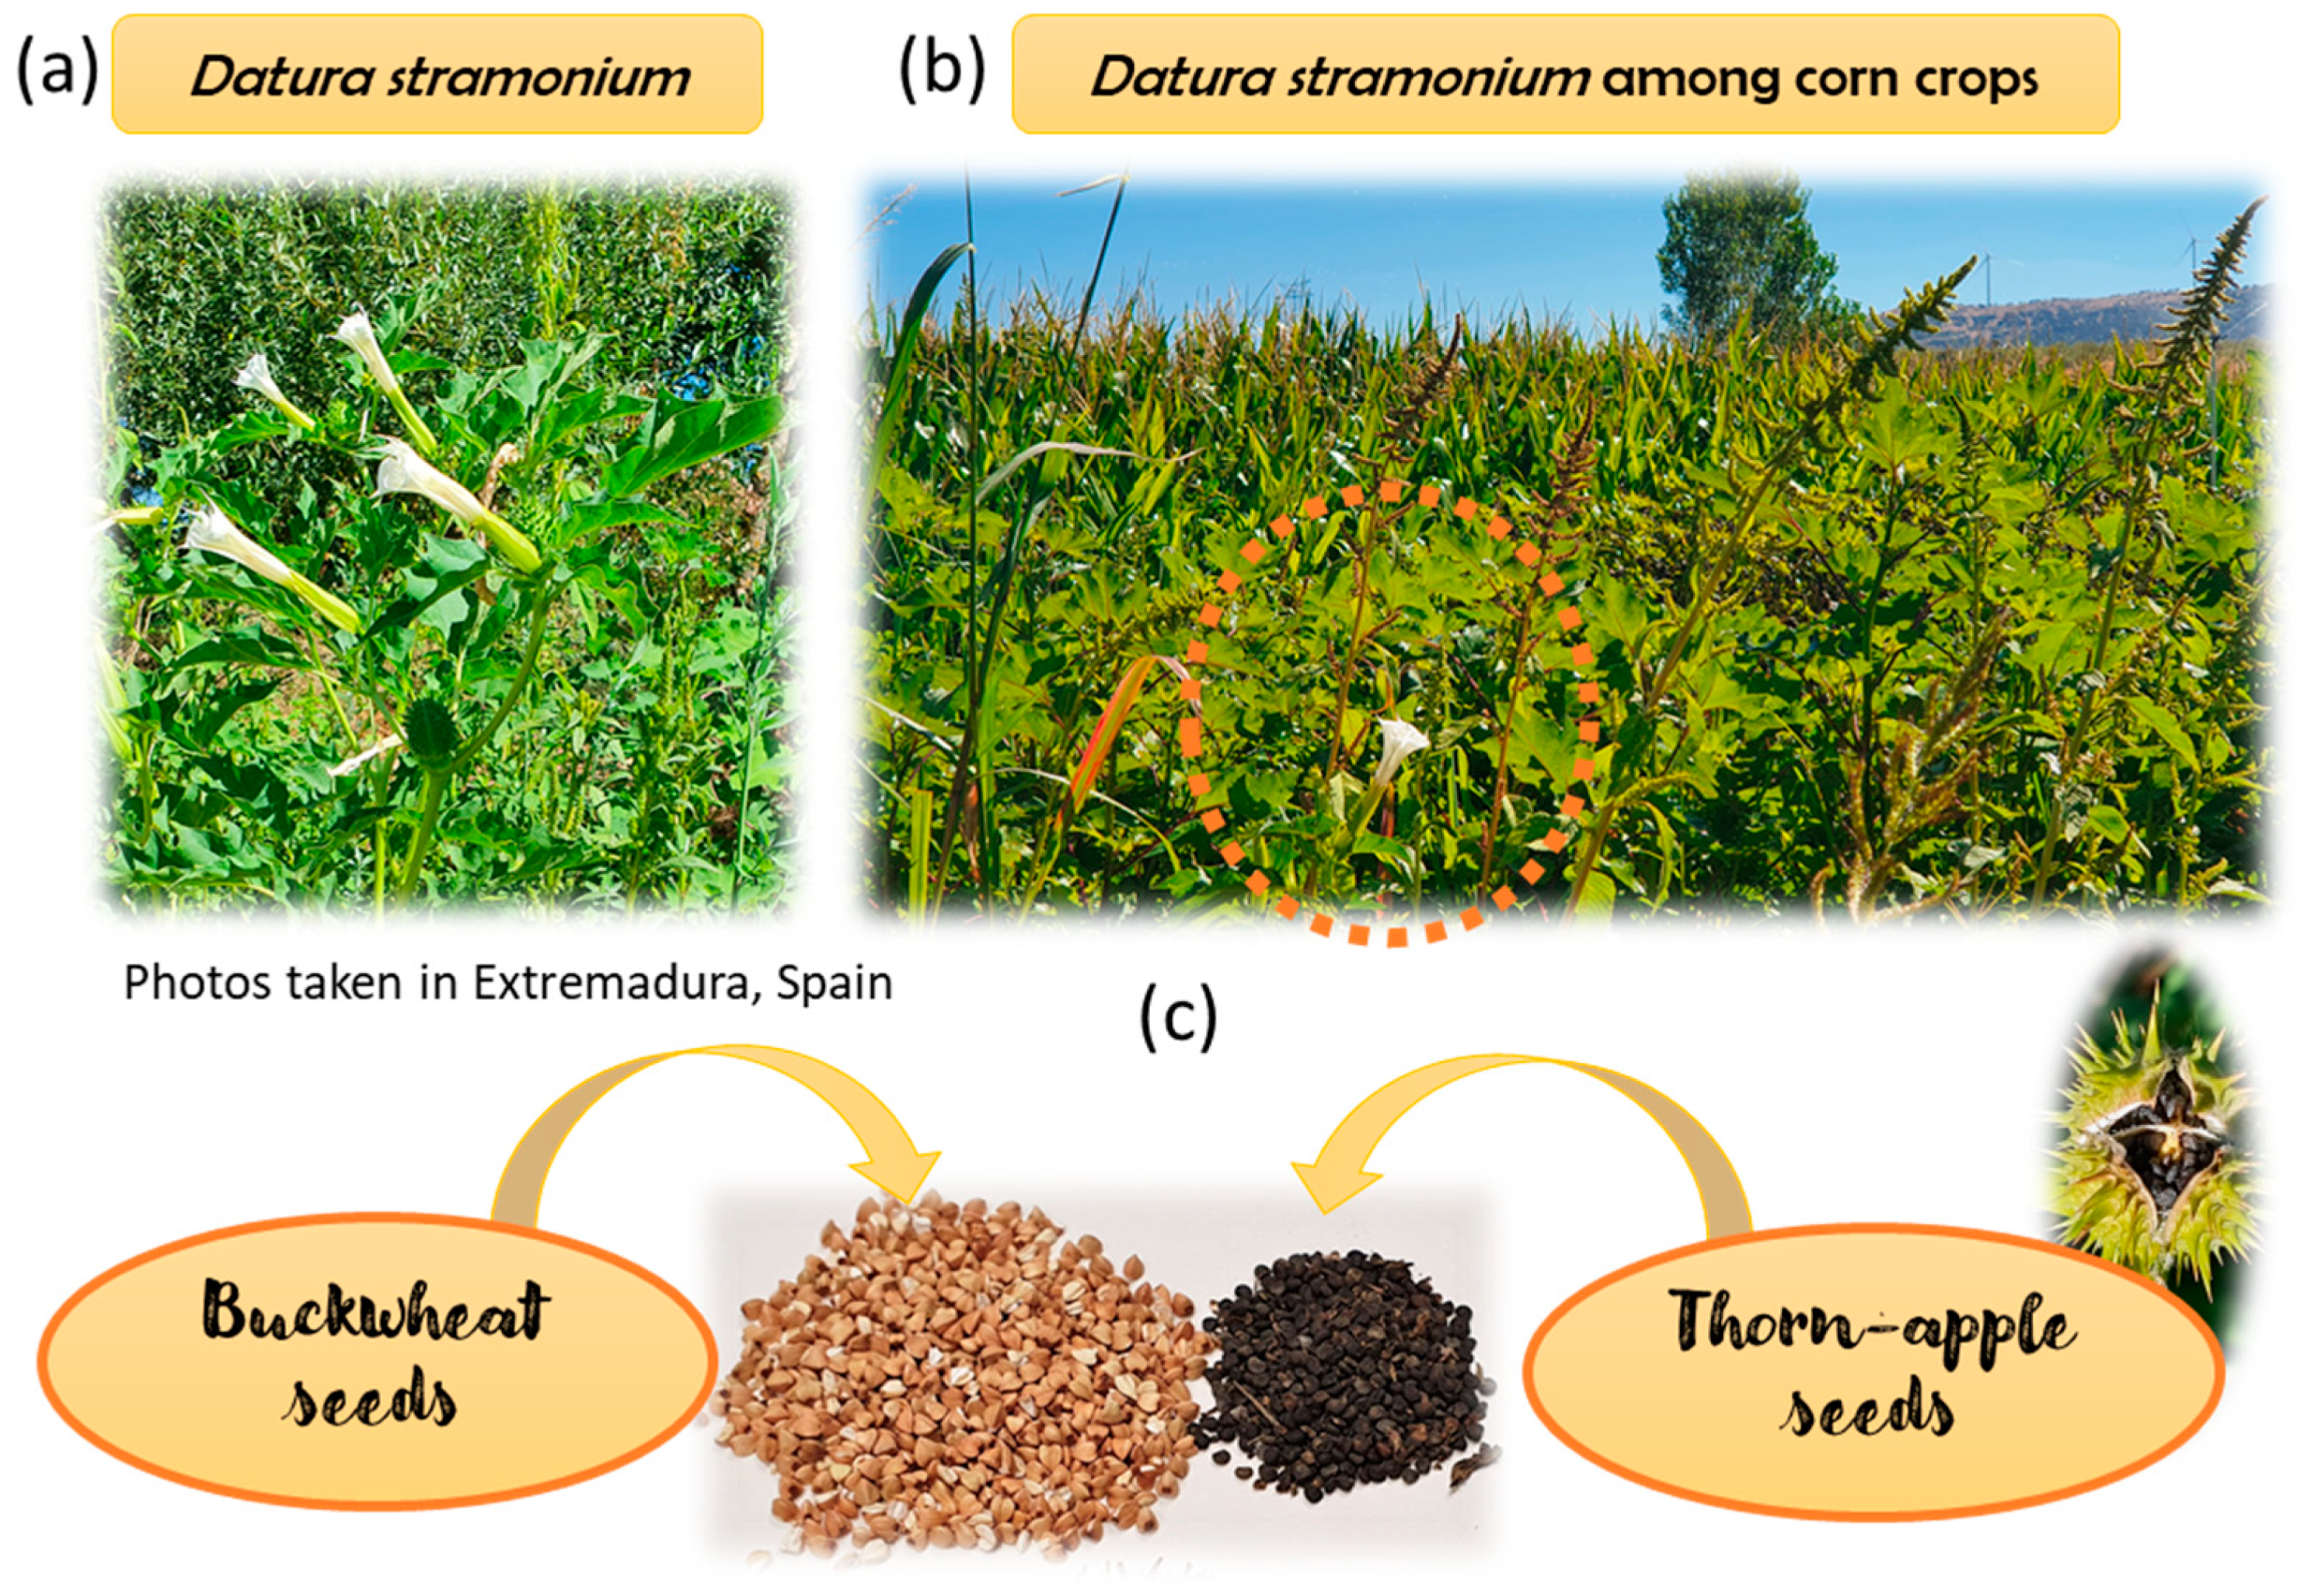
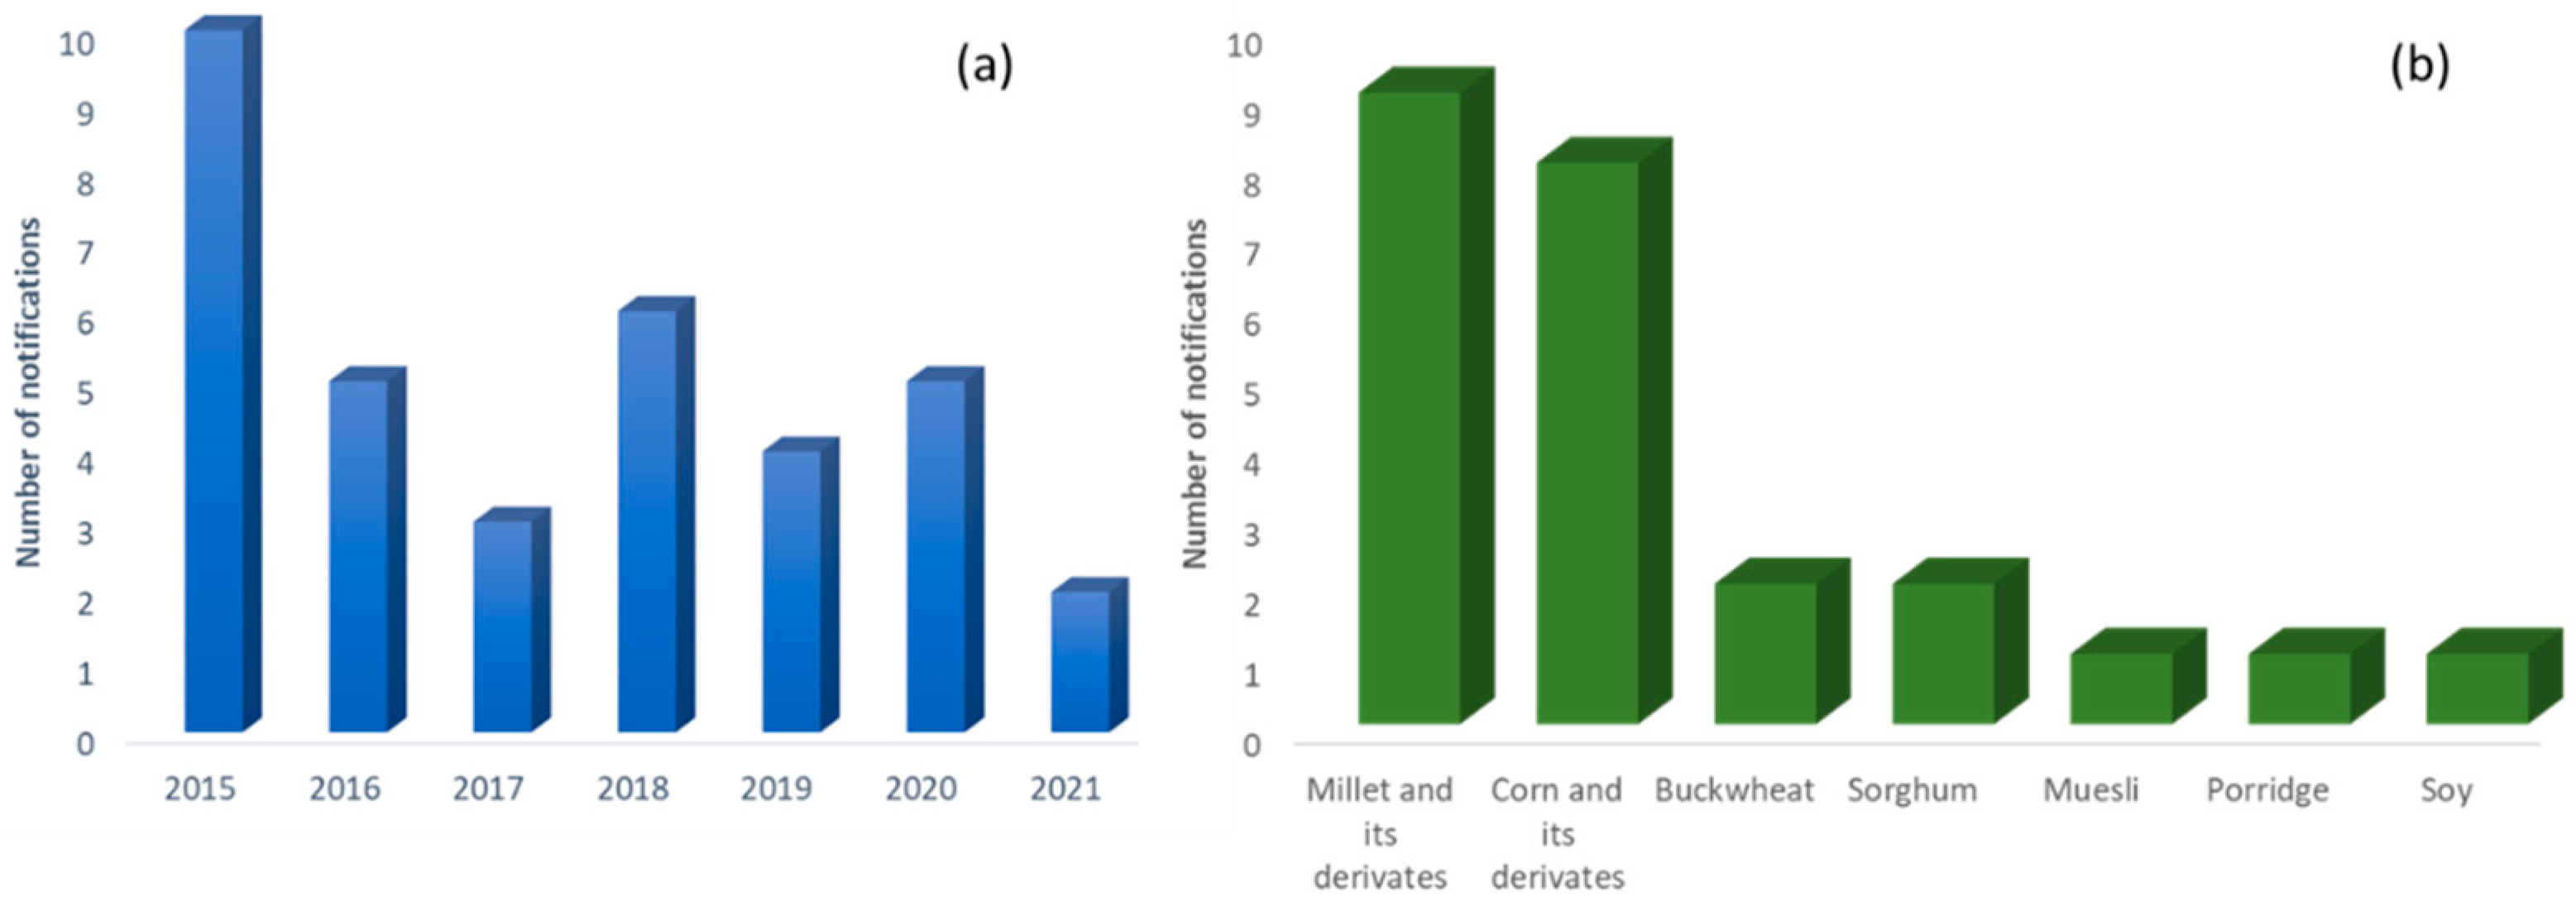
2.2. Occurrence
2.2.1. Cereals, Pseudo-Cereals, Legumes and Grains

| Foods (Nº of Samples Analyzed) | Nº of Samples with At (Range) | Nº of Samples with Sc (Range) | Other TAs | [Ref.] |
|---|---|---|---|---|
| Breakfast cereals, breakfast cereals with milk, biscuits, cookies (113 samples) | 21 of breakfast cereals (0.09–65.6 µg/kg) | 18 of breakfast cereals (0.28–15.2 µg/kg) | Anisodamine, aposcopolamine, homatropine, anidosine | [17] |
| Flours (buckwheat, millet and corn), cereal-based foods for children, breakfast cereals, biscuits and pastry, pasta and bread, legumes, stir-fry mixes and oilseeds (1305 samples) | 46 of flours (0.5–149 µg/kg), 42 of cereal-based foods for children (0.5–3.73 µg/kg), 15 of breakfast cereals (0.5–90.83 µg/kg), 24 of biscuits and pastry (0.5–1.85 µg/kg), 18 of bread (0.5–3.80 µg/kg), 20 of legumes, stir-fry mixes and oilseeds (0.5–0.11 µg/kg) | 46 of flours (0.5–198.5 µg/kg), 42 of cereal-based foods for children (0.5–1.86 µg/kg), 15 of breakfast cereals (0.5–17.64 µg/kg), 24 of biscuits and pastry (0.5–0.65 µg/kg), 18 of bread (0.5–0.36 µg/kg), 20 of legumes, stir-fry mixes and oilseeds (0.5–0.09 µg/kg) | 6-HO-tropinone, nortropinone, pseudotropine, scopine, scopoline, tropine, tropinone, convolamine, convolidine, convolvine, fillalbine, anisodamine, apoatropine, aposcopolamine, homatropine, littorine, noratropine, norscopolamine | [21] |
| Buckwheat, buckwheat flour and pasta; soy and soy flour; peeled millet and millet flour; linseed and linseed flour (15 samples) | 1 of buckwheat (<1 µg/kg) 1 of millet flour (13 µg/kg) | 1 of buckwheat (<2 µg/kg) 1 of millet flour (23 µg/kg) | Anidosamine, littorine, tropinone | [16] |
| Buckwheat, buckwheat flour and pasta, soy, wheat, amaranthus grain, chia seeds, peeled millet (8 samples) | N.D | N.D | Three scopolamine transformation products | [22] |
| Buckwheat flour, pasta and bakery (26 samples) | 1 of flour (83.9 µg/kg) 1 of pasta (21.3 µg/kg) 1 of bakery (13.9 µg/kg) | 1 of flour (10.4 µg/kg) 1 of pasta (5.7 µg/kg) | N.St | [13] |
| Cereal based baby foods (pap, biscuits, snacks and grissines) (18 samples) | 1 of biscuits (11.5 µg/kg) | 1 of biscuits (2.8 µg/kg) | Anidosamine, homatropine, apoatropina | [18] |
| Bread (wheat, multi-grain, rye, wheat-rye) (40 samples) | N.D | 1 of wheat-rye bread (0.22 µg/kg) | N.D | [23] |
| Wheat, corn, rice, oat and millet flours, mixed cereals flours, infant cereals, cereal-based products (95 samples) | 1 of tomato rice flakes product (9.6 µg/kg) | 1 of tomato rice flakes product (2.6 µg/kg) | N.St | [19] |
| Buckwheat and buckwheat flour, quinoa, amaranth, teff flour, refined corn flour, corn flour, blue corn flour, sorghum flour, peeled millet, green and red lentil flours, chickpea flour, pea flour (15 samples) | 3 of buckwheat grain and flour (6.7–21 µg/kg), 1 of quinoa (7.1 µg/kg), 1 of teff flour (78 µg/kg), 1 of refined corn flour (7 µg/kg), 1 of sorghum flour (15 µg/kg), 1 of peeled millet (6.9 µg/kg) | 1 of teff flour (28 µg/kg) | N.St | [14] |
2.2.2. Teas, Herbal Teas, Herbs and Spices
2.2.3. Other Plant-Based Foods
2.2.4. Animal-Derived Foods
3. Regulatory Aspects and Safety Issues in Food
4. Sample Preparation and Analysis Methods of TAs in Foods
4.1. Chromatographic Analysis Conditions
4.2. Sample Preparation for TAs Analysis in Foods
4.2.1. Methodologies with Solid–Liquid and Liquid–Liquid Extraction Protocols
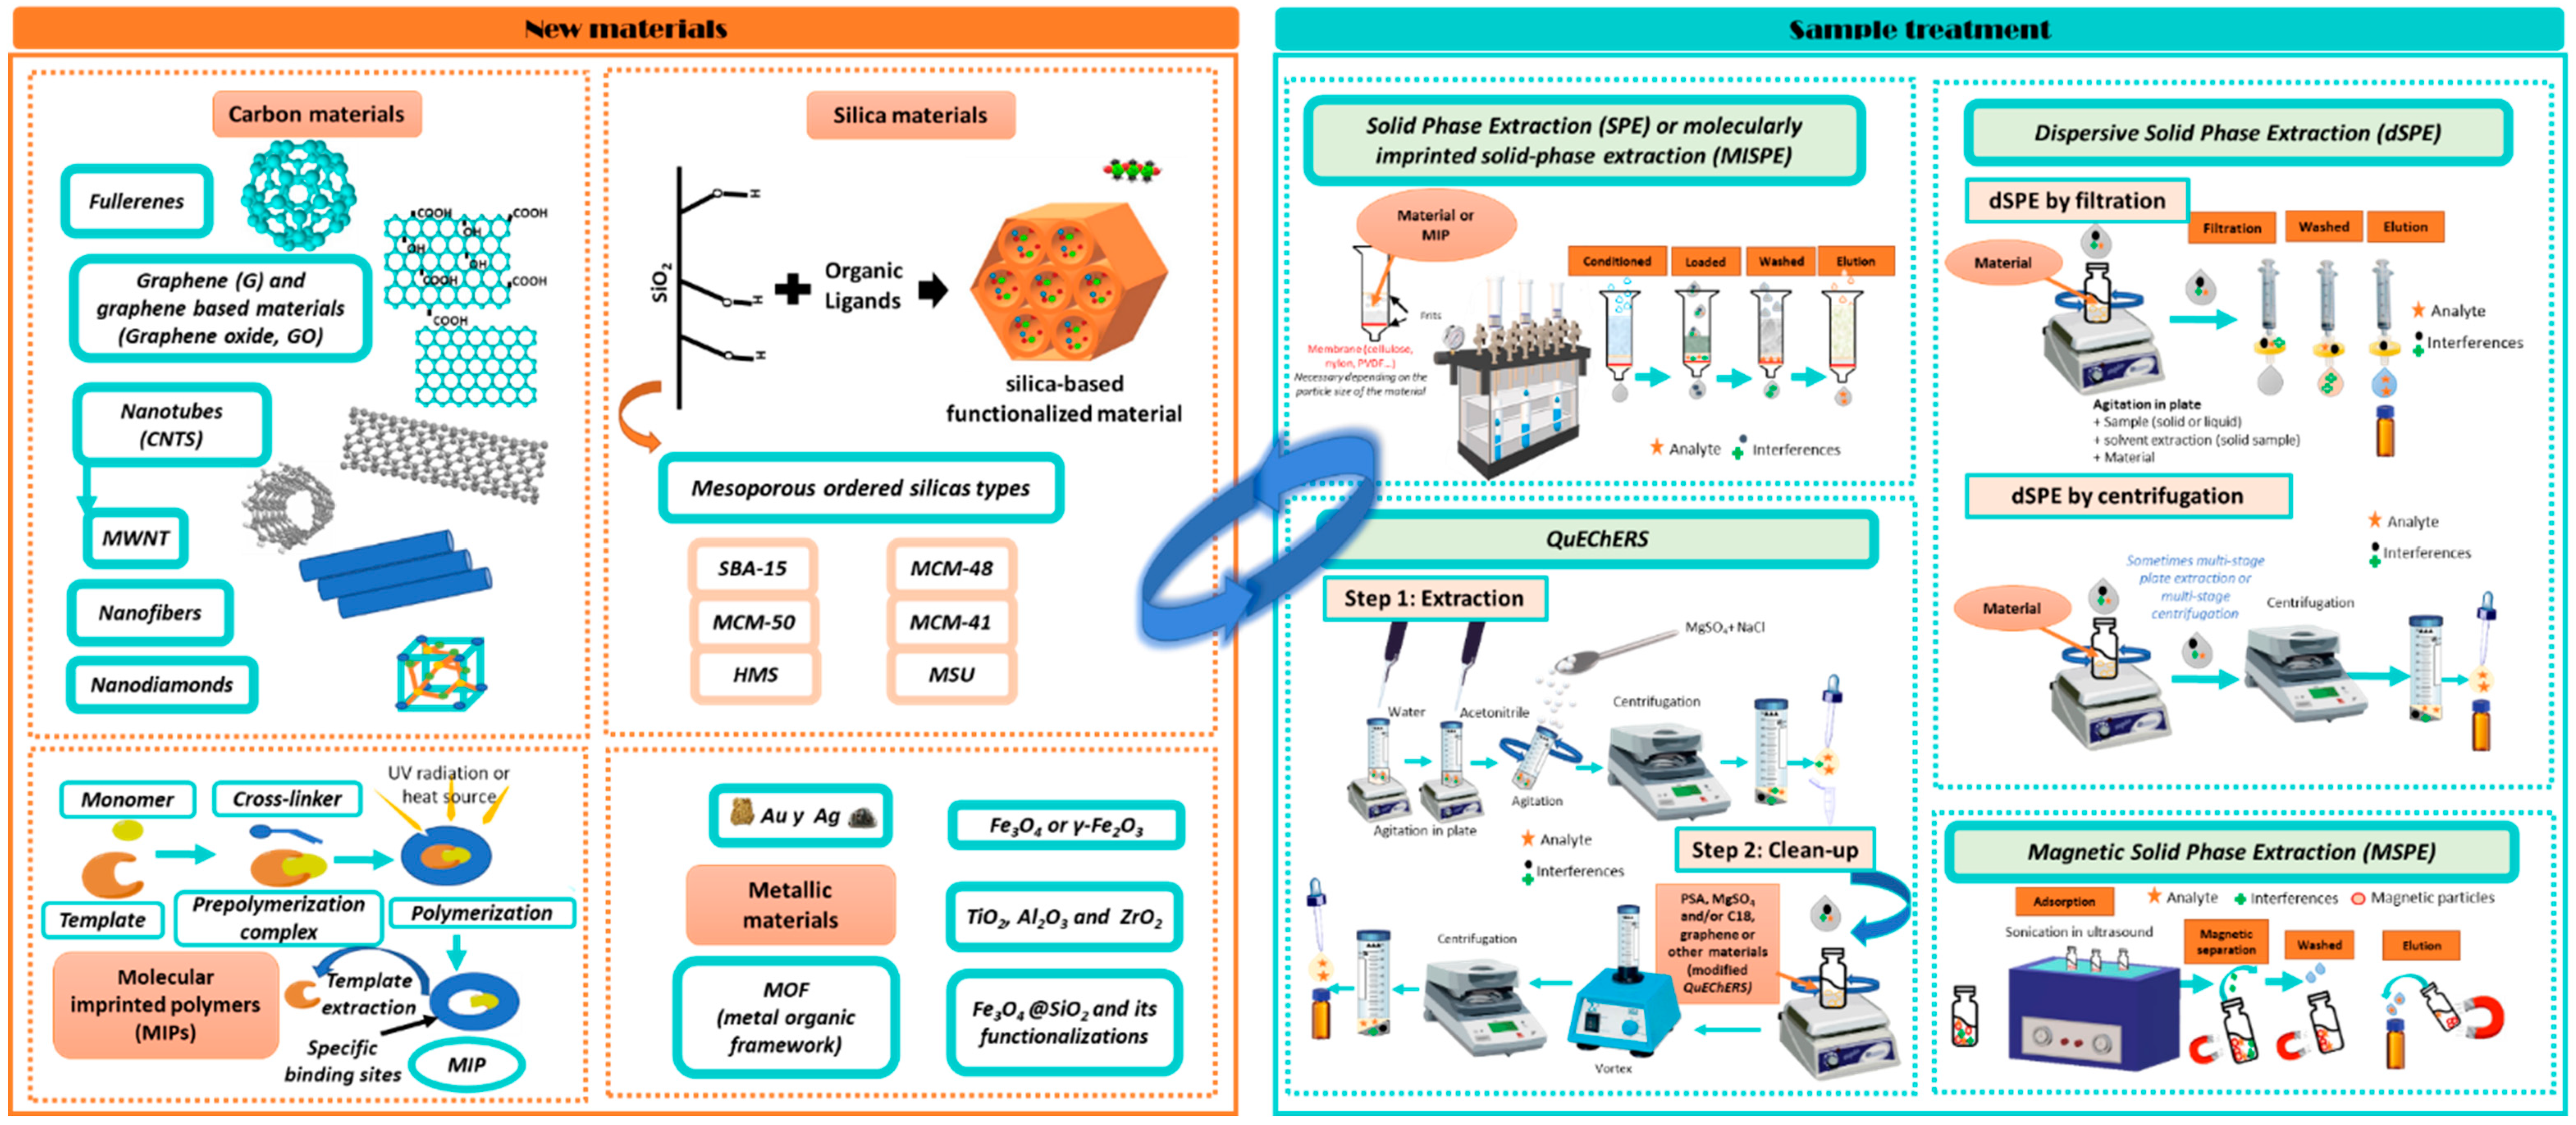
4.2.2. Methodologies with Other Extraction and Purification Techniques
Solid-Phase Extraction
QuEChERS Procedure
4.3. Application of New Materials in Sample Preparation
5. Future Projections and New Directions
6. Conclusions
Supplementary Materials
Author Contributions
Funding
Conflicts of Interest
References
- Aehle, E.; Dräger, B. Tropane alkaloid analysis by chromatographic and electrophoretic techniques: An update. J. Chromatogr. B Anal. Technol. Biomed. Life Sci. 2010, 878, 1391–1406. [Google Scholar] [CrossRef] [PubMed]
- European Food Safety Authority. Scientific Opinion on Tropane alkaloids in food and feed. EFSA J. 2013, 11, 1–113. [Google Scholar] [CrossRef]
- Alexander, J.; Benford, D.; Cockburn, A.; Cravedi, J.; Dogliotti, E.; Domenico, A.D.I.; Férnandez-Cruz, M.L.; Fürst, P.; Fink-gremmels, J.; Galli, C.L.; et al. Tropane alkaloids (from Datura sp.) as undesirable substances in animal feed—Scientific Opinion of the Panel on Contaminants in the Food Chain. EFSA J. 2008, 6, 1–55. [Google Scholar] [CrossRef]
- Kohnen-Johannsen, K.L.; Kayser, O. Tropane alkaloids: Chemistry, pharmacology, biosynthesis and production. Molecules 2019, 24, 796. [Google Scholar] [CrossRef] [PubMed] [Green Version]
- Martinello, M.; Borin, A.; Stella, R.; Bovo, D.; Biancotto, G.; Gallina, A.; Mutinelli, F. Development and validation of a QuEChERS method coupled to liquid chromatography and high resolution mass spectrometry to determine pyrrolizidine and tropane alkaloids in honey. Food Chem. 2017, 234, 295–302. [Google Scholar] [CrossRef] [PubMed]
- Abia, W.A.; Montgomery, H.; Nugent, A.P.; Elliott, C.T. Tropane alkaloid contamination of agricultural commodities and food products in relation to consumer health: Learnings from the 2019 Uganda food aid outbreak. Compr. Rev. Food Sci. Food Saf. 2021, 20, 501–525. [Google Scholar] [CrossRef]
- Romera-Torres, A.; Romero-González, R.; Martínez Vidal, J.L.; Garrido Frenich, A. Analytical methods, occurrence and trends of tropane alkaloids and calystegines: An update. J. Chromatogr. A 2018, 1564, 1–15. [Google Scholar] [CrossRef]
- Adamse, P.; van Egmond, H.P.; Noordam, M.Y.; Mulder, P.P.J.; De Nijs, M. Tropane alkaloids in food: Poisoning incidents. Qual. Assur. Saf. Crop. Foods 2014, 6, 15–24. [Google Scholar] [CrossRef]
- Dey, P.; Kundu, A.; Kumar, A.; Gupta, M.; Lee, B.M.; Bhakta, T.; Dash, S.; Kim, H.S. Analysis of Alkaloids (Indole Alkaloids, Isoquinoline Alkaloids, Tropane Alkaloids); Elsevier: Amsterdam, The Netherlands, 2020; ISBN 9780128164556. [Google Scholar]
- Wink, M. Alkaloids: Toxicology and Health Effects, 1st ed.; Elsevier Ltd.: Amsterdam, The Netherlands, 2015; ISBN 9780123849533. [Google Scholar]
- Debnath, B.; Singh, W.S.; Das, M.; Goswami, S.; Singh, M.K.; Maiti, D.; Manna, K. Role of plant alkaloids on human health: A review of biological activities. Mater. Today Chem. 2018, 9, 56–72. [Google Scholar] [CrossRef]
- Giménez-Bastida, J.A.; Zieliński, H. Buckwheat as a Functional Food and Its Effects on Health. J. Agric. Food Chem. 2015, 63, 7896–7913. [Google Scholar] [CrossRef]
- Cirlini, M.; Demuth, T.M.; Biancardi, A.; Rychlik, M.; Dall’Asta, C.; Bruni, R. Are tropane alkaloids present in organic foods? Detection of scopolamine and atropine in organic buckwheat (Fagopyron esculentum L.) products by UHPLC–MS/MS. Food Chem. 2018, 239, 141–147. [Google Scholar] [CrossRef] [PubMed]
- González-Gómez, L.; Gañán, J.; Morante-Zarcero, S.; Pérez-Quintanilla, D.; Sierra, I. Sulfonic Acid-Functionalized SBA-15 as Strong Cation-Exchange Sorbent for Solid-Phase Extraction of Atropine and Scopolamine in Gluten-Free Grains and Flours. Foods 2020, 9, 1854. [Google Scholar] [CrossRef] [PubMed]
- European Union. Commission regulation (EU) 2021/1408 of 27 August 2021 amending Regulation (EC) No 1881/2006 as regards maximum levels of tropane alkaloids in certain foodstuffs. Off. J. Eur. Union 2021, L304, 1–4. [Google Scholar]
- Marín-Sáez, J.; Romero-González, R.; Garrido Frenich, A. Multi-analysis determination of tropane alkaloids in cereals and solanaceaes seeds by liquid chromatography coupled to single stage Exactive-Orbitrap. J. Chromatogr. A 2017, 1518, 46–58. [Google Scholar] [CrossRef] [PubMed]
- Mulder, P.P.J.; Pereboom-de Fauw, D.P.K.H.; Hoogenboom, R.L.A.P.; de Stoppelaar, J.; de Nijs, M. Tropane and ergot alkaloids in grain-based products for infants and young children in the Netherlands in 2011–2014. Food Addit. Contam. Part B Surveill. 2015, 8, 284–290. [Google Scholar] [CrossRef]
- Marín-Sáez, J.; Romero-González, R.; Garrido Frenich, A. Reliable determination of tropane alkaloids in cereal based baby foods coupling on-line spe to mass spectrometry avoiding chromatographic step. Food Chem. 2019, 275, 746–753. [Google Scholar] [CrossRef] [PubMed]
- Baslé, Q.; Mujahid, C.; Bessaire, T. Application of a streamlined LC-MS/MS methodology for the determination of atropine and scopolamine in cereals from Asian and African countries. Food Addit. Contam. Part A Chem. Anal. Control. Expo. Risk Assess. 2020, 37, 1744–1754. [Google Scholar] [CrossRef]
- RASFF Portal—Food and Feed Safety Alerts. Available online: https://webgate.ec.europa.eu/rasff-window/portal/? (accessed on 28 March 2021).
- Mulder, P.P.J.; de Nijs, M.; Castellari, M.; Hortos, M.; MacDonald, S.; Crews, C.; Hajslova, J.; Stranska, M. Occurrence of tropane alkaloids in food. EFSA Support. Publ. 2016, 13, 1140E. [Google Scholar] [CrossRef] [Green Version]
- Chen, H.; Marín-Sáez, J.; Romero-González, R.; Garrido Frenich, A. Simultaneous determination of atropine and scopolamine in buckwheat and related products using modified QuEChERS and liquid chromatography tandem mass spectrometry. Food Chem. 2017, 218, 173–180. [Google Scholar] [CrossRef]
- Veršilovski, A.; Mulder, P.P.J.; Pereboom-de Fauw, D.P.K.H.; de Stoppelaar, J.; de Nijs, M. Simultaneous quantification of ergot and tropane alkaloids in bread in the Netherlands by LC-MS_MS.pdf. Food Addit. Contam. Part B 2020, 13, 215–223. [Google Scholar] [CrossRef]
- Chan, T.Y.K. Worldwide occurrence and investigations of contamination of herbal medicines by Tropane Alkaloids. Toxins 2017, 9, 284. [Google Scholar] [CrossRef] [Green Version]
- Cirlini, M.; Cappucci, V.; Galaverna, G.; Dall’Asta, C.; Bruni, R. A sensitive UHPLC-ESI-MS/MS method for the determination of tropane alkaloids in herbal teas and extracts. Food Control 2019, 105, 285–291. [Google Scholar] [CrossRef]
- Romera-Torres, A.; Romero-González, R.; Martínez Vidal, J.L.; Garrido Frenich, A. Simultaneous analysis of tropane alkaloids in teas and herbal teas by liquid chromatography coupled to high-resolution mass spectrometry (Orbitrap). J. Sep. Sci. 2018, 41, 1938–1946. [Google Scholar] [CrossRef] [PubMed]
- Shimshoni, J.A.; Duebecke, A.; Mulder, P.P.J.; Cuneah, O.; Barel, S. Pyrrolizidine and tropane alkaloids in teas and the herbal teas peppermint, rooibos and chamomile in the Israeli market. Food Addit. Contam. Part A Chem. Anal. Control. Expo. Risk Assess. 2015, 32, 2058–2067. [Google Scholar] [CrossRef] [PubMed]
- González-Gómez, L.; Morante-zarcero, S.; Pérez-Quintanilla, D.; Sierra, I. Analysis of atropine and scopolamine in culinary aromatics herbs by HPLC-MS/MS: Evaluation of two functionalized mesostructured silicas as cation-exchange sorbents in packed or dispersive solid phase extraction. J. Chromatogr. A 2022, under review, unpublished results. [Google Scholar]
- Castilla-Fernández, D.; Moreno-González, D.; García-Reyes, J.F.; Ballesteros, E.; Molina-Díaz, A. Determination of atropine and scopolamine in spinach-based products contaminated with genus Datura by UHPLC–MS/MS. Food Chem. 2021, 347, 1–7. [Google Scholar] [CrossRef]
- Zheng, W.; Yoo, K.H.; Choi, J.M.; Park, D.H.; Kim, S.K.; Kang, Y.S.; Abd El-Aty, A.M.; Hacımüftüoğlu, A.; Jeong, J.H.; Bekhit, A.E.D.; et al. A modified QuEChERS method coupled with liquid chromatography-tandem mass spectrometry for the simultaneous detection and quantification of scopolamine, L-hyoscyamine, and sparteine residues in animal-derived food products. J. Adv. Res. 2019, 15, 95–102. [Google Scholar] [CrossRef]
- Lamp, J.; Knappstein, K.; Walte, H.G.; Krause, T.; Steinberg, P.; Schwake-Anduschus, C. Transfer of tropane alkaloids (atropine and scopolamine) into the milk of subclinically exposed dairy cows. Food Control 2021, 126, 108056. [Google Scholar] [CrossRef]
- Romera-Torres, A.; Romero-González, R.; Martínez Vidal, J.L.; Garrido Frenich, A. Comprehensive tropane alkaloids analysis and retrospective screening of contaminants in honey samples using liquid chromatography-high resolution mass spectrometry (Orbitrap). Food Res. Int. 2020, 133, 109130. [Google Scholar] [CrossRef]
- Thompson, T.S.; van den Heever, J.P.; Limanowka, R.E. Hyoscyamine and Scopolamine in Honey by HILIC–ESI-MS/MS. Chromatographia 2020, 83, 683–689. [Google Scholar] [CrossRef]
- European Union. Commision Recommendation (EU) 2015/976 of 19 June 2015 on the monitoring of the presence of tropane alkaloids in food. Off. J. Eur. Union 2015, 11, 97–98. [Google Scholar]
- European Union. Commission Regulation (EU) 2016/239 of 19 February 2016 amending Regulation (EC) No 1881/2006 as regards maximum levels of tropane alkaloids in certain cereal-based foods for infants and young children. Off. J. Eur. Union 2016, L45, 3–5. [Google Scholar]
- Arcella, D.; Altieri, A.; Horváth, Z. Human acute exposure assessment to tropane alkaloids. EFSA J. 2018, 16, 1–29. [Google Scholar] [CrossRef] [Green Version]
- Dräger, B. Analysis of tropane and related alkaloids. J. Chromatogr. A 2002, 978, 1–35. [Google Scholar] [CrossRef]
- Dzuman, Z.; Jonatova, P.; Stranska-Zachariasova, M.; Prusova, N.; Brabenec, O.; Novakova, A.; Fenclova, M.; Hajslova, J. Development of a new LC-MS method for accurate and sensitive determination of 33 pyrrolizidine and 21 tropane alkaloids in plant-based food matrices. Anal. Bioanal. Chem. 2020, 412, 7155–7167. [Google Scholar] [CrossRef] [PubMed]
- Marín-Sáez, J.; Romero-González, R.; Garrido Frenich, A. Degradation of tropane alkaloids in baked bread samples contaminated with Solanaceae seeds. Food Res. Int. 2019, 122, 585–592. [Google Scholar] [CrossRef]
- Marín-Sáez, J.; Romero-González, R.; Garrido Frenich, A. Effect of tea making and boiling processes on the degradation of tropane alkaloids in tea and pasta samples contaminated with Solanaceae seeds and coca leaf. Food Chem. 2019, 287, 265–272. [Google Scholar] [CrossRef]
- Urban, M.; Hann, S.; Rost, H. Simultaneous determination of pesticides, mycotoxins, tropane alkaloids, growth regulators, and pyrrolizidine alkaloids in oats and whole wheat grains after online clean-up via two-dimensional liquid chromatography tandem mass spectrometry. J. Environ. Sci. Heal. Part B Pestic. Food Contam. Agric. Wastes 2019, 54, 98–111. [Google Scholar] [CrossRef]
- Rausch, A.K.; Brockmeyer, R.; Schwerdtle, T. Development, validation, and application of a multi-method for the determination of mycotoxins, plant growth regulators, tropane alkaloids, and pesticides in cereals by two-dimensional liquid chromatography tandem mass spectrometry. Anal. Bioanal. Chem. 2021, 413, 3041–3054. [Google Scholar] [CrossRef]
- Klein-Júnior, L.C.; Vander Heyden, Y.; Henriques, A.T. Enlarging the bottleneck in the analysis of alkaloids: A review on sample preparation in herbal matrices. TrAC Trends Anal. Chem. 2016, 80, 66–82. [Google Scholar] [CrossRef]
- Ötles, S.; Kartal, C. Solid-Phase Extraction (SPE): Principles and applications in food samples. Acta Sci. Pol. Technol. Aliment. 2016, 15, 5–15. [Google Scholar] [CrossRef] [PubMed] [Green Version]
- Pavlović, D.M.; Babić, S.; Dolar, D.; Ašperger, D.; Košutić, K.; Horvat, A.J.M.; Kaštelan-Macan, M. Development and optimization of the SPE procedure for determination of pharmaceuticals in water samples by HPLC-diode array detection. J. Sep. Sci. 2010, 33, 258–267. [Google Scholar] [CrossRef] [PubMed]
- Anastassiades, M.; Lehotay, S.J.; Štajnbaher, D.; Schenck, F.J. Fast and easy multiresidue method employing acetonitrile extraction/partitioning and. J. AOAC Int. 2003, 86, 412–431. [Google Scholar] [CrossRef] [PubMed] [Green Version]
- Sierra, I.; Morante-Zarcero, S. New Advances in Food Sample Preparation with Nanomaterials for Organic Contaminants Analysis by Liquid Chromatography; Elsevier Inc.: Amsterdam, The Netherlands, 2018; ISBN 9780128127926. [Google Scholar]
- Turiel, E.; Martín-Esteban, A. Molecularly imprinted polymers for sample preparation: A review. Anal. Chim. Acta 2010, 668, 87–99. [Google Scholar] [CrossRef] [PubMed]
- Zeng, S.; She, Y.; Jiao, B.; Liu, G.; Wang, J.; Su, X.; Ma, X.; Jin, M.; Jin, F.; Wang, S. Molecularly imprinted polymer for selective extraction and simultaneous determination of four tropane alkaloids from Przewalskia tangutica Maxim. fruit extracts using LC-MS/MS. RSC Adv. 2015, 5, 94997–95006. [Google Scholar] [CrossRef]
- Zuo, J.; Zhang, X.; Li, X.; Li, Z.; Li, Z.; Li, H.; Zhang, W. Preparation of monoethyl fumarate-based molecularly imprinted polymers and their application as a solid-phase extraction sorbent for the separation of scopolamine from tropane alkaloids. RSC Adv. 2019, 9, 19712–19719. [Google Scholar] [CrossRef] [Green Version]
- Bujak, R.; Gadzała-Kopciuch, R.; Nowaczyk, A.; Raczak-Gutknecht, J.; Kordalewska, M.; Struck-Lewicka, W.; Markuszewski, M.J.; Buszewski, B. Selective determination of cocaine and its metabolite benzoylecgonine in environmental samples by newly developed sorbent materials. Talanta 2016, 146, 401–409. [Google Scholar] [CrossRef]
- Casado, N.; Pérez-Quintanilla, D.; Morante-Zarcero, S.; Sierra, I. Current development and applications of ordered mesoporous silicas and other sol–gel silica-based materials in food sample preparation for xenobiotics analysis. TrAC Trends Anal. Chem. 2017, 88, 167–184. [Google Scholar] [CrossRef]
- González, L.; Morante-Zarcero, S.; Pérez-Quintanilla, D.; Sierra, I. Hydroxymethylfurfural determination in cereal and insect bars by high-performance liquid chromatography-mass spectrometry employing a functionalized mesostructured silica as sorbent in solid-phase extraction. J. Chromatogr. A 2020, 1622, 461124. [Google Scholar] [CrossRef]
- Casado-Hidalgo, G.; Pérez-Quintanilla, D.; Morante-Zarcero, S.; Sierra, I. Mesostructured silica-coated magnetic nanoparticles to extract six opium alkaloids in poppy seeds prior to ultra-high-performance liquid chromatography-tandem mass spectrometry analysis. Foods 2021, 10, 1587. [Google Scholar] [CrossRef]
- Casado, N.; Gañán, J.; Morante-Zarcero, S.; Sierra, I. New advanced materials and sorbent-based microextraction techniques as strategies in sample preparation to improve the determination of natural toxins in food samples. Molecules 2020, 25, 702. [Google Scholar] [CrossRef] [PubMed] [Green Version]
- Chen, Q.; Zhu, L.; Chen, J.; Jiang, T.; Ye, H.; Ji, H.; Tsang, S.; Zhao, Z.; Yi, T.; Chen, H. Recent progress in nanomaterial-based assay for the detection of phytotoxins in foods. Food Chem. 2019, 277, 162–178. [Google Scholar] [CrossRef] [PubMed]
- Izcara, S.; Casado, N.; Morante-Zarcero, S.; Pérez-Quintanilla, D.; Sierra, I. Miniaturized and modified QuEChERS method with mesostructured silica as clean-up sorbent for pyrrolizidine alkaloids determination in aromatic herbs. Food Chem. 2022, 380, 132189, in press. [Google Scholar] [CrossRef] [PubMed]
- Yohannes, A.; Yao, S. Preconcentration of tropane alkaloids by a metal organic framework (MOF)-immobilized ionic liquid with the same nucleus for their quantitation in Huashanshen tablets. Analyst 2019, 144, 6989–7000. [Google Scholar] [CrossRef]


| Foods (Nº of Samples Analyzed) | Nº of Samples with At (Range) | Nº of Samples with Sc (Range) | Other TAs | [Ref.] |
|---|---|---|---|---|
| Green tea, black tea, chamomile, fennel, melissa, peppermint and rooibos (70 samples) | 1 of fennel (83 µg/kg) 8 of peppermint (20–208 µg/kg) | 1 of fennel (11 µg/kg) 8 of peppermint (20–208 µg/kg) 1 of chamomile (2.1 µg/kg) 1 of rooibos (2 µg/kg) | N.St | [27] |
| Dry (herbal) teas (121 samples) | 85 of dry (herbal) teas (0.0067–294.8 µg/kg) | 85 of dry (herbal) teas (0.0067–133.7 µg/kg) | 6-HO-tropinone, Nortropinone, Pseudotropine, Scopine, Scopoline, Tropine, tropinone, convolamine, convolidine, convolvine, fillalbine, anisodamine, apoatropine, aposcopolamine, homatropine, littorine, noratropine, norscopolamine | [21] |
| Green tea with mint, green tea with mate, Piccadilly tea, red Chinese tea, rooibos of apple, relaxing tea, Mentha pulegium tea, ayurvedic spiced tea, coca leaf tea, mixture of teas (11 samples) | 1 of Mentha pulegium tea (9 µg/kg) 1 of coca leaf tea (27 µg/kg) | N.D | Physoperuvine, pseudotropine, tropine, homatropine, apoatropine | [26] |
| Herbal teas, herbal supplements (60 samples) | 1 of herbal tea with Melissa officinalis and others (25 µg/kg) 1 of herbal tea with Taraxacum officinalis and others (69 µg/kg) | 1 of herbal tea with Melissa officinalis and others (50 µg/kg) | Homatropine, anidosamine | [25] |
| Thyme, basil and coriander (16 samples) | 5 of thyme (<5–5.7 µg/kg) 5 of basil (9–11.7 µg/kg) 4 of coriander (9.9–42 µg/kg) | 2 of thyme (<5 µg/kg) 1 of coriander (34 µg/kg) | N.St | [28] |
| Foods (Nº of Samples Analyzed) | Nº of Samples with At (Range) | Nº of Samples with Sc (Range) | Other TAs | [Ref.] |
|---|---|---|---|---|
| Honey (40 samples) | 9 of honey (1.4–3.8 µg/kg) | N.D | N. St | [5] |
| Porcine muscle, egg, milk (30 samples) | N.D | N.D | N.St | [30] |
| Honey (23 samples) | 2 of honey (0.012 µg/kg) | 1 of honey (0.012 µg/kg) | N.St | [33] |
| Honey (19 samples) | N.D | 2 of honey (27 µg/kg) | Physoperuvine, tropine, pseudotropine, tropinone | [32] |
| Analyte | Sample (Amount) | Extraction Conditions | Other Treatments | Recovery (%) | [Ref.] |
|---|---|---|---|---|---|
| At, Sc + 4 TAs + others (ergot alkaloids) | Breakfast cereals, breakfast cereals with milk, biscuits, cookies (4 g) | 40 mL MeOH/ H2O /FA (60:40:0.4, v/v/v) + agitation (30 min) + centrifuged (15 min, 3500 g) | Ultrafiltrated | 86–91 TAs 88 At 88 Sc | [17] |
| At, Sc + 4 TAs + others (pyrrolizidine alkaloids) | Green tea, black tea, chamomile, fennel, melissa, peppermint and rooibos (1 g) | 10 mL of aqueous HAC/MeOH solution (1:2, v/v) + agitation (30 min) + centrifuged (10 min, 4000 g) | Diluted with NH4OH + evaporated with N2 at 40 °C + reconstituted in H2O + filtered | 80–95 TAs | [27] |
| At, Sc | Buckwheat flour, pasta and bakery (5 g) | 25 mL MeOH/H2O (3:2, v/v) with 0.2% FA + 0.2% ACN + agitation (90 min) + centrifuged (15 min, 4000 rpm) | Diluted with the extraction solvent | 88–103 At 83–103 Sc | [13] |
| At, Sc + 12 TAs + others (calystegines) | Bread (3 g) | 30 mL H2O (HAC 0.5%)/MeOH (1:2, v/v) + vortex (1 min) + agitation (30 min) + centrifuged (10 min, 5000 rpm) | - | 75–101 TAs 93 At 88 Sc | [39] |
| At, Sc + 11 TAs + others (cocaine, calystegines) | Pasta (3 g) | 30 mL MeOH/H2O (2:1, v/v) with 0.5% HAC + Polytron (30 s) + agitation (30 min) + centrifuged (10 min, 4480 rcf) | Filtered | 74–98 TAs 93 At 93 Sc | [40] |
| At, Sc + 2 TAs | Herbal teas, herbal supplements (1 g) | 25 mL ACN/H2O (3:2, v/v) with 0.2% FA + agitation (90 min) + centrifuged (15 min, 2150 g × 2) | Diluted with the extraction solvent | 83–107 TAs 105–107 At 83–103 Sc | [25] |
| At, Sc + others (pesticides, mycotoxins, growth regulators, pyrrolizidine alkaloids) | Oats and wheat (5 g) | 10 mL ACN/ H2O (80:20, v/v) + shaking (2 min) + agitation (30 min) + centrifuged (5 min, 3000 rpm) | Filtered | 75–119 At 72–116 Sc | [41] |
| At, Sc + 4 TAs + others (ergot alkaloids) | Bread (wheat, multi-grain, rye, wheat-rye) (4 g) | 40 mL MeOH/H2O/FA (60:40:0.4, v/v/v) + agitation (30 min) + centrifuged (15 min, 3500 g) | Ultrafiltrated | 73–94 TAs 83 At 73 Sc | [23] |
| At, Sc | Honey (5 g) | 10 mL sodium acetate solution + vortex (2500 rpm, 15 min) + 10 mL ACN + centrifugation (10 min, 3000 rpm) | - | 87–103 At 87–106 Sc | [33] |
| At, Sc + 19 TAs + others (pyrrolizidine alkaloids) | Sorghum, oregano, herbal tea (1 g) | 10 mL MeOH/H2O/FA (60:39.6:0.4, v/v/v) + agitation (30 min) + centrifuged (5 min, g) | Filtered | 78–115 TAs 95–111 At 84–110 Sc | [38] |
| At, Sc + others (mycotoxins, plant growth regulators, pesticides) | Wheat, barley, rice, oats, spelt, rye (2.5 g) | 10 mL ACN/H2O/FA (79:20:1, v/v/v) + agitation (30 min) + centrifuged (3 min, 1902 g) | Filtered and diluted with ACN | 103 At 105 Sc | [42] |
| Analyte | Sample (Amount) | SLE Conditions | SPE Conditions | Other Treatments | Recovery (%) | [Ref.] |
|---|---|---|---|---|---|---|
| At, Sc + 22 TAs | Flours (buckwheat, millet and corn), cereal-based food (breakfast cereals, biscuits, pastry, pasta and bread), legumes, stir-fry mixes, dry herbal teas (4 g) | 40 mL MeOH/H2O/FA (75:25:0.4, v/v/v) + agitation (30 min) + centrifuged (15 min, 3500 rpm) | OASIS MCX (150 mg) or Strata-X (200 mg) C: MeOH (6 mL) + MeOH/H2O/FA (75:25:1, v/v/v) (6 mL) L: supernatant (10 mL, in teas 5 mL) W: MeOH/H2O/ FA (75:25:1, v/v/v) (6 mL) Dry under vacuum (5–10 min) E: MeOH with 0.5% NH4OH (aq) | Evaporated with N2 in a warmed water bath + reconstituted in MeOH/H2O (10:90, v/v) + filtered | 20–124 TAs 64–112 At 51–117 Sc | [21] |
| At, Sc + 22 TAs | Herbal tea infusions (37.5 mL) | - | OASIS MCX (150 mg) C: MeOH (6 mL) + H2O with 1% FA (6 mL) L: 37.5 mL infusion (+ 75 µL FA + centrifuged) W: MeOH/H2O/ FA (75:25:1, v/v/v) (6 mL) Dry under vacuum (5–10 min) E: MeOH with 0.5% NH4OH (aq) | Evaporated with N2 in a warmed water bath + reconstituted in MeOH/H2O (10:90, v/v) + filtered | 51–104 TAs 92 At 90 Sc | [21] |
| At, Sc + 11 TAs | Buckwheat, buckwheat flour and pasta; soy and soy flour; peeled millet and millet flour; linseed and linseed flour (1 g) | 10 mL H2O (HAC 0.5%)/MeOH (1:2, v/v) + vortex (1 min) + agitation (30 min) + centrifuged (10 min, 5000 rpm) | Strata-X (200 mg) C: MeOH/ H2O (1% HAC) (2:1, v/v) L: supernatant (10 mL) W: MeOH/H2O (1% HAC) (2:1, v/v) E: MeOH with 3% NH4OH (aq) | Evaporated with N2 + reconstituted in MeOH/H2O (0.1% HAC) (50:50, v/v) + filtered | 60–109 TAs 63–93 At 63–94 Sc | [16] |
| At, Sc + 11 TAs | Teas and herbal teas (1 g) | 10 mL MeOH/H2O/FA (75:25:0.4, v/v/v) + agitation (30 min) + centrifuged (5 min, 5000 rpm) | Strata-X-C (200 mg) C: MeOH/ H2O/FA (75:25:1, v/v/v) L: supernatant (5 mL) W: MeOH/ H2O/FA (75:25:1, v/v/v) Dry under vacuum (1 h) E: MeOH with 3% NH4OH (aq) | Evaporated with N2 + reconstituted in H2O/MeOH (90:10 v/v) + filtered | 75–128 TAs 99–113 At 96–122 Sc | [26] |
| At, Sc + 11 TAs | Cereal based baby foods (pap, biscuits, snacks and grissines) (1 g) | 10 mL MeOH/H2O (2:1, v/v) with 0.5% HAC + vortex (1 min) + agitation (30 min) + centrifuged (10 min, 4480 rcf) and diluted tenfold with MeOH/H2O (2:1, v/v) with 1% HAC | Strata-X-C (20 × 2 mm, 25 µm) SPE online, 8 mL injected | - | 66–98 TAs 68–95 At 83–93 Sc | [18] |
| At, Sc + 11 TAs + others (cocaine, calystegines) | Tea (3 g) | - | Strata-X-C (200 mg) C: MeOH (6 mL) and MeOH/H2O (1% HAC) (2:1, v/v) (6 mL) L: 45 mL infusion (+ cooled + centrifuged + acidified 1% HAC) W: MeOH/H2O (1% HAC) (2:1, v/v) (6 mL) E: MeOH with 3% NH4OH (aq) (6 mL) | - | 74–98 TAs 93 At 93 Sc | [40] |
| Analyte | Sample (Amount) | Extraction Conditions | Clean-Up Conditions | Other Treatments | Recovery (%) | [Ref.] |
|---|---|---|---|---|---|---|
| At, Sc + others (pyrrolizidine alkaloids) | Honey (1.5 g) | 10 mL H2SO4 (0.1 M) + 0.5 g of zinc dust + agitation (1 h 30 min) + centrifuged (10 min, 3700 g) = supernatant + 10 mL ACN + Q-Sep QuEChERS extraction salts: MgSO4 (4 g), C6H5Na3O7 2H2O (1 g), C6H6Na2O7 1.5 H2O (0.5 g), NaCl (1 g) + shaken (4 min) + centrifuged | PSA (0.15 mg), MgSO4 (0.9 g). Vortex + centrifuged | Evaporated under vacuum at 45 °C + reconstituted in ACN/H2O (0.1% FA) (13:87, v/v) | 101–104 At 96–109 Sc | [5] |
| At, Sc | Buckwheat, buckwheat flour and pasta, soy, wheat, amaranthus grain, chia seeds, peeled millet (5 g) | 10 mL H2O + vortex (1 min) + 10 mL of ACN with 1% FA + vortex (2 min) + Na2SO4 (4 g) + NH₄CH₃CO₂ (1 g) + centrifuged (5 min, 5000 rpm) | PSA (25 mg), GBC (25 mg). Vortex (1 min) + centrifuged (5 min, 5000 rpm) | Diluted with H2O + filtered | 66–92 At 50–88 Sc | [22] |
| Sc, L-hyoscyamine + other (sparteine) | Porcine muscle (2 g) Egg and milk (2 mL) | 0.1 mL EDTA + 10 mL of ACN with 0.5% TFA + vortex 5 min + MgSO4 (4 g) + NaCl (1 g) + C6H5Na3O7 2H2O (1 g) + C6H6Na2O7·1.5 H2O (0.5 g) + vortex (5 min) + centrifuged (10 min, 2600 g) | C18 (0.15 g), MgSO4 (0.9 g) Vortex (5 min) + centrifuged (10 min, 2600 g) | Evaporated with N2 at 45 °C + reconstituted in MeOH + vortex + centrifuged + filtered | 83–99 At 74–99 Sc | [30] |
| At, Sc + 9 TAs | Honey (2.5 g) | 10 mL MeOH/ H2O/FA (75:25:0.4, v/v/v) + agitation (30 min) + centrifuged (10 min, 5000 rpm) | MgSO4 (0.3 g), GBC (0.05 g). Vortex (1 min) + centrifuged (10 min, 5000 rpm) | Filtered | 71–120 TAs 85–103 At 116–120 Sc | [32] |
| At, Sc | Wheat, corn, rice, oat and millet flours, mixed cereals flours, infant cereals, cereal-based products (5 g) | 10 mL H2O + shaken + 10 mL of ACN with HAC (95:5, v/v) + agitation (30 min) + QuEChERS salt mixture: NaCl (1 g) + MgSO4 (4 g) + shaken + centrifuged (10 min, 3500 rpm) = 5 mL + hexane + shaken + centrifuged (1 min, 4000 g) | The hexane phase was discarded | Evaporated with N2 at 40 °C + reconstituted in MeOH + sonicated + diluted with H2O + vortex + centrifuged | 95–107 At 87–118 Sc | [19] |
| At, Sc | Spinach-based products (10 g) | 10 mL of ACN + NaCl (1 g) + MgSO4 (4 g) + C6H5Na3O7 2H2O (1 g) + C6H6Na2O7 1.5 H2O (0.5 g) + shaken (1 min) + centrifuged (5 min, 3500 rpm) = 5 mL | PSA (0.25 mg), MgSO4 (0.75 g). Shaken (30 s) + centrifuged (5 min, 3500 rpm) | Diluted with H2O + Filtered | 94–103 At 91–98 Sc | [29] |
| Analyte | Sample (Amount) | SLE Conditions | SPE Conditions | Other Treatments | Recovery (%) | [Ref.] |
|---|---|---|---|---|---|---|
| At, Sc + 2 TAs | Przewalskia tangutica fruit (1 g) | 3 mL NH3 + vortex (2 min) + 30 mL ACN + agitation (30 min) + centrifuged (5 min, 8000 rpm) × 3 Evaporated + dissolved in MeOH (1 mL) before MISPE | MIP (100 mg) C: ACN (3 mL) L: supernatant (1 mL) W: ACN saturated n-hexane (1 mL) E: HAC/MeOH (3/7, v/v) (2 mL) | - | 82–102 TAs 97–102 At 95–98 Sc | [49] |
| Sc | Plants (Hindu Datura, Belladona and Hyoscyamus niger) (50 mg) | 250 mL HCl (2 M) + ultrasound (2 h) 10 mL supernatant + NH3 (pH 8–9) + dichloromethane + dried + dissolved with MeOH (50 mL) before MISPE | MIP (100 mg) C: MeOH (10 mL) + dichloromethane (5 mL) L: supernatant (10 mL) W: MeOH/ethyl acetate (10/90, v/v) (5 mL) E: MeOH/H2O (2% HAC) (60/40, v/v) (2 mL) | Evaporated + reconstituted in dichloromethane | 96–106 | [50] |
| At, Sc | Gluten-Free grains and flours (1 g) | 8 mL H2O (1.1% HCl, pH 1.0) + agitation (30 min) + centrifuged (10 min, 6000 rpm) + precipitate washing 1 mL H2O (1.1% HCl, pH 1.0) + filtration before SPE | M-SBA-15-SO3− (150 mg) C: H2O (1.1% HCl, pH 1.0) (5 mL) L: supernatant (9 mL) W: H2O (1.1% HCl, pH 1.0) (3 mL) E: MeOH (3 mL) + MeOH with 10% ammonia solution (90:10, v/v, pH 11.8) (6 mL) | Evaporated under vacuum + reconstituted in ACN/H2O (50:50, v/v) | 93–105 At 93–96 Sc | [14] |
| At, Sc | Thyme, basil, coriander (0.25 g) | 8 mL H2O (1.1% HCl, pH 1.0) + agitation (30 min) + centrifuged (10 min, 6000 rpm) + precipitate washing 1 mL H2O (1.1% HCl, pH 1.0) + filtration before SPE | HMS-SO3− (75 mg) C: H2O (1.1% HCl, pH 1.0) (5 mL) L: supernatant (9 mL) W: H2O (1.1% HCl, pH 1.0) (3 mL) E: MeOH (3 mL) + MeOH with 10% ammonia solution (90:10, v/v, pH 11.8) (6 mL) | Evaporated under vacuum + reconstituted in ACN/H2O (50:50, v/v) | 87–92 At 70–92 Sc | [28] |
Publisher’s Note: MDPI stays neutral with regard to jurisdictional claims in published maps and institutional affiliations. |
© 2022 by the authors. Licensee MDPI, Basel, Switzerland. This article is an open access article distributed under the terms and conditions of the Creative Commons Attribution (CC BY) license (https://creativecommons.org/licenses/by/4.0/).
Share and Cite
González-Gómez, L.; Morante-Zarcero, S.; Pérez-Quintanilla, D.; Sierra, I. Occurrence and Chemistry of Tropane Alkaloids in Foods, with a Focus on Sample Analysis Methods: A Review on Recent Trends and Technological Advances. Foods 2022, 11, 407. https://doi.org/10.3390/foods11030407
González-Gómez L, Morante-Zarcero S, Pérez-Quintanilla D, Sierra I. Occurrence and Chemistry of Tropane Alkaloids in Foods, with a Focus on Sample Analysis Methods: A Review on Recent Trends and Technological Advances. Foods. 2022; 11(3):407. https://doi.org/10.3390/foods11030407
Chicago/Turabian StyleGonzález-Gómez, Lorena, Sonia Morante-Zarcero, Damián Pérez-Quintanilla, and Isabel Sierra. 2022. "Occurrence and Chemistry of Tropane Alkaloids in Foods, with a Focus on Sample Analysis Methods: A Review on Recent Trends and Technological Advances" Foods 11, no. 3: 407. https://doi.org/10.3390/foods11030407