Article

Influence of Sample Matrix on Determination of Histamine in Fish by Surface Enhanced Raman Spectroscopy Coupled with Chemometric Modelling

1
Faculty of Food Technology and Biotechnology, University of Zagreb, Pierottijeva 6, 10000 Zagreb, Croatia
2
Center of Excellence for Advanced Materials and Sensing Devices, Ruđer Bošković Institute, Bijenička c. 54, 10000 Zagreb, Croatia
*
Author to whom correspondence should be addressed.
Foods 2021, 10(8), 1767; https://doi.org/10.3390/foods10081767
Submission received: 30 June 2021 / Revised: 27 July 2021 / Accepted: 29 July 2021 / Published: 30 July 2021
(This article belongs to the Special Issue Advanced Methods for Evaluation of Seafood Quality)

Abstract

:
Histamine fish poisoning is a foodborne illness caused by the consumption of fish products with high histamine content. Although intoxication mechanisms and control strategies are well known, it remains by far the most common cause of seafood-related health problems. Since conventional methods for histamine testing are difficult to implement in high-throughput quality control laboratories, simple and rapid methods for histamine testing are needed to ensure the safety of seafood products in global trade. In this work, the previously developed SERS method for the determination of histamine was tested to determine the influence of matrix effect on the performance of the method and to investigate the ability of different chemometric tools to overcome matrix effect issues. Experiments were performed on bluefin tuna (Thunnus thynnus) and bonito (Sarda sarda) samples exposed to varying levels of microbial activity. Spectral analysis confirmed the significant effect of sample matrix, related to different fish species, as well as the extent of microbial activity on the predictive ability of PLSR models with R2 of best model ranging from 0.722–0.945. Models obtained by ANN processing of factors derived by PCA from the raw spectra of the samples showed excellent prediction of histamine, regardless of fish species and extent of microbial activity (R2 of validation > 0.99).

1. Introduction

Histamine fish poisoning is an allergy-like form of food poisoning caused by consumption of different foods containing high concentration of histamine. In fish products, histamine is formed due to bacterial decarboxylation of free histidine caused by poor handling, i.e., time—temperature abuse of fish [1]. Majority of histamine fish poisoning incidents are associated with consumption of fish species containing high amount of free histidine in their tissues, such as tuna, mackerel, mahi-mahi, sardines and anchovies, although species with lower amount of free histidine, e.g., salmon and swordfish, are often reported as causative agents in histamine fish poisoning incidents [2,3]. Regulatory limits for histamine content of fishery products are established in many countries and range from 50 mg/kg of fish in the USA [4] to 100 mg/kg of fresh fish or 200 mg/kg of enzyme matured products in EU [5].
Traditional methods for histamine analysis and testing include high-performance liquid chromatography (HPLC), gas chromatography (GC), thin layer chromatography (TLC), enzymatic-linked immunosorbent assay (ELISA) and fluorometric methods [2,6] and are often time consuming, require expensive equipment and skilled laboratory personnel. Although intoxication mechanisms, control strategies and hazardous products are well known and documented, histamine is still the far most common cause of health problems associated with seafood [7,8,9] which leads to a conclusion that simple and rapid methods for histamine testing are required, in order to ensure safety of fish products in global trade. This is, in addition, confirmed by large number of recent scientific papers dealing with improvement of traditional histamine testing methods [10,11,12,13,14,15] or development of novel approaches such as different sensors [16,17,18,19,20] and application of different spectroscopic methods [21,22,23,24,25,26,27].
Among various spectroscopic techniques examined for rapid food analysis, Surface Enhanced Raman Spectroscopy (SERS) has gained significant interest due to high sensitivity, short analysis time and suitability for on-field analysis [28]. SERS combines Raman spectroscopy, which obtains molecular “fingerprint” of sample through measurement of inelastic light scattering, with nanotechnology. Enhancement of Raman signals is accomplished through electromagnetic and chemical mechanisms, when molecules of analyte are deposited onto metallic substrate with nanoscale surface roughness (SERS substrate) [29]. Electromagnetic enhancement originates through strong electromagnetic field generated by localized surface plasmons excited on metallic nanostructure by incident light beam while chemical enhancement arises from increased polarizability of molecule adsorbed onto SERS substrate [30,31]. In certain cases, combination of these enhancement mechanisms generates Raman enhancement factor up to order of 1014, enabling detection of single molecule of analyte [32,33,34]. However, application of SERS, for analysis complex matrices such as food, still faces challenges in terms of enhancing sensitivity and selectivity, reduction of matrix interferences, non-destructive sampling techniques and in-situ application. In addition, interpretation of spectral readings obtained by SERS often isn’t straightforward and requires use of different chemometric modelling tools to produce satisfactory results.
In recent years, several studies dealing with SERS detection and quantification of histamine in fish products have been published [21,22,26,27,35]. Majority of these studies were conducted on single fish species or on fish samples spiked with different concentration of histamine. Although this approach is valid for method development, it does not give much information on influence of sample matrix on method performance and overall applicability of such method for real-life applications. Sample matrix can differ significantly among different fish species. In addition, it may vary depending on extent of microbial activity within the sample since microbial activity isn’t restricted solely to histamine production but includes degradation of majority of components present in fresh fish and formation of wide array of chemical components. Since our previous study showed significant influence of sample matrix on performance of developed SERS method for determination of histamine in fish [22,36], this work was focused on testing the method on different fish species and on fish samples containing naturally formed histamine. In addition, different chemometric tools including Partial Least Squares Regression (PLSR) and Artificial Neural Networks (ANN) coupled to Principal Component Analysis (PCA) were employed to obtain prediction models (quantitative and qualitative) and test method performance with different fish samples.

2. Materials and Methods

2.1. Chemicals and Reagents

Silver nitrate (AgNO3, 99.9%), trisodium citrate (Na3C6H5O7×2H2O, 99.0%), sodium hydroxide (NaOH, 98.0%) and 1-butanol (C₄H₉OH, 99.5%) were purchased from Kemika d.d. (Zagreb, Croatia). Perchloric acid (HClO4, 65.0%) and sodium chloride (NaCl, 99.0%) were purchased from Carlo Erba Reagents (Milano, Italy). Sodium borohydride (NaBH4, 99.0%) was purchased form Acros Organics (Morris Plains, NJ, USA). Histamine dihydrochloride (C5H9N3 × 2HCl, 99.5%) was purchased from Applichem GmbH (Damstadt, Germany). All chemicals were of analytical grade and were used without further purification. High-purity water with a resistivity of 18 MΩcm was used in all experiments.

2.2. Fish Samples

Fresh samples of bluefin tuna (Thunnus thynnus) and bonito (Sarda sarda) were collected from the local market and transported to the laboratory. Skin, bones and viscera were removed and muscle tissue was minced using a stick blender. The histamine content of the fresh samples was analyzed by the reference HPLC method and the analysis confirmed that the fresh samples did not contain histamine. Minced samples of each species were divided into two groups. The first group (“calibration samples”) was spiked with histamine dihydrochloride to obtain final concentrations of 0, 25, 50, 75, 100, 125, 150, 175, 200, 250 and 300 mg/kg fish. The second group (“real samples”) was stored at room temperature to allow natural formation of histamine. Two samples were taken every 6 h and frozen until further analysis by HPLC and SERS method.

2.3. Determination of Histamine by Reference HPLC Method

Samples were analyzed according to the method of Malle et al. [37] officially recommended by the EU authorities. Briefly, 500 µL of internal standard (imidazole, 5 mg/mL) was added to 5.0 g of sample and homogenized in 50 mL of 0.4 M HClO4. The homogenate was centrifuged (3500× g/3 min) and 100 µL of the supernatant was mixed with 200 µL of saturated Na2CO3 solution and 500 µL of dansyl chloride solution (5 mg/mL in acetone). The prepared mixture was kept in a water bath at 60 °C for 60 min. Then, 100 µL of L-proline (100 mg/mL) was added and the mixture was left in the dark for 30 min. 500 µL of toluene was added and mixed with a vortex. After separation, 200 µL of the upper layer was transferred to a vial, evaporated in a stream of nitrogen until dry and dissolved in 200 µL of acetonitrile. The prepared samples were analyzed on an Agilent 1200 series liquid chromatograph using a LiChrospher C-18 column, 5 µm, 250 × 4.6 mm (Merck, Darmstadt, Germany) at 25 °C. Solvent A (water: acetonitrile, 40:60) and solvent B (acetonitrile) were used for gradient elution at a flow rate of 1 mL/min. Histamine was detected with DAD detector at a wavelength of 254 nm.

2.4. Preparation of Citrate Reduced Silver Nanoparticles (AGC)

The AGC colloid solution was prepared using the chemical reduction method according to the slightly modified method of Lee and Meisel [38]. Briefly, 90 mg of AgNO3 in 500 mL of miliQ H2O was poured into a four-necked glass flask and heated to boiling with constant stirring using a glass stirrer in an oil bath (120 °C) under reflux and nitrogen bubbling. 50 mL of 1% trisodium citrate was added rapidly to the boiling solution and stirred vigorously throughout. The solution was refluxed at 120 °C for 90 min and then removed from the oil bath and stirred until it cooled to room temperature.

2.5. SERS Measurements

Samples were prepared according to our previously developed method [22], which included homogenizing 5.0 g of minced fish muscle in 50 mL of 0.4 mol/L perchloric acid using the Ultra Turrax T-18 (IKA-Labortechnik, Staufen, Germany) laboratory homogenizer for 2 min at maximum speed and filtering through Whatman No. 4 filter paper. Then, 2 mL of the filtered extract was transferred to a glass test tube with a screw cap and 0.4 mL NaOH (5 mol/L), 1.4 g NaCl, and 2 mL of 1-butanol were added. The mixture was shaken on a laboratory shaker for 10 min at 70 rpm and allowed to stand for a few minutes to allow the layers to separate. 100 µL of the top butanol layer was transferred to a 1.5 mL capped micro centrifuge tube and evaporated under a stream of nitrogen at 60 °C until completely dry. 80 µL of AGC colloid, 10 µL of water and 10 µL of aggregating agent (0.23 mol/L NaBH4) were added to the dried sample, vortexed for 30 s, placed in a glass capillary (25 × 2 mm) and positioned in the macro chamber of the Raman instrument.

2.6. Instrumentation

Raman spectra were recorded using the Jobin Yvon T64000 triple Raman spectrometer (Horiba, Oberursel, Germany) in subtractive mode equipped with an argon ion laser with an excitation wavelength of 514.5 nm. The laser beam was focused with a 100 mm lens in 90° geometry and the laser power on the sample was approximately 60 mW. Raman scattering experiments were performed at room temperature. Spectra were recorded with 30 s accumulation and three replicates unless otherwise stated. The spectrometer was calibrated using the Raman spectrum of the transversal optical mode at 520.7 cm−1 of an undoped silicon wafer with (111) surface orientation.

2.7. Spectral Analysis and Chemometric Modelling

2.7.1. Partial Least Squares Regression

In developing the models, specific regions of the SERS spectra were selected, all based on previous literature data examining the vibrational spectra of histamine, i.e., the intensity of the specific vibrational band of the histamine molecule [39] and four different wavelength combinations were selected. Thus, model M1 was developed in the wavelength range: 1140–1618 cm−1; for model M2, two ranges were chosen: 1240–1350 cm−1 & 1500–1600 cm−1; for model M3, six significant wavelengths were selected: 1264, 1268, 1304, 1320, 1437 & 1570 cm−1; and for the last model, M4, three following wavelengths were selected: 1268, 1320 & 1570 cm−1.
PLSR models [24] were developed on set of calibration samples spiked with histamine concentrations ranging from 0–300 mg/kg and containing 2048 wavelengths (1068.7–1618.1 cm−1) of each of the 479 SERS spectra. Prior to modeling, various preprocessing methods were applied to the SERS spectra including (i) Normalize (N); (ii) Baseline (B); (iii) Standard Normal Variate (SNV); smoothing methods such as (iv) Moving Average (MA); (v) Gaussian filter (GF); (vi) Median filter (MF); (vii) Savitzky-Golay Smoothing (SG_Sm) as well as combinations of two preprocessing methods such as (viii) Baseline coupled with the Savitzky-Golay derivation (S-G, B+dSG) & (ix) SNV combined with the Savitzky-Golay derivation (SNV+dSG). The efficiency of the model was evaluated using the root mean square error of cross validation (RMSEC) and the coefficients of determination (R2).
The obtained PLSR calibration models were applied to SERS spectra of real samples for all fish samples together (n = 196) and separately for bluefin tuna (Thunnus thynnus) (nT = 160) and bonito (Sarda sarda) (nB = 36). Data for all PLSR models were randomly divided into 60:40 ratio for calibration and validation. The efficiency of histamine concentration prediction was evaluated using the error of estimation (RMSEV) and Rv2 (representing predictive ability). The Unscrambler X software (CAMO Software, Oslo, Norway) was used for preprocessing and modeling data in developing PLSRs.

2.7.2. Principal Component Analysis

Although often used to detect similarities/differences between samples and to detect adulteration of samples [40], in our case, PCA was used to shorten the data matrix because it has the ability to extract important information from the data matrix and express it as factors (principal components). From the eigenvalues, the signifficant factors were selected and later used as input for the ANN modeling. Raw spectra without any preprocessing method were used for PCA analysis using Statistica v.13.0 software (StatSoft, Tulsa, OK, USA).

2.7.3. Artificial Neural Networks

ANNs in combination with PCA were used to predict histamine concentration in different fish samples. The first 10 factors obtained by PCA were used as input for ANNs with hidden layer consisting of 3–14 neurons and histamine concentration as output. In addition, random separation of data into different ratios for training, testing, and validation was tested so as not to overfit or underfit ANNs. In all cases, random separation of data into 60:20:20 ratios for training, testing, and validation proved to be optimal. From the multiple layer perceptron networks that were developed in Statistica v.13.0 software (StatSoft, Tulsa, OK, USA), the ANNs presented in the results were selected based on the highest R2 values for training, testing, and validation along with the lowest root mean square errors.

3. Results and Discussion

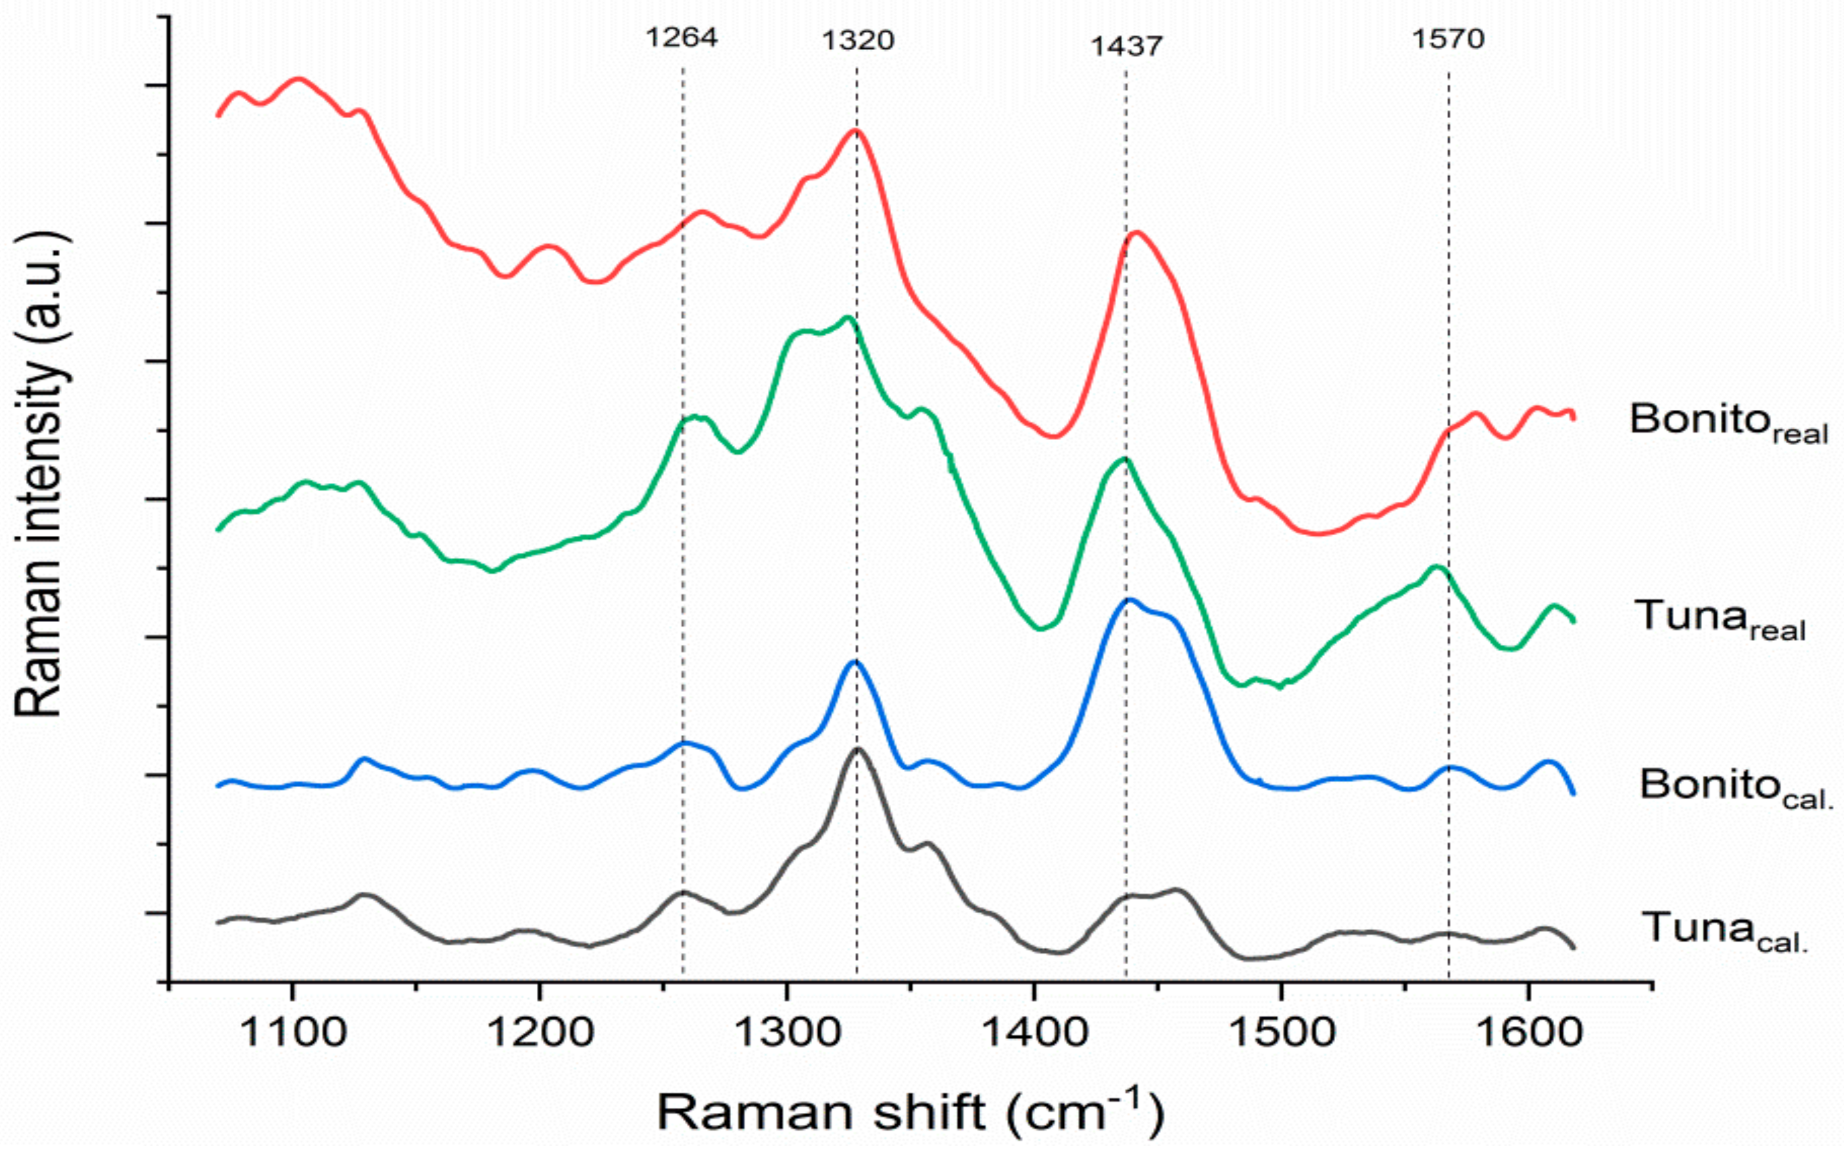
3.1. Histamine Content and Spectral Features of Fish Samples
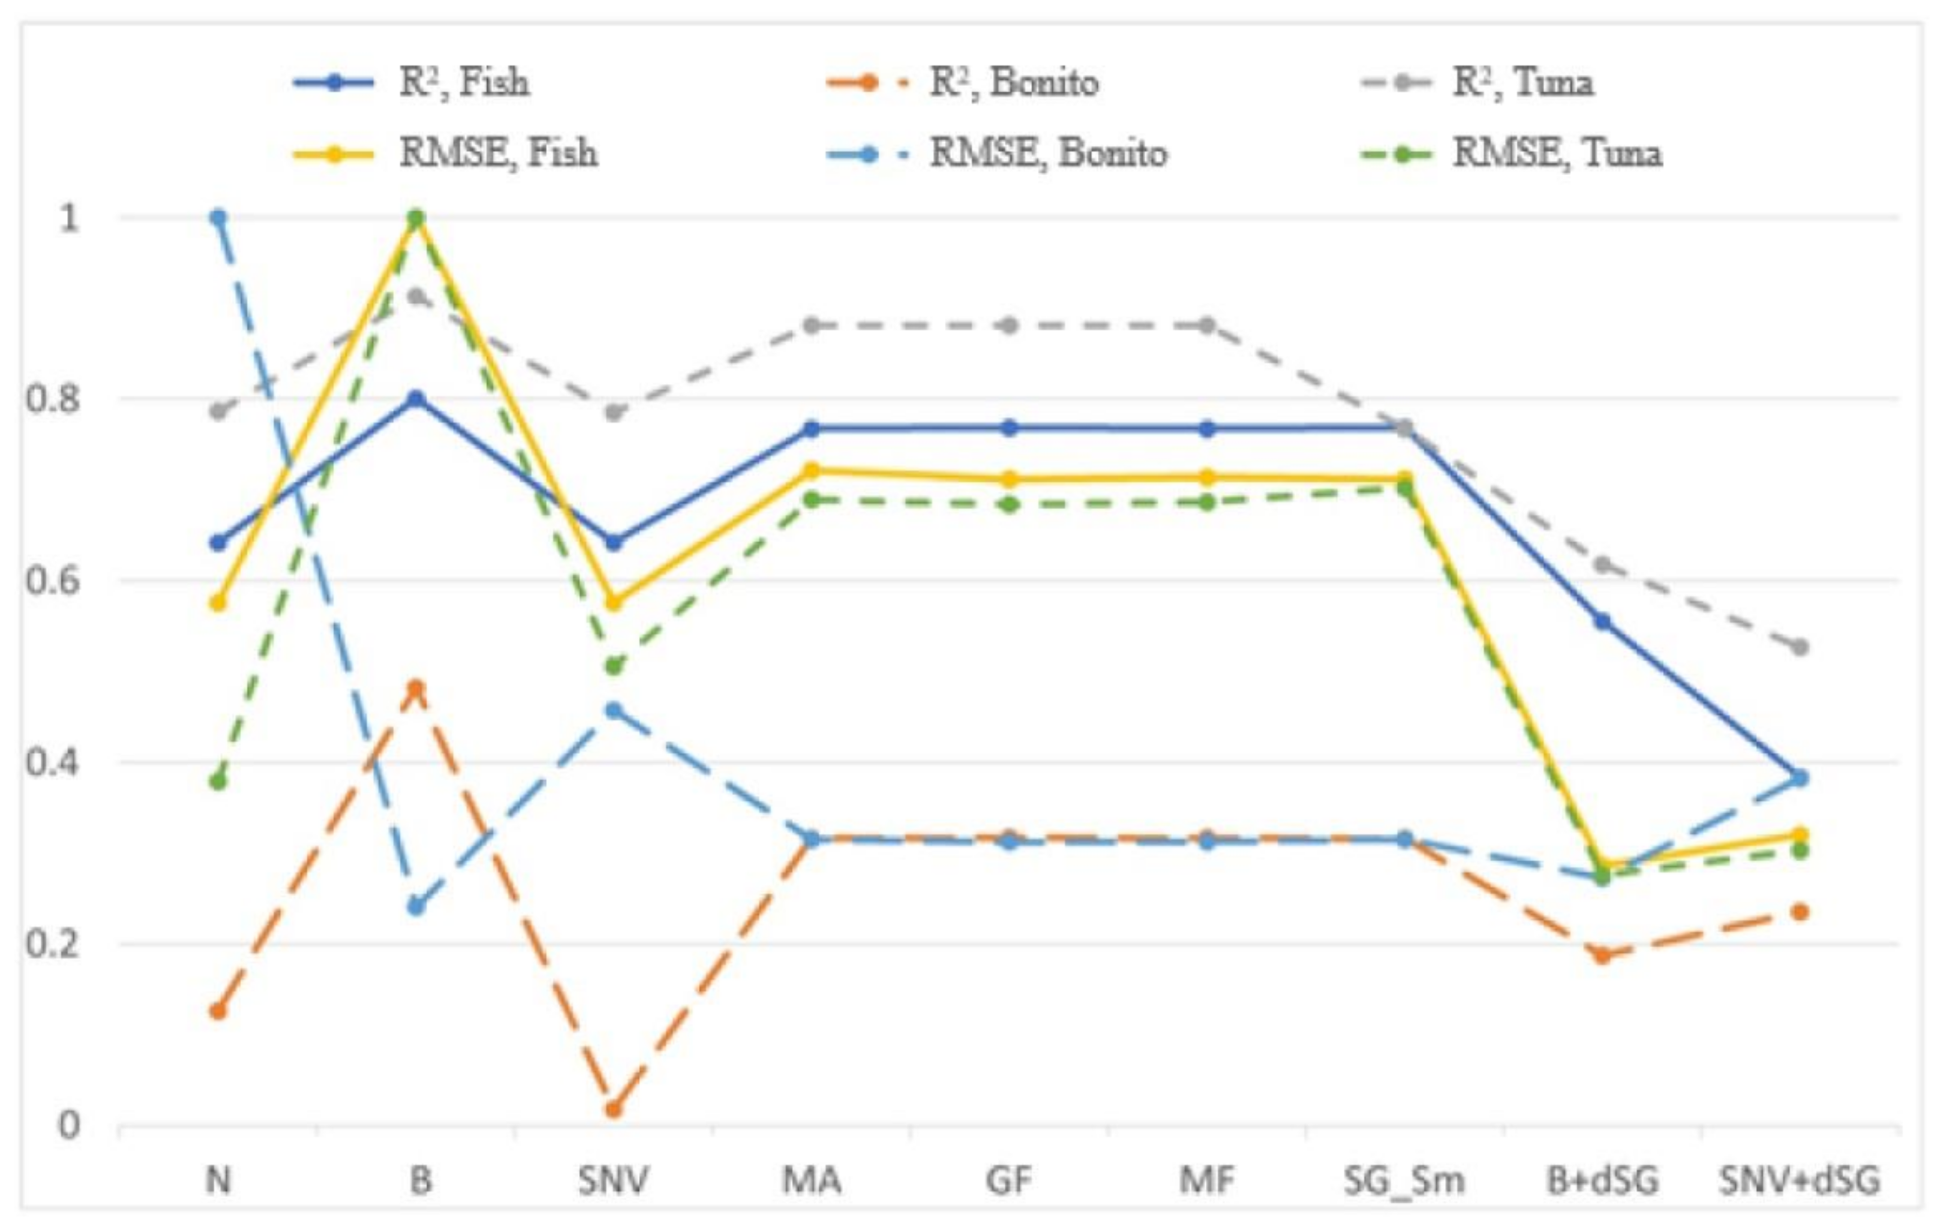
Reference HPLC analyses of sample sets containing naturally formed histamine showed significant formation of histamine in the samples during storage at room temperature. Since our SERS method has been shown to be suitable for the determination of histamine in the concentration range 0–300 mg/kg [22], samples with histamine contents above 300 mg/kg were excluded from further analysis. The histamine content of the real samples used for method testing is shown in Table 1.
From the SERS spectra of the histamine spiked calibration samples shown in Figure 1, it can be concluded that the characteristic SERS bands of histamine at 1264, 1320 and 1570 cm−1 and the citrate band at 1437 cm−1 [22,36] are clearly visible in the spectra of both fish species. Histamine SERS bands are of higher relative intensity and regular shape in the spectra of tuna sample, which can be explained by the intrinsic characteristics of the different fish species. It is possible that the matrix of the bonito samples contains a higher amount of interfering substances, resulting in slight spectral shifts and partial masking of the visible histamine bands.
Comparison of SERS spectra of calibration and real samples reveals significant changes in their spectral characteristics. While the baseline of the spectra of the calibration samples is flat, the baseline of the real samples shows higher intensity, which is especially observed in the lower wavenumber region. Moreover, significant shifts and distortions of the histamine SERS bands can be observed in the spectra of both fish species, although this effect is more pronounced in the spectra of the bonito samples, which contain naturally formed histamine. The described effect is a consequence of decomposition of the sample matrix due to various factors which include microbial activity, activity of endogenous enzymes and chemical reactions resulting in the formation of various degradation products, which may exhibit higher fluorescence when present in the extract. In addition, the SERS bands of the degradation products contribute to the SERS spectra of the sample and may cause spectral shifts or mask the characteristic SERS bands of histamine.

3.2. PLSR Models

The primary objective of applying PLSR models was to quantitatively predict histamine concentration in real fish samples with naturally formed histamine based on the collected SERS spectra. From the results presented in Figure 2, it is evident that the quality evaluation parameters of quantitative prediction are best for the model where the Baseline method was used to preprocess the spectral data (Table 2). Therefore, the baseline preprocessing method was subsequently applied to SERS spectra used for other models (Table 3).
Despite good qualitative indicators, prediction is not equally successful for both fish species (Table 2) and in different ranges of spectral wavelengths (Table 3). Equal prediction efficiency for bluefin tuna samples was obtained with model M1 (1140–1618 cm−1) and model M2 (1240–1350 cm−1 & 1500–1600 cm−1), which achieved Rv2 of 0.913 and 0.912, respectively. The best results for the bonito samples and the combined bonito and tuna samples were obtained with model M2, achieving Rv2 of 0.722 and 0.786, respectively.
As expected, the best predictive capabilities were obtained for the M2 model, since it is based on spectral regions containing vibrational modes of medium and strong intensity of the histamine molecule, i.e., the 1255–1324 cm−1 and 1480–1570 cm−1 regions, as previously reported [22,36,39,41]. Less acceptable predictive capabilities are determined for the M3 and M4 models based on a fewer individual strong vibrational bands of the histamine molecule, indicating that weaker vibrational bands present in a broader spectral range contain information that contributes significantly to the overall quality of the PLSR model.
The comparison of PLSR model parameters presented in Table 3 shows that the effect of sample matrix has a significant impact on the predictive capabilities of the PLSR models, as the best overall results were obtained for histamine spiked calibration samples (Rc2 = 0.945). The lower performance of the models applied to SERS spectra of real fish samples with naturally formed histamine can be explained by the microbial activity that leads to the decomposition of the fish sample and the formation of various degradation products in addition to histamine formation. Since the sample preparation procedure for SERS measurement involves partial removal of matrix components from the extract, the vibrational bands of the compounds present in the extract may partially mask the SERS signals of histamine and affect PLSR model performance. The matrix effect can also be observed when comparing the results obtained for different fish species. The best results were obtained for bluefin tuna samples (Rv2 = 0.912), while bonito samples may contain higher amounts of interfering compounds, resulting in lower model performance (Rv2 = 0.722). In the case of applying the PLSR model to combined tuna and bonito samples, the result obtained (Rv2 = 0.786) is intermediate between the results obtained for the individual fish species due to lower model performance for predicting histamine concentration in bonito samples.

3.3. Artificial Neural Network Models

To predict histamine concentration in fish samples, ANN were used in combination with PCA. Our experience in modelling with ANN in combination with PCA [40,42,43] has shown that preprocessing of spectral data before PCA analysis can sometimes improve the final result in terms of model performance [43]. Since preprocessing large amounts of data is time-consuming, laborious and requires modeling experience, in this work PCA was performed using the raw SERS spectra of the fish samples in order to minimize the required time for overall data analysis and thus provide faster method.
Furthermore, PCA is able to cope with small baseline variations from spectrum to spectrum [44] and it can perform very well with variety of spectroscopic data that are related [45]. In this case, PCA was used primarily to compress the data matrix used as loading for ANN. For example, the data matrix for combined fish samples in model M1 (wavelength range of 1140–1618 cm−1) is 196 × 1792, where 196 is the number of fish sample spectra and 1792 is the number of wavelengths in the range of 1140–1618 cm−1. From the derived eigenvalues obtained by PCA, it is possible to determine the number of factors necessary for further analysis. In our case, the first 10 factors were responsible for 99.99% of all variations in the samples, which means that none of the important information was lost, compressing our data matrix from 196 × 1792 to 196 × 10. Therefore, the first ten factors generated by PCA were later used as inputs for ANN, and single output for ANN was histamine concentration.
The first ANN models were developed for calibration sample sets, for each fish species individually and for combined fish samples (bonito and tuna). Calibration of the combined fish samples was performed using data from both individual fish species in the same matrix. Different ANN models were tested to determine which data separation could be used for all further analyses to avoid overfitting or underfitting of ANNs. Among the different data separations tested (70:15:15; 50:30:20; 60:20:20; 70:20:10), the best results were obtained by a random data separation of 60:20:20 for training, testing and validation, respectively. The results of ANN model predictions of histamine concentration for common fish samples and for each species separately are shown in Table 4.
As shown in Table 4, the M1 model (1140–1618 cm−1) for calibration set of tuna samples showed the highest values in terms of R2 for validation (0.9945) with the lowest root mean square error of 9.3494, while the lowest R2 value for validation was obtained for the combined calibration sets of both species with a value of 0.9754 and an root mean square error of 20.4546. From the network architecture, it can be seen that the M1 model for tuna had 10 inputs which were 10 first factors derived from PCA, 13 neurons in the hidden layer and one output which was histamine concentration, while the M1 model for bonito and combined samples had 12 neurons in the hidden layer. For the calibration of the combined fish samples, the highest values of R2 for training, test and validation (0.9960, 0.9911 and 0.9906) were obtained with the M2 model (1240–1350 cm−1 & 1500–1600 cm−1) with the lowest errors of 7.8974, 11.2420 and 13.2226, respectively. Slightly lower values were observed for model M3 (1264, 1268, 1304, 1320 cm−1) and the lowest prediction of histamine was obtained for model M4 (1268, 1320, 1570 cm−1).
As for the results obtained for bonito samples, the highest R2 values were also obtained for model M2, followed by model M1, M3 and the lowest values for model M4. Models M1, M3 and M2 obtained for tuna samples all had R2 values for validation above 0.99, with M1 having the highest value of 0.9945. As in the previous cases, model M4 had the lowest R2 value. To further test whether combining calibration samples with the addition of real fish samples would yield similar results, ANN models were developed with the same separation of data (60:20:20).
The results presented in Table 5 show that the models for combined calibration and real tuna samples had higher R2 values for all tested models. In addition, model M2 showed the highest predictive ability of histamine concentration, followed by models M3 and M1. As for the models constructed for separate calibration samples, model M4 showed the lowest ability to predict histamine concentration. For bonito samples, the highest values were also obtained with model M2, followed by models M1 and M3, while model M4 showed the lowest quality.
To test the ability of the ANN models to predict histamine concentration in real fish samples, the data for the calibration sample sets were excluded and ANN models were constructed using SERS spectra of real fish samples for individual fish species as well as for combined samples (Table 6).
It is interesting to see from the results in Table 6 that the R2 values of all ANN models were higher than 0.9602. The M1, M2 and M3 models showed excellent prediction of histamine concentration in the samples in all cases, while the M4 model, which previously had R2 values below 0.8630 (Table 4 and Table 5), showed the lowest value of 0.9602 for combined bonito and tuna samples in this case. As was the case with the ANN models for the calibration sets and the combined calibration and real sample sets, the models showed the highest possibility of histamine prediction for tuna samples. For bonito samples, it can be argued that the sample size was too small for the application of ANN as only 36 samples were tested. Although ANN models are more accurate for large datasets [46], this test was conducted to test whether it would be possible to obtain good predictions on such a small dataset. It can be clearly seen that better results were obtained for the tuna dataset, which had 160 samples.
Comparing the results of ANN with PLSR models, it can be concluded that ANN in combination with PCA is the more suitable method for the determination of histamine in fish using SERS. This could be explained by the fact that the intensity changes of histamine SERS bands do not show a linear trend with histamine concentration, but are better described by the Langmuir adsorption isotherm, which describes the adsorption of histamine molecules on SERS substrate [22,36]. Since PLSR models are better suited for linear models, one might expect ANN models to be better suited for this type of predictions.

4. Conclusions

The results have shown that there is significant influence in certain wavelength ranges of Raman spectra that were studied for both tuna and bonito samples due to the differences between two species and the extent of microbial activity leading to the formation of histamine and decomposition of the samples.
The observed changes in the spectra of the samples negatively affected the predictive ability of the PLSR models, regardless of the different pre-processing methods applied to the spectra. The best results were obtained by baseline correction of the raw spectra for PLSR model built on combined spectral range (1240–1350 cm−1 & 1500–1600 cm−1), resulting in Rv2 of 0.912, 0.722 and 0.786 for the prediction of histamine concentration in tuna, bonito and combined samples, respectively.
Processing of the raw spectra by PCA allowed the extraction of factors accounting for 99.99% of all variations in the samples and significant compression of the data matrix for ANN modelling. The obtained ANN models showed an excellent prediction of histamine, regardless of the fish species and the extent of microbial activity, and the best results were also obtained for the model built on combined spectral range (1240–1350 cm−1 & 1500–1600 cm−1) with an Rv2 greater than 0.99 in all cases studied.

Author Contributions

Conceptualization, T.J. and S.V.F.; methodology, T.J., L.M., D.V. and J.G.K.; validation, T.J., L.M., D.V. and J.G.K.; investigation, T.J. and L.M.; resources, M.I.; writing—original draft preparation, T.J., D.V. and J.G.K.; writing—review and editing, T.J., D.V. and J.G.K.; visualization, T.J., D.V. and J.G.K.; supervision, S.V.F. and M.I.; project administration, M.I.; funding acquisition, M.I. All authors have read and agreed to the published version of the manuscript.

Funding

This research was funded by Croatian Science Foundation, project number (IP-2014-09-7046).

Data Availability Statement

Not applicable.

Conflicts of Interest

The authors declare no conflict of interest. The funders had no role in the design of the study; in the collection, analyses, or interpretation of data; in the writing of the manuscript, or in the decision to publish the results.

References

  1. Vidaček, S.; Janči, T. Chapter 5—Safety of fish products. In Regulating Safety of Traditional and Ethnic Foods; Prakash, V., Martín-Belloso, O., Keener, L., Astley, S., Braun, S., McMahon, H., Lelieveld, H., Eds.; Academic Press: San Diego, CA, USA, 2016; pp. 79–97. [Google Scholar]
  2. Hungerford, J.M. Scombroid poisoning: A review. Toxicon 2010, 56, 231–243. [Google Scholar] [CrossRef] [PubMed] [Green Version]
  3. Feng, C.; Teuber, S.; Gershwin, M.E. Histamine (scombroid) fish poisoning: A comprehensive review. Clin. Rev. Allerg. Immunol. 2016, 50, 64–69. [Google Scholar] [CrossRef] [PubMed]
  4. FDA. Scombrotoxin (histamine) formation. In Fish and Fishery Products Hazards and Controls Guidance, 4th ed.; Department of Health and Human Services: Washington, DC, USA; Public Health Service: Washington, DC, USA; Food and Drug Administration: Silver Spring, MD, USA; Center for Food Safety and Applied Nutrition: College Park, MD, USA; Office of Food Safety: Washington, DC, USA, 2011; pp. 113–152. [Google Scholar]
  5. Commission regulation (EC) No 2073/2005 of 15 November 2005 on microbiological criteria for foodstuffs. OJEU 2005, 338, 1. Available online: https://eur-lex.europa.eu/legal-content/EN/TXT/HTML/?uri=CELEX:02005R2073-20200308&from=EN#tocld2 (accessed on 21 February 2021).
  6. Lehane, L.; Olley, J. Histamine fish poisoning revisited. Int. J. Food Microbiol. 2000, 58, 1–37. [Google Scholar] [CrossRef]
  7. Hussain, M.A.; Saputra, T.; Szabo, E.A.; Nelan, B. An overview of seafood supply, food safety and regulation in new South Wales, Australia. Foods 2017, 6, 52. [Google Scholar] [CrossRef] [Green Version]
  8. Barrett, K.A.; Nakao, J.H.; Taylor, E.V.; Eggers, C.; Gould, L.H. Fish-associated foodborne disease outbreaks: United States, 1998–2015. Foodborne Pathog. Dis. 2017, 14, 537–543. [Google Scholar] [CrossRef]
  9. EFSA. The European Union one health 2018 zoonoses report. EFSA J. 2019, 17, e05926. [Google Scholar] [CrossRef] [Green Version]
  10. Altieri, I.; Semeraro, A.; Scalise, F.; Calderari, I.; Stacchini, P. European official control of food: Determination of histamine in fish products by a HPLC–UV-DAD method. Food Chem. 2016, 211, 694–699. [Google Scholar] [CrossRef]
  11. Li, Y.-F.; Lin, Z.-Z.; Hong, C.-Y.; Huang, Z.-Y. Histamine detection in fish samples based on indirect competitive ELISA method using iron-cobalt co-doped carbon dots labeled histamine antibody. Food Chem. 2021, 345, 128812. [Google Scholar] [CrossRef]
  12. Yu, H.; Zhuang, D.; Hu, X.; Zhang, S.; He, Z.; Zeng, M.; Fang, X.; Chen, J.; Chen, X. Rapid determination of histamine in fish by thin-layer chromatography-image analysis method using diazotized visualization reagent prepared with p-nitroaniline. Anal. Methods 2018, 10, 3386–3392. [Google Scholar] [CrossRef]
  13. Nadeem, M.; Naveed, T.; Rehman, F.; Xu, Z. Determination of histamine in fish without derivatization by indirect reverse phase-HPLC method. Microchem. J. 2019, 144, 209–214. [Google Scholar] [CrossRef]
  14. Kounnoun, A.; EL Maadoudi, M.; Cacciola, F.; Mondello, L.; Bougtaib, H.; Alahlah, N.; Amajoud, N.; El Baaboua, A.; Louajri, A. Development and validation of a high-performance liquid chromatography method for the determination of histamine in fish samples using fluorescence detection with pre-column derivatization. Chromatographia 2020, 83, 893–901. [Google Scholar] [CrossRef]
  15. Huang, J.; Gan, N.; Lv, F.; Cao, Y.; Ou, C.; Tang, H. Environmentally friendly solid-phase microextraction coupled with gas chromatography and mass spectrometry for the determination of biogenic amines in fish samples. J. Sep. Sci. 2016, 39, 4384–4390. [Google Scholar] [CrossRef]
  16. Koçoğlu, İ.O.; Erden, P.E.; Kılıç, E. Disposable biogenic amine biosensors for histamine determination in fish. Anal. Methods 2020, 12, 3802–3812. [Google Scholar] [CrossRef]
  17. Veseli, A.; Vasjari, M.; Arbneshi, T.; Hajrizi, A.; Švorc, Ľ.; Samphao, A.; Kalcher, K. Electrochemical determination of histamine in fish sauce using heterogeneous carbon electrodes modified with rhenium(IV) oxide. Sens. Actuat. B Chem. 2016, 228, 774–781. [Google Scholar] [CrossRef]
  18. Serrano, V.M.; Cardoso, A.R.; Diniz, M.; Sales, M.G.F. In-situ production of histamine-imprinted polymeric materials for electrochemical monitoring of fish. Sens. Actuat. B Chem. 2020, 311, 127902. [Google Scholar] [CrossRef]
  19. Torre, R.; Costa-Rama, E.; Lopes, P.; Nouws, H.P.A.; Delerue-Matos, C. Amperometric enzyme sensor for the rapid determination of histamine. Anal. Methods 2019, 11, 1264–1269. [Google Scholar] [CrossRef]
  20. Lee, M.-Y.; Wu, C.-C.; Sari, M.I.; Hsieh, Y.-H. A disposable non-enzymatic histamine sensor based on the nafion-coated copper phosphate electrodes for estimation of fish freshness. Electrochim. Acta 2018, 283, 772–779. [Google Scholar] [CrossRef]
  21. Tan, A.; Zhao, Y.; Sivashanmugan, K.; Squire, K.; Wang, A.X. Quantitative TLC-SERS detection of histamine in seafood with support vector machine analysis. Food Control. 2019, 103, 111–118. [Google Scholar] [CrossRef] [Green Version]
  22. Janči, T.; Valinger, D.; Gajdoš Kljusurić, J.; Mikac, L.; Vidaček, S.; Ivanda, M. Determination of histamine in fish by surface enhanced Raman spectroscopy using silver colloid SERS substrates. Food Chem. 2017, 224, 48–54. [Google Scholar] [CrossRef]
  23. Pochanagone, S.; Rittiron, R. Preliminary study on the determination of ppm-level concentration of histamine in tuna fish using a dry extract system for infrared coupled with near-infrared spectroscopy. ACS Omega 2019, 4, 19164–19171. [Google Scholar] [CrossRef] [Green Version]
  24. Ghidini, S.; Chiesa, L.M.; Panseri, S.; Varrà, M.O.; Ianieri, A.; Pessina, D.; Zanardi, E. Histamine control in raw and processed tuna: A rapid tool based on NIR spectroscopy. Foods 2021, 10, 885. [Google Scholar] [CrossRef]
  25. Pauline, O.; Chang, H.-T.; Tsai, I.L.; Lin, C.-H.; Chen, S.; Chuang, Y.-K. Intelligent assessment of the histamine level in mackerel (Scomber australasicus) using near-infrared spectroscopy coupled with a hybrid variable selection strategy. LWT 2021, 145, 111524. [Google Scholar] [CrossRef]
  26. Gao, F.; Grant, E.; Lu, X. Determination of histamine in canned tuna by molecularly imprinted polymers-surface enhanced Raman spectroscopy. Anal. Chim. Acta 2015, 901, 68–75. [Google Scholar] [CrossRef]
  27. Zhou, T.; Fan, M.; You, R.; Lu, Y.; Huang, L.; Xu, Y.; Feng, S.; Wu, Y.; Shen, H.; Zhu, L. Fabrication of Fe3O4/Au@ATP@Ag Nanorod sandwich structure for sensitive SERS quantitative detection of histamine. Anal. Chim. Acta 2020, 1104, 199–206. [Google Scholar] [CrossRef]
  28. Lin, Z.; He, L. Recent advance in SERS techniques for food safety and quality analysis: A brief review. Curr. Opin. Food Sci. 2019, 28, 82–87. [Google Scholar] [CrossRef]
  29. McNay, G.; Eustace, D.; Smith, W.E.; Faulds, K.; Graham, D. Surface-enhanced Raman scattering (SERS) and surface-enhanced resonance Raman scattering (SERRS): A review of applications. Appl. Spectrosc. 2011, 65, 825–837. [Google Scholar] [CrossRef]
  30. Aroca, R. Surface-enhanced Raman scattering. In Surface-Enhanced Vibrational Spectroscopy; Aroca, R., Ed.; John Wiley & Sons: Hoboken, NJ, USA, 2006; pp. 73–106. [Google Scholar]
  31. Le Ru, E.C.; Blackie, E.; Meyer, M.; Etchegoin, P.G. Surface enhanced Raman scattering enhancement factors: A comprehensive study. J. Phys. Chem. C 2007, 111, 13794–13803. [Google Scholar] [CrossRef]
  32. Bizzarri, A.R.; Cannistraro, S. Surface-enhanced resonance Raman spectroscopy signals from single myoglobin molecules. Appl. Spectrosc. 2002, 56, 1531–1537. [Google Scholar] [CrossRef]
  33. Habuchi, S.; Cotlet, M.; Gronheid, R.; Dirix, G.; Michiels, J.; Vanderleyden, J.; De Schryver, F.C.; Hofkens, J. Single-molecule surface enhanced resonance Raman spectroscopy of the enhanced green fluorescent protein. J. Am. Chem. Soc. 2003, 125, 8446–8447. [Google Scholar] [CrossRef]
  34. Mao, P.; Liu, C.; Favraud, G.; Chen, Q.; Han, M.; Fratalocchi, A.; Zhang, S. Broadband single molecule SERS detection designed by warped optical spaces. Nat. Commun. 2018, 9, 1–8. [Google Scholar] [CrossRef] [PubMed]
  35. Huynh, K.-H.; Pham, X.-H.; Hahm, E.; An, J.; Kim, H.-M.; Jo, A.; Seong, B.; Kim, Y.-H.; Son, B.S.; Kim, J.; et al. Facile histamine detection by surface-enhanced Raman scattering using SiO2@Au@Ag alloy nanoparticles. Int. J. Mol. Sci. 2020, 21, 4048. [Google Scholar] [CrossRef] [PubMed]
  36. Janči, T.; Mikac, L.; Ivanda, M.; Marušić Radovčić, N.; Medić, H.; Vidaček, S. Optimization of parameters for histamine detection in fish muscle extracts by surface-enhanced Raman spectroscopy using silver colloid SERS substrates. J. Raman Spectrosc. 2017, 48, 64–72. [Google Scholar] [CrossRef]
  37. Malle, P.; Vallé, M.; Bouquelet, S. Assay of biogenic amines involved in fish decomposition. J. AOAC Int. 1996, 79, 43–49. [Google Scholar] [CrossRef] [Green Version]
  38. Lee, P.C.; Meisel, D. Adsorption and surface-enhanced Raman of dyes on silver and gold sols. J. Phys. Chem. 1982, 86, 3391–3395. [Google Scholar] [CrossRef]
  39. Collado, J.A.; Ramírez, F.J. Infrared and Raman spectra of histamine-Nh4 and histamine-Nd4 monohydrochlorides. J. Raman Spectrosc. 1999, 30, 391–397. [Google Scholar] [CrossRef]
  40. Valinger, D.; Jurina, T.; Šain, A.; Matešić, N.; Panić, M.; Benković, M.; Gajdoš Kljusurić, J.; Jurinjak Tušek, A. Development of ANN models based on combined UV-vis-NIR spectra for rapid quantification of physical and chemical properties of industrial hemp extracts. Phytochem. Anal. 2021, 32, 326–338. [Google Scholar] [CrossRef]
  41. Mukherjee, V.; Yadav, T. Conformational study of neutral histamine monomer and their vibrational spectra. Spectrochim. Acta A 2016, 165, 167–175. [Google Scholar] [CrossRef]
  42. Valinger, D.; Kušen, M.; Tušek, A.; Panić, M.; Jurina, T.; Benković, M.; Redovniković, I.R.; Kljusurić, J.G. Development of near infrared spectroscopy models for quantitative prediction of the content of bioactive compounds in olive leaves. Chem. Biochem. Eng. Q 2019, 32, 535–543. [Google Scholar] [CrossRef]
  43. Jurinjak Tušek, A.; Benković, M.; Malešić, E.; Marić, L.; Jurina, T.; Gajdoš Kljusurić, J.; Valinger, D. Rapid quantification of dissolved solids and bioactives in dried root vegetable extracts using near infrared spectroscopy. Spectrochim. Acta A 2021, 120074. [Google Scholar] [CrossRef]
  44. Stoyanova, R.; Brown, T.R. NMR spectral quantitation by principal component analysis. NMR Biomed. 2001, 14, 271–277. [Google Scholar] [CrossRef]
  45. Stoyanova, R.; Arias-Mendoza, F.; Brown, T.R. Making multi-dimensional spectroscopy practical: Application of principal-component analysis to CSI data. In High-Power Gradient MR-Imaging; Oudkerk, M., Edelman, R.R., Eds.; Blackwell: Berlin, Germany, 1997. [Google Scholar]
  46. Ajiboye, A.; Abdullah-Arshah, R.; Qin, H.; Isah-Kebbe, H. Evaluating the effect of dataset size on predictive model using supervised learning technique. IJSECS 2015, 1, 75–84. [Google Scholar] [CrossRef]
Figure 1. SERS spectra of calibration samples spiked with 75 mg/kg histamine and real samples T5 and B3 with similar histamine content.
Foods 10 01767 g001
Figure 2. Validation results of PLSR equations for different input data, obtained by different preprocessing of SERS spectra of combined fish samples (Fish) and individual fish species (tuna, bonito) with corresponding root mean square errors (RMSE).
Foods 10 01767 g002
Table 1. Histamine content of samples with naturally formed histamine determined by the reference HPLC method expressed as mean (n = 3) ± SD (tuna samples: T1–T7, bonito samples: B1–B5).
SampleHistamine Content
(mg/kg)
SampleHistamine Content
(mg/kg)
T18.6 ± 3.3T7248.1 ± 11.7
T29.6 ± 1.4B133.6 ± 0.6
T323.0 ± 6.3B241.1 ± 1.0
T433.3 ± 0.8B376.1 ± 0.5
T581.8 ± 6.2B4136.2 ± 0.4
T6173.7 ± 10.1B5184.9 ± 10.2
Table 2. Results of model evaluation parameters (R2 and RMSE) for different preprocessing methods used for calibration data (model M1 in the range of 1140–1618 cm−1).
Calibration
Pre-Processing MethodRc2RMSEC
Normalize, N0.96616.072
Baseline, B0.97813.169
Standard Normal Variate, SNV0.98411.127
Moving Average, MA0.96616.125
Gaussian filter, GF0.97114.969
Median filter, MF0.96715.904
Savitzky-Golay Smoothing, SG_Sm0.96616.129
Baseline + der. S-G, B+dSG0.95917.805
SNV + der. S-G, SNV+dSG0.97214.747
Pre-processing method0.96616.072
Table 3. Parameters of PLSR models based on different spectral regions (M2: 1240–1350 & 1500–1600 cm−1; M3: 1264, 1268, 1304, 1320, 1437 & 1570 cm−1; M4: 1268; 1320, 1570 cm−1).
ModelCalibrationFishBonitoTuna
Rc2RMSECRv2RMSEVRv2RMSEVRv2RMSEV
M10.97813.1690.800237.7410.48252.5780.913242.606
M20.94520.7010.786140.5290.72243.2620.912131.231
M30.76442.8420.69167.5890.377556.6980.87968.901
M40.50473.5250.40968.0450.402250.3760.42271.555
Table 4. Artificial neural network models for histamine prediction of calibration sample sets for combined fish samples (Fish) and individual fish species (Tuna, Bonito).
FishModelNetwork ArchitectureTraining Perf.Test Perf.Validation Perf.Training ErrorTest ErrorValidation ErrorHidden ActivationOutput Activation
FishM110-12-10.99750.98280.97546.377415.357820.4546TanhExponential
M210-6-10.99600.99110.99067.897411.242013.2226TanhIdentity
M310-10-10.98970.96140.958512.690323.355728.1661ExponentialLogistic
M410-9-10.80450.71170.664452.620158.976471.8243LogisticLogistic
BonitoM110-12-10.99640.99550.99107.63009.089813.0946ExponentialLogistic
M210-5-10.99810.99540.99165.63709.237110.1250TanhExponential
M310-7-10.99640.99390.98707.802810.834512.6816LogisticExponential
M410-8-10.90470.89280.850739.461344.279149.3624TanhExponential
TunaM110-13-10.99810.99530.99455.35129.25809.3494TanhExponential
M210-11-10.99790.99080.99026.074611.604113.0318TanhLogistic
M310-6-10.99590.99460.99197.86039.742711.2788LogisticExponential
M410-13-10.92950.86480.826931.862447.366449.4626LogisticExponential
Table 5. Artificial neural network models for histamine prediction for calibration sample sets combined with real sample sets of each fish species.
FishModelNetwork ArchitectureTraining Perf.Test Perf.Validation Perf.Training ErrorTest ErrorValidation ErrorHidden ActivationOutput Activation
BonitoM110-10-10.99650.99060.98747.541511.864612.7808LogisticExponential
M210-7-10.99640.99260.98837.644010.765113.4342TanhExponential
M310-6-10.99310.98390.979710.615715.494616.6087ExponentialExponential
M410-5-10.93500.87550.856432.216342.377349.1198LogisticLogistic
TunaM110-10-10.99770.99330.99206.35208.802011.6935LogisticExponential
M210-12-10.99810.99310.99305.86719.017810.6760TanhExponential
M310-10-10.99800.99330.99256.00899.094211.3809TanhExponential
M410-11-10.93990.86980.863032.232339.159648.9777ExponentialTanh
Table 6. Artificial neural network models for histamine prediction in real fish samples for combined fish samples (Fish) and individual fish species (Tuna, Bonito).
FishModelNetwork ArchitectureTraining Perf.Test Perf.Validation Perf.Training ErrorTest ErrorValidation ErrorHidden ActivationOutput Activation
FishM110-7-10.99880.99370.99363.96888.83499.7735TanhIdentity
M210-8-10.99930.99730.99352.97495.86209.6090ExponentialTanh
M310-10-10.99780.99390.99355.47149.064110.4907LogisticTanh
M410-5-10.98310.96530.960215.182421.701523.3168LogisticExponential
BonitoM110-10-10.99900.99760.99552.40705.34075.8885LogisticExponential
M210-10-10.99920.99720.99582.40934.88948.1239ExponentialLogistic
M310-4-10.99960.99890.97131.60745.197316.2568LogisticIdentity
M410-9-10.99820.96980.96033.802417.405121.3636TanhLogistic
TunaM110-6-10.99950.99900.99882.81033.65194.3021ExponentialLogistic
M210-12-10.99980.99900.99891.63273.64204.6434TanhExponential
M310-11-10.99990.99960.99871.27632.30124.5641TanhIdentity
M410-4-10.99590.99240.99127.751210.007312.8127TanhTanh
Publisher’s Note: MDPI stays neutral with regard to jurisdictional claims in published maps and institutional affiliations.

