Article

The Influence of Individual-Specific Plant Parameters and Species Composition on the Allergenic Potential of Urban Green Spaces

by
Susanne Jochner-Oette
1,*,
Theresa Stitz
1,
Johanna Jetschni
1 and
Paloma Cariñanos
2
1
Physical Geography/Landscape Ecology and Sustainable Ecosystem Development, Catholic University of Eichstätt-Ingolstadt, Eichstätt 85072, Germany
2
Department of Botany, Faculty of Pharmacy, Campus de Cartuja, University of Granada, Granada 18071, Spain
*
Author to whom correspondence should be addressed.
Forests 2018, 9(6), 284; https://doi.org/10.3390/f9060284
Submission received: 3 May 2018 / Revised: 17 May 2018 / Accepted: 19 May 2018 / Published: 23 May 2018
(This article belongs to the Special Issue Growth and Ecosystem Services of Urban Trees)

Abstract

:
Green planning focusses on specific site requirements such as temperature tolerance or aesthetics as crucial criteria in the choice of plants. The allergenicity of plants, however, is often neglected. Cariñanos et al. (2014; Landscape and Urban Planning, 123: 134–144) developed the Urban Green Zone Allergenicity Index (IUGZA) that considers a variety of plant characteristics to calculate the allergenic potential of urban green spaces. Based on this index, we calculated an index for the individual-specific allergenic potential (IISA) that accounts for a varying foliage volume by accurate measurements of crown heights and surface areas occupied by each tree and only included mature individuals. The studied park, located in Eichstätt, Germany, has an area of 2.2 ha and consists of 231 trees. We investigated the influence of species composition using six planting scenarios and analysed the relationship between allergenic potential and species diversity using Shannon index. Only a small number of trees was female and therefore characterised as non-allergenic, 9% of the trees were classified as sources of main local allergens. The allergenic potential of the park based on literature values for crown height and surface was IUGZA = 0.173. Applying our own measurements resulted in IISA = 0.018. The scenarios indicated that replacing trees considered as sources of main local allergens has the strongest impact on the park’s allergenic potential. The IUGZA offers an easy way to assess the allergenic potential of a park by the use of a few calculations. The IISA reduces the high influence of the foliage volume but there are constraints in practicability and in speed of the analysis. Although our study revealed that a greater biodiversity was not necessarily linked to lower index values, urban green planning should focus on biodiversity for ameliorating the allergenic potential of parks.

1. Introduction

Allergic diseases are considered as important human health issues as they substantially restrict many allergic people [1,2]. In Germany, almost 20% of the adult population suffers from at least one type of allergy [1] and 30% of the adult population and 50% of the adolescent generation show sensitisations [2]. Since 15% of the population are affected by hay fever [3], pollen allergy poses a major risk for humans.
In light of these rising numbers of allergic diseases, the consideration of allergy-friendliness in urban green planning seems to be essential [1,4]. Actually, pollination is regarded as an ecosystem service provided by green infrastructure [5]. When related to pollen allergies, however, it can also be considered as an ecosystem disservice [6] representing a conflict to other ecosystem services such as recreation and health benefits as green spaces regulate climate and improve air quality [5].
Urban green planning mainly focusses on specific site requirements (e.g., temperature tolerance, pest resistance, tolerance to pruning) and aesthetics as crucial criteria in the choice of plants [7]. The allergenic potential of plants, however, is often neglected [1,4,8]. Still, more research is required regarding the use of allergenic plants in green spaces and the development of allergy-friendly green areas in urban environments. Some attempts have been made to formulate planning recommendations to reduce negative health impacts caused by plants producing allergenic pollen [9,10,11]. For example, it was recommended to develop gardens with only female plants or with a great diversity of non-allergenic plants [10]. Microbial diversity was found to positively affect the human immune system by reducing certain allergenic and respiratory diseases (e.g., reviewed by [12]). A study conducted in eastern Finland showed that atopic individuals were associated with lower environmental biodiversity in the surroundings of their homes and significantly lower generic diversity of gammaproteobacteria on their skin [13]. Since there is a link between richness of macroorganisms and the associated microbial biodiversity [12], a greater biodiversity of plants in general may reduce the risk of allergy sensitisations. In addition, an increased biodiversity linked to a reduction of traditional species with a high allergenic capacity leads to lower concentrations of monospecific pollen [14].
The allergenic potential of plants was assessed by [10] who developed the Ogren Plant Allergy Scale (OPALS). This scale considers different plant-specific criteria based on studies about similarities between allergenic and non-allergenic plants. Characteristics include pollen weight and size, pollen moisture, flower fragrance as well as the position of male flowers of monoecious species. The scale categorises species at ten levels with 1 being non-allergenic and 10 being highly allergenic. Another attempt to categorise plants according to their allergological characteristics was made by [15] who developed the allergen index (A.I.). This index is based on information on the plant’s life cycle, the length of its phenanthesic period, the presence of phenomena of cross reactivity and species abundance [15,16]. In addition, [17] developed the so-called Urban Green Zone Allergenicity Index (IUGZA) to calculate the allergenic potential of urban green spaces. This index compares an existent green space with a hypothetical space with maximum allergenicity. The index is based on the following assumptions: Plants with a higher crown volume emit higher pollen quantities [18], anemophilous trees produce more pollen than other trees [19] and pollen release is directly proportional to the number of individuals belonging to one species.
In this study, the current allergenic potential of the trees and shrubs in an urban park (Hofgarten, located in Eichstätt, Germany) was examined using IUGZA.
Based on this index, we developed IISA, an index for the individual-specific allergenic potential of urban green spaces. Therefore, we measured the height and the surface covered by each individual tree or shrub and only included mature individuals already emitting pollen. In addition, we investigated the influence of species composition on the allergenic potential of the park using six different planting scenarios and analysed the relationship between allergenic potential and species diversity using Shannon index. Thus, our main aims were to develop and evaluate management tools (indices and planting scenarios) in order to formulate recommendations for urban planning. Although this study only includes a single park, our methods are also applicable for any park of any size and therefore illustrative for the practicability of the management tools presented in our study.

2. Materials and Methods
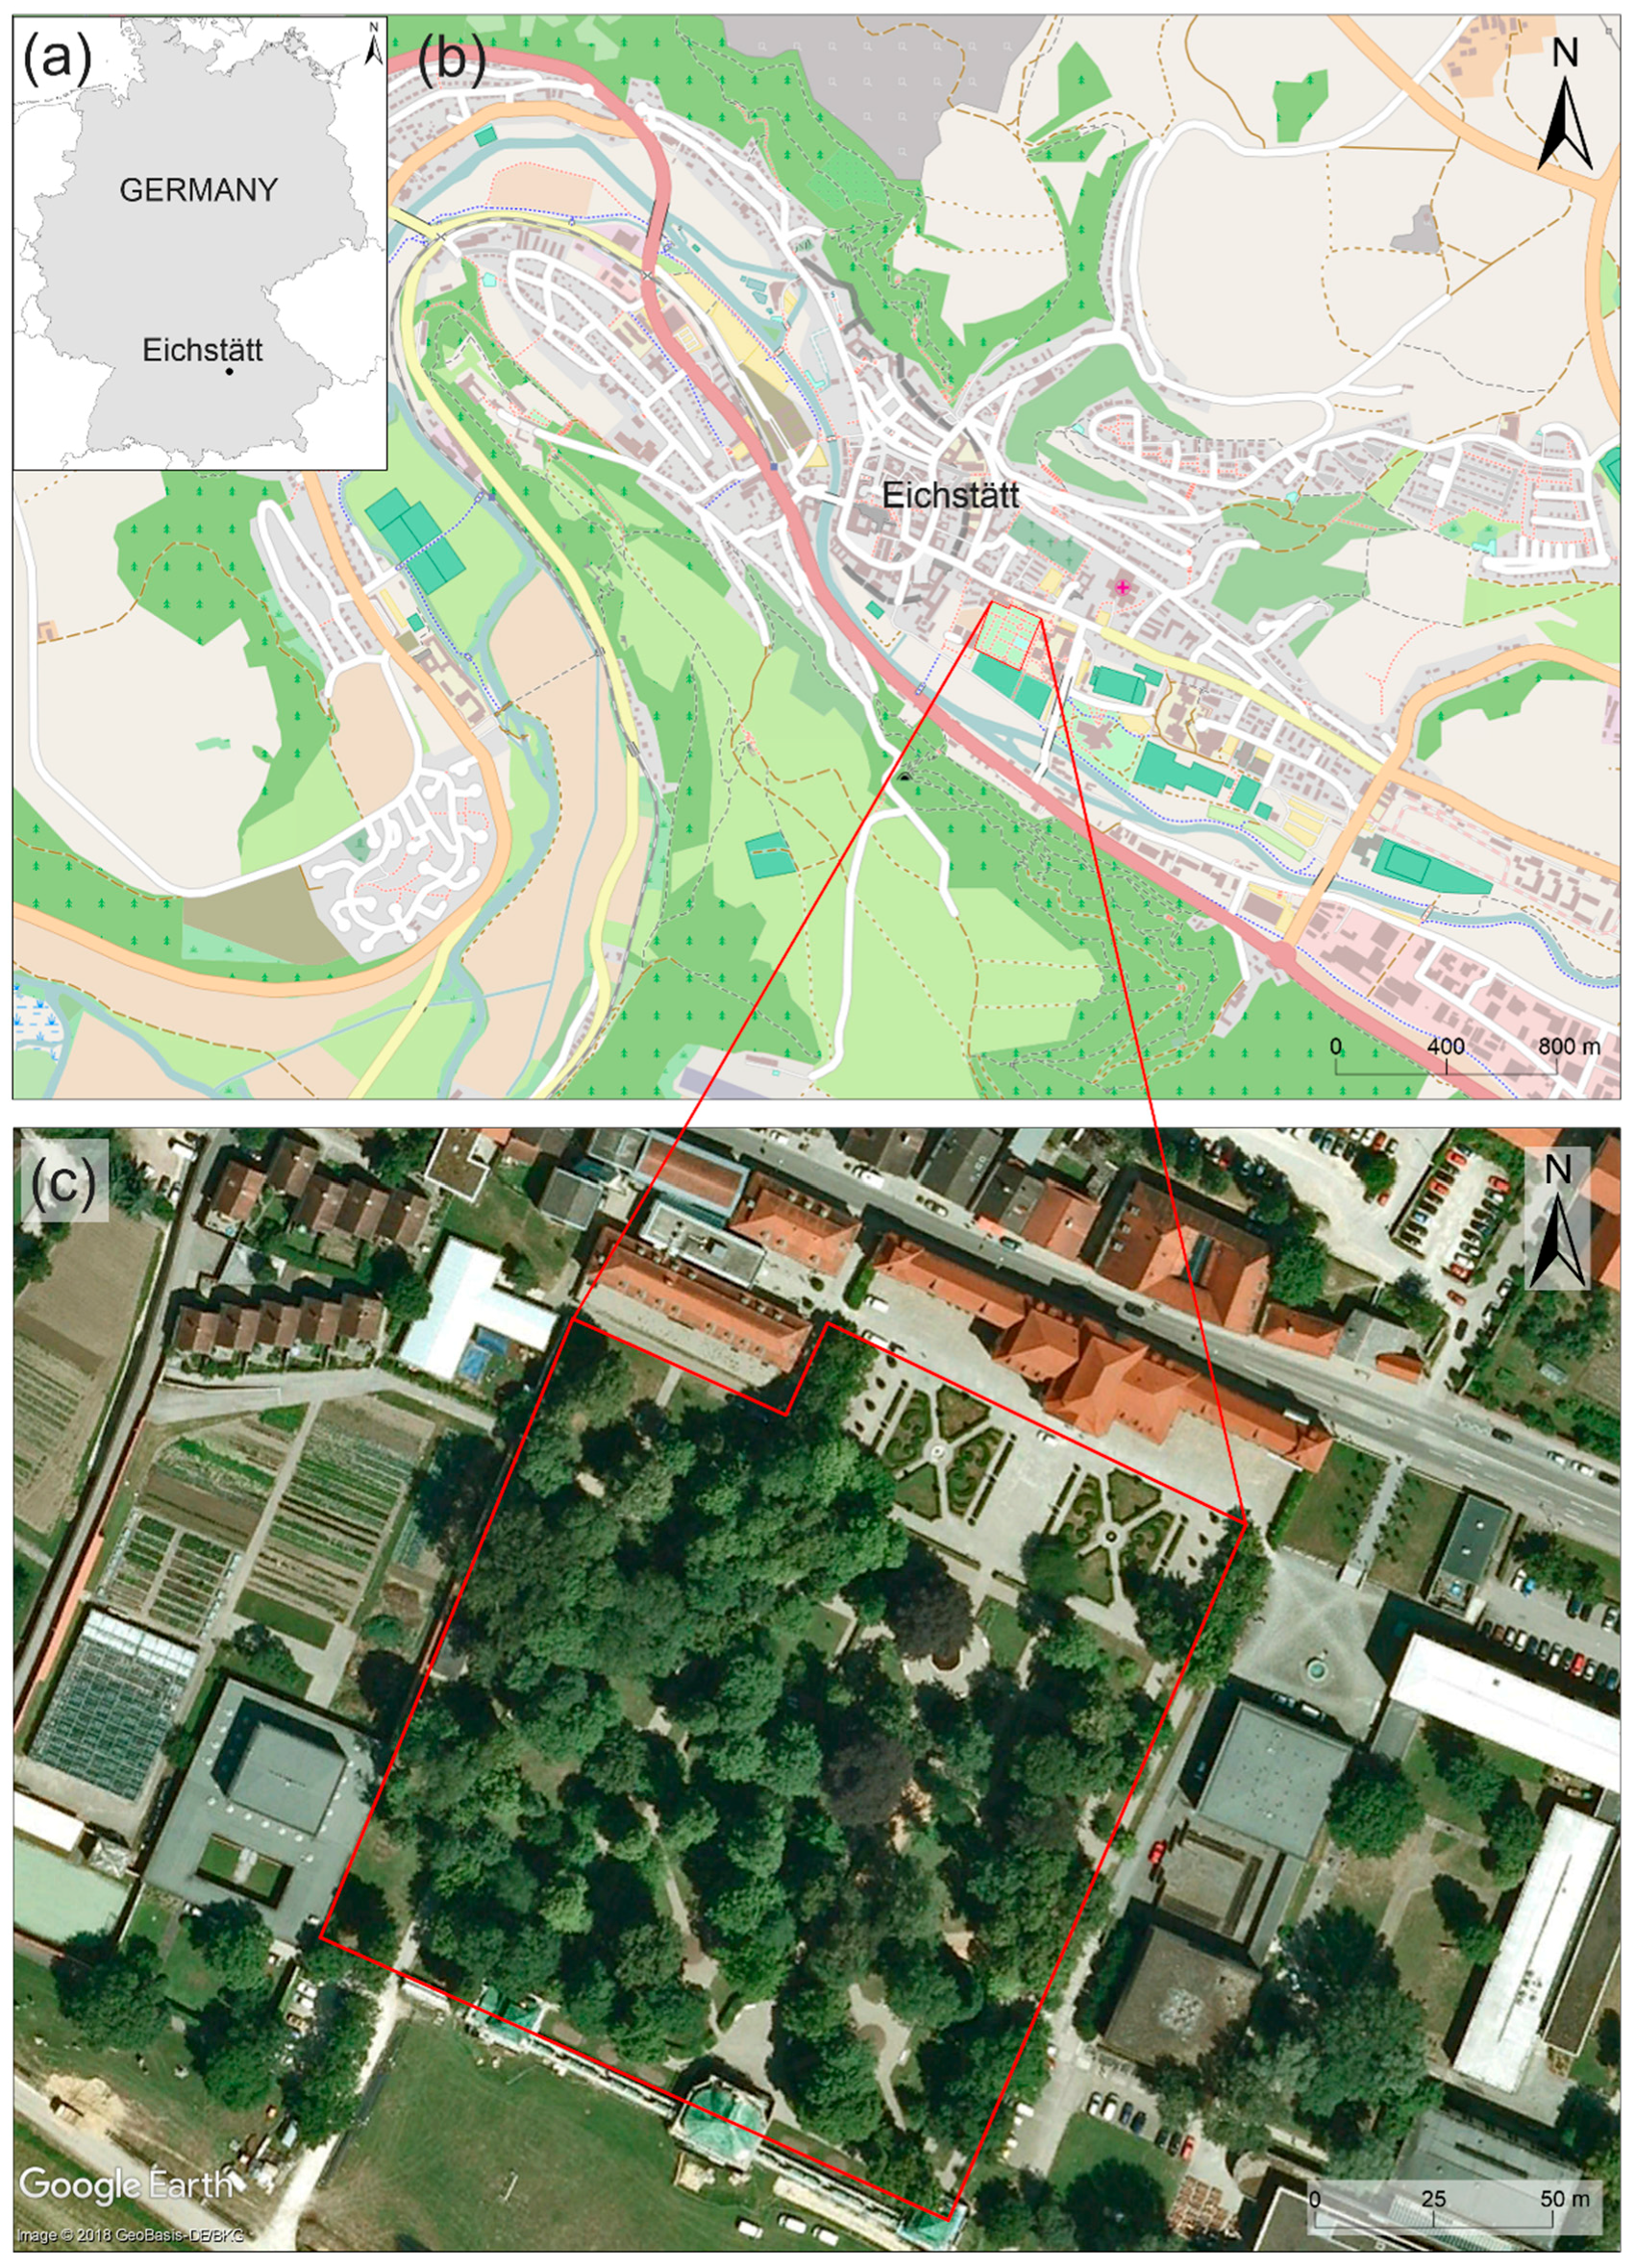
2.1. Study Area

The studied park Hofgarten (48°53′20.54″ N, 11°11′17.78″ E, 385 m a.s.l.) is located in the city of Eichstätt, Bavaria, Germany (Figure 1a,b). The climate is temperate with an average annual temperature of 8.0 °C and an annual precipitation of 776.5 mm (1961–1990, German Meteorological Service, station “Landershofen”). Eichstätt is located at the Altmühl river and has a few open green areas. The rectangular-shaped urban park lies south-east of the city center, next to the main campus of the Catholic University of Eichstätt-Ingolstadt (Figure 1c). Hofgarten has an area of 22,480 m² (~2.2 ha). In 1735, the park was designed as a baroque garden and partially transformed to an English garden after 1817. In recent times, these concepts were combined leading to a composition of geometrically designed and accurately pruned baroque elements with long and structured avenues and a variety of some very old trees originating from Europe, North America and Asia [20]. Recently, the park counts 231 trees and shrubs of 69 different species (excluding hedges, flowerbeds and grass and herb species) (Table 1).

2.2. IUGZA—Urban Green Zone Allergenicity Index

The Urban Green Zone Allergenicity Index (IUGZA, [17], Equation (1)) compares an existent green space with a hypothetical space with maximum allergenicity. The index considers a variety of plant characteristics, partially adjusted for our study (Table 2).
I UGZA = 1 378 · S T · i = 1 k n i · ap i · pe i · ppp i · S i · H i
Relevant variables for IUGZA are the total area of the examined green space in square meters (ST), the number of species (k), the number of individuals belonging to one species i (ni), species-specific and classified values for allergenicity (api), type of pollen emission (pei), duration of the main pollination period (pppi), crown height in meters (Hi) and surface area of the plant in square meters (Si) (classification see Table 2). The values for the parameters of the index were—apart from the base area of the green space (ST) and of the present number of species and individuals (k, ni)—obtained from databases or reports and in this study adapted to conditions prevailing in the biogeographic region of our investigated park (see Section 2.4). The capacity of species-specific pollen emission (Si × Hi) was calculated using a volume calculation of geometric plant shapes. A cylindrical shape was used for trees and a hemispherical shape for shrubs. The height of the crown (Hi) and surface area of trees and shrubs (Si) refer to the maximum values of a mature individual of the respective species. For simplification, these literature-based values of Hi and Si were also classified or scaled.
The figure 378 is an expression of the maximum values (api × pei × pppi × Hi) a species i can obtain and serves, together with the base area of the green space (ST), as reference unit of the formula. Although, maximum values for height can reach 18 m and main local allergens are considered as ap = 4, [17] used ap = 3, pe = 3, ppp = 3 and H = 14 for the calculation of this factor.
An index value of 0 can only be obtained if the tree is female (pe = 0) or the emitted pollen is non-allergenic (ap = 0).
Values higher than 0.5 already relate to a high allergenic potential [17]. When a densely planted green space is considered, the sum of all surface areas occupied by the plants can be greater than the base area of the green space (ST). In this case and when all factors and parameters measured are maximal, the index can also exceed the value of 1.

2.3. IISA—Index of Individual-Specific Allergenic Potential of Green Spaces

The index of the individual-specific allergenic potential of green spaces (IISA) was calculated using the same formula as for IUGZA (Equation (1)). In contrast to IUGZA, we measured the crown height (Hi) and surface areas (Si) of each plant. In addition, IISA uses a different constant (1/1188) since we considered main local allergens (ap = 4) and the maximum tree height differs in our study due to plant-specific measurements. The highest crown represented by the species Tilia tomentosa was H = 33 m. In contrast to the study presented by [17] we only included mature individuals that are already producing flowers and hence emitting pollen. For both variants (IUGZA and IISA), we excluded flowerbeds and herb and grass species and revised all parameters according to the descriptions below.

2.4. Parameters Used for IUGZA and IISA

For the classification of the allergenic potential (api) of plants, we used the Ogren Plant Allergy Scale (OPALS, [10], reclassification see Table 2). Different species composition and airborne pollen concentrations imply varying sensitisation rates for specific species between countries/regions [8]. Thus, locally occurring highly allergenic plants were additionally taken into account (ap = 4). In our studied park, this relates to species of Betulaceae, Fagaceae and Oleaceae [11]. For missing species not listed in [10], we calculated the median. e.g., the median of all Acer species was used to obtain the value for missing information on the allergenic potential of Acer monspessulanum.
The factor type of pollen emission (pei) consists of information about the type of pollination. E.g., female dioecious plants do not emit any pollen whereas anemophilous plants emit far more pollen than entomophilous plants [22]. The classification of female plants resulted in ap = 0. This classification was mainly made by means of optical characteristics (presence of fruits, e.g., berries on Ilex aquifolium = female). If optical inspections were not possible due to plant height, we used the mean of the allergenicity values for female and male plants of the respective species. For the classification of missing species not evaluated by [17], we used information of the databases BiolFlor [23] and Baumkunde.de [24]. In case of diverging specifications, a plant was attributed to pe = 2.
To adopt the length of the pollination period (pppi) to the biogeographical region of our study, information on this parameter was obtained from literature and databases [23,24,25,26]. Therefore, it was also necessary to adjust the width of classes for this parameter (see Table 2).
The individual-specific volume (Si × Hi) of each tree is considered to represent the capacity of pollen emission [18]. In contrast to IUGZA, the newly developed IISA does not incorporate mean values for adult trees but takes the actual information of Si and Hi for each individual into account. As described by [17], a cylindrical shape was used for trees and a hemispherical shape for shrubs. The unequal symmetry of many trees and shrubs implies that the calculation of the volume of the cylinder remains imprecise when an average radius of the crown is applied. Therefore, the plant’s radius was measured at four positions. Tree and crown height was assessed using a height meter (SUUNTO PM-5/1520).
Since IISA only includes mature individuals, the age of the trees as an indicator for maturity was assessed using a commonly used method proposed by [27] which is based on the measurement of trunk circumferences at a height of 1.5 m. According to [27], the age of the tree is its circumference in centimetres divided by 2.5. In the case of fast-growing trees (e.g., Sequoiadendron giganteum, Pterocarya fraxinifolia, Nothofagus antarctica, Liriodendron tulipifera), the circumference is divided by 5. Information regarding species-specific age of maturity was obtained from different publications [28,29,30,31]. In case of missing information the mean age of maturity of all available species (=20.1 years) was used as a threshold value of maturity. Note that the growth of solitary trees may differ but could not be assessed in the course of our study.

2.5. Planting Scenarios

Since IUGZA uses the maximum plant height and surface of the crown (values known from literature), but IISA requires individual-specific values, it was more sensible to use IUGZA in planting scenarios. In all six scenarios, the number of hypothetical planted individuals equals the number of individuals currently growing in the studied park (N = 231).
For scenario 1, we selected 14 typical park trees according to [32,33]. We calculated their count (see numbers in brackets) according to their current proportional occurrence in the park: Acer plantanoides (34.3), Acer pseudoplatanus (43.3), Aesculus hippocastanum (32.5), Betula pendula (3.6), Carpinus betulus (1.8), Fagus sylvatica (5.4), Fraxinus excelsior (10.8), Larix decidua (1.8), Picea omorica (1.8), Picea pungens (1.8), Taxus baccata (21.7), Tilia cordata (27.1), Tilia platyphyllos (37.9), T. tomentosa (7.2). Scenario 2 is based on the exclusion of locally high-allergenic species. In total 21 trees/shrubs with ap = 4 belonging to the plant families Betulaceae, Fagaceae and Oleaceae were replaced by randomly selected individuals. The median of this new selection was ap = 2. For scenario 3, all present species were selected but uniformly distributed. With 231 individuals and 69 different species, a frequency of 3.35 was assigned to these species. In scenario 4, only the ten most prevalent species were considered (A. pseudoplatanus, T. platyphyllos, A. platanoides, A. hippocastanum, T. cordata, T. baccata, F. excelsior, T. tomentosa, Quercus robur). The number of individuals were uniformly distributed among species. Thus, a frequency of 23.1 was assigned to each species. For scenario 5, also only the ten most prevalent species were incorporated in our calculations, however, with an unequal distribution. The frequencies were 1, 2, 3, 5, 10, 20, 30, 40, 50 and 70 with the lowest frequency related to the species that is represented fewest of all. We considered 24 species in scenario 6 recommended by [34] for city trees and shrubs that were classified at least as suitable in the categories of drought tolerance and winter hardiness. Those climate-tolerant species were uniformly distributed and yielded a count of 9.6. Species belonging to this category were Acer negundo, Sorbus aria, Buxus sempervirens, Cornus mas, Acer rubrum, Ailanthus altissima, Ginkgo biloba, Gleditsia triacanthos, Styphnolobium japonicum, Sorbus domestica, Sorbus torminalis, T. tomentosa, A. monspessulanum, A. platanoides, Aesculus x carnea, B. pendula, C. betulus, P. omorika, T. cordata, Crataegus monogyna, Castanea sativa, Corylus colurna, F. excelsior and Quercus petraea.

2.6. Shannon Index (HS)

The Shannon index HS is a commonly used index to describe biodiversity [35] and was used for the comparison of different planting scenarios. If HS = 0, only one species is prevailing, accounting for 100% of the individuals. The highest diversity represents many different species with an even distribution of individuals. The Shannon index was calculated using Equation (2):
H S = i = 1 S p i · ln ( p i )   with   p i = n i N
where S = number of species, pi = relative frequency of the ith species, ni = number of individuals belonging to one species, and N = number of individuals.

3. Results

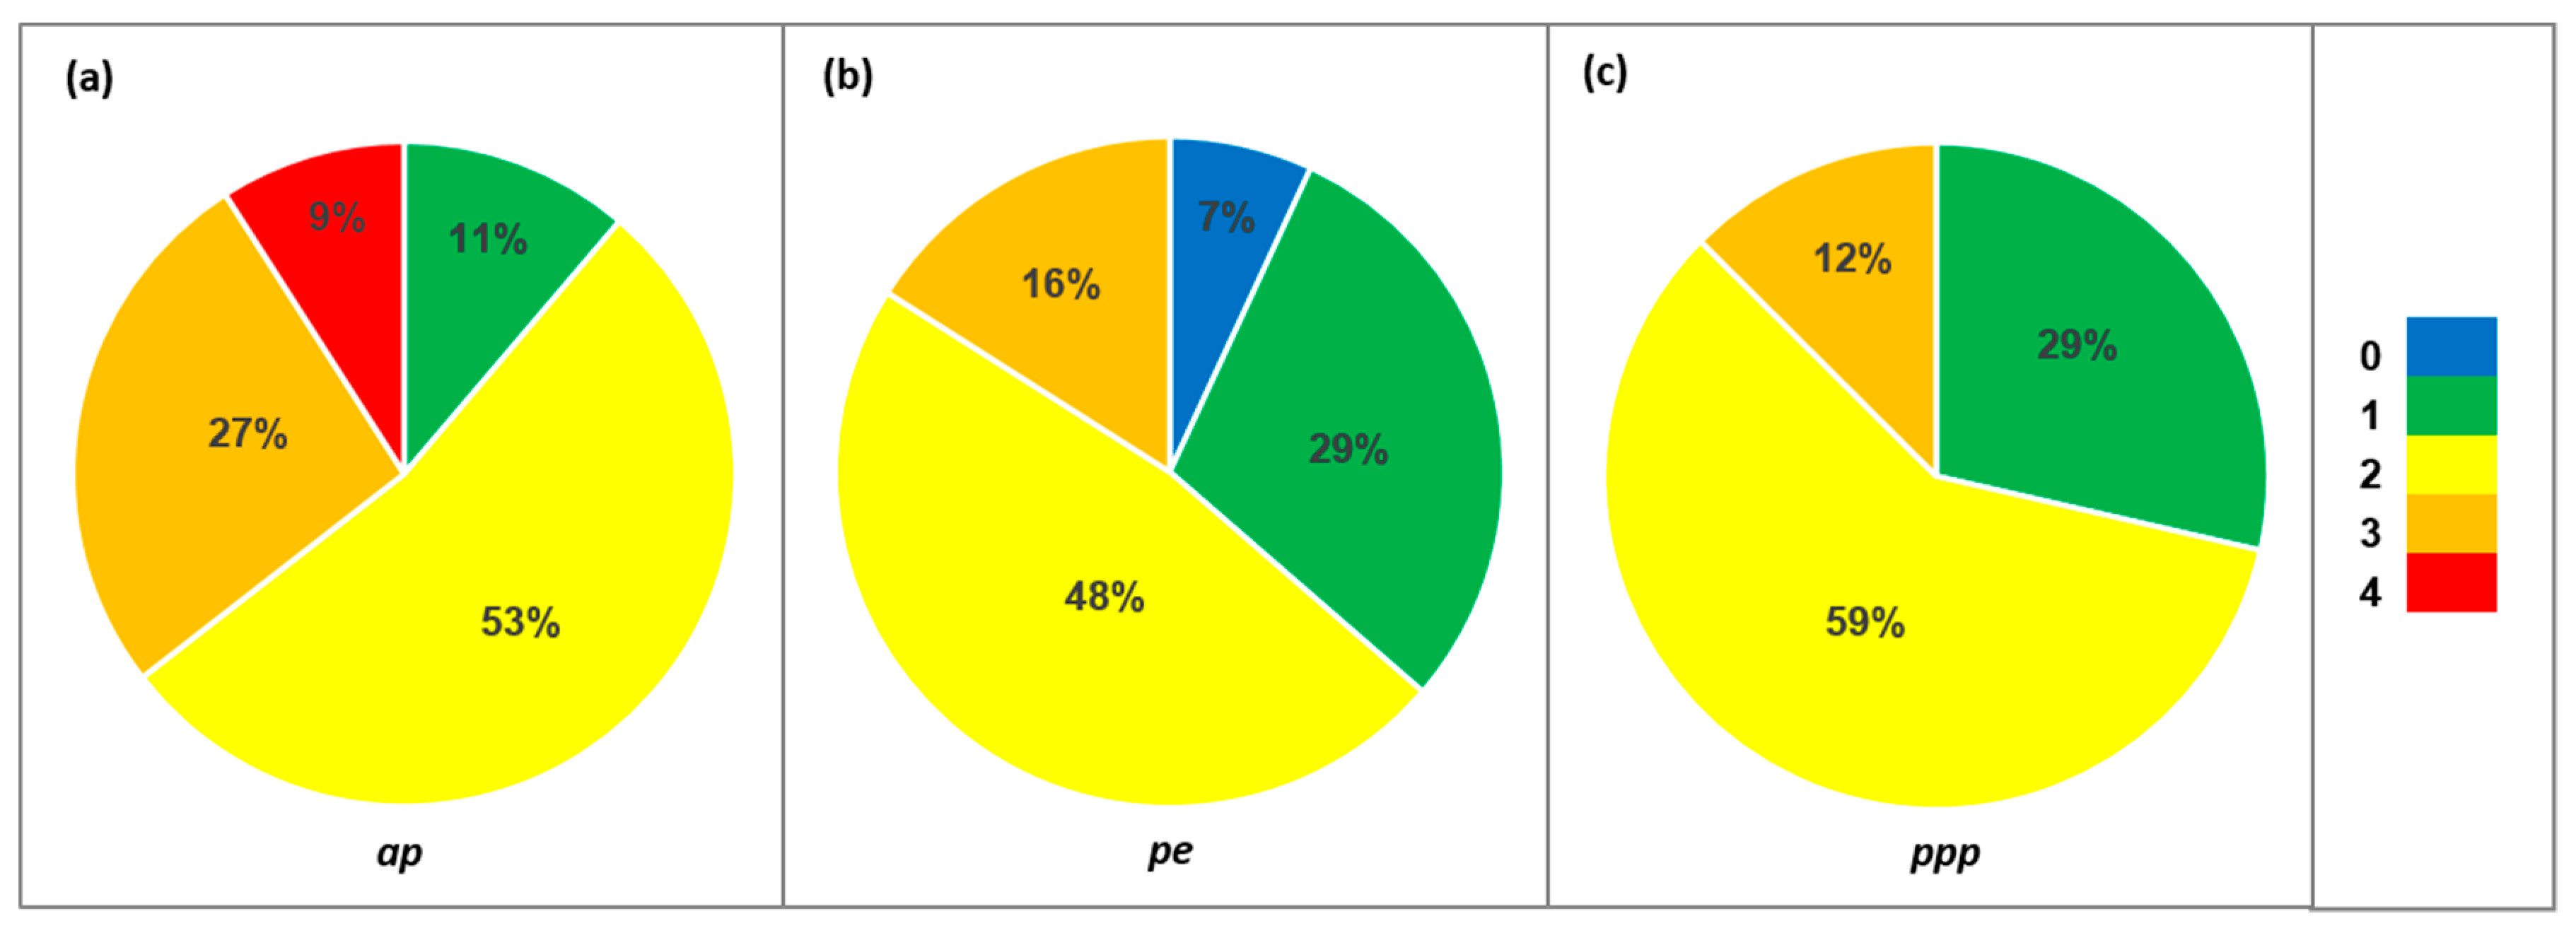
3.1. Plant Characteristics and Current Allergenic Potential of the Park

The allergenic potential of the investigated 231 trees is predominantly moderate (53%; Figure 2a). Only a small number of trees (11%) was characterised as low allergenic and a comparable amount (9%) is even considered as a source of main local allergens (e.g., B. pendula or Corylus avellana). The most common pollination strategy (48%) is the mixture of entomophily and anemophily (Figure 2b). Only 7% of the individuals were female plants producing no pollen (e.g., T. baccata or I. aquifolium). The majority of trees (59%) have a principal pollination period of 4–6 weeks; merely 12% of the plant species flower for 9 weeks or even longer (Figure 2c).
The allergenic potential of the park calculated using literature values for crown height and surface was IUGZA = 0.173. Assuming no alterations of planted species, the park’s potential is limited to a low allergenic potential. Applying our own measurements to the data reduced the index to IISA = 0.018. Thus, the current allergenic potential is substantially overestimated using IUGZA.

3.2. Planting Scenarios and Associated Biodiversity

Although some species producing pollen known as main local allergens (e.g., pollen of B. pendula and F. excelsior) were considered in scenario 1, the planting of typical park trees [32,33] according to their current proportional occurrence was associated with the highest allergenic potential (IUGZA = 0.226, see Table 3). Replacing trees considered as sources of main local allergens (scenario 2) had the strongest positive impact on the park’s allergenic potential (IUGZA = 0.147), almost comparable to scenario 5 (IUGZA = 0.150) where the ten most predominant species with an unequal distribution were selected. An equal distribution, however, induced a comparable high value (IUGZA = 0.197, scenario 4). Applying scenario 3 (uniform distribution of all present species) or scenario 6 (climate-tolerant species [34]), yielded quite similar values for IUGZA compared to the current state (see Table 3).
A greater biodiversity (according to Shannon index Hs) was not necessarily linked to a lower allergenic potential of the park (Table 3 and Figure 3). In fact, the highest biodiversity (Hs = 4.23) in scenario 3 (uniform distribution of all present species) only yielded an average allergenic potential (IUGZA = 0.170). The lowest biodiversity (Hs = 1.81) in scenario 5 (unequal distribution of ten most occurring species) was even associated with a relatively low allergenic potential (IUGZA = 0.150).

4. Discussion

4.1. Comparison of Indices and Conceptual Remarks

The indices IUGZA and IISA used in our study can be used as a management tool in urban green planning. These indices offer a comparison of the allergenic potential of different parks or planting scenarios, therefore, they can contribute to the development of allergy-friendly parks. Since the presented indices account for the total area of the examined green space (see Equation (1)), the methods presented in our study are applicable for any park of any size. In fact, recommendations for planting trees can be applied with little effort, leading to positive effects for pollen allergy sufferers.
The IUGZA facilitates an easy way to assess and predict the allergenic potential of an urban green space by the use of only a few mathematical calculations. To assess the individual-specific allergenic potential of urban green spaces, we developed an index (IISA) that includes individual-specific foliage volume by accurate measurements of crown heights and surface areas occupied by each plant. Since there exists an apparent link between foliage volume and number of flowers (and therefore intensity of pollen emission [18]), it is sensible to use individual-specific measurements. Therefore, the IISA has advantages such as the improvement in accuracy and the reduction of a high influence of the parameters height and surface area. On the other hand, there are constraints in practicability and in speed of the analysis.
In general, the IISA resulted in a lower value compared to IUGZA (0.018 vs. 0.173). This difference is not surprising because the data obtained for calculating IUGZA are based on mean values of mature individuals (which is different to the individual-specific measurement). The actual growth rate of trees is dependent on different site-specific factors such as climate, competition or nutrient supply [36]. Therefore, the calculation of IUGZA based on literature data may lead to an overestimation of the actual crown volume and in turn to an underestimation of the intrinsic allergenic potential. This fact was also mentioned by [37] who applied this index to three localities in Spain.
The purpose of both indices is to compare an actual green space with a hypothetical green space with maximum allergenicity. Generally, plant crowns might overlap resulting in a higher surface area occupied by plants compared to the geometrical surface area of the park. Thus, a conceptual weakness of both indices is the fact that values can also be higher than 1 (see Methods section). In reality, however, the indices are rather small for parks (see Results [17,37]), but not for dense forests [38]. Even smaller values would be obtained when the constant of the formula for IUGZA is adjusted to 648 (by applying the prevailing maximum values for the parameters used: ap = 4, pe = 3, ppp = 3 and H = 18). The value for IISA (0.018) was considerably smaller since the constant used in the equation (1188) included sources of main local allergens (ap = 4) and was adapted to the maximum measured crown height (H = 33 m, T. tomentosa). Some species, e.g., C. avellana, will never reach a comparable height. Therefore, this index might yield in more meaningful values when the height of trees does not differ very much among planted trees or shrubs.
Another modification was the reduction of the number of considered individuals due to the fact that only mature species were included for the calculation of IISA. Considering all species (both mature and immature), the index was quite similar (0.019, data not shown). This is probably attributable to the fact that immature individuals are smaller in size and therefore do not contribute much to the magnitude of the index.
Allergenic pollen is not only restricted to trees and shrubs. The high sensitisation rate in German adults of 37.9% linked to grass pollen [39] shows the importance of lawns. In our studied park, grass is cut on a regular basis and only some small areas covering less than 5% of the park’s area are not cut to promote spontaneous vegetation for insects. Thus, this study does not include the allergenic potential of non-woody plants but only the allergenic potential based on trees and shrubs. The inclusion of lawn area which accounts for 55.9% of the park area (1.3 ha) would result in an increase of IUGZA by 0.00254 when a medium height of 0.2 m is assumed. Including grass for IISA is not sensible since this index is based on accurate measurements of plant heights (which varies in the course of the vegetation season in the case of grass) and only includes mature individuals. Most grasses, however, do not flower in our park due to frequent cutting. Nevertheless, in other urban green areas, the inclusion of non-woody plants may has to be considered as well.
The employment of pruning can be an effective management tool. In our park, accurately pruned individuals of B. sempervirens expose a lower risk since flowers are kept to a minimum. Ideally, information on pruning practices should be included in assessing the allergenic potential of parks. The studies of [17,37] accounted for the effects of grass and flower species. Here, we excluded hedges and lawns since they are very frequently cut.
An important factor not considered in our study is the pollen emission of areas outside the study area [8]. In case of Hofgarten, an inflow especially from south-eastern (plantings and lawns), south-western (large green areas and riverside vegetation) and north-western directions (plant nursery) is possible, despite walls and buildings enclosing this park. Depending on species and wind conditions, pollen can be spread over large areas and great distances [40,41] substantially influencing the allergenic potential of a given place. Pollen abundance is further affected by numerous surfaces for impaction and filtration [42] such as walls and buildings that surround Hofgarten. In addition, needles of conifers or leaves of deciduous trees may influence the impaction of pollen. Early flowering anemophilous plants such as hazel and birch may be able to disperse their pollen more efficiently since their own leaves and most leaves of other plants are not unfolded yet. Except for some fountains, lakes or ponds are not present in Hofgarten, but they allow the deposition of pollen [38]. Since the length of the pollination period (ppp) may vary due to different weather conditions from one year to another [43], phenological observations and/or airborne pollen measurement might contribute to a more accurate index in further studies. In the study of [37], pollen concentrations were monitored at the roof of high buildings, but not in the investigated parks. An exact assessment of the influence of pollen transport however, is only possible with on-site airborne pollen measurements.

4.2. Planting Scenarios and Recommendations for Plantings in Urban Green Areas

The selection of 14 typical park trees in German cities [32,33] according to their current proportional occurrence resulted in the highest allergenic potential (IUGZA = 0.226) among all six planting scenarios. This finding suggests that the planting of common park trees in general is not very suitable for designing allergy-friendly green spaces. This may be attributed to some species whose pollen are known as main local allergens such as B. pendula or F. excelsior. Regarding the current state of the park, a comparison between these typical park trees (93 individuals) and the remaining trees and shrubs which are not very common or even exotic (138 individuals) shows that their proportional IUGZA is almost equal (0.087 vs. 0.086; data not shown). This finding also suggests that typical park trees include species with negative effects for allergy sufferers. It was pointed out that a moderate planting of exotic species leads to an increasing floral diversification, but the overuse of these exotics should be avoided [14]. Olea europaea is an example of a species producing highly allergenic pollen that is mainly planted because of its exotic appearance [10]. Frequently planted individuals of O. europaea lead to an increase of airborne Oleaceae pollen and therefore to an increase of the sensitisation rate of German adults which is currently at 9.7% [39]. This species might pose a risk since a high degree of family relationship with another more common species with allergenic pollen (Fraxinus spp.) exists [44]. The role of exotic species is controversially debated: Whereas [45] attribute exotic species a preventive measure to reduce sensitisations, other authors noted that some species attracted negative attention. For southern Spain, [46] mentioned allergy symptoms in autumn related to the genus Casuarina that is native to Australia and Asia but extensively used as an ornamental tree, especially in coastal cities [47].
The role of main local allergens for the allergenic potential of green spaces is evident: Regarding the current state of the park, 21 major local allergenic trees and shrubs are contributing with a value of 0.036 to the allergenic potential (data not shown). This means that only 9% of the trees and shrubs are responsible for 21.1% of the allergenic potential calculated with IUGZA. For example, major local allergenic pollen of birch, hazel and grasses are triggering clinically relevant symptoms in over 90% of the German adults and on over 75% of Europeans [39]. Thus, replacing main local allergenic plants (scenario 2) had a considerable impact on the park’s allergenic potential (IUGZA = 0.147). The substitution was made by randomly selected individuals with a medium allergenic potential of ap = 2. Using solely non-allergenic plants would yield in even lower values of IUGZA.
To assess the suitability of the current selection of trees, we incorporated three different scenarios. Although a uniform distribution of all planted species (scenario 3) was linked to a similar IUGZA as the actual selection, an equal distribution of the ten most frequently occurring plants (scenario 4) resulted in a comparably high allergenic potential (IUGZA = 0.197). This indicates that the actual preferential selection of trees is not very suitable with respect to their allergenic potential. An unequal distribution (scenario 5, IUGZA = 0.156) reduced the high influence on IUGZA of some species such as the main local allergenic trees Q. robur and F. excelsior as well as the high allergenic potential of T. tomentosa because of its great foliage volume. As a result, the mass use of certain plants results in large quantities of monospecific pollen, probably affecting the frequency of new sensitisations and the aggravation of symptoms in people allergic to this pollen [14].
The categorisation of climate-tolerant species by [34] does not include any parameters related to the risk for allergy sufferers. The species that are able to perform well under changed climatic conditions (scenario 6) yielded similar values for IUGZA compared to the current state. However, for these and for all other species, it has to be considered that plant-related factors such as the length of the pollination period or the pollen’s allergenicity might change with ongoing climate change [48]. In the future, these changes might result in different assessments and have to be timely regarded in urban planning.
The results of our planting scenarios suggest that a greater diversity of trees, assessed using Shannon index, is not linked to a lower allergenic potential of the park. However, several studies claim that urban green planning should focus on biodiversity for ameliorating the allergenic potential of parks [14,17]. Additional species are increasing species diversity but we suppose that the mass use of common pollen emitters leads to high pollen levels increasing the risk of new sensitisations and aggravating allergic reactions.
Allergy sufferers should have access to green spaces where they are not put at additional health risk. In Germany, pollen allergens can be found nearly year-round in the air [26], which can strongly affect those concerned. The occurrence of highly allergenic and anemophilous plants should be limited or avoided, because of their high pollen emission [8]. Furthermore, plants with a long pollination period and the increased planting of only male individuals of dioecious species pose a risk for allergy sufferers. It was suggested that the concept of a female park is suitable for allergy sufferers, because female individuals of dioecious species do not release any pollen [10]. However, the sterility of such green spaces results in a minimised capability of pollination [8]. In addition, female trees are often not favoured for planting due to higher amounts of litter or undesirable odour as observed in G. biloba [14].

5. Conclusions

In order to keep and design cities as liveable as possible, it is important to regard urban green spaces as providers for not only positive ecosystem services but possibly also for ecosystem disservices related to allergies. Until now, not many specific recommendations for the implementation of allergy-friendly city greening exist and are therefore needed. Indices are a useful management tool for analysing and assessing allergenic potential in public green spaces. With purposive consideration of single individuals, they allow to make an actual site-specific assessment. Based on literature values and a few mathematical equations the IUGZA is easy to calculate. The individual-specific allergenic potential of urban green spaces assessed by IISA requires more information obtained by accurate measurements of crown heights and surface areas occupied by each plant. Thus, the calculation of this index is more time consuming but the result is more precise. Planting scenarios and assessing biodiversityare useful for the formulation of recommendations for urban planning. In further studies, influences such as pollen flow from neighbouring or distant green areas should be taken into account.

Author Contributions

S.J.-O. and T.S. conceived and designed the study; T.S. was involved in field measurements; J.J. prepared maps of the study area; S.J.-O. analysed the data; P.C. contributed with methods and plant information; S.J.-O. wrote the paper with the help of all co-authors.

Acknowledgments

We gratefully acknowledge the support of the Spanish Ministry of Economy and Competitiveness (FENOMED CGL2014-54731-R).

Conflicts of Interest

The authors declare no conflict of interest.

References

  1. Bergmann, K.-C.; Heinrich, J.; Niemann, H. Current status of allergy prevalence in Germany: Position paper of the Environmental Medicine Commission of the Robert Koch Institute. Allergo J. Int. 2016, 25, 6–10. [Google Scholar] [CrossRef] [PubMed]
  2. Ring, J.; Bachert, C.; Bauer, C.-P.; Czech, W. Weißbuch Allergie in Deutschland, 3rd ed.; Springer Medizin: München, Germany, 2010; ISBN 978-3-89935-245-0. (In German) [Google Scholar]
  3. Langen, U.; Schmitz, R.; Steppuhn, H. Häufigkeit allergischer Erkrankungen in Deutschland: Ergebnisse der Studie zur Gesundheit Erwachsener in Deutschland (DEGS1). Bundesgesundh. Gesundheitsforsch. Gesundheitssch. 2013, 56, 698–706. (In German) [Google Scholar] [CrossRef] [PubMed]
  4. Bundesministerium für Umwelt, Naturschutz, Bau und Reaktorsicherheit. Grün in der Stadt—Für eine Lebenswerte Zukunft. Grünbuch Stadtgrün; BMUB: Berlin, Germany, 2015. (In German) [Google Scholar]
  5. Millennium Ecosystem Assessment. Ecosystems and Human Well-Being: Synthesis; Island Press: Washington, DC, USA, 2005; ISBN 1-59726-040-1. [Google Scholar]
  6. Lyytimäki, J.; Sipilä, M. Hopping on one leg—The challenge of ecosystem disservices for urban green management. Urban For. Urban Green. 2009, 8, 309–315. [Google Scholar] [CrossRef]
  7. Baumschulen Gebr. van den Berk. Van den Berk über Bäume, 2nd ed.; Baumschule Van den Berk: Sint-Oedenrode, Germany, 2004; ISBN 90-807408-6-1. (In German) [Google Scholar]
  8. Seyfang, V. Studie zum Wissenschaftlichen Erkenntnisstand über das Allergiepotential von Pollenflug der Gehölze im Öffentlichen Grün der Städte und Gemeinden und Mögliche Minderungsstrategien; Hochschule Ostwestfalen-Lippe: Lemgo, Germany, 2008. (In German) [Google Scholar]
  9. Huntington, L. Das Gartenbuch für Allergiker. Die Schönsten Pflanzen, die Besten Arbeitsweisen; VGS: Köln, Germany, 1999; ISBN 3802513851. (In German) [Google Scholar]
  10. Ogren, T.L. Allergy-Free Gardening. The Revolutionary Guide to Healthy Landscaping; Ten Speed Press: Berkeley, CA, USA, 2000; ISBN 1580081665. [Google Scholar]
  11. Bergmann, K.-C.; Zuberbier, T.; Ausgustin, J.; Mücke, H.-G.; Straff, W. Klimawandel und Pollenallergie. Städte und Kommunen sollten bei der Bepflanzung des öffentlichen Raums Rücksicht auf Pollenallergiker nehmen. Allergo J. 2012, 21, 103–108. (In German) [Google Scholar] [CrossRef]
  12. Sandifer, P.A.; Sutton-Grier, A.E.; Ward, B.P. Exploring connections among nature, biodiversity, ecosystem services, and human health and well-being: Opportunities to enhance health and biodiversity conservation. Ecosyst. Serv. 2015, 12, 1–15. [Google Scholar] [CrossRef]
  13. Hanski, I.; von Hertzen, L.; Fyhrquist, N.; Koskinen, K.; Torppa, K.; Laatikainen, T.; Karisola, P.; Auvinen, P.; Paulin, L.; Mäkelä, M.J.; et al. Environmental biodiversity, human microbiota, and allergy are interrelated. Proc. Natl. Acad. Sci. USA 2012, 109, 8334–8339. [Google Scholar] [CrossRef] [PubMed]
  14. Cariñanos, P.; Casares-Porcel, M. Urban green zones and related pollen allergy: A review. Some guidelines for designing spaces with low allergy impact. Landsc. Urban Plan. 2011, 101, 205–214. [Google Scholar] [CrossRef]
  15. Hruska, K. Assessment of urban allergophytes using an allergen index. Aerobiologia 2003, 19, 107–111. [Google Scholar] [CrossRef]
  16. Ciferri, E.; Torrisi, M.; Staffolani, L.; Hruska, K. Ecological study of the urban allergenic flora of central Italy. J. Mediter. Ecol. 2006, 7, 15–21. [Google Scholar]
  17. Cariñanos, P.; Casares-Porcel, M.; Quesada-Rubio, J.-M. Estimating the allergenic potential of urban green spaces: A case-study in Granada, Spain. Landsc. Urban Plan. 2014, 123, 134–144. [Google Scholar] [CrossRef]
  18. Friedman, J. The Ecology and Evolution of Wind Pollination. Ph.D. Thesis, University of Toronto, Toronto, ON, Canada, 2009. [Google Scholar]
  19. Givnish, T.J. Ecological constraints on the evolution of breeding systems in seed plants: Dioecy and dispersal in Gymnosperms. Evolution 1980, 34, 959. [Google Scholar] [CrossRef] [PubMed]
  20. Besl, M. Der Hofgarten vor der Sommerresidenz Eichstätt. Genese und Vergleiche. Master’s Thesis, Catholic University of Eichstätt-Ingolstadt, Eichstätt, Germany, 2011. (In German). [Google Scholar]
  21. Byng, J.W.; Chase, M.W.; Christenhusz, M.J.; Fay, M.F.; Judd, W.S.; Mabberley, D.J.; Sennikov, A.N.; Soltis, D.E.; Soltis, P.S.; Stevens, P.F.; et al. An update of the Angiosperm Phylogeny Group classification for the orders and families of flowering plants: APG IV. Bot. J. Linn. Soc. 2016, 181, 1–20. [Google Scholar] [CrossRef]
  22. Pütz, N. Studienhilfe Botanik; Vechtaer fachdidaktische Forschungen und Berichte No. 17; Institut für Didaktik der Naturwissenschaften, der Mathematik und des Sachunterrichts: Vechta, Germany, 2008. (In German) [Google Scholar]
  23. Umweltforschungszentrum Leipzig Halle. BiolFlor: Datenbank Biologisch-Ökologischer Merkmale der Flora von Deutschland. Available online: http://www2.ufz.de/biolflor/index.jsp (accessed on 20 February 2017). (In German).
  24. Gurk, C.; Hepp, C. Baumkunde.de: Online-Datenbank für Bäume und Sträucher. Available online: http://www.baumkunde.de/ (accessed on 20 February 2017). (In German).
  25. Jäger, E.J.; Müller, G.K.; Ritz, C.; Welk, E.; Wesche, K. Rothmaler—Exkursionsflora von Deutschland. Gefäßpflanzen: Atlasband, 11th ed.; Springer Spektrum: München, Germany, 2007. (In German) [Google Scholar]
  26. Stiftung Deutscher Polleninformationsdienst. Pollenflugkalender für Deutschland: Pollenflug Gesamtdeutscher Raum 2007–2011. Available online: http://www.pollenstiftung.de/pollenvorhersage/pollenflug-kalender/ (accessed on 7 March 2017). (In German).
  27. Mitchell, A. Die Wald- und Parkbäume Europas. Ein Bestimmungsbuch für Dendrologen und Naturfreunde, 2nd ed.; Parey: Hamburg, Germany, 1979; ISBN 3490059182. (In German) [Google Scholar]
  28. Bartels, H. Gehölzkunde; Ulmer: Stuttgart, Germany, 1993. (In German) [Google Scholar]
  29. Schütt, P.; Weisgerber, H.; Schuck, H.J.; Lang, U.M.; Stimm, B.; Roloff, A. Enzyklopädie der Laubbäume. Die Große Enzyklopädie mit über 800 Farbfotos unter Mitwirkung von 30 Experten; Nikol: Hamburg, Germany, 2006; ISBN 3937872396. (In German) [Google Scholar]
  30. Schütt, P.; Schuck, H.J.; Stimm, B. Lexikon der Bauch- und Strauchbaumarten. Das Standardwerk der Forstbotanik, 3rd ed.; Nikol: Hamburg, Germany, 2014. (In German) [Google Scholar]
  31. Stinglwagner, G.K.F.; Haseder, I.E.; Erlbeck, R. Das Kosmos Wald- und Forstlexikon, 2nd ed.; Kosmos: Stuttgart, Germany, 2005; ISBN 3440103757. (In German) [Google Scholar]
  32. Kunick, W. Biotopkartierung—Landschaftsökologische Grundlagen; Teil 3; Stadt Köln: Köln, Germany, 1983. (In German) [Google Scholar]
  33. Wittig, R. Siedlungsvegetation. 40 Tabellen; Ulmer: Stuttgart (Hohenheim), Germany, 2002; ISBN 9783800136933. (In German) [Google Scholar]
  34. Roloff, A.; Bonn, S.; Gillner, S. Konsequenzen des Klimawandels—Vorstellung der Klima-Arten-Matrix (KLAM) zur Auswahl geeigneter Baumarten. Stadt+Grün 2009, 57, 53–60. [Google Scholar]
  35. Munk, K. Ökologie—Evolution; Thieme: Stuttgart, Germany, 2009; ISBN 3131448814. (In German) [Google Scholar]
  36. Speer, J.H. Fundamentals of Tree-Ring Research; University of Arizona Press: Tuscon, AZ, USA, 2010. [Google Scholar]
  37. Maya Manzano, J.M.; Tormo Molina, R.; Fernández Rodríguez, S.; Silva Palacios, I.; Gonzalo Garijo, Á. Distribution of ornamental urban trees and their influence on airborne pollen in the SW of Iberian Peninsula. Landsc. Urban Plan. 2017, 157, 434–446. [Google Scholar] [CrossRef]
  38. Cariñanos, P.; Adinolfi, C.; de Guardia, C.L.D.; de Linares, C.; Casares-Porcel, M. Characterization of allergen emission sources in urban areas. J. Environ. Qual. 2016, 45, 244–252. [Google Scholar] [CrossRef] [PubMed]
  39. Burbach, G.J.; Heinzerling, L.M.; Edenharter, G.; Bachert, C.; Bindslev-Jensen, C.; Bonini, S.; Bousquet, J.; Bousquet-Rouanet, L.; Bousquet, P.J.; Bresciani, M.; et al. GA(2)LEN skin test study II: Clinical relevance of inhalant allergen sensitizations in Europe. Allergy 2009, 64, 1507–1515. [Google Scholar] [CrossRef] [PubMed]
  40. Stanley, R.G.; Linskens, H.F. Pollen. Biologie, Biochemie, Gewinnung und Verwendung, Lizenzausg; Freund: Greifenberg, Germany, 1985; ISBN 9783924733001. [Google Scholar]
  41. Makra, L.; Matyasovszky, I.; Tusnády, G.; Wang, Y.; Csépe, Z.; Bozóki, Z.; Nyúl, L.G.; Erostyák, J.; Bodnár, K.; Sümeghy, Z.; et al. Biogeographical estimates of allergenic pollen transport over regional scales: Common ragweed and Szeged, Hungary as a test case. Agric. For. Meteorol. 2016, 221, 94–110. [Google Scholar] [CrossRef]
  42. Emberlin, J.; Norris-Hill, J. Spatial variation of pollen deposition in North London. Grana 1991, 30, 190–195. [Google Scholar] [CrossRef]
  43. Jochner, S.C.; Beck, I.; Behrendt, H.; Traidl-Hoffmann, C.; Menzel, A. Effects of extreme spring temperatures on urban phenology and pollen production: A case study in Munich and Ingolstadt. Clim. Res. 2011, 49, 101–112. [Google Scholar] [CrossRef]
  44. Vara, A.; Fernández-González, M.; Aira, M.J.; Rodríguez-Rajo, F.J. Fraxinus pollen and allergen concentrations in Ourense (South-western Europe). Environ. Res. 2016, 147, 241–248. [Google Scholar] [CrossRef] [PubMed]
  45. Chiesura, A. The role of urban parks for the sustainable city. Landsc. Urban Plan. 2004, 68, 129–138. [Google Scholar] [CrossRef]
  46. García, M.; Moneo, I.; Audicana, M.T.; del Pozo, M.D.; Muñoz, D.; Fernández, E.; Díez, J.; Etxenagusia, M.A.; Ansotegui, I.J.; Fernández de Corres, L. The use of IgE immunoblotting as a diagnostic tool in Anisakis simplex allergy. J. Allergy Clin. Immunol. 1997, 99, 497–501. [Google Scholar] [CrossRef]
  47. Trigo, I.F.; Davies, T.D.; Bigg, G.R. Objective climatology of cyclones in the Mediterranean region. J. Clim. 1999, 12, 1685–1696. [Google Scholar] [CrossRef]
  48. Beggs, P.J. Impacts of climate change on aeroallergens: Past and future. Clin. Exp. Allergy 2004, 34, 1507–1513. [Google Scholar] [CrossRef] [PubMed]
Figure 1. Location of the study site in Germany (Eurostat, NUTS 2013/EU-28) (a) and in the city of Eichstätt, red border; (b) OpenStreetMap; (c) GoogleEarth.
Forests 09 00284 g001
Figure 2. Percentage of plant individuals (N = 231) in the urban park Hofgarten classified according to their (a) allergenic potential (ap); (b) type of pollen emission (pe) and (c) duration of principal pollination period (ppp, see Table 2 for parameters and values).
Forests 09 00284 g002
Figure 3. Scatterplot with the variables Shannon index (Hs) and Urban Green Zone Allergenicity Index (IUGZA) for the current state of the urban park (0) and for six planting scenarios (values see Table 3).
Forests 09 00284 g003
Table 1. Number (N) of individuals planted in Hofgarten belonging to 69 species and 31 plant families (according to the APG system [21]). ap: allergenic potential, pe: type of pollen emission, ppp: duration of principal pollination period (see Table 2 for parameters and values).
SpeciesNFamilyappepppSpeciesNFamilyappeppp
Acer griseum (Franch.) Pax 19021Sapindaceae221Liquidambar styraciflua L.1Altingiaceae231
Acer monspessulanum L.1Sapindaceae212Liriodendron tulipifera L. 1Magnoliaceae112
Acer negundo L.1Sapindaceae221Magnolia × soulangeana Soul.-Bod.3Magnoliaceae212
Acer pensylvanicum L. 17531Sapindaceae221Magnolia kobus DC. 1Magnoliaceae212
Acer platanoides L.19Sapindaceae322Magnolia stellata (Siebold & Zucc.) Maxim.3Magnoliaceae212
Acer pseudoplatanus L. 175324Sapindaceae321Morus alba L. 17531Moraceae211
Acer rubrum L. 17532Sapindaceae122Nothofagus Antarctica (G. Forster) Oerst.1Nothofagaceae432
Aesculus × carnea Zeyh.2Sapindaceae222Ostrya carpinifolia Scop.1Betulaceae433
Aesculus hippocastanum L.18Sapindaceae222Paeonia × suffruticosa Andrews 1Paeoniaceae112
Ailanthus altissima (Mill.) Swingle1Simaroubaceae321Paulownia tomentosa (Thunb.) Steud.1Paulowniaceae212
Berberis vulgaris L.1Berberidaceae113Philadelphus coronarius L.4Hydrangeaceae113
Betula pendula Roth2Betulaceae432Picea omorika (Pančić) Purk.1Pinaceae131
Buxus sempervirens L.24Buxaceae212Picea pungens Engelm.1Pinaceae133
Carpinus betulus L.1Betulaceae432Platanus × hispanica (Aiton) Willd.1Platanaceae331
Castanea sativa (Mill.)2Fagaceae231Potentilla fruticosa (L.) Rydb.1Rosaceae113
Catalpa bignonioides Walter1Bignoniaceae312Prunus padus L.2Rosaceae212
Celtis australis L.1Cannabaceae331Prunus sargentii ‘Accolade’ Rehder3Rosaceae212
Cercidiphyllum japonicum Siebold & Zucc.1Cercidiphyllaceae212Prunus serrulata ‘Kanzan’ LINDL.1Rosaceae212
Cercis siliquastrum L.1Fabaceae213Prunus tomentosa Thunb.1Rosaceae112
Chaenomeles japonica (Thunb.) Lindl. ex Spach1Rosaceae112Pterocarya fraxinifolia (Lam.) Spach1Juglandaceae232
Chamaecyparis lawsoniana (A. Murray) Parl.1Cupressaceae332Quercus petraea (Matt.) Liebl.1Fagaceae431
Chamaecyparis nootkatensis D.Don 18241Cupressaceae332Quercus robur L.4Fagaceae431
Cornus mas L.4Cornaceae213Ribes alpinum L.2Grossulariaceae102
Corylus avellana L.1Betulaceae433Sequoiadendron giganteum (Lindl.) J.Buchh.2Cupressaceae232
Corylus colurna L.1Betulaceae432Sorbus aria (L.) Crantz1Rosaceae111
Crataegus monogyna Jacq.1Rosaceae112Sorbus aucuparia L.2Rosaceae112
Deutzia scabra Thunb1Hydrangeaceae112Sorbus domestica L.1Rosaceae111
Fagus sylvatica L.3Fagaceae432Sorbus torminalis (L.) Crantz1Rosaceae112
Fraxinus excelsior L.6Oleaceae432Spiraea x arguta Zabel1Rosaceae212
Ginkgo biloba L.3Ginkgoaceae231Styphnolobium japonicum (L.) Schott1Fabaceae222
Gleditsia triacanthos L.1Fabaceae102Taxus baccata L.12Taxaceae303
Hedera helix ‘Arborescens‘ L.2Araliaceae213Tilia cordata Mill.15Malvaceae222
Ilex aquifolium L.1Aquifoliaceae202Tilia platyphyllos Scop.21Malvaceae221
Kolkwitzia amabilis Graebn. Christenh.1Caprifoliaceae112Tilia tomentosa Moench4Malvaceae222
Larix decidua (Mill.)1Pinaceae133Sum231
Table 2. Scale of values for the parameters used for IUGZA (Urban Green Zone Allergenicity Index) and IISA (Index of individual-specific allergenic potential of green spaces).
ParametersValues for IUGZA and IISA
Allergenic potential (ap)0 = non-allergenic (OPALS 1)
1 = low allergenicity (OPALS 2–4)
2 = moderate allergenicity (OPALS 5–7)
3 = high allergenicity (OPALS 8–10)
4 = main local allergens
Type of pollen emissions (pe)0 = only female-sex individuals
1 = entomophilous
2 = ampiphilous
3 = anemophilous
Principal pollination period (ppp)1 = 1–4 weeks
2 = 5–8 weeks
3 ≥ 9 weeks
IUGZAIISA
Crown height (H)Mean height attained at reproductive maturity: 2, 6, 10, 14 m or exceptionally 18 mIndividual-specific measurements [m]
Plant surface (S)Small-diameter: <4 m, medium-diameter: 4–6 m, large-diameter: >6 mIndividual-specific measurements using 4 radii [m]
OPALS: Ogren Plant Allergy Scale [10].
Table 3. Urban Green Zone Allergenicity Index (IUGZA) for the current state of the urban park (0) and for current state and different planting scenarios and their corresponding Shannon index (Hs).
IUGZAHs
Current state (0)0.1733.47
Scenario 10.2262.20
Scenario 20.1473.39
Scenario 30.1704.23
Scenario 40.1972.30
Scenario 50.1501.81
Scenario 60.1713.18

