Article

C:N:P Stoichiometry of Plant, Litter and Soil along an Elevational Gradient in Subtropical Forests of China

1
College of Forestry, Fujian Agriculture and Forestry University, Fuzhou 350002, China
2
Key Laboratory of Ecology and Resources Statistics, Fujian Colleges, Fuzhou 350002, China
3
Cross-Strait Nature Research Center, Fujian Agriculture and Forestry University, Fuzhou 350002, China
4
School of Forest, Fisheries, and Geomatics Sciences, University of Florida, Gainesville, FL 32603, USA
*
Author to whom correspondence should be addressed.
Forests 2022, 13(3), 372; https://doi.org/10.3390/f13030372
Submission received: 8 December 2021 / Revised: 12 February 2022 / Accepted: 22 February 2022 / Published: 23 February 2022
(This article belongs to the Section Forest Soil)

Abstract

:
The internal correlation of plant, litter and soil stoichiometric characteristics and their responses to the environment are helpful for revealing nutrient cycling mechanisms. However, few studies have assessed the nutrient relationship between plant, litter and soil and nutrient stock along elevational gradients, which limit the understanding of nutrient relationships in the ecosystem. To gain insight into the forces of nutrient stock and its stoichiometric ecological characteristics along the elevational gradients in forest ecosystem, we investigated the carbon (C), nitrogen (N) phosphorus (P) contents and stoichiometric ratios of dominant plants, litter and soil layers at different elevations (900–1600 m) in Daiyun Mountain. The results showed the following: (1) C, N and P contents showed an increasing order as plant > litter > soil in each elevation of Daiyun Mountain. Dominant plants were limited by N each elevation. C, N and P contents of plants at high elevation were higher than those at low elevation and significant correlations were found between plant and litter TN, TP and air and soil temperature (negative), which conforms to the Temperature-Plant Physiological Hypothesis (TPPH). (2) Significant correlations were found between plant C:N and litter C:N (positive); between litter C:P and soil N:P (positive); and between litter C:P and soil C:N (negative). (3) Elevation and slope were essential environmental factors to the stoichiometric ratio of plant and litter, and pH was the main factor that correlated negatively to soil stoichiometry ratio. Litter provided a link between plant and soil, and there was a coupling among plant, litter and soil nutrients. The results could provide a theoretical basis for understanding the nutrient cycling for the subtropical forest ecosystem of China.

1. Introduction

Global warming has led to ecological imbalances and a sharp decline in biodiversity, which seriously affected the development of forest ecosystems [1,2]. Carbon (C), nitrogen (N) and phosphorus (P) are critical elements for ecosystem organism construction and play vital roles in ecosystem processes [3]. Ecological stoichiometry, focusing on the interaction of chemical elements in the biogeochemical processes, has been regarded as a scientific and effective approach for exploring the feedbacks and relationships between components in an ecosystem [3]. It was first proposed by Elser et al. [3] in 2000, which has a wide application in ecological studies regarding nutrients and biogeochemical cycles. Among them, chemometrics that organically connects various components in the ecosystem, such as plants, litter and soil, has become an effective method for revealing the balanced relationship between C, N and P, which is of great significance for studying the response of ecosystems under global changes [4,5].
The stoichiometric characteristics of plants, litter and soil are critical indicators of plant nutrient limitation and cycling in response to climate change. They can reflect nutrient cycling and regulation strategies of individual plants and populations and are an essential link between plant metabolism and growth [6,7]. Exploring C, N and P nutrient characteristics of plants, litter and soil in forest ecosystems would help reveal the essential effects of stoichiometry on plant growth, litter decomposition and soil nutrients [8,9,10]: for example, the hypothesized leaf N:P breakpoint (10, 47) between N-limitation (N:P < 14) and P-limitation (N:P > 16) [11]. Net N release started when the average C:N ratio of the leaf litter was less than 40 (a range of 31 to 48), based on global-scale similarities in nitrogen release patterns during long-term decomposition [12]. Additionally, Xu et al. [13] found that soil C:N:P ratio varied from 64:5:1 to 1347:72:1 with an average of 287:17:1 using a global data set of 3422 measurements. For soils in China, Tian et al. [14] reported a ratio of 60:5:1, and Li et al. [15] reported 80:7.9:1 for topsoil (0–20 cm) in subtropical areas. These contribute to our understanding of the dynamics of plant, litter or soil elements under large environmental perturbations, but little is known about the geochemical cycles of nutrient elements in terrestrial ecosystems and the differences in the responses of plant, litter and soil nutrients to the environment [16]. Since global climate change can affect the coupling and cycling of C, N and P among plants, litter and soil [17], it is necessary to analyze the stoichiometric characteristics of C, N and P to reveal nutrient limitation, cycling and feedback of plants.
Elevational gradients provide unique and, sometimes, the best conditions to study terrestrial ecosystems under global climate change, since climate and vegetation can transform dramatically in short distances along an elevational gradient. With a rising elevational gradient, environmental factors, air temperature and humidity will change and, in turn, alter the stoichiometry of plants, litter and soil [18]. Numerous studies have reported the C, N and P nutrient characteristics of vegetation, soil and litter in forest ecosystems along elevation gradients [19,20,21]. The temperature–plant physiological hypothesis (TPPH) [19] states that plant N and P contents would increase as elevation increases and temperature decreases since cold climates may favor high leaf N and P contents to compensate for low physiological efficiency at low temperatures. Plant litter chemicals are altered elevation rises, but they also alter microenvironmental conditions in mountain ecosystems [20]. Soil organic C and total N contents significantly increased with elevation, likely because low temperature limits the cycling of organic matter at high elevations [21]. However, the C, N and P of nutrient components among plants, litter and soil act as a whole with nutrient circulation and energy flow. These studies have independently identified the nutrient characteristics of different components of the ecosystem, but the correlations between components need to be further explored to obtain a comprehensive understanding of the geochemical cycles of nutrient elements in terrestrial ecosystems. Therefore, regarding the ecosystem as a whole to explore the changing pattern of climate at different elevations and their combined effects would promote the understanding of the ecological stoichiometry for forest ecosystems.
The Daiyun Mountain National Nature Reserve is in the transitional zone of the southern subtropics and the middle subtropics, preserving the typical southeastern coastal mountainous forest ecosystem in Fujian Province of China [22,23]. Previous studies focused on the C,N and P of soil nutrients in Daiyun Mountain showed that soil pH and slope position were the driving factors of soil P; C:P; and N:P [24,25]. However, soil nutrients come from the decomposition of litter, which comes from plant shedding, and plant nutrients mainly come from soil. The ecological stoichiometries among plants, litter and soil at different elevations in Daiyun Mountain were examined. Therefore, the aims include the following: (a) compare stoichiometry among plants, litter and soil at different elevations, (b) quantify the correlations among the leaf, litter and soil nutrients and (c) determine the main ecological factors stoichiometric ratio of plants, litter and soil.

2. Materials and Methods
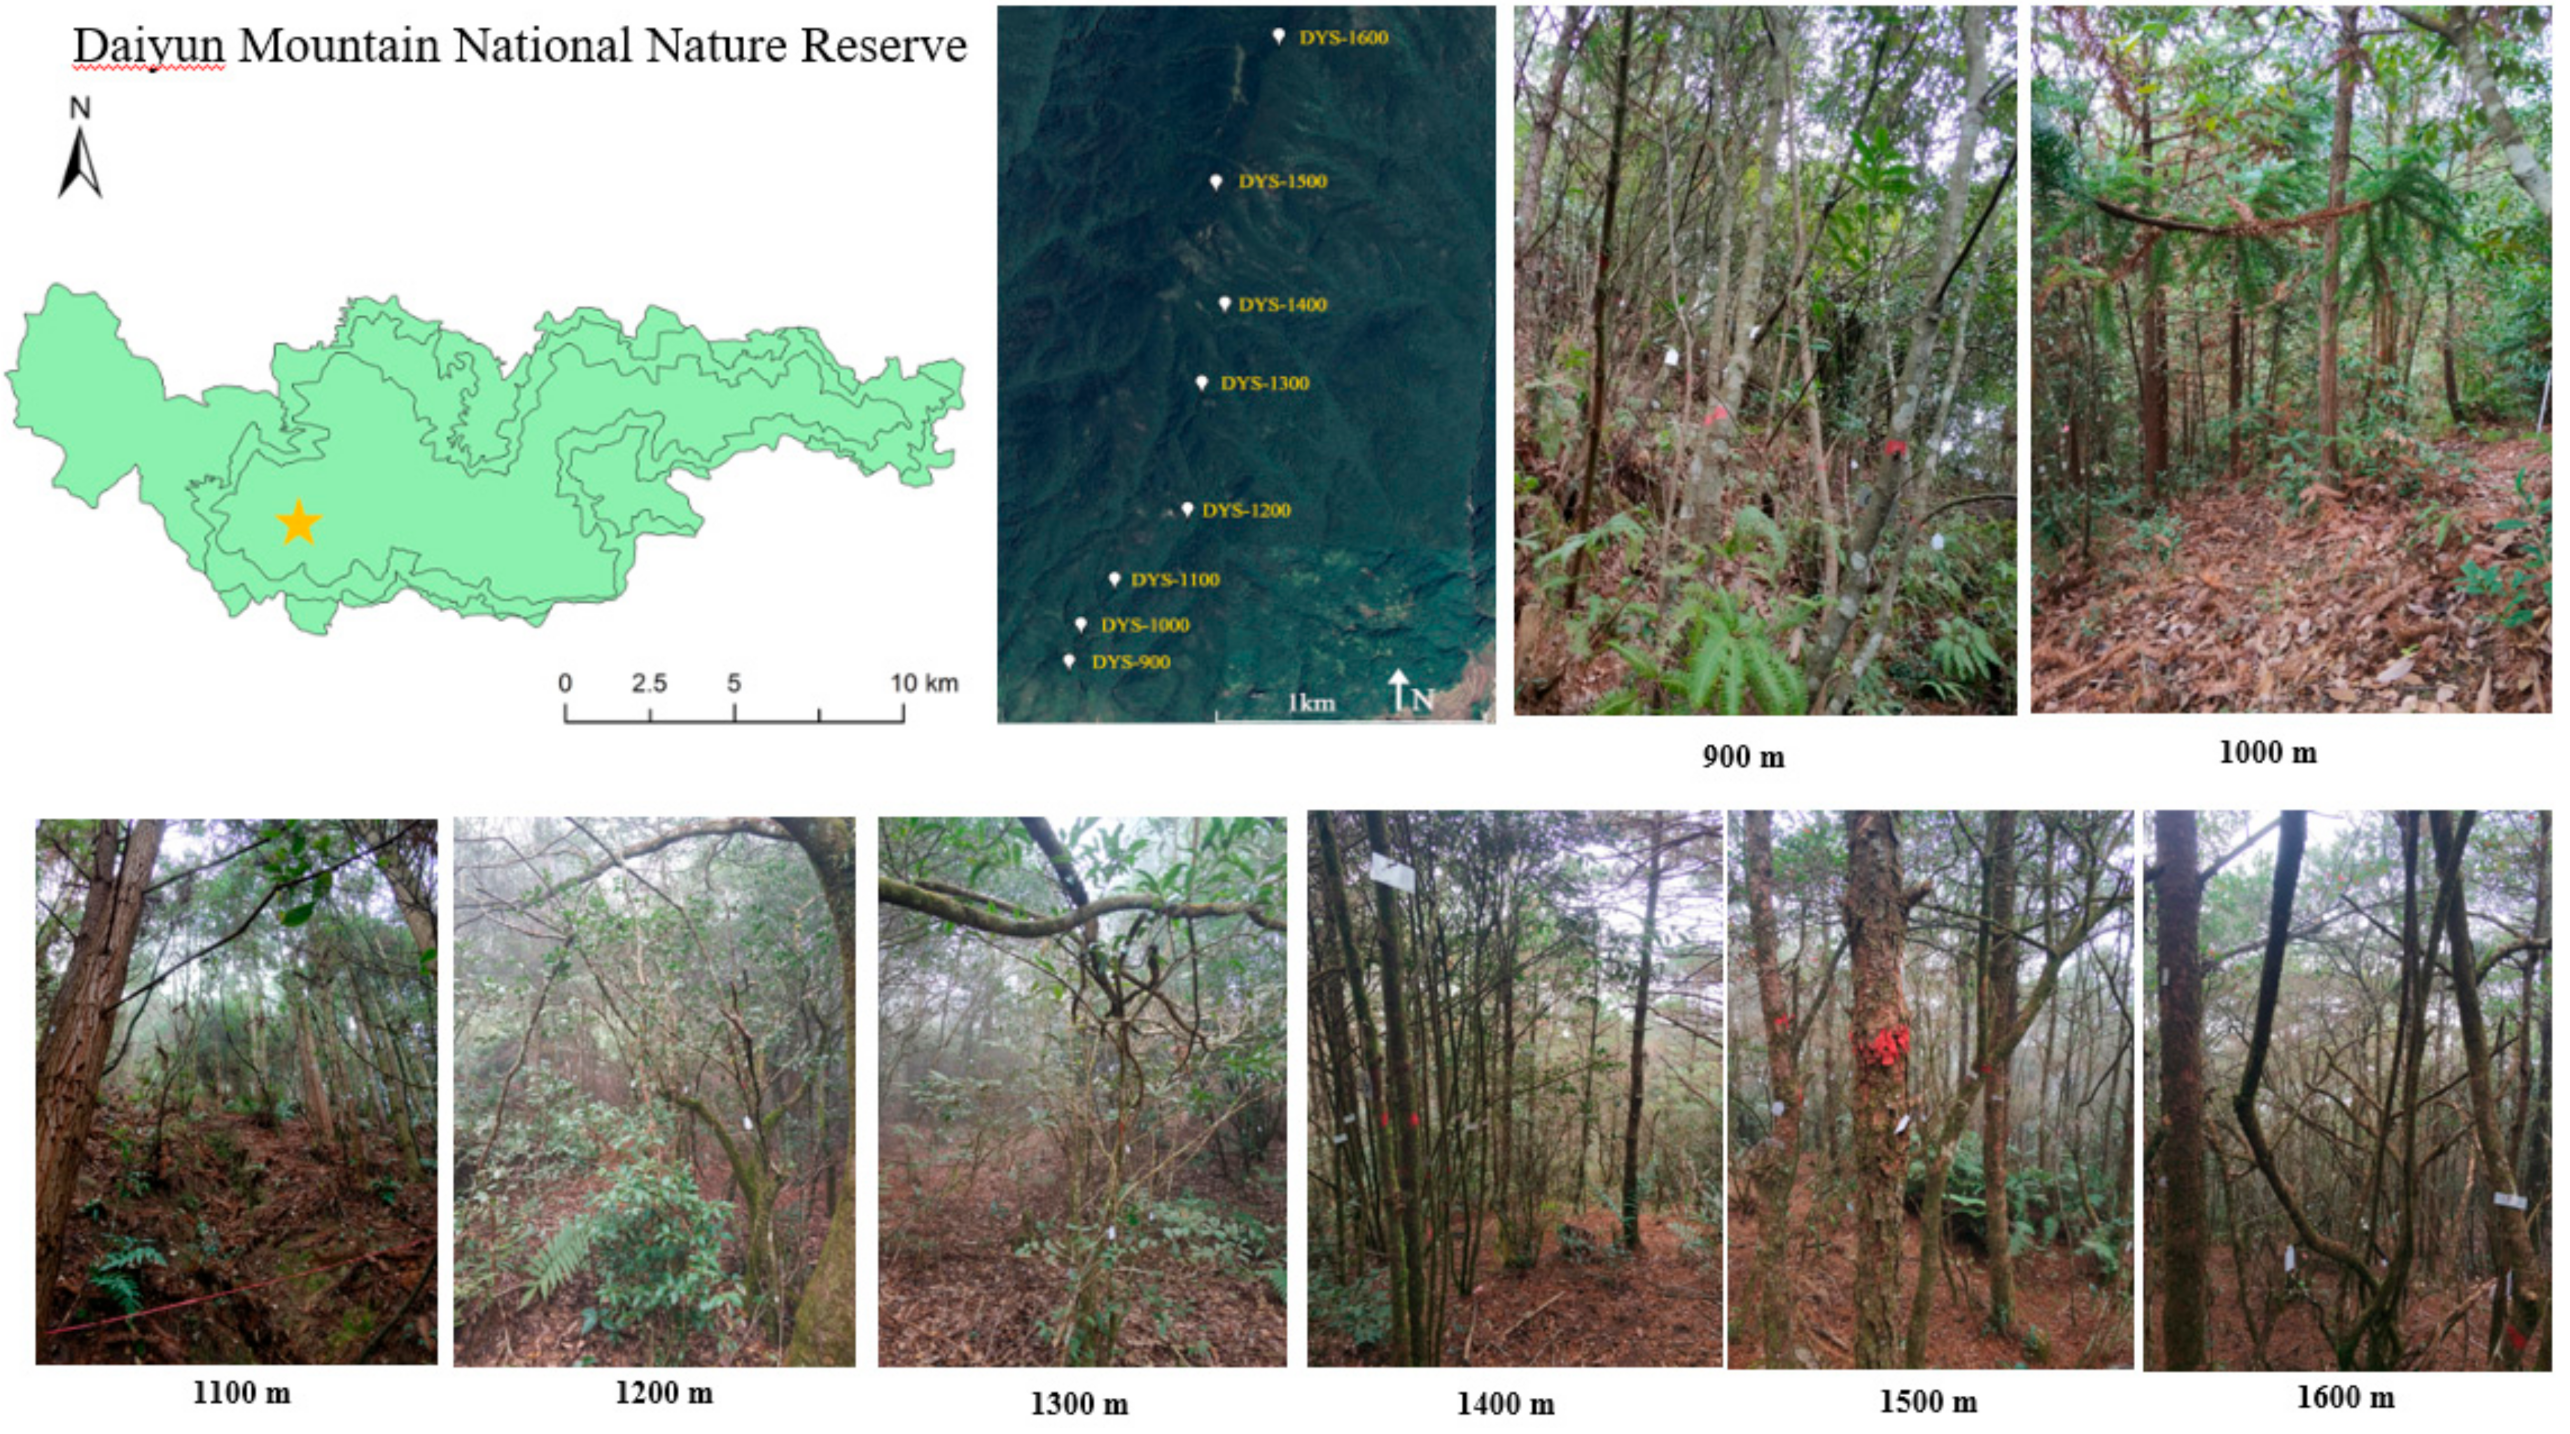
2.1. Study Site

The Daiyun Mountain National Nature Reserve (25°38′~25°43′ N, 118°05′~118°20′ E) is located in Dehua County, Fujian Province, China. The highest peak of the mountain has a maximum elevation of 1856 m. The study site has a southern subtropical and mid-subtropical climate with an average annual temperature of 15.6–19.5 °C. The average annual temperature is 17.8 °C, the average annual precipitation is 1604 mm and the relative humidity is maintained above 80%. The main type of soil in Daiyun Mountain is mountain Ferric acrisols soil. Daiyun Mountain is rich in plant resources that are distributed widely and randomly. Forest vegetation coverage in this area is as high as 90% or more. The typical vegetation types are coniferous and evergreen broad-leaved forest (CEBF) and coniferous forest (CF) [25,26].

2.2. Sample Plot Setting

According to CTFS (Center for Tropical Forest Science) [27] and BEST (Biodiversity along Elevational Gradients: Shifts and Transitions), sample plot construction standards were used. At an elevation of 900–1600 m on the southern slope of Daiyun Mountain, we divided the elevation range into eight gradients with intervals of 100 m. Eight permanent sample plots were established at each elevation point, away from areas already struck by natural disturbances or obvious clues of artificial interference. Furthermore, communities in those selected plots were expected to be representative. A 20 m × 30 m plot was set in each elevation gradient, and each plot was divided into three 10 m × 20 m quadrats (Figure 1). Environmental factors such as forest type, latitude and longitude, elevation, slope, aspect and slope position of each standard plot were recorded in reference of [25].

2.3. Data Collection

Information species, diameter at breast height and tree height were measured. The standardization of species identification was referred to Flora of China (http://frps.iplant.cn/) (accessed on 22 September 2017). According to the survey results, for each 10 m × 20 m plot, samples were taken from the top of two dominant tree species for each 3 trees in each plot. To standardize sample collection, sun-exposed mature and fully expanded leaves were collected from six individuals in each quadrat. Leaves were collected at mid-height using a pole pruner from the east, west, south and north directions. Freshly fallen leaf litter was selected from the leaves with obvious senescence characteristics (such as yellowing and reddening) but not yet decomposed, and the freshly fallen litter was obtained by gently shaking the trunk as the litter sample. For soil sampling, the leaf litter was removed at the litter sampling point layer (including undecomposed and semi-decomposed), and after removing the litter layer at 0–20 cm, they were obtained separately from each point by a soil cutting ring and were fully homogenized to form one composite soil sample for each soil layer in each plot in each elevation. The subsamples of plant leaves, litter and soil were transported to the laboratory and oven-dried at 70 °C to a constant weight for further analysis.
Air and soil temperature monitoring adopts the American MAXIM iButton (Maxim Integrated, iButton, San Jose, CA, USA) DS1923-F5 (air temperature) and DS1922-F50 (soil temperature) recorder. In the center of each elevation sample plot, place the air temperature recorder at a distance of 1.5 m from the vertical height of the soil surface. Soil temperature recorder was buried 10 cm below the ground. Starting from 12 am every day, air and soil temperatures were automatically recorded every 2 h, and the average value recorded in 1 year was used as air and soil temperature data at each elevation. C, N and P of plants, litter and soil all represent total carbon (TC), total nitrogen (TN) and total phosphorus (TP) in this paper. The TC and TN of plant and litter were measured by a carbon and nitrogen analyzer (VARIO MAX CN Elemental Analyzer, Elementar Analysensysteme GmbH, Langensel-bold, Germany); TP of plant and litter were measured by an inductively coupled plasma emission spectrometer (PE OPTIMA 8000, PerkinElmer, Waltham, MA, USA) and the data of soil TC, TN and TP were determined in reference of [25]. The details of all of these method refer to forest soil analysis methods [28].

2.4. Data Analysis

The effects of the contents of the same element (C, N and P) and the same component (plant, litter and soil) at different elevations and the difference between the same elements in different components at the same elevation were tested using one-way ANOVA and least significant difference (LSD) multiple comparisons (p < 0.05). Pearson’s correlation was used to determine the relationship of C, N and P stoichiometry among plant, litter and soil and relationship between C, N and P stoichiometry and air temperature and soil temperature. All statistical analyses were performed using R version 4.1.0 [29].
The structural equation model is a statistical method for analyzing the relationship between variables based on the correlation coefficient or covariance matrix. The general expression of the structural equation model is as follows [30]:
η = βη + Γξ + ς
x = Λxξ + δ
y = Λyη + ε
Formula (1) is the model of the structural equation model. Among them, η is an endogenous latent variable, ξ is an exogenous latent variable and established environmental factors (ξ1), plant (ξ2), litter (ξ3) and soil (ξ4) were used as potential exogenous latent variables. ς is a random interference term, reflecting the unexplained part of η. β is a η coefficient matrix, describing the mutual influence between η. Γ is a ξ coefficient matrix, describing the influence of ξ on η.
Formulas (2) and (3) are the measurement models in the structural equation model, where x is the observed variable of ξ, δ is the measurement error of x and Λx is the factor loading matrix of the observed variable x in the exogenous latent variable ξ; y is the measurement variable of η, ε is the measurement error of y and ΛY is the factor loading matrix of the endogenous latent variable η of the observed variable y. Then, established air temperature (x1), soil water content (x2), slope (x3), pH (x4) and elevation (x5) are observation variables related to environmental factors. Plant C:N (x6), Plant N:P (x7) and Plant C:P (x8) are observed variables related to a plant. Litter C:N (x9), Litter N:P (x10) and Litter C:P (x11) are used as observed variables related to litter. Soil C:N (x12), soil N:P (x13) and soil C:P (x14) are used as observed variables related to soil.
Plants absorb nutrients from the soil, assimilate C through photosynthesis, store N, P and other nutrients and gradually return them to the soil in the form of litter decomposition. The nutrients in the “plant–litter–soil” continuum are rationally distributed and circulated to ensure the normal growth of plants. The heterogeneity of the internal environment of the forest ecosystem causes changes in three physical and chemical properties, thereby affecting its stoichiometric ecological characteristics [6]. Based on this, the following assumptions were made on latent variables and observed variables: Hypothesis 1: latent variables environmental related effects on the coupling state of latent variables plant, litter and soil; Hypothesis 2: plants have related effects on litter, litter on soil and soil on plant coupling; Hypothesis 3: observed variable environmental factors have related effects on plant, litter and soil stoichiometry.
We used the lavaan package in R [30,31] to build the structural equation model. After constructing the initial model, the data were fitted, and parameters were also fitted. Commonly used absolute fit indexes include SRMR (Standardized Root Mean Square Residual), GFI (Goodness of Fit Index), etc. The value of SRMR and CFI ranges from 0 to 1, and the larger the value, the better the model is, which is more than 0.9 acceptable [31]. The fitting index standard of this study shown in Table A1.

3. Results

3.1. Characteristics of C, N and P Contents and Ecological Stoichiometric Ratio of Plants and Litter at Different Elevations

According to our previous studies [25] on C, N and P of soil in the Daiyun Mountain and C, N and P contents and ecological stoichiometric ratios of plants and litter (Table 1), it showed that plants contain the highest C, N and P contents across all elevations, followed by litter and soil. The average C contents of plants and litter was 475.17 g/kg and 457.48 g/kg, respectively. Except for the C contents of plants and litter at the elevation of 1000 m, there was no significant difference. There were significant differences among plants and litter at other elevations (p < 0.01). The average N contents of plants and litter were 14.58 g/kg and 11.22 g/kg, respectively. There were significant differences between plants and litter at other elevations (p < 0.01). The average P contents of plants and litter was 1.33 g/kg and 0.50 g/kg, respectively. There were significant differences in plants and litter at other elevations (p < 0.01). In general, the average contents of C, N and P in plants and litter were higher at a high elevation between 1400 and 1600 m than at low and middle elevations between 900 and 1300 m. In terms of correlations between air temperature, soil temperature and leaf, litter and soil N and P concentrations and ratios (Table A2), significant correlations were found between plant and litter TN, TP and air and soil temperature (p < 0.01) (negative). Significant correlations were found between plant C:N, C:P and air and soil temperature (p < 0.01) (positive); significant correlations were found between litter C:N and air and soil temperature (p < 0.01) (positive).
The average C:N values of plants and litter at different elevations were 33.36 ± 2.14 and 42.22 ± 1.60 respectively. The average C:P values of plants and litter at different elevations were 365.60 ± 24.93 and 942.65 ± 85.66, respectively. There were significant differences in C:P between plants and litter at the same elevation (p < 0.01). The average N:P values of plants, litter and soil at different elevations were 11.07 ± 0.66 and 22.84 ± 2.23, respectively. There were significant differences in the N:P of plants and litter between 1100 and 1200 m (p < 0.01).

3.2. C:N, C:P and N:P Correlations of Plant, Litter and Soil in Daiyun Mountain

Significant correlations were found between plant C:N and litter C:N (p < 0.01) (positive) (Figure 2). No significant correlations were found between plant and soil ratios of C, N and P. Significant correlations were found between litter C:P and soil N:P (p < 0.01) (positive). Significant correlations were found between litter C:P and soil C:N (p < 0.05) (negative). Significant correlations were found between litter N:P and soil C:N (p < 0.01) (negative).

3.3. Structural Equation Model Analysis of Plant, Litter and Main Environmental Factors

The latent variable environment had a positive impact on plants and litter and a negative impact on the soil. Significant impact correlations were found among latent variables of plants, litter and soil. (Figure 3A). The latent variable environment had a positive impact on air temperature, slope and pH and had a negative impact on elevation and soil water contained (Figure 3B). The latent variables of plant soil litter had a negative impact on their stoichiometry (Figure 3C–E). Elevation was an important environmental factor that correlated negatively to the stoichiometric ratio of plant and litter; air temperature had an indirect negative effect on the stoichiometric ratio of plant; slope had an indirect positive effect on the stoichiometric ratio of plant and litter; and pH was the main environmental factor that correlated negatively to soil stoichiometry ratio (Table 2).

4. Discussion

4.1. Stoichiometric Characteristics of Forest Ecosystem in Daiyun Mountain

C, N and P contents can reflect the nutrient utilization efficiency of plants, nutrient release of litter and nutrient supply status of soil [32]. The contents of C, N and P in plants and litter were higher at a high elevation between 1400 and 1600 m than at low and middle elevations between 900 and 1300 m (Table 1). When combined, there was a negative significant correlation between plant and litter TN and air, soil temperature (p < 0.01; Table A2) and a negative significant correlation between plant and litter TP and air temperature (p < 0.01; Table A2), which is consistent with TPPH. TPPH suggests that N and P contents should increase with decreasing temperature [19], which can explain the higher leaf nutrient contents observed in Daiyun Mountain compared with low-elevation regions. Previous studies show that the nutrient contents of plants and litter at high elevation are relatively high [33,34]. On the one hand, plants mainly obtain nutrients by absorbing them from soil. Jiang et al. [25] studied soil nutrients at different elevation gradients in Daiyun Mountain and showed that soil nutrients increase with elevation. In addition, air temperature decreases with an increase in elevation, which results in the efficiency of nutrient utilization extending the retention time of nutrients by shedding litter in response to environmental changes [19].
Compared with the contents of C (374.1–646.5 g/kg), N (8.4–30.5 g/kg) and P (0.6–6.2 g/kg) of dominant plants in the north–south transect of forest ecosystems in Eastern China [35], the average contents of C (475.17 g/kg), N (14.58 g/kg) and P (1.33 g/kg) in plants at different elevations of Daiyun Mountain were all within the range, but the average contents of P were lower (Table 1). The result is similar to Wang et al. [36] on the stoichiometric ratios of C, N and P for dominant plants in subtropical evergreen broad-leaved forests (the contents of C, N and P at 472.8, 19.8 and 1.54 g/kg, respectively), indicating that subtropical plants have higher C contents but the P content is relatively low.
C, N and P cycles within the ecosystem are converted between plants, litter and soil, which is important to maintain nutrients in the forest ecosystem [37]. According to our previous studies [25] on C, N and P of soil in the Daiyun Mountain.and the statistical analyses of C, N and P contents and ecological stoichiometric ratios of plants and litter at different elevations (900–1600 m) in Daiyun Mountain (Table 1), the C, N, and P contents of plants, litter and soil at different elevations (900–1600 m) in Daiyun Mountain were all shown as plant > litter > soil (Table 1), which is consistent with subtropical understory plants, litter and soil stoichiometric characteristics [38,39,40]. The main reason is that plants absorb nutrients needed for their growth from the soil and continuously synthesize organic compounds through leaf photosynthesis. At the end of the plant life cycle, leaves fall as litter, which are leached by the rain, damaged by soil animals and decomposed by microorganisms. A small part of organic matter is lost, but most of it is released into the soil.
Litter C:N and C:P are usually used to reflect the utilization efficiency of plant N and P and the growth rate of the plant. The growth rate hypothesis proposes that C:N and C:P are often inversely proportional to plant growth rate, reflecting vegetation productivity to a certain extent [36]. The average values of C:N and C:P of plants at eight elevations in Daiyun Mountain were 33.36 ± 2.14 and 365.60 ± 24.93 (Table 1), which are higher than the global average of 22.5 and 232 [41], indicating that the plants in Daiyun Mountain have a low utilization rate of N and P on a global scale. Plant N:P is often used to reflect plant growth-limited nutrients [42,43]. Previous studies have also shown that the ratio of plant N to plant P in plant biomass can be an indicator of vegetation composition, functioning and nutrient limitation at the community level [44,45]. An N:P < 14 generally indicates N limitation, while a ratio > 16 suggests P limitation [11,45]. Plant N:P < 14 of each elevation in Daiyun Mountain, indicating that the growth of dominant plants in Daiyun Mountain is limited by N. This finding corresponds with Liu et al. [26] on the relationship between Pinus taiwanensis seedling regeneration and the spatial heterogeneity of soil nitrogen in the Daiyun Mountain’s coniferous forest, which showed that the higher N contents can result in a higher survival rate of P. taiwanensis seedlings.
Litter C:N and C:P can also reflect the supply of N and P in the soil [14,46]. Studies have shown that there a critical value for nutrient release in the litter. When C:N is lower than 40 and C:P is lower than 600, the content of N or P in litter is effectively released [12]. In this study, the average value of litter C:N at eight elevations was 42.22 ± 1.60 (Table 1), which is higher than the critical value of C:N release; the average value of C:P was 942.65 ± 85.66, which is higher than the critical value of C:P. The results showed that the contents of N and P of the litter in Daiyun Mountain were not effectively released, and according to 942.65/ 600 and 42.22/ 40, we can know that the release rate of P was lower than that of N. Based on Jiang et al. [25], the ecological stoichiometry of soil at different elevations (900–1600 m) in Daiyun Mountain and the mineralization and humification of soil organic matter at different elevations were obvious, and P content was relatively lacking, which further proved the scientific rationality of inferred P deficiency in soil from the stoichiometry of litters in this study. In addition, the joint limitation of N and P in plant growth is probably caused by the ineffective release of N from litter and the lack of P in soil. Further comparison found that litter C:N and C:P values in Daiyun Mountain were much higher than those in other temperate and tropical terrestrial regions [47]. The results correspond with many studies on litter stoichiometric characteristics in subtropical regions [15,36,41], indicating that the litter stoichiometry C:N and C:P values of subtropical ecosystems are generally high and would be very different from temperate and tropical ecosystems.

4.2. Stoichiometric Relationship of Forest Ecosystems in Daiyun Mountain

The C, N and P stoichiometries of plants and litter are closely related to soil, which is the internal regulation mechanism of nutrient cycling in the ecosystem [48]. In this study, significant correlations were found between plant C:N and litter C:N (p < 0.01) (positive) (Figure 2), but they were not significantly correlated with soil C:N. The reason is that soil C and N mainly come from litter, which is directly derived from plants. The degree of decomposition is not high, resulting in a significant correlation between plants and litter. Significant correlations were found between litter C:P and soil N:P (p < 0.01) (positive) (Figure 2), which is consistent with the results of Chen et al. [49] indicating that there is a certain connection between litter and soil P, and most nutrients in the litter are returned to soil, producing the result that plant and soil stoichiometric ratios are not significantly correlated. Plant and litter nutrients as well as litter and soil stoichiometric ratio were significantly correlated, indicating that the litter is a link between, which corresponds with Zhang et al. [50]. The coupling of leaf, litter and soil nutrients in temperate forests of Shaanxi Province, China, indicate that the litter provided a link between plants and soil and demonstrated nutrient associations among plants, litter and soil.

4.3. Environmental Factors Affecting the Stoichiometric Ratio of Daiyun Mountain Forest Ecosystem

SRMR, GFI and CFI values indicated that the structural equation model fits well (Table A1). The latent variable environmental factors positively correlated with latent variable plant and litter and positively correlated with latent variable soil (Figure 3). Among the observed variables, elevation was an essential environmental factor that correlated negatively to the stoichiometric ratio of plant and litter, and air temperature had an indirect positive effect on the stoichiometric ratio of plants (Table 2). This result corresponds with Bo et al. [51], who observed that plant growth requires more nutrients (mainly N and P) to adapt to changes in the surrounding environment under cold climates, resulting in a smaller increase in C than N and P contents and a smaller increase in N than P contents. Soil pH was the main environmental factor that correlated negatively to the soil stoichiometry ratio (Table 2), which has been proved by previous studies on microbial composition affected by pH in an arable soil [52,53,54]. The effect of soil pH on soil C, N and P is often related to soil microbes. Soil pH can adjust the number and types of soil microbes to a certain extent, which in turn affects changes in soil C, N and P nutrient elements through microbial action. Generally, the contents of soil C, N and P are higher because the abundance of fungi is higher in acidic soils. Slope has an indirect positive effect on the stoichiometric ratio of plant and litter (Table 2), which has been proved by previous studies [55,56,57] that showed that the slope affects C:N:P stoichiometry. As an important topographical factor, slope can affect plant growth and leaf litter stoichiometry by adjusting local water and energy balances [56].
There was a significant correlation in the minor cycle (plant–litter–soil–plant) among the latent variables, plant, litters and soil, which also indirectly affected the stoichiometric ratio (Figure 3). This finding has been proved by previous studies [50,58] that demonstrated coupling among leaf, litter and soil nutrients. Changes in soil nutrient content directly affect plant nutrient absorption and its stoichiometric ratio. Plants change the stoichiometric ratio through litter and use appropriate nutrient utilization strategies to adapt to the changes of soil nutrient supplies. Litter decomposition can achieve and maintain a balance between soil nutrients and the element ratio required for plant growth, reflecting the coordination of the nutrient cycling process of the ecosystem [48].

5. Conclusions

We have studied the stoichiometric characteristics of plants, litter and soil and explored C, N and P nutrition relationships in the southern subtropical mountains of China. We found that elevation and slope were essential environmental factors to the stoichiometric ratio of plants and litter, and pH was the main environmental factor that correlated negatively to soil stoichiometry ratio. The contents of C, N and P, in plants and litter at high elevation were higher than those at a low elevation and there was a negative significant correlation between plant and litter TN, TP and air and soil temperature, which confirmed the hypothesis of TPPH. C, N and P contents all showed an increasing order: plants > litter > soil of each elevation. Litter provided a link between plant and soil, and there was an obvious coupling relationship between the nutrients of plant, litter and soil. This research can provide a certain theoretical basis for the circulation and nutrient flow of plants, litter and soil in the southern subtropical forest ecosystem, but it has not yet explored the specific coupling between plants, litter and soil. Hence, in order to better understand the impact of climate warming on subtropical forest ecosystems of China, further research on the coupling mechanism should be carried out.

Author Contributions

Conceptualization, B.C., L.C. and Z.H.; methodology, B.C., L.C., D.X. and Z.H.; software, B.C.; formal analysis, L.J. and J.C.; investigation, B.C., L.J., J.Z., J.C., Q.H., D.X. and Z.H.; data curation, L.J. and Z.H.; writing—original draft preparation, B.C.; writing—review and editing, B.C., L.C. and Z.H.; visualization, B.C., L.J., J.Z., Q.H. and J.C.; supervision, J.L. and Z.H.; funding acquisition, J.L. and Z.H. All authors have read and agreed to the published version of the manuscript.

Funding

This research was funded by the National Natural Science Foundation of China (NSFC), grant number 31700550 and 31770678; Science and Technology Promotion of Project Forestry Bureau of Fujian Province, grant number 2018TG14-2; Nature Science Fund of Fujian Province Science and Technology of China, grant number 2019J01367; and Daiyun Mountain Nature Reserve Administration Project, grant number KH1401450.

Institutional Review Board Statement

Not applicable.

Informed Consent Statement

Not applicable.

Data Availability Statement

Not applicable.

Acknowledgments

We wish to express our thanks for the support received from the Daiyun Mountain Nature Reserve in Dehua City, Fujian Province, to allow us to collect samples. The authors would like to thank Cong Xing, Xinguang Gu, Yangdi Li and Wenwei Chen for field work. This work is part of the BEST (Biodiversity along Elevational gradients: Shifts and Transitions) research network (https://best-mountains.org) (accessed on 20 September 2021). We thank all BEST research network researchers for their great assistance with data analysis, review and editing of the manuscript. The authors also record sincere appreciation for helpful and constructive comments made by reviewers of the draft manuscript.

Conflicts of Interest

The authors declare no conflict of interest.

Appendix A

Table A1. Fitting index standard.
IndexEvaluation StandardFinal Model Fitting Results
p-value (Chi-square)>0.050.118
GFI>0.900.950
CFI>0.900.933
IFI>0.900.974
SRMR<0.080.075
GFI: Goodness of Fit Index; CFI: Comparative Fit Index; SRMR: Standardized Root Mean Square Residual; IFI: incremental fit index.
Table A2. Correlations between air, soil temperature and leaf, litter and soil N and P concentrations and ratios.
ComponentElementATST
PlantTC−0.098−0.212
TN−0.492 *−0.531 **
TP−0.437 *−0.489 *
C:N0.431 *0.433 *
C:P0.427 *0.459 *
N:P−0.115−0.074
LitterTC−0.212−0.286
TN−0.657 **−0.782 **
TP−0.454 *−0.511 *
C:N0.559 **0.663 **
C:P0.3240.351
N:P−0.230−0.303
SoilTC0.0060.105
TN−0.329−0.342
TP0.556 **0.620 **
C:N0.1640.259
C:P−0.310−0.287
N:P−0.424 *−0.468 *
Note: AT: Air temperature; ST: Soil temperature. * as p < 0.05, ** as p < 0.01.

References

  1. Fang, J.Y.; Chen, A.P.; Peng, C.G.; Zhao, S.Q.; Ci, L.J. Changes in forest biomass carbon storage in China between 1949 and 1998. Science 2001, 292, 2320–2322. [Google Scholar] [CrossRef] [PubMed]
  2. Yu, G.R.; Song, X.; Wang, Q.F.; Liu, Y.F.; Guan, D.X.; Yan, J.H.; Sun, X.M.; Zhang, L.M.; Wen, X.F. Water use efficiency of forest ecosystems in eastern China and its relations to climatic variables. New Phytol. 2008, 177, 927–937. [Google Scholar] [CrossRef]
  3. Elser, J.J.; Stemer, R.W.; Gorokhova, E.; Sterner, R.W.; Gorokhova, E.; Fagan, W.F.; Markow, T.A.; Cotner, J.B.; Harrison, J.F.; Hobbie, S.E.; et al. Biological stoichiometry from genes to ecosystems. Ecol. Lett. 2000, 3, 540–550. [Google Scholar] [CrossRef] [Green Version]
  4. Grace, J.; Rayment, M. Respiration in the balance. Nature 2000, 404, 819–820. [Google Scholar] [CrossRef] [PubMed]
  5. Hobbie, S.E.; Nadelhoffer, K.J.; Hgberg, P. A synthesis: The role of nutrients as constraints on carbon balances in boreal and arctic regions. Plant Soil 2002, 242, 163–170. [Google Scholar] [CrossRef]
  6. Baxter, I.; Dilkes, B.P. Elemental profiles reflect plant adaptations to the environment. Science 2012, 336, 1661–1663. [Google Scholar] [CrossRef] [Green Version]
  7. Elser, J. Growth rate-stoichiometry couplings in diverse biota. Ecol. Lett. 2010, 6, 936–943. [Google Scholar] [CrossRef] [Green Version]
  8. Wu, J.; Shen, F.; Thompson, J.; Liu, W.; Bardgett, R.D. Stoichiometric traits (N:P) of understory plants contribute to reductions in plant diversity following long-term nitrogen addition in subtropical forest. Ecol. Evol. 2021, 11, 4243–4251. [Google Scholar] [CrossRef]
  9. Liu, R.; Wang, D. C:N:P stoichiometric characteristics and seasonal dynamics of leaf-root-litter-soil in plantations on the loess plateau. Ecol. Indic. 2021, 127, 107772. [Google Scholar] [CrossRef]
  10. Zhu, Q.; Liao, K.; Lai, X.M.; Lv, L.G. Scale-dependent effects of environmental factors on soil organic carbon, soil nutrients and stoichiometry under two contrasting land use types. Soil Use Manag. 2021, 37, 243–256. [Google Scholar] [CrossRef]
  11. Han, W.X.; Fang, J.Y.; Guo, D.L.; Zhang, Y. Leaf nitrogen and phosphorus stoichiometry across 753 terrestrial plant species in China. New Phytol. 2005, 168, 377–385. [Google Scholar] [CrossRef]
  12. Parton, W.; Silver, W.L.; Burke, I.C.; Grassens, L.; Harmon, M.E.; Currie, W.; King, J.Y.; Adair, E.C.; Brandt, L.; Hart, S.C. Global-scale similarities in nitrogen release patterns during long-term decomposition. Science 2007, 315, 361–364. [Google Scholar] [CrossRef] [PubMed]
  13. Xu, X.; Thornton, P.E.; Post, W.M. A global analysis of soil microbial biomass carbon, nitrogen and phosphorus in terrestrial ecosystems. Glob. Ecol. Biogeogr. 2013, 22, 737–749. [Google Scholar] [CrossRef]
  14. Tian, H.; Chen, G.; Zhang, C.; Melillo, J.M.; Hall, C.A.S. Pattern and variation of C:N:P ratios in China’ s soils: A synthesis of observational data. Biogeochemistry 2010, 98, 139–151. [Google Scholar] [CrossRef]
  15. Li, Y.; Wu, J.; Liu, S.; Shen, J.; Huang, D.; Su, Y.; Wei, W.; Syers, J.K. Is the C:N:P stoichiometry in soil and soil microbial biomass related to the landscape and land use in southern subtropical China? Glob. Biogeochem. Cycles 2012, 26, 4002. [Google Scholar] [CrossRef]
  16. Pang, Y.; Tian, J.; Zhao, X.; Chao, Z. The linkages of plant, litter and soil C:N:P stoichiometry and nutrient stock in different secondary mixed forest types in the Qinling Mountains, China. PeerJ 2020, 8, e9274. [Google Scholar] [CrossRef] [PubMed]
  17. Sardans, J.; Rivas-Ubach, A.; Peñuelas, J. The C:N:P stoichiometry of organisms and ecosystems in a changing world: A review and perspectives. Perspect. Plant Ecol. Evol. Syst. 2012, 14, 33–47. [Google Scholar] [CrossRef]
  18. Zhang, M.; Zhang, X.; Liang, W.; Dai, G.; Wang, X.; Han, S. Distribution of soil organic carbon fractions along the altitudinal gradient in Changbai Mountain, China. Pedosphere 2011, 21, 615–620. [Google Scholar] [CrossRef]
  19. Reich, P.B.; Oleksyn, J. Global patterns of plant leaf N and P in relation to temperature and latitude. Proc. Natl. Acad. Sci. USA 2004, 101, 11001–11006. [Google Scholar] [CrossRef] [Green Version]
  20. Wang, L.F.; Chen, Y.M.; Zhou, Y.; Zheng, H.F.; Xu, Z.F.; Tan, B.; You, C.M.; Zhang, L.; Li, H.; Guo, L.; et al. Litter chemical traits strongly drove the carbon fractions loss during decomposition across an alpine treeline ecotone. Sci. Total Environ. 2021, 753, 142287. [Google Scholar] [CrossRef]
  21. He, X.J.; Hou, E.Q.; Liu, Y.; Wen, D.Z. Altitudinal patterns and controls of plant and soil nutrient concentrations and stoichiometry in subtropical China. Sci. Rep. 2016, 6, 24261. [Google Scholar] [CrossRef] [PubMed] [Green Version]
  22. Jiang, L.; He, Z.S.; Gu, X.G.; Liu, J.F.; Liu, Y.H. Classification and ordination of the Pinus taiwanensis forest on Daiyun Mountain, Fujian Province, China. Taiwania 2020, 65, 119–128. [Google Scholar]
  23. Su, S.J.; Liu, J.F.; He, Z.S.; Zheng, S.Q.; Hong, W.; Xu, D.W. Ecological species groups and interspecific association of dominant tree species in Daiyun Mountain National Nature Reserve. J. Mt. Sci. 2015, 12, 637–646. [Google Scholar] [CrossRef]
  24. Xu, D.W.; Liu, J.F.; Marshall, P.; He, Z.S.; Zheng, S.Q. Leaf litter decomposition dynamics in unmanaged Phyllostachys pubescens stands at high elevations in the Daiyun Mountain National Nature Reserve. J. Mt. Sci. 2017, 14, 2246–2256. [Google Scholar] [CrossRef]
  25. Jiang, L.; He, Z.S.; Liu, J.F.; Xing, C.; Gu, X.G.; Wei, C.S.; Zhu, J.; Wang, X.L. Elevation Gradient Altered Soil C, N, and P Stoichiometry of Pinus taiwanensis Forest on Daiyun Mountain. Forests 2019, 10, 1089. [Google Scholar] [CrossRef] [Green Version]
  26. Liu, J.F.; Su, S.J.; He, Z.S.; Jiang, L.; Hong, W. Relationship between Pinus taiwanensis seedling regeneration and the spatial heterogeneity of soil nitrogen in Daiyun Mountain, southeast China. Ecol. Indic. 2020, 115, 106398. [Google Scholar] [CrossRef]
  27. Condit, R. Tropical Forest Census Plots; Springer: Berlin/Heidelberg, Germany, 1998. [Google Scholar]
  28. People’ s Republic of China Forestry. Industry Standard. Forest Soil Analysis Method; The State Forestry Administration of the People’ s Republic of China: Beijing, China, 1999; pp. 71–113. (In Chinese)
  29. R Core team. R: A Language and Environment for Statistical Computing; R Foundation for Statistical Computing: Vienna, Austria, 2015; Volume 11, p. 7. [Google Scholar]
  30. Shipley, B. A New inferential test for path models based on directed acyclic graphs. Struct. Equ. Modeling A Multidiscip. J. 2000, 7, 206–218. [Google Scholar] [CrossRef]
  31. Rosseel, Y. lavaan: An R package for structural equation modeling. J. Stat. Softw. 2012, 48, 1–36. [Google Scholar] [CrossRef] [Green Version]
  32. Redfield, A.C. The biological control of chemical factors in the environment. Am. Sci. 1958, 46, 205–221. [Google Scholar]
  33. Feng, L.; Hu, J.; Xie, Y.; Cong, H.; Chen, X.; Deng, Z. Foliar stoichiometry of carbon, nitrogen, and phosphorus in wetland sedge Carex brevicuspis along a small-scale elevation gradient. Ecol. Indic. 2017, 92, 322–329. [Google Scholar]
  34. Schinner, F. Soil microbial activities and litter decomposition related to altitude. Plant Soil 1982, 65, 87–94. [Google Scholar] [CrossRef]
  35. Ren, S.J.; Yu, G.R.; Jiang, C.M.; Fang, H.J.; Sun, X.M. Stoichiometric characteristics of leaf carbon, nitrogen, and phosphorus of 102 dominant species in forest ecosystems along the North-South Transect of East China. Chin. J. Appl. Ecol. 2012, 23, 581–586. (In Chinese) [Google Scholar]
  36. Wang, J.Y.; Wang, S.Q.; Li, R.L.; Yan, J.H.; Sha, L.Q.; Han, S.J. C:N:P stoichiometric characteristics of four forest types’ dominant tree species in China. Chin. J. Plant Ecol. 2011, 35, 587–595. (In Chinese) [Google Scholar]
  37. Hu, Q.; Sheng, M.; Bai, Y.; Xiao, H. Response of C, N, and P stoichiometry characteristics of Broussonetia papyrifera to altitude gradients and soil nutrients in the karst rocky ecosystem, SW China. Plant Soil 2020, 14, 1–14. [Google Scholar] [CrossRef]
  38. Xiang, X.Y.; Chen, S.K.; Pan, P.; Ouyang, X.Z.; Ning, J.K.; Li, Q. Stoichiometric traits of C, N and P of leaf-litter-soil system of Pinus massoniana forest. J. For. Environ. 2019, 39, 11–17. (In Chinese) [Google Scholar]
  39. Wang, P.A.; Gong, Y.Q.; Wang, Q.W.; Ren, M.X.; Bo, F.J.; Zhang, Y.X.; Guo, J.P. Carbon, nitrogen and phosphorus stoichiometric characteristics of needle leaf- leaf litter- soil from Larix principis-rupprechtii plantation with different ages. J. Northwest For. Univ. 2020, 35, 1–9. (In Chinese) [Google Scholar]
  40. Bai, X.J.; Zeng, Q.C.; An, S.S.; Wang, B.R. Ecological stoichiometry characteristics of leaf-litter-soil in different plantations on the Loess Plateau, China. Chin. J. Appl. Ecol. 2016, 27, 3823–3830. [Google Scholar]
  41. Vitousek, P. Nutrient cycling and nutrient use efficiency. Am. Nat. 1982, 119, 553–572. [Google Scholar] [CrossRef]
  42. Tessier, J.T.; Raynal, D.J. Use of nitrogen to phosphorus ratios in plant tissue as an indicator of nutrient limitation and nitrogen saturation. J. Appl. Ecol. 2003, 40, 523–534. [Google Scholar] [CrossRef]
  43. Guo, Y.; Yan, Z.; Gheyret, G.; Zhou, G.; Xie, Z.; Tang, Z. The community-level scaling relationship between leaf nitrogen and phosphorus changes with plant growth, climate and nutrient limitation. J. Ecol. 2020, 108, 1276–1286. [Google Scholar] [CrossRef]
  44. Güsewell, S. N:P ratios in terrestrial plants: Variation and functional significance. New Phytol. 2010, 164, 243–266. [Google Scholar] [CrossRef]
  45. Koerselman, W.; Meuleman, A.F.M. The vegetation N:P ratio: A new tool to detect the nature of nutrient limitation. J. Appl. Ecol. 1996, 33, 1441–1450. [Google Scholar] [CrossRef]
  46. Tong, R.; Zhou, B.Z.; Jiang, L.L.; Ge, X.G.; Cao, Y.H.; Shi, J.X. Leaf litter carbon, nitrogen and phosphorus stoichiometry of Chinese fir (Cunninghamia lanceolata) across China. Glob. Ecol. Conserv. 2021, 27, e1542. [Google Scholar] [CrossRef]
  47. Aerts, R. Climate, leaf litter chemistry and leaf litter decomposition in terrestrial ecosystems: A triangular relationship. Oikos 1997, 79, 439–449. [Google Scholar] [CrossRef]
  48. Guo, C.; Liu, S.B.; Xiang, Y.Z.; Tang, X.L.; Liu, H.T.; Yao, B.; Luo, X.Q. Impact of living mulch on soil C:N:P stoichiometry in orchards across China: A meta-analysis examining climatic, edaphic, and biotic dependency. Pedosphere 2020, 30, 26–34. [Google Scholar]
  49. Chen, C.; Zhang, S.J.; Li, L.D.; Liu, Z.D.; Chen, J.L.; Gu, X.; Wang, L.F.; Fang, X. Carbon, nitrogen and phosphorus stoichiometry in leaf, litter and soil at different vegetation restoration stages in the mid-subtropical region of China. Chin. J. Plant Ecol. 2019, 43, 658–671. (In Chinese) [Google Scholar] [CrossRef]
  50. Zhang, G.Q.; Zhang, P.; Peng, S.Z.; Chen, Y.M.; Cao, Y. The coupling of leaf, litter, and soil nutrients in warm temperate forests in northwestern China. Sci. Rep. 2017, 7, 11754. [Google Scholar] [CrossRef]
  51. Bo, F.J.; Zhang, Y.X.; Chen, H.Y.H.; Wang, P.G.; Ren, X.M.; Guo, J.P. The C:N:P stoichiometry of planted and natural Larix principis-rupprechtii stands along altitudinal gradients on the Loess Plateau, China. Forests 2020, 11, 363. [Google Scholar] [CrossRef] [Green Version]
  52. Johannes, R.; Philip, C.B.; Erland, B. The microbial PLFA composition as affected by pH in an arable soil. Soil Biol. Biochem. 2009, 42, 516–520. [Google Scholar]
  53. Bååth, E.; Anderson, T.H. Comparison of soil fungal/bacterial ratios in a pH gradient using physiological and PLFA-based techniques. Soil Biol. Biochem. 2003, 35, 955–963. [Google Scholar] [CrossRef]
  54. Thomas, S.; Katharina, M.K.; Emanuel, S.; Katja, S.G.; Ellersdorfer, G.; Bernd, R.; Andreas, R.; Sophie, Z.B.; Kathrin, R. Who is who in litter decomposition? Metaproteomics reveals major microbial players and their biogeochemical functions. Multidiscip. J. Microb. Ecol. 2012, 6, 1749–1762. [Google Scholar]
  55. Qin, Y.Y.; Feng, Q.; Adamowski, J.F.; Zhu, M.; Zhang, X.F. Community level response of leaf stoichiometry to slope aspect in a montane environment: A case study from the Central Qilian Mountains, China. Glob. Ecol. Conserv. 2021, 28, e01703. [Google Scholar] [CrossRef]
  56. Ai, Z.M.; He, L.R.; Xin, Q.; Yang, T.; Liu, G.B.; Xue, S. Slope aspect affects the non-structural carbohydrates and C:N:P stoichiometry of Artemisia sacrorum on the Loess Plateau in China. Catena 2017, 152, 9–17. [Google Scholar] [CrossRef]
  57. Waigwa, A.N.; Mwangi, B.N.; Wahiti, G.R.; Omengo, F.; Zhou, Y.D.; Wang, Q.F. Variation of morphological and leaf stoichiometric traits of two endemic species along the elevation gradient of Mount Kenya, East Africa. J. Plant Ecol. 2020, 13, 785–792. [Google Scholar] [CrossRef]
  58. Chen, L.L.; Qiang, D.; Yuan, Z.Y.; Mu, X.M.; Kallenbach, R.L. Age-related C:N:P stoichiometry in two plantation forests in the Loess Plateau of China. Ecol. Eng. 2018, 120, 14–22. [Google Scholar] [CrossRef]
Figure 1. General information of sample plots along elevations in Daiyun Mountain.
Forests 13 00372 g001
Figure 2. Correlations of C:N, C:P and N:P among leaf, litter and soil. Note: PCN: Plant C:N; PCP: Plant C:P; PNP: Plant N:P; LCN: Litter C:N; LCP: Litter C:P; LNP: Litter N:P; SCN: Soil C:N; SCP: Soil C:P; SNP: Soil N:P. * as p < 0.05, ** as p < 0.01, *** as p < 0.001.
Forests 13 00372 g002
Figure 3. (AE) Fitting results of structural equation model for plant, litter, soil and environmental factors. Note: The explicit variable of the structural equation and the number on the line point to the path coefficient; blue represents positive correlation; red represents negative correlation; AT: Air temperature; SWC: Soil water content; ELE: Elevation; PCN: Plant C:N; PCP: Plant C:P; PNP: Plant N:P; LCN: Litter C:N; LCP: Litter C:P; LNP: Litter N:P; SCN: Soil C:N; SCP: Soil C:P; SNP: Soil N:P.
Forests 13 00372 g003
Table 1. C, N and P in plant and litter at different elevations in Daiyun Mountain.
ItemsComponents900 m1000 m1100 m1200 m1300 m1400 m1500 m1600 m
TC
(g/kg)
Plant458.49 ± 0.33
dB
480.88 ± 2.61
aA
496.89 ± 3.74
abA
471.00 ± 1.93
cA
478.95 ± 2.61
abA
470.38 ± 0.54
cA
494.36 ± 1.75
bcB
470.42 ± 0.11
cA
Litter433.71 ± 0.78
eC
473.44 ± 1.27
bB
475.44 ± 1.41
bA
409.30 ± 2.51
fB
460.29 ± 0.99
dB
467.33 ± 0.57
cB
480.06 ± 1.37
aA
460.31 ± 0.69
dB
TN
(g/kg)
Plant14.99 ± 0.96
bA
12.55 ± 0.28
cdA
12.22 ± 0.53
bcdA
15.10 ± 1.14
bcA
12.67 ± 0.49
bcdA
16.07 ± 2.51
dA
14.83 ± 0.93
cdA
18.19 ± 1.01
aA
Litter8.9 ± 0.18
dC
8.33 ± 0.46
dC
10.90 ± 0.48
cC
13.50 ± 0.14
bB
10.37 ± 0.48bC11.43 ± 0.41
aB
11.64 ± 1.86
bC
14.73 ± 0.19
bC
TP
(g/kg)
Plant1.24 ± 0.14
cdA
1.12 ± 0.06
cdA
1.18 ± 0.07
cdA
1.33 ± 0.09
bcA
1.50 ± 0.08
bA
1.40 ± 0.33
aA
1.38 ± 0.10
dA
1.44 ± 0.10
cdA
Litter0.43 ± 0.07
cdB
0.5 ± 0.04
abB
0.38 ± 0.02
cB
0.53 ± 0.01
abB
0.55 ± 0.06
aB
0.50 ± 0.06
abB
0.52 ± 0.05
abB
0.59 ± 0.04
aB
C:NPlant30.71 ±1.89
abB
38.35 ± 0.95
abB
39.09 ± 1.93
abA
31.38 ± 2.37
abA
37.86 ± 1.28
abA
30.05 ± 5.01
aA
33.49 ± 2.26
aA
25.94 ± 1.43
bB
Litter48.77 ± 0.92
bC
57.05 ± 3.44
aC
43.70 ± 1.46
cB
30.32 ± 0.19
eA
44.40 ± 1.14
cdeC
40.96 ±0.67
eC
41.32 ± 4.56
cdB
31.26 ± 0.42
deC
C:PPlant372.54 ± 38.42
bcB
430.56 ± 23.75
abB
405.08± 26.47
abB
355.16 ± 27.58
cdB
321.00 ± 16.34
dB
351.62 ± 74.76
dB
361.19 ± 28.14
aB
327.66 ± 22.38
abcA
Litter1028.07 ± 163.17
abB
959.83 ± 80.83
abB
1250.04 ±76.39
aB
776.90 ± 15.9
bB
843.25 ± 91.46
bA
955.02 ± 102.88
abB
938.12 ± 101.61
abB
789.95 ± 53.06
bA
N:PPlant12.10 ± 0.53
abB
11.24 ±0.78
abB
10.36 ± 0.36
abC
11.34 ± 0.69
bcC
8.48 ± 0.26
cB
11.63 ± 1.27
cB
10.79 ± 0.47
abB
12.66 ± 0.92
aB
Litter21.11 ± 3.56
cdB
16.81 ± 0.71
dA
28.73 ± 2.57
abB
25.63 ± 0.50
abcB
18.99 ± 1.88
abcA
23.43 ± 3.53
aA
22.73 ± 3.29
abcA
25.28 ± 1.83
bcdA
Note: Values designated by different capital letters were significantly different in the same column, and those by different lowercase letters were significantly different in the same row, respectively (p < 0.05).
Table 2. The influence coefficient of the observed variable (environment) to latent variable (plant, litter and soil).
FactorsPlantLitterSoil
ELE−0.481 *−0.429 *0.3319 *
pH0.2660.2153−0.4296 *
Slope0.301 *0.3297 *0.0738
SWC−0.41−0.35610.3159
AT0.356 **0.24560.3118
Note: AT: Air temperature; SWC: Soil water content; ELE: Elevation. * as p < 0.05, ** as p < 0.01.
Publisher’s Note: MDPI stays neutral with regard to jurisdictional claims in published maps and institutional affiliations.

