Remote Sensing Applied in Forest Management to Optimize Ecosystem Services: Advances in Research
by
 , , and
Emilio Abad-Segura
1,* ,
,
Mariana-Daniela González-Zamar
2,3,* ,
,
Esteban Vázquez-Cano
4 and
Eloy López-Meneses
5,6
1
Department of Economics and Business, University of Almeria, 04120 Almeria, Spain
2
Department of Education, University of Almeria, 04120 Almeria, Spain
3
Higher Technical School of Architecture of Seville, Avenida de la Reina Mercedes, 2, 41012 Seville, Spain
4
Department of Didactics and School Organization, National University of Distance Education, 28040 Madrid, Spain
5
Department of Education and Social Psychology, Pablo de Olavide University, 41013 Sevilla, Spain
6
Research Institute in Social Sciences and Education, Vice-Rectory for Research and Postgraduate, University of Atacama, Copiapó 1530000, Chile
*
Authors to whom correspondence should be addressed.
Forests 2020, 11(9), 969; https://doi.org/10.3390/f11090969
Submission received: 29 July 2020
/
Revised: 27 August 2020
/
Accepted: 4 September 2020
/
Published: 7 September 2020
(This article belongs to the Special Issue Analysis of Forest Landscape and Land-Use Based on Remote Sensing Technology)
Abstract
:Research Highlights: the wide variety of multispectral sensors that currently exist make it possible to improve the study of forest systems and ecosystem services. Background and Objectives: this study aims to analyze the current usefulness of remote sensing in forest management and ecosystem services sciences, and to identify future lines of research on these issues worldwide during the period 1976–2019. Materials and Methods: a bibliometric technique is applied to 2066 articles published between 1976 and 2019 on these topics to find findings on scientific production and key subject areas. Results: scientific production has increased annually, so that in the last five years, 50.34% of all articles have been published. The thematic areas in which more articles were linked were environmental science, agricultural, and biological sciences, and earth and planetary sciences. Seven lines of research have been identified that generate contributions on this topic. In addition, the analysis of the relevance of the keywords has detected the ten main future directions of research. The growing worldwide trend of scientific production shows interest in developing aspects of this field of study. Conclusions: this study contributes to the academic, scientific, and institutional discussion to improve decision-making, and proposes new scenarios and uses of this technology to improve the administration and management of forest resources.
1. Introduction
The world population is eminently urban. Nowadays, approximately 5 billion people are considered to live in cities. The urban population is expected to reach 6.5 billion within a decade [1,2]. This urban growth will affect terrestrial ecosystems and will produce an increase in demands on the services they provide [3]. The United Nations (UN) exposes the importance that environmental services and ecosystems offer to human beings as natural goods and services, and on which social well-being and economic development depend directly, and which are currently declining globally at a dizzying rate [4,5]. On the other hand, the establishment of forest ecosystems requires a minimum of conditions that allow the growth of trees. Forest conservation is vital for its positive effects against global warming and the protection of biological diversity and indigenous peoples. By safeguarding forested areas, the management of natural resources, such as the planet’s fresh water is reinforced; 75% comes from these ecosystems, and the yield of the land is increased. These ecosystems are also a source of clean air and home to more than 75% of land animals and plants, as well as natural pollinators.
Satellite images make it possible to evaluate ecosystems and with the help of spectral indices, the health and integrity of these ecosystems can be evaluated. The parameterization of the annual curve of spectral vegetation indices allows to derive indices or attributes of three factors key to the functioning of ecosystems (productivity, seasonality, and phenology), to establish the reference conditions and evaluate the changes that occur [6,7]. Therefore, through the analysis of a long time series, it is possible to identify directional trends of change, useful in the perspective of global change.
In this study context, the forest is characterized by having a large number of trees, and a great diversity of species of fauna and flora, which makes it one of the most important biomes for the planet’s biosphere [8], in addition to acting as a stabilizer of global temperature, and being home to the biodiversity of plants and animals, it requires its conservation. In this way, remote sensing refers to the way to obtain information about forests through data collection and analysis without the instruments used to acquire the data being in direct contact with the forest [9]. Indeed, remote sensing can be applied to forest management, referring to the process of planning and executing practices for the administration and use of forests, to meet environmental, economic, social, and cultural objectives. Thereby, remote sensing is a key tool in forest management with the aim of optimizing the ecosystem services of forests, such as the supply of raw materials, the regulation of the water cycle, the absorption of atmospheric CO2, the richness of species, or the leisure options they provide [10,11,12,13,14].
Hence, if ecosystems stop providing their services, the alternatives would be costly. For this reason, the need arises to implement new approaches and tools for study and conservation, using remote sensing to support decision-making processes in biodiversity conservation efforts around the world [15,16], in addition to contributing to the benefits associated with the well-being and survival of the world’s population.
The motivation of this study is to document the evolution of the knowledge base of remote sensing applied in forest management to optimize ecosystem services, with the intention of contributing to the development of research and opening new addresses.
Based on the review of the literature carried out and the studies that address this issue, we seek to answer three research questions: (i) What is the dynamics of the research?; (ii) What are the main thematic areas where the articles are published?; and (iii) What are the thematic axes that this research topic develops and towards which they are evolving?
Consequently, the main objective of this study is to analyze current and future lines of research at the global level, during the period 1976–2019, on remote sensing applied to forest management to optimize ecosystem services. To obtain answers to the research questions, a sample of 2066 scientific journal articles selected from the Scopus database was analyzed. This review uses bibliometric techniques to synthesize the knowledge base on remote sensing applied to forest management to improve ecosystem services in an international context. It is essential to know the state of the research to continue with the most appropriate lines of research, and thus establish the bibliometric indicators.
Research continues to evolve, so that ten new directions related to ecological sensitivity assessment, sustainable rural development, ecological conservation zone, ecological control buffer zone, air pollution mitigation, contemporary political forest, cross border biophysical forest phenomena, satellite fire mapping, topological acoustic sensing, and unsupervised treetop detector.
This study supposes an analysis of the scientific production during the period 1976–2019, as well as the identification of the lines of research and their transformation. The evolution in this field of research has been identified from the relevance of the keywords. Hence, the results obtained are a complement to the knowledge of remote sensing applied in the forest management to enhance ecosystem services and allow the relationship between science and technique to be established, and to inform the decision-making process.
To achieve the stated aim and clarify your understanding, this study is organized as follows. Section 2 justifies the relevance of the research topic, delimiting the unit of analysis and making a literature review of the most relevant aspects of the theoretical principles and the basic concepts of this topic. Section 3 details the applied methodology and the data inclusion/exclusion process. Section 4 shows the main results and their discussion in a broad context. Finally, Section 5 presents the conclusions.
2. Framework
Section 2 is the result of the analysis and previous review of the literature, its purpose being to act as a guide and theoretical and conceptual framework for the interpretation of the results. In this way, the theoretical model and a series of interrelated terms are described that allow the conceptualization of the study in this field of knowledge, consolidate the purpose of the research, and help the reader understand the subject.
In an initial bibliographic search, in order to delimit the research problem and avoid approaches that are not related to the study, a set of articles is identified that provides evidence and an initial synthesis on the subject, in addition to allowing the definition of the objective of research and extract the essential terms. Table 1 shows the main articles selected after reviewing the literature on the research topic, establishing a framework for the theoretical basis and terminology on remote sensing applied in the forest management to optimize ecosystem services. Their analysis has allowed determining the problem, the purpose, and the objective of the research, as well as obtaining the key terms (remote sensing, forest management and ecosystem service) to apply the methodology specified in Section 3.
The reviewed literature provides definitions for the basic concepts of this research topic. Therefore, some reflections on the terms and concepts used in the context of this research are included, which have shaped this field of study from the beginning.
2.1. Remote Sensing
Remote sensing refers to the technique that allows information to be obtained at a distance from objects without material contact. In this work, the concept is linked in the context of forests (located on the Earth’s surface). Observation will be possible through the interaction between the objects and the sensor, where the interaction is a flux of radiation that starts from the objects and is directed towards the sensor. The flux can originate from: (i) solar radiation reflected by objects: visible light and reflected infrared; (ii) terrestrial radiation emitted by objects: thermal infrared; and (iii) radiation emitted by the sensor and reflected by objects: radar [32,33,34]. Therefore, techniques (i) and (ii) make up active remote sensing, while (iii) refers to active remote sensing.
Therefore, remote sensing encompasses all the information collected by sensors that are physically separated from the objects to be analyzed. The information is captured from an elevated platform, which generates data, such as satellite images or aerial photography. Remote sensing instruments are based on detecting the energy emitted or reflected by the analyzed object [35,36]. In addition, this technology enables the electromagnetic variation of the surface to be measured and monitored, so that the data provides a unique view of the landscape. Similarly, remote sensing can itself be used as an important data source in model development and improvement, and can be used to validate models [37,38]. From aerial photographs, for example, information is obtained on the types of vegetation and soil, the limits of lakes, plots, and sheets of water, or geological formations [39].
In this context, satellites allow observing the planet and monitoring the change in nature’s surface over time, in a consistent, integrated, synoptic, and numerical way. Remote sensing satellites provide comprehensive, cost-effective, and repeatable spatial and temporal data coverage, that is, they can simultaneously analyze various phenomena together, so that these tasks can be carried out over very wide regions, such as example, assessment, and observation of the state of the soil [40,41]. On the other hand, remote sensing is inescapably associated with the concept of image, which refers to satellite images, aerial photographs, other data from remote observation, and scanned data. The images are raster data, representing real-world phenomena, that is, digital aerial photographs, satellite images, digital images, or scanned maps [42,43]. In this case, each pixel has a value that varies depending on how the image was captured and what it represents. If it is a satellite image, each pixel represents the value of the energy reflected by a part of the Earth’s surface [44].
For all this, the spectral data (data derived from the measurement of the level of reflectance or transmittance of a given color at selected wavelengths along the visible spectrum) must be enhanced, filtered, and geometrically corrected with image processing techniques. Before its integration into the Geographical Information Systems (GIS). Geometric correction involves the process by which the image coordinates are transformed into real-world coordinates [45,46]. In general, this supposes a rotation and a scaling of the pixels, in addition to the reclassification of the values assigned to each one, from the use of reclassification techniques that involve the definition of new positions for the pixels of the GIS map, and their padding with data obtained using interpolation algorithms, such as the closest neighbor algorithm, bilinear interpolation, or cubic convolution [47,48].
2.2. Forest Management
The forest is an ecosystem where the predominant vegetation is made up of trees and shrubs. These plant communities cover large areas of the globe and function as habitats for animals, modulators of hydrological flows and soil preservatives, constituting one of the most important aspects of the Earth’s biosphere. They occupy approximately one-third of the earth’s surface and represent more than two-thirds of the leaf surface of terrestrial plants, and contain around 70% of the carbon present in living beings [49,50]. However, forests are becoming great victims of civilization as the global population has been increasing, with the consequent problems of deforestation, contamination, and use. The role of the forest in climate change is twofold since it acts as a cause and as a solution for greenhouse gas emissions. For the conservation of forests, it is necessary to stop the loss and degradation of forest ecosystems and promote their restoration. Furthermore, forests can potentially contribute to more than a third of the total mitigation of climate change, which is necessary to meet the objectives of the Paris Agreement by 2030 [51,52].
The concept of forest management refers to the process of planning and executing practices for the administration and use of forests and other wooded land, with the objective of meeting specific environmental, economic, social, and cultural objectives. It can also be related to degrees of deliberate human intervention, such as actions that seek to protect and maintain forest ecosystems and their functions, or those that seek to favor species of social or economic value, or groups of species that allow for improved production of goods and forest services. In other words, forest management refers to the management of forests in accordance with the principles of sustainable development [53,54,55].
Consequently, managing the ecological, economic, and sociocultural balance provides globally integrated benefits, such as the protection of biodiversity and ecosystems, the reduction of rural poverty and the mitigation of some of the effects of climate change. Due to global warming, it is necessary to sustainably manage forests, reducing their fuel load to prevent fires [56,57]. Correct forest management means increasing the use of resources, improving the management of forest residues, reducing costs, and increasing the value of forest products increases in value.
The “Principles Relating to Forests” (Rio de Janeiro, 1992) adopted at the United Nations Conference on Environment and Development (UNCED) established sustainable forest management [58,59]. In 2007, the United Nations General Assembly adopted the non-binding instrument on all types of forests, which reflected the international commitment to promote sustainable forest management through a new approach that brings together all actors [60]. Carrying out adequate forest management allows the conservation of environmental and social values as well as increasing the economic benefit. In this sense, for example, logging is key to the economy of various regions, and through proper management, the best benefit can be obtained without harming the environment [61,62]. Forests, from an ecological point of view, intervene in water regulation, protect soils, help maintain biodiversity and contribute to reducing greenhouse gases; while they are also leisure areas [63,64]. Therefore, it is essential to plan before starting forest management to guarantee both forest stability and the multiplicity of the environment.
Forest management planning consists of establishing the objectives to be achieved and establishing the phases to achieve correct forest management: (i) preliminary evaluation at the environmental, legal, administrative and socio-cultural levels; (ii) make inquiries; (iii) define the management objectives, (iv) zoning the forest area; (v) calculate the sustainable yield of wood and non-wood products; (vi) prepare the forest management plan, (vii) execute the field management plan; and (viii) monitor and evaluate the measures adopted through the use of criteria and indicators [65,66,67].
These criteria and indicators allow quantifying the progress of the activities carried out to guarantee sustainable forest management. Hence, the forest area can be monitored and evaluated over time after reaching the objectives. In this way, the criteria make it possible to achieve sustainability considering the ecological, economic, and social functions of forests. However, the indicators allow evaluating whether forest management has been correct, in addition to monitoring the state and changes of forests in quantitative and qualitative terms according to each criterion.
2.3. Ecosystem Service
The Food and Agriculture Organization (FAO) initially refers to the concepts of biodiversity and ecosystem to later define ecosystem services. Accordingly, biodiversity is the variety existing among living organisms, essential for the function of ecosystems and for them to provide their services; while ecosystems are the living elements that interact with each other and with their non-living environments, and that provide benefits or services to the world [68,69]. Consequently, ecosystem services are the multitude of benefits that nature brings to society. Among other intrinsic benefits to ecosystem services, those that stand out are: (i) making human life possible by providing nutritious food and clean water; (ii) regulate diseases and climate; (iii) support crop pollination and soil formation; and (iv) they offer recreational, cultural, and spiritual benefits [70,71,72].
The natural resource base and ecosystem services are the foundation of agricultural and food systems. Despite the high economic value of these goods, they are not sufficiently considered by economic policies and regulations; this indicates that there is not a sufficient investment in its protection and management. To guarantee the provision of ecosystem services, it is necessary to support and maintain the functions of ecosystems and protect biodiversity, so that these must be managed sustainably [73,74].
Ecosystems provide four types of services: (i) regulation: benefits obtained from the regulation of ecosystem processes (the regulation of air quality and soil fertility, the control of floods and diseases and the pollination of crops); (ii) cultural: immaterial benefits that people derive from ecosystems (the source of inspiration for aesthetic manifestations and engineering works, cultural identity and spiritual well-being); and (iii) supply: material benefits that people obtain from ecosystems (the supply of food, water, fibers, wood and fuels) [75,76,77]. The agriculture, livestock, forestry, and fishing sectors benefit from, and in turn provide, ecosystem services. The effects of these sectors on ecosystem services can be positive, for example, forests help maintain healthy aquatic ecosystems and provide reliable sources of clean water; or negative, for example, deforestation and poor management can increase flooding and landslides during cyclones [78,79].
On the other hand, ecosystem services are not limited by borders, that is, for example, a certain region benefits from agricultural products from other continents or from flood protection provided by floodplains in a neighboring country. Therefore, the analysis of flows between distant regions that arise from ecosystem services allows: (i) to recognize the value of intact nature; (ii) identify the global drivers of biodiversity loss or soil erosion in distant regions; and (iii) develop measures for more sustainable management. It is important to understand the interrelationships and environmental costs caused by internal consumption of ecosystem services in other countries [80,81,82]. This information can be used in political decisions, such as fair-trade standards, environmentally and socially responsible certification, as well as financial compensation measures.
3. Data and Methodology
Section 3 provides a basic description of the bibliometric methodology applied in the study, the inclusion and exclusion criteria of data to determine the sample of articles analyzed, and the processing of the data in relation to the objective of the research.
3.1. Bibliometric Method
Bibliometrics applies mathematical and statistical methods to scientific literature, to analyze the activity of a certain scientific field. This methodology was started by E. Garfield in the middle of the 20th century, and since then it has become generalized in the analysis of scientific research and has contributed to reviewing knowledge in multiple disciplines [83,84]. In this way, bibliometrics has evolved from reflection on scientific development, and from the availability of numerous databases accessible to the researcher. It has also become an indispensable tool for managers and specialists in management or in organizations that develop research or innovation programs. Quantitative studies, based on bibliometrics, enrich the understanding and description of the dynamics of activity and scientific production [85].
In recent years, bibliometric methodology has encouraged the revision of different schools of scientific knowledge. It has been used by numerous scientists, including management, finance, economics, and education [86]. Bibliometric indicators are the instruments used to measure the results of scientific activity in any of its manifestations [87]. Likewise, studies on the scientific literature make it possible to identify certain relationships between documents in a given area of research and, thus, to recognize sub-disciplines or trace historical development and progress in an area of interest [88,89].
3.2. Data Collection
The main objective of the study was to analyze current and future lines of research at a global level, between 1976 and 2019, on remote sensing applied to forest management to optimize ecosystem services. To achieve this objective, a quantitative analysis has been carried out using bibliometric techniques. Based on the revised literature of the study topic, highlighted in Table 1, the terms chosen in the search string have been: remote sensing, forest management, and ecosystem service.
Currently, there is no doubt about the importance and advantages of bibliographic databases, and that the quality and validity of a study will depend on them. Some studies have tried to answer which database is more suitable to be used for bibliometric work. The presence of two large scientific databases, Web of Science (WoS) and Scopus, raises the important question of the comparison and stability of the statistics obtained from the different data sources. Previous analyses between both databases, have not given a clear winner, since everything depends on what you want to analyze, the discipline in question and the period of analysis [90,91]. In this study, both databases have been evaluated, so that, in volume of articles, WoS (Core Collection) has yielded a total of 219 compared to 2066 by Scopus, in the same temporal coverage 1976–2019.
The process followed to select the sample is adjusted to the flow diagram of Figure 1, based on the Preferred Reporting Items for Systematic Reviews and Meta-Analyzes (PRISMA) [92]. Then, in phase 1 (identification), 32,811 records were identified from the Scopus database, considering all the fields for each of the search terms (remote sensing, forest management and ecosystem service), all types of documents and all the data in the data range (all years July, 2020). In the next phase 2 (selection), the option “article title, abstract and keywords” was selected in the field of each term, excluding 29,822 records. Then, in phase 3 (eligibility), of the 2989 records, only the articles were selected as the type of document, to guarantee the quality derived from the peer review process. In this phase, 734 records were excluded. In the last phase (included), of the 2255 records, 189 documents were excluded, so the final sample included 2066 articles, both open access and non-open access.
The representation of this sample of documents is supported by the proven quality of the Scopus database, with respect to the indexing protocol, in addition to the systematic procedures of the search criteria. In essence, the applied method consisted of performing a search in the Scopus database, using a search string with the terms that make up this research (remote sensing, forest management and ecosystem service). The objective was to examine the subtopics of the title, abstract and keywords of a sample of articles in the period from the year of the first contribution (1976) to the last full year (2019), that is, during the last 44 years, in order to be able to compare complete years as described in previous bibliometric works [93,94,95].
3.3. Data Processing
In the data processing phase, the collected data is translated into usable information. This processing must be carried out correctly so as not to negatively affect the results obtained from the data. Thus, from the data in its raw form, they are converted to a more readable format, such as tables and figures, giving them the necessary form and context to be interpreted, so as to allow conclusions to be drawn and aid decision-making.
Among the different bibliometric techniques, relationship indicators have been used to determine the semantic structure of the articles in the sample and, thus, to carry out possible disciplinary or thematic separations, that is, to identify the invisible borders and the evolution of the contents. These indicators measure the relationships and connections between words [96].
In this study, the analysis of the keywords has allowed the detection of the main current and future research topics, based on the co-occurrence analysis, since the scientific texts can be reduced to the set of joint appearances between the words that compose it [97].
The occurrence refers to the frequency of each lexical unit (keyword) in the context units that constitute it (articles). Hence, co-occurrence is the frequency of appearance of some terms next to others and even their syntactic or semantic evaluation. The co-occurrence of two terms will be high if they frequently appear together in one set of articles and rarely do so separately in the rest, that is, if the terms co-occur (appear together) in one sentence, they are likely to be semantically related [98]. Thereby, co-occurrence analysis refers to the proximity relationship of two or more terms in a unit of text.
The network based on the co-occurrence method provides a graphical visualization of the relationships of the concepts represented in the documents. Therefore, the co-occurrence analysis allows strongly related concepts to be grouped within the set of articles. For these reasons, in a research topic, this method allows to deduce the relevant terms and extract the schools of thought or thematic axes [99,100].
For the analysis of the sample of the 2066 articles, the VOSviewer software (version 1.6.15., University of Leiden, Leiden, The Netherlands) was applied and using the relationship indicators through co-occurrence analysis, which provides data on the interactions and the evaluation of subject-matters, to measure the activities of research networks. This tool allows you to view relationship maps and network links between keywords [101]. Network mapping refers to the process of establishing the connection and structure of the network with the aim of mapping the dynamics of science, in this case, of a given field of research, and exploring the underlying structure of similarities and interrelationships between articles [102].
3.4. Method Terminology
The terminology of the VOSviewer tool has been used in this study. In consequence, Link is the connection or relationship between two elements (articles), that is, it refers to the co-occurrence links between terms. The Total Link Strength indicates that each link has a strength, represented by a positive numerical value; the higher this value, the stronger the link will be, and, in the case of concurrent links, indicates the number of articles in which two terms appear together. On the other hand, the terms and links together constitute a network, and a cluster is a set of terms included in a map. Moreover, groups do not need to exhaustively cover all the elements on a map, that is, there may be terms that do not belong to any cluster.
The attributes used for the description of the terms have been those of weight and score, represented by numerical values. Thus, the weight of a term indicates the importance of the article in the whole of the sample analyzed, that is, in the field of research studied. A term with a higher weight is considered more important than an item with a lower weight. Hence, if a term has a weight, for example, twice as high as the weight of another term, the first term is twice as important. In a map display, items with a higher weight are displayed more prominently than items with a lower weight. For a given term, the weight of the Link attribute indicates the number of links a term has to other terms, while the weight of the Link Strength attribute indicates the total strength of the links of a term with other terms.
VOSviewer is based on a scientific classification system at article level starting from [103]:
- Determine the relationship of the publications: from a set of articles, the relationship of each pair in this set is determined, to produce hierarchical classification systems. Each article belongs to a single research area at the lowest level of a ranking system; each research area at the lowest level in turn belongs to a unique research area at the second lowest level, and so on.
- Group the articles to build the basic structure of a classification system: the articles are grouped into research areas and the research areas are organized in a hierarchical structure. The grouping technique is based on modularity. VOSviewer’s clustering algorithm allows communities to be detected in a network, which considers modularity, that is, a measure that assesses the quality of community structures. Therefore, VOSviewer’s modularity-based clustering provides networks where nodes are densely connected internally within groups, but without external connection between different groups. In this way, it unifies the mapping and grouping approaches, in addition to dividing the research carried out in documents [104].
- Labeling research areas: to complete the construction of the classification system, labels are assigned to research areas. These labels are obtained by extracting appropriate terms from the titles and summaries of the articles that belong to a research area.
Therefore, continuing with the punctuation attribute, it allows us to classify by relevance the terms that appear in the titles and summaries of the articles that belong to the research area. For this reason, the calculation of the relevance score for each term in a research area allows us to deduce that the terms with a higher relevance score provide a better prediction to identify a future line of research [103,105,106].
In this sense, given a term x in a research area a in a classification system, which in turn is part of the research area b. Hence, the relevance score of term x in research area a is calculated as (1):
where nax and nbx denote the number of items in areas a and v in which the x term occurs, respectively. This calculation of term relevance scores is based on the balance or compensation of the following considerations (which is denoted by parameter c): (i) the frequency of appearance of the term x in area a, in relation to the frequency of appearance of the term x in area b can be considered as an indication of the relevance of the term x for area a; and (ii) the absolute frequency of occurrence of term x in area a can also be considered as an indication of the relevance of term x [103].
The findings obtained are valuable for a group of actors involved in scientific research on remote sensing applied in the forest management to optimize ecosystem services, and who require an examination of past and future information, such as engineers, investment analysts, academics, researchers, research institutions, universities, government agencies, suppliers of materials and services, among others.
4. Results and Discussion
Section 4, first, presents and discusses the main results of the evolution of scientific production in a global context on remote sensing applied in the forest management to optimize ecosystem services. Then, the distribution of articles by subject area is analyzed. Subsequently, the results obtained from the analysis of the main keywords associated with this field of research are discussed, which allowed to identify the main current lines. Finally, based on the relevance of the terms, the main future directions of research have been identified.
4.1. Scientific Production and Subject Areas
The search in Scopus database generated 2066 scientific articles and none were excluded. Figure 2 shows the evolution of the number of articles on global research on remote sensing applied in the forest management to optimize ecosystem services, from 1976 to 2019.
It is observed that, of the 2066 articles in the 44-year period studied, 1040 have been published in the last 5 years (2015–2019), that is, 50.34% of all documents, while in the last decade (2010–2019) 1574 articles have been published (76.19%). Likewise, it is important to highlight that in the last year (2019) 268 articles (12.97%) have been published. These figures confirm the interest of the research topic in recent years by the scientific and academic community at the international level, with a growing publication from the beginning. Furthermore, the polynomial trend line of order 4 illustrates the growing relationship between the number of articles published on remote sensing applied in the forest management to optimize ecosystem services along the time horizon examined, since the curve shows its goodness with an R2 of 0.9867.
The first article on this topic dates from 1976, with the title Processing Remotely Sensed Data for Dimensional Analysis, published in the American journal IEEE Transactions on Geoscience Electronics, by the authors Cox, T., Hitchcock, H. and Weber, S [107]. Likewise, the most cited article, with 1019 citations in July 2020, was published in 2010 by the British journal Nature, with the title Recent decline in the global land evapotranspiration trend due to limited moisture supply, written by Jung, M., Reichstein, M., Ciais, P., Seneviratne, S.I., Sheffield, J., Goulden, M.L., … and Zhang, K. [108]. On the other hand, the most relevant article, that is, the contribution that most closely matches the search terms in the Scopus database, has been cited 50 times from its publication to July 2020. This article was published in 2010 by the journal Chinese Geographical Science, with the title Remote sensing of ecosystem services: An opportunity for spatially explicit assessment, and written by the authors Feng, X., Fu, B., Yang, X., and Lü, Y [109].
In this field of research, 89.40% of the articles are written in English (1874). This particularity is related to the fact that the publication in this language broadens its audience, as it happens widely in the searches carried out in the Scopus database [110]. It is followed by publication in Chinese (178, 8.62%), while each of the other languages does not reach 1% of representation (Spanish, Russian, French, Portuguese, Croatian, German, Bosnian, Hungarian, Italian, Japanese, and Polish).
The 2066 articles are classified into 22 thematic areas of the 27 in the Scopus database. In this sense, an article could be classified only in one area or in more than one thematic area. There is a correlation between the thematic areas and the journals where the articles are published, being the journal publisher who catalogues each article in the thematic areas, according to their criteria and experience.
Figure 3 presents the classification of these 15 main thematic areas in which the articles on remote sensing applied in the forest management to optimize ecosystem services are classified worldwide, over the past four decades. For each of these thematic areas, the articles are presented by decade and the percentage they represent. Moreover, in this Figure 3 the years 1976–1979 have not been represented, since they do not make up a decade. For the entire period, Environmental Science is the category that collects the largest number of published articles (1325, 59.78%), followed by Agricultural and Biological Sciences (1032, 49.95%). They are followed by Earth and Planetary Sciences (627, 30.35%), Social Sciences (318, 15.39%), Engineering (99, 4.79%), Energy (83, 4.02%), Computer Science (70, 3.39%), Decision Sciences (49, 2.37%), Biochemistry, Genetics and Molecular Biology (44, 2.13%), Multidisciplinary (44, 2.13%), and Physics and Astronomy (42, 2.03%). The rest of the thematic areas did not reach 2% of all published articles.
The subject of remote sensing applied in the forest management to optimize ecosystem services is the subject of multidisciplinary research. Its analysis is complex since its evolution is the reflection of numerous disciplines [111,112,113]. Although in a topic initially related to geography, topography, and forestry, it is also linked by its repercussions with the social sciences, the economy, or agriculture [114,115].
4.2. Keyword Analysis
In the 2066 articles in the study sample, 11,890 keywords were identified. The analysis of the keywords that appear frequently and relevance provided the identification of a set of research topics, which suggest the most current lines of interest among academics during the period 1976–2019, in addition to detecting the future directions of the research on remote sensing applied in the forest management to optimize ecosystem services at an international level.
Therefore, the most used keywords in the 2066 articles in the sample were examined. Table 2 lists the 30 most used keywords, ordered by the number of occurrences or number of articles in which they appear, and with the added information of the cluster to which it is associated (see Figure 4), and the weights of the attributes of the Links and Total Link Strength. The most prominent terms are “Remote Sensing” (in 1695 articles) and “Forest Management” (802). These two keywords are also the ones with the highest link weight and total strength. It should be noted that both keywords were considered in the search query of the Scopus database, together with the one found in the fourth position, “Ecosystem Service” (526).
The 30 top keywords associated with this topic are associated with the three variables of the study: Remote Sensing (Satellite Imagery, GIS, Landsat, Satellite Data, Environmental Monitoring, Laser Imaging Detection and Ranging (LiDAR), Mapping, Climate Change, Conservation), Forest Management (Forestry, Land Use, Land Use Change, Environmental Protection), and Ecosystem Service (Ecosystem, Biodiversity, Forest Inventory, Forest Cover, Biomass).
4.2.1. Clustering: Identification of Current Lines of Research
The keywords of the total articles of the selected sample of the Scopus database were analyzed, based on the analysis of co-occurrences. Figure 4 shows the seven clusters in which the keywords and their links were grouped, identifying each group with a color. The size of each cluster refers to the importance of the keywords that make up the group, while the thickness of the lines of union between two clusters refers to the number of interactions established between two different communities.
Table 3 shows the seven clusters that have been detected based on the co-occurrence analysis. These have been named by the keyword with the most occurrences, and ordered by the percentage of keywords that include, that is, cluster 1: “Forest Management”, 2: “Ecosystem services”, 3: “Environmental Monitoring”, 4: “Deforestation”, 5: “Satellite Data”, 6: “Biodiversity”, and 7: “Remote Sensing”. The weight of the Link and Total Link Strength attributes of each most representative keyword is included, and the 10 most important keywords with which each of them is associated are provided. Cluster 1 (pink color) is the most numerous, with 31.70%, while cluster 7 (orange color) includes the most central keyword, with 25,638 links and 1695 link strength.
Next, Figure 5, Figure 6 and Figure 7 represent the keywords with the most links and the links and the highest link strength, which coincide with the terms used in the search for Scopus to obtain the sample of the 2066 articles. Therefore, Figure 5 shows the 25,638 links and the 1695 link strength of the keyword “Remote Sensing”, which represents the centrality of the study, that is, the most prominent keyword in this field of research. The three strongest links of this keyword (cluster 7) have been established, during the analyzed period, with “Satellite Imagery” (cluster 4–303), “Vegetation” (3–199), and “Satellite Data” (5–172).
For its part, Figure 6 shows the 12,971 links and the link strength 802 of the keyword “Forest Management”, which represents the second keyword with more links and total strength. The three strongest links in “Forest Management” (cluster 1) have them with “Remote Sensing” (cluster 7—709), “Forestry” (1—412) and “Satellite Imagery” (4—146).
Figure 7 shows the 8400 links and 526 link strength of the keyword “Ecosystem Service”, which represents the fourth most prominent keyword in the research area. The three strongest links of “Ecosystem Service” (cluster 2) are established with “Remote Sensing” (cluster 7—467), “Ecosystems” (2—192) and “Land Use” (4—131).
The seven clusters identified from the co-occurrence analysis represent the lines of research developed during the period analyzed (1976–2019) by the different driving agents of this field of research, that is, authors, research institutions, countries, and financing centers. Below are these lines and a brief description of their research efforts.
- Forest Management: during this period, mainly, the link between active forest management and sustainability has been studied since adequate sustainable forest management has made it possible to increase production as they grow. Forests, as indicated in Section 2, contribute to the reduction of carbon emissions, but in the process of logging in agriculture or other industrial activities, they emit large amounts of CO2 and other greenhouse gases into the atmosphere that negatively influence climate change [10,29,53,116].
- Ecosystem Service: the publications on these lines, during the period analyzed, the publications on these lines have been aimed at analyzing the tangible and intangible benefits that forest ecosystems provide to the natural ecosystem itself, to the rest of the ecosystems and to society, such as: maintaining the functioning of the basins; water; the conservation of the biodiversity of native flora and fauna; the provision of medicinal species and other beneficial natural products for the maintenance of health, the fight against diseases and other uses; the reduction of water, wind and biological erosion, and protection of the geomorphological structure; protection of the diversity of related natural and cultural landscapes; or the maintenance of the environmental offer of tourist and educational interest [17,25,117]. Have been aimed at analyzing the tangible and intangible benefits that forest ecosystems provide to the natural ecosystem itself, to the rest of the ecosystems and to society, such as: maintaining the functioning of the basins; water; the conservation of the biodiversity of native flora and fauna; the provision of medicinal species and other beneficial natural products for the maintenance of health, the fight against diseases and other uses; the reduction of water, wind and biological erosion, and protection of the geomorphological structure; protection of the diversity of related natural and cultural landscapes; or the maintenance of the environmental offer of tourist and educational interest [17,25,117].
- Environmental Monitoring: this school of thought has studied the study of continuous and systematic monitoring of environmental, social, economic, and institutional variables to identify and evaluate the conditions of natural resources. The development of this line has provided information on the factors that can be influenced, in addition to the state of conservation, preservation, degradation, and environmental recovery of a given region [31,34,118].
- Satellite Imagery: during this period, research in this line has sought to identify, from data and the use of aerial photographs, trends at the regional and global level and the effects of climate change on vegetation. Subsequently, satellite remote sensing has become a more versatile tool to identify trends in vegetation dynamics on a large temporal and spatial scale. The use of satellite images, as well as databases, and other environmental variables and computational statistics, has allowed us to analyze trends in forest change in different regions globally [36,47,119].
- Satellite Data: in recent years, the research has contributed to developing applications and technologies for satellite tracking, such as Google Earth, which allows anyone with an Internet connection to see aerial images of almost any place on Earth. These applications allow more effective monitoring of environmental changes, such as fluctuations in sea ice at the poles, changes in ocean plankton, and deforestation. Satellite observation data has become a business for companies. A major factor in the increased use of satellite imagery has been the Landsat Data Distribution Policy, which allows access to data captured by Landsat satellites, and has been collecting data since 1972 [9,19,120].
- Deforestation: it is key to recognize that forests represent a source of food, medicine, and fuel for the entire world population, as well as being a key tool to combat climate change and protect soil and water. In this sense, deforestation referred to the loss of forests and jungles due to the impact of human activities or natural causes has had a high impact on research in the period analyzed. Likewise, the consequences of global deforestation contribute with most of the total emission of greenhouse gases into the atmosphere, followed by the generation of energy produced by fossil fuels and industrial activities [30,121].
- Remote Sensing: this main line of research has dealt, among others [9,20,22]: (i) with the mapping of occupation and land use and the detection of changes from multispectral images of medium and high spatial resolution (Landsat Thematic Mapper (TM) and Landsat Enhanced Thematic Mapper (ETM)., Satellite Probatoire d’Observation de la Terre (SPOT) High Resolution Visible (HRV) and High Resolution Visible (HRG)) and aerial orthophotos; (ii) the remote sensing connection with the GIS; (iii) the analysis of the human risk of forest fires and the regeneration of the vegetation behind them; (iv) estimation of the moisture content of the vegetation; (v) mapping of fuel models; (vi) detection of weeds; (vii) restoration of pastures; or (viii) obtaining spectral information to estimate biophysical parameters of vegetation in the context of global change.
4.2.2. Evolution of Keywords
This subsection presents the evolution that the keywords have followed in the research on remote sensing applied in the forest management to optimize ecosystem services during the period examined (1976–2019). Therefore, the pioneering terms associated with this research are identified and have been incorporated based on the increase in published articles. For this reason, Figure 8 shows the evolution and maturity of each keyword community, since it differentiates the period in which they have been analyzed and associated with the articles examined. In this way, it is verified that there has been progress in the terminology of the subject of study.
In this evolution of the keywords associated with the research topic, Figure 8 shows the group of pioneering keywords that has established the basis of the study of remote sensing applied in the forest management to optimize ecosystem services, such as forest management planning, strategic planning, defoliation, parks, silviculture, ecological economics, vegetation indices, change detection, inventory, species conservation, plant extracts, forest structure, ecological impact, and cost-benefit analysis, plus search terms (remote sensing, forest management, and ecosystem service).
Moreover, among the keywords that have been most recently associated with this topic, the following stand out: spatiotemporal analysis, enhanced vegetation index, unmanned aerial vehicles (UAV), hyper-spectral imageries, land surface temperature, digital storage, water stress, stereo image processing, water yield, woody plant, imaging spectroscopy, climate change mitigation, water availability, and anthropogenic disturbance.
In this sense, the different subperiods in which the remote sensing scientific activity applied in the forest management to optimize ecosystem services is carried out represent an abundant collection of keywords. This allows verifying the seven axes of study in the research activity identified. Figure 8 visualizes the importance of key terms based on when they have been associated with this research. Therefore, as indicated, the oldest have been a reference for the later ones.
4.3. Future Research Directions
Table 4 presents the top 10 terms of international remote sensing research applied in the forest management to optimize ecosystem services, based on the score relevance attribute calculated by VOSviewer (see Section 3.4), which has allowed the identification of the 10 future lines of research with more importance.
Below is a brief description of each of the future lines of research to be carried out in this field.
- Ecological Sensitivity Assessment: environmental sensitivity is the capacity of an ecosystem to withstand changes caused by anthropogenic actions, without undergoing substantial alterations that prevent it from reaching a dynamic balance that maintains an admissible level in its structure and function. Thus, the degree of environmental sensitivity will depend on the level of conservation or degradation of the ecosystem and the presence of external (anthropic) actions [122].
- Sustainable Rural Development: it refers to the process that seeks social change and economic growth of rural communities, based on the rational integration of the means of production, resources, and needs of these populations. The final objective is to improve the quality of life of these societies and conserve the environment. Among the main needs for sustainable rural development are: (i) improving the well-being of millions of people living in rural areas (approximately half of the world’s population), reducing the rural-urban gap, eradicating poverty, and avoiding poverty, migration to the city; (ii) protect and conserve natural, landscape and cultural resources; and (iii) ensure universal access to food with sustainable agricultural production. In this rural culture the role of the rural world is valued, mainly, in the conservation of nature, creating a culture of local consumption, promoting training and management resources for a sustainable economy, and transferring to urban society the importance of the world rural [123,124].
- Ecological Conservation Zone: they denote the regions that contain representative samples of ecosystems in a good state of preservation and that are intended to protect natural elements and ecological processes that promote balance and social well-being. An ecological reserve or nature reserve is a semi-protected area, of importance for wildlife, flora, or fauna, or with geological features of special interest that is protected and managed by man, for the purpose of conservation, and to provide opportunities for research and education. It is a human delimitation where activities harmful to the environment are prohibited, which is established mainly to conserve biological diversity of regional and local interest, and maintain the continuity of essential ecological processes, in addition to the provision of environmental services derived from them [5,82,122].
- Ecological Control Buffer Zone: buffer zones for conservation are strips of vegetation incorporated into the landscape to influence ecological processes and provide us with a variety of goods and services. The Intergovernmental Platform for Science and Policy on Biodiversity and Ecosystem Services (IPBES) indicates that one million species of animals and plants are in danger of extinction, a figure that reflects that three quarters of the terrestrial environment is deteriorated and approximately 66% of the oceans significantly altered [82,125].
- Air Pollution Mitigation: this line of research should provide quantitative and qualitative analyses on the mitigation of air pollution, in relation to the means of transport to make way for new energy, establish new pollution control mechanisms. Air pollution affects the environment. Growing forests absorb carbon from the atmosphere and store it in their biomass. At the time of harvesting the trees, carbon is transferred to the products and, at the end of their life cycle, part of the carbon is released into the atmosphere. Thus, good forest management, forests can mitigate the effects of climate change [77,126].
- Contemporary Political Forest: these are the result of four types of forestry intertwined chronologically: (i) colonial; (ii) national or for development; (iii) of war; and (iv) non-state. Political forests are not accurately mapped to forest cover and are different from common sense interpretations of the forest as natural formations characterized by associated trees and species, such as FAO forest classifications based on vegetation assessment. The creation of political forests implies coercion and violence, that is, wars, insurgencies, and other forms of political violence impact these areas, often forcing the displacement of resident peoples [5,127].
- Cross Border Biophysical Forest Phenomena: the phenomenon of shyness of the tree canopy consists of a limited growth of the treetops, so that the leaves and branches of adjacent trees do not touch each other, producing figures and patterns with the background sky when observing the trees from the ground. The shyness of the crown has been observed in certain species of European oak and pine, and species of tropical and subtropical habitats. The mechanism that gives rise to this phenomenon is attempted to be explained by the: (i) friction hypothesis: it indicates that the friction of some branches with others when the wind hits them would limit their growth to avoid touching neighboring trees, due to damage caused by abrasion; (ii) allelopathy hypothesis: indicates that the shyness of the crown has an allelopathic origin, that is, plants and trees communicate with each other through chemical signals; and (iii) photoreceptor hypotheses: they would provoke in the tree the response to move away from the adjacent one, and would allow it to obtain a greater amount of light for photosynthesis [11,128]. This line of research should analyze whether this phenomenon: (i) allows greater light penetration into the forest to carry out photosynthesis more efficiently; (ii) prevents branches and leaves from being damaged when struck against each other in the event of a storm or gusts of wind; (iii) prevents diseases, larvae and leaf-eating insects from spreading easily from one tree to another; or (iv) follows a collaborative relationship between species for survival, rather than competition [23,129].
- Satellite Fire Mapping: this future research direction seeks to empower people based on cartographic applications to minimize the effect of forest fires and hold those responsible for burning these forest stands accountable. In this sense, it seeks to: (i) track fire activity and impacts, combining real-time satellite data, high-resolution satellite images, detailed maps of land cover and concessions for key products such as palm oil and pulp, wood, weather conditions, and air quality data; (ii) show where fires occur; (iii) help authorities determine who could be responsible; (iv) collaborate with non-governmental organizations (NGOs) and national and local governments, speeding up the response time to fire [130,131].
- Topological Acoustic Sensing: sound wave topological insulators allow sound waves to move on their surface, but inside they are acoustic insulators. The potential of these materials could be applied in ultrasound technologies, or to improve ultrasound. In this type of solids, the sound signal remains robust and insensitive to the presence of noise caused by impurities and defects in the material. In the framework of this research, previous studies have detected that this acoustic insulator could act as an extremely robust waveguide, capable of radiating sound in a very narrow beam towards the far field. The development of mobile applications, sensors, camera traps or the acoustic monitoring system, which seek to combat hunting and illegal logging, in order to conserve the planet’s biodiversity, as well as to know in what situation a certain species is or how to manage a certain natural resource. This method is used in scientific research to determine the status of a species or a geographical area in terms of conservation [132]. In this sense, various study applications have begun to be implemented, such as the AudioMoth case, with the aim of designing techniques to monitor anthropogenic disturbances, which may be linked to illegal hunting of wildlife [133].
- Unsupervised Treetop Detector: concern about the need to increase crop yields, reduce the environmental impact of plant protection products and prevent the introduction and spread of quarantine diseases, arouses interest in developing legislative, scientific, and technical tools for the early detection of diseases. Likewise, current agriculture is torn between the need to increase agricultural production and growing environmental concern. The most sustainable way to meet these challenges is to increase crop yields through a sustainable use of inputs that, in the field of crop protection, is achieved by reducing losses caused by diseases, weeds, and pests. Furthermore, the appearance of new pests and diseases derived from the intensification of commercial exchanges has caused an economic, social, and environmental alarm. In the particular context of diseases, their early detection in the field is a valuable source of information for executing adequate disease management and control strategies that prevent the development and spread of pathogens. Conventional methods for detecting diseases, based on visual inspection of symptoms and damage in the field, are costly in time and resources. An alternative to these methods is remote sensing, with the aim of detecting symptoms in early stages of the development of diseases on a cover scale. In agricultural research in the field of remote sensing based on hyperspectral and thermal sensors, the derived applications have proven to be relevant for the detection of nutritional and water deficiencies, and for the early detection of diseases [134].
Starting from the reference conditions of the forest ecosystem to be analyzed, and to assess the significant changes that occur in it, these future lines of research should also answer questions such as:
- —
- How do the descriptors of the functioning of forest ecosystems vary in space?
- —
- How are forest ecosystems changing? What is the trend of change?
- —
- How has the ecosystem behaved in the last period analyzed with respect to the historical series?
- —
- What areas have had an abnormal behavior?
The answers to these questions will allow estimating the trends of the functional attributes, in addition to the temporal and special anomalies, and their extreme values in the forest ecosystem under study.
5. Conclusions
The objective of this study was to analyze the evolution of scientific production and research trends worldwide, over the last four decades, on remote sensing applied in the forest management to optimize ecosystem services. Applying a bibliometric technique to 2066 scientific articles published between 1976 and 2019, we find that scientific production has increased especially in the last five years, where 1040 articles have been published, which represents 50.34% of the total. In other words, more than half of the total articles have been published between 2015 and 2019, which confirms the relevance and global impact of this research topic in the academic and scientific community. The research areas identified as the most influential include Environmental Sciences, Agricultural and Biological Sciences and Earth and Planetary Sciences. We also identify key contributions to research in: (i) forest management; (ii) ecosystem service; (iii) environmental monitoring; (iv) satellite images; (v) satellite data; (vi) deforestation; and (vii) remote sensing.
Globally, research on remote sensing applied in the forest management to optimize ecosystem services continues to evolve, so this study has identified ten new directions in the research: (i) ecological sensitivity assessment; (ii) sustainable rural development; (iii) ecological conservation zone; (iv) ecological control buffer zone; (v) air pollution mitigation; (vi) contemporary political forest; (vii) cross border biophysical forest phenomena; (viii) satellite fire mapping; (ix) topological acoustic sensing; and (x) unsupervised treetop detector.
Likewise, this study proposes that, based on the reference conditions of a certain forest ecosystem, and by evaluating the significant changes that occur in it from remote sensing and forest management; the anomalous behavior of this ecosystem with respect to the historical series. In this way, it will be possible to estimate the trends of functional attributes, in addition to temporal and spatial deviations, and their extreme values in the forest ecosystem in question.
This study supposes an analysis of the scientific production, in addition to the identification of the main current lines of research, in the period 2011–2019, and the future directions on research in remote sensing applied in the forest management to optimize ecosystem services. The findings obtained are a complement to knowledge on this subject and allow establishing the relationship between technology and forests, to favor the decision-making process. In this manner, an optimized management of both research resources and their applications would be achieved.
However, the study has a set of limitations, which have conditioned the results obtained, and these could be considered as the basis for future research articles. Among these limitations, the Scopus database chosen to apply the methodology can be highlighted; the keywords selected to extract the sample of scientific articles; the study period; to the bibliometric methodology used; even the variables examined. It is also necessary to recognize that, using data mining, one could explore large databases and find repetitive patterns that explain the behavior of this data.
Finally, it should be noted that global research on remote sensing applied in the forest management to optimize ecosystem services shows an upward trend, derived both from the number of articles and from current and future lines of research. This indicates the interest increasingly accentuated by the academic and scientific community, mainly due to the multidisciplinary nature of the research field.
Author Contributions
Conceptualization, methodology, software, formal analysis, resources, data curation, and writing—original draft preparation, E.A.-S. and M.-D.G.-Z.; investigation, validation, writing—review and editing, visualization, supervision, project administration, E.A.-S., M.-D.G.-Z., E.L.-M., and E.V.-C.; funding acquisition, E.L.-M. and E.V.-C. All authors have read and agreed to the published version of the manuscript.
Funding
This research received no external funding.
Conflicts of Interest
The authors declare no conflict of interest.
References
- Xia, N.; Cheng, L.; Li, M. Mapping Urban Areas Using a Combination of Remote Sensing and Geolocation Data. Remote Sens. 2019, 11, 1470. [Google Scholar] [CrossRef] [Green Version]
- Rinaldi, F.; Jonsson, R. Accounting for uncertainty in forest management models. For. Ecol. Manag. 2020, 468, 118186. [Google Scholar] [CrossRef] [PubMed]
- Alan, M. Silviculture and tree breeding for planted forests. Eurasian J. For. Sci. 2020, 8, 74–83. [Google Scholar] [CrossRef]
- Zhu, Y.; Feng, Z.; Lu, J.; Liu, J. Estimation of Forest Biomass in Beijing (China) Using Multisource Remote Sensing and Forest Inventory Data. Forests 2020, 11, 163. [Google Scholar] [CrossRef] [Green Version]
- Koskikala, J.; Kukkonen, M.; Käyhkö, N. Mapping Natural Forest Remnants with Multi-Source and Multi-Temporal Remote Sensing Data for More Informed Management of Global Biodiversity Hotspots. Remote Sens. 2020, 12, 1429. [Google Scholar] [CrossRef]
- Boisvenue, C.; White, J. Information Needs of Next-Generation Forest Carbon Models: Opportunities for Remote Sensing Science. Remote Sens. 2019, 11, 463. [Google Scholar] [CrossRef] [Green Version]
- Mazzella, M.N.; Koprowski, J.L. Response to fire by a forest specialist in isolated montane forest. For. Ecol. Manag. 2020, 462, 117996. [Google Scholar] [CrossRef]
- Abad-Segura, E.; Batlles de la Fuente, A.; González-Zamar, M.-D.; Belmonte-Ureña, L.J. Effects of Circular Economy Policies on the Environment and Sustainable Growth: Worldwide Research. Sustainability 2020, 12, 5792. [Google Scholar] [CrossRef]
- Cochran, F.; Daniel, J.; Jackson, L.; Neale, A. Earth observation-based ecosystem services indicators for national and subnational reporting of the sustainable development goals. Remote Sens. Environ. 2020, 244, 111796. [Google Scholar] [CrossRef]
- Barbierato, E.; Bernetti, I.; Capecchi, I.; Saragosa, C. Integrating Remote Sensing and Street View Images to Quantify Urban Forest Ecosystem Services. Remote Sens. 2020, 12, 329. [Google Scholar] [CrossRef] [Green Version]
- Grinde, A.R.; Slesak, R.A.; D’Amato, A.W.; Palik, B.P. Effects of tree retention and woody biomass removal on bird and small mammal communities. For. Ecol. Manag. 2020, 465, 118090. [Google Scholar] [CrossRef]
- Zhao, C.; Lu, Z. Remote Sensing of Landslides—A Review. Remote Sens. 2018, 10, 279. [Google Scholar] [CrossRef] [Green Version]
- Chasmer, L.E.; Devito, K.J.; Hopkinson, C.D.; Petrone, R.M. Remote sensing of ecosystem trajectories as a proxy indicator for watershed water balance. Ecohydrology 2018, 11, e1987. [Google Scholar] [CrossRef]
- Wang, C.; Zhao, H. Analysis of remote sensing time-series data to foster ecosystem sustainability: Use of temporal information entropy. Int. J. Remote Sens. 2018, 40, 2880–2894. [Google Scholar] [CrossRef]
- Aravanopoulos, F. Do Silviculture and Forest Management Affect the Genetic Diversity and Structure of Long-Impacted Forest Tree Populations? Forests 2018, 9, 355. [Google Scholar] [CrossRef] [Green Version]
- Kumar, L.; Mutanga, O. Remote Sensing of Above-Ground Biomass. Remote Sens. 2017, 9, 935. [Google Scholar] [CrossRef] [Green Version]
- Pau, S.; Dee, L.E. Remote sensing of species dominance and the value for quantifying ecosystem services. Remote Sens. Ecol. Conserv. 2016, 2, 141–151. [Google Scholar] [CrossRef]
- Graf, R.F.; Mathys, L.; Bollmann, K. Habitat assessment for forest dwelling species using LiDAR remote sensing: Capercaillie in the Alps. For. Ecol. Manag. 2009, 257, 160–167. [Google Scholar] [CrossRef]
- Wulder, M.A.; Dymond, C.C.; White, J.C.; Leckie, D.G.; Carroll, A.L. Surveying mountain pine beetle damage of forests: A review of remote sensing opportunities. For. Ecol. Manag. 2006, 221, 27–41. [Google Scholar] [CrossRef]
- Aguilar, A. Remote Sensing of Forest Regeneration in Highland Tropical Forests. GI Sci. Remote Sens. 2005, 42, 66–79. [Google Scholar] [CrossRef]
- De Wasseige, C.; Defourny, P. Remote sensing of selective logging impact for tropical forest management. For. Ecol. Manag. 2004, 188, 161–173. [Google Scholar] [CrossRef]
- Myers, N. Tropical deforestation and remote sensing. For. Ecol. Manag. 1998, 23, 215–225. [Google Scholar] [CrossRef]
- Millette, T.L.; Tuladhar, A.R.; Kasperson, R.E.; Turner, B. The use and limits of remote sensing for analysing environmental and social change in the Himalayan Middle Mountains of Nepal. Glob. Environ. Chang. 1995, 5, 367–380. [Google Scholar] [CrossRef]
- Crespi, M.; Jürgens, C.; Maktav, D.; Jacobsen, K. 3D remote sensing and urban remote sensing. Int. J. Remote Sens. 2016, 37, 3437–3438. [Google Scholar] [CrossRef]
- Poon, P.; Kinoshita, A. Estimating Evapotranspiration in a Post-Fire Environment Using Remote Sensing and Machine Learning. Remote Sens. 2018, 10, 1728. [Google Scholar] [CrossRef] [Green Version]
- Matous, P.; Todo, Y. An experiment in strengthening the networks of remote communities in the face of environmental change: Leveraging spatially distributed environmental memory. Reg. Environ. Chang. 2018, 18, 1741–1752. [Google Scholar] [CrossRef] [Green Version]
- Bauer, M.E. Remote Sensing of Environment: History, Philosophy, Approach and Contributions, 1969–2019. Remote Sens. Environ. 2020, 237, 111522. [Google Scholar] [CrossRef]
- Del Río-Mena, T.; Willemen, L.; Vrieling, A.; Nelson, A. Understanding Intra-Annual Dynamics of Ecosystem Services Using Satellite Image Time Series. Remote Sens. 2020, 12, 710. [Google Scholar] [CrossRef] [Green Version]
- Belgiu, M.; Stein, A. Spatiotemporal Image Fusion in Remote Sensing. Remote Sens. 2019, 11, 818. [Google Scholar] [CrossRef] [Green Version]
- Huemmrich, K.F.; Campbell, P.; Landis, D.; Middleton, E. Developing a common globally applicable method for optical remote sensing of ecosystem light use efficiency. Remote Sens. Environ. 2019, 230, 111190. [Google Scholar] [CrossRef]
- Masoom, A.; Kosmopoulos, P.; Bansal, A.; Kazadzis, S. Solar Energy Estimations in India Using Remote Sensing Technologies and Validation with Sun Photometers in Urban Areas. Remote Sens. 2020, 12, 254. [Google Scholar] [CrossRef] [Green Version]
- Imbriaco, R.; Sebastian, C.; Bondarev, E.; de With, P. Aggregated Deep Local Features for Remote Sensing Image Retrieval. Remote Sens. 2019, 11, 493. [Google Scholar] [CrossRef] [Green Version]
- Im, J.; Park, H.; Takeuchi, W. Advances in Remote Sensing-Based Disaster Monitoring and Assessment. Remote Sens. 2019, 11, 2181. [Google Scholar] [CrossRef] [Green Version]
- Zhou, G.; Wei, H.; Fu, S. A fast and simple algorithm for calculating flow accumulation matrices from raster digital elevation. Front. Earth Sci. 2019, 13, 317–326. [Google Scholar] [CrossRef]
- Li, C.; Liu, X.; Lu, W. An Image-Pyramid-Based Raster-to-Vector Conversion (IPBRTVC) Framework for Consecutive-Scale Cartography and Synchronized Generalization of Classic Objects. Photogramm. Eng. Remote Sens. 2019, 85, 169–178. [Google Scholar] [CrossRef]
- Nijland, W.; Reshitnyk, L.; Rubidge, E. Satellite remote sensing of canopy-forming kelp on a complex coastline: A novel procedure using the Landsat image archive. Remote Sens. Environ. 2019, 220, 41–50. [Google Scholar] [CrossRef]
- Razavi-Termeh, S.V.; Sadeghi-Niaraki, A.; Choi, S.-M. Ubiquitous GIS-Based Forest Fire Susceptibility Mapping Using Artificial Intelligence Methods. Remote Sens. 2020, 12, 1689. [Google Scholar] [CrossRef]
- Abedi Gheshlaghi, H. Using GIS to Develop a Model for Forest Fire Risk Mapping. J. Indian Soc. Remote Sens. 2019, 47, 1173–1185. [Google Scholar] [CrossRef]
- Ghorai, D.; Mahapatra, M. Extracting Shoreline from Satellite Imagery for GIS Analysis. Remote Sens. Earth Syst. Sci. 2020, 3, 13–22. [Google Scholar] [CrossRef]
- Ahmad, F.; Uddin, M.M.; Goparaju, L. Analysis of forest health and socioeconomic dimension in climate change scenario and its future impacts: Remote sensing and GIS approach. Spat. Inf. Res. 2019, 27, 385–397. [Google Scholar] [CrossRef]
- Fujisawa, H. The forest planning system in relation to the forest resource and forestry policies. J. For. Res. 2004, 9, 1–5. [Google Scholar] [CrossRef]
- Reise, J.; Kukulka, F.; Flade, M.; Winter, S. Characterising the richness and diversity of forest bird species using National Forest Inventory data in Germany. For. Ecol. Manag. 2019, 432, 799–811. [Google Scholar] [CrossRef]
- Hein, J.; Guarin, A.; Frommé, E.; Pauw, P. Deforestation and the Paris climate agreement: An assessment of REDD + in the national climate action plans. For. Policy Econ. 2018, 90, 7–11. [Google Scholar] [CrossRef]
- Geden, O. The Paris Agreement and the inherent inconsistency of climate policymaking. Wiley Interdiscip. Rev. Clim. Chang. 2016, 7, 790–797. [Google Scholar] [CrossRef]
- Yamada, Y. Can a regional-level forest management policy achieve sustainable forest management? For. Policy Econ. 2018, 90, 82–89. [Google Scholar] [CrossRef]
- Barbati, A.; Marchetti, M.; Chirici, G.; Corona, P. European Forest Types and Forest Europe SFM indicators: Tools for monitoring progress on forest biodiversity conservation. For. Ecol. Manag. 2014, 321, 145–157. [Google Scholar] [CrossRef] [Green Version]
- Meng, Y.; Cao, B.; Dong, C.; Dong, X. Mount Taishan Forest Ecosystem Health Assessment Based on Forest Inventory Data. Forests 2019, 10, 657. [Google Scholar] [CrossRef] [Green Version]
- Sugiura, K.; Sonohara, W. Application of an Adaptive Forest Management Simulation Model Based on Zoning in a Man-Made Forest. Forests 2019, 10, 482. [Google Scholar] [CrossRef] [Green Version]
- Schwaiger, F.; Poschenrieder, W.; Biber, P.; Pretzsch, H. Ecosystem service trade-offs for adaptive forest management. Ecosyst. Serv. 2019, 39, 100993. [Google Scholar] [CrossRef]
- Madeley, J. The United Nations Conference on Environment and Development (UNCED). Land Use Policy 1992, 9, 300–302. [Google Scholar] [CrossRef]
- Dompka, V. Environment and the United Nations World Population Conference. J. Environ. Dev. 1995, 4, 155–169. [Google Scholar] [CrossRef]
- Johnson, T.; Rickard, V. United Nations, Uniting Nations: International Support Cues and American Attitudes on Environmental Sustainability. Soc. Sci. Q. 2017, 98, 876–893. [Google Scholar] [CrossRef]
- Ekholm, T. Optimal forest rotation under carbon pricing and forest damage risk. For. Policy Econ. 2020, 115, 102131. [Google Scholar] [CrossRef] [Green Version]
- Baycheva-Merger, T.; Sotirov, M. The politics of an EU forest information system: Unpacking distributive conflicts associated with the use of forest information. For. Policy Econ. 2020, 112, 102110. [Google Scholar] [CrossRef]
- Zhao, Q.; Li, J.; Cuan, Y.; Zhou, Z. The Evolution Response of Ecosystem Cultural Services under Different Scenarios Based on System Dynamics. Remote Sens. 2020, 12, 418. [Google Scholar] [CrossRef] [Green Version]
- Kogo, B.K.; Kumar, L.; Koech, R. Forest cover dynamics and underlying driving forces affecting ecosystem services in western Kenya. Remote Sens. Appl. Soc. Environ. 2019, 14, 75–83. [Google Scholar] [CrossRef]
- Vargas, L.; Willemen, L.; Hein, L. Assessing the Capacity of Ecosystems to Supply Ecosystem Services Using Remote Sensing and An Ecosystem Accounting Approach. Environ. Manag. 2018, 63, 1–15. [Google Scholar] [CrossRef] [Green Version]
- Wu, J.; Liang, S. Assessing Terrestrial Ecosystem Resilience using Satellite Leaf Area Index. Remote Sens. 2020, 12, 595. [Google Scholar] [CrossRef] [Green Version]
- Zhu, J.; Huang, Z.; Sun, H.; Wang, G. Mapping Forest Ecosystem Biomass Density for Xiangjiang River Basin by Combining Plot and Remote Sensing Data and Comparing Spatial Extrapolation Methods. Remote Sens. 2017, 9, 241. [Google Scholar] [CrossRef] [Green Version]
- Rojas, O. Agricultural extreme drought assessment at global level using the FAO-Agricultural Stress Index System (ASIS). Weather Clim. Extrem. 2020, 27, 100184. [Google Scholar] [CrossRef]
- Benjaminsson, F.; Kronholm, T.; Erlandsson, E. A framework for characterizing business models applied by forestry service contractors. Scand. J. For. Res. 2019, 34, 779–788. [Google Scholar] [CrossRef] [Green Version]
- Balzarolo, M.; Peñuelas, J.; Filella, I.; Portillo-Estrada, M.; Ceulemans, R. Assessing Ecosystem Isoprene Emissions by Hyperspectral Remote Sensing. Remote Sens. 2018, 10, 1086. [Google Scholar] [CrossRef] [Green Version]
- Weitzman, J. Applying the ecosystem services concept to aquaculture: A review of approaches, definitions, and uses. Ecosyst. Serv. 2019, 35, 194–206. [Google Scholar] [CrossRef]
- Cabana, D.; Ryfield, F.; Crowe, T.P.; Brannigan, J. Evaluating and communicating cultural ecosystem services. Ecosyst. Serv. 2020, 42, 101085. [Google Scholar] [CrossRef]
- Rölfer, L.; Winter, G.; Máñez Costa, M.; Celliers, L. Earth observation and coastal climate services for small islands. Clim. Serv. 2020, 18, 100168. [Google Scholar] [CrossRef]
- Dangles, O.; Casas, J. Ecosystem services provided by insects for achieving sustainable development goals. Ecosyst. Serv. 2019, 35, 109–115. [Google Scholar] [CrossRef]
- McVittie, A.; Faccioli, M. Biodiversity and ecosystem services net gain assessment: A comparison of metrics. Ecosyst. Serv. 2020, 44, 101145. [Google Scholar] [CrossRef]
- Huang, X.; Li, S.; Su, J.; Liu, W.; Lang, X. The relationship between species richness and ecosystem multifunctionality in the Pinus yunnanensis natural secondary forest. Biodivers. Sci. 2017, 25, 1182–1191. [Google Scholar] [CrossRef] [Green Version]
- Laine, A.M.; Bubier, J.; Riutta, T.; Nilsson, M.B.; Moore, T.R.; Vasander, H.; Tuittila, E.-S. Abundance and composition of plant biomass as potential controls for mire net ecosytem CO2exchange. Botany 2012, 90, 63–74. [Google Scholar] [CrossRef] [Green Version]
- Farley, J. Ecosystem services: The economics debate. Ecosyst. Serv. 2012, 1, 40–49. [Google Scholar] [CrossRef] [Green Version]
- Hendee, J.T.; Flint, C.G. Incorporating Cultural Ecosystem Services into Forest Management Strategies for Private Landowners: An Illinois Case Study. For. Sci. 2014, 60, 1172–1179. [Google Scholar] [CrossRef] [Green Version]
- Ovando, P.; Brouwer, R. A review of economic approaches modeling the complex interactions between forest management and watershed services. For. Policy Econ. 2019, 100, 164–176. [Google Scholar] [CrossRef]
- Tadesse, G.; Zavaleta, E.; Shennan, C.; FitzSimmons, M. Prospects for forest-based ecosystem services in forest-coffee mosaics as forest loss continues in southwestern Ethiopia. Appl. Geogr. 2014, 50, 144–151. [Google Scholar] [CrossRef] [Green Version]
- Komeil, J.; Hamid, A.; Zahra, A.; Alireza, V. Estimation of the value of forest ecosystem services to develop conservational strategy management (strengths, weaknesses, opportunities and threats). J. For. Sci. 2017, 63, 300–312. [Google Scholar] [CrossRef] [Green Version]
- Prathap, G. Eugene Garfield: From the metrics of science to the science of metrics. Scientometrics 2017, 114, 637–650. [Google Scholar] [CrossRef]
- Nicolaisen, J.; Frandsen, T.F. Bibliometric evolution: Is the journal of the association for information science and technology transforming into a specialty Journal? J. Assoc. Inf. Sci. Technol. 2014, 66, 1082–1085. [Google Scholar] [CrossRef] [Green Version]
- Aksu, G.; Güzeller, C.O. Analysis of Scientific Studies on Item Response Theory by Bibliometric Analysis Method. Int. J. Progress. Educ. 2019, 15, 44–64. [Google Scholar] [CrossRef]
- Prathap, G. Quantity, quality, and consistency as bibliometric indicators. J. Assoc. Inf. Sci. Technol. 2013, 65, 214. [Google Scholar] [CrossRef]
- Van den Besselaar, P.; Sandström, U. Measuring researcher independence using bibliometric data: A proposal for a new performance indicator. PLoS ONE 2019, 14, e0202712. [Google Scholar] [CrossRef] [Green Version]
- Abad-Segura, E.; González-Zamar, M.-D. Global Research Trends in Financial Transactions. Mathematics 2020, 8, 614. [Google Scholar] [CrossRef]
- Shen, B.; Li, Y. Analysis of co-occurrence networks with clique occurrence information. Int. J. Mod. Phys. C 2014, 25, 1440015. [Google Scholar] [CrossRef]
- Efremenkova, V.M.; Gonnova, S.M. A comparison of Scopus and WoS database subject classifiers in mathematical disciplines. Scientific and Technical Information. Processing 2016, 43, 115–122. [Google Scholar] [CrossRef]
- Franceschini, F.; Maisano, D.; Mastrogiacomo, L. Do Scopus and WoS correct “old” omitted citations? Scientometrics 2016, 107, 321–335. [Google Scholar] [CrossRef]
- Liberati, A.; Altman, D.G.; Tetzlaff, J.; Mulrow, C.; Gøtzsche, P.C.; Ioannidis, J.P.A.; Moher, D. The PRISMA Statement for Reporting Systematic Reviews and Meta-Analyses of Studies That Evaluate Health Care Interventions: Explanation and Elaboration. PLoS Med. 2009, 6, e1000100. [Google Scholar] [CrossRef]
- Abad-Segura, E.; González-Zamar, M.-D.; Infante-Moro, J.C.; Ruipérez García, G. Sustainable Management of Digital Transformation in Higher Education: Global Research Trends. Sustainability 2020, 12, 2107. [Google Scholar] [CrossRef] [Green Version]
- Belmonte-Ureña, L.J.; Garrido-Cardenas, J.A.; Camacho-Ferre, F. Analysis of World Research on Grafting in Horticultural Plants. HortScience 2020, 55, 112–120. [Google Scholar] [CrossRef]
- González-Zamar, M.D.; Ortiz Jiménez, L.; Sánchez Ayala, A.; Abad-Segura, E. The Impact of the University Classroom on Managing the Socio-Educational Well-being: A Global Study. Int. J. Environ. Res. Public Health 2020, 17, 931. [Google Scholar] [CrossRef] [Green Version]
- Durda, K.; Buchanan, L.; Caron, R. Grounding co-occurrence: Identifying features in a lexical co-occurrence model of semantic memory. Behav. Res. Methods 2009, 41, 1210–1223. [Google Scholar] [CrossRef]
- Brodić, D.; Milivojević, Z.N.; Maluckov, Č.A. Recognition of the Script in Serbian Documents Using Frequency Occurrence and Co-Occurrence Analysis. Sci. World J. 2013, 2013, 1–14. [Google Scholar] [CrossRef]
- Kimbrough, D.E.; Parekh, P. Occurrence and co-occurrence of perchlorate and nitrate in California drinking water sources. J. Am. Water Works Assoc. 2007, 99, 126–132. [Google Scholar] [CrossRef]
- Ravikumar, S.; Agrahari, A.; Singh, S.N. Mapping the intellectual structure of scientometrics: A co-word analysis of the journal Scientometrics (2005–2010). Scientometrics 2015, 102, 929–955. [Google Scholar] [CrossRef]
- Chen, G.-B.; Kao, H.-Y. Word co-occurrence augmented topic model in short text. Intell. Data Anal. 2017, 21, S55–S70. [Google Scholar] [CrossRef] [Green Version]
- Van Eck, N.J.; Waltman, L. Citation-based clustering of publications using CitNetExplorer and VOSviewer. Scientometrics 2017, 111, 1053–1070. [Google Scholar] [CrossRef] [Green Version]
- Lee, C.I.S.; Felps, W.; Baruch, Y. Mapping Career Studies: A Bibliometric Analysis. Acad. Manag. Proc. 2014, 2014, 14214. [Google Scholar] [CrossRef]
- Waltman, L.; van Eck, N.J. A new methodology for constructing a publication-level classification system of science. J. Am. Soc. Inf. Sci. Technol. 2012, 63, 2378–2392. [Google Scholar] [CrossRef] [Green Version]
- Van Eck, N.J.; Waltman, L. Software survey: VOSviewer, a computer program for bibliometric mapping. Scientometrics 2009, 84, 523–538. [Google Scholar] [CrossRef] [PubMed] [Green Version]
- Boyack, K.; Glänzel, W.; Gläser, J.; Havemann, F.; Scharnhorst, A.; Thijs, B.; Waltmann, L. Topic identification challenge. Scientometrics 2017, 111, 1223–1224. [Google Scholar] [CrossRef]
- Van Eck, N.J.; Waltman, L.; Noyons, E.C.M.; Buter, R.K. Automatic term identification for bibliometric mapping. Scientometrics 2010, 82, 581–596. [Google Scholar] [CrossRef] [Green Version]
- Cox, T.; Hitchcock, H.; Weber, S. Processing Remotely Sensed Data for Dimensional Analysis. IEEE Trans. Geosci. Electron. 1976, 14, 55–59. [Google Scholar] [CrossRef] [Green Version]
- Jung, M.; Reichstein, M.; Ciais, P.; Seneviratne, S.I.; Sheffield, J.; Goulden, M.L.; Zhang, K. Recent decline in the global land evapotranspiration trend due to limited moisture supply. Nature 2010, 467, 951–954. [Google Scholar] [CrossRef]
- Feng, X.; Fu, B.; Yang, X.; Lü, Y. Remote sensing of ecosystem services: An opportunity for spatially explicit assessment. Chin. Geogr. Sci. 2010, 20, 522–535. [Google Scholar] [CrossRef] [Green Version]
- Zabor, L. Perception of Uniqueness and the Acquisition of the English Article System. Belgrade Engl. Lang. Lit. Stud. 2011, 3, 63–86. [Google Scholar] [CrossRef] [Green Version]
- Xu, H.; Twine, T.; Yang, X. Evaluating Remotely Sensed Phenological Metrics in a Dynamic Ecosystem Model. Remote Sens. 2014, 6, 4660–4686. [Google Scholar] [CrossRef] [Green Version]
- Okhrimenko, M.; Hopkinson, C. Investigating the Consistency of Uncalibrated Multispectral Lidar Vegetation Indices at Different Altitudes. Remote Sens. 2019, 11, 1531. [Google Scholar] [CrossRef] [Green Version]
- Fu, K.; Chen, Z.; Zhang, Y.; Sun, X. Enhanced Feature Representation in Detection for Optical Remote Sensing Images. Remote Sens. 2019, 11, 2095. [Google Scholar] [CrossRef] [Green Version]
- Levizzani, V.; Cattani, E. Satellite Remote Sensing of Precipitation and the Terrestrial Water Cycle in a Changing Climate. Remote Sens. 2019, 11, 2301. [Google Scholar] [CrossRef] [Green Version]
- Shrivastava, R.J.; Gebelein, J.L. Land cover classification and economic assessment of citrus groves using remote sensing. ISPRS J. Photogramm. Remote Sens. 2007, 61, 341–353. [Google Scholar] [CrossRef]
- Mohren, G.M.J. Large-scale scenario analysis in forest ecology and forest management. For. Policy Econ. 2003, 5, 103–110. [Google Scholar] [CrossRef]
- Quoc Vo, T.; Kuenzer, C.; Oppelt, N. How remote sensing supports mangrove ecosystem service valuation: A case study in Ca Mau province, Vietnam. Ecosyst. Serv. 2015, 14, 67–75. [Google Scholar] [CrossRef]
- Coulby, G.; Clear, A.; Jones, O.; Godfrey, A. A Scoping Review of Technological Approaches to Environmental Monitoring. Int. J. Environ. Res. Public Health 2020, 17, 3995. [Google Scholar] [CrossRef]
- Baban, S.M.J.; Luke, C. Mapping agricultural land use using retrospective ground referenced data, satellite sensor imagery and GIS. Int. J. Remote Sens. 2000, 21, 1757–1762. [Google Scholar] [CrossRef]
- Gao, X.; Liang, S.; He, B. Detected global agricultural greening from satellite data. Agric. For. Meteorol. 2019, 276–277, 107652. [Google Scholar] [CrossRef]
- Stropp, J.; Umbelino, B.; Correia, R.A.; Campos-Silva, J.V.; Ladle, R.J.; Malhado, A.C.M. The ghosts of forests past and future: Deforestation and botanical sampling in the Brazilian Amazon. Ecography 2020, 43, 979–989. [Google Scholar] [CrossRef] [Green Version]
- Ding, Z.; Yao, S. Theoretical analysis and model design of search for ecological conservation redlines based on the sensitivity assessment of ecosystem services. Land Use Policy 2020, 97, 104745. [Google Scholar] [CrossRef]
- Allanina, L.M. Sustainable Development of Rural Areas: Increasing Employment in the Context of Digital Technologies Development. J. Adv. Res. Dyn. Control Syst. 2020, 12, 1069–1076. [Google Scholar] [CrossRef]
- Riva, F.; Colombo, E. System-dynamics modelling of the electricity-development nexus in rural electrification based on a Tanzanian case study. Energy Sustain. Dev. 2020, 56, 128–143. [Google Scholar] [CrossRef]
- The Intergovernmental Science-Policy Platform on Biodiversity and Ecosystem Services (IPBES). Available online: https://ipbes.net/ (accessed on 26 July 2020).
- World Health Organization. Health and the Environment. Available online: https://www.who.int/westernpacific/about/how-we-work/programmes/health-and-the-environment#:~:text=The%20mandate%20of%20WHO’s%20Health,or%20hazardous%20waste%20and%20chemicals (accessed on 25 July 2020).
- Zanotti, L.; Knowles, N. Large intact forest landscapes and inclusive conservation: A political ecological perspective. J. Political Ecol. 2020, 27, 539–557. [Google Scholar] [CrossRef]
- Gasior, K.; Forest, M.G.; Gladfelter, A.S.; Newby, J. Mathematically Modeling Mechanisms of Molecular Identity in Biomolecular Condensates. Biophys. J. 2020, 118, 304a. [Google Scholar] [CrossRef]
- Moon, M.; Li, D.; Liao, W.; Rigden, A.J.; Friedl, M.A. Modification of surface energy balance during springtime: The relative importance of biophysical and meteorological changes. Agric. For. Meteorol. 2020, 284, 107905. [Google Scholar] [CrossRef]
- Worldview—Earthdata—NASA. Available online: https://worldview.earthdata.nasa.gov/ (accessed on 25 July 2020).
- The European Forest Fire Information System (EFFIS). Available online: https://effis.jrc.ec.europa.eu/static/effis_current_situation/public/index.html (accessed on 25 July 2020).
- Lata, T.D.; Deymier, P.A.; Runge, K.; Le Tourneau, F.-M.; Ferrière, R.; Huettmann, F. Topological acoustic sensing of spatial patterns of trees in a model forest landscape. Ecol. Model. 2020, 419, 108964. [Google Scholar] [CrossRef]
- Hill, A.P.; Prince, P.; Piña Covarrubias, E.; Doncaster, C.P.; Snaddon, J.L.; Rogers, A. AudioMoth: Evaluation of a smart open acoustic device for monitoring biodiversity and the environment. Methods Ecol. Evol. 2018, 9, 1199–1211. [Google Scholar] [CrossRef] [Green Version]
- Gong, M.; Duan, Y.; Li, H. Group Self-Paced Learning with a Time-Varying Regularizer for Unsupervised Change Detection. IEEE Trans. Geosci. Remote Sens. 2020, 58, 2481–2493. [Google Scholar] [CrossRef]
- Li, W.; Chen, J.; Zhang, Z. Forest quality-based assessment of the Returning Farmland to Forest Program at the community level in SW China. For. Ecol. Manag. 2020, 461, 117938. [Google Scholar] [CrossRef]
- De Valck, J.; Beames, A.; Liekens, I.; Bettens, M.; Seuntjens, P.; Broekx, S. Valuing urban ecosystem services in sustainable brownfield redevelopment. Ecosyst. Serv. 2019, 35, 139–149. [Google Scholar] [CrossRef]
- Gounand, I.; Little, C.J.; Harvey, E.; Altermatt, F. Global quantitative synthesis of ecosystem functioning across climatic zones and ecosystem types. Glob. Ecol. Biogeogr. 2020, 29, 1139–1176. [Google Scholar] [CrossRef]
- Jones, L.; Norton, L.; Austin, Z.; Browne, A.L.; Donovan, D.; Emmett, B.A.; Willis, G.F. Stocks and flows of natural and human-derived capital in ecosystem services. Land Use Policy 2016, 52, 151–162. [Google Scholar] [CrossRef]
- Liu, S. Sustainability of United Nations Recruitment: An Empirical Analysis of Recent Vacancy Advertisements of United Nations Specialized Agencies. Eur. J. Sustain. Dev. 2020, 9, 31. [Google Scholar] [CrossRef]
- Constantinou, C.M.; Hadjimichael, M.; Eftychiou, E. Ambivalent greenings, collateral conservation: Negotiating ecology in a United Nations buffer zone. Political Geogr. 2020, 77, 102096. [Google Scholar] [CrossRef]
- Salazar, S.; Coffman, R. Multi-Channel Optical Receiver for Ground-Based Topographic Hyperspectral Remote Sensing. Remote Sens. 2019, 11, 578. [Google Scholar] [CrossRef] [Green Version]
- Xu, C.; Du, X.; Yan, Z.; Fan, X. ScienceEarth: A Big Data Platform for Remote Sensing Data Processing. Remote Sens. 2020, 12, 607. [Google Scholar] [CrossRef] [Green Version]
Figure 1.
Flowchart: selection of the sample of articles based on Preferred Reporting Items for Systematic Reviews and Meta-Analyzes (PRISMA).
Figure 1.
Flowchart: selection of the sample of articles based on Preferred Reporting Items for Systematic Reviews and Meta-Analyzes (PRISMA).

Figure 2.
Evolution of Scientific Production. Number of articles per year (1976–2019).

Figure 3.
Top 15 Subject areas by period (1980–2019).

Figure 4.
Network of keywords based on co-occurrence method (1976–2019).

Figure 5.
Links of “Remote Sensing” keyword (1976–2019).

Figure 6.
Links of “Forest Management” keyword (1976–2019).

Figure 7.
Links of “Ecosystem Service” keyword (1976–2019).

Figure 8.
Evolution of keywords network based on co-occurrence method (1976–2019).


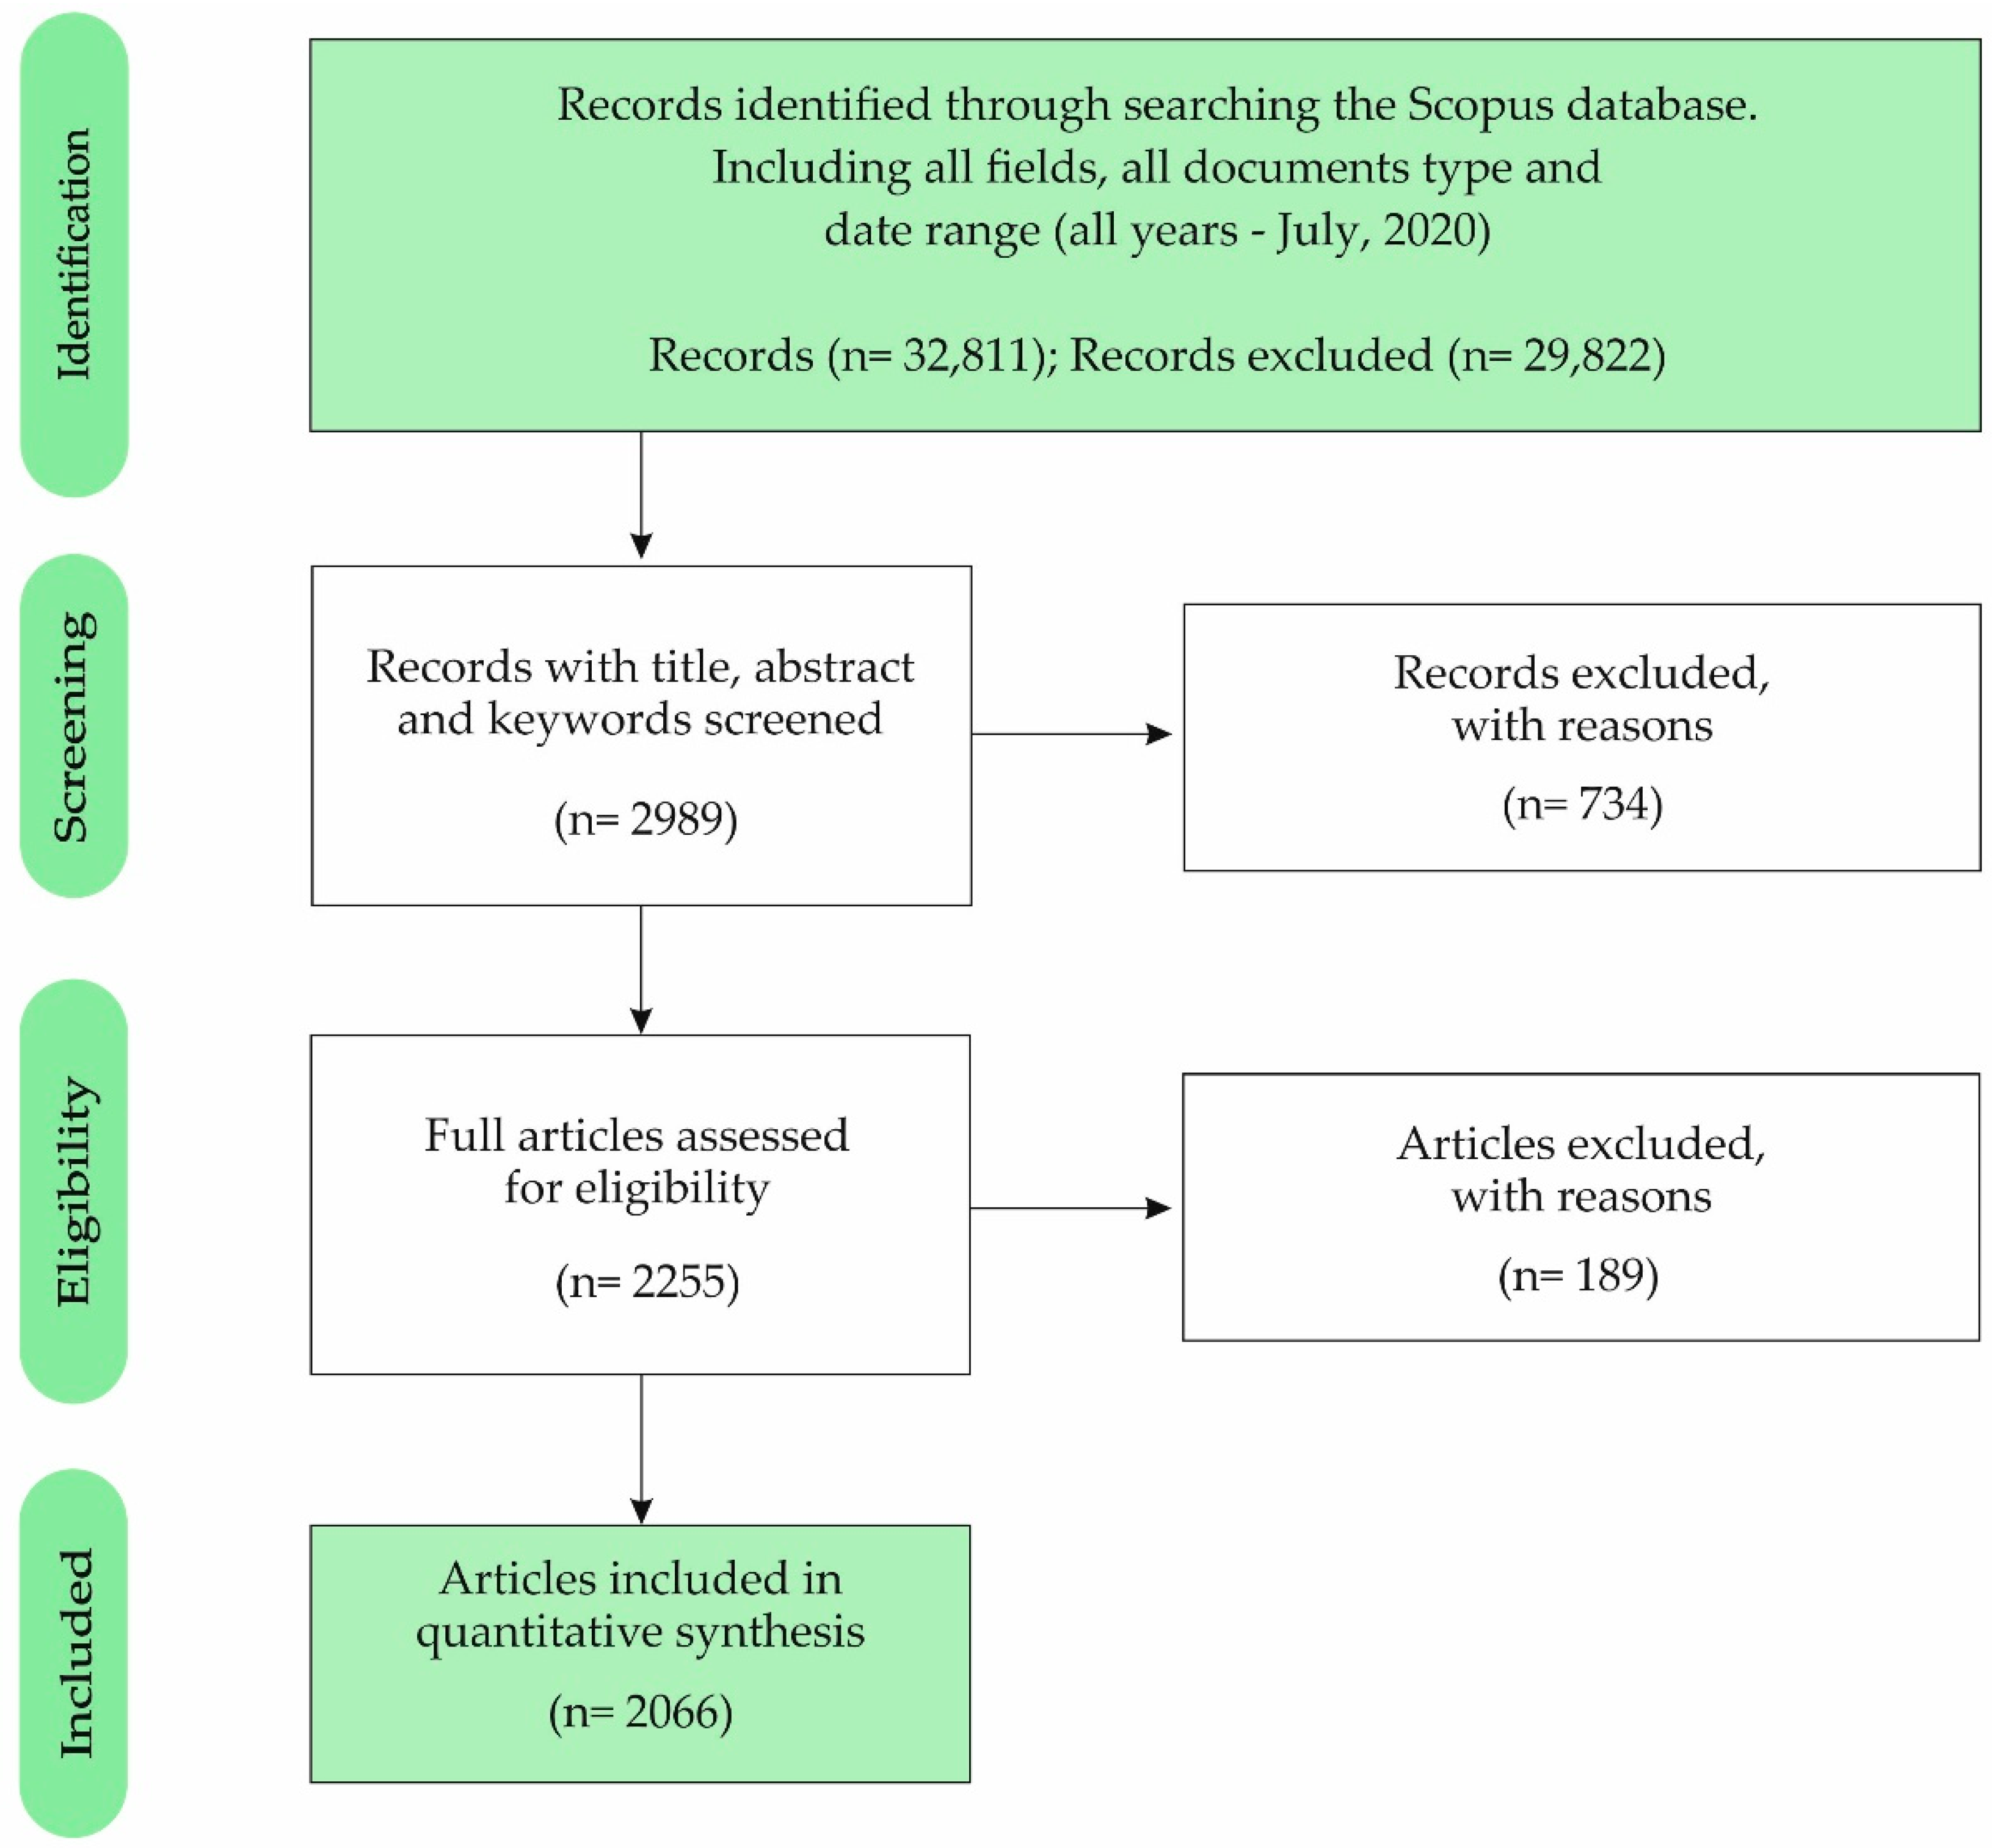
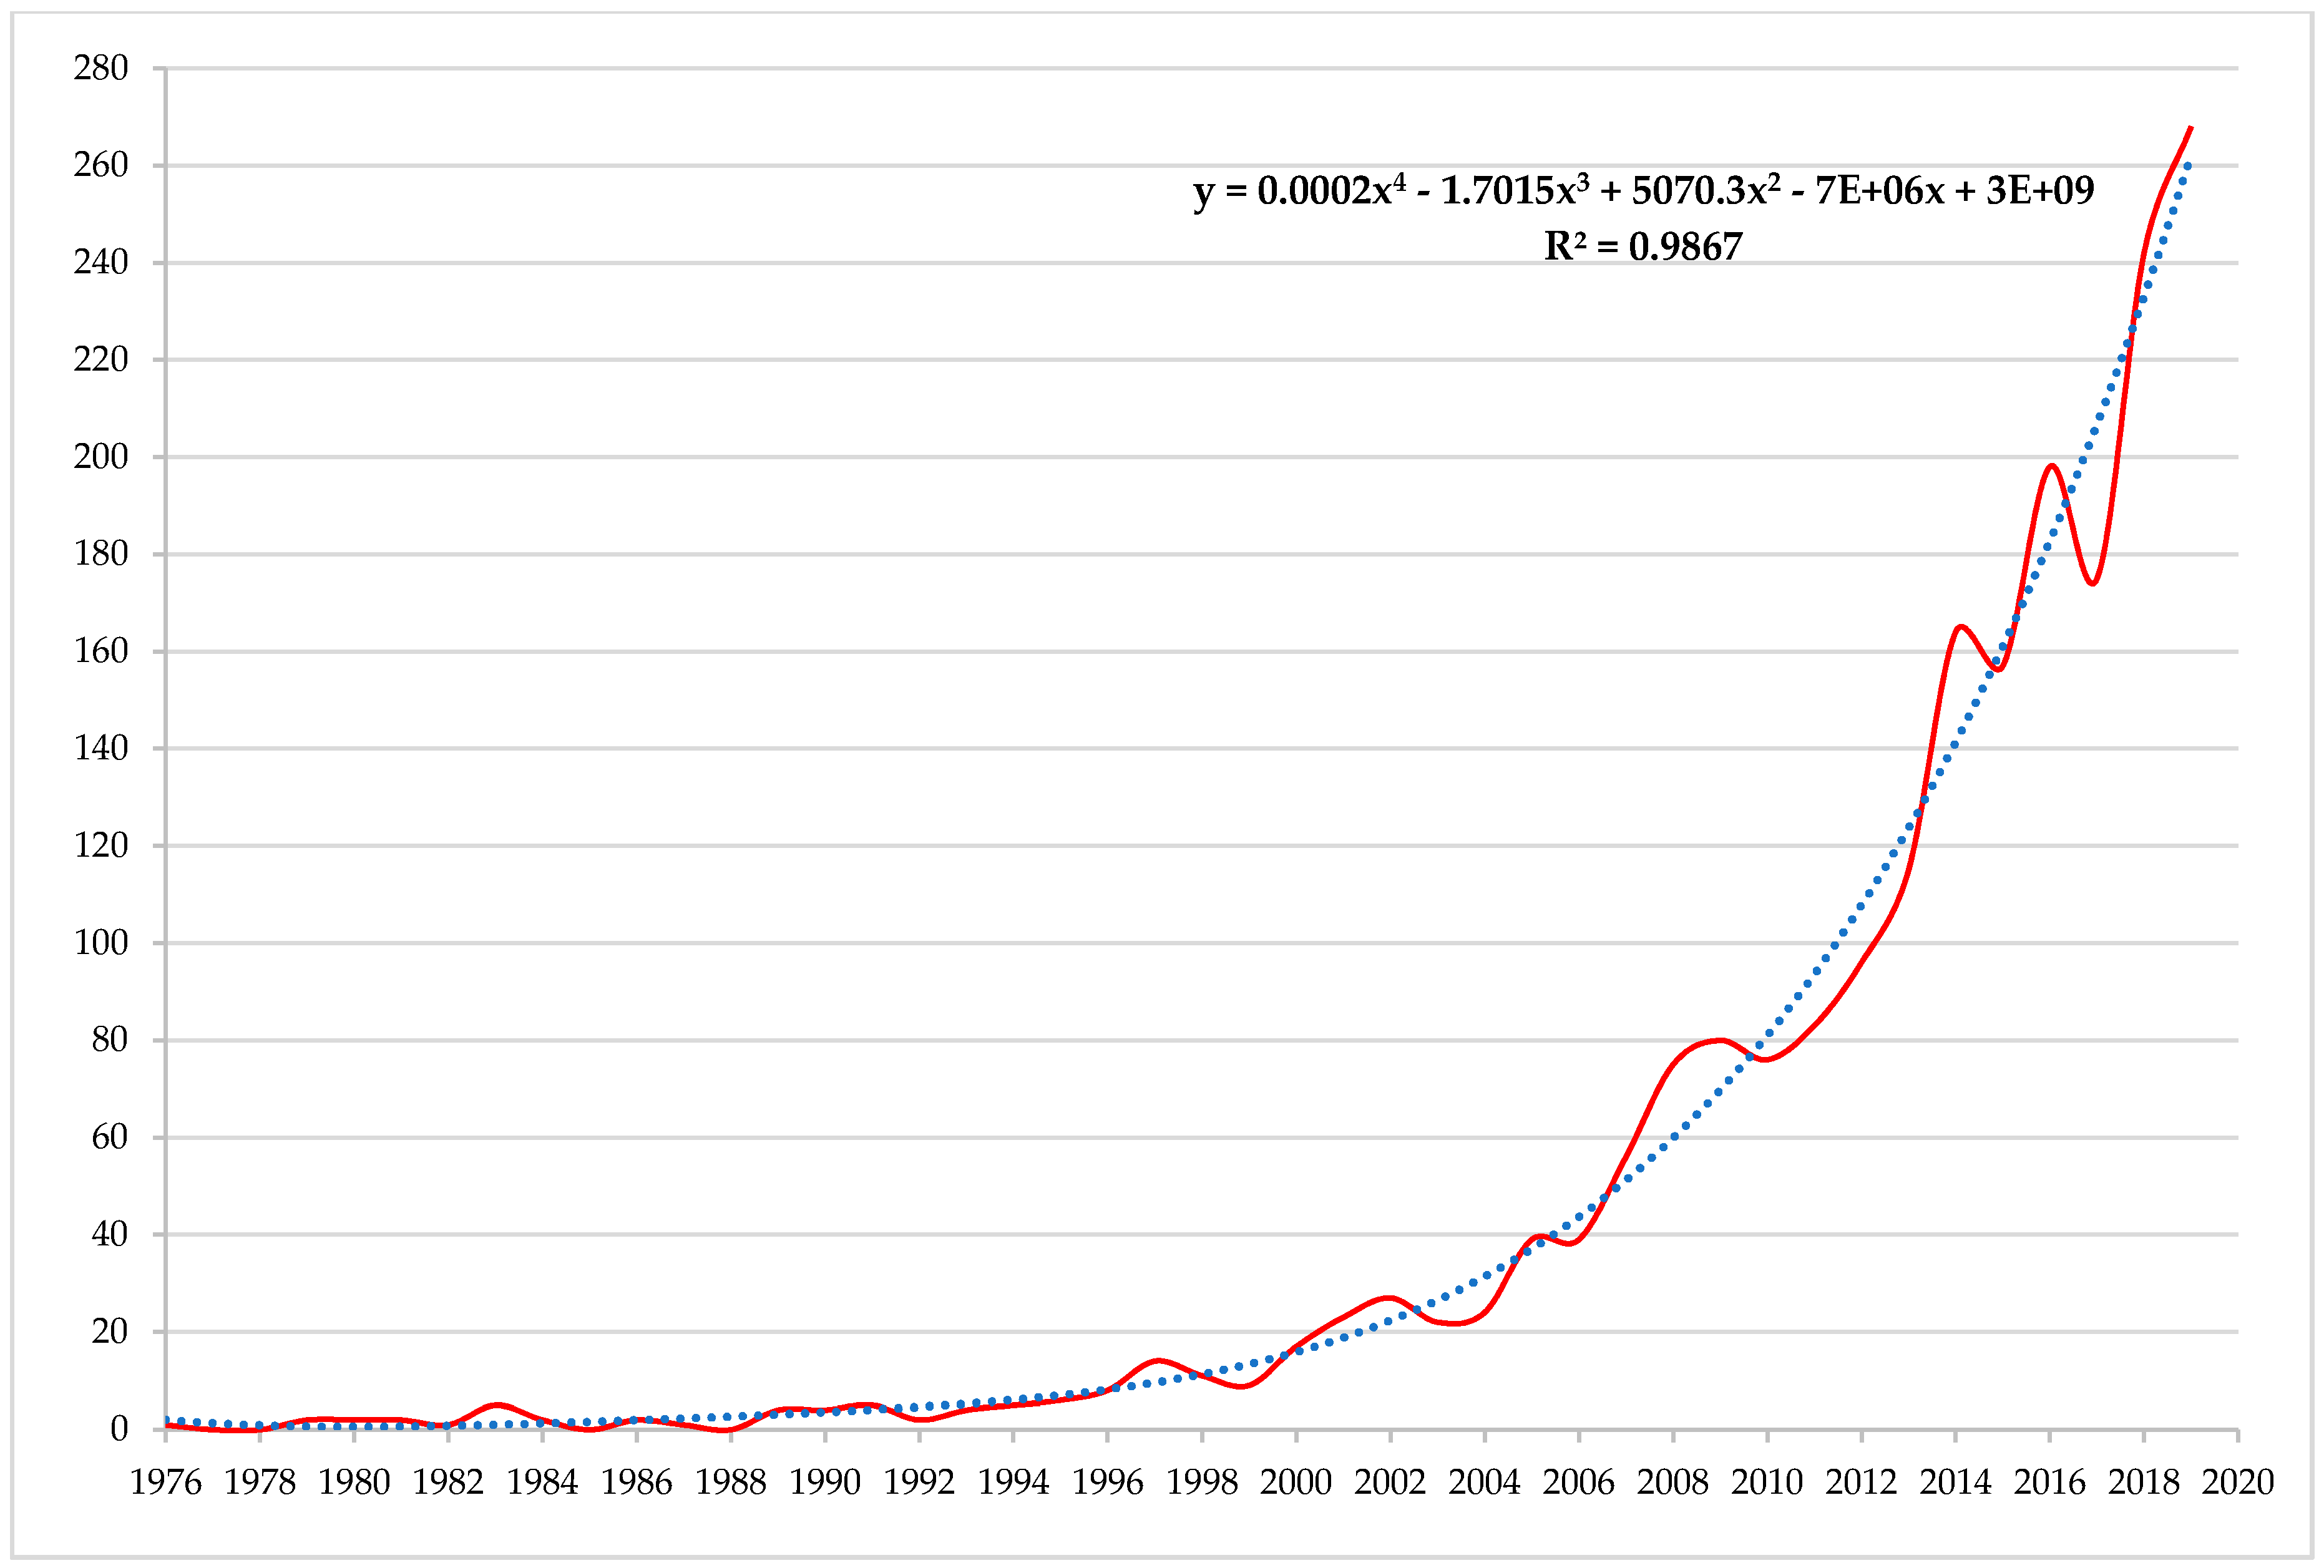
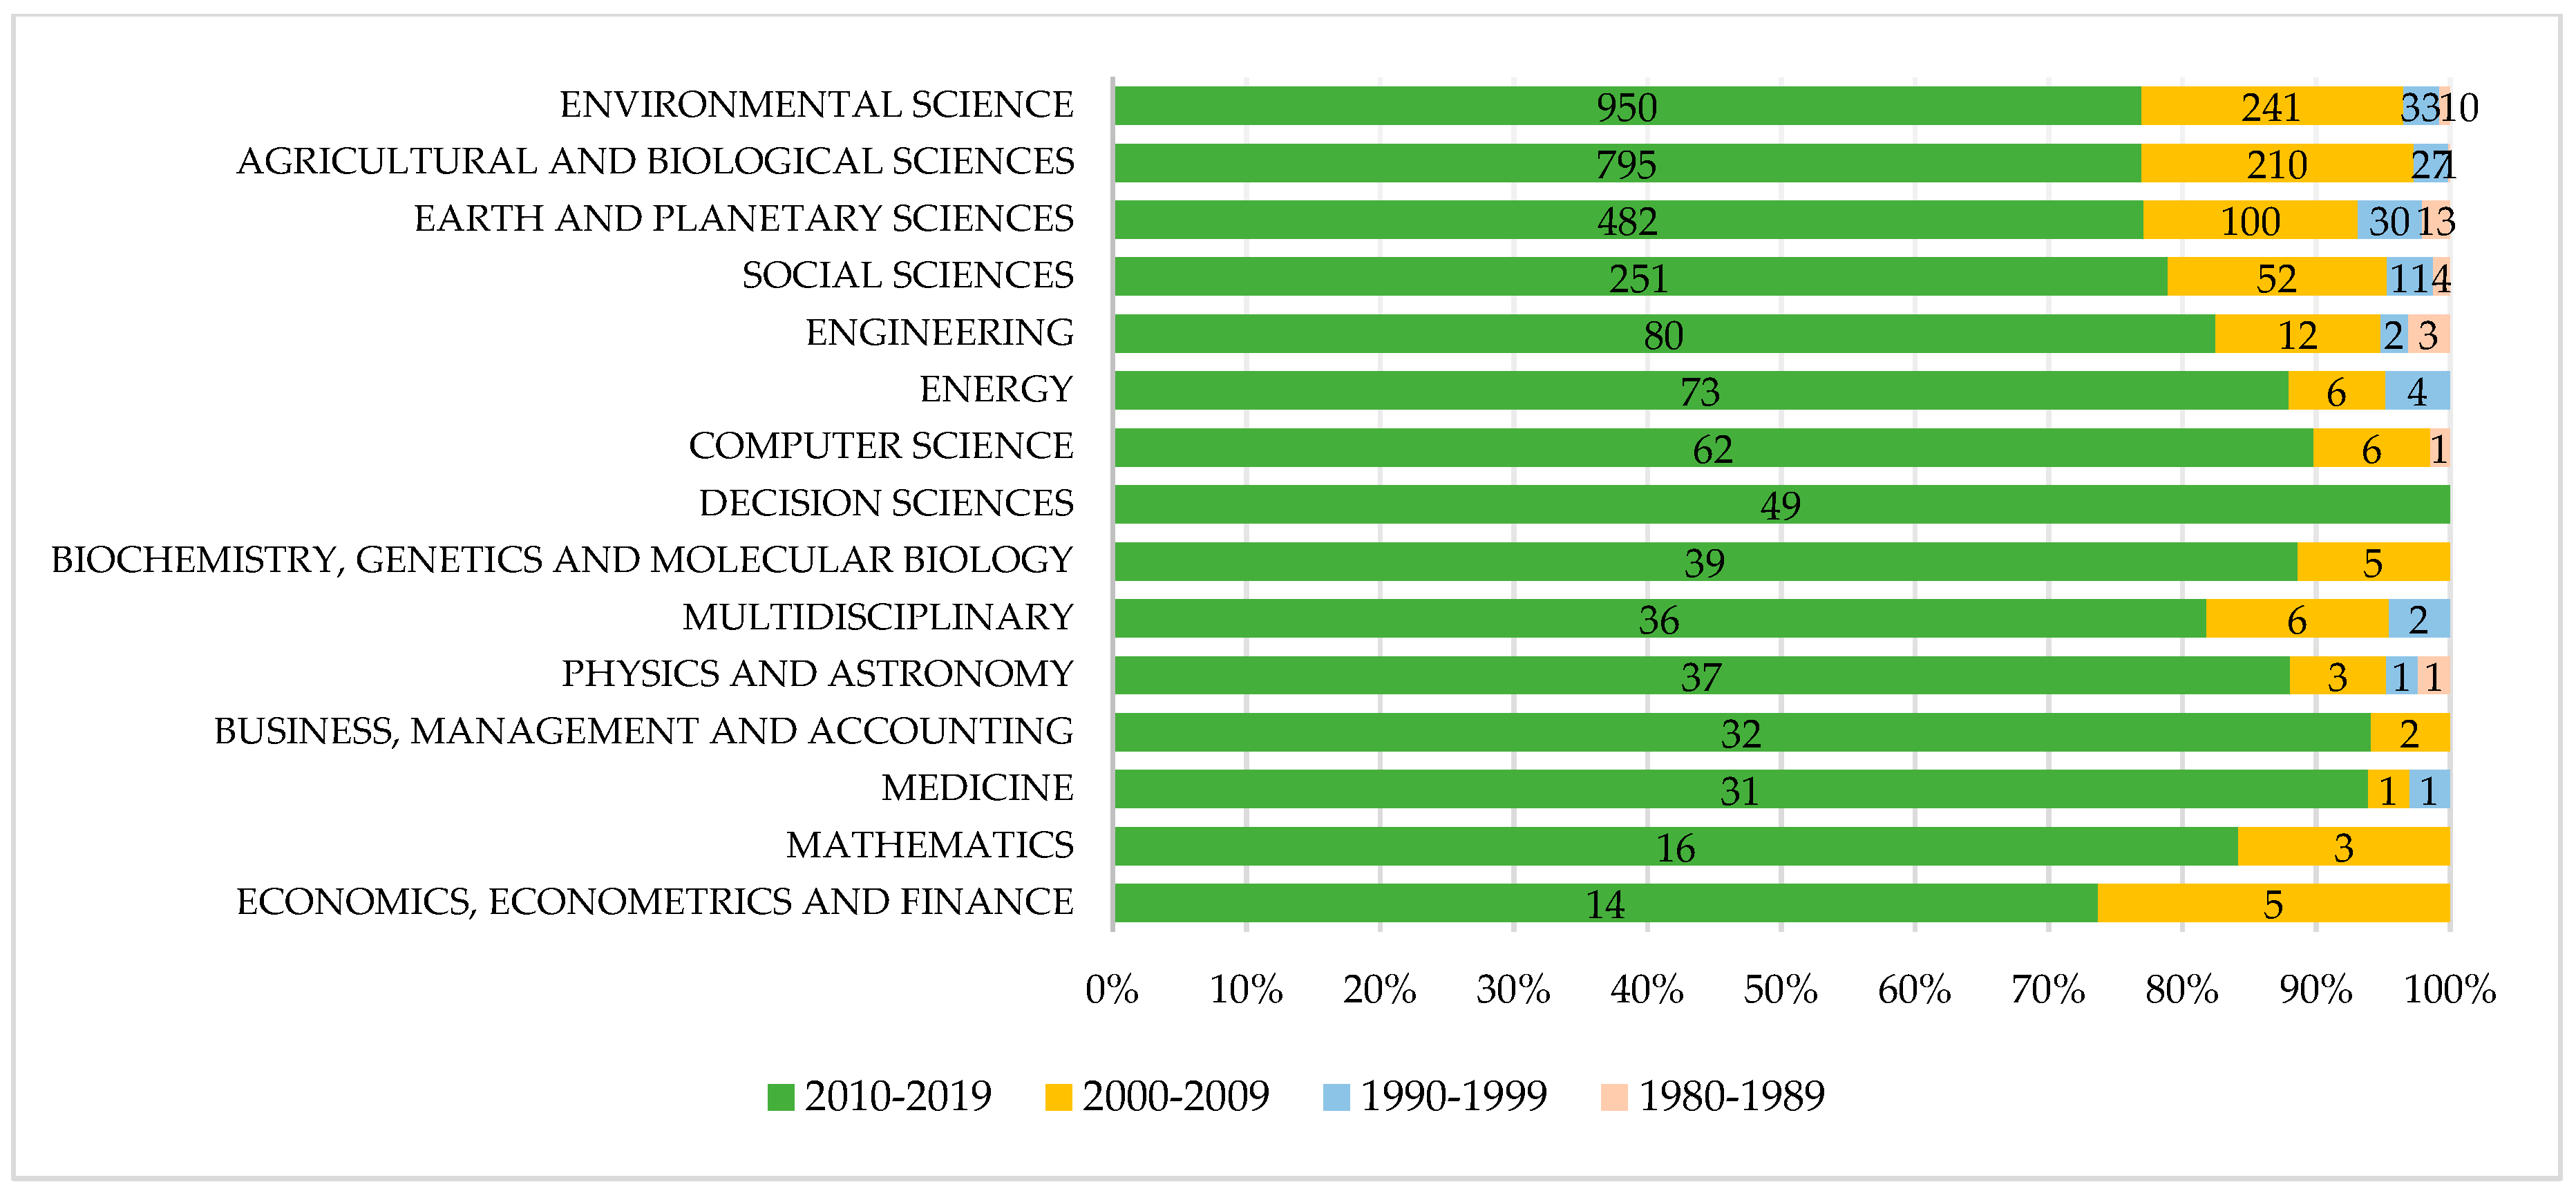
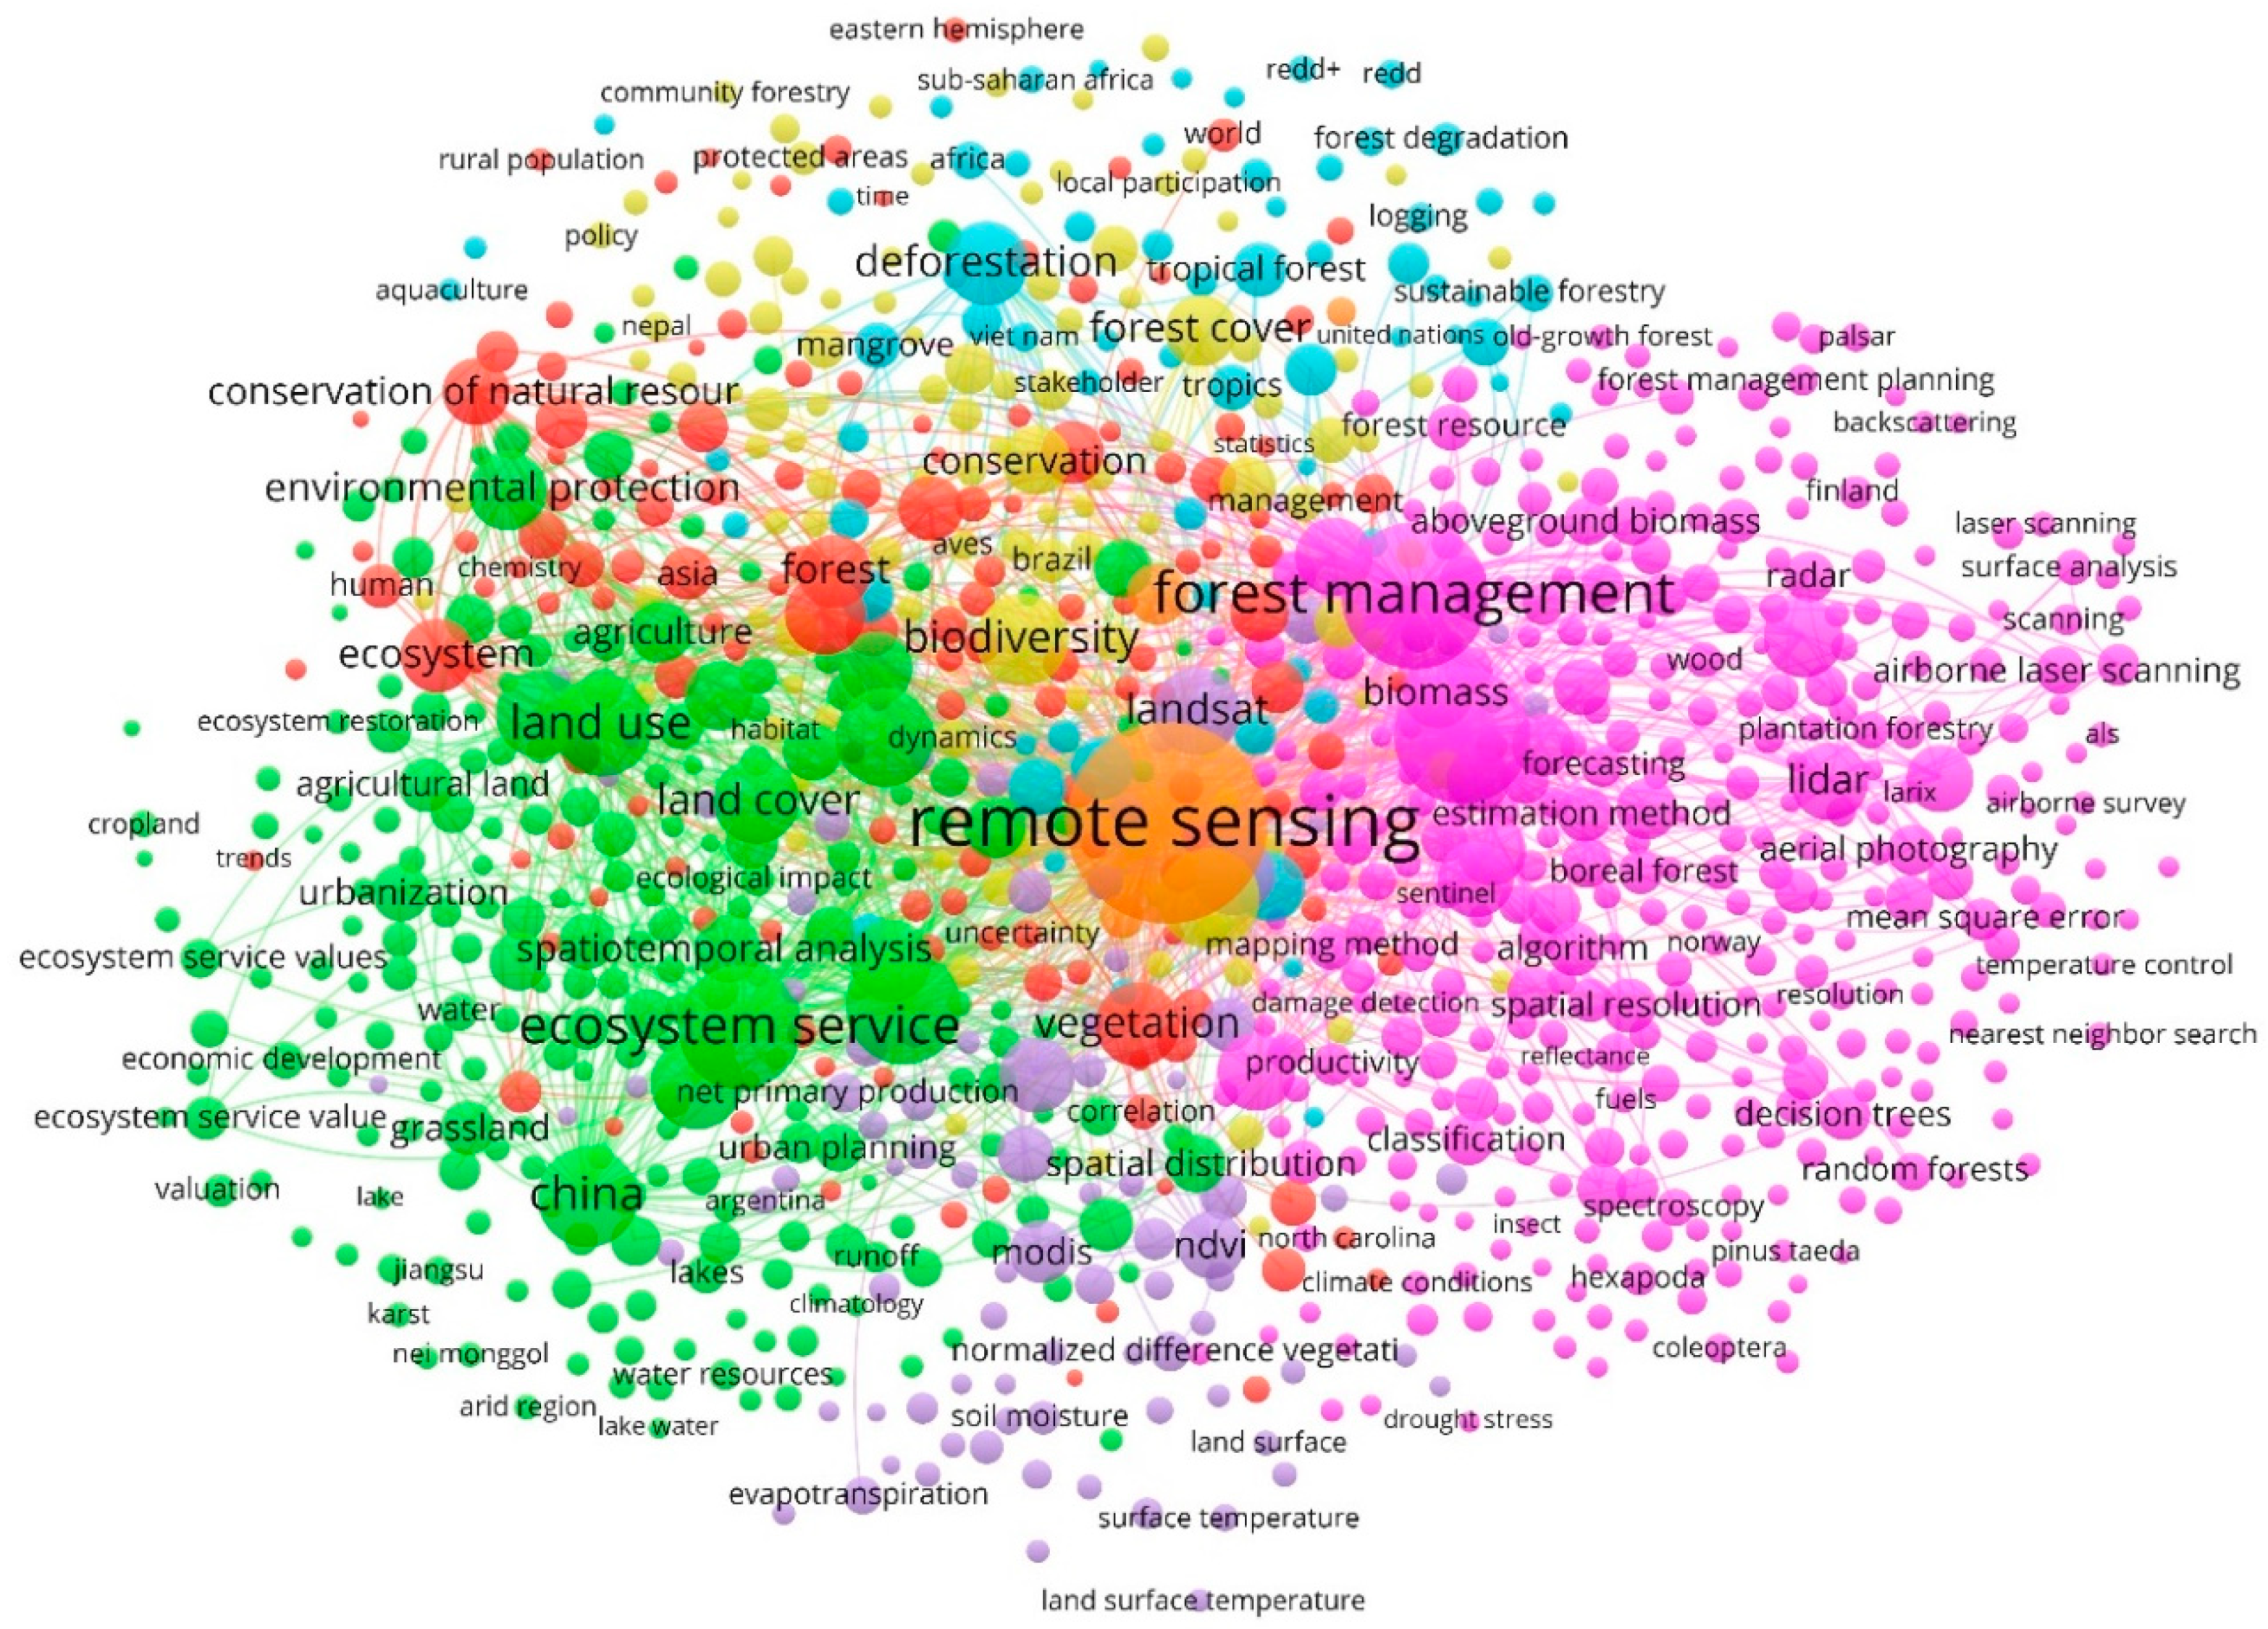
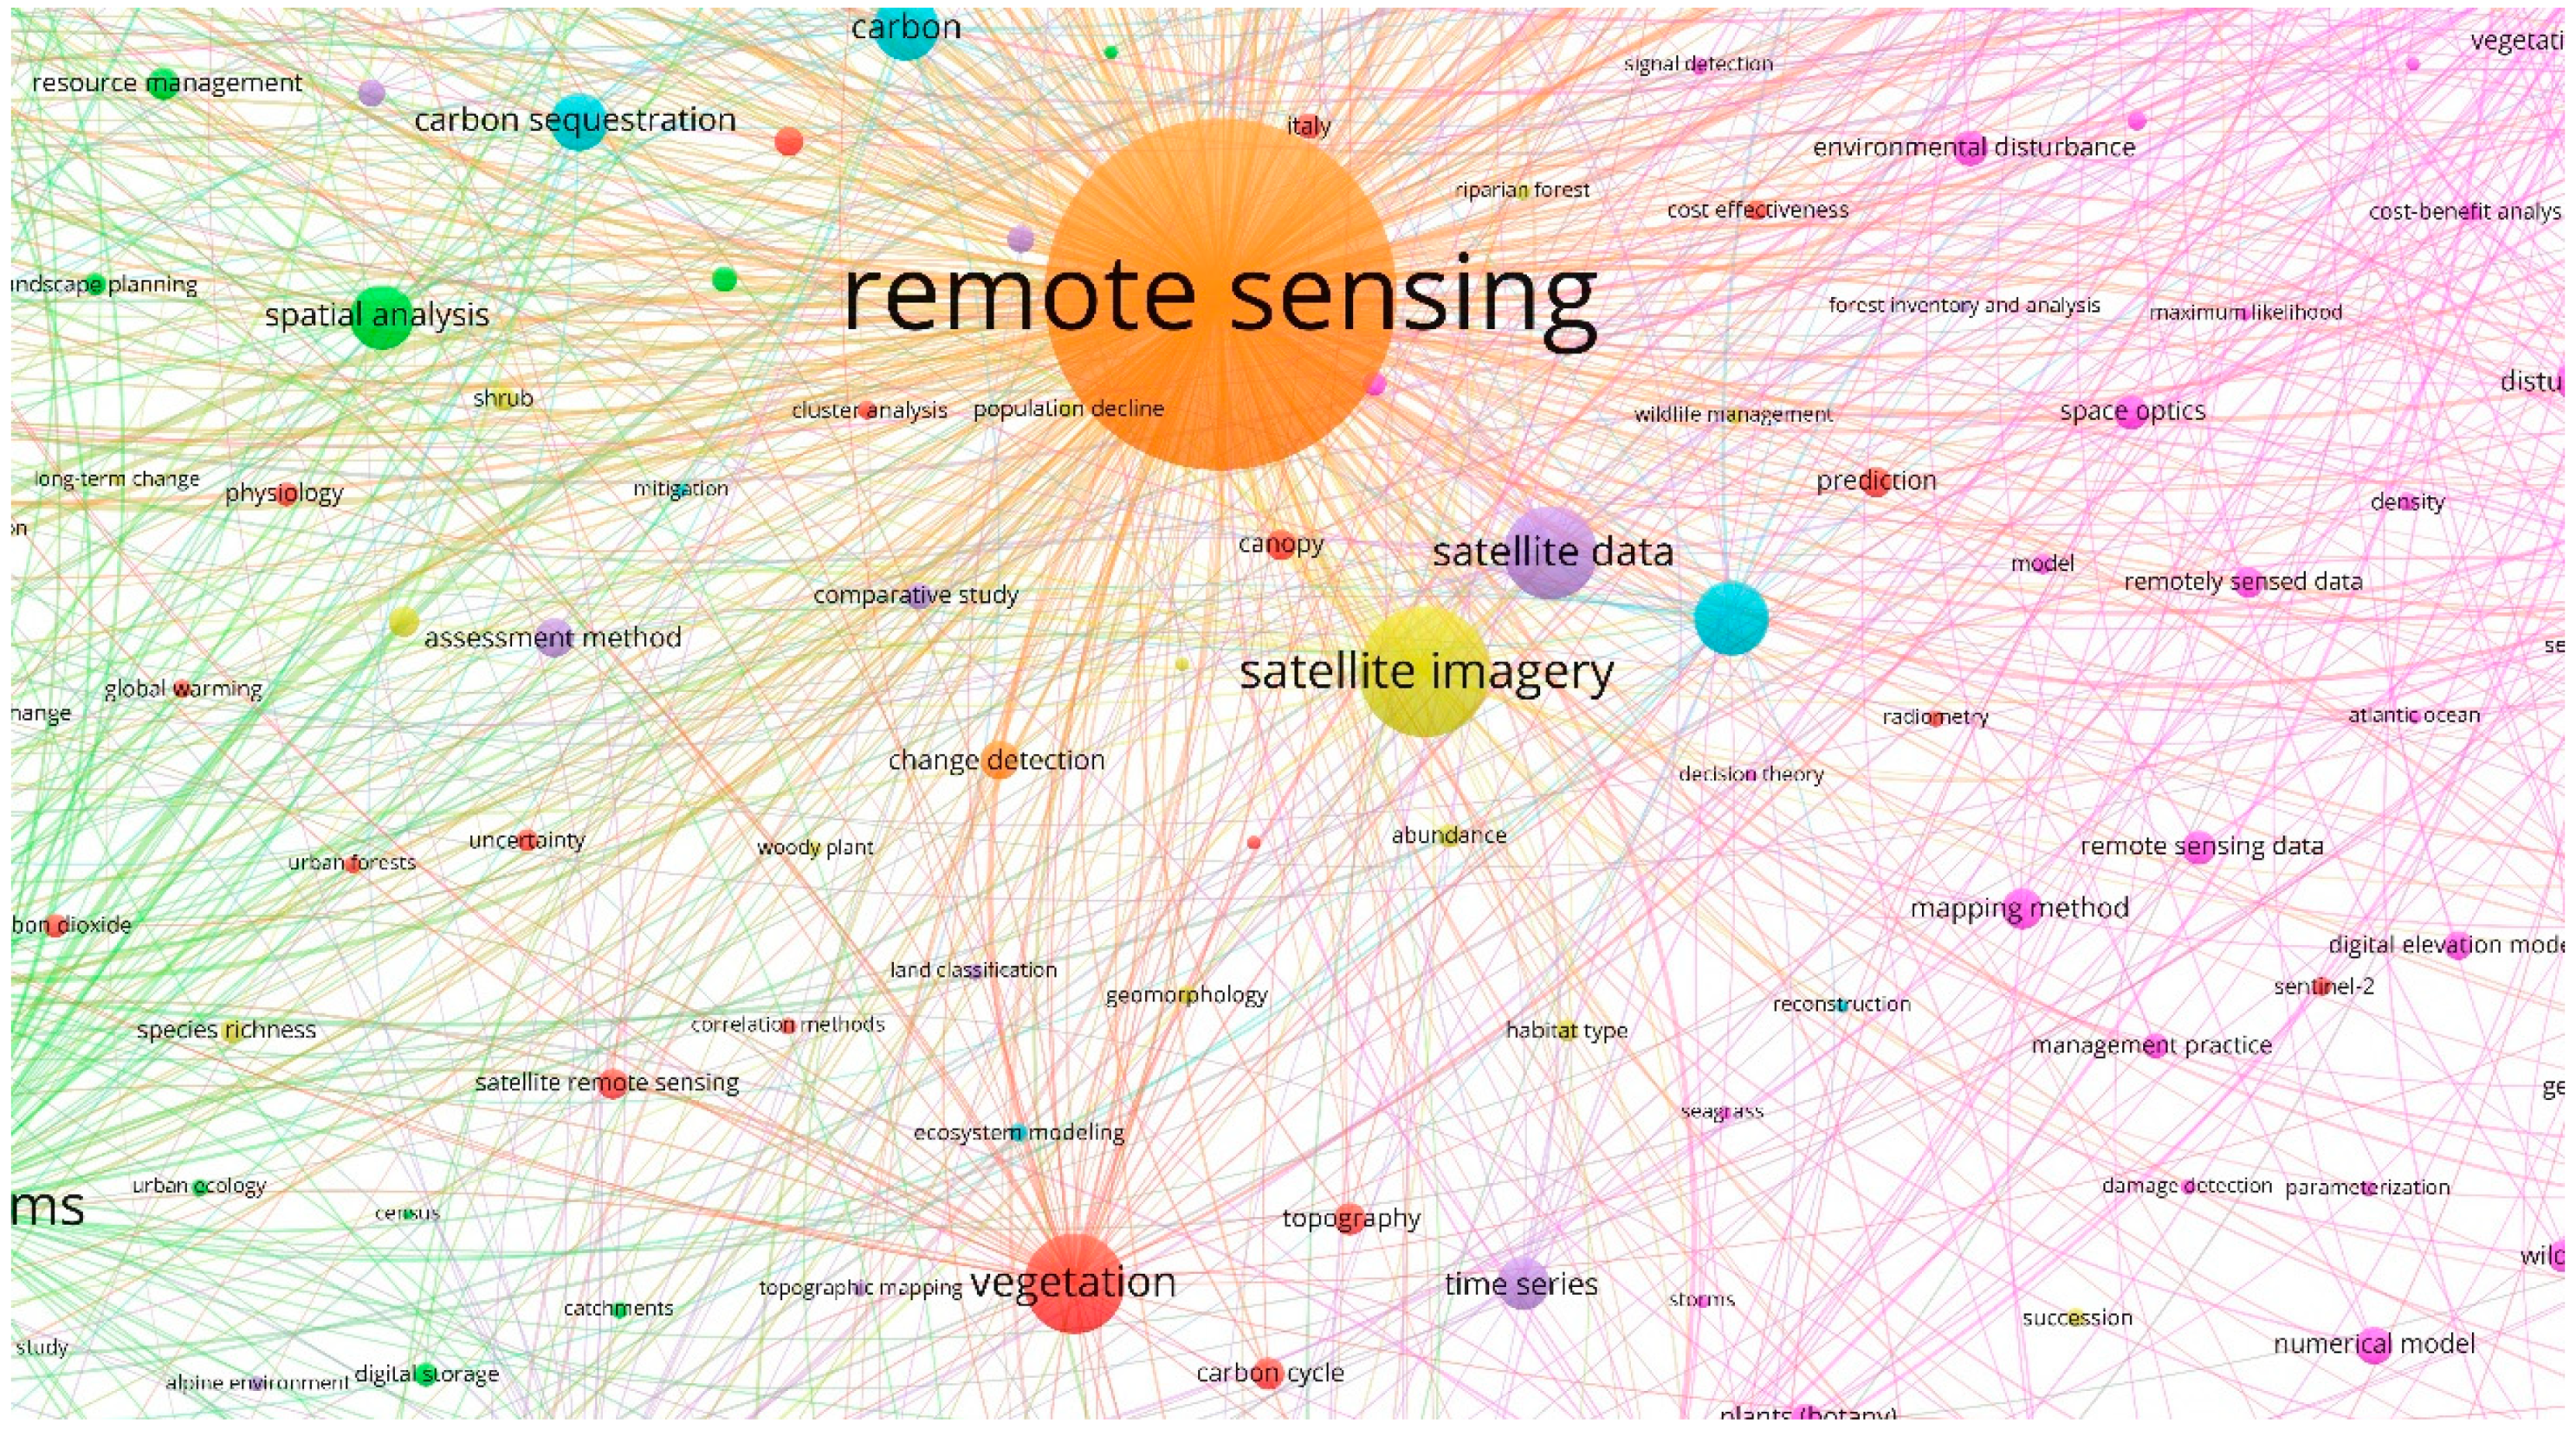
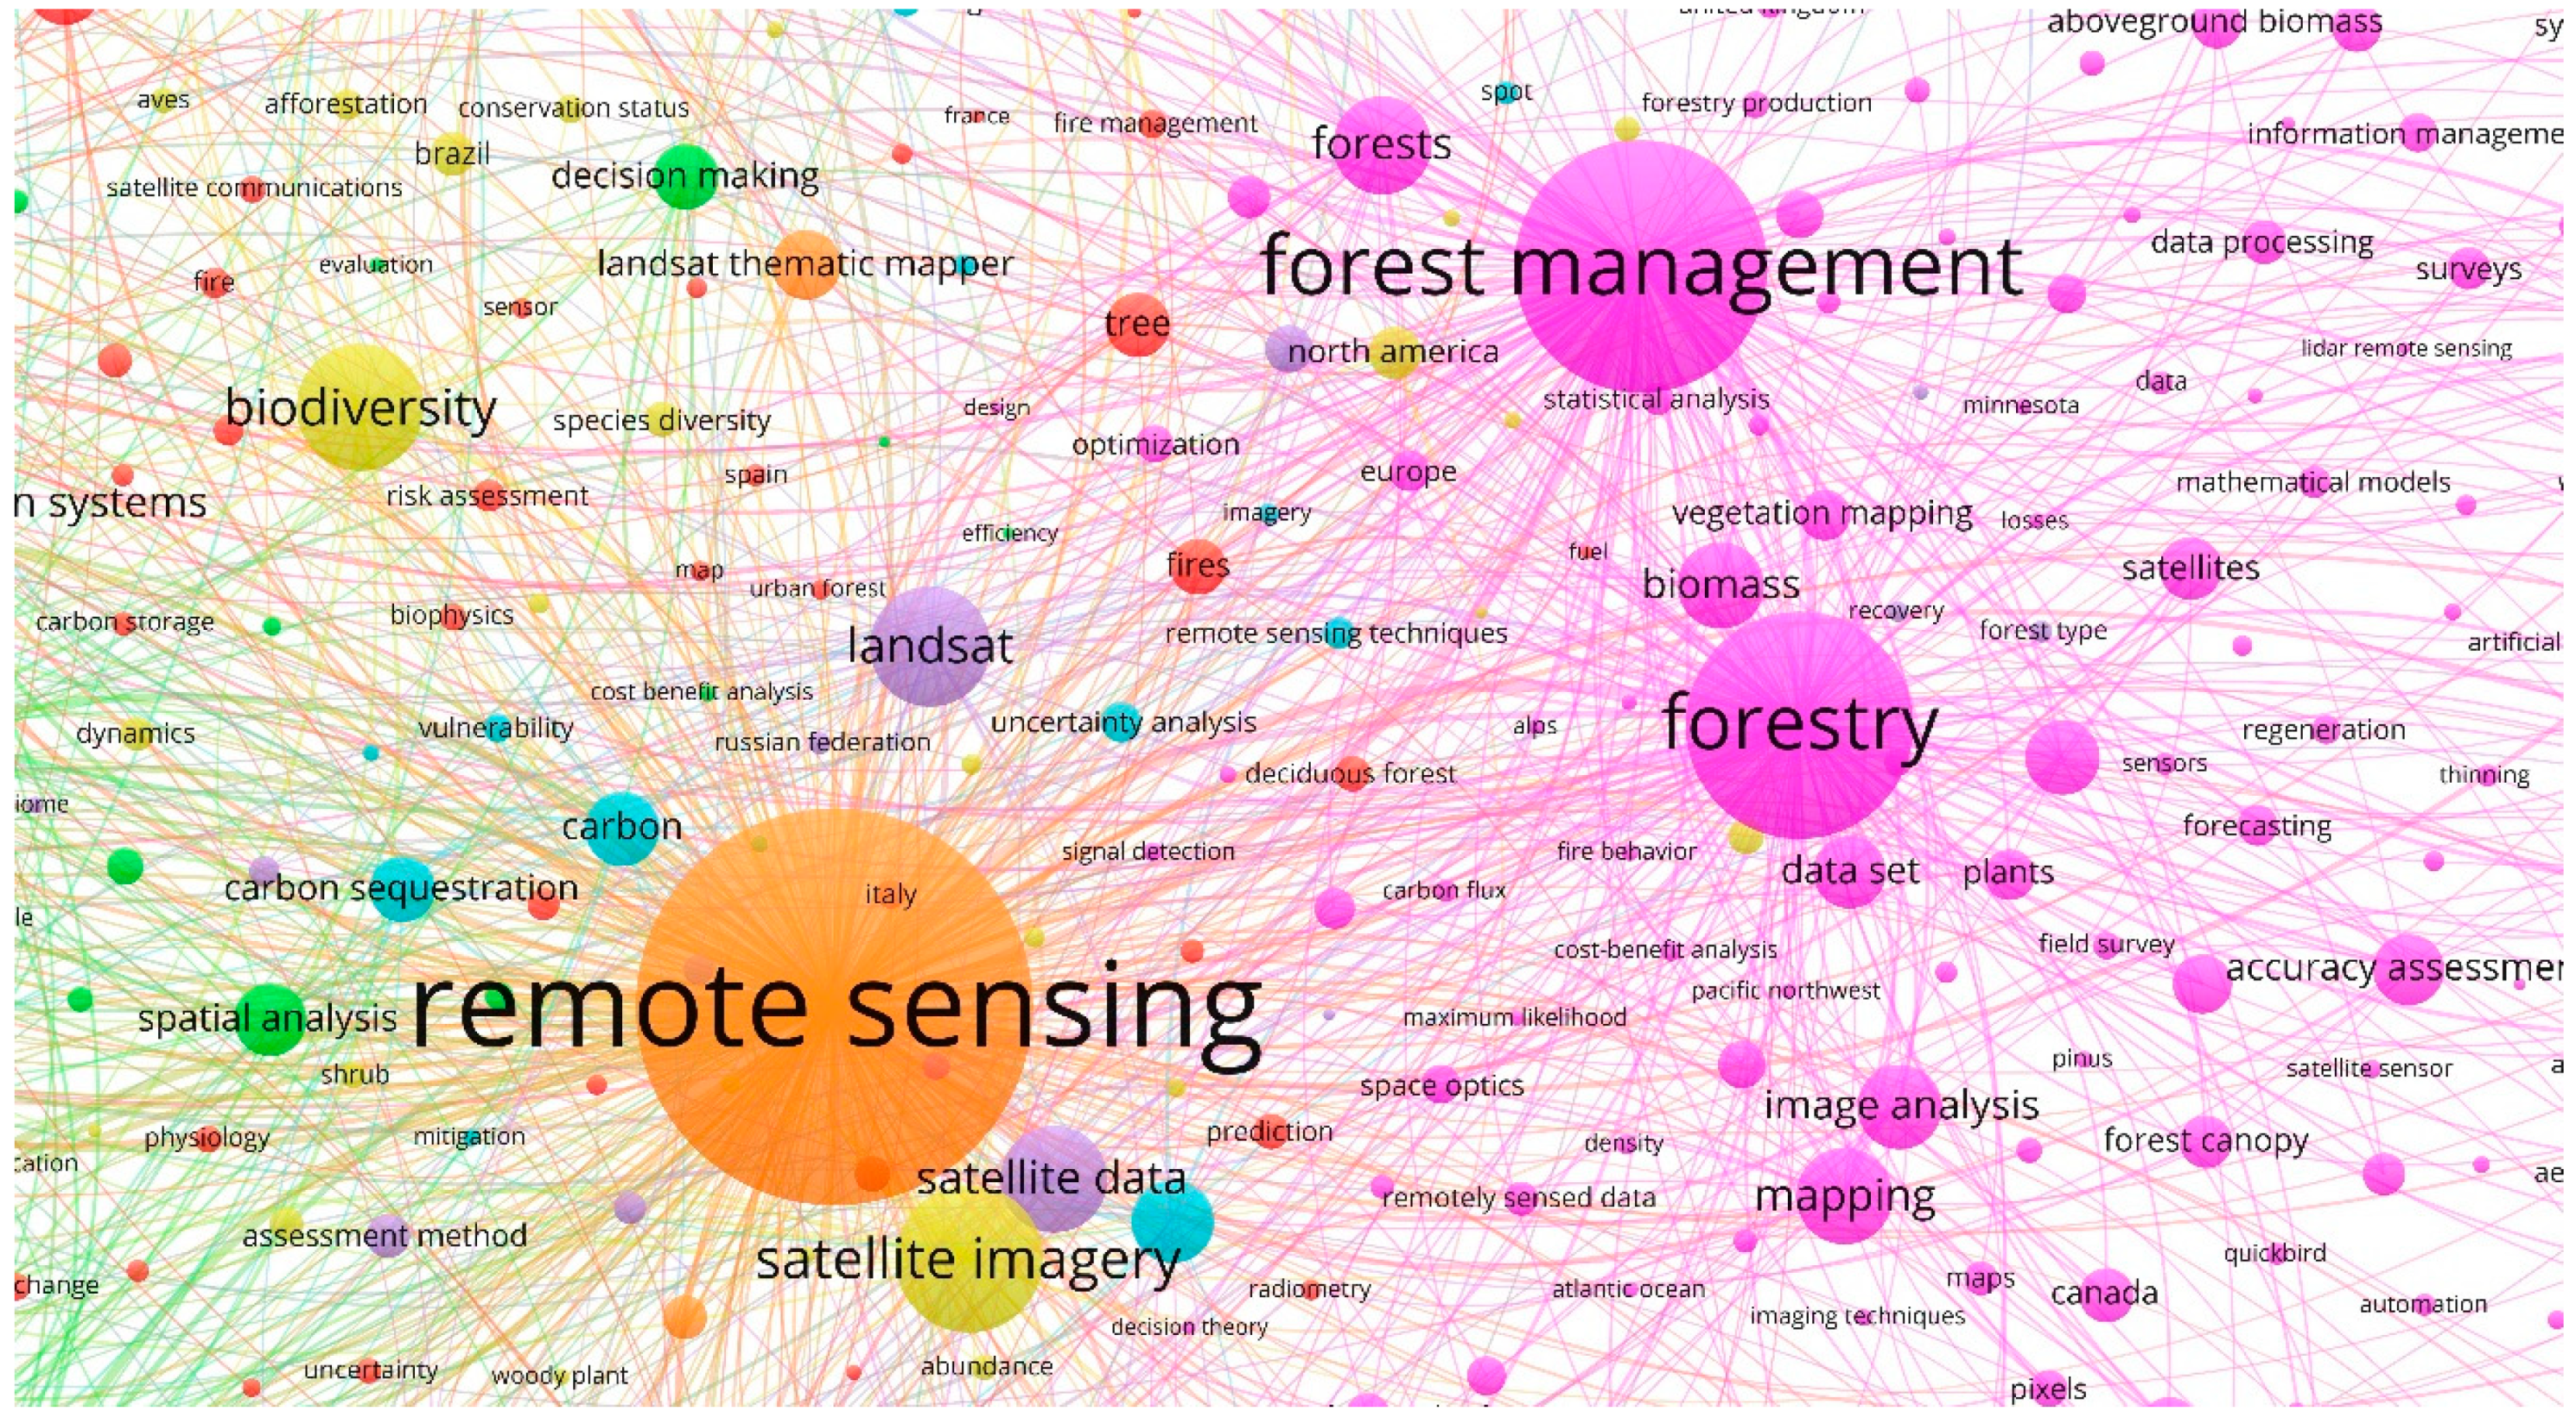
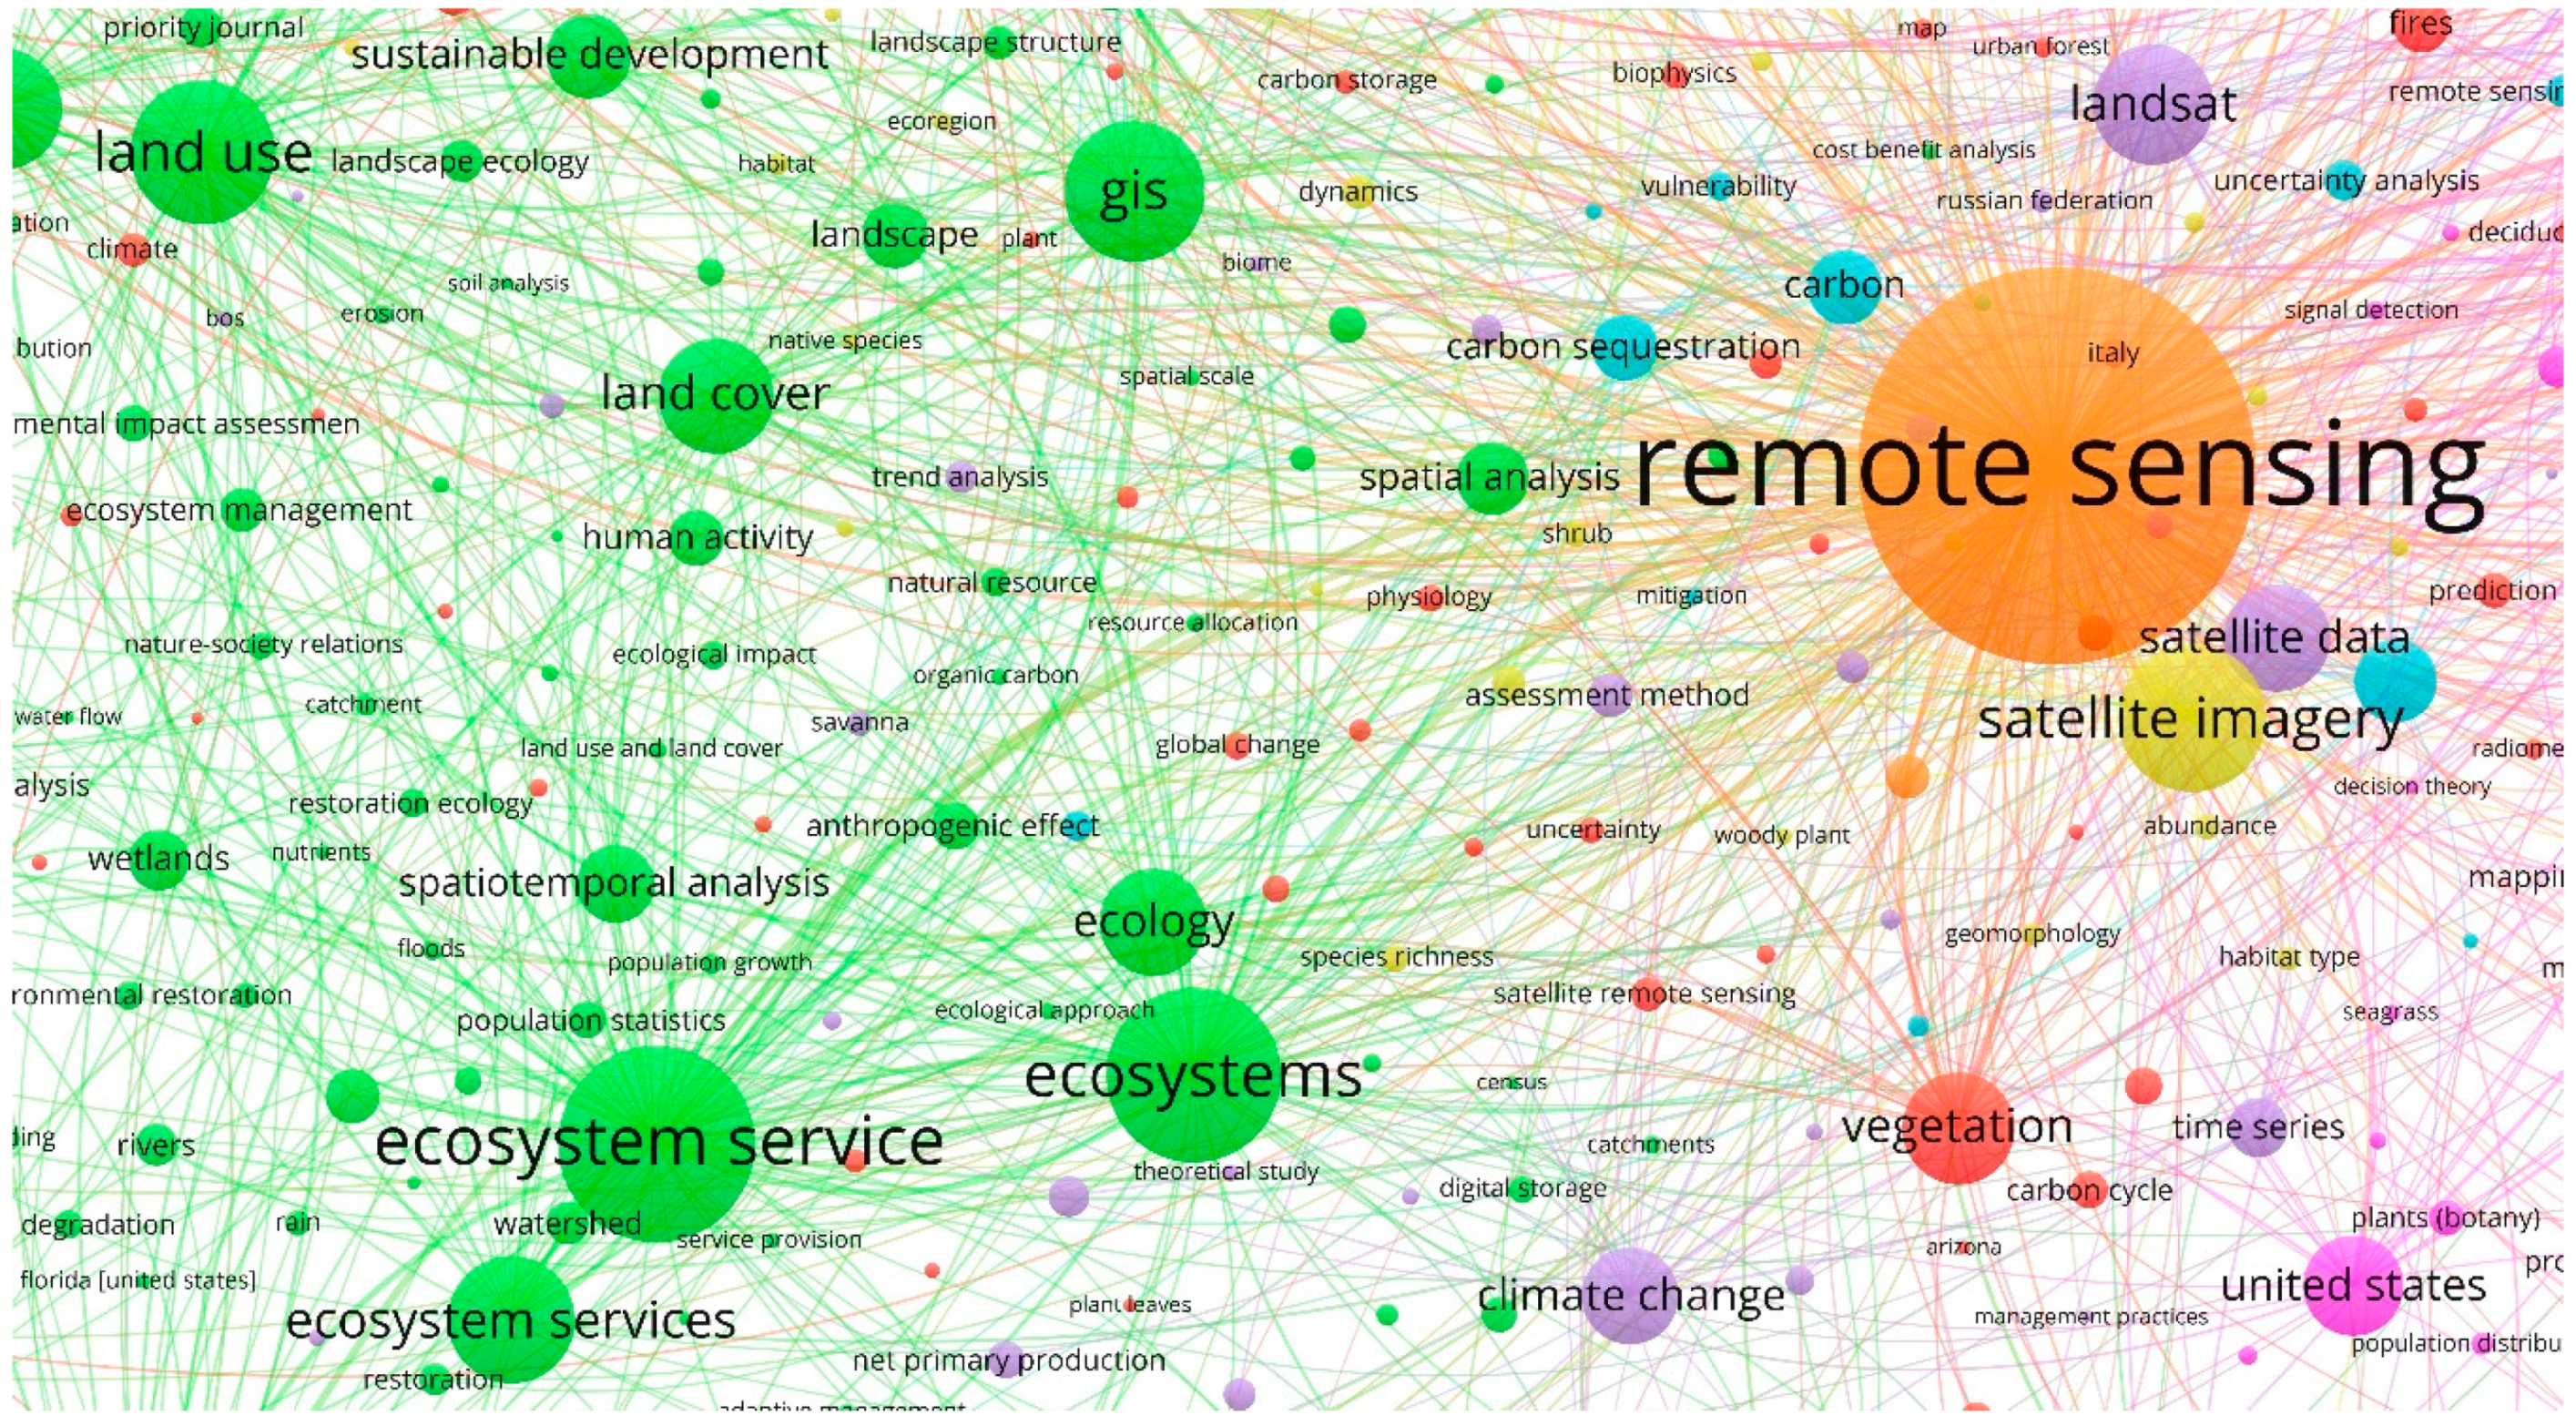
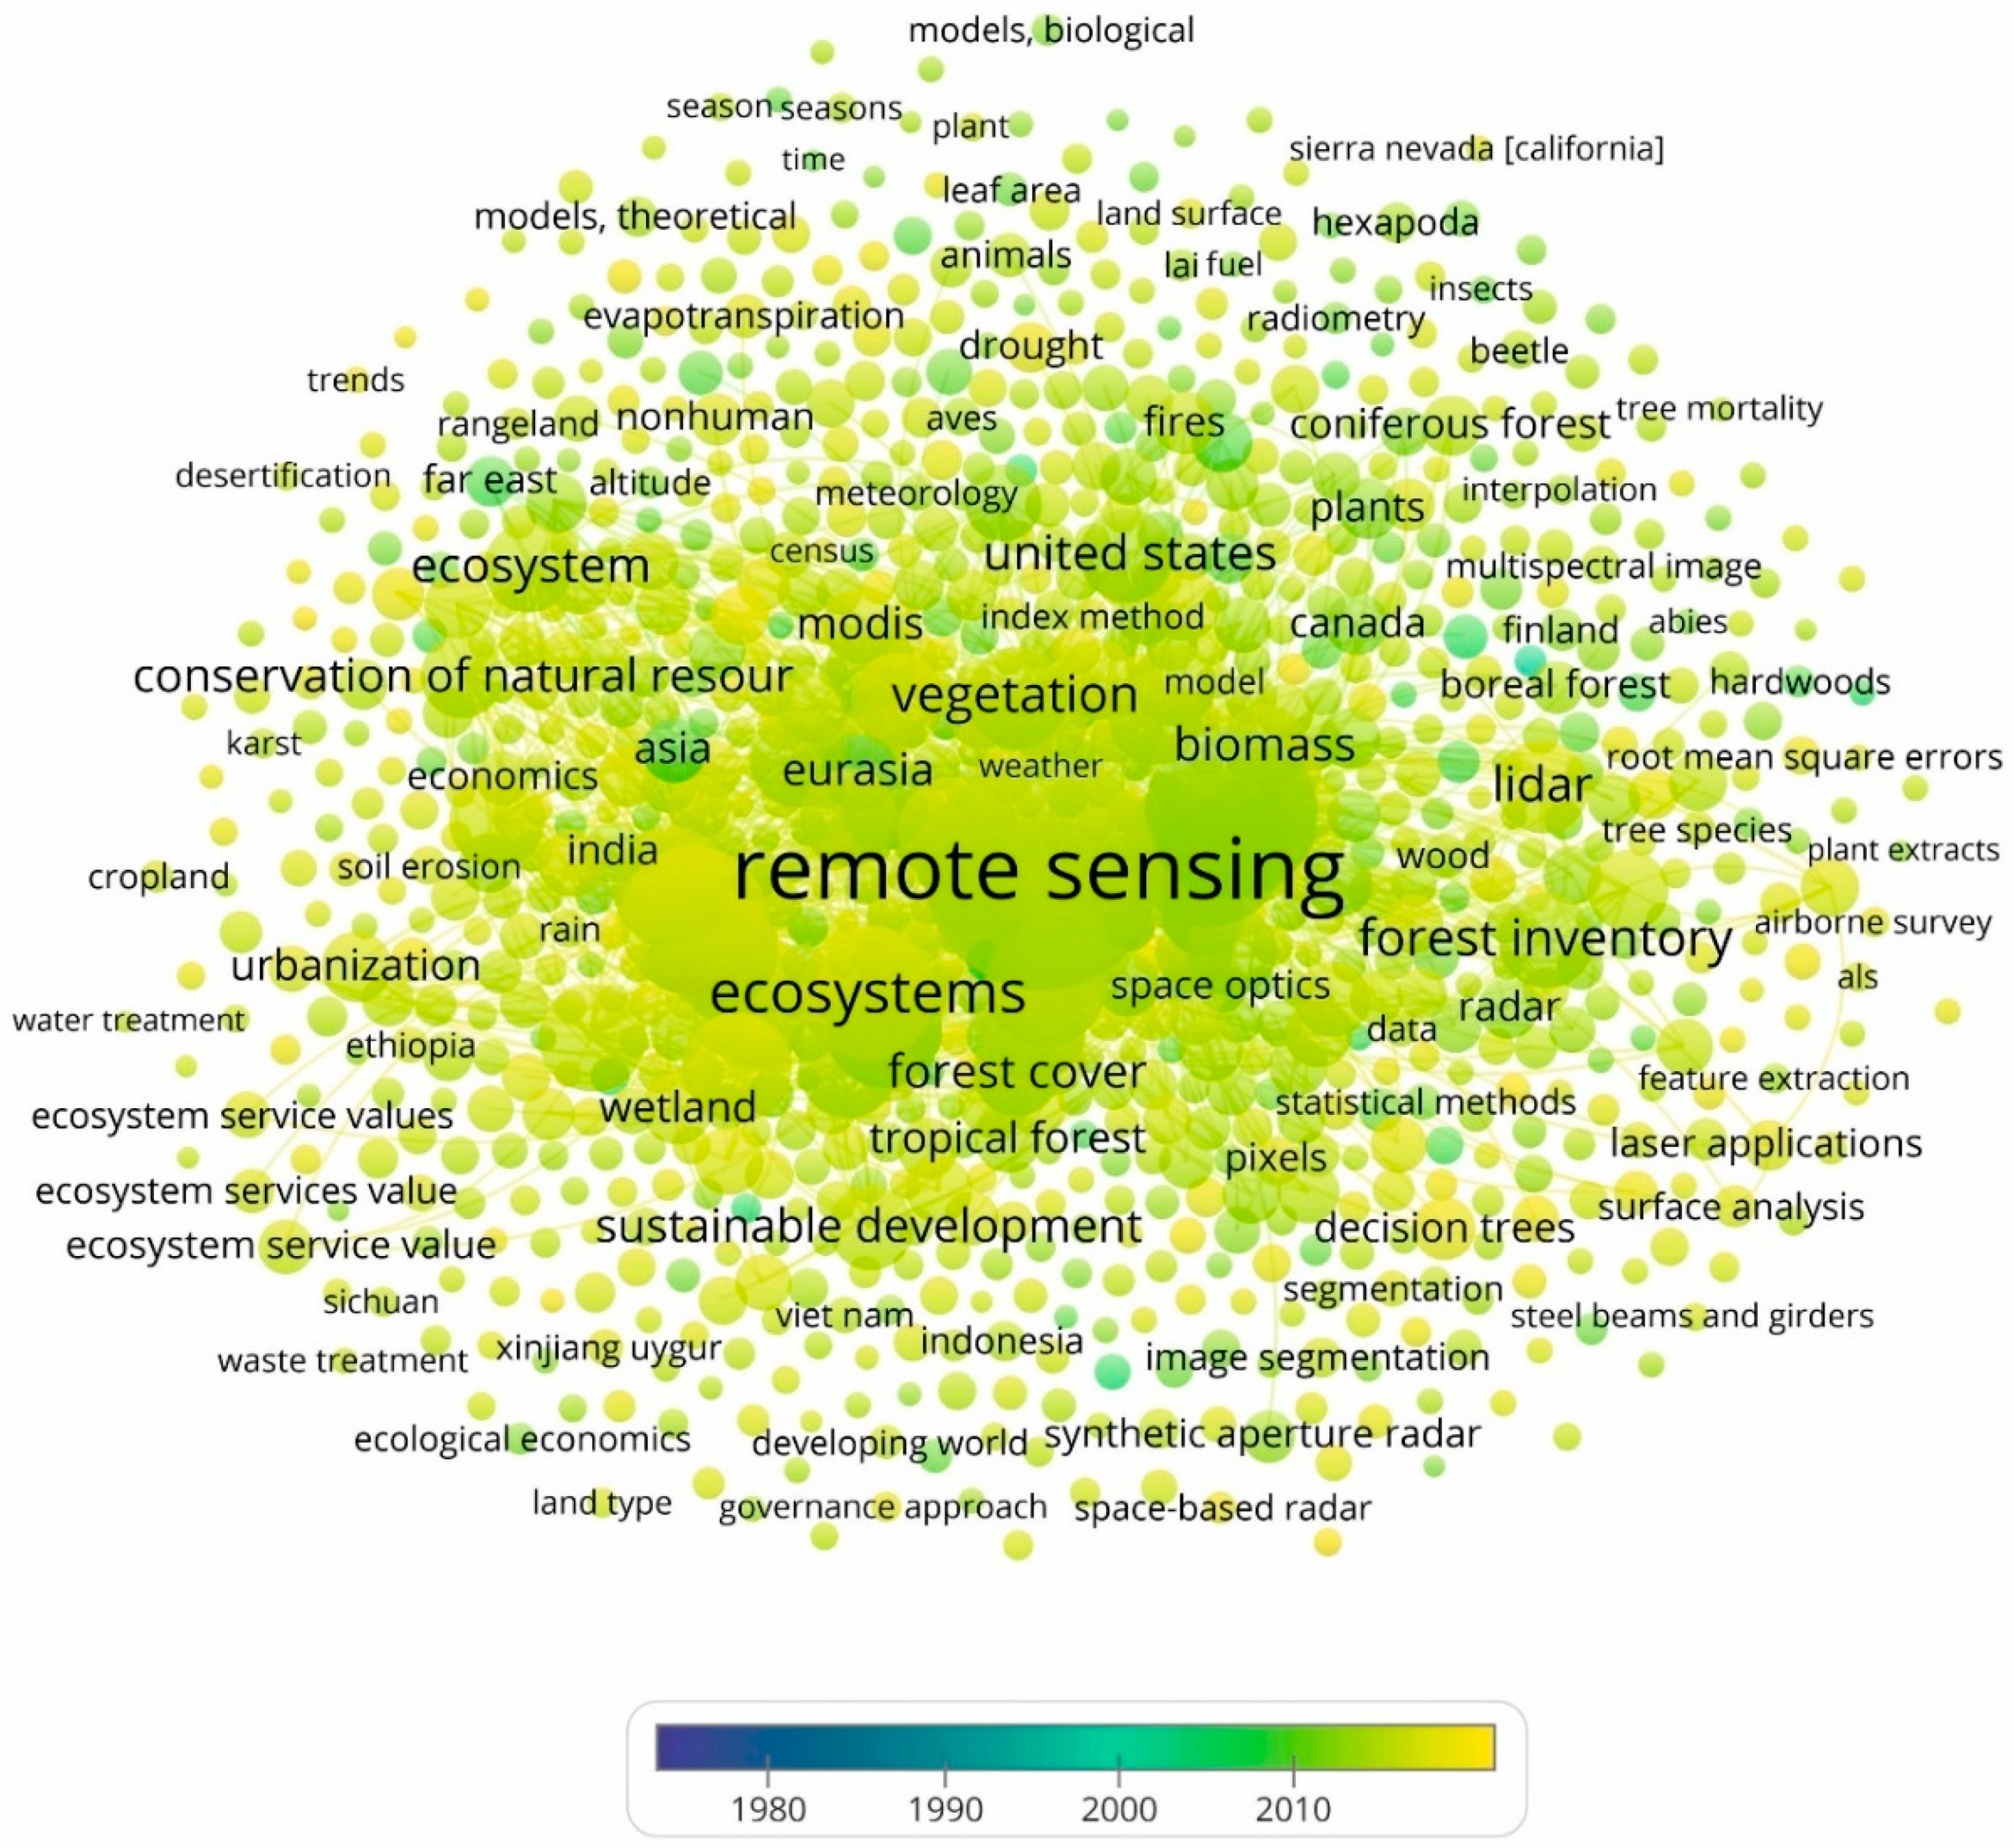
Table 1.
Main literature reviewed on the research topic.
| R | Year | Article Title | Author(s) | Journal | Term Associated |
|---|---|---|---|---|---|
| [17] | 2020 | Earth observation-based ecosystem services indicators for national and subnational reporting of the sustainable development goals | Cochran, F.; Daniel, J.; Jackson, L.; Neale, A. | Remote Sensing of Environment | RS—ES |
| [18] | 2020 | Integrating Remote Sensing and Street View Images to Quantify Urban Forest Ecosystem Services | Barbierato, E.; Bernetti, I.; Capecchi, I.; Saragosa, C. | Remote Sensing | RS—FM—ES |
| [19] | 2020 | Estimation of Forest Biomass in Beijing (China) Using Multisource Remote Sensing and Forest Inventory Data | Zhu, Y.; Feng, Z.; Lu, J.; Liu, J. | Forests | RS—FM |
| [20] | 2018 | Remote Sensing of Landslides—A Review | Zhao, C.; Lu, Z. | Remote Sensing | RS—ES |
| [21] | 2018 | Remote sensing of ecosystem trajectories as a proxy indicator for watershed water balance | Chasmer, L.E.; Devito, K.J.; Hopkinson, C.D.; Petrone, R.M. | Ecohydrology | RS—ES |
| [22] | 2018 | Analysis of remote sensing time-series data to foster ecosystem sustainability: use of temporal information entropy | Wang, C.; Zhao, H. | International Journal of Remote Sensing | RS—FM—ES |
| [23] | 2018 | Do Silviculture and Forest Management Affect the Genetic Diversity and Structure of Long-Impacted Forest Tree Populations? | Aravanopoulos, F. | Forests | FM—ES |
| [24] | 2017 | Remote Sensing of Above-Ground Biomass | Kumar, L.; Mutanga | Remote Sensing | RS—FM |
| [25] | 2016 | Remote sensing of species dominance and the value for quantifying ecosystem services | Pau, S.; Dee, L.E. | Remote Sensing in Ecology and Conservation | RS—ES |
| [26] | 2009 | Habitat assessment for forest dwelling species using LiDAR remote sensing: capercaillie in the Alps | Graf, R.F.; Mathys, L.; Bollmann, K. | Forest Ecology and Management | RS—FM |
| [27] | 2006 | Surveying mountain pine beetle damage of forests: A review of remote sensing opportunities | Wulder, M.A.; Dymond, C.C.; White, J.C.; Leckie, D.G.; Carroll, A.L. | Forest Ecology and Management | FM—ES |
| [28] | 2005 | Remote Sensing of Forest Regeneration in Highland Tropical Forests | Aguilar, A. | GIScience & Remote Sensing | RS—FM |
| [29] | 2004 | Remote sensing of selective logging impact for tropical forest management | De Wasseige, C.; Defourny, P. | Forest Ecology and Management | RS—FM |
| [30] | 1998 | Tropical deforestation and remote sensing | Myers, N. | Forest Ecology and Management | RS—FM |
| [31] | 1995 | The use and limits of remote sensing for analyzing environmental and social change in the Himalayan Middle Mountains of Nepal | Millette, T.L.; Tuladhar, A.R.; Kasperson, R.E.; Turner, B. | Global Environmental Change | RS—FM—ES |
R: Reference; RM: Remote Sensing; FM: Forest Management; ES: Ecosystem Service.
Table 2.
Top 30 keywords (1976–2019).
| R | Keyword | N | C | L | TLS | R | Keyword | N | C | L | TLS |
|---|---|---|---|---|---|---|---|---|---|---|---|
| 1 | Remote Sensing | 1695 | 7 | 998 | 25,638 | 16 | Satellite Data | 191 | 5 | 782 | 3438 |
| 2 | Forest Management | 802 | 1 | 963 | 12,971 | 17 | Forest Inventory | 186 | 1 | 672 | 3211 |
| 3 | Forestry | 670 | 1 | 981 | 12,484 | 18 | Environmental Monitoring | 185 | 3 | 797 | 4303 |
| 4 | Ecosystem Service | 526 | 2 | 880 | 8400 | 19 | Environmental Protection | 177 | 2 | 710 | 3948 |
| 5 | Ecosystems | 436 | 2 | 943 | 8272 | 20 | LiDAR (Laser Imaging Detection and Ranging) | 167 | 1 | 630 | 2900 |
| 6 | Satellite Imagery | 327 | 4 | 883 | 5952 | 21 | Mapping | 165 | 1 | 677 | 2822 |
| 7 | Land Use | 316 | 2 | 837 | 6219 | 22 | Climate Change | 165 | 5 | 740 | 3243 |
| 8 | GIS (Geographical Information Systems) | 306 | 2 | 829 | 4830 | 23 | Forest Cover | 143 | 4 | 654 | 2585 |
| 9 | Biodiversity | 255 | 4 | 835 | 4452 | 24 | Biomass | 136 | 1 | 676 | 2468 |
| 10 | Land Use Change | 237 | 2 | 736 | 4276 | 25 | Conservation | 134 | 4 | 683 | 2655 |
| 11 | Landsat | 232 | 5 | 773 | 4026 | 26 | Sustainable Development | 133 | 2 | 618 | 2388 |
| 12 | Land Cover | 218 | 2 | 743 | 3815 | 27 | Image Analysis | 132 | 1 | 676 | 2462 |
| 13 | Vegetation | 209 | 3 | 838 | 4234 | 28 | Forest Ecosystem | 129 | 6 | 668 | 2287 |
| 14 | Deforestation | 200 | 6 | 714 | 3574 | 29 | Conservation of Natural Resources | 123 | 3 | 641 | 3267 |
| 15 | Ecology | 194 | 2 | 811 | 3724 | 30 | NDVI (Normalized Difference Vegetation Index) | 121 | 5 | 580 | 1924 |
R: Rank position; N: number of articles; C: Cluster (see Figure 4); L: Weight Links; TLS: Weight Total Link Strength.
Table 3.
Identified clusters of keywords (1976–2019).
| R | Cluster Name | Color (Figure 4) | % | O | L | TLS | Top 10 Keywords |
|---|---|---|---|---|---|---|---|
| 1 | Forest Management | Pink | 31.63 | 963 | 12,971 | 802 | Forestry, Forest Inventory, LiDAR, Mapping, Biomass, Image Analysis, Optical Radar, Satellites, Spatial Resolution, Forest Canopy |
| 2 | Ecosystem Service | Green | 23.92 | 880 | 8400 | 526 | Ecosystems, Land Use, GIS (Geographic Information Systems), Land Use Change, Land Cover, Ecology, Environmental Protection, Sustainable Development, Agriculture, Landscape |
| 3 | Environmental Monitoring | Red | 14.01 | 797 | 4303 | 185 | Vegetation, Conservation of Natural Resources, Tree, Forest Fire, Vegetation Index, Leaf Area Index, Carbon Cycle, Land Management, Topography, Deciduous Forest |
| 4 | Satellite Imagery | Yellow | 12.71 | 883 | 5952 | 327 | Biodiversity, Forest Cover, Conservation, Reforestation, Conservation Management, Landscape Change, Forest Dynamics, Protected Area, Habitat Fragmentation, Species Diversity |
| 5 | Satellite Data | Violet | 8.81 | 782 | 3438 | 191 | Landsat, Climate Change, NDVI (Normalized Difference Vegetation Index), MODIS (Moderate Resolution Imaging Spectroradiometer), Vegetation Cover, Radiometers, Vegetation Dynamics, Evapotranspiration, Soil Moisture, Moderate Resolution Imaging Spectroradiometer |
| 6 | Deforestation | Blue | 7.31 | 714 | 3574 | 200 | Forest Ecosystem, Carbon Sequestration, Tropical Forest, Sustainable Forest Management, Environmental Degradation, Rhizophoraceae, Coastal Zone, Forest Degradation, Greenhouse Gas, Carbon Emission |
| 7 | Remote Sensing | Orange | 1.40 | 998 | 25,638 | 1695 | Wildfire, Mountain Region, Montane Forest, Mediterranean Environment, Himalayas, Topographic Mapping, Landsat Thematic Mapper, Change Detection, National Forest Planning, Topographic Effect |
R: Rank position; %: percentage of total articles published; O: Occurrences; L: Weight Links; TLS: Weight Total Link Strength.
Table 4.
Main terms by score relevance.
| Rank | Term | Relevance Score |
|---|---|---|
| 1 | Ecological Sensitivity Assessment | 69.061 |
| 2 | Sustainable Rural Development | 47.721 |
| 3 | Ecological Conservation Zone | 47.376 |
| 4 | Ecological Control Buffer Zone | 47.376 |
| 5 | Air Pollution Mitigation | 38.412 |
| 6 | Contemporary Political Forest | 37.773 |
| 7 | Cross Border Biophysical Forest Phenomena | 37.773 |
| 8 | Satellite Fire Mapping | 37.773 |
| 9 | Topological Acoustic Sensing | 37.773 |
| 10 | Unsupervised Treetop Detector | 26.409 |
© 2020 by the authors. Licensee MDPI, Basel, Switzerland. This article is an open access article distributed under the terms and conditions of the Creative Commons Attribution (CC BY) license (http://creativecommons.org/licenses/by/4.0/).
Share and Cite
MDPI and ACS Style
Abad-Segura, E.; González-Zamar, M.-D.; Vázquez-Cano, E.; López-Meneses, E. Remote Sensing Applied in Forest Management to Optimize Ecosystem Services: Advances in Research. Forests 2020, 11, 969. https://doi.org/10.3390/f11090969
AMA Style
Abad-Segura E, González-Zamar M-D, Vázquez-Cano E, López-Meneses E. Remote Sensing Applied in Forest Management to Optimize Ecosystem Services: Advances in Research. Forests. 2020; 11(9):969. https://doi.org/10.3390/f11090969
Chicago/Turabian StyleAbad-Segura, Emilio, Mariana-Daniela González-Zamar, Esteban Vázquez-Cano, and Eloy López-Meneses. 2020. "Remote Sensing Applied in Forest Management to Optimize Ecosystem Services: Advances in Research" Forests 11, no. 9: 969. https://doi.org/10.3390/f11090969
Note that from the first issue of 2016, this journal uses article numbers instead of page numbers. See further details here.