Bark Features for Identifying Resonance Spruce Standing Timber
by
 ,
,
Florin Dinulică
1 ,
,
Cristian-Teofil Albu
2,
Maria Magdalena Vasilescu
1,* and
Mariana Domnica Stanciu
3 1
Departament of Forest Engineering, Forest Management Planning and Terrestrial Measurements, Transilvania University of Brașov, 500123 Brașov, Romania
2
Gurghiu Forestry High School, 547295 Gurghiu, Romania
3
Department of Mechanical Engineering, Transilvania University of Brașov, 500036 Brașov, Romania
*
Author to whom correspondence should be addressed.
Forests 2019, 10(9), 799; https://doi.org/10.3390/f10090799
Submission received: 15 August 2019
/
Revised: 1 September 2019
/
Accepted: 6 September 2019
/
Published: 12 September 2019
(This article belongs to the Special Issue Genetic and Phenotypic Variation in Tree Crops Biodiversity)
Abstract
:Measuring the acoustic properties of wood is not feasible for most luthiers, so identifying simple, valid criteria for diagnosis remains an exciting challenge when selecting materials for manufacturing musical instruments. This article aims to verify whether the bark qualities as a marker of resonance wood are indeed useful. The morphometric and colour traits (in CIELab space) of the bark scales were compared with the structural (width and regularity of the growth rings and of the latewood) and acoustic features (transverse sound velocity, radiation ratio, impedance, and wood basic density) of the wood from 145 standing and 10 felled spruce trees, which are considered a resource of the resonance wood in the Romanian Carpathians. It has been emphasized that the spruce trees with acoustic and structural features that match the requirements for the manufacture of violins have a bark phenotype distinguishable by colour (higher redness, lower yellowness and brightness)—as well as by scale shape (higher slenderness and width). The south-facing side of the trunk and the external side of the scale are best for identifying resonance trees by their bark. Additionally, the mature bark phenotypes denote topoclinal variations and do not depend on tree age. Moreover, the differences among bark phenotypes are noticeable to the naked eye.
1. Introduction
There are 1.43 million ha of Norway spruce (Picea abies L. (Karst)) in the Romanian Carpathians [1], which host one of the most important resources of resonance wood in Europe in terms of value and volume [2,3]. Although it is continuously decreasing, the resonance wood resource still satisfies the demand for the local musical instruments industry, which are shipped across all continents [4].
Recognizing standing trees that have resonance wood has always been a challenge for luthiers. Long-time observations revealed the distinct physiognomy of resonance trees [5,6,7], but the topic remained somewhat unsolved until some of the physiognomic features were acoustically verified [8]. The literature provided a few morphological descriptors of the stem and crown of resonance trees [9,10] and of raw resonance wood [11,12,13,14,15]. However, other points of view have not placed much trust in these descriptors [16]—labelling them as folkloric [17]. Given the indicative value of some traits of trees in relation to the material’s acoustic quality, we shall hereafter call them phenotypical markers or morphological descriptors of resonance spruce. Some luthiers empirically associate resonance spruce with the phenotype of smooth or thin fissured barked trees with small, soft, and rounded scales, grouped vertically [8,9,18], which is different from regular spruce trees that have thicker and deeply furrowed bark at the harvesting age of the resonance wood [4]. Furthermore, spruce with indented rings is sought after by violin makers [19]—specifically indentations imprinting the underbark side [20]. In any case, the bark descriptors of resonance wood have not yet been acoustically and statistically checked [21].
Normally, bark width returns the tree growth traits [22] and together with these, they are age- and site-related [23]. The qualitative features of bark, such as relief and colour, are predominantly hereditary [24,25] and have a certain taxonomic value so that the bark texture can allow for the digital identification of species [26,27].
Besides the ecological and functional significance [28,29], bark morphology can be a good indicator of wood properties [30]. For instance, in the case of fir trees of similar age—which have persistent smooth bark—the wood is lighter, and the cellulose amount is smaller in contrast to early rough bark trees [31]. In the case of European and Chinese pear trees, the early rough bark trees contain more lignin in the wood and have a low carbon use ratio [32]. In the case of Scots pine trees, which have deeply fissured bark in thin, square plates that are smooth and light in colour, the heartwood is red, and its amount—alongside the amount of resin—is larger [33].
Sound velocity, wood density, dynamic modulus of elasticity and their indices, as radiation ratio, specific modulus, characteristic impedance, and acoustic converting efficiency, are preferred for expressing the suitability for strings [14,33,34,35,36]. High values for specific modulus of elasticity, sound velocity and radiation ratio, lower values for impedance and internal friction, as well as the lower values for density are recommended in the choice of material for soundboards [14,37,38,39,40,41]. Sound propagation velocity sets the clarity of the sound emitted by the musical instrument, acoustic radiation is a measure of acoustic power—in particular of the sound loudness—and the acoustic impedance expresses the sound sprinting [42,43].
Vibrational methods have already become common in identifying damages in standing trees [44,45,46,47] and assessing tree stiffness [48,49]. Using them in examining the tree goodness for the manufacture of musical instruments is still in the early stages [8]. New advanced methods, such as X-ray light microtomography coupled with scanning electron microscopy, are involved in describing the acoustical behavior of the wood [50]. Our aim is to check the hypothesis of the link between the bark features and the acoustic qualities of wood originating from stands that supply raw materials for violin manufacturing—specifically the possibility of an objective diagnosis of resonance wood using the bark. For this purpose, we: (1) identified the variation sources of the bark phenotype; (2) checked the connection between the bark features and the wood structure, and (3) verified the relation between the bark features and the acoustic properties of the wood.
2. Materials and Methods
2.1. Sampled Area
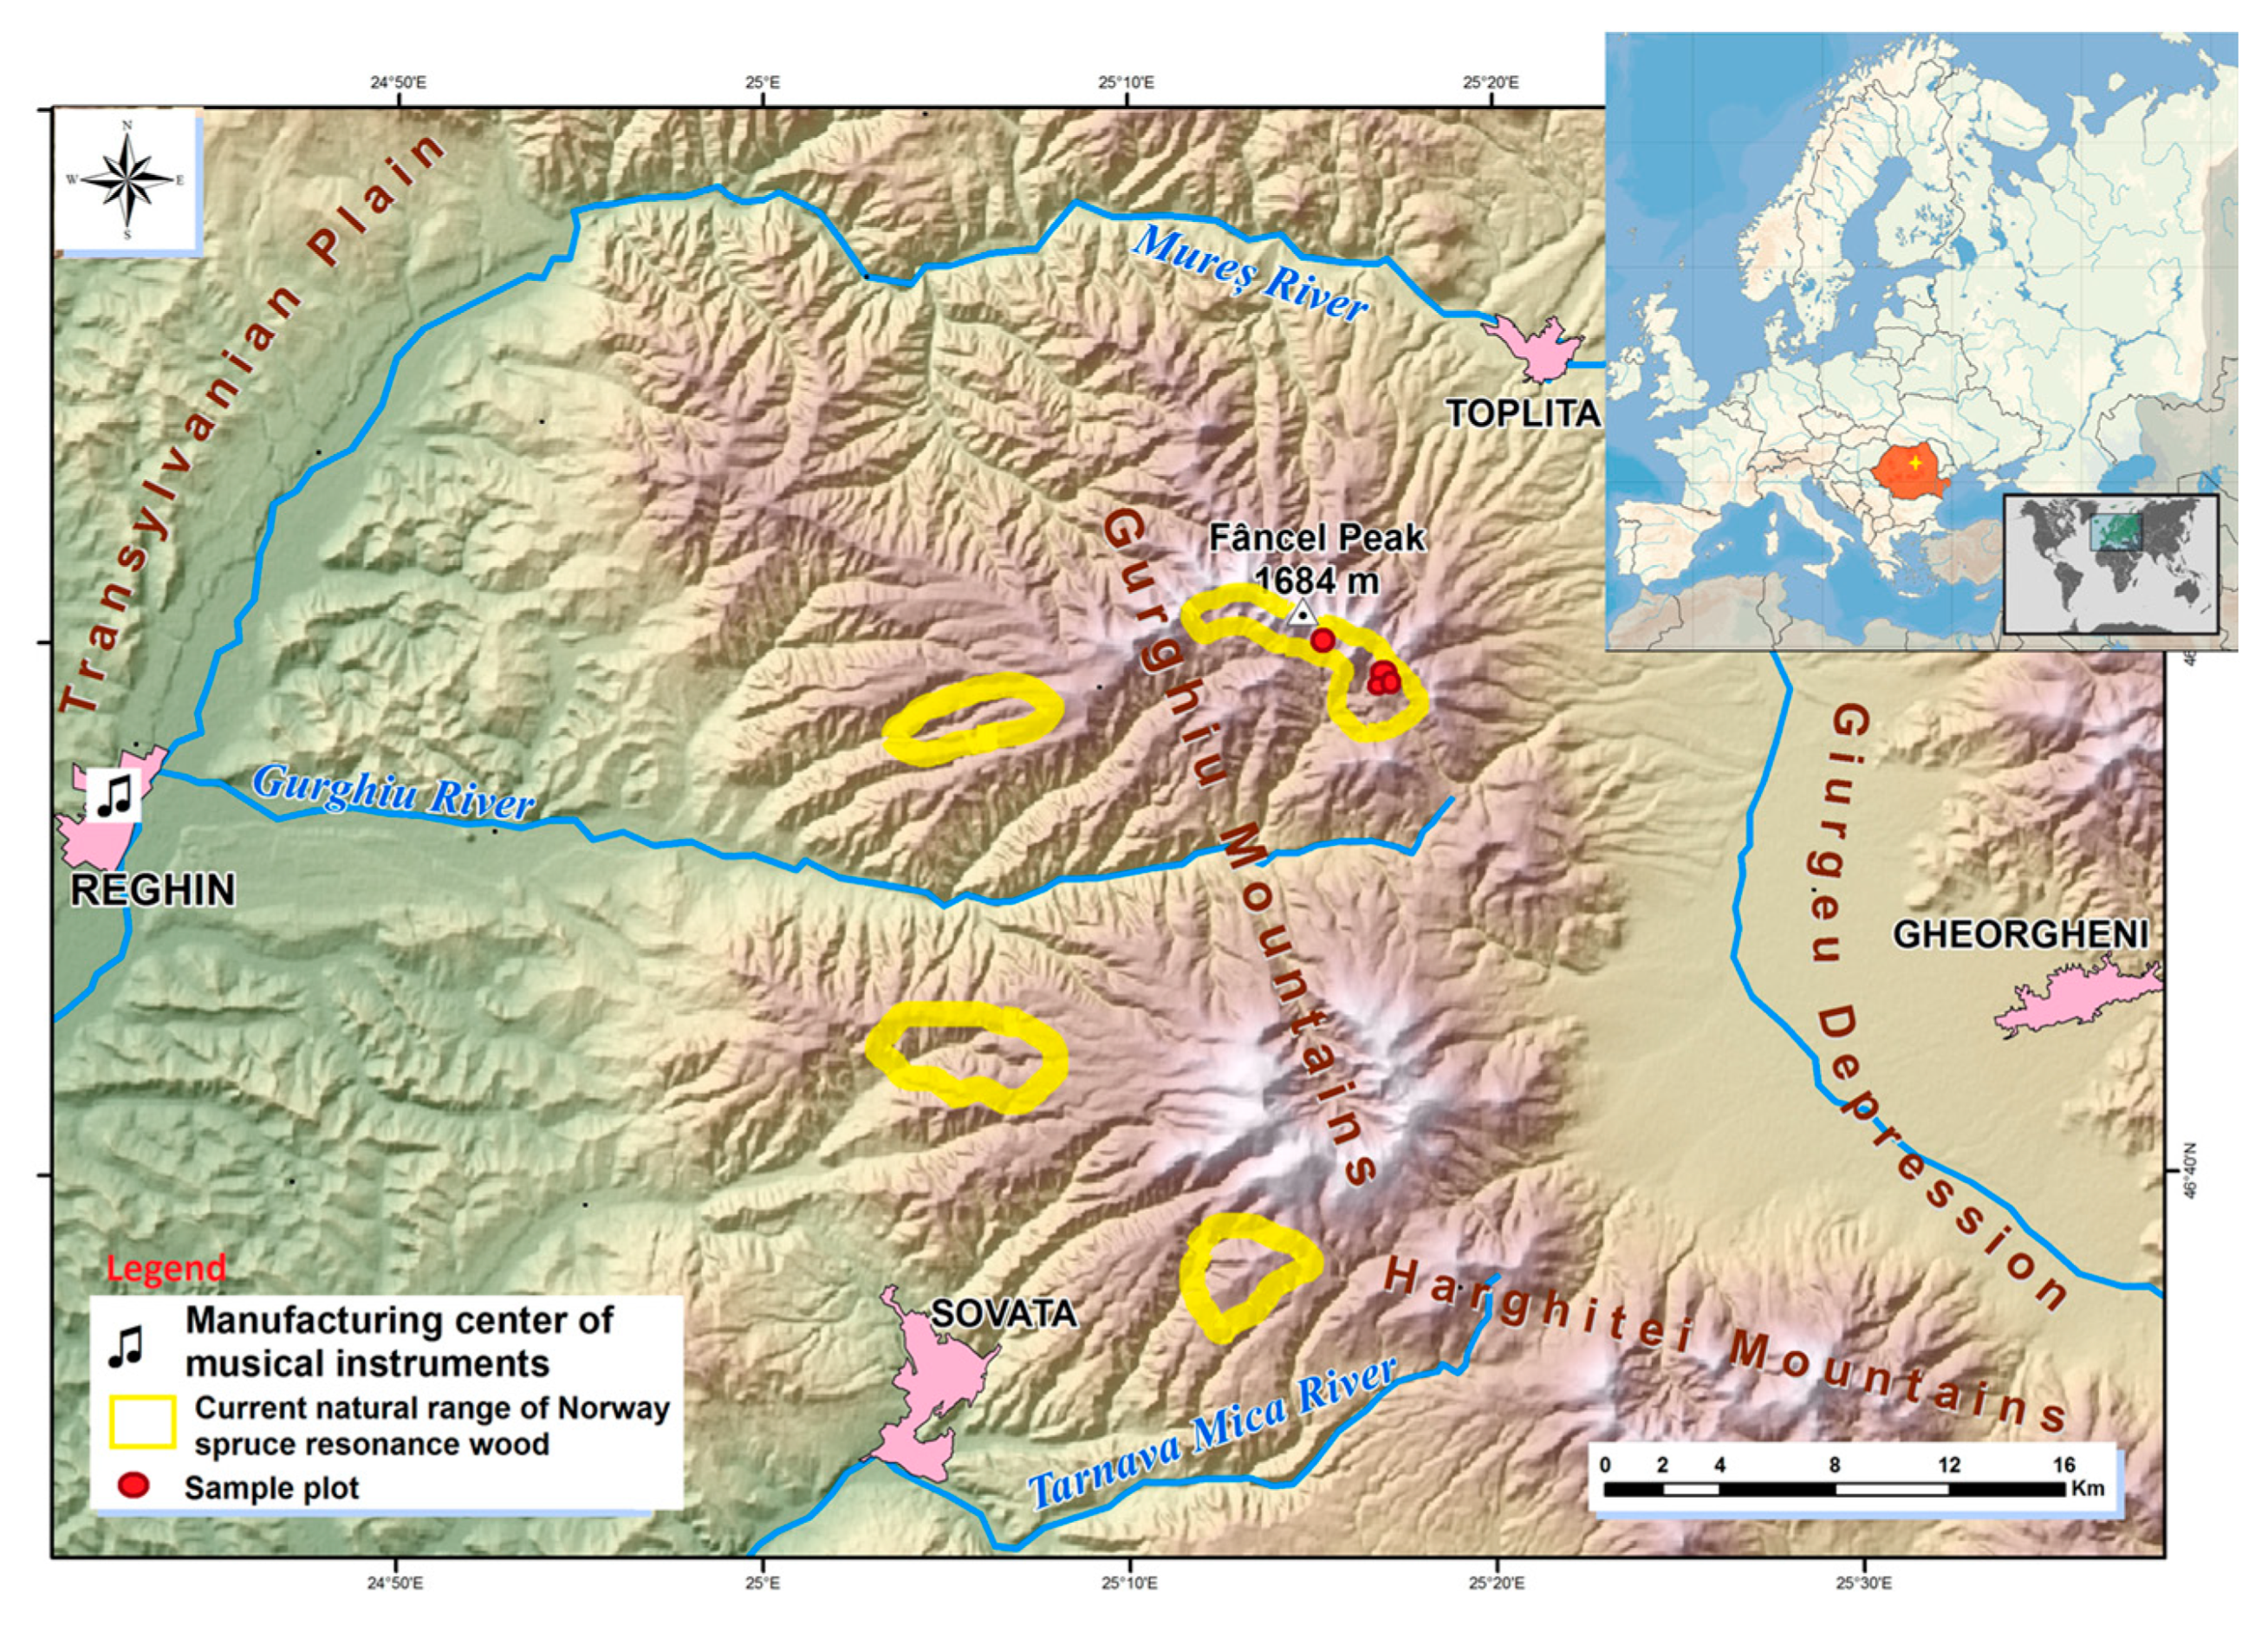
The materials originate from the Gurghiu Mountains, which today are home to the largest concentration of resonance wood in the Romanian Carpathians (Figure 1). The relief and the local volcanic substratum favoured the selection and settlement of the resonance spruce phenotype [4]. The resonance spruce trees are located inside the former volcanic basin, which today forms the Gurghiu Mountains. The volcanic bowl protects the trees from excess wind circulation, thus reducing the occurrence of compression wood that compromises the acoustic value of the wood [51]. The mean annual temperature ranges around 5.2 °C at 1200 to 1300 m elevation. The soil bedrock is of andesite origin, well-supplied with rain water (850–1100 mm·year−1). The soils are deep, loose, and of moderate fertility.
The local stands containing resonance wood are mixed, relatively uneven-aged or two-storied stands, and consist of spruce (Picea abies Karst.), beech (Fagus sylvatica L.), fir (Abies alba Mill.) and sometimes sycamore (Acer pseudoplatanus L.) as well. The resonance spruce trees cover the middle third of the slope—which are moderately to highly sloped—and avoid the cold air in the valleys or on the peaks.
2.2. Sampling Design
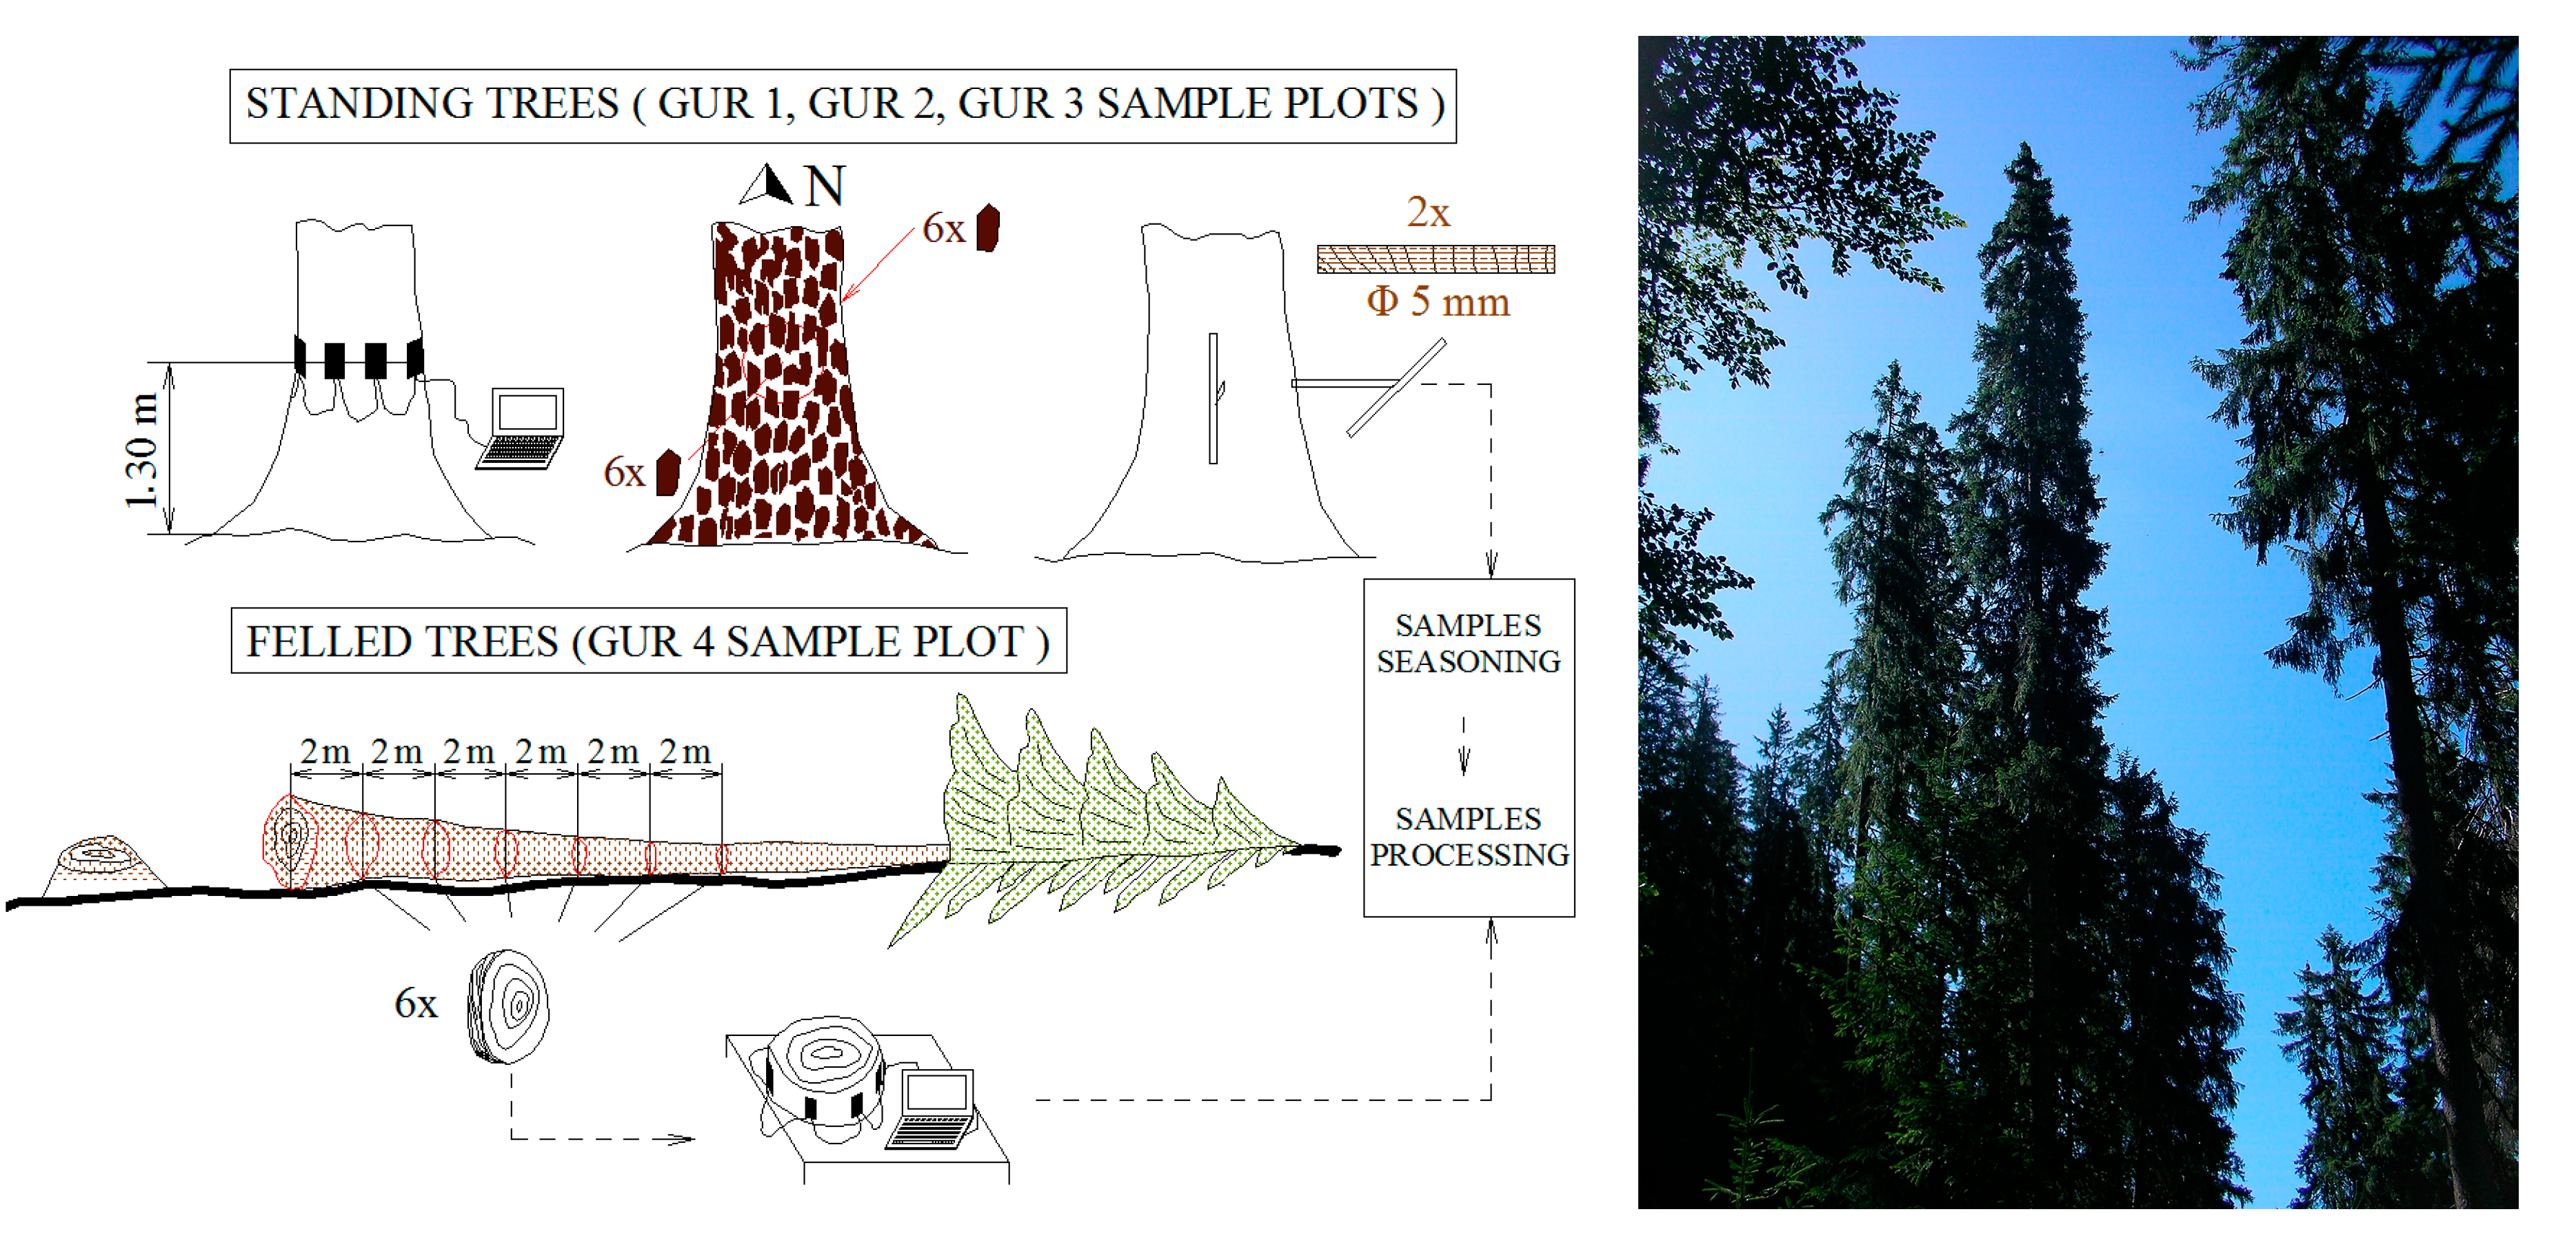
To check the link between the bark features, the wood structure, and the acoustic properties of the wood, four sample plots were established (Figure 2) in stands that had the highest occurrence of resonance spruce (identified by habitus [5,15,18]).
In the first three plots, the spruce trees with diameters larger than 20 cm were cored. The samples were collected at breast height, on two directions; one from the self-pruned sector of the bole and the other from the non-pruned sector. An increment borer with a length of 400 mm and an inner diameter of 5 mm was used (Table 1, denoted a). On the fourth sample plot (GUR4) which had undergone logging operations, 10 of the resonance trees used later by Gliga Company for manufacturing violins were selected. These 10 trees yielded 18 resonance logs from where discs were cut every 2 m—resulting in 65 discs that were used for the present study (Table 1, denoted b).
Bark samples (six bark scales) were taken at breast height from each tree and disc: three facing North and three facing South. This was done to check the influence of the various insolation conditions on the bark features [53].
2.3. Processing the Material
2.3.1. Bark Measurements
The measurements on the sampled bark were performed in the laboratory after seasoning, lasting at least three months. At the time of the measurements, the humidity of the bark scales was 11%, determined using the Ohaus MB45 halogen moisture analyzer [54] by seasoning at 104 ± 1 °C. The length LS and width WS of each scale were measured. The bark scale slenderness index (LS/WS ratio) was calculated as well. In order to quantify the colour, the CIELab chromatic system was employed [55] by using the CR-400 portable colorimeter [56]. Through this system, the colour is rendered in a space with three coordinate axes whose values are provided by the colour meter: L *—colour brightness or whiteness (%), a *—colour redness/greenness, and b *—colour yellowness/blueness. Both sides of the scales were scanned three times. A total number of 1884 scales were measured. The ability of visual perception of the colour differences between bark samples was checked using the colour difference index ΔE * resulted from calculations (relation 1). Its values were balanced to the perception scales proposed by Minemura and Umehara [57]:
2.3.2. Wood Structural Data Acquisition
After seasoning, the cores were mounted on boards. The samples from the GUR2 plot, which were used for the destructive determination of the wood density, were not glued to the board as the rings were measured after the surface of the cores was smoothed. The discs and the mounted cores were sanded to meet the requirements of 1200 dpi scanning resolution. The individual growth rings were transferred to digital format using WinDENDRO (Régent Instruments Inc., Québec City, Canada) Density equipment [58]. The measurements were carried out on the images resulted from the scans. For each disc, the radii of the four cardinal points were measured.
The digital format of the growth rings consists of: ring width TRW, earlywood width, latewood width LWW, earlywood proportion, and latewood proportion LWP. The raw data were stacked into chronological series. Using these raw variables, two more indices were produced for identifying the resonance wood: the difference in width between the consecutive rings DBR (mm) and the ring width regularity index RI [13,59]. For the discs, the ring circumferential regularity index CI was calculated, as percentage deviation from the average of extreme values along the girth, using the relation:
where is the circumferential irregularity of ring i, is the width of ring i on radius k of the disc.
The width of the area with resonance wood (LRE) was established according to the fluctuations TRW, LWP, and DBR along the radius [59]. The size of these features enabled the structural classification of the sampled trees (Table 2). The average structural quality class (SQC) was calculated for the trees where two cores had been extracted.
2.3.3. Acoustic Measurements
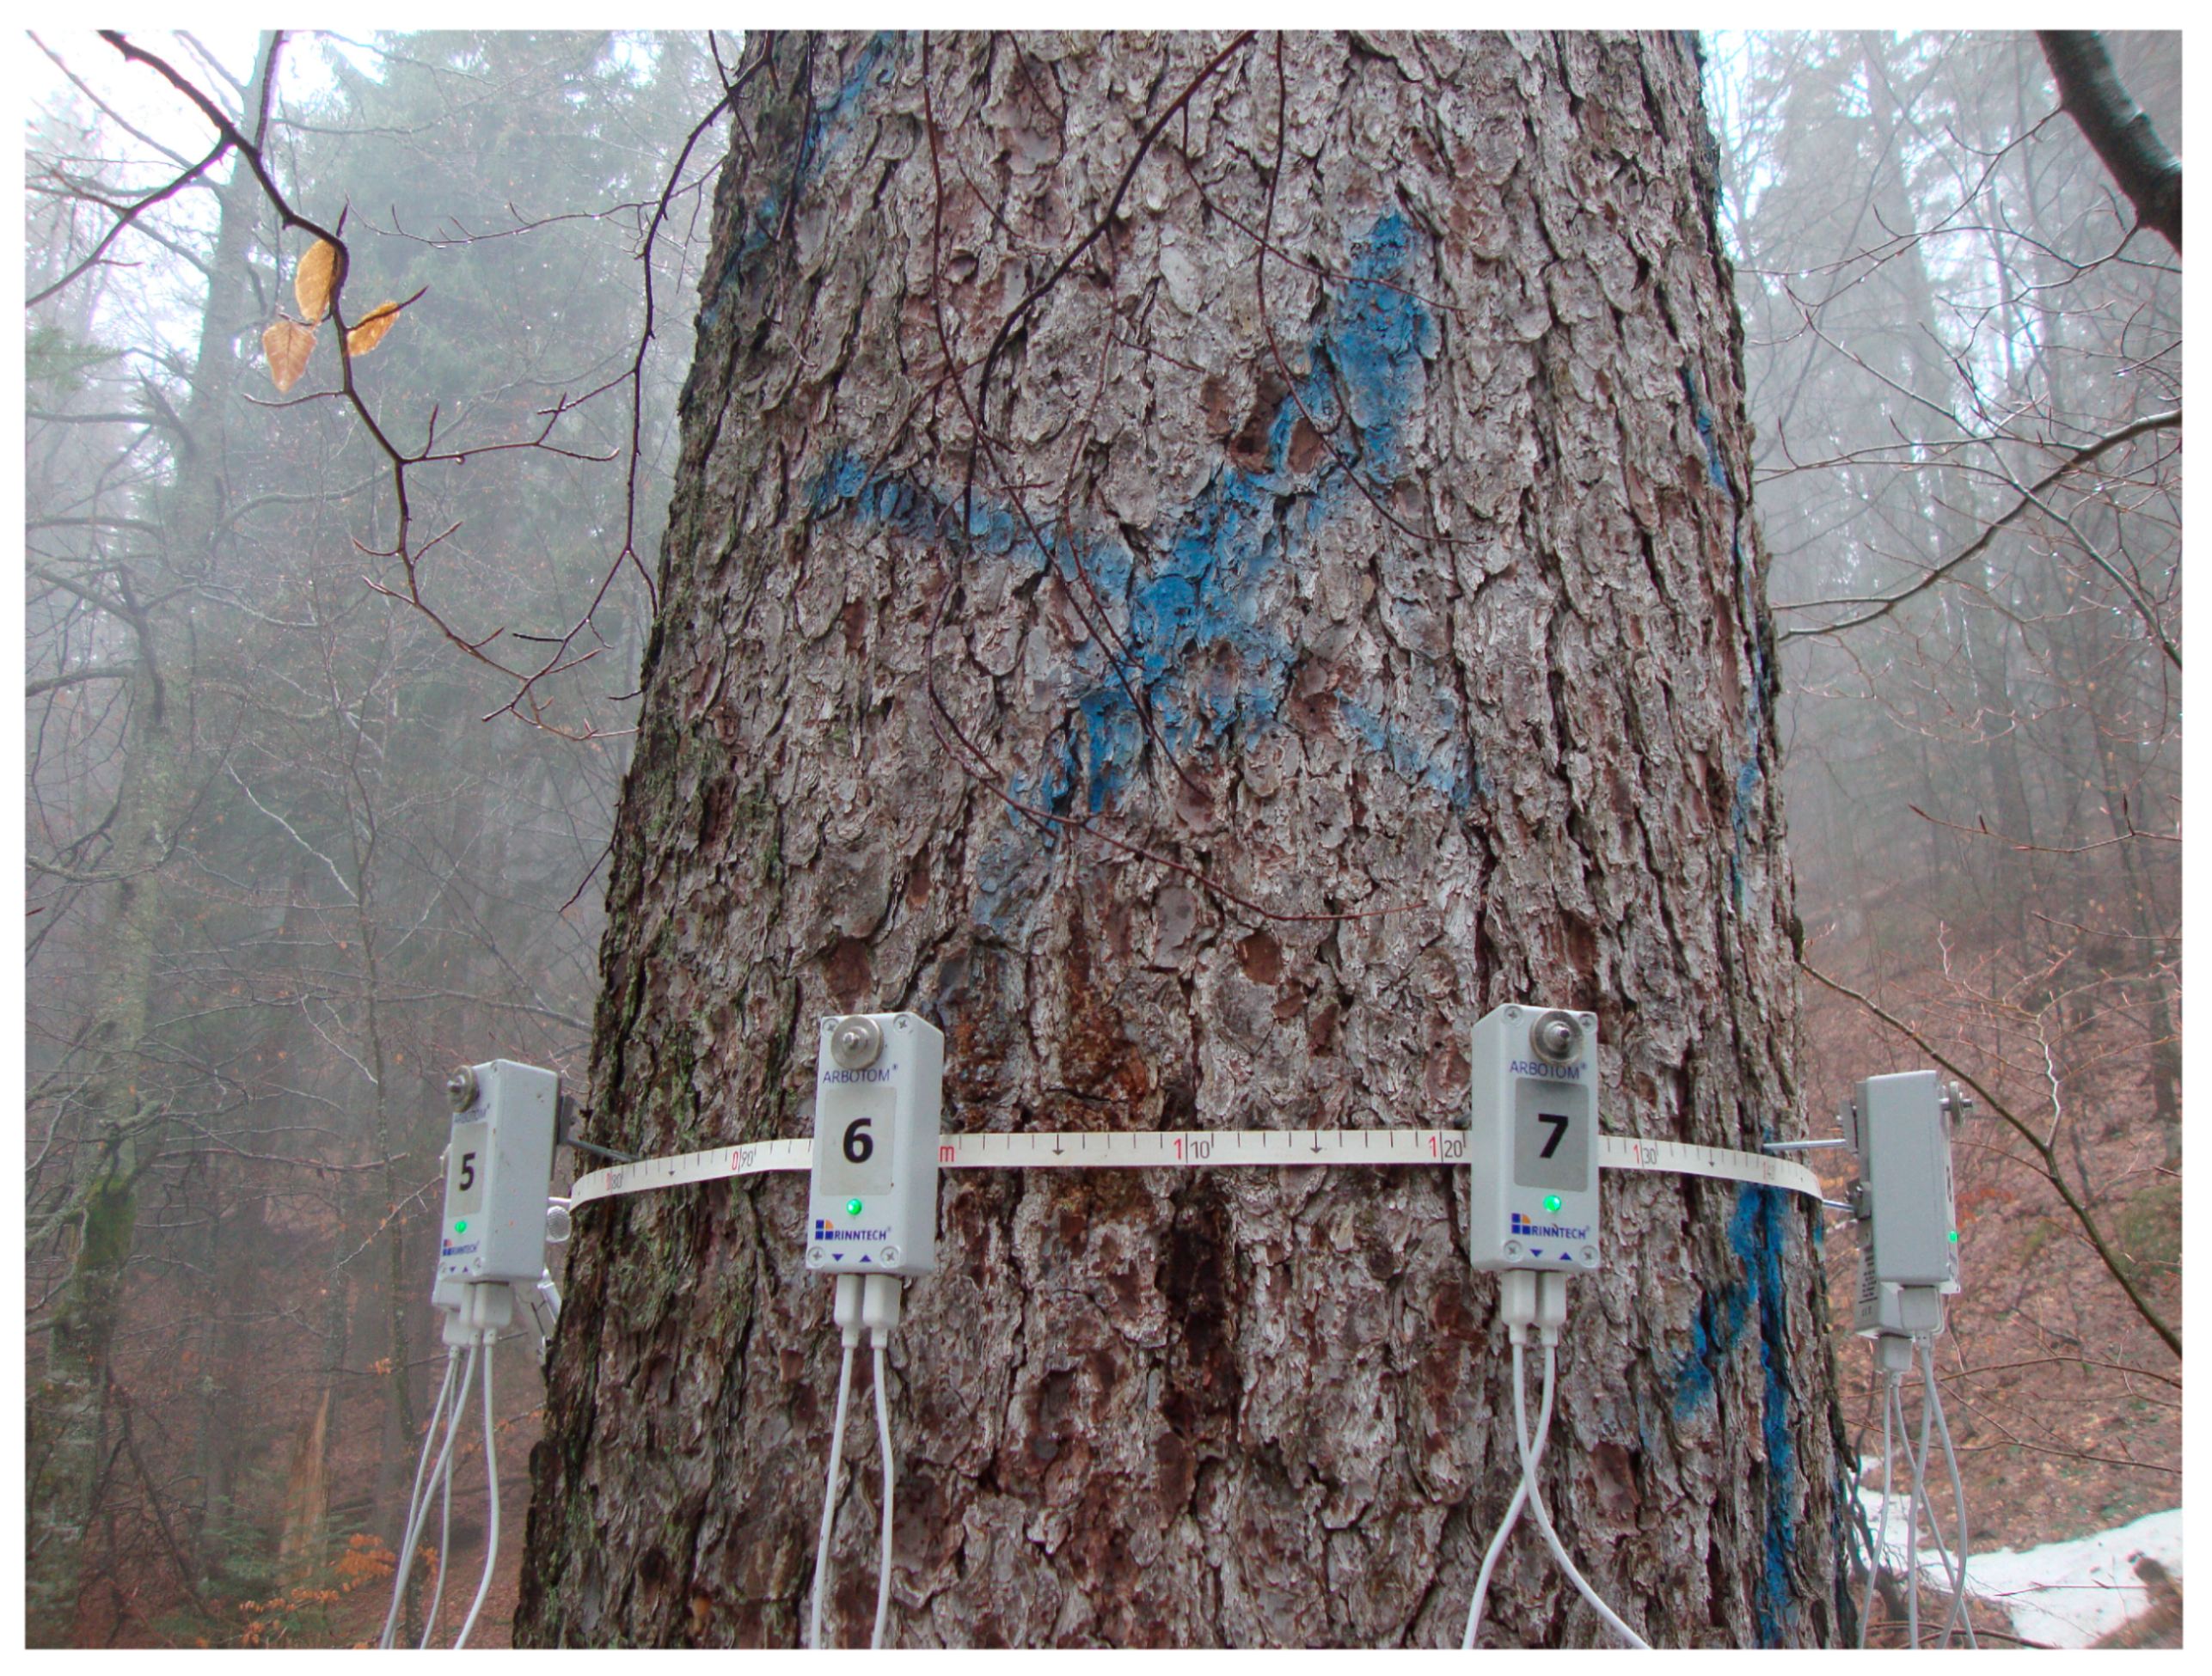
The transverse sound velocity was measured (m·s−1) in the standing trees and discs using the Arbotom sonic tomograph produced by Rinntech [60]. Although in the acoustic tests the longitudinal direction is preferred, the vibratory properties of the wood across the fibre are proportional to those along the fibre [61]. The acoustic measurements in the standing trees were done outside the vegetation season when the wood had an average moisture content gravimetrically determined, of 39% in heartwood and 98% in sapwood, and the air temperature was around 4 °C. The acoustic measurements of the discs were done in the laboratory, at the wood moisture content of 10%. The 15 sensors were put on in the breast height section of the tree, 15 to 20 cm apart (Figure 3). The position of the sensors was established according to the directions on which the coring was done in the standing trees, or the rings were measured in the discs. The sensors were hammered five times with the same force. The software associated to the Arbotom equipment generated the sound velocity matrices and the sonic tomograms.
To calculate the radiation ratio and the specific acoustic resistance (impedance), the wood basic density of the cores from the GUR2 plot was measured. For this purpose, the saturation method developed by Keylwerth [62] was used. The resin was removed from the cores through classic extraction using the Soxhlet device [63] because resin biased the acoustic radiation [64] and the wood density size.
Then, the cores were divided according to the quality sections of the wood structure: wood of structural quality for manufacturing musical instruments and wood with no structural qualities, respectively (Table 2). The solvent was a mixture of benzene and absolute ethyl alcohol 2:1 [65]. The extraction lasted 12 h for each sample. Saturation was obtained by boiling in distilled water for 12 hours [66]. After boiling, the samples were weighed, resulting the mass mmax, then dried in a drying oven at 103 °C until constant mass was achieved [67]. After cooling in an exicator, they were weighed again (mass m0). The basic density size (resulted from the following calculation [68]:
2.4. Data Processing
In the case of the split discs, only the values on the directions that did not cross the shake were kept in the sound velocity matrix. In the statistical processing, the sound velocity values lower than 600 m·s−1 were removed. The rough data were imported and processed using STATISTICA 8.0 [69].
Simple, multiple, and partial correlation analysis was employed in order to quantify the dependence between the variables [70]. Multiple correlation was used in order to identify and estimate the influence of the explicative variables. Only the variables with a statistically significant coefficient of partial regression (as confirmed by the t test) were considered. Some of the links were transposed into regressions. The regression model with the highest determination coefficients was adopted. To avoid multicollinearity, the relation between the predictors was verified beforehand, and only the explicative variables independent from one another were retained in the model.
The structural quality class of the basal area wood was adopted as a criterion for the stratification of the morphological tree features. Only the variables showing a link with SQC previously confirmed using a significance test were stratified. When selecting this test, the normality of the distributions was interrogated using the Shapiro-Wilks test. For the Gaussian type variables, ANOVA was adopted, and the non-parametric Kruskal-Wallis test or rank tests were adopted for the other variables [70].
3. Results
3.1. The Variability of the Bark Features
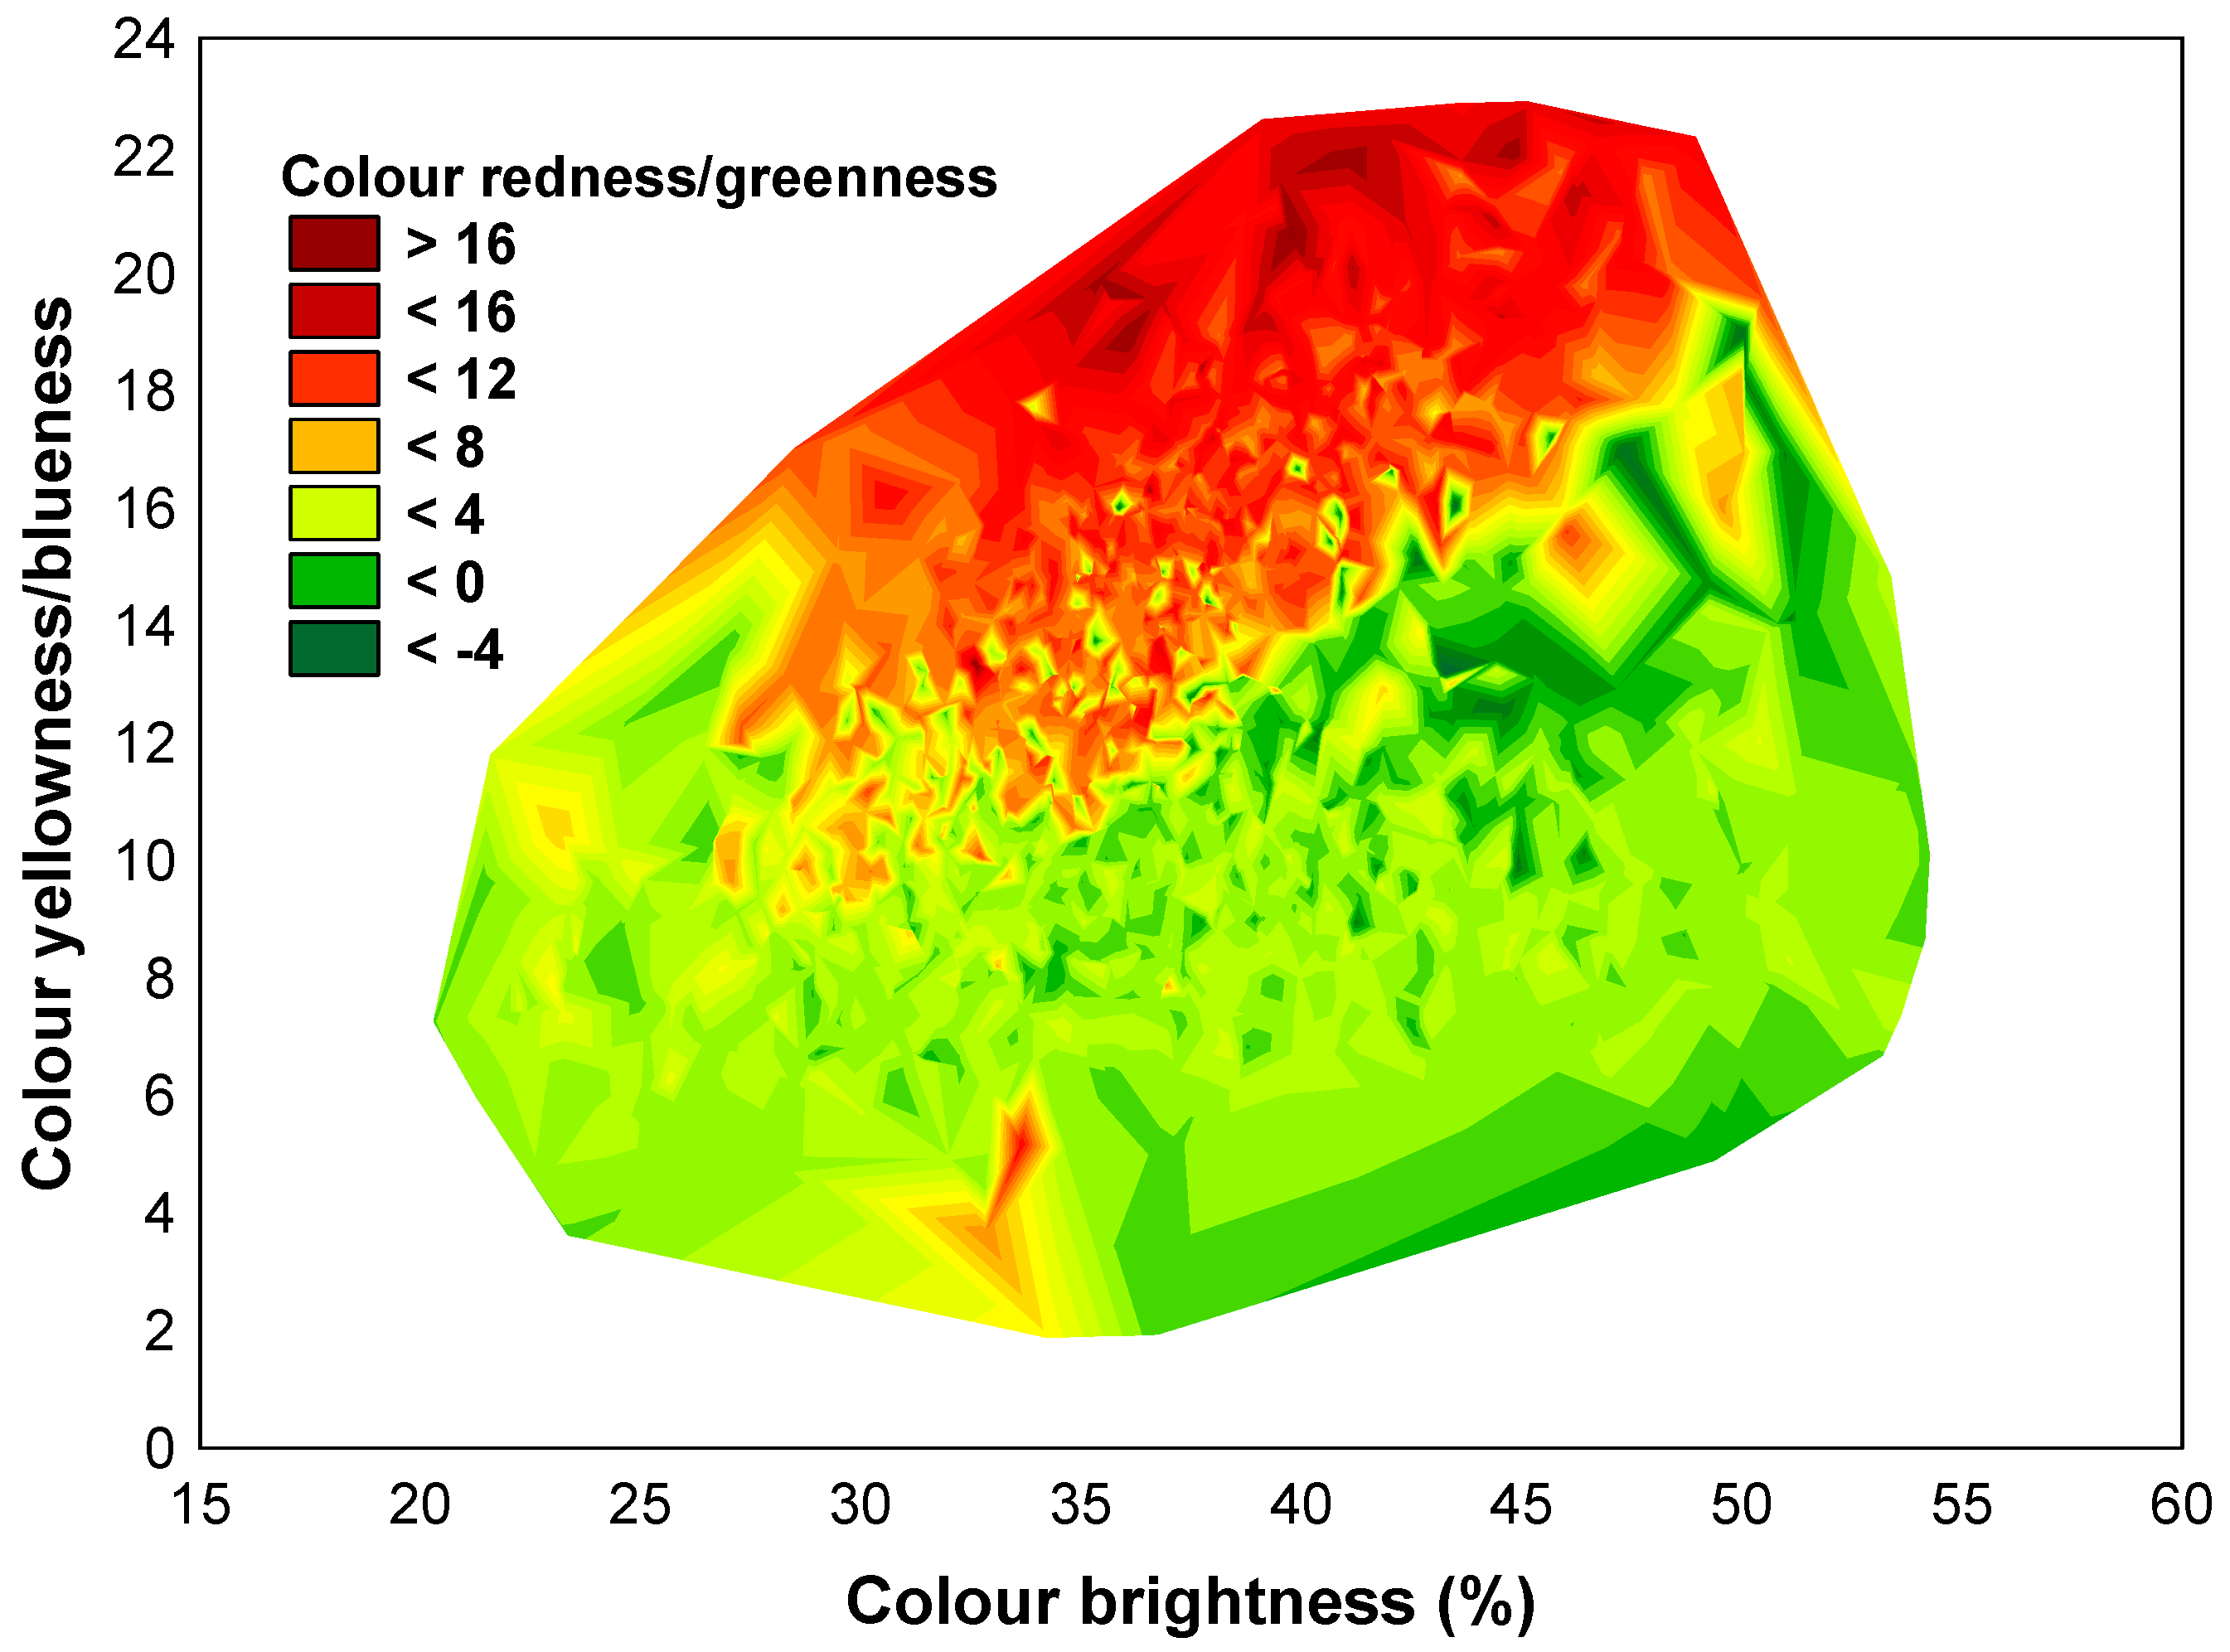
The examined bark features (scale size and colour) were moderately variable (coefficients of variation between samples from 15.7% to 32.9%)—excepting scale colour redness/greenness—which was highly variable (coefficient of variation of 82.6% and the largest amplitude). None of these variables had a Gaussian allure (W > 0.850, p < 0.0001). All were variables with continuous variations, some with high percent relative range, such as colour redness/greenness and scale length (376% and 235%, respectively, without outliers), and others with low percent relative range, such as colour brightness (91% without outliers). Even if they were continuous variables, the bark chromatics tended to separate into classes of values which distinguish the grey-barked trees from the brown-barked trees (Figure 4).
Negative values for variable b * were not recorded, so blue was not detected in the composition of the bark scale colour. The negative values of a * (scale greenness) had a 7.3% frequency and were identified only on the external side of the scales—especially on the south-facing side of the trunk.
The bark features are stable among trees inside the sample plot (Table 3). The sample plot is the main source of variation for scale size, slenderness, and brightness—but not for bark scale redness/greenness and yellowness. There are differences between the northern and southern side of the bark from the trunk for redness/greenness and yellowness, and for scale width—but not for scale slenderness (Table 3). Both colour variable values are higher on the southern side. The values are more stable from plot to plot on the northern side.
The scale sizes have a total contribution of 94% to the variation of their slenderness (multiple R ≤ 0.590, F = 7475, p < 0.001). The relation between scale shape and colour is weak: Spearman R rank order correlations between −0.156 (p < 0.001) and 0.048 (p = 0.15).
The contribution of tree age to the variation of the bark phenotype is up to 6.8% (Spearman R rank order correlations with age between −0.180 and +0.261, p = 0.01–0.98). The size and range of the scale slenderness index decrease with tree age (H = 10.40, p = 0.03). The influence of tree age on the bark colour was only detected on the external side of the north-facing scales (p = 0.01–0.05, compared to 0.06–0.98 on the southern side). On the internal side of the scales, slightly distinguishable was only the decrease of the colour brightness with age (R = −0.176, p = 0.05). The oldest trees (older than 300 years) were different from the younger trees in the low yellowness on the external side of the north-facing scales (H = 9.41, p = 0.05). The bark colour differences (ΔE *) between the northern and southern side of the stem—as well as between the internal and external side of the scales—were not influenced by tree age (H = 1.99, p = 0.74 and H = 2.60, p = 0.63, respectively).
The bark colour variation from one sample plot to another is explained as well by the altitude range. The altitude share to the scale features variation is up to 13%: Spearman R rank order correlation R with bark yellowness on the northern external side of the scale = +0.364, p < 0.001; R with bark redness on both the northern and southern external side of the scale = −0.288 respectively −0.264, p < 0.001; R with scale length = −0.159, p = 0.04.
All the colour differences ΔE * between the scales were, without exception, visible to the naked eye—at least at a “light” level of visual assessment (ΔE * > 0.70), according to Minemura and Umehara’s classification [48]. The colour differences between the two trunk sides (northern and southern) reached “considerable” and “important” levels (3.9–9.9), while the differences between the scale sides were “very important” (10.2–13.6). The colour differences between the scale sides are considerably higher between the trunk sides and are due to the redness/greenness and yellowness (H = 1279.45, p < 0.0001 and H = 970.15, p < 0.0001, respectively). More precisely, the scale internal side is more reddish than the external side.
3.2. Linking Bark Features to the Wood Structure
The qualities of bark as a marker of wood structure were analyzed using correlation and statistical significance tests.
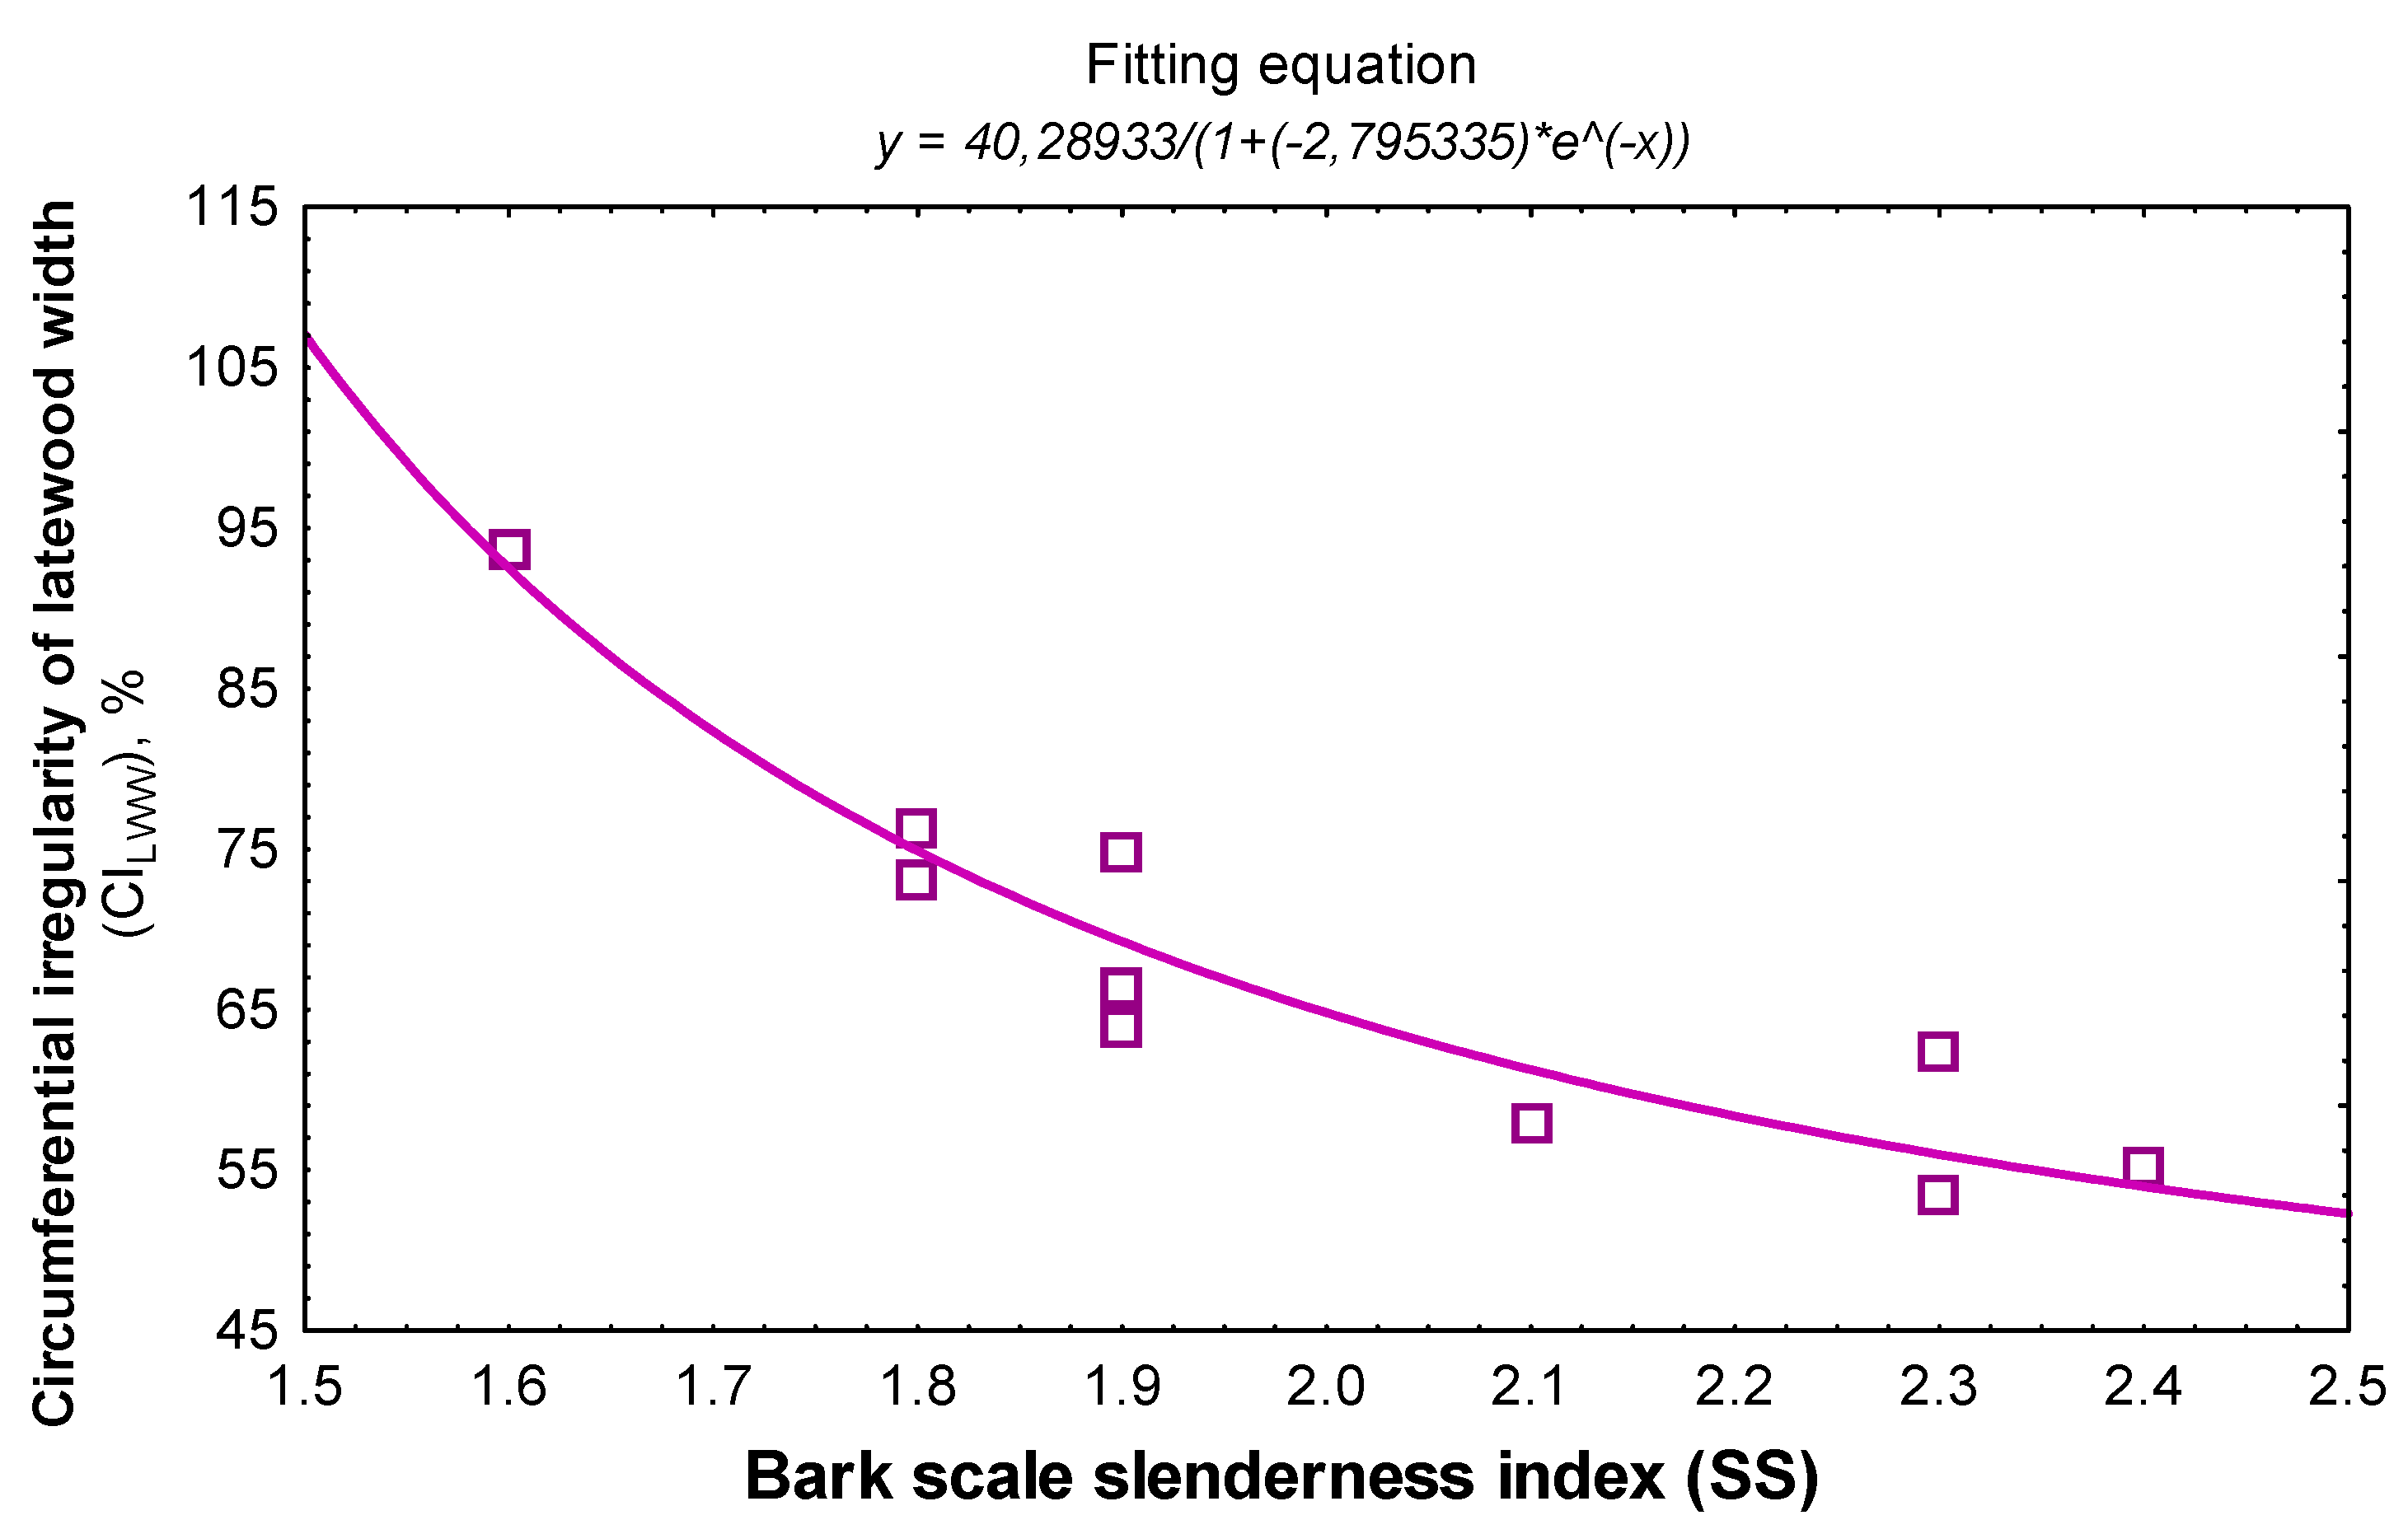
The length and width of the scale’s variation is independent of the wood structure (Spearman rank order correlation ≤0.16, p > 0.09). By contrast, the scale slenderness index is strongly connected to the ring structure regularity (Table 4). The link is even better if tree age is joined (multiple R). If its influence is filtered, the contribution of the scale slenderness index to the estimation of the circumferential irregularity is at least 73% (square partial r). DBH is not determinative in the link between scale slenderness and wood structure (Table 4). The bark descriptor with the closest link to wood structure is the circumferential irregularity of latewood width (Table 4). Logistic growth fitting best describes the link between the two variables (Figure 5). Similarly, the link between scale slenderness and circumferential irregularity of ring width is better expressed by the polynomial model. All these links indicate that trees with better annual ring regularity show high slenderness scales. If the threshold value of the latewood irregularity of 70% [13,59] is applied in Figure 5, then the scale slenderness indices must be at least 1.9 for resonance spruce trees.
The multiple regression analysis indicates that the width of the resonance zone at breast height level was rendered well by the brightness and redness of the bark scales (F = 7.23, p = 0.0002). The trees with scales that were redder and darker on the north-facing side of the trunk have a wider resonance zone.
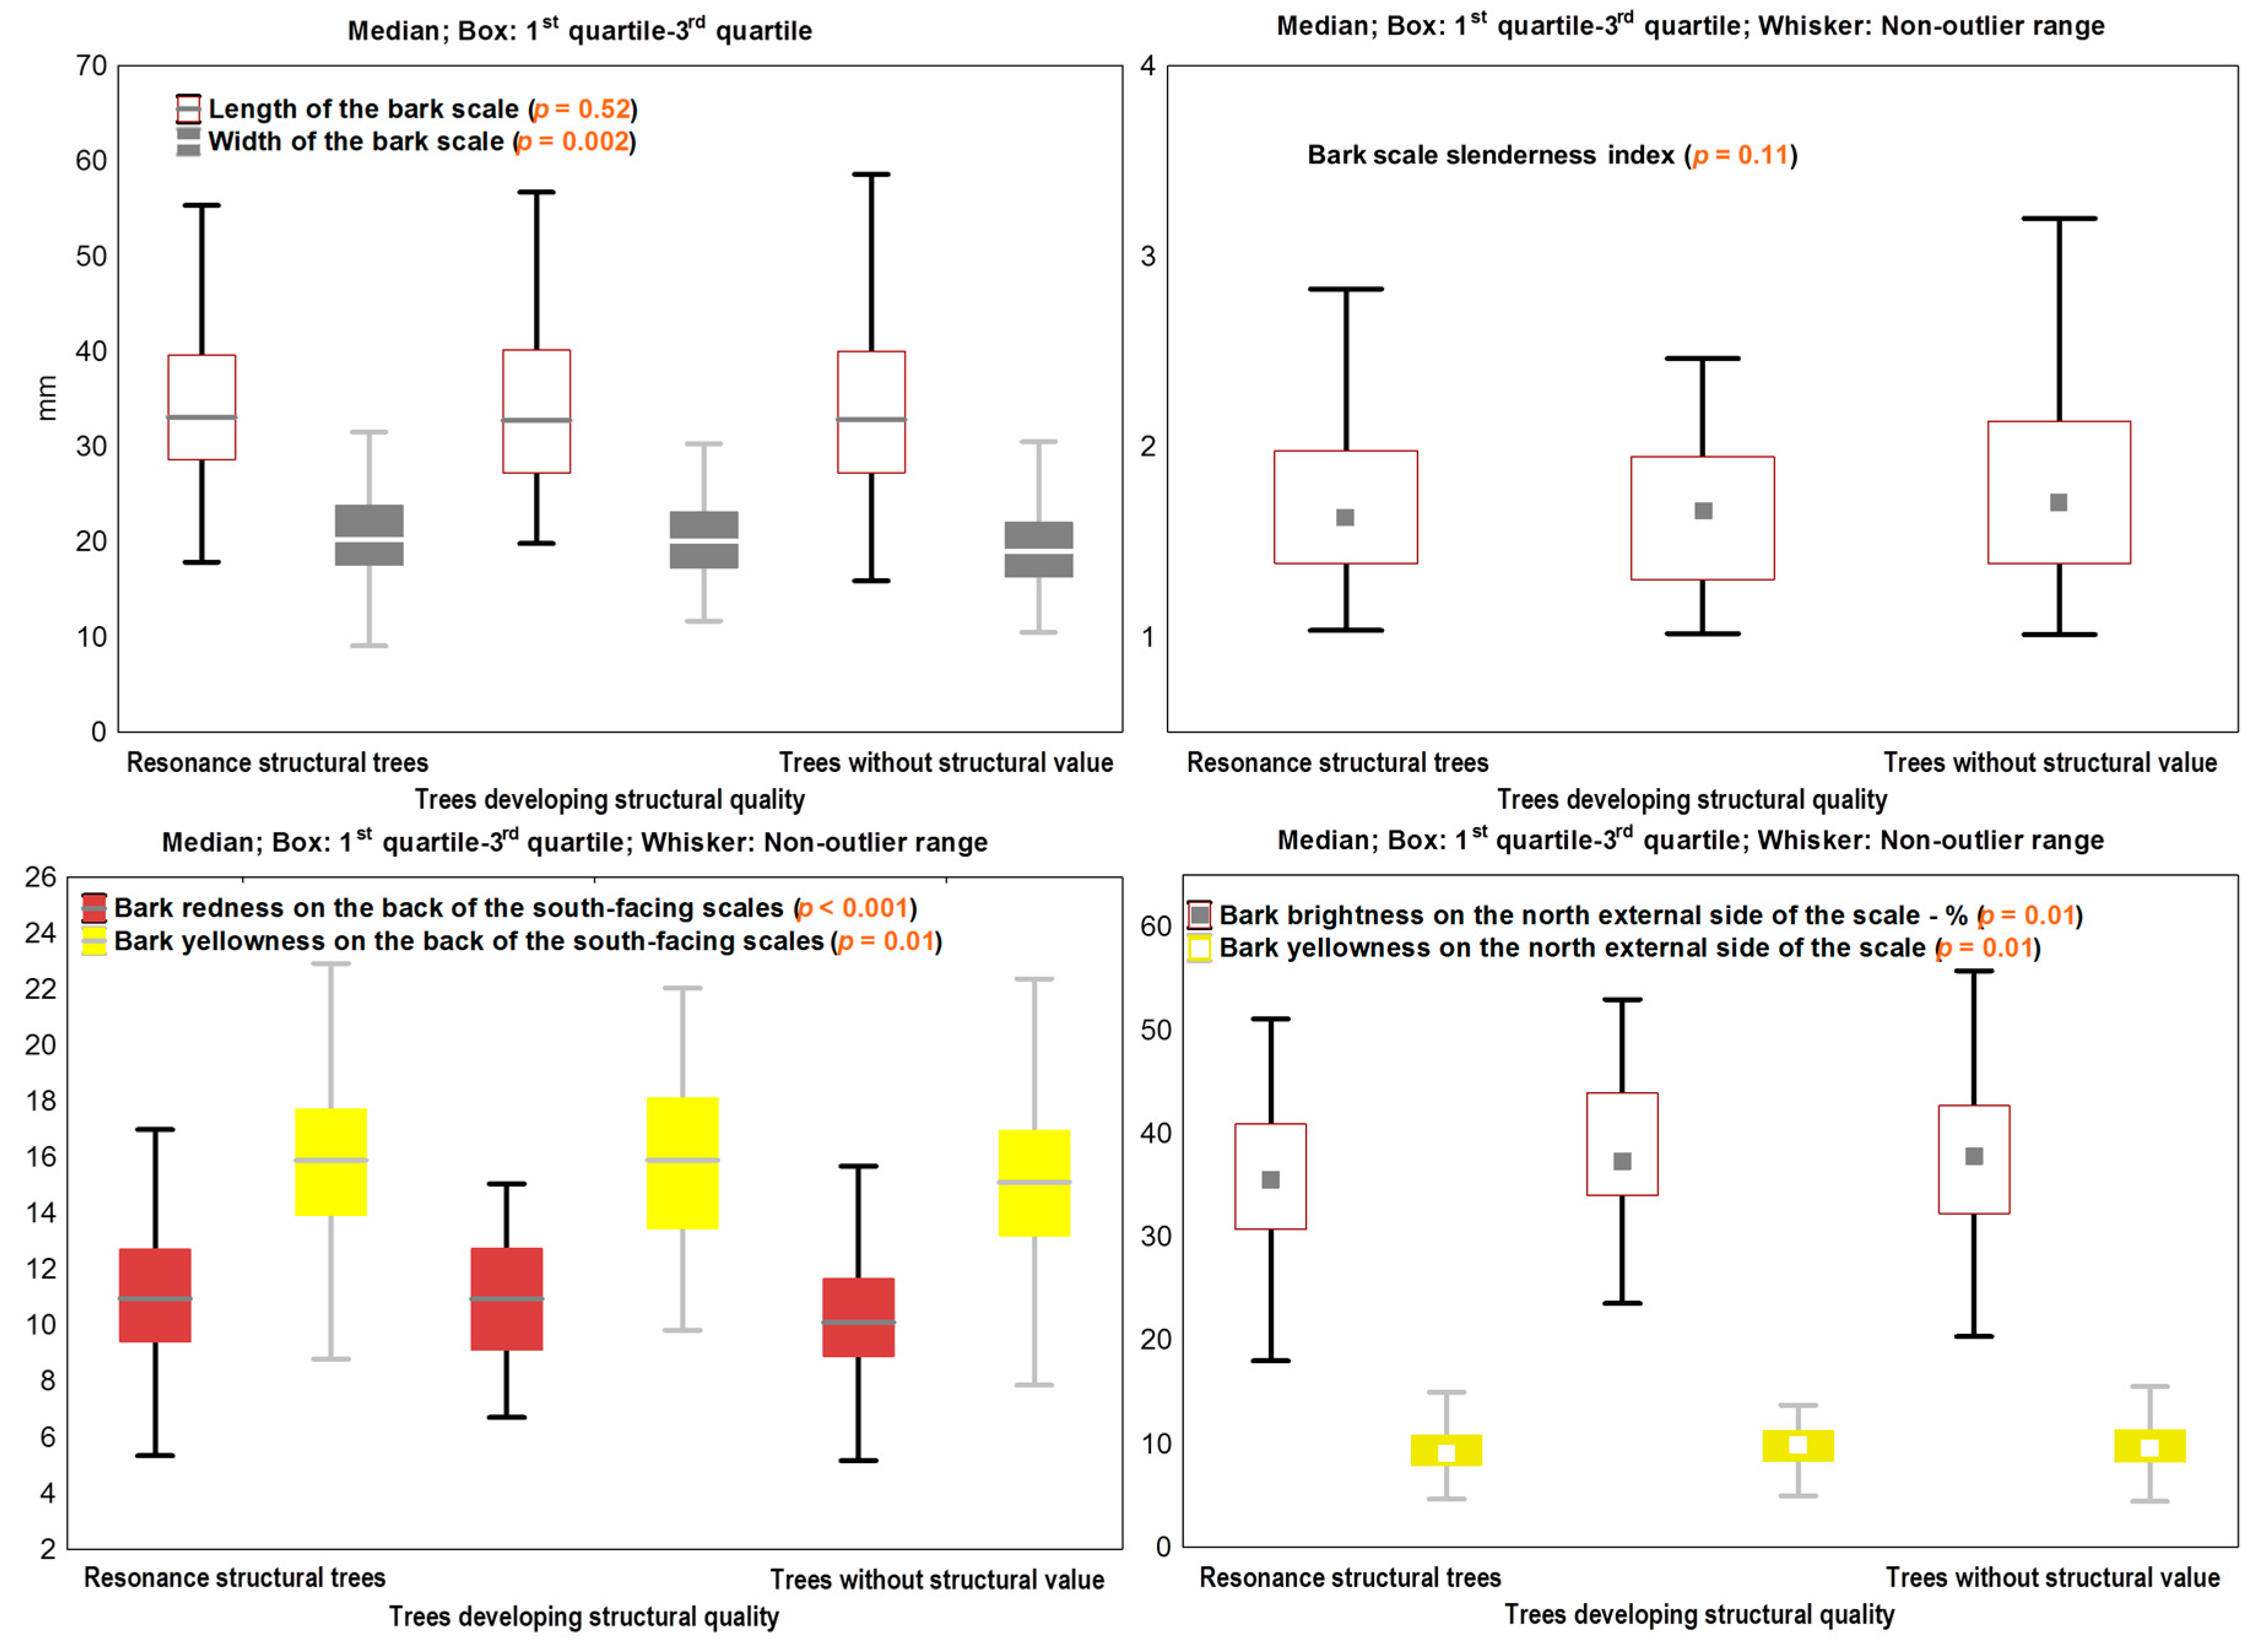
Some of the tree variables were grouped according to the structural quality of the wood; Figure 6 only shows the variables of interest for this research, as well as the variables of bark colour for which p ≤ 0.05. The bark scale slenderness index and length do not appear to be connected with the wood structure quality (Figure 6). However, the bark scales of resonance structural trees are somewhat wider.
Furthermore, the values of the chromatic components were polarized according to the structural quality class (Figure 6). However, the differences between the structural classes regarding bark scale colour are not major and only refer to one of the scale sides—either the northern or the southern side. After the stratification of the colour components depending on the cardinal points and their position on the scale sides, four chromatic markers of SQC became apparent (Figure 6): bark brightness on the north side, the redness on the back of the south-facing scales, and the yellowness on both sides of the bark. The contribution of tree age was irrelevant: the correlation coefficients between the chromatic coordinates and the tree age are below 0.200, p > 0.04. The tree diameter has a contribution of up to 7.3% to the colour variation.
Even if the differences in bark colour between the trees are not significant—they are visible to the naked eye as proven by values ΔE* (Table 5). The northern side of the trunk is the most suitable for this purpose. The strongest differences occur between extreme quality classes. Trees with a matured (SQC ≤ 3) or developing (SQC = 4) structural quality can be easily distinguished (at the “considerable” and “important” levels of visual assessment) from the trees with no such qualities.
3.3. Acoustic Screening of Bark Markers
The measured acoustic features of the wood have a low variability level (Table 6). All the acoustic variables examined are Gaussian (W from the Shapiro-Wilk test has values higher than 0.93, p > 0.07), which encouraged the application of ANOVA as a significance test. The values of the sound velocity can be grouped according to the sampled variation sources. Of interest is the assigning structural quality class to transverse sound velocity and radiation ratio (the highest values of these acoustics in quality class 3 and the lowest values in quality class 5, both in the standing and felled trees).
Among the measured bark features, only colour offers clues about the acoustic properties of the wood. The basic density of the wood (without extractable) cannot be explained by any of the measured bark features. The extractable content in benzene-alcohol of the measured spruce cores is due to the resin (average value of 5.26% of dry weight).
The transverse sound velocity is explained by the redness of the bark: the trees which carry sound better have redder scales on the outside and less red on the inside (Table 7). Trees with a more yellow bark on the scale outside have less sound flowing wood—and therefore a lower capacity for sonic energy (Table 7).
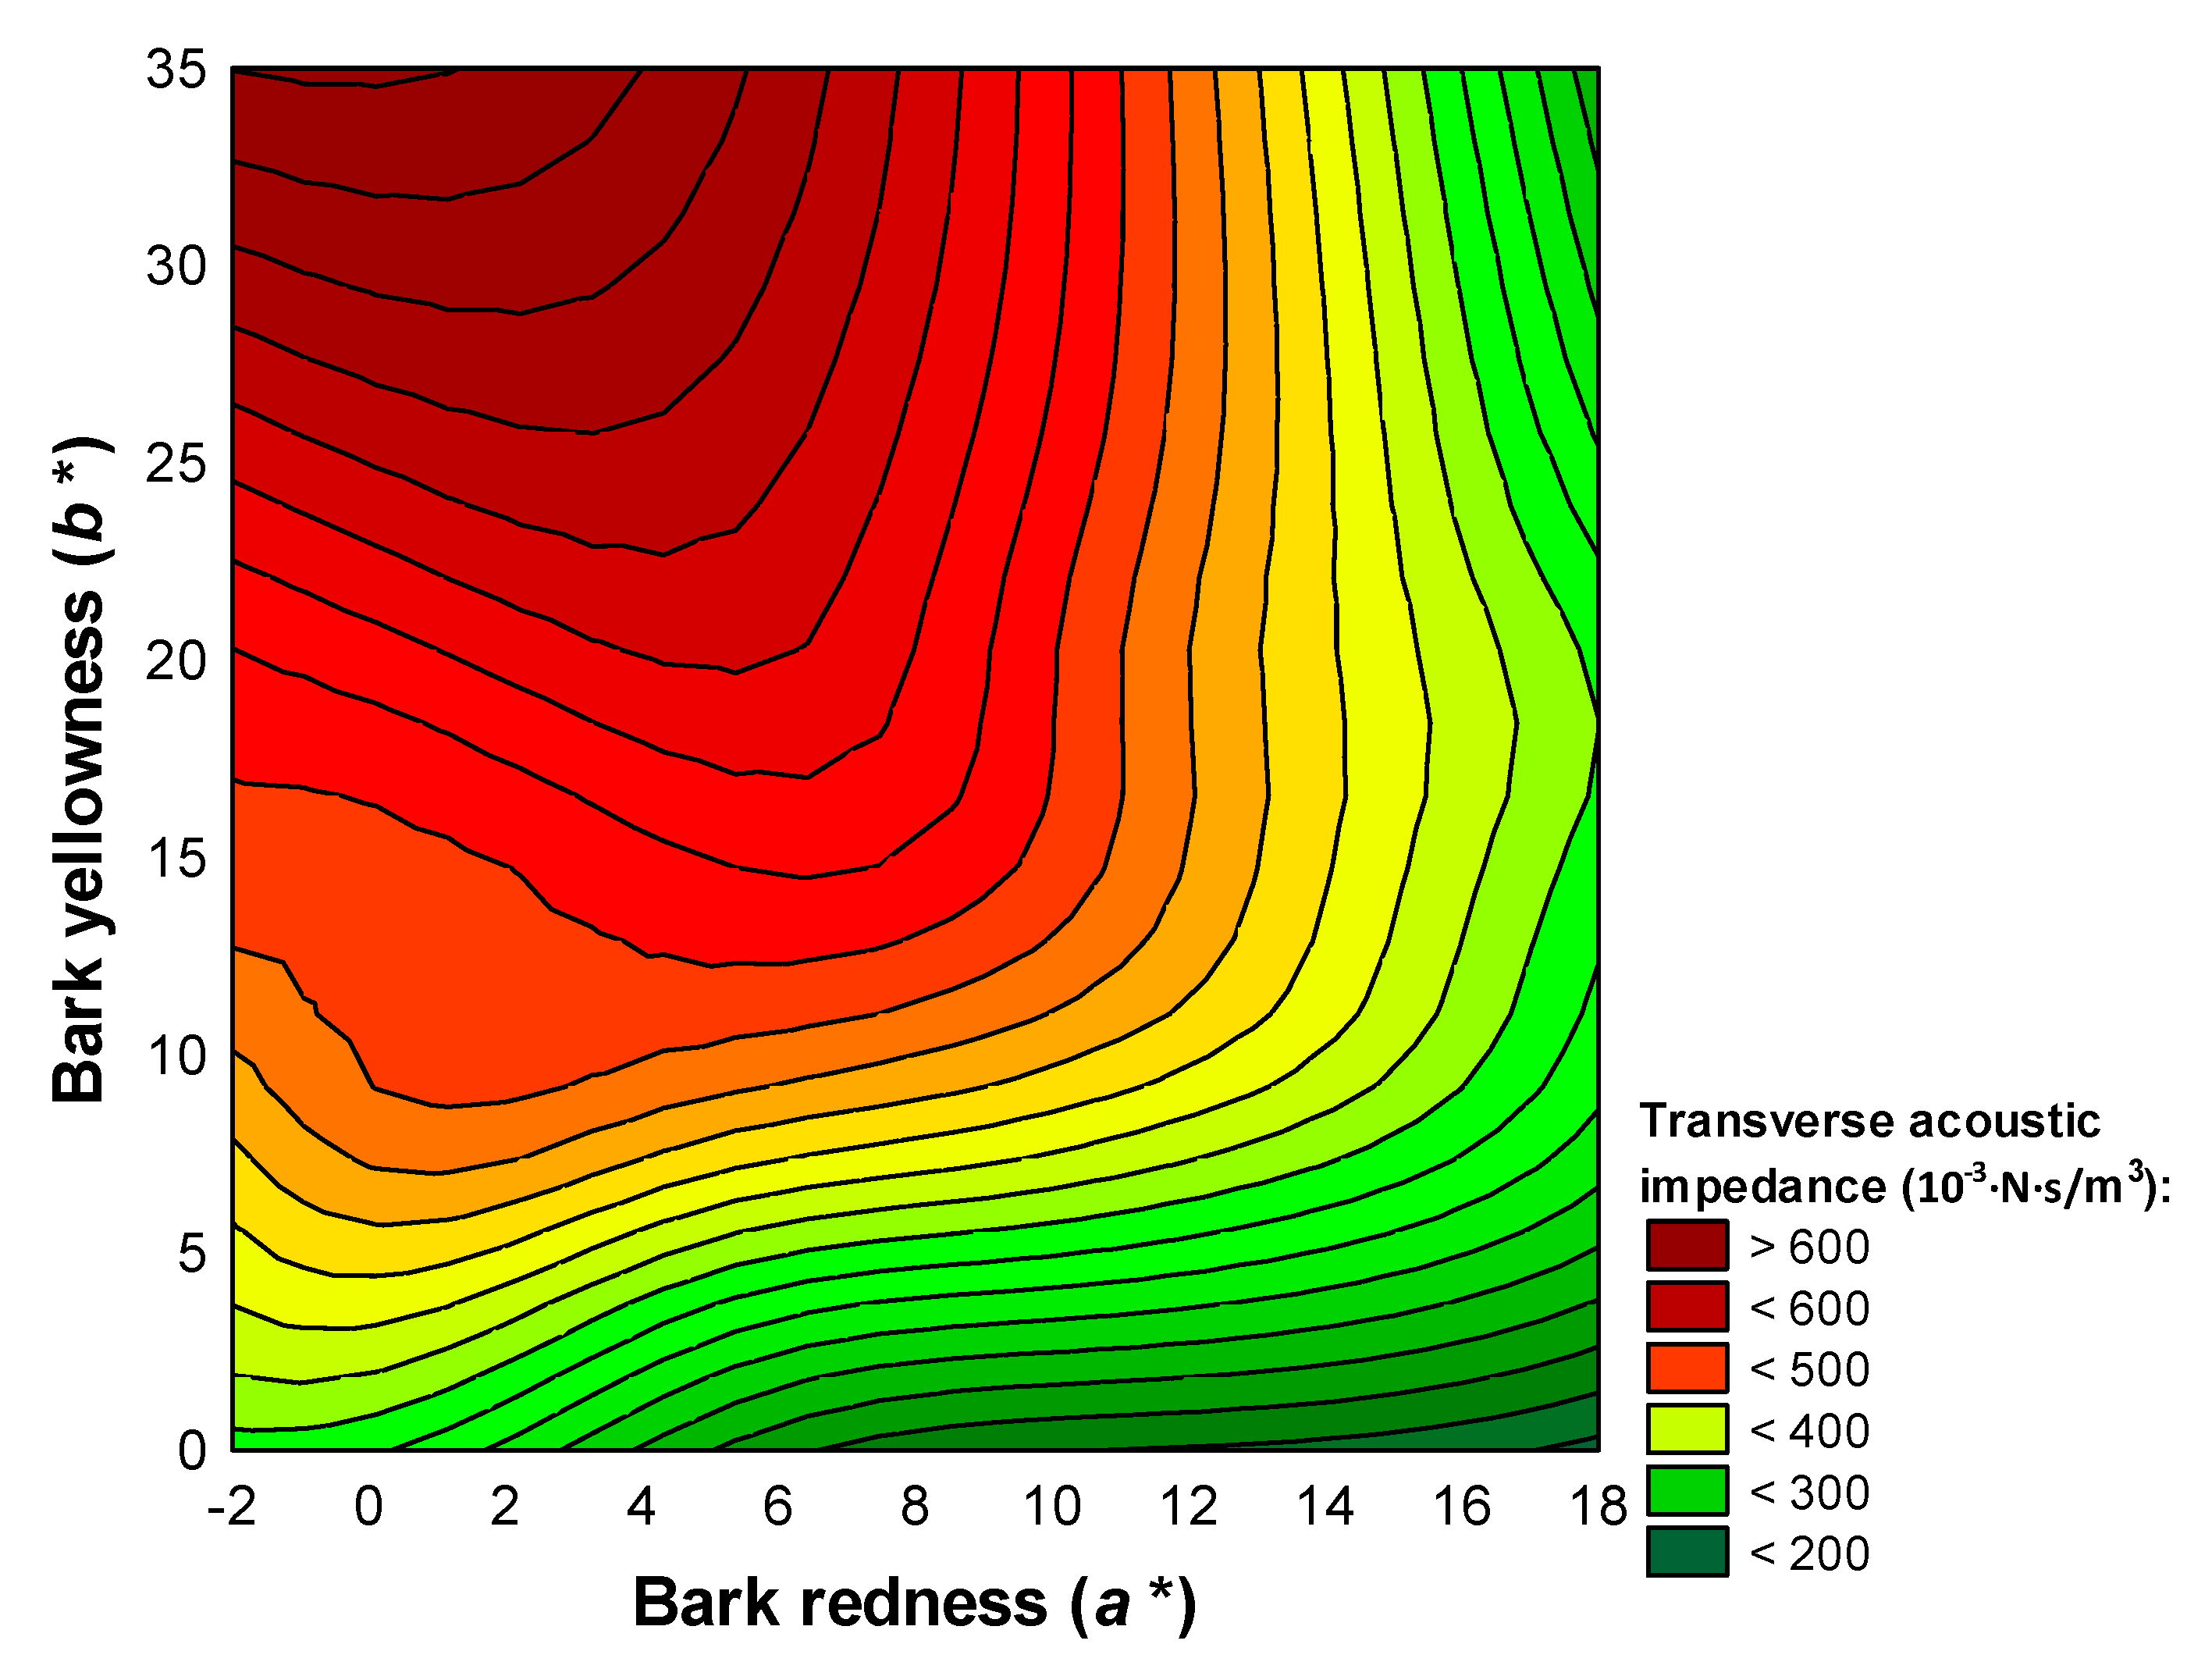
The assigning of bark scale colour to wood acoustic impedance can be observed in Figure 7 and helps to conclude that trees with better acoustic emission have redder and less yellow scales.
4. Discussion
Joining the morphological features of the trees to the connection between wood structure-acoustic properties simplifies the identification of the trees that supply material for manufacturing musical instruments—offering luthiers expeditious criteria. These criteria should not replace the acoustic testing of the rough material, which is done by most luthiers only at the rudimentary level of hitting the trunk and examining the emitted sounds [42,71], or safer still, after the flitches are dry when the velocity of the longitudinal sound propagation is checked [4].
The relevance of the morphological bark and crown features in relation to the acoustic properties of the wood [8] lies in the contribution to the elastic-mechanical wood features of: crown metrics [72], stem knottiness [73], the repeated sway of the trees, and the factors that generate compression wood [51,74] and fibre twisting [12].
The “bark features-wood acoustics” relationship appears to be obscure. To provide an explanation, it is assumed that this relation is still manifested through the wood structure—a consequence of a common genetic control—similar to the one in spruce which guides the blooming of trees and the growth cessation simultaneously [75,76,77]. The comparison is not forced, since the phenology of the buds and the wood structure have common heredity [78], and resonance spruce is a late bud phenotype [5], with weak growth [59] and preference for the green colour of female strobili [6]. In spruce plantations outside the natural range, the stability of the bark features was noticeable, which explained the predominant contribution of heredity in their expression [22]. The genetic control of spruce bark features manifests through polygenes—in particular, at least two to three pairs of non-allelic genes for bark colour [79]. The weak correlation of bark colour with scale shape [79], confirmed by our analysis, suggests the control of these bark features through neighbour genes on the chromosome, with linked transmission [79].
The shoot colour in spruce has topoclinal variation [80] in which the lowland populations exhibit brownish bark, and the highland populations have grey-coloured bark [81,82]. Spruce trees from multisite comparative trials in Romania showed that the specimens with dark early rough bark originate from altitudes lower than 1000 m and are traditional populations containing resonance wood [83]. The phenotype of resonance spruce bark assigns the darker hues of scales (Figure 6)—namely more redness and less yellowness (Table 7, Figure 6). From our data, the results showed that even for a narrow altitude range (1215–1580 m) the yellowness of the bark increases with altitude while the redness decreases. Under these circumstances, the distribution of resonance trees becomes limited at medium and lower altitudes within the spruce range. In the Romanian Carpathians, resonance spruce was found at altitudes ranging between 700 and 1000 m [84], in the Metaliferi Mountains between 650 and 900 m [21], in Jura Mountains between 800 and 1000 m [53], and in the Alps between 1500 and 1900 m [10,21]. In fact, the distribution of resonance spruce is conditioned by the site ability to ensure stable soil moisture and a balanced nutrition, and to protect the trees from climatic extremes that could acoustically harm the wood structure [7,84,85]—conditions which indeed are not satisfied at high altitudes [85].
The bark redness explains the assigning of resonance wood to the Europaea variety (Teplouchoff) Schrotter, whose bark is brown-reddish [4]. The leaf and soil analyses conducted in natural spruce stands revealed a significantly smaller amount of nitrogen, phosphorus, and magnesium in the needles of brown-barked spruce trees as opposed to grey-barked spruce trees [86], which indicates a high efficiency in metabolizing these elements and explains the modest wood bioaccumulations in resonance wood [87].
The shape of the spruce bark scales is a feature with ecoclinal variation, conditioned by the quantity of light radiation responsible for the earliness of the rough bark [53]. Thus, differentiating the phenotypes according to the bark relief can be a result of site elevation, as well as the trees’ social status and spacing. In the case of Scots pine, the association of the bark relief (longitudinally versus panel-like cracked) with the crown shape (conical and paraboidal, respectively) [88] was found. In general, resonance trees are dominant and less pressured for competition at maturity [4,9]. The resonance spruce trees’ position in canopy is not the result of favouring the trees through growth, but the result of maintaining it tenaciously as the trees can reach considerable age, as shown in Table 1 [5]. In the case of poplar, it was found that MOE becomes bigger as the trees grow taller [89], so by extrapolating from spruce it can be assumed that a dominant position brings additional contribution to the elastic superiority of resonance wood. Our results show that scale shape does not appear to be relevant in relation to the acoustic properties of the wood—however, it is an indicator of its structural quality (Table 4, Figure 6). The most important clues relate to latewood regularity (Figure 5)—which is in fact a selection criterion for the rough material for violins [90]. Moreover, the latewood content has a diagnostic value superior to the growth ring width in relation to its acoustic use [91]. The regularity of the anatomical structures is a key feature of the suitability for musical instruments [13,92].
The structural features of trees are priority when choosing logs for musical instruments—even if they are occasionally viewed reluctantly [11,14,59]. Wood structure on a macroscale is a marker of acoustic features by means of wood density [90] and its direct influence on MOE [65]. In general, resonance spruce is a xylotype with a lower density than common spruce [39]. The sizes of the wood density in our sample (Table 6) are inferior to the data in the literature [14]. One explanation for this is the removal of extractables from wood and the calculation specific to the basic density (minimal weight per maximum volume). Additionally, the resonance wood in Romania is lighter than in other geographic regions from central and Eastern Europe [11], and, in the classification of spruce seed sources in Romania, the local spruce population (Gurghiu) is located in the last size class—depending on the basic density and latewood ratio [93]. In our sample, the wood density variations are independent from the variations of the bark features, as well as from those of the wood structure. In some exotics, the wood density is not relevant for the wave velocity [94].
The other acoustic properties of wood are influenced by the moisture of the material. As far as sound velocity is concerned, a ratio of 0.85 resulted between green wood and dry wood. In the case of Scots pine, this ratio was 0.92 for the tangential ultrasound velocity and 0.82 for the radial ultrasound velocity, at moistures similar to the material examined herein [95]. Thus, the depreciatory influence the moisture content has on the acoustic properties of the wood is confirmed [96]. These values refer to the transverse sound propagation, which are, in any case, relevant to the longitudinal one [49] as the wood is a high anisotropic material [97]. Additionally, there are opinions according to which the cross grain elastic properties are more important than those along the grain in the acoustic behaviour of wood [34]. By characterizing green wood (Table 6), the average found values of the transverse sound velocity and radiation ratio are similar to the data in the literature applied to European spruce selected for musical instruments, which refer to dry wood [42]. Still, the values of the transverse sound velocity we discovered in the discs—harvested from trees used later in manufacturing violins—are circa 600 m·s−1 lower than the values from the excellence class of spruce tonal wood [36]. The radiation ratio was thought to be the most important criterion for diagnosing the suitability of wood for soundboards [36].
The link of the bark features to the acoustic properties of wood changes from the northern to the southern side of the trunk, respectively (Table 7)—most likely because the acoustic properties themselves vary around stem circumference [98]. The closest relations are found on the southern side (Table 7), which explains some luthiers’ preference for the sunny side of the tree [34].
The stability of the bark features inside the sample plot (Table 3) presupposes the fact that the phenotype of resonance trees, which are few [84], is in fact a mark of the population it is part of—which in turn is an elite population according to other features—such as the pruning of the trees, the branchiness and the rarity of the wood faults [99].
Out of precaution, we recommend that the diagnosis of resonance wood be given only after the examination and comparison of all the phenotypical features that individualize it, and, where possible, the acoustic testing of the wood, regardless whether the bark is a highly trusted marker of trees with acoustic properties. Consequently, recognizing and classifying resonance wood should be a multi-criteria analysis of the trees’ phenotype [39].
5. Conclusions
In the case of spruce stands, which supply material for manufacturing violins, there is an important amount of phenotypical variability of the tree bark features between sites. The scale colour and length show topoclinal variations to a certain extent related to the altitude. From the variation sources analyzed, the location of the sample plot around circumference has the greatest impact on the morphometry and colour of the bark. The differences in bark among trees are to a small degree due to age, and are consistent only in relation to the sides of the trunk, the south-facing side being the most relevant for diagnosing resonance wood. On the north-facing side of the trunk, the differences in scale colour from plot to plot are insignificant. On the south-facing side of the trunk, the influence of the tree age is not manifested, which increases its value when characterizing the bark phenotype for spruce. The most significant differences in colour are recorded between the external and internal sides of the bark scales—which are stable with age. The differences between phenotypes regarding bark colour are significant enough to be visible to the naked eye.
The sizes of the bark are not enlightening with regard to the annual ring structure specific to resonance wood, but their ratio is a valuable marker of the regularity of this structure—especially of the latewood width regularity. The relation shows that the trees with elongated bark scales have better ring regularity around circumference. The bark colour provides valuable clues for the identification of structures with acoustic value. The resonance structural trees have less brightness and yellowness, but more redness in the bark. The differences between the wood structure qualities are recorded on the external side of the north-facing scales and on the internal side of the south-facing scales.
The size of the bark scale is not relevant with regard to the acoustic properties of the wood, but, on the other hand, the scale colour is an important marker of the acoustic quality of the material. The bark redness and yellowness on the external side of the south-facing scales have a high diagnostic value in relation to the acoustic performance of the material expressed by the sound velocity, acoustic impedance, and radiation ratio—all in transversal direction. The bark does not offer any clues regarding wood density. The phenotype of trees with acoustic properties is signaled by brown bark, high redness, and low yellowness on the external side of the scales—especially on the south-facing side of the trunk.
At least by analyzing scale colour and slenderness, the bark can be used as a criterion for diagnosing standing resonance wood.
Author Contributions
Conceptualization, F.D. and C.T.A.; methodology, F.D.; software, F.D.; validation, F.D. and M.D.S.; investigation, C.T.A.; data curation, F.D. and M.M.V.; writing—original draft preparation, F.D.; writing—review and editing, M.M.V.; visualization, M.D.S.; supervision, F.D.
Funding
The authors received no specific funding for this work.
Acknowledgments
The authors thank Petru Maran who assisted us in the map analysis, and our colleague Aureliu Florin Hălălișan, who helped us with the bark scale analysis. We are grateful as well to Alexandra Stan, for her contribution in English editing.
Conflicts of Interest
The authors declare no conflict of interest.
References
- Şofletea, N.; Curtu, L. Dendrology; Pentru Viaţă Publishing House: Braşov, Romania, 2007; pp. 40–53. [Google Scholar]
- Surmiński, J. Wood properties and uses. In Biology and Ecology of Norway Spruce; Tjoelker, M.G., Boratyński, A., Bugała, W., Eds.; Springer: Dordrecht, The Netherlands, 2007; pp. 333–342. [Google Scholar]
- Ege, K. The Piano Soundboard—Modal Studies in the Low- and Mid-Frequency Ranges. Ph.D. Thesis, École Polytechique, Palaiseau, France, 2009. [Google Scholar]
- Albu, C.T. Research on the Characteristics of Resonance Spruce Wood from Gurghiu River Basin in Conjunction with the Requirements of the Musical Instruments Industry. Ph.D. Thesis, Transilvania University of Braşov, Brașov, Romania, 2010. [Google Scholar]
- Ștefănescu, P. A Norway spruce forest site in Gurghiu Mountains containing resonance wood, located in the range of Sovata Forest District. Rev. Pădurilor 1961, 76, 85–92. [Google Scholar]
- Ștefănescu, P. Contributions to the knowledge of resonance Norway spruce from Gurghiu Mountains. Rev. Pădurilor 1964, 79, 511–517. [Google Scholar]
- Domont, P. Spruce Resonance Wood: A Jewel of Mountain Forests. Available online: https://www.waldwissen.net/waldwirtschaft/holz/verarbeitung/wsl_klangholz/index_FR (accessed on 10 July 2019).
- Fedyukov, V.I.; Saldaeva, E.Y.; Chernova, M.S.; Chernov, V.Y. Biomorphology of Spruce Trees as a Diagnostic Attribute for Non-Destructive Selection of Resonant Wood in a Forest. South-East Eur. For. 2018, 9, 147–153. [Google Scholar] [CrossRef]
- Grapini, V.; Constantinescu, N. Resonance Spruce; Forest Research Institute: Bucharest, Romania, 1968; p. 19. [Google Scholar]
- Zugliani, G.; Dotta, L. Resonance wood. Technical features and ecological conditions. Sherwood 2009, 154, 7–13. [Google Scholar]
- Krzysik, F. Problems of resonance wood sorting and use. Holzindustrie 1968, 1, 3–7. [Google Scholar]
- Hutchins, C.M. Wood for violins. Catgut Acoust. Soc. Newsl. 1978, 29, 14–18. [Google Scholar]
- Rocaboy, F.; Bucur, V. About the physical properties of wood of twentieth century violins. J. Acoust. Soc. Am. 1990, 1, 21–28. [Google Scholar]
- Bucur, V. Acoustics of Wood, 2nd ed.; Springer: Berlin, Germany, 2006; pp. 173–196. [Google Scholar]
- Zugliani, G.; Dotta, L. Resonance wood. Management, selection and manufacture in the state forest of Paneveggio. Sherwood 2009, 155, 14–18. [Google Scholar]
- Buksnowitz, C.; Teischinger, A.; Müller, U.; Pahler, A.; Evans, R. Resonance wood [Picea abies (L.) Karst.]: Evaluation and prediction of violin makers’ quality-grading. J. Acoust. Soc. Am. 2007, 121, 2384–2395. [Google Scholar] [CrossRef]
- Darnton, M. Violin Making. Available online: http://darntonviolins.com (accessed on 12 May 2009).
- Pașcovici, N. Spruce as resonance and keyboard wood. I Resonance spruce in forests. Rev. Pădurilor 1930, 46, 85–99. [Google Scholar]
- Nocetti, M.; Romagnoli, M. Seasonal cambial activity of spruce (Picea abies Karst.) with indented rings in the Paneveggio Forest (Trento, Italy). Acta Biol. Crac. Ser. Bot. 2008, 50, 27–34. [Google Scholar]
- Bonamini, G.; Uziellli, L. A simple non-destructive method to recognize resonance spruce. Monti e Boschi 1998, 6, 50–53. [Google Scholar]
- Domont, P. Development of Resonance Wood in Switzerland, Rep. no. 5.162. 2000. Available online: http://www.waldwissen.net/waldwirtschaft/holz/verarbeitung/wsl_klangholz/wsl_klangholz_rapport_final.pdf (accessed on 29 February 2016).
- Popescu, G.A. Conifers in the Hills of the Eastern and Curvature Subcarpathians; Ceres Publishing House: Bucharest, Romania, 1984; pp. 122–126, 192–200. [Google Scholar]
- Arco Molina, J.G.; Hadad, M.A.; Domínguez, D.P. Tree age and bark thickness as traits linked to frost ring probability on Araucaria araucana trees in northern Patagonia. Dendrochronologia 2016, 37, 116–125. [Google Scholar] [CrossRef]
- Otegbeye, G.O.; Kellison, R.C. Genetics of wood and bark characteristics of Eucalyptus viminalis. Silvae Genet. 1980, 29, 27–31. [Google Scholar]
- Bdeir, R.; Muchero, W.; Yordanov, Y.; Tuskan, G.A.; Busov, V.; Gailing, O. Quantitative trait locus mapping of Populus bark features and stem diameter. BMC Plant Biol. 2017, 17, 224. [Google Scholar] [CrossRef] [PubMed]
- Kalbande, R.B. Digital visual bark: An image based tool for plant diversity research, diversity in bark supports in tree identification. Int. J. Life Sci. Pharma Res. 2014, 4, 17–24. [Google Scholar]
- Boudra, S.; Yahiaoui, I.; Behloul, A. A Comparison of Multi-scale Local Binary Pattern Variants for Bark Image Retrieval. In Advanced Concepts for Intelligent Vision Systems; Battiato, S., Blanc-Talon, J., Gallo, G., Philips, W., Popescu, D., Scheunders, P., Eds.; Springer: Cham, Switzerland, 2015; Volume 9386, pp. 764–775. [Google Scholar]
- Nicolai, V. The bark of trees: Thermal properties, microclima and fauna. Oecologia 1986, 69, 148–160. [Google Scholar] [CrossRef]
- Rossel, J.A.; Castorena, M.; Laws, C.A.; Westoby, M. Bark ecology of twigs vs. main stems: Functional traits across eighty-five species angiosperms. Oecologia 2015, 178, 1033–1043. [Google Scholar] [CrossRef]
- Wang, X.H.; Ma, X.H.; Jin, G.Q.; Chen, L.Y.; Zhou, Z.C. Variation pattern of individual types and wood characters in natural stands of Schima superba. Sci. Silvae Sin. 2011, 47, 133–139. [Google Scholar]
- Mihai, D. Research on Fir Variability in Romania with a View to Expand Valuable Specimens to Plantations. Ph.D. Thesis, University of Brașov, Braşov, Romania, 1978. [Google Scholar]
- Ogata, A.; Itai, A.; Nishiyama, M.; Ikeda, H.; Kanahama, K. Analyses of early rough bark phenotype found in seedlings of a cross between the European pear ‘Bartlett’ and the Chinese pear ‘Yali’. Sci. Hortic. 2012, 148, 1–8. [Google Scholar] [CrossRef]
- Carlisle, A. A guide to the named variants of Scots pine (Pinus silvestris, Linnaeus). Forestry 1958, 31, 203–224. [Google Scholar] [CrossRef]
- Schelleng, J.C. Wood for violins. Catgut Acoust. Soc. Newsl. 1982, 37, 8–19. [Google Scholar]
- Ono, T.; Norimoto, M. On physical criteria for the selection of wood for soundboards of musical instruments. Rheol. Acta 1984, 23, 652–656. [Google Scholar] [CrossRef]
- Meyer, H.G. A practical approach to the choice of tone wood for the instruments of the violin family. Catgut Acoust. Soc. J. 1995, 2, 9–13. [Google Scholar]
- Brémaud, I. What Do We Know on “Resonance Wood” Properties? Selective Review and Ongoing Research; Societé Française d’Acoustique: Nantes, France, 2012; pp. 2760–2764. [Google Scholar]
- Wegst, U.G.K. Wood for sound. Am. J. Bot. 2006, 93, 1439–1448. [Google Scholar] [CrossRef] [PubMed]
- Brémaud, I. Acoustical properties of wood in string instruments soundboards and tuned idiophones: Biological and cultural diversity. J. Acoust. Soc. Am. 2012, 131, 807–818. [Google Scholar] [CrossRef] [Green Version]
- Woodhouse, J. The acoustics of the violin: A review. Rep. Prog. Phys. 2014, 77, 115901. [Google Scholar] [CrossRef]
- Mania, P.; Fabisiak, E.; Skrodzka, E. Investigation of modal behaviour of resonance spruce wood samples (Picea abies L.). Arch. Acoust. 2017, 42, 23–28. [Google Scholar] [CrossRef]
- Haines, D.W. On musical instruments wood. Catgut Acoust. Soc. Newsl. 1979, 31, 23–32. [Google Scholar]
- Bucur, V. Towards an objective assessment of violin wood properties. Rev. For. Fr. 1983, 32, 130–137. [Google Scholar] [CrossRef]
- Ouis, D. Vibrational and acoustical experiments on logs of spruce. Wood Sci. Technol. 1999, 33, 151–184. [Google Scholar] [CrossRef]
- Gilbert, E.A.; Smiley, E.T. Picus Sonic tomography for the quantification of decay in white oak (Quercus Alba) and Hickory (Carya spp.). J. Arboric. 2004, 30, 277–281. [Google Scholar]
- Rinn, F. Central Defects in Sonic Tomography. 2015. Available online: http://download.rinntech.com/RINN_CentralDefectsInSonicTreeTomography_WesternArborist_Spring_2015.pdf (accessed on 20 June 2019).
- Gilbert, G.S.; Ballesteros, J.O.; Barrios-Rodriguez, C.A.; Bonadies, E.F.; Cedeno-Sanchez, M.L.; Fossatti-Caballero, N.J.; Trejos-Rodriguez, M.M.; Perez-Suniga, J.M.; Holub-Young, K.S.; Henn, L.A.W.; et al. Use of Sonic Tomography to Detect and Quantify Wood Decay in Living Trees. Appl. Plant Sci. 2016, 4, 1600060. [Google Scholar] [CrossRef] [PubMed]
- Lindström, H.; Harris, P.; Nakada, R. Methods for measuring stiffness of young trees. Holz Als Roh- Werkstoff 2002, 60, 165–174. [Google Scholar] [CrossRef]
- Wang, X.; Carter, P.; Ross, R.J.; Brashaw, B.K. Acoustic assessment of wood quality of raw forest materials—A path to increased profitability. For. Prod. J. 2007, 57, 6–14. [Google Scholar]
- Caniato, M.; Favretto, S.; Bettarello, F.; Schmid, C. Acoustic characterization of resonance wood. Acta Acust. United Acust. 2018, 104, 1030–1040. [Google Scholar] [CrossRef]
- Brémaud, I.; Ruelle, J.; Thibaut, A.; Thibaut, B. Changes in viscoelastic vibrational properties between compression and normal wood: Role of microfibril angle and of lignin. Holzforschung 2013, 67, 75–85. [Google Scholar] [CrossRef]
- Food and Agriculture Organization of the United Nations. World Reference Base for Soils Resources; World Soil Research Report No. 84; FAO: Rome, Italy, 1998. [Google Scholar]
- Bouvarel, P. Variability of Norway spruce (Picea excelsa Link.) in the French Jura Mountains. Distribution and characters of different types. Rev. For. Fr. 1954, 6, 85–98. [Google Scholar] [CrossRef]
- Ohaus Corporation. MB45 Moisture Analyzer. Instruction Manual; Ohaus Co.: Parsippany, NJ, USA, 2001; p. 71. [Google Scholar]
- Hunt, R.W.G. Measuring Colour, 3rd ed.; Fountain Press: Kingston-upon-Thames, UK, 1998; p. 153. [Google Scholar]
- Konica-Minolta. Chroma Meter CR-400/410. Instruction Manual; Konica-Minolta Sensing Inc.: Osaka, Japan, 2007; p. 156. [Google Scholar]
- Dirckx, O.; Triboulot-Trouy, M.C.; Merlin, A.; Deglise, X. Changes of wood colour of Abies grandis exposed to solar radiation. Ann. For. Sci. 1992, 49, 425–447. [Google Scholar] [CrossRef]
- WinDENDRO. WinDENDROTM2006 for Tree-Ring Analysis. Manual of Exploitation; Régent Instruments Inc.: Québec City, QC, Canada, 2007; p. 133. [Google Scholar]
- Dinulică, F.; Albu, C.T.; Borz, S.A.; Vasilescu, M.M.; Petritan, I.C. Specific structural indexes for resonance Norway spruce wood used for violin manufacturing. Bioresources 2015, 10, 7525–7543. [Google Scholar] [CrossRef]
- Rinn, F. ARBOTOM®: 3-D Tree Impulse Tomograph. User Manual; Rinntech: Heidelberg, Germany, 2012; p. 57. [Google Scholar]
- Shen, J. Relationships between longitudinal and radial Picea genera sound vibration parameters. Front. For. Chin. 2006, 4, 431–437. [Google Scholar] [CrossRef]
- Keylwerth, R. A contribution to qualitative increment analysis. Eur. J. Wood Wood Prod. 1954, 12, 77–83. [Google Scholar] [CrossRef]
- Keith, C.T. Resin content of red pine wood and its effect on specific gravity determinations. For. Chron. 1969, 45, 338–343. [Google Scholar] [CrossRef]
- Zaițev, E.V. The acoustic properties of cedar wood. Деревooбрабатывающая прoмышленнoсть 1969, 7, 18–19. [Google Scholar]
- Brémaud, I. Diversity of Woods Used or Usable in Musical Instruments Making. Ph.D. Thesis, Montpellier II University, Montpellier, France, 2006. [Google Scholar]
- Polge, H. The quality of wood of the principal exotic conifers used in French plantations. Ann. Eaux For. 1963, 20, 403–469. [Google Scholar]
- Williamson, G.B.; Wiemann, M.C. Measuring wood specific gravity… Correctly. Am. J. Bot. 2010, 97, 519–524. [Google Scholar] [CrossRef]
- Smith, D.M. Maximum Moisture Content Method for Determining Specific Gravity of Small Wood Samples; Rep. no. 2014. USDA; Forest Service: Madison, WI, USA, 1954; p. 9. Available online: http://hdl.handle.net/1957/2445 (accessed on 10 February 2019).
- StatSoft Inc. STATISTICA (Data Analysis Software System), version 8.0; StatSoft Inc.: Tulsa, OK, USA, 2007. [Google Scholar]
- Zar, J.H. Biostatistical Analysis, 5th ed.; Pearson Prentice-Hall: Upper Saddle River, NJ, USA, 2010. [Google Scholar]
- Beldeanu, E.C. Forest Products and Wood Science; Transilvania University Publishing House: Brașov, Romania, 1999. [Google Scholar]
- Kuprevicius, A.; Auty, D.; Achim, A.; Caspersen, J.P. Quantifying the influence of live crown ratio on the mechanical properties of clear wood. Forestry 2013, 86, 361–369. [Google Scholar] [CrossRef] [Green Version]
- Lundström, T.; Heiz, U.; Stoffel, M.; Stöckli, V. Fresh-wood bending: Linking the mechanical and growth properties of a Norway spruce stem. Tree Physiol. 2007, 27, 1229–1241. [Google Scholar] [CrossRef]
- Norimoto, M.; Ono, T.; Watanabe, Y. Selection of wood used for piano soundboards. J. Soc. Rheol. Jpn. 1984, 9, 115–119. [Google Scholar] [CrossRef]
- Gyllenstrand, N.; Clapham, D.; Källman, T.; Lagercrantz, U. A Norway spruce FLOWERING LOCUS T Homolog is implicated in control of growth rhytm in conifers. Plant Physiol. 2007, 144, 248–257. [Google Scholar] [CrossRef]
- Lagercrantz, U. At the end of the day: A common molecular mechanism for photoperiod responses in plants? J. Exp. Bot. 2009, 60, 2501–2515. [Google Scholar] [CrossRef] [PubMed]
- Karlgren, A.; Gyllenstrand, N.; Clapham, D.; Lagercrantz, U. FLOWERING LOCUS T/TERMINAL FLOWER1-LIKE genes affect growth rhytm and bud set in Norway spruce. Plant Physiol. 2013, 163, 792–803. [Google Scholar] [CrossRef] [PubMed]
- Vaganov, E.A.; Hughes, M.K.; Shashkin, A.V. Growth Dynamic of Conifer Tree Rings. Images of Past and Future Environments; Springer: Berlin/Heidelberg, Germany, 2006; p. 354. [Google Scholar]
- Stănescu, V.; Șofletea, N.; Popescu, O. Phetotypical circumstances concerning the Norway spruce genome. Rev. Silvic. Cineg. 1997, 2, 3–5. [Google Scholar]
- Stănescu, V.; Şofletea, N. Ecological genetic study in mountain spruce forests. Rev. Pădurilor 1990, 105, 114–119. [Google Scholar]
- Przybylski, T. Morphology. In Biology and Ecology of Norway Spruce; Tjoelker, M.G., Boratyński, A., Bugała, W., Eds.; Springer: Dordrecht, The Netherlands, 2007; pp. 9–14. [Google Scholar]
- Godet, J.D. Guide of Barks of European Trees. Identify and Compare the Species; Delachaux et Niestlé: Paris, France, 2012; pp. 36–37. [Google Scholar]
- Niţu, C.; Răiescu, V.; Creangă, I. Research Concerning the Behaviour of Norway Spruce Provenances Tested in Different Site Conditions; Forest Research and Management Institute: Bucharest, Romania, 1984; p. 36. [Google Scholar]
- Geambașu, N. Research on the Management of Norway Spruce Resonance and Keyboard Stands; Tehnică Silvică Publishing House: Bucharest, Romania, 1995; pp. 64–77. [Google Scholar]
- Pașcovici, N. The spruce as resonance and keyboard wood. II The forest site conditions for the resonance spruce. Rev. Pădurilor 1930, 46, 279–305. [Google Scholar]
- Bolea, V.V.; Popescu, N.E.; Surdu, A.; Mandai, M. Ecological significances of nutrition biodiversity in Norway spruce. 1 Chemical composition of needles in relation to soil, branching, bark colour and health condition of the tree. Rev. Silvic. Cineg. 1996, 1, 9–17. [Google Scholar]
- Hejnowicz, A. Anatomy, embryology, and karyology. Bud structure and shoot development. In Biology and Ecology of Norway Spruce; Tjoelker, M.G., Boratyński, A., Bugała, W., Eds.; Springer: Dordrecht, The Netherlands, 2007; pp. 49–342. [Google Scholar]
- Józefaciukowa, W.; Ubysz-Borucka, L. Variation in habit forms of Scots pine (Pinus silvestris L.) on the area of Poland. Silvae Genet. 1972, 21, 9–17. [Google Scholar]
- Yin, Y.; Jiang, X.; Wang, L.; Bian, M. Predicting wood quality of green logs by resonance vibration and stress wave in plantation-grown Populus × euramericana. For. Prod. J. 2011, 61, 136–142. [Google Scholar] [CrossRef]
- Ghelmeziu, N.; Beldie, I.P. On the characteristics of resonance spruce wood. Bull. Transilvania Univ. Brașov 1970, 12, 315–326. [Google Scholar]
- Spycher, M.; Schwarze, F.W.M.R.; Steiger, R. Assesment of resonance wood quality by comparing its physical and histological properties. Wood Sci. Technol. 2008, 42, 325–342. [Google Scholar] [CrossRef]
- Brancheriau, L.; Baillères, H.; Détienne, P.; Gril, J.; Kronland, R.; Metzger, B. Classifying xylophone bar materials by perceptual, signal processing and wood anatomy analysis. Ann. For. Sci. 2006, 63, 73–81. [Google Scholar] [CrossRef] [Green Version]
- Budeanu, M. Testing the Genetic Value of Some Norway Spruce Seed Sources in Multisite Comparative Trials. Ph.D. Thesis, Transilvania University of Braşov, Brașov, Romania, 2012. [Google Scholar]
- Baar, J.; Tippner, J.; Gryc, V. The influence of wood density on longitudinal wave velocity determined by the ultrasound method in comparison to the resonance longitudinal method. Eur. J. Wood Prod. 2012, 70, 767–769. [Google Scholar] [CrossRef]
- Vorobicov, A.M.; Evdokimova, N.I.; Okolykhina, L.V. The influence of density and moisture on the velocity of ultrasonic oscillations transmission through pine wood. Lesnoy Zhurnal 1968, 135, 106–109. [Google Scholar]
- Macareva, T.A. Factors affecting the constant acoustic of resonance wood. Деревooбрабатывающая прoмышленнoсть 1968, 10, 14–15. [Google Scholar]
- Bucur, V.; Lanceleur, P.; Roge, B. Acoustic properties of wood in tridimensional representation of slowness surfaces. Ultrasonics 2002, 40, 537–541. [Google Scholar] [CrossRef]
- Lachenbruch, B.; Jonson, G.R.; Downes, G.M.; Evans, R. Relationship of density, microfibril angle and sound velocity with stiffness and strength in mature wood of Douglas-fir. Can. J. For. Res. 2010, 40, 55–64. [Google Scholar] [CrossRef]
- Dinulică, F.; Albu, C.T.; Zdrob, G.S. What and how much do we know about the determinism of resonance Norway spruce? Rev. Pădurilor 2015, 130, 23–40. [Google Scholar]
Figure 1.
Location of the sampled resource of resonance spruce wood.

Figure 2.
Scheme of the sampling design and outlook of one of the sample sites.

Figure 3.
Caption of a tomography in the field.

Figure 4.
The spectrum of bark colours in the measured spruce trees.

Figure 5.
The regression of circumferential irregularity of latewood thickness with the bark scale slenderness index in trees sampled with discs.
Figure 5.
The regression of circumferential irregularity of latewood thickness with the bark scale slenderness index in trees sampled with discs.

Figure 6.
The stratification * of some morphological traits according to the structural quality class of the trees (p from Kruskal-Wallis test or ANOVA).
Figure 6.
The stratification * of some morphological traits according to the structural quality class of the trees (p from Kruskal-Wallis test or ANOVA).

Figure 7.
3D contour plot of acoustic impedance against bark scale redness and yellowness.


Table 1.
Summary of sampled sites.
| Features | Sample Plot | |||
|---|---|---|---|---|
| GUR1 | GUR2 | GUR3 | GUR4 | |
| Altitude (m asl) | 1380 | 1300 | 1215 | 1580 |
| Facing | NE | NW | W | NE |
| Slope (°) | 33 | 31 | 24 | 17 |
| Soil type * | Cmeu | CMdy | PZrs | BOis |
| Species composition ** | 100%NS | 80%NS 20%BC | 80%NS 10%BC 10%SF | 100%NS |
| Number of sampled trees | 44 | 61 | 30 | 10 |
| Diameter at breast height (cm) *** | 25...52...81 | 22.5...42...81 | 33...58...101 | 42...53...62 |
| Tree height (m) *** | 23...33...39.5 | 20...29...40.3 | 21...37...49.5 | 28...30...35 |
| Tree age (years at breast height) *** | 144...181...298 | 152...182...278 | 122...242...418 | 95...168...238 |
| Number of measured samples (cores a/discs b) | 66 a | 104 a | 58 a | 65 b |
* Cmeu—Eutric Cambisols; Cmdy—Distric Cambisols; PZrs—Rustic podzols—BOis—Lepti-dystric Cambisols [52]; ** BC—European beech; NS—Norway spruce; SF—Silver fir; *** Range (first quartile–third quartile) and median; a cores; b discs.
Table 2.
The structural-qualitative classification of raw material intended for violin making [4].
Table 2.
The structural-qualitative classification of raw material intended for violin making [4].
| Quality Grade (SQC) | Structural Requirements to the Resonance Wood Zone * |
|---|---|
| 1. Wood of high structural quality | Ring width = 0.8 to 2.5 mm (average ≥ 1.2 mm). |
| Average latewood proportion ≤ 20%. | |
| Average difference in width between consecutive rings ≤ 0.5 mm. | |
| Ring width regularity index ≤ 0.7. | |
| Width of resonance wood ≥ 130 mm. | |
| 2. Wood of average structural quality | Ring width = 0.8 to 2.5 mm. |
| Average latewood proportion ≤ 35%. | |
| Average difference in width between consecutive rings ≤ 0.6 mm. | |
| Width of resonance wood ≥ 130 mm. | |
| 3. Wood of low structural quality | Ring width ≤ 3.0 mm (average ≥ 0.5 mm). |
| Average latewood proportion ≤ 39%. | |
| Average difference in width between consecutive rings ≤ 1.0 mm. | |
| Width of resonance wood ≥ 130 mm. | |
| 4. Wood from young resonance trees | The wood meets the requirements imposed on SQC2—with the exception of the resonance zone width—which is insufficient for a violin flitch (130 mm), but exceeds 50 mm. |
| Diameter at breast height ≤ 38 cm. | |
| 5. Wood from thick trees, with insufficient width of the resonance wood | Diameter at breast height > 38 cm, tree age > 150 years; |
| 50 ≤ width of resonance wood < 130 mm. | |
| 6. Wood with no structural-acoustic qualities | Width of resonance wood < 50 mm or; |
| average ring width ≤ 0.5 mm. |
* In the case of the first three classes, a maximum of seven growth rings exceeding the limits of the criteria for resonance wood by one standard deviation are admitted.
Table 3.
The statistical significance of the influence of some factors on the analyzed bark features, using the Kruskal-Wallis test.
Table 3.
The statistical significance of the influence of some factors on the analyzed bark features, using the Kruskal-Wallis test.
| Source of Variation | LS | WS | SS | L * | a * | b * | ||||||
|---|---|---|---|---|---|---|---|---|---|---|---|---|
| H | p | H | p | H | p | H | p | H | p | H | p | |
| Sample plot | 13.81 | 0.008 | 12.00 | 0.017 | 33.63 | <0.001 | 38.86 | <0.001 | 6.80 | 0.15 | 6.96 | 0.14 |
| Tree × plot | 11.00 | 0.25 | 9.88 | 0.36 | 10.82 | 0.29 | 14.75 | 0.10 | 3.12 | 0.96 | 16.49 | 0.05 |
| Tree | 23.08 | 0.006 | 15.52 | 0.08 | 16.04 | 0.007 | 30.03 | 0.0004 | 4.34 | 0.89 | 14.29 | 0.11 |
| Cardinal point | 3.02 | 0.08 | 7.22 | 0.007 | 0.29 | 0.59 | 1.93 | 0.17 | 1233.21 | <0.001 | 938.3 | <0.001 |
| Scale | 6.00 | 0.74 | 6.00 | 0.74 | 6.00 | 0.74 | 9.00 | 0.44 | 10.00 | 0.35 | 9.00 | 0.44 |
| Scale × sample plot | 132.23 | <0.001 | 45.72 | <0.001 | 18.31 | <0.001 | 0.814 | 0.67 | 1.85 | 0.40 | 0.03 | 0.98 |
LS: bark scale length; WS: bark scale width; SS: bark scale slenderness; a * bark colour redness/greenness; b * bark colour yellowness/blueness.
Table 4.
Bark as predictor of spruce wood structure from the breast height (only the correlations with R > 0.5 are shown).
Table 4.
Bark as predictor of spruce wood structure from the breast height (only the correlations with R > 0.5 are shown).
| Predictor | Dependent Variable | Spearman Rank Order Simple Correlation/p | Multiple Correlation with TA or DBH/p | Partial Correlation with TA or DBH/p | ||
|---|---|---|---|---|---|---|
| TA/p • | DBH/p • | TA | DBH | |||
| Scale slenderness index | CITRW | −0.698/0.02 | 0.857/0.015 | 0.683/0.45 | −0.855 | −0.665 |
| CILWW | −0.914/<0.0001 | 0.903/0.25 | 0.879/0.98 | −0.903 | −0.879 | |
| CILWP | −0.729/0.02 | 0.921/0.03 | 0.837/0.503 | −0.875 | −0.834 | |
•p from t test for the significance of the partial regression coefficient associated with the tree age (TA) and the DBH (diameter at breast height) variable, respectively. If p > 0.05, then the influence of the tree age or the diameter on the predictor is not statistically proven.
Table 5.
The matrix of median differences in bark colour between the structural classes of standing spruce trees (ΔE * on the northern side of the breast height section/ΔE * on the southern side).
Table 5.
The matrix of median differences in bark colour between the structural classes of standing spruce trees (ΔE * on the northern side of the breast height section/ΔE * on the southern side).
| SQC | 1 | 2 | 3 | 4 | 5 | 6 |
|---|---|---|---|---|---|---|
| 1 | - | 3.19/1.48 | 3.17/1.86 | 1.15/4.32 | 4.48/1.00 | 7.52/2.51 |
| 2 | - | 1.13/1.56 | 2.14/5.79 | 2.63/1.42 | 5.59/3.78 | |
| 3 | - | 2.03/5.56 | 1.63/0.94 | 4.73/3.05 | ||
| 4 | - | 3.40/4.79 | 6.49/2.75 | |||
| 5 | - | 3.13/2.46 | ||||
| 6 | - |
Table 6.
Variation sources of acoustic features of spruce wood in stands with resonance wood from the Gurghiu Mountains (the Romanian Carpathians).
Table 6.
Variation sources of acoustic features of spruce wood in stands with resonance wood from the Gurghiu Mountains (the Romanian Carpathians).
| Feature | Mean/Confidence | Coefficient of Variation (%) | Source of Variation | ||
|---|---|---|---|---|---|
| p from ANOVA F Test * | |||||
| Stand | Tree | SQC | |||
| Transverse velocity in standing trees ** (m·s−1) | 1132.99/1123.68–1142.31 | 14.52 | <0.001 | <0.001 | <0.001 |
| Transverse velocity in discs *** (m·s−1) | 1334.12/1251.82–1416.41 | 28.25 | - | 0.66 | 0.005 |
| Basic density (g·cm−3) | 0.366/0.358–0.373 | 11.08 | 0.54 | <0.001 | 0.69 |
| Transverse radiation ratio in standing trees (10−3·m4/kg·s) | 3047.17/2773.37–3320.98 | 20.78 | 0.99 | <0.001 | <0.001 |
| Transverse acoustic impedance in standing trees (103·N·s/m3) | 437.85/406.05–469.65 | 16.80 | <0.001 | 0.75 | |
* 0.05 is the threshold value for statistical significance; ** moisture content (MC) of 39% in heartwood and 98% in sapwood; *** moisture content of 10%.
Table 7.
Bark as predictor of the acoustic properties of spruce wood (only regressions with R > 0.5 are shown).
Table 7.
Bark as predictor of the acoustic properties of spruce wood (only regressions with R > 0.5 are shown).
| Dependent Variable | Predictor (s) | Statistical Model | Adjusted R2 | F | p |
|---|---|---|---|---|---|
| Transverse sound velocity | Bark redness on the back of the north-facing scales (), bark redness on the outside of the south-facing scales () | y = 847.54 + 30.14 × − 57.88 × | 0.416 | 5.68 | <0.001 |
| Specific acoustic resistance of wood | Bark yellowness on the outside of the south-facing scales (), bark redness on the outside of the south-facing scales () | y = 279.85 + 25.18 × 36.57 × | 0.472 | 5.91 | 0.002 |
| Radiation ratio | Bark yellowness on the outside of the south-facing scales ( | y = 3953.14 − 130.24 × | 0.284 | 5.37 | 0.04 |
© 2019 by the authors. Licensee MDPI, Basel, Switzerland. This article is an open access article distributed under the terms and conditions of the Creative Commons Attribution (CC BY) license (http://creativecommons.org/licenses/by/4.0/).
Share and Cite
MDPI and ACS Style
Dinulică, F.; Albu, C.-T.; Vasilescu, M.M.; Stanciu, M.D. Bark Features for Identifying Resonance Spruce Standing Timber. Forests 2019, 10, 799. https://doi.org/10.3390/f10090799
AMA Style
Dinulică F, Albu C-T, Vasilescu MM, Stanciu MD. Bark Features for Identifying Resonance Spruce Standing Timber. Forests. 2019; 10(9):799. https://doi.org/10.3390/f10090799
Chicago/Turabian StyleDinulică, Florin, Cristian-Teofil Albu, Maria Magdalena Vasilescu, and Mariana Domnica Stanciu. 2019. "Bark Features for Identifying Resonance Spruce Standing Timber" Forests 10, no. 9: 799. https://doi.org/10.3390/f10090799
Note that from the first issue of 2016, this journal uses article numbers instead of page numbers. See further details here.