Article

Assessment of Genetic Diversity of Tea Germplasm for Its Management and Sustainable Use in Korea Genebank

National Agrobiodiversity Center, National Institute of Agricultural Sciences (NAS), RDA, Jeonju 54874, Korea
*
Author to whom correspondence should be addressed.
Forests 2019, 10(9), 780; https://doi.org/10.3390/f10090780
Submission received: 24 July 2019 / Revised: 2 September 2019 / Accepted: 4 September 2019 / Published: 8 September 2019
(This article belongs to the Special Issue Genetic and Phenotypic Variation in Tree Crops Biodiversity)

Abstract

:
Tea (Camellia sinensis (L.) O. Kuntze) is cultivated in many developing Asian, African, and South American countries, and is the most widely consumed beverage in the world. It is of critical importance to understand the genetic diversity and population structure of tea germplasm for effective collection, conservation, and utilization. In this study, 410 tea accessions collected from South Korea were analyzed using 21 simple sequence repeat (SSR) markers. Among 410 tea accessions, 85.4% (350 accessions) were collected from Jeollanam-do. A total of 286 alleles were observed, and the genetic diversity and evenness were estimated to be on average 0.79 and 0.61, respectively, across all the tested samples. Using discriminant analysis of principal components, four clusters were detected in 410 tea accessions. Among them, cluster 1 showed a higher frequency of rare alleles (less than 1%). Using the calculation of the index of association and rbaD value, each cluster showed a clonal mode of reproduction. The result of analysis of molecular variance (AMOVA) showed that most of the variation observed was within populations (99%) rather than among populations (1%). The present study revealed the presence of lower diversity and simpler population structure in Korean tea germplasms. Consequently, more attention should be focused on collecting and conserving the new tea individuals to broaden genetic variation of new cultivars in future breeding of the tea plant.

1. Introduction

Tea (Camellia sinensis (L.) O. Kuntze, 2n = 2x = 30) is one of the most popular non-alcoholic beverages worldwide, and is consumed by approximately 70% of the world’s population for its refreshing taste, attractive aroma, therapeutic uses, and mildly stimulating properties [1]. It is an economically important tree crop, grown in over 52 countries in Asia, Africa, and South America [2,3]. The tea is a woody ever-green perennial plant and recorded to be native to Yunnan and Sichuan provinces in China and the northern part of Myanmar [4]. In Korea, although tea was introduced from China as early as the seventh century, the development of the tea industry was slow, and production was small [5].
The importance of using genetic resources in breeding programs to enhance crop genetic potential has been well recognized [6]. Many germplasm appraisal methods, such as morphology, biochemistry, molecular markers, and sensory evaluation, have been used to evaluate the resources of tea germplasm [7,8,9]. The phenotype can be referred to as a good standard for the evaluation of tea germplasm, because this method is simply based on the morphological traits to analyze the genetic diversity assessment [10]. Recently, the technology of using molecular markers has been proven to be one of the most effective methods for identifying different tea varieties [2,7,11,12,13,14].
Tea is an out-crossing species, and selected elite genotypes are propagated vegetatively and released as clonal varieties [13,15,16]. Clonal identification is traditionally based on morphological descriptors such as plant shape, stem width, leaf shape, young leaf type, and fruit shape [15,17]. However, as in many out-crossing crops, tea is highly heterozygous with most of its morphological, physiological, and biochemical descriptors showing continuous variation and high plasticity [18,19]. Korir et al. reported that morphological traits are associated with drawbacks such as the influences of environment on trait expressions, epistatic interactions, and pleiotropic effects among others despite the value of their advantages [17]. On the contrary, molecular markers are used as they are least affected by environmental factors and indefinite presence. In addition, they offer a possibility to observe the genome directly and thus eliminate the shortcomings inherent in a phenotype observation [15]. In previous studies, genetic diversity, discrimination and differentiation of tea germplasms have been assessed using different DNA markers such as restriction fragment length polymorphism (RFLP), randomly amplified polymorphic DNA (RAPD), amplified fragment length polymorphism (AFLP), inter-simple sequence repeat (ISSR), and simple sequence repeat (SSR) [3,5,7,11,12,13,14,15,20,21,22].
In Korea, the national research institutes collected and conserved excellent tea individuals and investigated their morphological characteristics [23]. Also, some studies analyzed the genetic diversity of Korean tea germplasm using RFLP and RAPD [5,14,16]. However, the analysis of genetic diversity in Korean tea germplasm is not sufficient as it included a very small population (approximately 20–50 individuals). In the present study, 21 SSR primer pairs were used to analyze 410 tea accessions from Korea, and the aim was: (1) to evaluate the genetic diversity and population structure of Korean tea accessions and (2) to estimate the genetic differentiation and variation source among inferred populations. It is hypothesized that the results of the present study would be helpful to gain a deeper understanding on the genetic diversity, population structure, and differentiation of tea germplasm to guide effective collection, conservation, and application of tea genetic resources in Korea.

2. Materials and Methods

2.1. Plant Materials

A total of 410 tea accessions were obtained from the National Agrobiodiversity Center (NAC) at the Rural Development Administration in South Korea. Among 410 tea accessions, 400 accessions were collected from 31 cities at three provinces in South Korea, while ten accessions lacked the data of collecting area (Table S1).

2.2. DNA Extraction

Genomic DNA was extracted from the tea leaves using a Qiagen DNA extraction kit (Qiagen, Hilden, Germany). DNA quality and quantity were measured using 1% (w/v) agarose gel and spectrophotometrically (Epoch, BioTek, Winooski, VT, USA). Extracted DNA was diluted to 30 ng/µL and stored at −20 °C until further PCR amplification.

2.3. SSR Genotyping

For SSR analysis, a total of 21 SSRs were fluorescently labeled (6-FAM, HEX and NED) and used for the detection of amplification products (Table 1 and Table S2). PCR reactions were carried out using 25 µL reaction mixture, containing 30 ng template DNA, 1.5 mM MgCl2, 0.2 mM of each dNTPs, 0.5 µm of each primer, and 1 U Taq polymerase (Inclone, Korea). The amplification was performed with the cycling conditions of: initial denaturation at 94 °C for 5 min, followed by 35 cycles of denaturation at 95 °C for 30 s, annealing at 55 °C for 30 s, extension at 72 °C for 1 min, and a final extension step at 72 °C for 10 min. Each amplicon was resolved on ABI prism 3500 DNA sequence (ABI3500, Thermo Fisher Scientific Inc., Wilmington, DE, USA) and scored using Gene Mapper Software (Version 4.0, Thermo Fisher Scientific Inc.).

2.4. Population Structure and Genetic Diversity

The Number of alleles (Na), Shannon index (I), Nei’s unbiased gene diversity (GD), and Eveness were calculated using poppr package for R software [24]. The analysis of molecular variance (AMOVA) and calculation of the coefficient of genetic differentiation among populations (PhiPT) were done using GenAlEx software (6.5 version) with 999 permutations [25].
The population structure was analyzed by a discriminant analysis of principal components (DAPC) using the adegenet package for R software [26,27]. The find.clusters function was used to detect the number of clusters in the population. It uses K-means clustering which decomposes the total variance of a variable into between-group and within-group components. The best number of subpopulations has the lowest associated Bayesian Information Criterion (BIC). A cross-validation function (Xval. dapc) was used to confirm the correct number of principal component (PC) to be retained. In this analysis, the data is divided into two sets: a training set (90% of the data) and a validation set (10% of the data) The member of each group is selected by stratified random sampling, which ensures that at least one member of each group or population in the original data is represented in both training and validation sets. DAPC is carried out on the training set by retaining variable numbers of PCs, and the degree to which the analysis is able to accurately predict the group membership of excluded individuals (those in the validation set) is used to identify the optimal number of PCs to be retained. At each level of PC retention, the sampling and DAPC procedures are repeated many times [28]. The best number of PCs that should be retained is associated with the lowest root mean square error. The resultant clusters were plotted in a scatter plot of the first and second linear discriminants of DAPC.

2.5. Estimation of Reproduction Mode among 410 Korean Tea Accessions

Linkage disequilibrium was calculated to test for the evidence of sexual reproduction. Linkage among loci can be caused by clonal reproduction and selection events; and as linkage increases populations fall into linkage disequilibrium, while recombination from sexual reproduction breaks up linkage among loci and generates linkage equilibrium. To quantify linkage, poppr package calculates the indices Ia (The index of association) and rbarD (The standardized index of association). High values of Ia, i.e., values that differ strongly from 0, can be interpreted as evidence of strong linkage and linkage disequilibrium [29]. The rbarD value has been shown to be a more reliable estimator of linkage equilibrium than Ia since it is not influenced by sample size [30], but to be thorough both metrics were calculated. Significance was tested by creating a null dataset (999 random permutations) and if the observed rbarD value lies outside the null dataset then the null hypothesis that no linkage exists would be rejected [24,29].

3. Results

3.1. Regional Distribution of 410 Tea Accessions in South Korea

The collection areas of 410 tea accessions were seven cities in Gyeongsangnam-do (GN), 19 in Jeollanam-do (JN), and five in Jeollabuk-do (JB) (Table 2). Among 410 tea accessions, 350 tea accessions (85.4%) were collected from JN, 7.1% (29 accessions) from GN, and 5.1% (21 accessions) from JB. Of 31 cities, the largest tea accessions were collected from Boseong (18.8%), followed by Suncheon (13.9%), and less than 10% from other cities.

3.2. Population Structure and Mode of Reproduction of 410 Tea Accessions

In order to understand the genetic relationship among 410 tea accessions, DAPC analysis was performed (Figure 1). Four clusters were detected in coincidence with the lowest BIC value using find.clusters function. DAPC analysis was carried out using the detected number of clusters. Typically, 50 first PCs (68.4% of variance conserved) of PCA and three discriminant eigenvalues were retained. These values were confirmed by a cross-validation analysis. The number of accessions in each cluster was 138, 75, 108, and 88 corresponding to clusters 1 to 4, respectively (Table 2).
Cluster 1 was the highest in JN with 36%, while JB and GN had a similar level of 21% and 24%, respectively. Unlike Cluster 1, cluster 2 accounted for the lowest percentage with 17% in JN and JB and 24% in GN. Cluster 3 had the highest ratio in JB (38%), followed by GN (31%) and JN (25%). The ratio of cluster 4 in GN and JN was almost similar accounting for 24% and 22%, respectively, while in JB it was only 14%. Among the ten unknown accessions, five accessions were in cluster 3 (50%), followed by cluster 2 (30%).
Among 410 tea accessions, 409 multilocus SSR genotypes were found (Table 3). The Simpson’s Dominance (λ), a Simpson’s diversity (1-λ), and Nei’s Gene diversity (GD) were calculated as 0.998, 0.002, and 0.792 in 410 tea accessions, respectively. In four clusters, 1-λ and GD ranged from 0.007 (C1) to 0.013 (C2) and 0.695 (C4) to 0.805 (C2), respectively. Each cluster was tested for linkage disequilibrium and evidence of sexual reproduction (Table 3 and Figure S3). All accessions showed the index of association (Ia) = 0.792 and rbarD = 0.0583. The ranges of Ia and rbarD in four clusters were from 0.123 (C1) to 0.999 (C4) and from 0.0062 (C1) and 0.0508 (C4), respectively. The hypothesis of no linkage among markers was rejected for all the accessions (p = 0.001) and each cluster (C1, p = 0.018; C2, C3, and C4, p = 0.001), thus supporting a clonal mode of reproduction.

3.3. Genetic Diversity

A total of 286 alleles were detected among 410 tea accessions by polymorphic 21 SSR markers (Table S3). On average, 13.6 alleles varying from five (TM604) to 20 (MSE0083 and MSG0699) were amplified by each marker. The Shannon index (I) varied from 0.98 (MSE0237) to 2.31 (MSE0083) among 21 SSR markers. The average gene diversity (GD) was estimated to be 0.79 and varied from 0.52 (MSE0237) to 0.87 (MSE0083 and MSG0361). The average evenness (E) was 0.75 varied from 0.61 (MSG0429) to 0.87 (TM604), respectively.
Among four clusters, the lowest number of alleles was recorded in the cluster 3 (190, mean = 9.1), while the highest was registered in the cluster 1 (247, mean = 11.8) (Table 4). The average I, GD, and E varied from 1.50 (C4) to 1.89 (C2), 0.69 (C4) to 0.81 (C2), and 0.68 (C4) to 0.76 (C2), respectively.
Seventy-six rare alleles, defined with a frequency less than 1%, were observed in 21 SSR markers (Table 4). All the rare alleles were observed in 119 accessions from four clusters. Typically, 53.9% of rare alleles were observed in 41 accessions from cluster 1, followed by 39.5% in 30 accessions in cluster 2. Unique private alleles were found in 35 accessions and 40% of them belonged to cluster 1.

3.4. Gene Flow

The sources of genetic differentiation were revealed among different inferred clusters by the AMOVA method. Results indicated that 1% of variations could be attributed to differentiation among clusters and 99% of variations could be attributed to differentiation within inferred clusters (Table 5). PhiPT and gene flow (Nm) for 410 tea accessions was 0.014 (p < 0.001) and 36.156, respectively. Pairwise population PhiPT values for four clusters ranged from 0.01 (C2–C4) to 0.021 (C2–C3) (Table 6). Pairwise population estimates of gene flow (Nm) for four clusters ranged from 23.717 to 47.872 migrants per clusters.

4. Discussion

Erosion of plant genetic diversity is a very serious problem caused by modernization and replacement of wild plants or landraces with a few elite varieties [31,32]. Therefore, collection and preservation of plant genetic resources are of immense importance for crop breeding to support the demands of a growing human population. Effective management and utilization of plant genetic resources require information about the origin of strains, phenotypic traits, and genetic diversity (identified by molecular techniques) [33]. In this study, analysis of genetic diversity of 410 tea accessions collected and conserved in the Korea genebank was performed. Genetic diversity provides an assurance of future genetic progress and insurance against unforeseen threats to agricultural production such as disease epidemics or climate changes. Thus, the fate of genetic diversity in these gene pools is of utmost importance if plant breeding will continue to address the pressing needs of society such as increased yield, genetic resistance to diseases and pests, improved nutritional and processing quality of crop products, and reduction in environmental effects [34].
In the present study, about 85% of tea accessions were collected from Boseong and Suncheon in Jeollanam-do (JN) (Table 2). According to Eom and Kim, the tea seeds obtained from China were firstly cultivated in Mount Jiri in JN and so a majority of tea plants are included in the Honam region (Jeollanam-do and Jeollabuk-do) [35]. In addition, tea experiment stations in Boseong experiment station (BES) and Mokpo experiment station (MES, a city close to Suncheon) have collected the tea accessions since the late 1990s [18]. The two experiment stations have probably collected tea accessions around the area where the institute is located, and thus the largest number of tea accessions was collected in the region. The tea accessions of the two research institutes have been managed as registered tea germplasms of the NAC and appear to cause a regional collectivity imbalance of tea accessions in Korea.
In this study, the mean Nei’s gene diversity (GD, 0.792) across 21 SSR markers was higher than other studies; 0.652 in 280 tea accessions using 23 SSR markers [7], 0.640 in 450 tea accessions using 96 EST-SSR marker [22], 0.543 in 185 Chinese tea cultivars using 48 SSR markers [13], and 0.680 in 64 Sri Lankan tea cultivars using 33 EST- or genomic-SSR markers [3]. The gene diversity of a locus, also known expected heterozygosity, is a fundamental measure of genetic variation in a population, and describes the proportion of heterozygosis expected under Hardy–Weinberg equilibrium [36]. As tea is an open pollinated plant, the tea plant shows highly heterogeneous and consequently broad genetic variation [13]. The obtained results also showed high gene diversity in a manner similar to the previously reported data. However, Yao et al., mentioned that the comparison of the degree of genetic diversity between different studies is difficult as the analysis may be affected by various factors like sampling schemes, number of SSR markers, sizes of SSR repeats, and location of SSR in the genome [22].
Contrary to the result of higher gene diversity, 410 tea accessions in this study were characterized by an extreme dearth of genetic diversity as revealed by an overall Simpson’s Dominance (λ) of 0.998. Furthermore, the AMOVA revealed there was no significant difference among populations, suggesting low genetic diversity across the entire collected region. In addition, the standardized index of association (rbarD, 0.0583, (p < 0.001)) supported the hypothesis of clonal population structure based on the linkage disequilibrium tests, where the null hypothesis of random mating was rejected for all populations. Under clonal propagation, heterozygosis and allelic diversity at each locus are expected to increase [37,38]. While high levels of clonality tend to increase genetic variation within the population, an opposite effect is expected on genetic differentiation among populations and on genotypic diversity, both decreasing with the rate of clonal reproduction [37,39]. Indeed, the 410 tea accessions in this study were landraces and are likely to have been collected from private farms. As breeding a reliable cultivar for a private farm is nearly impossible, almost all the tea gardens consist of seedling tea plants from the local and wild origin with great morphological variations [23]. BES and MES also collected and investigated the morphological characteristics of tea germplasm and many variations were observed in the number of stems, stem length, leaf area, and leaf color which were within the limits of the investigation of the morphological characteristics [40]. Due to the lack of sufficient studies on the genetic diversity of Korean tea germplasm, a few researchers argued over the importance of genetic collection and preservation of tea accessions [14,21].
Previous studies performed the analysis of genetic diversity of different tea accessions using molecular markers like RFLP, RAPD, and SSR [3,5,21,22]. In addition, the STRUCTURE software was used to analyze the population structure of tea germplasm [2,3,13,22]. To analyze the genetic diversity and population structure of Korean tea accessions, 21 SSR markers and DAPC analysis were used in this study. The DAPC method provides an interesting alternative to STRUCTURE software as it does not require that populations should be in Hard-Weinberg equilibrium and can handle large sets of data without using parallel processing software [41]. DAPC analysis divided the population into well-defined clusters associated with provenance, ploidy, taxonomy and breeding program of the genotypes and related to their genetic structure [42]. According to Rosyara et al., STRUCTURE, EIGENSTRAT, and DAPC exhibit the ability to control population structure in association with mapping studies [43]. EIGENSTRAT and DAPC were slightly better than STRUCTURE but DAPC led to a better separation among populations. In this study, DAPC (four clusters) analysis provided a more detailed clustering within tea accessions than STRUCTURE (two populations) (Figure S1). Campoy et al., reported that their results of population structure in sweet cherry using STRUCTURE and DAPC showed good consistency between the two methods and DAPC analysis provided a more detailed clustering among the populations compared to STRUCTURE analysis [41].
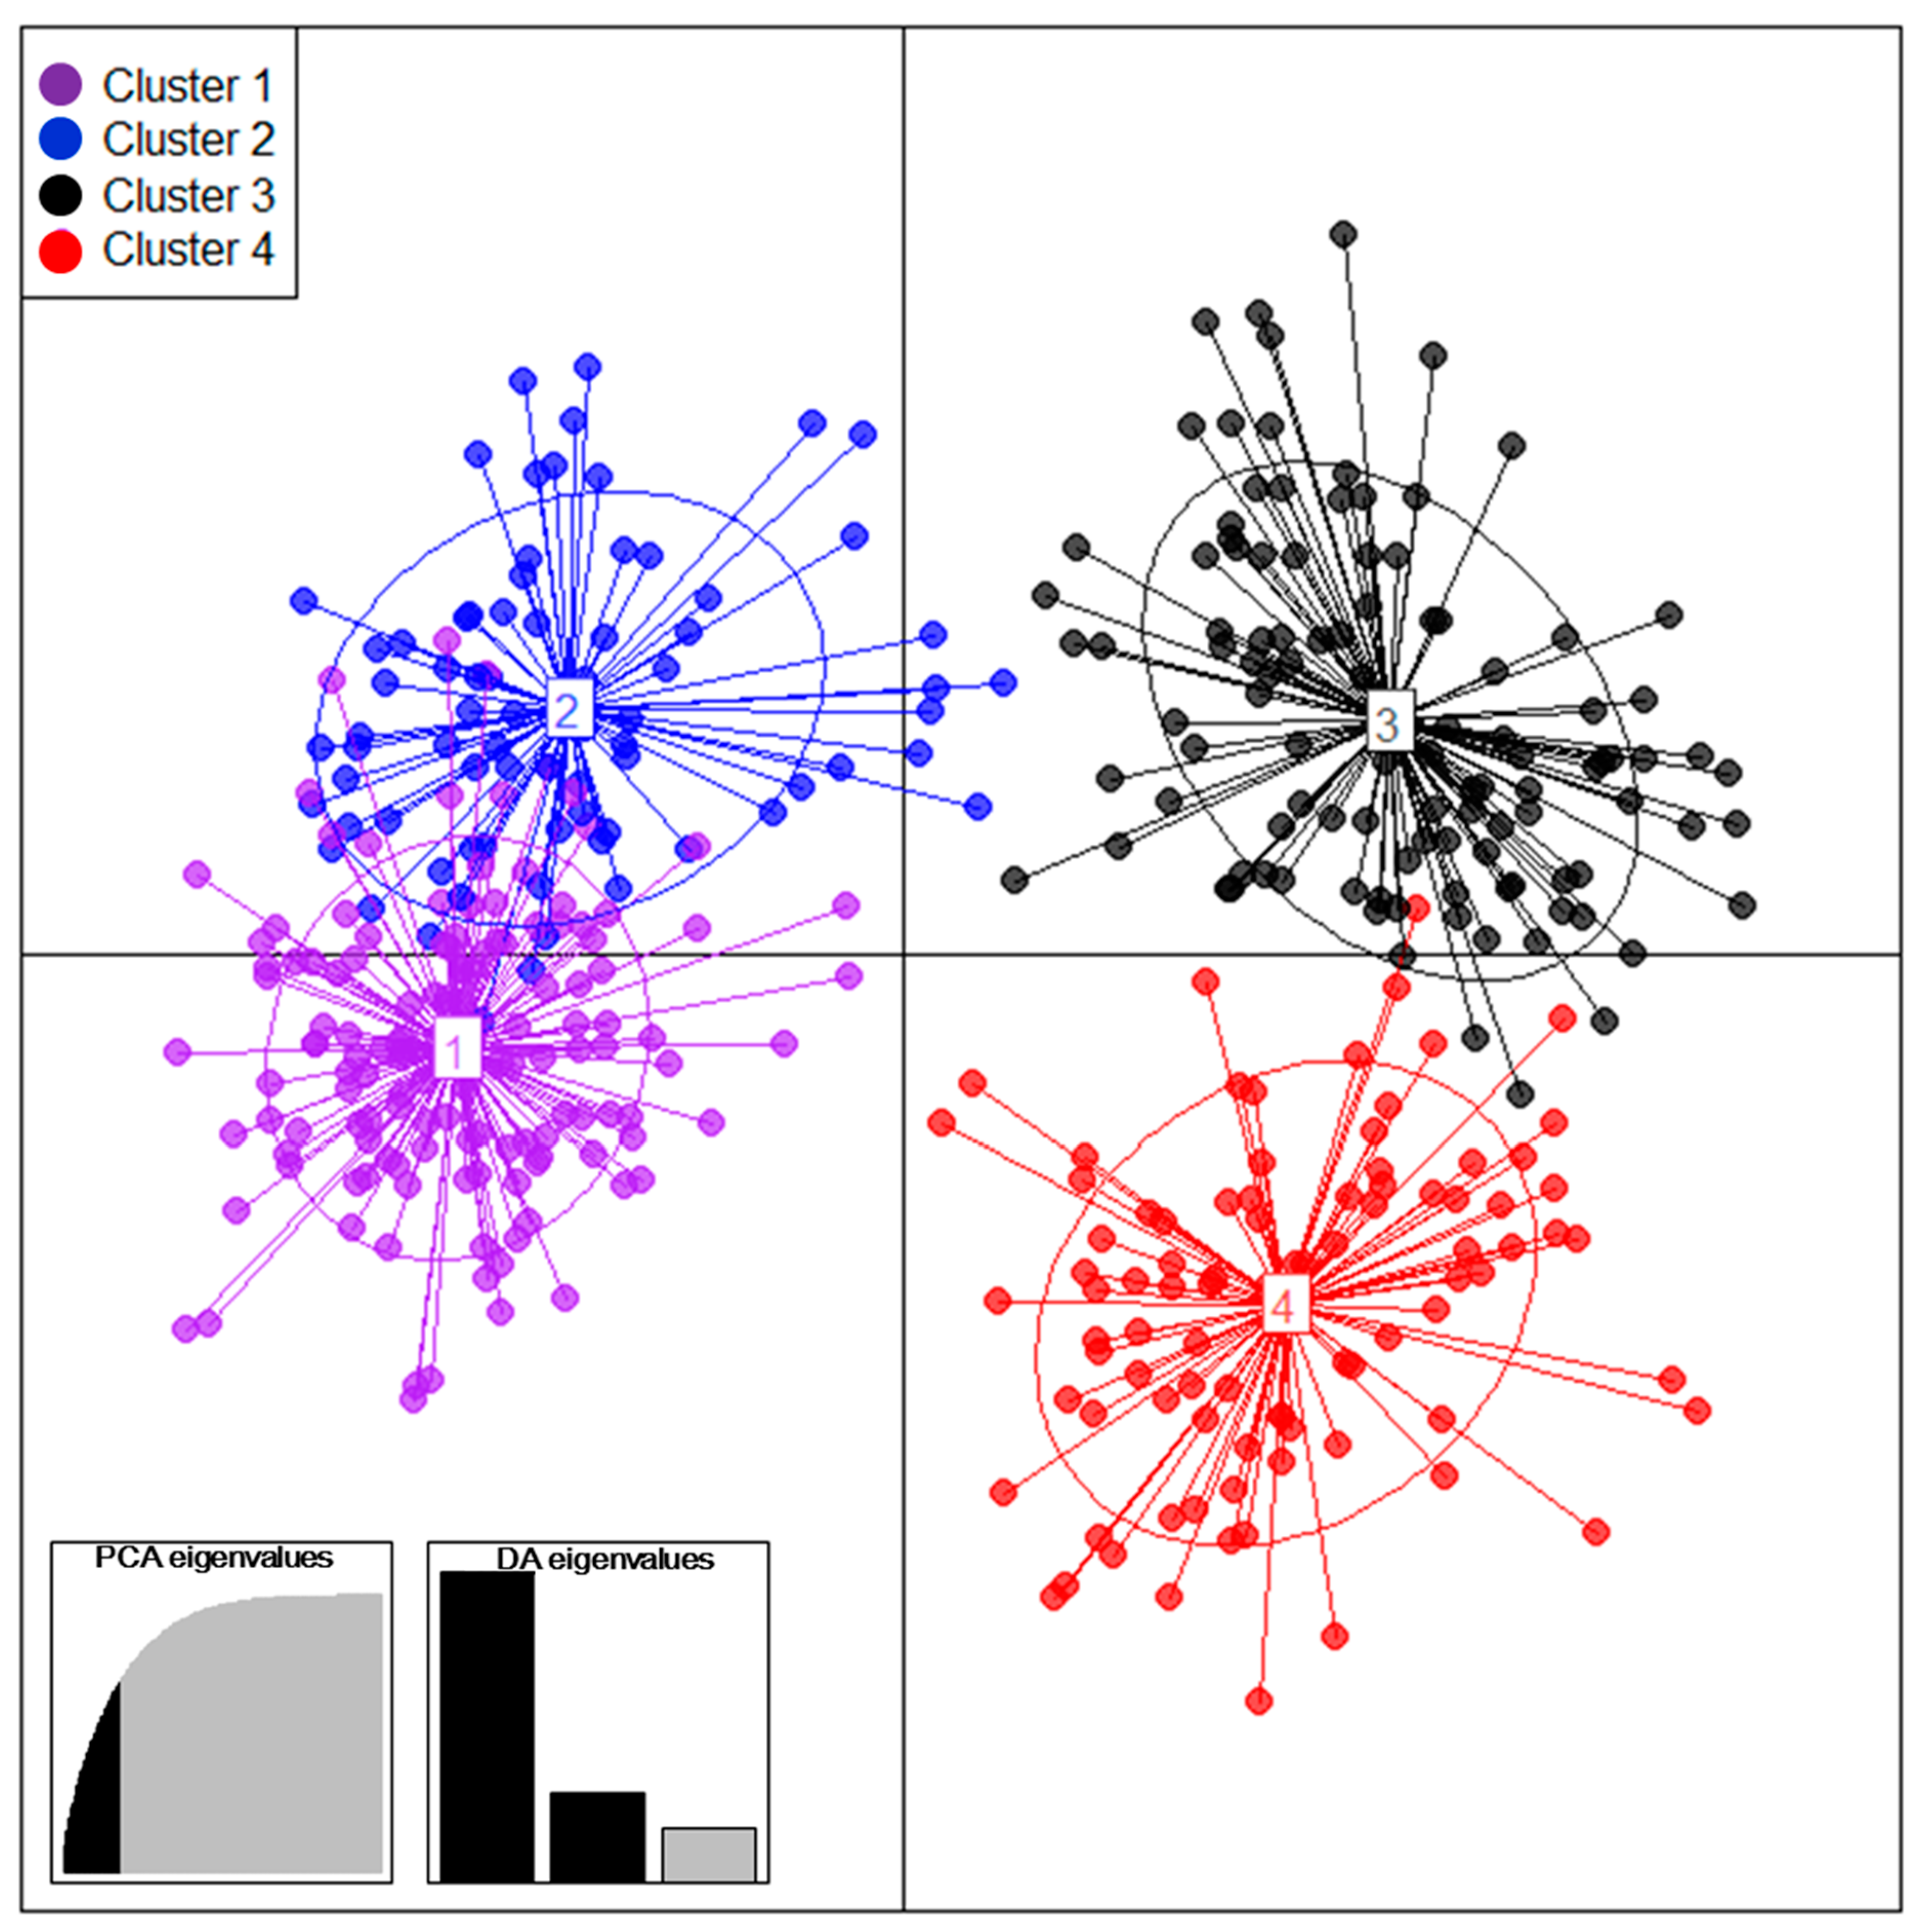
As per the result of DAPC, 410 tea accessions were divided into four clusters (Figure 1). Among them, cluster 1 and 2 showed a higher frequency of rare alleles and genetic diversity, and there was high gene flow (Nm = 45.120) between two clusters. Yao et al., reported that a majority of rare SSR alleles and higher diversity were observed in the tea accessions from Yunnan and its neighboring provinces, considered as an original center of the tea plant in China [22]. They also reported that the allele number, genetic diversity, and PIC value of tea germplasm significantly decreased with the distance away from the origin center of the tea plant. Although a particular collection area cannot be designated as an origin, tea accessions contained in cluster 1 and 2 are thought to be the origin of the Korean tea germplasm due to their ratio of rare alleles and higher genetic diversity.
Kaundun et al., reported that tea accessions collected from Korea showed higher genetic diversity than those from Taiwan and Japan [21]. On the other hand, Jeong and Park mentioned that the genetic variation in Korean tea population is smaller compared to Chinese or Japanese wild tea populations [18]. The results of the present study confirmed that 410 tea accessions collected and conserved in Korea genebank exhibit the narrow genetic variations. Park et al., suggested that the low genetic diversity of Korean tea was established from a limited gene stock from China [14]. The short history and relatedly homogeneous environment in which they were introduced in the southwestern part of the country did not favor population differentiation. In addition, loss of diversity was exacerbated by the mass destruction of tea plantations in the fourteenth century due to political and religious reasons [44]. Consequently, tea being a highly outcrossing species, variability is mostly expected within rather than between the populations as predicted by Hamrick [45].

5. Conclusions

In this study, genetic diversity and population structure of 410 Korean tea accessions collected and conserved in Korea genebank were analyzed using 21 SSR markers. The results provided molecular evidence for the narrow genetic base of the Korean tea accessions. According to the database in NAC, initially, 4223 tea accessions were collected and conserved (http://genebank.rda.go.kr). However, only 510 tea accessions were conserved in NAC as many tea accessions were destroyed by the extreme cold condition in the winter season. Among them, 427 tea accessions were collected from Korea, 56 from China, 22 from Japan, and five from Indonesia. In conclusion, there exists an urgent need for broadening the genetic base of tea accessions in Korea genebank and the necessitation can be achieved by not only collecting tea plants in Korea but also introducing the tea germplasm from other countries. Additionally, it is necessary to analyze the biochemical components of tea accessions in order to gain an understanding of their effects on the quality characteristics of tea varieties and promote utilization of tea germplasm for tea breeding.

Supplementary Materials

The following are available online at https://www.mdpi.com/1999-4907/10/9/780/s1, Table S1: List of 410 tea accessions used in this study; Table S2: Repeat motif and product size of 21 SSR primers used in this study; Table S3: Genetic diversity of 21 SSR markers in each cluster; Figure S1: (A) Relationship between delta K and K as revealed by STRUCTURE harvester. (B) Population structure analysis of 410 tea accessions inferred using STRUCTURE software based on 21 SSR markers for delta K = 2.

Author Contributions

Conceptualization, K.J.L.; Data curation, K.J.L., R.S., and M.-J.S.; Formal analysis, K.J.L., R.S., and M.-J.S.; Investigation, J.-R.L., S.-H.K., and G.-T.C.; Project administration, D.Y.H.; Resources, J.-R.L., S.-H.K., and G.-T.C.; Writing—original draft, K.J.L.; Writing—review and editing, D.Y.H.

Funding

This research was funded by [Research Program for Agricultural Science & Technology Development, National Institute of Agricultural Sciences, Rural Development Administration, Republic of Korea] grant number [PJ01355702].

Conflicts of Interest

The authors declare no conflict of interest.

References

  1. Karak, T.; Bhagat, R.M. Trace Elements in Tea Leaves, Made Tea and Tea Infusion: A Review. Food Res. Int. 2010, 43, 2234–2252. [Google Scholar] [CrossRef]
  2. Wambulwa, M.C.; Meegahakumbura, M.K.; Kamunya, S.; Muchugi, A.; Möller, M.; Liu, J.; Xu, J.-C.; Li, D.-Z.; Gao, L.-M. Multiple origins and a narrow genepool characterise the African tea germplasm: Concordant patterns revealed by nuclear and plastid DNA markers. Sci. Rep. 2017, 7, 4053. [Google Scholar] [CrossRef] [PubMed]
  3. Karunarathna, K.H.T.; Mewan, K.M.; Weerasena, O.V.D.S.J.; Perera, S.A.C.N.; Edirisinghe, E.N.U.; Jayasoma, A.A. Understanding the genetic relationships and breeding patterns of Sri Lankan tea cultivars with genomic and EST-SSR markers. Sci. Hortic. 2018, 240, 72–80. [Google Scholar] [CrossRef]
  4. Wight, W. Nomenclature and Classification of the Tea Plant. Nature 1959, 183, 1726–1728. [Google Scholar] [CrossRef]
  5. Matsumoto, S.; Kiriiwa, Y.; Yamaguchi, S. The Korean tea plant (Camellia sinensis): RFLP analysis of genetic diversity and relationship to Japanese tea. Breed. Sci. 2004, 54, 231–237. [Google Scholar] [CrossRef]
  6. Thomas, T.A.; Mathur, P.N. Germplasm Evaluation and Utilzation. In Plant Genetic Resources: Conservation and Management. Concepts and Approaches; Paroda, R.S., Arora, R.K., Eds.; IBPGR Regional Office: New Delhi, India, 1991. [Google Scholar]
  7. Wambulwa, M.C.; Meegahakumbura, M.K.; Samson, K.; Alice, M.; Michael, M.; Liu, J.; Xu, J.C.; Sailesh, R.; Li, D.Z.; Gao, L.M.; et al. Insights into the genetic relationships and breeding patterns of the african tea germplasm based on nSSR markers and cpDNA sequences. Front. Plant Sci. 2016, 7, 1244. [Google Scholar] [CrossRef] [PubMed]
  8. Li, Y.; Chen, C.; Li, Y.; Ding, Z.; Shen, J.; Wang, Y.; Zhao, L.; Xu, M.; Li, Y.; Chen, C.; et al. The identification and evaluation of two different color variations of tea. J. Sci. Food Agric. 2016, 96, 4951–4961. [Google Scholar] [CrossRef]
  9. Feng, L.; Gao, M.J.; Hou, R.Y.; Hu, X.Y.; Zhang, L.; Wan, X.C.; Wei, S.; Feng, L.; Gao, M.J.; Hou, R.Y.; et al. Determination of quality constituents in the young leaves of albino tea cultivars. Food Chem. 2014, 155, 98–104. [Google Scholar] [CrossRef]
  10. Gunasekare, M.T.K. Applications of molecular markers to the genetic improvement of Camellia sinensis L. (tea)—A review. J. Pomol. Hort. Sci. 2007, 82, 161–169. [Google Scholar]
  11. Chen, L.; Zhou, Z.X.; Chen, L.; Zhou, Z.X. Variations of main quality components of tea genetic resources [Camellia sinensis (L.) O. Kuntze] preserved in the China National Germplasm Tea Repository. Plant Foods Hum. Nutr. 2005, 60, 31–35. [Google Scholar] [CrossRef]
  12. Chen, L.; Yamaguchi, S.; Chen, L.; Yamaguchi, S. RAPD markers for discriminating tea germplasms at the inter-specific level in China. Plant Breed. 2010, 124, 404–409. [Google Scholar] [CrossRef]
  13. Fang, W.; Cheng, H.; Duan, Y.; Jiang, X.; Li, X. Genetic diversity and relationship of clonal tea (Camellia sinensis) cultivars in China as revealed by SSR markers. Plant Syst. Evol. 2012, 298, 469–483. [Google Scholar] [CrossRef]
  14. Park, Y.-G.; Kaundun, S.S.; Zhyvoloup, A. Use of the bulked genomic DNA-based RAPD methodology to assess the genetic diversity among abandoned Korean tea plantations. Genet. Resour. Crop Evol. 2002, 49, 159–165. [Google Scholar]
  15. Lai, J.A.; Yang, W.C.; Hsiao, J.Y. An assessment of genetic relationships in cultivated tea clones and native wild tea in Taiwan using RAPD and ISSR markers. Bot. Bull. Acad. Sin. 2001, 42, 93–100. [Google Scholar]
  16. Oh, C.J.; Lee, S.; You, H.C.; Chae, J.G.; Han, S.S. Genetic Diversity of Wild Tea (Camellia sinensis L.) in Korea. Korean J. Plant Resour. 2008, 21, 41–46. [Google Scholar]
  17. Korir, N.K.; Han, J.; Shangguan, L.; Wang, C.; Kayesh, E.; Zhang, Y.; Fang, J. Plant variety and cultivar identification: Advances and prospects. Crit. Rev. Biotechnol. 2013, 33, 111–125. [Google Scholar] [CrossRef]
  18. Jeong, B.-C.; Park, Y.-G. Tea Plant (Camellia sinensis) Breeding in Korea. In Global Tea Breeding: Achievements, Challenges and Perspectives; Springer: Berlin/Heidelberg, Germany, 2012; pp. 263–288. [Google Scholar]
  19. Gai, Z.; Wang, Y.; Jiang, J.; Xie, H.; Ding, Z.; Ding, S.; Wang, H. The quality evaluation of tea (Camellia sinensis) varieties based on the metabolomics. Horticulture 2019, 54, 409. [Google Scholar] [CrossRef]
  20. Chen, L.; Yao, M.; Zhao, L.P.; Wang, X. Recent Research Progresses on Molecular Biology of Tea Plant (Camellia sinensis). In Floriculture, Ornamental and Plant Biotechnology: Advances and Topical Issues, 1st ed.; da Silva, J.A.T., Ed.; Global Science Books: London, UK, 2006; Volume 4, pp. 425–436. [Google Scholar]
  21. Kaundun, S.S.; Zhyvoloup, A.; Park, Y.-G. Evaluation of the genetic diversity among elite tea (Camellia sinensis var. sinensis) accessions using RAPD markers. Euphytica 2000, 115, 7–16. [Google Scholar] [CrossRef]
  22. Yao, M.-Z.; Ma, C.-L.; Qiao, T.-T.; Jin, J.-Q.; Chen, L. Diversity distribution and population structure of tea germplasms in China revealed by EST-SSR markers. Tree Genet. Genomes 2012, 8, 205–220. [Google Scholar] [CrossRef]
  23. Jeong, B.-C.; Song, Y.S.; Moon, Y.H.; Han, S.K.; Bang, J.K. Collection and Multiplication of Superior Germplasm for Development of the New Tea Tree Cultivar; Joint Research Report for Tea germplasm in Korea; RDA: Mokpo, Korea, 2007; pp. 1–46. [Google Scholar]
  24. Kamvar, Z.N.; Tabima, J.F.; Grünwald, N.J. Poppr: An R package for genetic analysis of populations with clonal, partially clonal, and/or sexual reproduction. PeerJ. 2014, 2, e281. [Google Scholar] [CrossRef]
  25. Peakall, R.; Smouse, P.E. GenAlEx 6.5: Genetic analysis in Excel. Population genetic software for teaching and research±an update. Bioinformatics 2012, 28, 2537–2539. [Google Scholar] [CrossRef] [PubMed]
  26. Ivandic, V.; Hackett, C.A.; Nevo, E.; Keith, R.; Thomas, W.T.B.; Forster, B.P. Analysis of simple sequence repeats (SSRs) in wild barley from the Fertile Crescent: Associations with ecology, geography and flowering time. Plant Mol. Biol. 2002, 48, 511–527. [Google Scholar] [CrossRef] [PubMed]
  27. Jombart, T. adegenet: A R package for the multivariate analysis of genetic markers. Bioinformatics 2008, 24, 1403–1405. [Google Scholar] [CrossRef] [PubMed]
  28. Jombart, T.; Collins, C. A tutorial for Discriminant Analysis of Principal Components (DAPC) using adegenet 2.0.0. Available online: http://adegenet.r-forge.r-project.org/files/tutorial-dapc.pdf (accessed on 6 September 2019).
  29. Grunwald, N.J.; Kamvar, Z.N.; Everhart, S.E.; Tabima, J.F.; Knaus, B.J. Population Genetic and Genomics in R. Available online: http://grunwaldlab.github.io/Population_Genetics_in_R/ (accessed on 3 April 2019).
  30. Agapow, P.-M.; Burt, A. Indices of multilocus linkage disequilibrium. Mol. Ecol. Notes 2001, 1, 101–102. [Google Scholar] [CrossRef]
  31. van de Wouw, M.; Kik, C.; van Hintum, T.; van Treuren, R.; Visser, B. Genetic erosion in crops: Concept, research results and challenges. Plant Genet. Resour. 2010, 8, 1–15. [Google Scholar] [CrossRef]
  32. van Heerwaarden, J.; Hellin, J.; Visser, R.F.; van Eeuwijk, F.A. Estimating maize genetic erosion in modernized smallholder agriculture. Theor. Appl. Genet. 2009, 119, 875–888. [Google Scholar] [CrossRef] [PubMed] [Green Version]
  33. Kim, O.G.; Sa, K.J.; Lee, J.R.; Lee, J.K. Genetic analysis of maize germplasm in the Korean Genebank and association with agronomic traits and simple sequence repeat markers. Genes Genom. 2017, 39, 843–853. [Google Scholar] [CrossRef]
  34. Gepts, P. Plant genetic resources conservation and utilization: The accomplishments and future of a societal insurance policy. Crop Sci. 2006, 46, 2278–2292. [Google Scholar] [CrossRef]
  35. Eom, B.-C.; Kim, J.-W. Phytocoenosen and Distribution of a Wild Tea (Camellia sinensis (L.) Kuntze) Population in South Korea. Korean J. Plant Resour. 2017, 30, 176–190. [Google Scholar] [CrossRef]
  36. Harris, A.M.; DeGiorgio, M. An Unbiased Estimator of Gene Diversity with Improved Variance for Samples Containing Related and Inbred Individuals of any Ploidy. G3 Genes Genom. Genet. 2017, 7, 671–691. [Google Scholar] [CrossRef] [PubMed] [Green Version]
  37. Balloux, F.; Lehmann, L.; de Meeûs, T. The Population Genetics of Clonal and Partially Clonal Diploids. Genetics 2003, 164, 1635–1644. [Google Scholar] [PubMed]
  38. Birky, C.W., Jr. Heterozygosity, heteromorphy, and phylogenetic trees in asexual eukaryotes. Genetics 1996, 144, 427–437. [Google Scholar] [PubMed]
  39. Halkett, F.; Simon, J.C.; Balloux, F. Tackling the population genetics of clonal and partially clonal organisms. Trends Ecol. Evol. 2005, 20, 194–201. [Google Scholar] [CrossRef] [PubMed]
  40. Song, Y.S.; Moon, Y.H.; Han, S.K.; Jeong, B.C.; Bang, J.K. Morphological characteristics of progeny population in collected wild tea (Camellia sinensis). J. Korean Tea Soc. 2005, 11, 93–105. [Google Scholar]
  41. Campoy, J.A.; Lerigoleur-Balsemin, E.; Christmann, H.; Beauvieux, R.; Girollet, N.; Quero-García, J.; Dirlewanger, E.; Barreneche, T. Genetic diversity, linkage disequilibrium, population structure and construction of a core collection of Prunus avium L. landraces and bred cultivars. BMC Plant Biol. 2016, 16, 49. [Google Scholar] [CrossRef] [PubMed]
  42. Deperi, S.I.; Tagliotti, M.E.; Bedogni, M.C.; Manrique-Carpintero, N.C.; Coombs, J.; Zhang, R.; Douches, D.; Huarte, M.A. Discriminant analysis of principal components and pedigree assessment of genetic diversity and population structure in a tetraploid potato panel using SNPs. PLoS ONE 2018, 13, e0194398. [Google Scholar] [CrossRef]
  43. Rosyara, U.R.; De Jong, W.S.; Douches, D.S.; Endelman, J.B. Software for Genome-Wide Association Studies in Autopolyploids and Its Application to Potato. Plant Genome 2016, 9. [Google Scholar] [CrossRef] [PubMed]
  44. Choi, S. Studies of the aroma of Korean green tea. In Proceedings of the International Symposium of Tea Science; ISTS: Shizuoka, Japan, 1991; pp. 130–134. [Google Scholar]
  45. Hamrick, J. Isozymes and the analysis of genetic structure in plant populations. In Isozymes in Plant Biology; Soltis, D.E., Soltis, P.S., Dudley, T.R., Eds.; Springer: Dordrecht, The Netherlands, 1989; pp. 87–105. [Google Scholar]
Figure 1. Discriminant analysis of principal components (DAPC) for 410 tea accessions. The axes represent the first two Linear Discriminants (LD). Each circle represents a cluster and each dot represents an individual. Numbers represent the different subpopulations identified by DAPC analysis.
Forests 10 00780 g001
Table 1. List of 21 simple sequence repeat (SSR) primers used in this study.
LocusSequence (5′→ 3′)Dye
MSG0258F: ACTCATCACCATGCCTTCTCCATCFAM
R: GTTTAGCTCAACTGGTGGAACCTCAACT
MSE0173F: GTGTTCACCAACAACTCACCAAGGFAM
R: TGTCGAACAAAGATACACCCCAAA
MSE0313F: TGCTATGCCGCCTAACAAAAACTTFAM
R: ACCACCAACAACAATTCCCACTCT
MSG0403F: ATGATCGCCGGTTTAGAGATGAATFAM
R: GTTTAAGCTGGCTAACCTACACGGAGC
MSE0083F: GAGGAAAGAGATTATGCGGTGTGGFAM
R: GTGAGCCTTCAAAAGACAGCAACG
TM604F: TCTCAATCAAGGTTCCGAGGFAM
R: TGACATATTCGCCCAACAAA
TM530F: CCGTGTTTACCACCACCCTFAM
R: CCCTGGGAACAAGAAAGTGA
MSG0361F: AGATGGAGGTAGAGAGAGAGGCAGHEX
R: GTTTGTCCCTCTCATTTTCAACGC
MSE0029F: ATAGCCAATCAAGCTCCTCCTCCTHEX
R: AGTCTGTTCCTCCCTTGATGATCG
MSG0610F: ACAGAGGAGGAAGATGATCGGTAAHEX
R: GTTTGAAGAAGAAGAAAACTCCCGCCAT
MSE0291F: AATCAAATAACACTTGCACCCGCHEX
R: AAAAAGAGAAAGTCACGTCCACGG
MSG0681F: AGGGTTTGCGTCTTCAAAGAGAGAHEX
R: GTTTGTAACACTTGCCACGTTTCG
MSG0470F: ATAGGGTTCGAAAATGGCAGGHEX
R: GTTTGAGGTGGCAAGTTTGTGACTGT
MSG0699F: ATGCGACAGTGTTGCTGAGATTTTHEX
R: GTTTCAAAAATGGGGTGTCTACAGAGGG
MSG0429F: AGGACCGTTCTTCCCTACCTGTAANED
R: GTTTGAGATTGAGGATGTGGTCGTTGT
MSG0380F: ACAGACCTTCACCCTCTCCATTTCNED
R: GTTTACCTCTGCCTTCGTTCTTCAGC
MSG0423F: ACTCCATGTGCTGCTCTGTAGTTCNED
R: GTTTGCAGGAAGTTGAGCCAGAC
MSE0237F: CTCTCCTTCTTCACACCCTCCAAANED
R: TTGTTCTCAAAGAACCTCCTTCGC
MSE0113F: TACCTTCTGCAACTCCAGCAATCCNED
R: TGAGATTGACCATCTTTCATCGGA
MSE0107F: TCTCTCTACTCCTGCGCAATCTCANED
R: TCAAAGATGTTGCTCTCGTCAACC
TM382F: TCTCAAAACCAAATAGGCTCAANED
R: TTGCGTTATGATTTCTGGGA
Table 2. Distribution of collected locations and clusters from discriminant analysis of principal components (DAPC) analysis in 410 tea accessions.
LocationCluster 1Total (%)
1234
GN 2
Gimhae11316 (1.5)
Namhae1 23 (0.7)
Sacheon 213 (0.7)
Sancheong2 1 3 (0.7)
Yangsan22116 (1.5)
Jinju 2114 (1.0)
Hadong 2114 (1.0)
Subtotal679729 (7.1)
JN
Gangjin6251124 (5.9)
Goheung21 3 (0.7)
Gokseong1 629 (2.2)
Gwangyang21 25 (1.2)
Gwangju113 14 (3.4)
Gurye672318(4.4)
Naju10310629 (7.1)
Damyang 235 (1.2)
Mu’an711211 (2.7)
Boseong2817161677 (18.8)
Suncheon177191457 (13.9)
Yeosu133310 (2.4)
Yeong’am451212 (2.9)
Jangseong339520 (4.9)
Jangheung3 238 (2.0)
Jindo 11 2 (0.5)
Hampyeong31228 (2.0)
Haenam1113217 (4.1)
Hwasun1144221 (5.1)
Subtotal126608678350 (85.4)
JB
Gochang 2114 (1.0)
Gimje1 113 (0.7)
Sunchang2 3 5 (1.2)
Iksan1 1 (0.2)
Jeongeup13318 (2.0)
Subtotal558321 (5.1)
Unknown135110 (2.4)
Total1387510889410
1 Clusters were from the result of DAPC analysis, 2 GN—Gyeongsangnam-do; JN—Jeollanam-do; JB—Jeollabuk-do.
Table 3. Genetic diversity and linkage of 410 tea accessions.
ClusterN aMLGλGDIarbarDp-Value (rbarD)
C11381380.9930.7780.1230.00620.018
C275750.9870.8050.5540.02820.001
C31081080.9910.7240.4620.02350.001
C489880.9890.6950.9990.05080.001
Total4104090.9980.7921.1540.05830.001
a N, Number of accessions; MLG, Number of multilocus genotypes; λ, Simpson’s index; GD, Nei’s unbiased gene diversity; Ia, The index of association; rbadD, The standardized index of association.
Table 4. Distribution of rare alleles observed in four clusters.
LocusC1C2C3C4Total
MSG02582 (2)1 (1)1 (1)1 (1)3 (5)
MSE01730 (0)2 (2)1 (1)0 (0)2 (3)
MSE03135 (5)1 (1)0 (0)1 (1)5 (7)
MSE04033 (3)2(3)1 (2)1 (1)6 (9)
MSE00836 (9)3 (4)1 (2)0 (0)6 (15)
TM6041 (1)0 (0)0 (0)0 (0)1 (1)
TM5300 (0)0 (0)0 (0)1 (1)1 (1)
MSG03610 (0)0 (0)0 (0)0(0)6 (0)
MSE00291 (3)1 (1)0 (0)0 (0)1 (4)
MSE02911 (4)1 (2)1 (1)1 (1)4 (8)
MSG06812 (2)1 (1)2 (2)0 (0)5 (5)
MSG04705 (7)2 (2)0 (0)0 (0)6 (9)
MSG06991 (1)1 (2)4 (4)1 (1)6 (2)
MSG04291 (3)0 (0)0 (0)1 (1)1 (4)
MSG03802 (2)2 (2)1 (1)0 (0)2 (5)
MSG04232 (3)1 (2)1 (1)1 (1)4 (7)
MSE02370 (0)1 (2)2 (4)0 (0)3 (6)
MSE01133 (5)4 (6)2 (2)2 (2)6 (15)
MSE01073 (3)4 (5)0 (0)0 (0)5 (8)
TM3822 (2)1 (1)0 (0)2 (2)3 (5)
Total41 (56)30 (39)20 (24)16 (16)76 (119)
Table 5. Analysis of molecular variance (AMOVA) of 410 tea accessions.
SourcedfSSMSEst. Var.% Valuep Value
Among Pops3201.37567.1250.3881%PhiPT0.0140.001
Within Pops40611391.25028.05728.05799%Nm36.156
Total40911592.624 28.445100%
Table 6. Pairwise population PhiPT values (Below diagonal) and Nm values based on 999 permutations (above diagonal) from AMOVA. All PhiPT values were significantly greater than 0 (p < 0.0001).
C1C2C3C4
C1-45.12033.52540.760
C20.011-23.71747.872
C30.0150.021-37.797
C40.0120.0100.013-

