The Role of Woodlots in Forest Regeneration outside Protected Areas: Lessons from Tanzania


Department of Geography, University of Wisconsin–Madison, 550N Park St, Madison, WI 53706, USA
*
Author to whom correspondence should be addressed.
Forests 2019, 10(8), 621; https://doi.org/10.3390/f10080621
Submission received: 23 May 2019
/
Revised: 12 July 2019
/
Accepted: 24 July 2019
/
Published: 25 July 2019
(This article belongs to the Special Issue The Forest Renewal Issue: New Problems and Findings in the Establishment of Tree Regeneration)
Abstract
:Promoting forest regeneration outside protected forests is an urgent challenge in densely settled, biodiverse areas like the East African Rift. Regenerating forests entails managing complex processes of ecological recovery as well as understanding the needs and motivations of local land users. Here, we evaluate pathways for attaining native tree regeneration across variable site conditions. We investigate two common strategies for attaining native tree regeneration—setting aside land for forest regeneration (‘Protect and Wait’) and native tree planting (‘Native Tree Planting’)—and a possible third, smallholder exotic tree-planting (‘Woodlots’). We measured native seedling regeneration patterns for each of the three strategies, all underway at a single site in Southern Tanzania. We also used historical aerial photograph analysis and interviews with smallholder farmers to understand past and present land use. Our results show that forest regeneration has been arrested for decades on land under ‘Protect and Wait’, and seedling survival appears to be limited under ‘Native Tree Planting’. In contrast, we found saplings of 28 native species growing spontaneously within pine, eucalyptus, and cypress woodlots planted <400 m from native forest boundaries. Interviews showed that the citizens most likely to plant woodlots near the protected forest were those who owned additional land parcels elsewhere. Some saw woodlots as a means to avoid losing crops to wildlife at the forest edge. Our findings suggest: (1) Simply setting aside land for regeneration does not guarantee forest regrowth, even if it is adjacent to natural forest, (2) native seedlings will be more likely to survive if planted near shade trees, and (3) smallholders’ woodlots could hasten native tree regeneration at forest park edges if farmers have incentives to protect the native tree seedlings in their woodlots and they can find land elsewhere to plant food crops.
1. Introduction
Promoting native forest regeneration outside isolated protected areas is necessary to counter habitat fragmentation and isolation [1,2]. Field projects are underway globally to create forested corridors: Some simply to facilitate wildlife movement, and others to provide habitat [3]. There is special urgency for such efforts in areas with acute forest isolation, including densely settled biodiversity hotspots such as the East African Rift [4]. Here, forest remnants range from 84 Ha to 160,000 Ha [5,6], contain endangered and endemic species [7,8], and are surrounded by densely settled agriculture (up to 300 people per km2 [9]). Spatial planning tools and modeling can help identify and prioritize where to locate a corridor site [10,11], but the greater challenge lies in the implementation. Finding ecologically sound and socially fair ways to promote forest corridors in the Rift presents two main challenges: (1) Implementing restoration projects in the absence of detailed data on vegetation baselines and trajectories, and (2) incorporating the needs and motivations of local land users.
Before embarking on a forest regeneration effort, desired land cover outcomes should be defined based on known vegetation baselines [12] (Figure 1). Such baselines are difficult to establish in the East African Rift due to the region’s status as an ecotone between forest and savanna [13], and the limited availability of historical vegetation records [14]. Satellite imagery has limited applicability due to the region’s extensive cloud cover, fine-scale land use variations, and the fact that satellite data typically extends only to the mid-1980s. Alternative data sources, such as historical vegetation surveys and aerial photographs can help reconstruct land use and land cover changes [14] and aid in setting restoration targets [15].
If forest is the desired land cover, the next step is to identify the site conditions associated with native forest regeneration (Figure 1). The presence of native tree seedlings is a good indicator of the ability of the forest to regenerate and depends on the site’s ecological and management conditions [16]. Ecological conditions known to predict the presence and abundance of native tree seedlings include past forest cover, distance from current native forests, fire frequency, and the presence of competing vegetation. Sites previously forested may regenerate due to the presence of dormant seeds in the soil [17]. The distance from current forest edges also predicts native seedlings presence and abundance, partly by providing a proximate source of dispersers and seeds [18,19]. Conversely, fast-growing vegetation, such as grasses and shrubs, can out-compete native tree seedlings [20]. Other factors, like the presence of remnant trees, appear to increase native seedlings’ success either by self-propagation or by providing roosting spots for dispersers [21].
Site management conditions and land ownership can also be associated with either increased or decreased seedling presence (Figure 1). Forests can regenerate if fire and grazing are limited and grasses are controlled, but can otherwise stall, even on protected land [22]. Conversely, private landowners may manage their land in a manner that supports native seedlings regeneration (e.g., by suppressing competing vegetation or fires) [23].
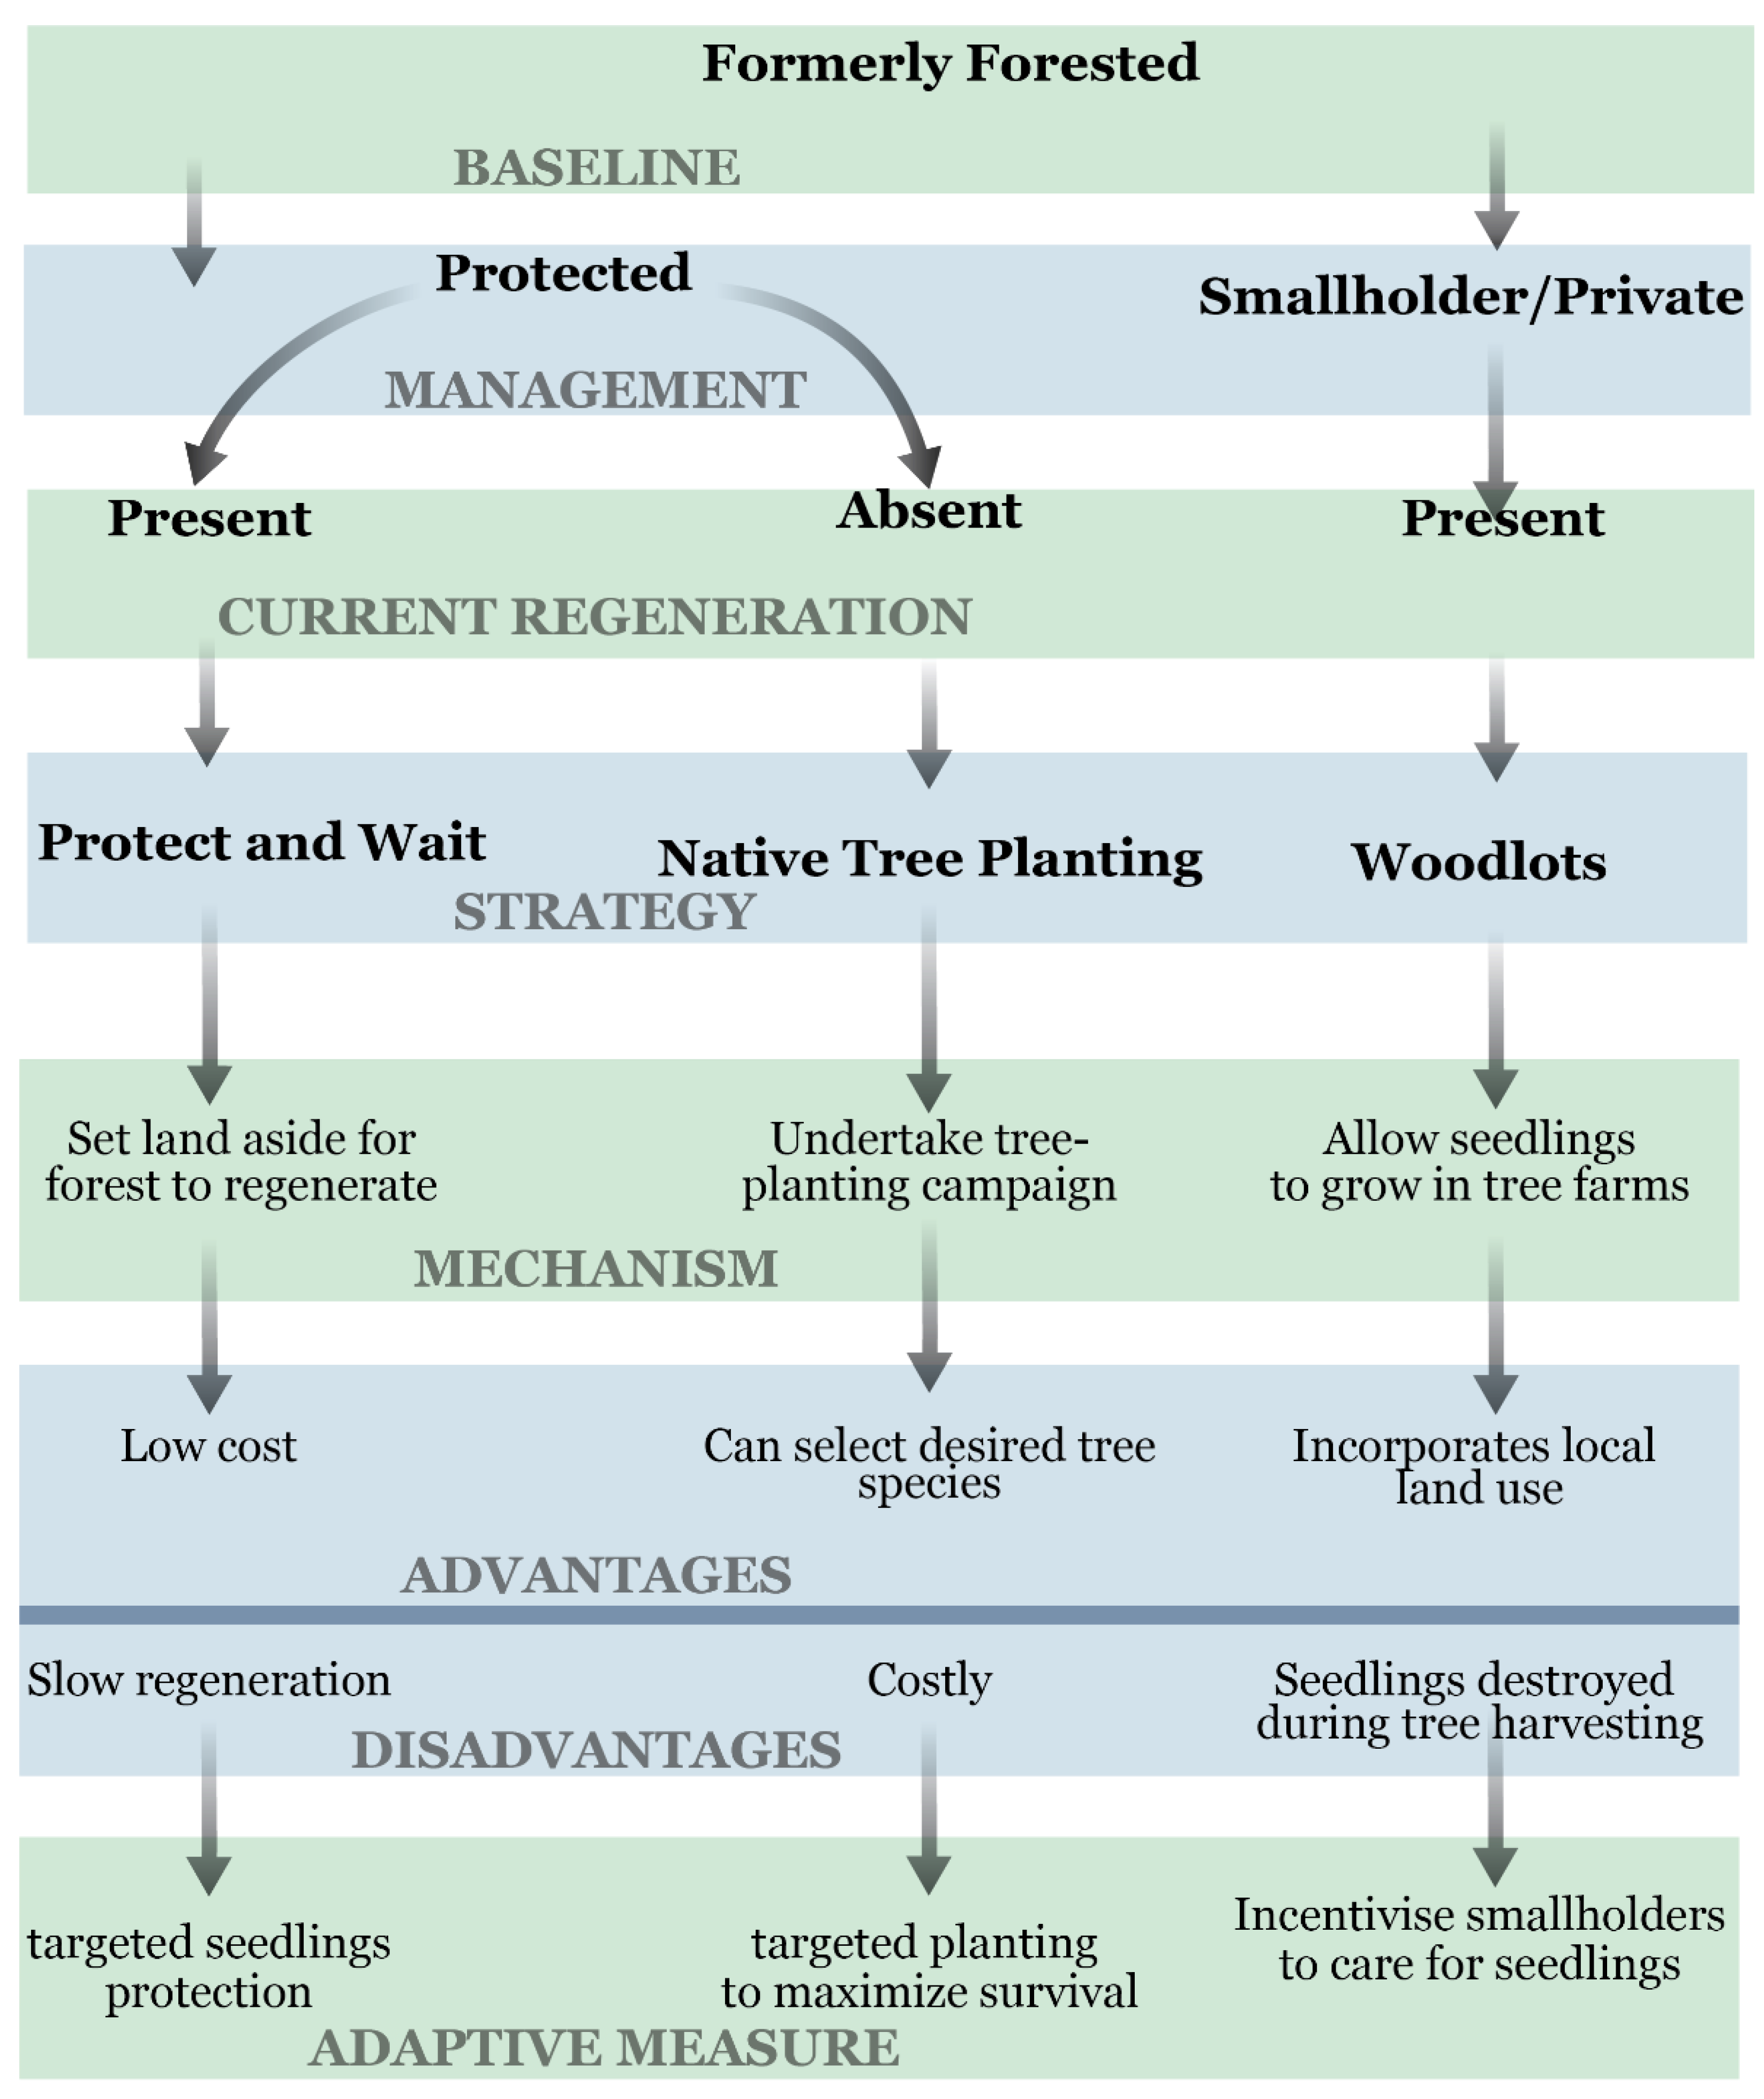
After defining the desired regeneration outcome and appraising a site’s management conditions, managers need to select an ecologically and socially viable regeneration strategy. In the Rift, regeneration strategies tend to fall into two categories: Protect an area from human disturbance so it can naturally regenerate (hereafter: Protect and Wait) or actively restore an area via native tree planting (hereafter: Native Tree Planting). We also explore a third, less familiar approach, centered on integrating smallholder tree farms into regeneration planning (hereafter: Woodlots) (Figure 1). We organize our analysis around the three strategies to reveal challenges and opportunities for forest regeneration at our study site and other isolated Rift protected forests.
The first strategy—Protect and Wait—entails the creation of new conservation areas, the extension of existing protected area boundaries, or local land-use zoning [24,25,26]. We define Protect and Wait in this context as a regeneration strategy that relies on native forest regrowth. Some studies from the Rift show that, with time, this strategy can favor regeneration [27]. Yet, Protect and Wait can imply significant social costs if it entails displacing smallholders from their land (Table A1). Forested corridor creation in the Rift involving the forced relocations of communities has a troubled history, including cases of violence and impoverishment [24].
The second strategy—Native Tree Planting—can be implemented in land under any management condition, but in the Rift, it is more common in protected areas (Table A1). We define Native Tree Planting in this context as an intensive native tree planting activity for the purpose of regenerating forested habitat (individual tree planting for shade or fruit on private land, for example, is excluded). In the Rift, non-governmental organizations tend to cover the direct costs of seedling propagation and distribution (Table A1). These costs can be significant (up to 700 USD/Ha [28,29]). Local citizens sometimes provide wage labor and/or raise seedlings for sale to projects undertaking Native Tree Planting [30], which indicates a potential social benefit.
The third strategy—Woodlots—centers on ongoing smallholder tree farming. In the East African context, a ‘woodlot’ generally refers to a small (<5 Ha) monoculture of non-native trees planted on private land [31,32,33,34]. Here, we propose Woodlots as an indirect regeneration strategy that would rely on protecting native tree seedlings found in woodlots that are grown for timber, firewood, and/or fruits, and are rapidly developing at the edges of protected forests in the Rift [35,36]. The term Woodlot should thus be understood both as a regeneration strategy as well as a type of land use. To date, those studying regeneration have generally viewed woodlots only as a way to alleviate pressure on native forests in the Rift by meeting the high demand for timber and firewood [25,37]. Their possible role in facilitating forest regeneration has received less attention (but see [23,25,36]).
If an area identified for forest regeneration is already under smallholder management, the Woodlot strategy is worth exploring. Woodlots on land adjacent to some forest edges in the Rift are increasing at a rapid rate [33,35]. Amidst this rapid expansion of woodlots [34,38,39], it remains unclear how smallholders decide to establish woodlots on a given land parcel versus another. These land allocation decisions are relevant to forest regeneration planning because management practices related to woodlots (e.g., suppressing fires and competing vegetation) shape native tree seedlings regeneration [36,40].
In this study, we evaluate the merits of different pathways to attain native tree regeneration in the context of local conditions. We focus on a corridor site in Southern Tanzania, where all three strategies are underway in a single small (300 Ha) area that includes government-protected land and smallholder farms. Specifically, we aim to:
- (1)
- Determine historical trends in tree cover for the area under protection versus under smallholder management;
- (2)
- Identify site conditions and management factors that determine variations in native tree seedling density and richness under the three regeneration strategies (Protect and Wait, Native Tree Planting, and Woodlots); and
- (3)
- Identify factors associated with allocating land to woodlots among smallholder farmers.
Thus, we draw lessons on when Protect and Wait results in regeneration, how Native Tree Planting can be improved via understanding of the site’s management and ecological conditions, and discuss Woodlots’ role in harboring native seedlings. A novel contribution of the paper is its consideration of all three strategies in a single area. We also document factors shaping smallholders’ decisions to plant woodlots, particularly near protected forests.
2. Methods
2.1. Study Site
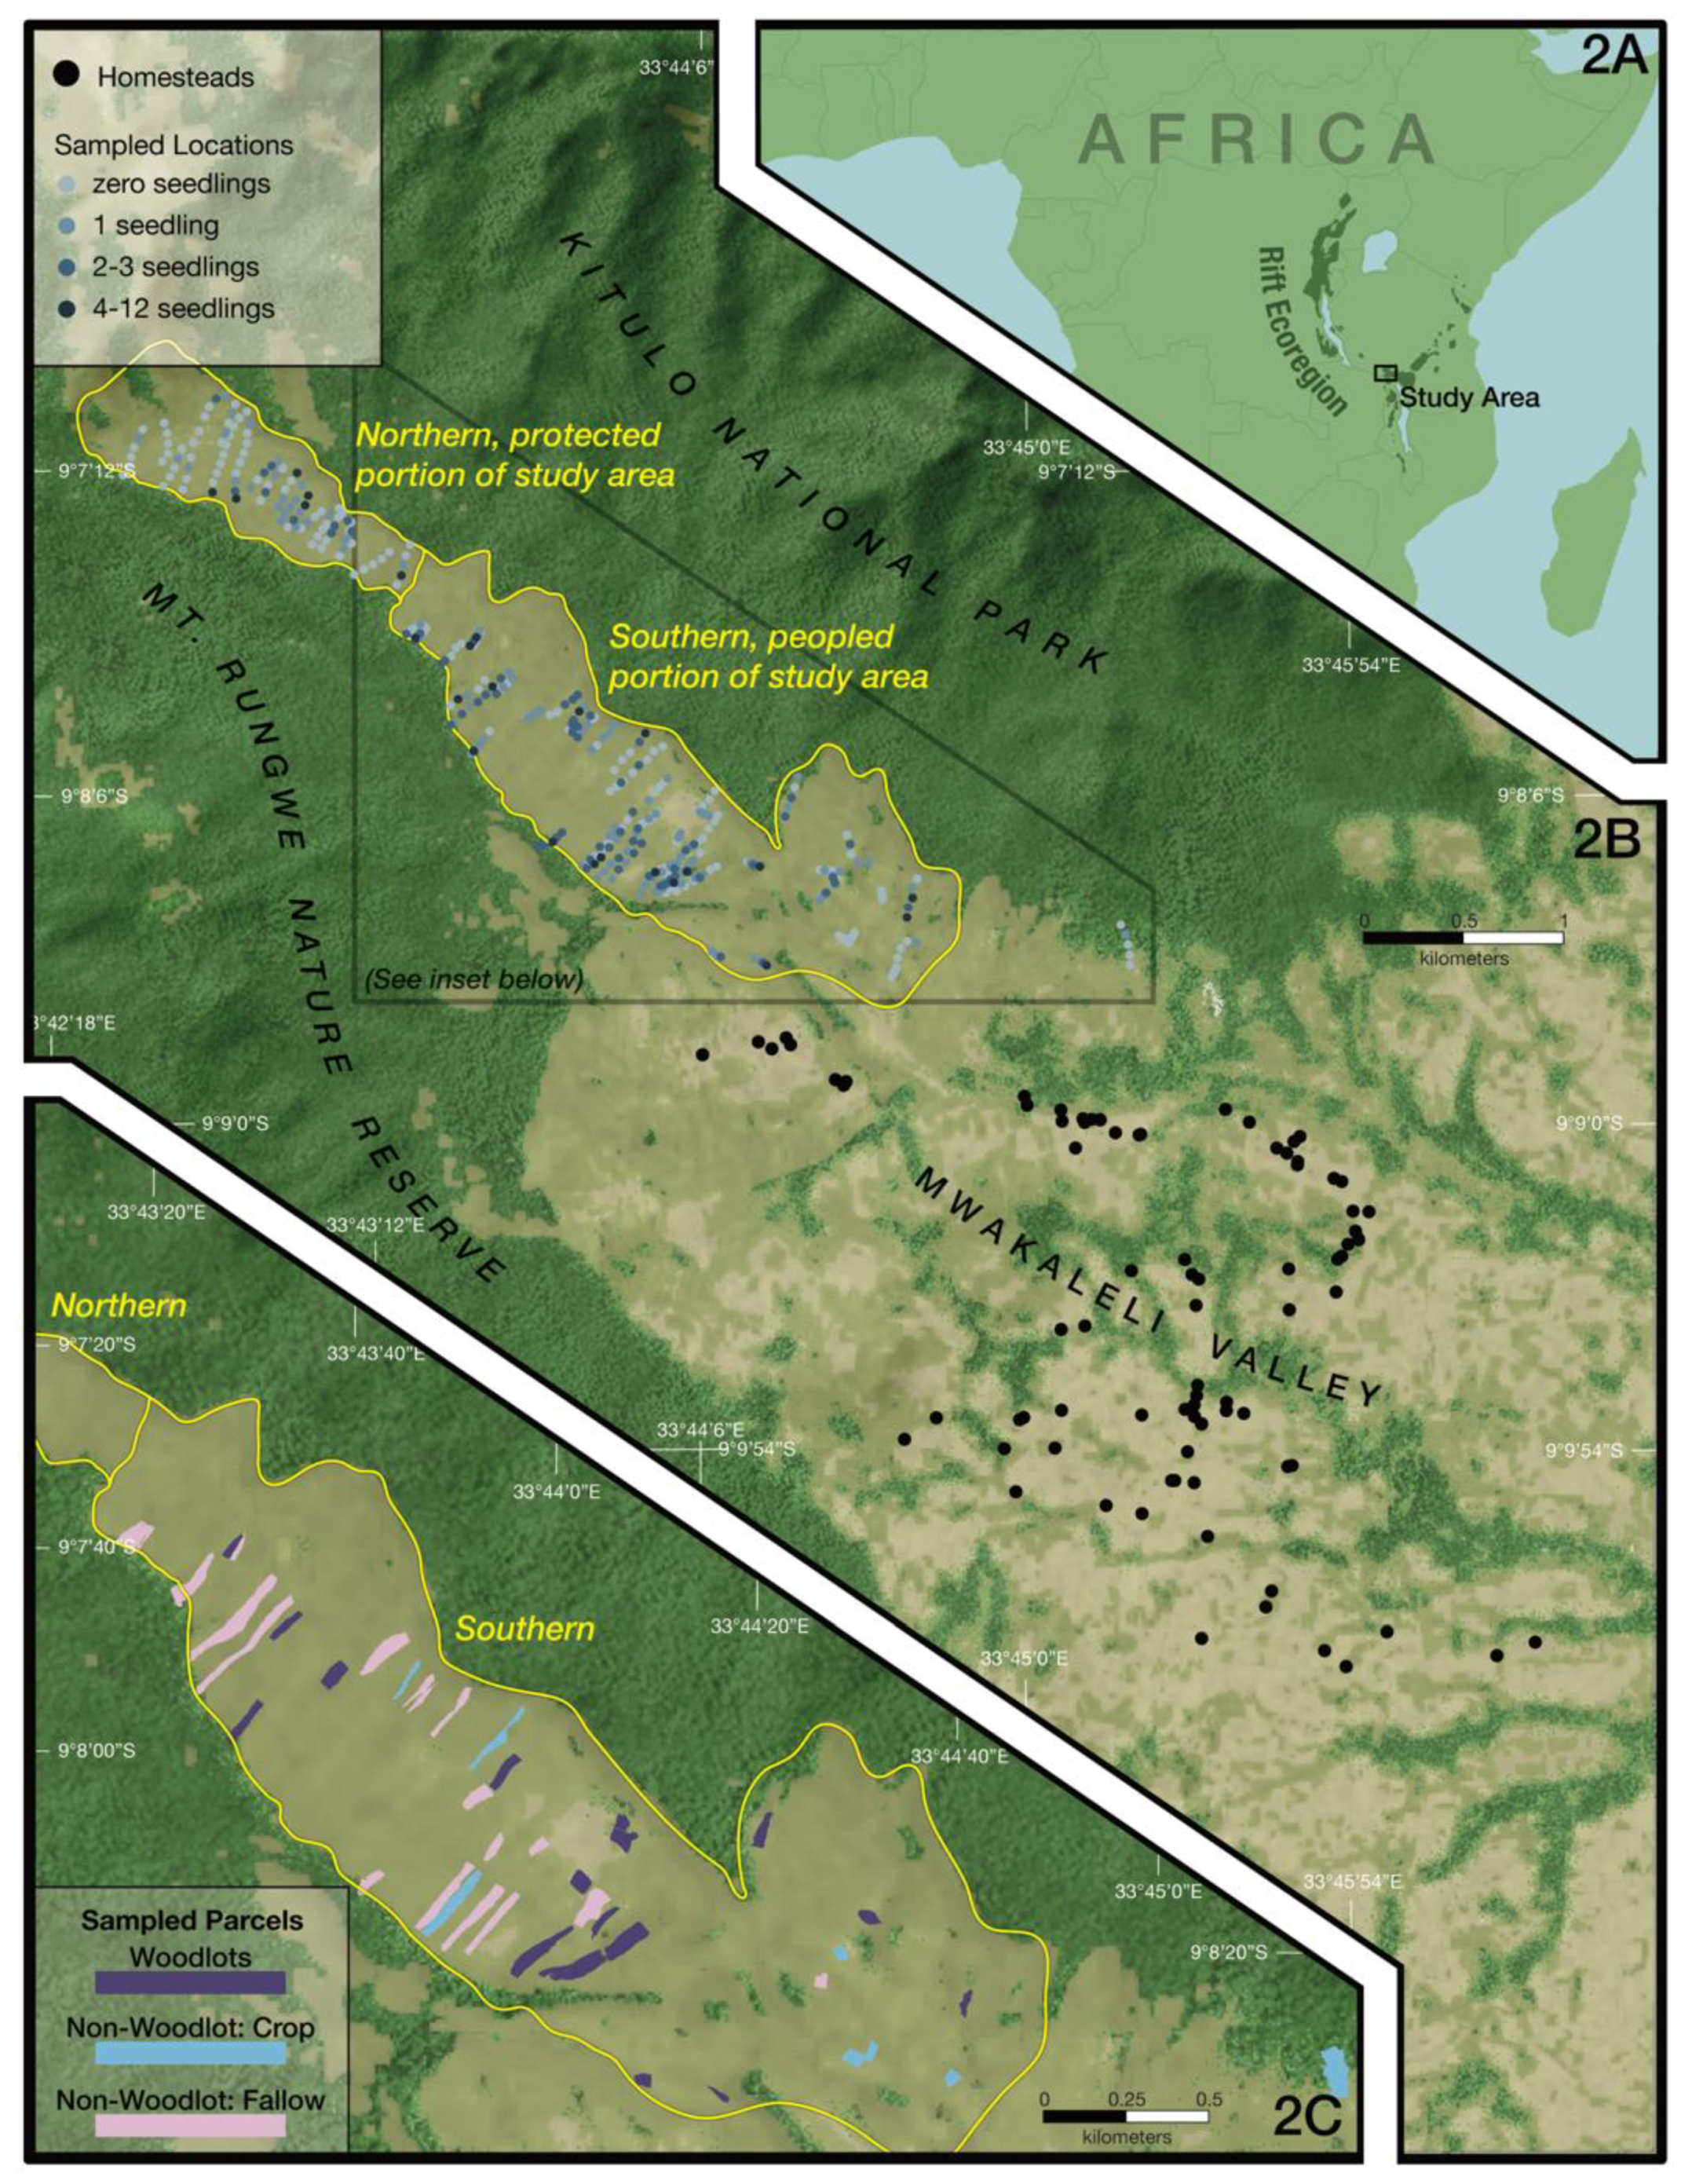
Our study site lies in the southern end of the East African Rift, amid the montane forests of Southern Tanzania (9° S, 33° E, Figure 2A). The southern highlands have a complex mosaic of ecotones, including native forest blocks located on either side of the study site, and flora-rich highland grasslands located ~1000 m above the study site [41]. The site receives 2000 mm of rainfall per year, and ranges in elevation from 1686–2008 m from south to north (Figure 2B).
We looked at the three forest regeneration strategies in the ‘Bujingijila gap’, a non-forested area measuring ~3 by ~1 km between two protected forests. The site is divided into two portions that differ by management: The northern, protected portion which is within Kitulo National Park, and the southern portion, which is under smallholder ownership (Figure 2B). At the study site, the three regeneration strategies observed were: Protect and Wait, Native Tree Planting, and Woodlots. Protect and Wait and Native Tree Planting strategies were implemented in the northern, protected portion of the site. Protect and Wait was implemented inadvertently, as the northern, protected portion of the site is within a protected area boundary. Native Tree Planting was implemented by the Southern Highlands Conservation Program (SHCP), a non-profit that invested in planting 17,500 native trees between 2010 and 2014 in an area measuring 8 Ha within the northern portion [42]. Woodlots are found in the southern portion (Figure 2C). Although there are no homesteads in the southern portion, there are crop cultivations, fallows, and woodlots. In the woodlots, smallholders plant exotic trees, including pine (Pinus patula), eucalyptus (Eucalyptus maidenii), and cypress (Cupressus lusitanica). The three strategies were not uniformly replicated across the study area, but all were underway within a 300 Ha area bordered by the mid-altitude forests of comparable composition [43]. This juxtaposition affords a unique opportunity for comparison.
2.2. Data Collection
The first author conducted archival and field research in June–August 2015, including analysis of aerial photographs, field surveys of vegetation, and interviews of smallholders.
Aerial Photographs allowed us to evaluate historical forest cover and determine vegetation baselines. We acquired multi-angle aerial photographs that cover our site for the years 1949, 1969, 1976, and 1985 (full reference in F A2). We georeferenced the aerial photographs in QGIS using the Georeferencer plugin. We collected at least ten ground control points (GCP) per image, using the Open Layers plugin for spatial reference, and applied the Thin Plate Transformation to minimize root mean square error (RMSE) (RMSE and number of GCP for each image in Table A2). We mosaicked the georeferenced aerial photos by year, and then hand-digitized tree cover in the study site for each year. We also hand-digitized tree cover for the years 2008, 2014, and 2017 from Historical Imagery in Google Earth Pro.
Vegetation Surveys allowed us to identify factors associated with native tree seedling density and richness. The seedling sampling design differed between the northern, protected portion of the site and the southern portion where land cover was shaped by individual farmers’ decisions. We placed a total of 401 circular plots of 1 m2 each: 111 in the northern, protected portion (total area = 87.5 Ha), and 290 in the southern, smallholder portion (total area = 157.8 Ha). In each circular plot, we recorded the GPS location, all tree seedlings of <1 m height, the average height of grass (Hyparrhenia rufa), and all large tree species (diameter at breast-height (DBH) > 20 cm) within 5 m of the plot.
In the northern, protected portion, we set vegetation transects ~150 m apart, oriented E–W, from one forest edge to another (n = 22 transects, x = 200 m, total length 4400 m). We located the 1 m2 circular plots every 50 m along transects. Here, we also conducted a targeted survey of the planted native tree seedlings. Aided by a local guide, we canvased about half the area where SHCP planted native tree seedlings, and identified planting sites based on distinct depressions of planting holes.
In the southern, smallholder portion, we sampled seedling distributions on farmers’ parcels (n = 60, average size: 0.6 Ha, range 0.1 to 2.4 Ha). We selected a random subset of parcels for vegetation surveys from a list of residents. Thirty-two of the fields had woodlots, 18 were in fallows, and 20 had annual crops, though half of the crop fields were recently planted with pine. We placed five of the 1 m2 circular plots along the middle of each field, with the inter-circle spacing ranging from 15 to 50 m depending on field size, and collected vegetation data in the same way as we did in the northern portion.
Farmer Interviews helped identify how smallholders locate woodlots. We generated a list of all land owners in the southern portion (~300 owners) with the help of village officials and local elders. Then, we stratified the names by land use (i.e., whether their parcel was a woodlot, a crop field, or fallowed) and drew randomly from each stratum, and conducted 92 interviews. We conducted interviews in Kiswahili at farmers’ homesteads, each lasting ~1.5 h, following the Living Standards Measurements Survey guidelines [44], and in accordance with human subjects protocol (IRB approval: #2015-0536). First, we asked about the farmer’s land parcel located within the study site, focusing on why the farmer established a woodlot, or planted crops, or left their land fallow. Then, we asked about the respondent’s land elsewhere and recorded the following attributes for each: Parcel location, area, crops planted, fallowing regime, and, if the parcel has a woodlot, the estimated number of trees. Last, we asked respondents to share their knowledge of land management in the northern portion, including questions about any recent fires and vegetation cover.
2.3. Data Analysis
To evaluate historical tree and land cover changes, we looked at historical aerial photographs and contemporary high-resolution imagery. We distinguished tree cover from non-tree cover by visual interpretation. We further distinguished native tree cover from planted smallholder woodlots using the woodlots’ textures that result from linear planting. From the digitized tree cover, we charted tree loss and tree gain for both the northern, protected portion of the site and the southern portion, for all the available years (1949, 1969, 1976, 1985, 2008, 2014, and 2017).
To evaluate regeneration patterns under different regeneration strategies, we looked at seedling density and richness. As noted previously, the three strategies were not uniformly implemented across the study area. Thus, for Native Tree Planting, we solely report the proportion of surveyed tree seedlings that survived. For the Protect and Wait and Woodlot strategies, we used the 1 m2 sampling circles as the unit of analysis, and tested seedling density and richness (dependent variables) versus proximity to a tree of DBH > 20 cm, distance from forest edge (in m, calculated as a perpendicular distance from the GPS point to the nearest forest edge; range: 0–405 m), and height of grass (in m). We fitted a zero-inflated General Linear Model (GLM) in R, using package pscl on the seedlings data [45]. The zero-inflated model fit a Poisson model with a log-link function on the count data, and a binomial model with a logit link on the zeroes. This approach was appropriate since the seedling data in the 1 m2 circles were count-based and contained a high proportion of true absences [46]. We selected the best model using Vuong model comparison criteria [45]. We present the proportion of planted native tree seedlings that survived under Native Tree Planting, and the odds-ratio predictors of native seedlings density and species richness for Protect and Wait and Woodlots.
To identify the land-use characteristics associated with woodlot-planting farmers, we categorized the interview responses in two ways. First, each enumerated parcel was labeled as either a forest edge parcel or a non-forest edge parcel. We classified all parcels in the gap or abutting forest edges as ‘edge parcels’ (n = 144) if they were located <400 m from forest edges in the gap or nearby area (Figure 2B), and the rest as ‘non-edge parcels’ (n = 370). Second, each respondent was labeled as either a Woodlot Planter (n = 59) or a Non-Woodlot Planter (n = 33). ‘Woodlot planters’ were those who had: (1) At least one parcel devoted entirely to a woodlot, (2) at least one woodlot parcel with ~1000 trees/Ha, and/or (3) an overall tree count exceeding 300. We used a paired t-test to check whether Woodlot Planters allocate their parcels differently compared to Non-Woodlot Planters. We made the same comparison for parcels located at forest edges versus those located elsewhere. We report differences between Woodlot Planters and Non-Woodlot Planters in terms of total land owned (in area and in number of parcels), and in terms of proportion of landholding devoted to a specific use at the forest edge versus non-forest edge.
3. Results
3.1. Historical Tree Cover Trajectories
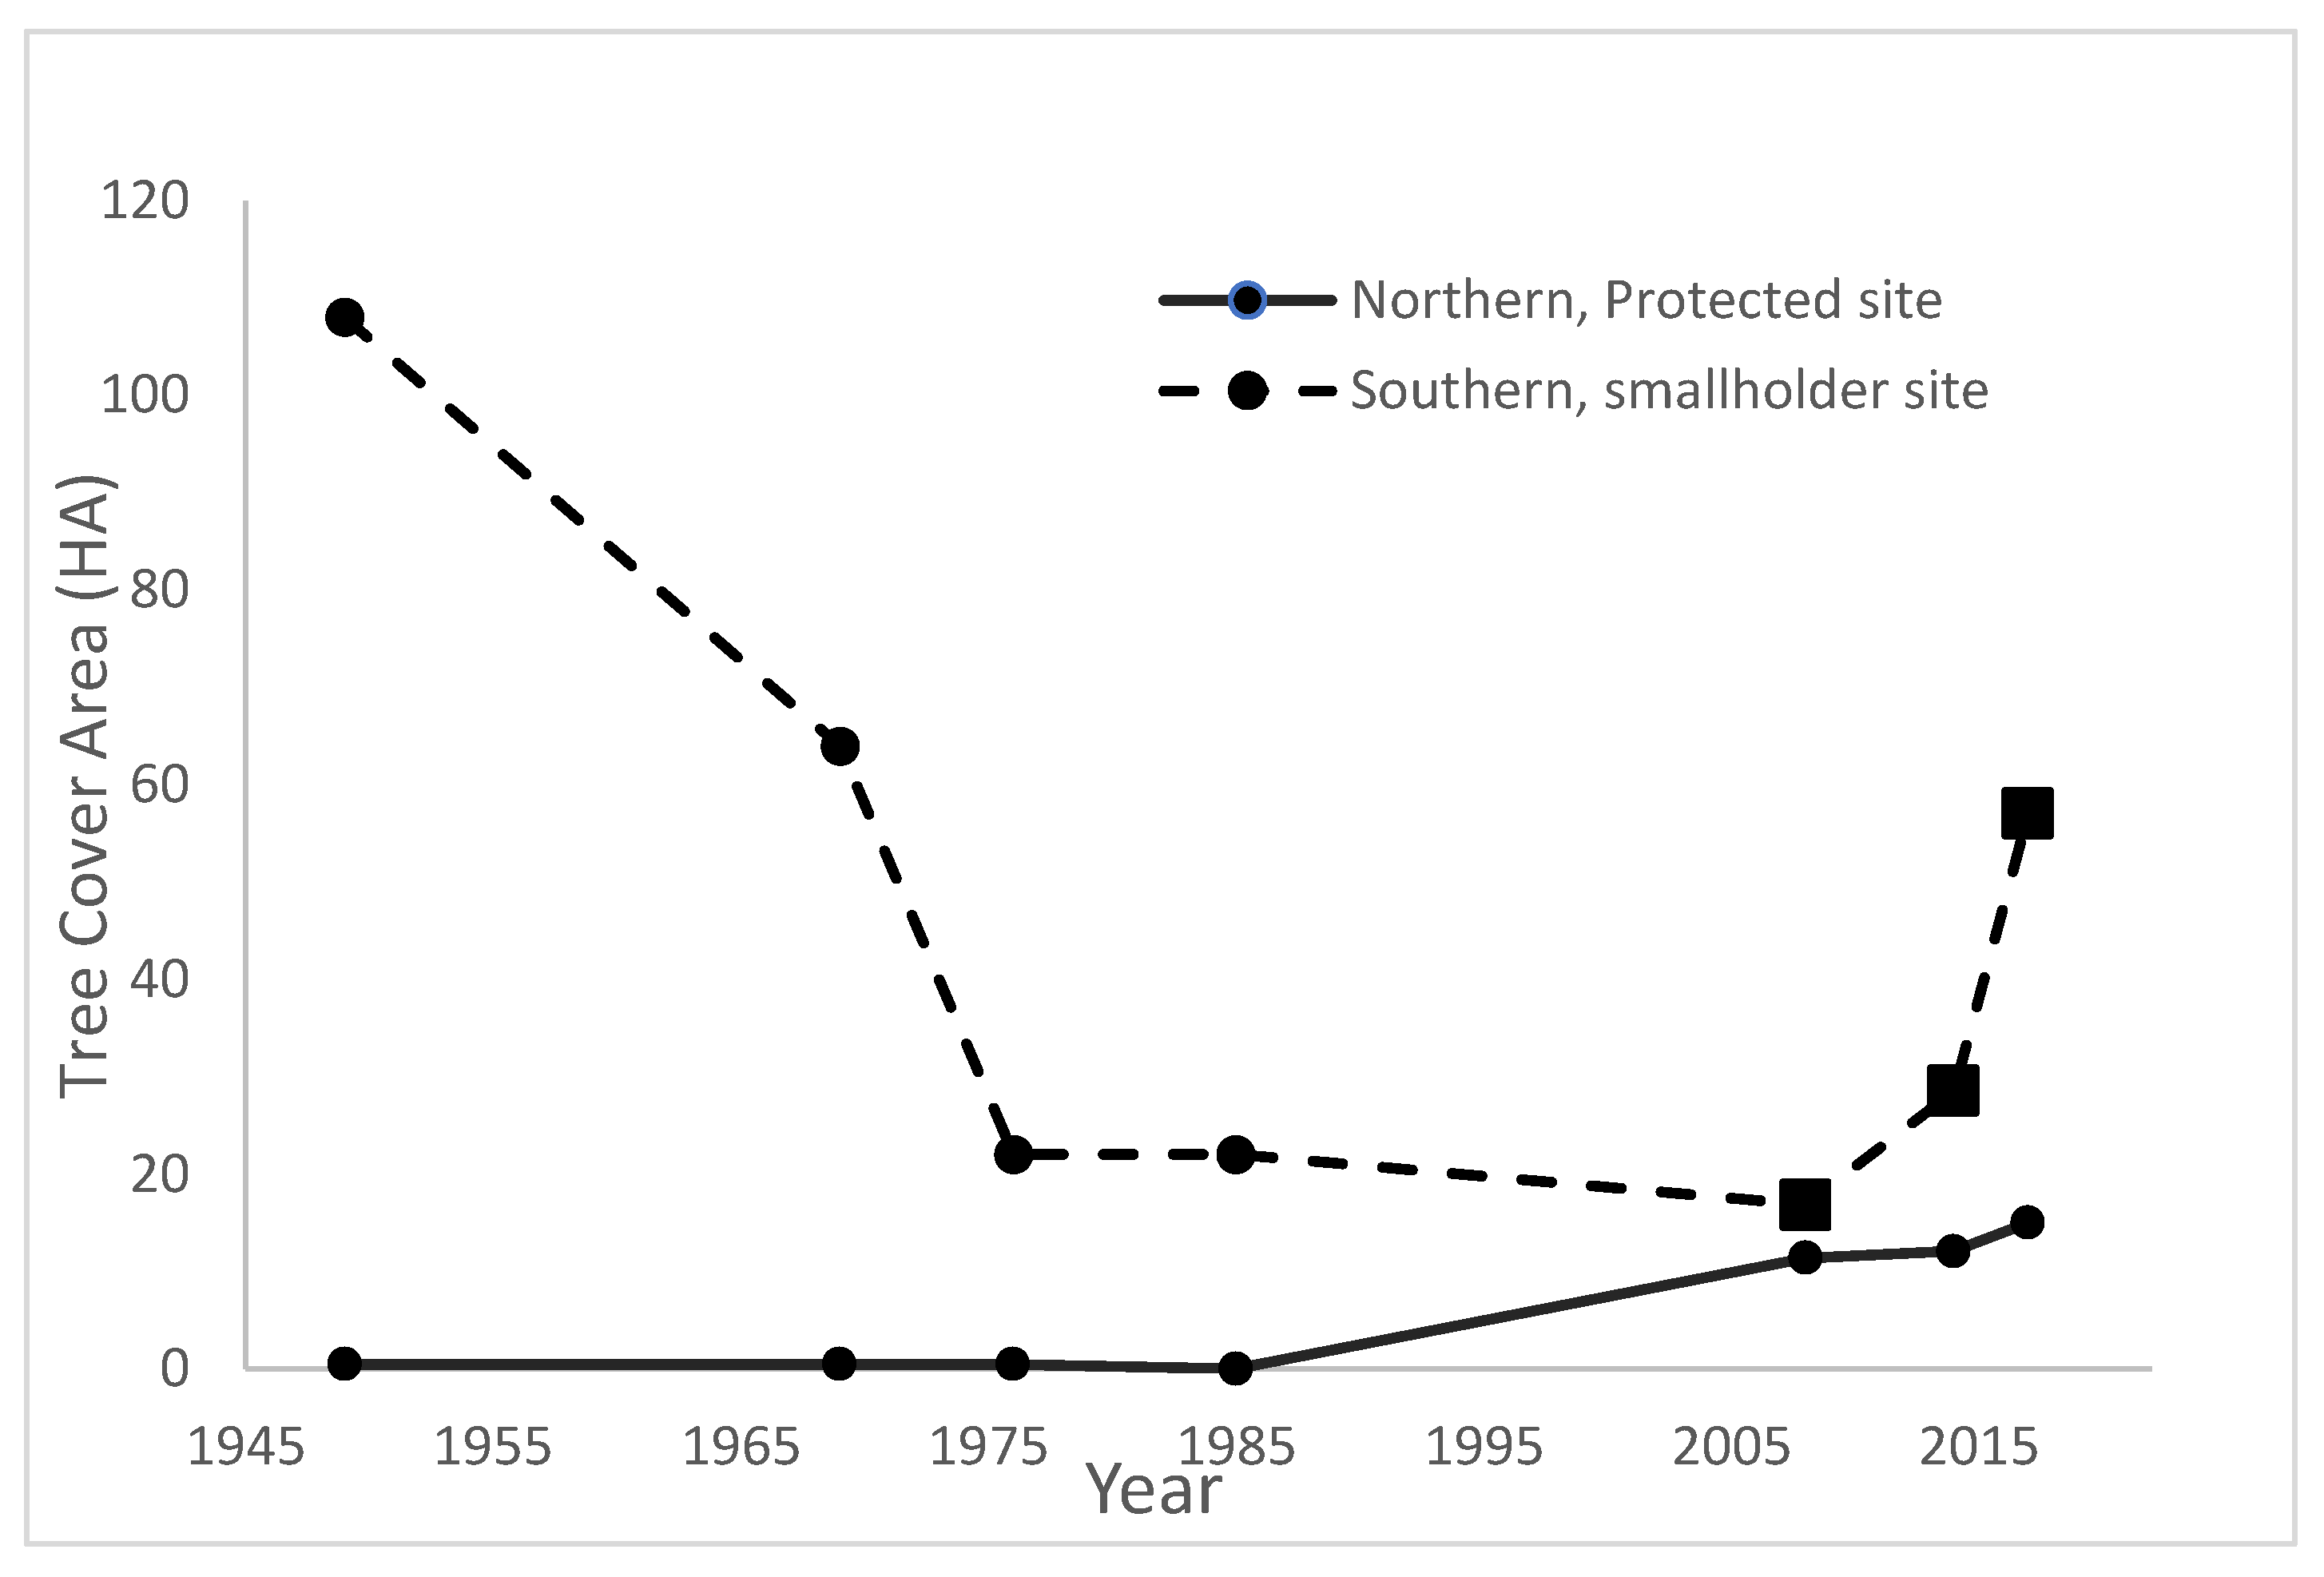
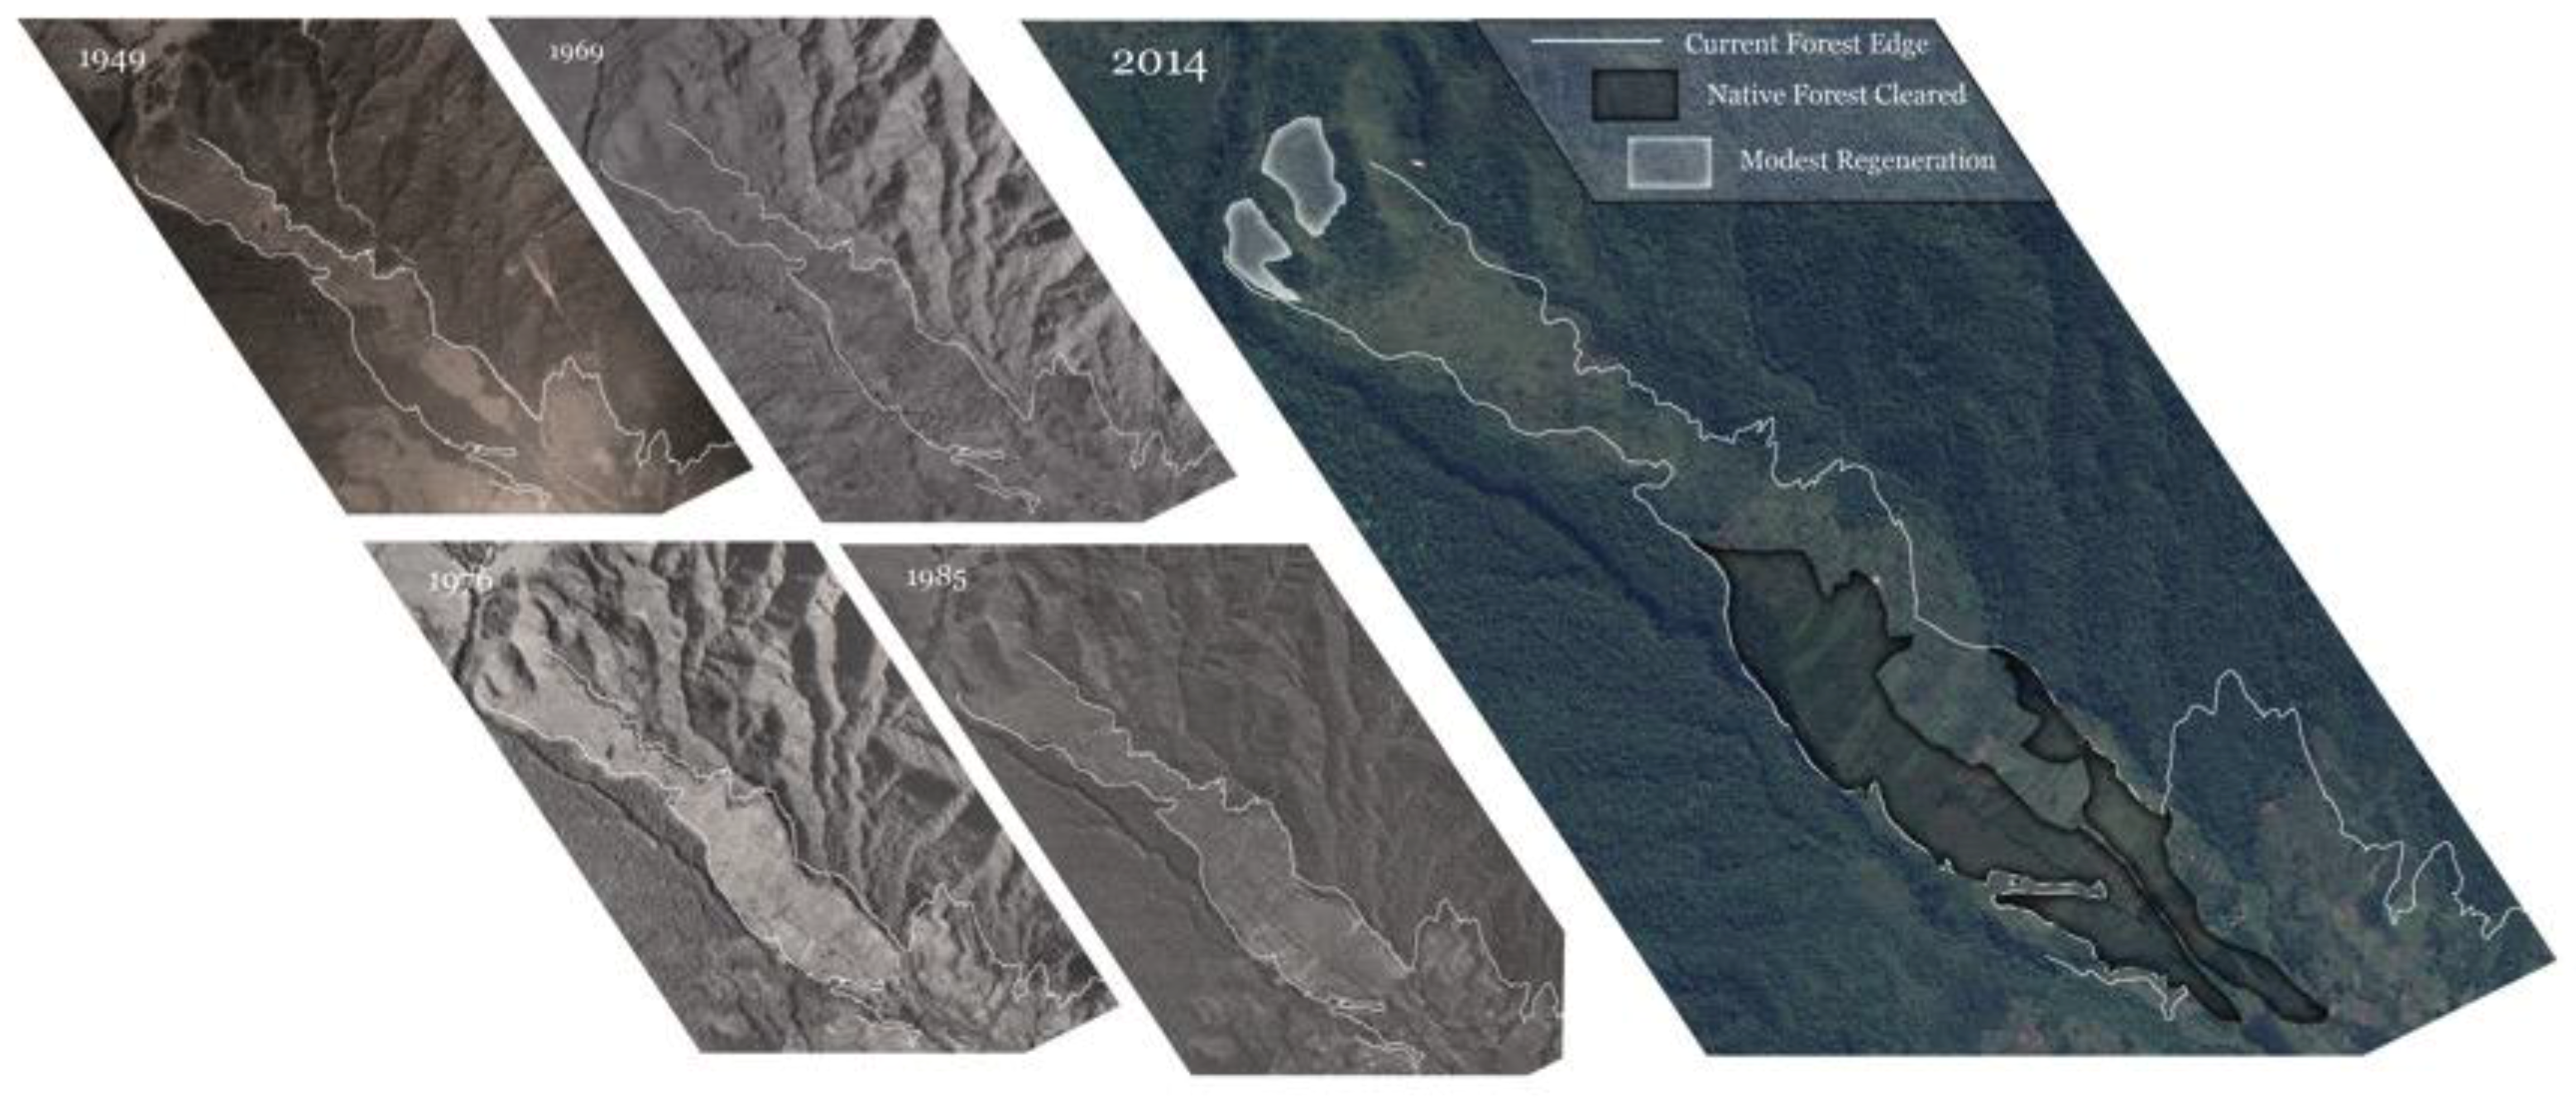
Imagery interpretation showed that tree cover increase has been low in the northern, protected portion of the site, while in the smallholder portion, tree cover initially decreased, and then started to increase (Figure 3). The northern portion has been free from any farming since at least 1949, according to aerial photography evidence and local respondents. However, a modest wooded area covering ~15 Ha (16%) has appeared in the intervening six decades (Figure 3). Meanwhile, in the southern portion, 108 Ha were converted from native tree cover to farmland between 1949 and 1975 (Figure A1). Since 1975, the native forest edges have remained steady in the southern portion, but woodlots have increased non-native tree cover since 2008 (Figure 3).
3.2. Patterns and Predictors of Native Tree Seedlings Abundance and Richness
Nearly half (190) of the 401 sampling circles had no tree seedlings (Table A3). The proportion of null observations was higher in the protected portion than in the smallholder portion (63% versus 41%, respectively, Z-score = 3.92, p-value < 0.0001), suggesting limited regeneration in the protected portion.
Tree seedlings of native species were more abundant within the southern, smallholder portion (0.07 seedlings/meter of survey effort versus 0.03 seedlings/meter in the protected portion) (Table A3). Overall, we encountered a total of 589 seedlings, representing 32 species: 28 native and four exotics. In the protected portion, we encountered 140 seedlings, representing 13 species, while in the smallholder portion the seedling count was 449, representing 28 species. Three native species dominated: Morella salicifolia subsp kilimandscharica, Maesa lanceolata, and Myrsine melanophloeos (together 52% of total seedlings, n = 489; see Table A5 for species list and Table A4 for a summary).
Under Native Tree Planting, we encountered 99 tree-planting holes, of which 19 had live seedlings. Given our low encounter rate and lack of prior information on the precise locations of tree-planting holes, we did not test predictors of planted seedlings distribution. Therefore, this treatment does not appear in Table 1 as a formal test, but rather we share data for Native Tree Planting as observations to strengthen the inferences in the Table.
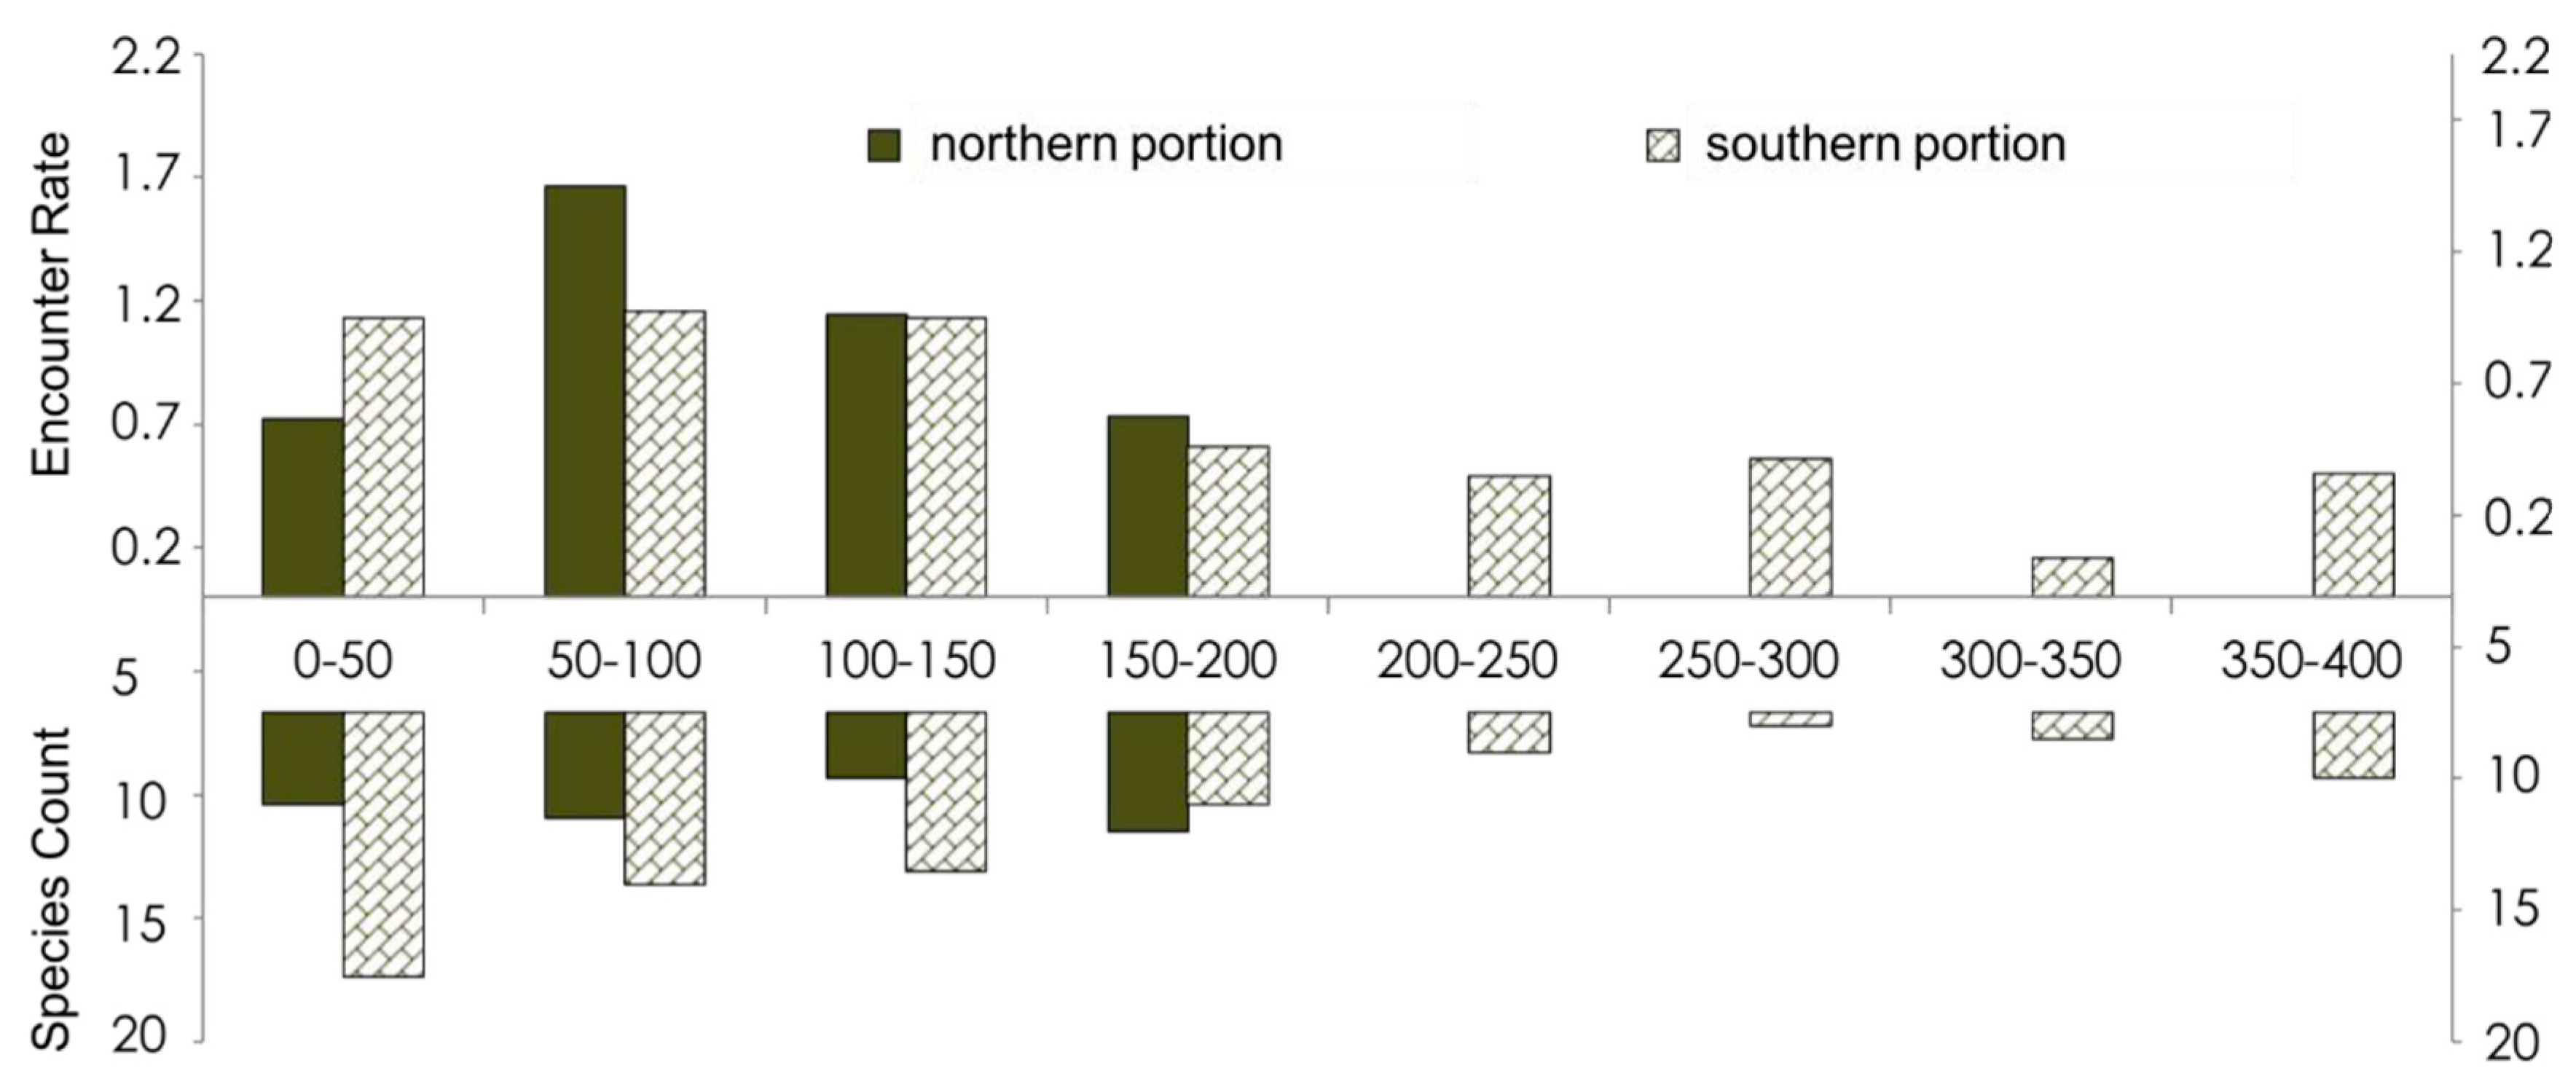
We observed two main distribution patterns in the vegetation data: Seedlings species richness varied by distance from the forest edge (Figure A2) while height of grass varied by the land-use category (Figure A3). Our GLM strongly predicted seedling distribution, with differing effects of proximity to a tree of DBH > 20 cm, distance from forest edge (in m), and height of grass (in m) based on whether the sampling location was under Protect and Wait or Woodlots (Table 1). For the entire site, proximity to forest edges increased the likelihood of encountering tree seedlings (odds ratio = 0.99), and this effect held between the Protect and Wait and Woodlots strategies. Proximity to large trees also increased the likelihood for encountering native tree seedlings, with a stronger effect under Protect and Wait (odds ratio = 2.01). Grass height increased the chances of null seedling observations over the whole site (odds ratio = 1.44).
3.3. Land-Use Factors Associated with Tree Planting among Smallholder Farmers
There were no homesteads in the study area, which means all the landowners we interviewed had at least one other land parcel elsewhere. On average, respondents owned a total of 4.7 parcels (range 2–11). Each parcel averaged 0.6 Ha and the total land area per respondent ranged from 0.4 Ha to 36 Ha (mean = 3.2 Ha, standard deviation (SDEV) = 4.0).
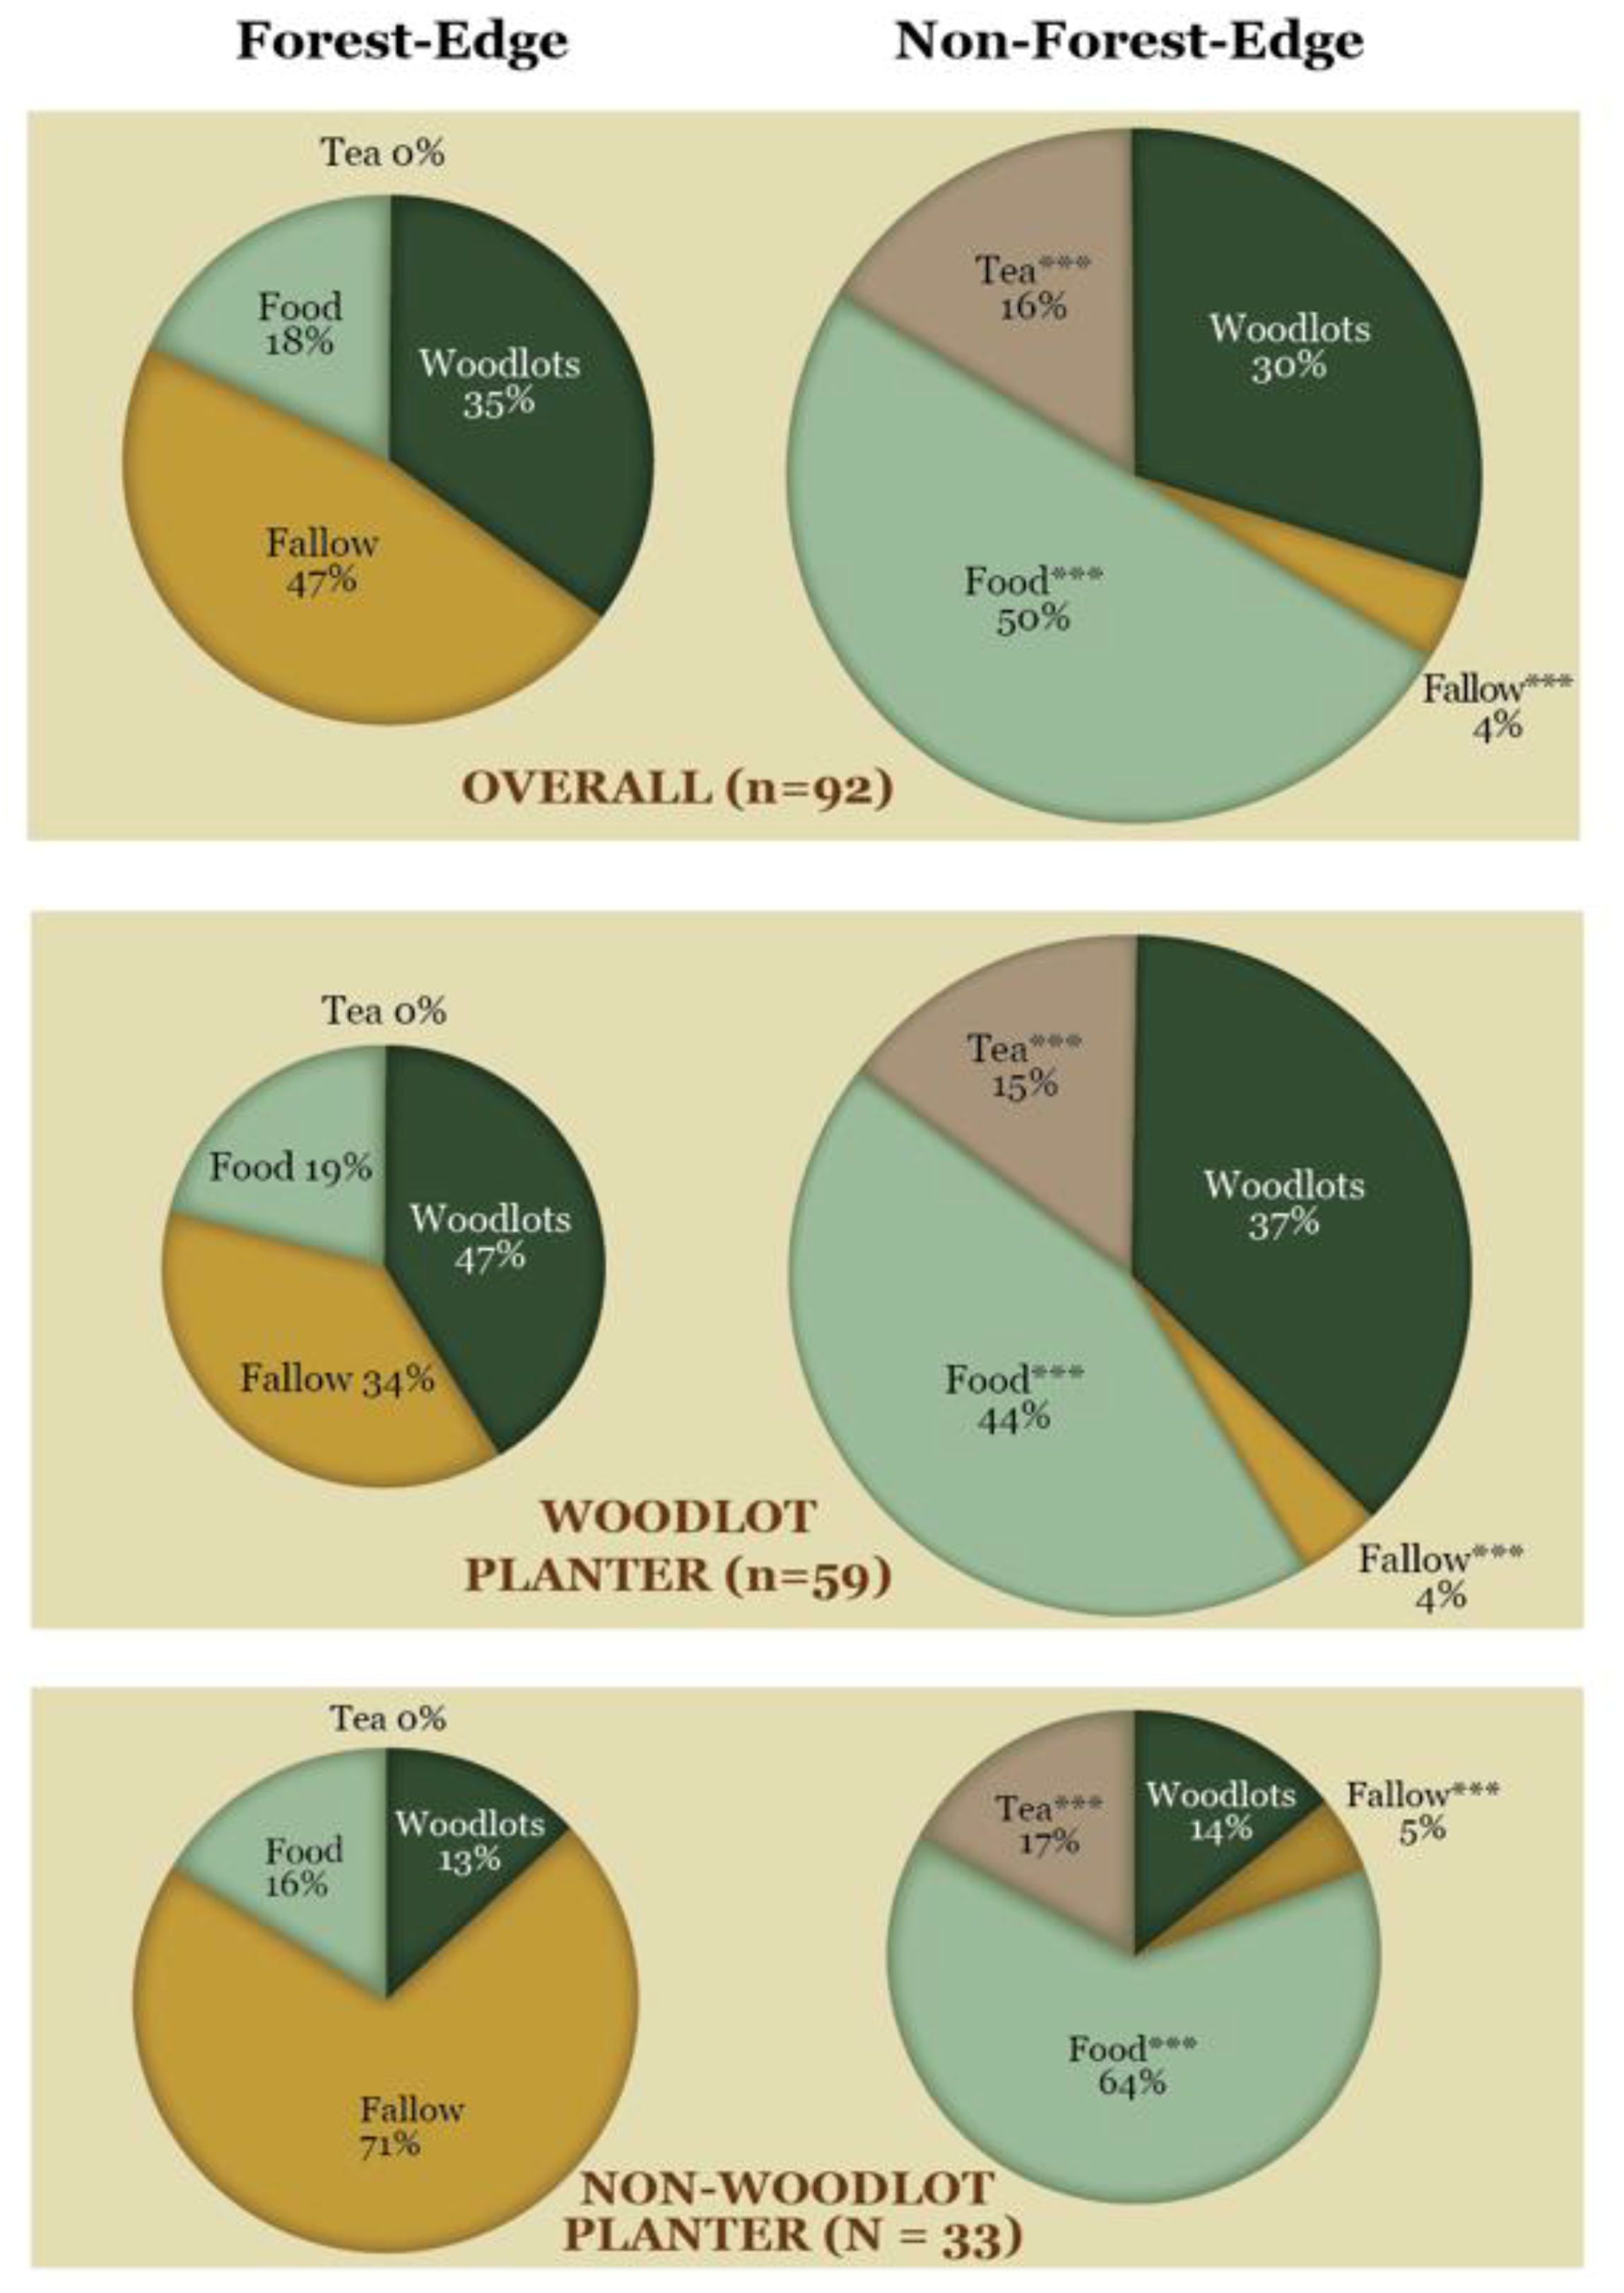
The main difference between people who planted woodlots (n = 59) and those who did not (n = 33) was that woodlot planters owned significantly more land away from the forest edge (Figure 4). All respondents (n = 92) favored growing food as far from the forest edge as possible. Paired comparison of land-use apportioning at the forest edge versus further from the forest edge showed that farmers prefer to plant food crops in parcels further from the forest edge (paired t-test difference = 32%, p-value ≤ 0.0001). Additionally, both groups devoted comparable amounts of land to food crops (woodlot planter = 1.00 Ha, non-woodlot planter = 1.18 Ha, difference = 0.18 Ha, paired t-test p-value = 0.15). However, the rest of the land woodlot planters own is devoted to tea and trees, while for non-woodlot planters, it is left fallow (Figure 4).
4. Discussion
Our study yielded three main findings: (1) Forest regeneration has been arrested for decades on land under Protect and Wait, and Native Tree Planting appears to have limited success; (2) forest-adjacent Woodlots had the highest abundance and richness of native tree seedlings; and (3) smallholder farmers were likely to plant woodlots at the forest edge if they could grow food elsewhere. Although caution is warranted in extrapolating these results, our study site is broadly representative of conditions elsewhere in the East African Rift (i.e., isolated forests surrounded by agriculture, a propensity for arrested forest succession, and a surge in woodlot planting). Thus, we offer the following insights regarding forest regeneration pathways:
4.1. Use of Historical Land Cover to Establish Regeneration Baselines
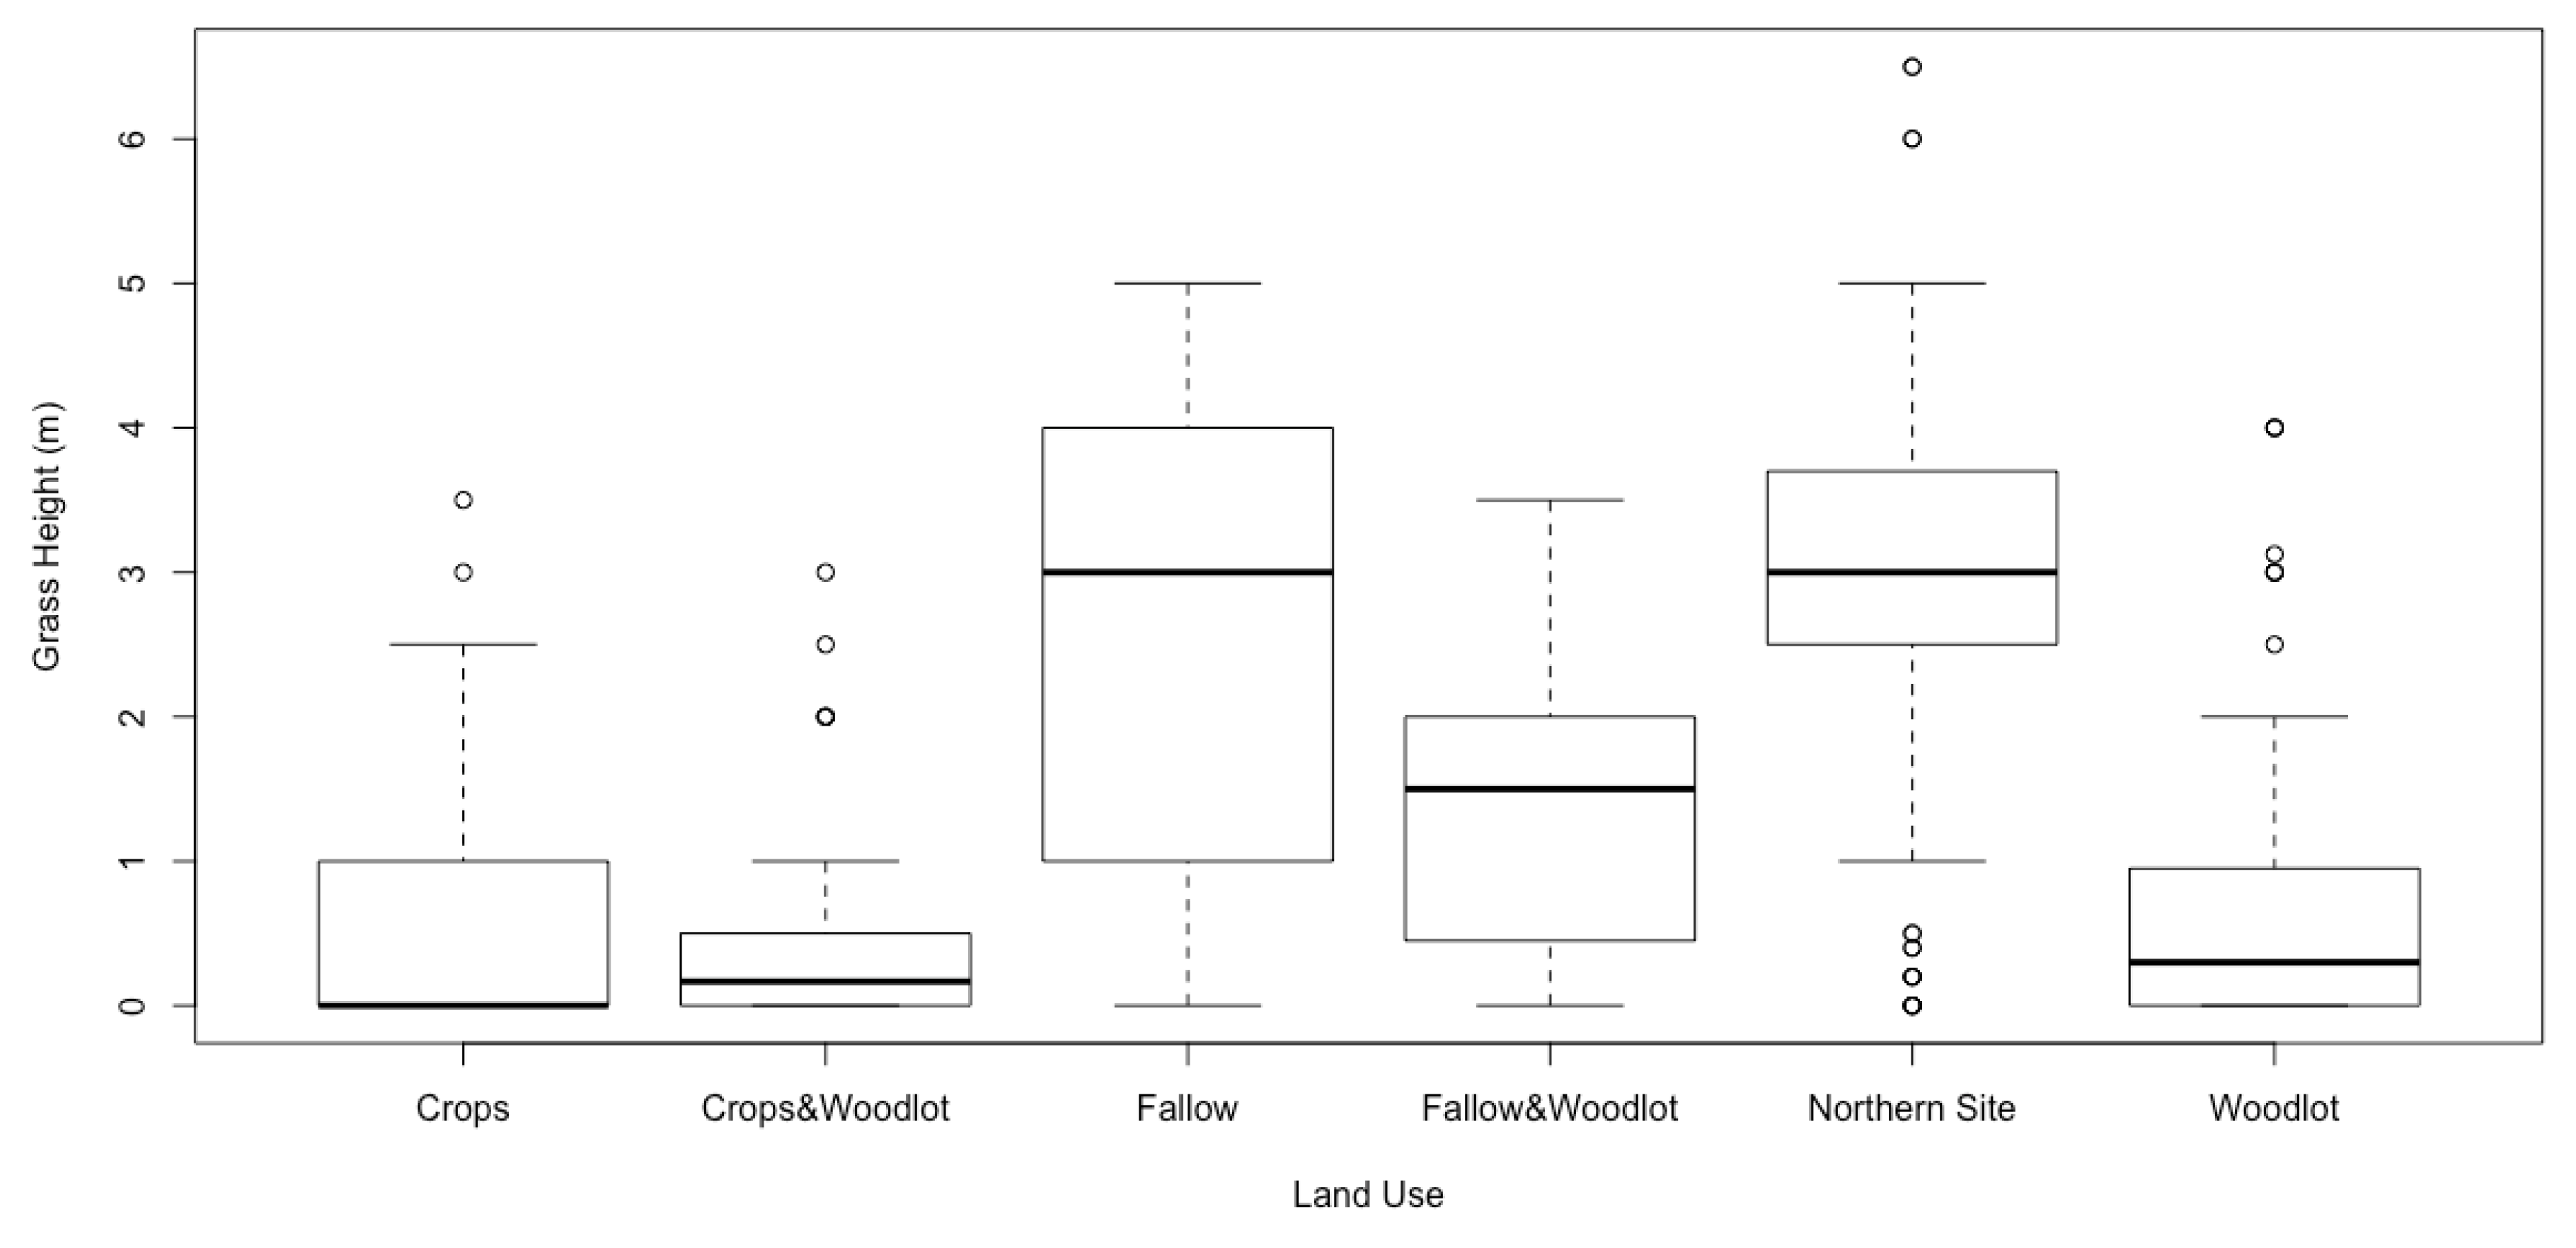
Determining vegetation and land cover baselines is challenging for East African Rift sites due to the limited availability of historical vegetation data [14], but it is a key step before embarking on any regeneration effort. Historical aerial photographs demonstrated that our site had areas that were forested in the recent past, and areas that were not. Determining such vegetation baselines is particularly important for regions that have complex vegetation mosaics, e.g., transition zones from tropical forests to savanna grasslands [13]. Our small study site is entirely bordered with montane forests. Biodiverse native grasslands are also present in the surrounding area, but these are found at 2800 m elevation, ~1000 m higher than our study site. [41]. These high-altitude grasslands hold many unique plant species. By contrast, at our study site, a disturbance-favored single grass species predominated—Hyparrhenia rufa, (locally called ‘lusanje’), which can grow to 3 m height and is known to suppress forest recovery [19]. In short, the long-term abundance of H. rufa could explain the suppressed forest growth in the northern portion.
4.2. Understanding Distribution Patterns of Native Seedlings
Three ecological conditions were significantly associated with native seedling abundance in sites under Woodlot and Protect and Wait: Distance from forest edge, grass height, and proximity to large, isolated native trees. As expected, proximity to forest edges increased native seedlings abundance and richness, as the forest provides a ready source of seeds [17]. Meanwhile, tall grass was associated with fewer native seedlings [19]. The fact that isolated large trees were positively associated with native tree seedlings of various species suggests that they are shading out surrounding tall grass, and/or providing roosting spots for seed dispersers [21]. These ecological conditions for native seedlings distribution were similarly predictive across management conditions. The findings reiterate the importance of understanding the site’s ecological and management conditions before implementing any regeneration strategy.
4.3. Strategic Application of Regeneration Strategies
Given the contingencies of management at our site, it was not possible to gather comparable data for all three regeneration strategies. Data for Native Tree Planting strategy were particularly limited. The tree planting efforts at our site were concentrated in only 8 Ha, all > 50 m from the forest edge. Due to this replicability problem, caution is warranted in drawing conclusions about the comparative advantages of different regeneration strategies. More research is needed, including studies attendant to smallholders’ possible roles in ‘igniting’ forest regeneration [23,47]. Despite this limit, our study offers the following insights for each regeneration strategy:
Protect and Wait: We found that even if land is left uncultivated for decades, forest regeneration is not guaranteed. This is a cautionary finding for some projects, especially those removing smallholders to allow forest regrowth (e.g., Table A1). Local ecological conditions, such as the presence of tall grass [19], may prevent regeneration in set-aside areas. Protect and Wait is only effective under conditions favorable to forest regeneration, namely, the presence of nearby seed stocks, roosts for seed dispersers, and the suppression of fire and competing grasses [27]. When reconnecting forests is urgent, such as at our site where the gap separates two patches of montane forest holding populations of an endangered arboreal primate [43], Protect and Wait might be too slow.
Native Tree Planting: Native tree planting projects often prove more costly and less effective than predicted [48,49], so they should be undertaken only after an assessment of the tree cover history and careful consideration of the financial and management capacity for protecting planted trees. Given that the local conservation organization planted 17,500 native trees [41], the low encounter rate is discouraging. Our low encounter rate was partly due to methodological problems (it was difficult to find seedlings in tall grass one-to-four years after they were planted), as well as the underlying low survival rate of the planted seedlings. In any case, due to sparse data, we were unable to model the predictors of seedlings success under this strategy. Native Tree Planting may still be a useful strategy for the northern site (and similar areas in the Rift) with key adaptations. Planting tree seedlings close to shade areas (e.g., under isolated remnant trees) and suppressing H. rufa may improve their survival. Additional considerations, such as fire frequency, should also be assessed. Though there are no systematic fire records for our site, respondents mentioned that ‘every few years’ fires set by some individuals in their own parcels spread northward into the protected portion. They recalled that the last notable fire burned in 2012, destroying many of the first set of planted trees [42]. Fire has limited native tree seedlings growth at analogous sites, both when seedlings grew spontaneously [22,28,50] and when they were planted [51]. A dual approach of planting seedlings near shade trees and suppressing H. rufa to reduce the risk of fires would favor seedling survival.
Woodlots: Even though pine, eucalyptus, and cypress woodlots are no substitute for native biodiverse forests, under some conditions they may contribute to forest regeneration in densely settled landscapes. In appraising this potential, it is vital to consider the size and location of exotic tree planting initiatives. For example, large exotic tree plantations may take pressure off of native forests for timber and bioenergy [52,53] but do not enhance native tree regeneration without purposeful interventions [54]. By contrast, our research focuses on regeneration opportunities in small woodlots planted along protected forest edges, a common scenario in the Rift [35,47,55]. We determined that smallholders are eager to plant and care for woodlots at the forest edge, provided they have enough land elsewhere to meet their food needs or they pursue other wage-based livelihoods. This accords with other studies showing better-off smallholders are more likely to plant trees [38], especially near protected areas where wildlife damage crops [35].
We found that woodlots planted adjacent to native forest support numerous native seedlings [40]. Such woodlots can provide important income for rural smallholders [35,56]. However, these native seedlings may suffer damage when the woodlot stands are harvested [23,36]. Incentives will likely be necessary to encourage smallholders to minimize impacts on native seedlings during woodlot harvesting [19]. Moreover, landowners might be reluctant to shift eventually from managing exotic woodlots to protecting native forests. In the long run, additional, more substantial interventions would likely be necessary to persuade farmers to shift from planting woodlots to managing forests.
5. Conclusions
The East African Rift landscape is changing rapidly, presenting new challenges and opportunities for native forest regeneration outside isolated protected forests. Smallholders and other land managers are planting fast-growing, non-native species to replace the dwindling supply of natural forest outside protected areas. Those promoting forest regeneration and connectivity in the Rift need to be aware of this surge in woodlots and plan accordingly. Along with evaluating vegetation baselines and current regeneration patterns, we also urge forest regeneration advocates to investigate and consider opportunities for aiding native forest recovery by working with smallholders. Ultimately, practitioners will likely have to try different combinations of Protect and Wait, Native Tree Planting, or Woodlots depending on the social-ecological context of the targeted regeneration site.
Author Contributions
Conceptualization, N.E.K. and L.N.-T.; methodology, N.E.K. and L.N.-T.; investigation, N.E.K.; data curation, N.E.K.; writing—original draft preparation, N.E.K.; writing—review and editing, L.N.-T. and N.E.K.; funding acquisition, L.N.-T. and N.E.K.
Funding
This research was funded by the Chicago Zoological Society Endangered Species Fund (2015).
Acknowledgments
We acknowledge WCS-Southern Highlands Conservation Program (WCS-SHCP): N. Mpunga, S. Machaga, S. Kimiti, H. Mbugi, and C. Bracebridge for insights, logistics, and financial assistance during fieldwork. S. Walljasper and T. Buckingham created the figures. We thank A. Treves and four anonymous reviewers for their constructive feedback.
Conflicts of Interest
The funders had no role in the design of the study; in the collection, analyses, or interpretation of data; in the writing of the manuscript; or in the decision to publish the results.
Appendix A

Table A1.
Detailed examples on strategies to regenerate East African Rift forests. § indicates proposed project, but not yet implemented. Some Tanzanian sites were summarized in [57].
Table A1.
Detailed examples on strategies to regenerate East African Rift forests. § indicates proposed project, but not yet implemented. Some Tanzanian sites were summarized in [57].
| Regeneration Stratergy | Location | Corridor Area (Length) | Actions | Land Use | Cost Financial; Social | Reported Success | Reported Challenges | Citations |
|---|---|---|---|---|---|---|---|---|
| Protect and Wait | § Mwanihana Corridor: Udzungwa Mountains-Magombera Forest, Tanzania | 600 Ha | Fenced corridor | sugarcane cultivation (Ilovo plantation + out-grower); smallholder farms | [58] | |||
| Gombe-Masito-Ugalla, Tanzania | 13,000 Ha | land use planning, seedling development, tree planting | Village land to protected | USAID 1-funded | Coordinated land use planning across 49 villages | [29] | ||
| § Mngeta Corridor: (Udzungwa Scarp – Northern Udzungwa forests), Tanzania | 6300 Ha | Improve protection; prevent future settlement | Smallholder land + Public Land | ~90 households | [59] | |||
| Usambara East (Derema), Tanzania | 790 Ha | Land use assessment; Resettlement of farms, prevent future cultivation | Smallholder land to protected | $2.5 million; 1128 farmers affected; relocated 1547 farm parcels (not homes) | [57,60] | |||
| Mount Kenya-Laikipia, Kenya | (14 km) | Fenced underpass from highland to lowland | ~ $1 million (without annual maintenance); | [61] | ||||
| Protect and Wait + Native Tree Planting | Gishwati-Nyungwe, Rwanda | 262 Ha | Resettlement, protection, restoration (with native + non-native species) | Smallholder land to protected | 150 households resettled | [26,62] | ||
| Kibale Forest, Uganda | 10,000 Ha (16 km) | Large-scale restoration of high-canopy forest in grassland. Tree planting and fire suppression. | Smallholder and to protected | 30,000 smallholders evicted 17 years prior | 3600 trees planted, 5000 saplings regenerated | Fire problems. Security issues. Crop loss complaints from local communities. | [24,28] | |
| Gishwati-Nyungwe, Rwanda | 262 Ha | Resettlement, Protection, Restoration (with native + non-native species) | Smallholder land to protected | 150 households resettled | [26,62] | |||
| Native Tree Planting | Nyungwe National Park, Rwanda | 9 Ha | Manual clearing of fern; fire suppression | Inside protected area | USAID-funded; | repeated fern removal for 3 years; regeneration | [50] | |
| § West Mau Forest Reserve Conservation Corridor, Kenya | (1.8 km) | Exotic tree plantations removal | smallholder farms + exotic tree plantations | NA | [63] | |||
| Wambabya and Bugoma Central Forest Reserves, Uganda | 96,732 Ha | Eucalyptus for fuelwood & timber. Native species planting in degraded forest. | Village land | NA | [64] |
1 USAID is the United States Agency for International Development.
Table A2.
List of aerial photos, the scale, and the geo-referencing root mean square error (RMSE) of the images (source: Mapping and Surveying unit of the Ministry of Lands and Planning of Tanzania).
Table A2.
List of aerial photos, the scale, and the geo-referencing root mean square error (RMSE) of the images (source: Mapping and Surveying unit of the Ministry of Lands and Planning of Tanzania).
| Aerial Photo | Scale | Ground Control Points | Transformation | Mean RMSE 1 |
|---|---|---|---|---|
| SHEET 259 YR.1949 FILM 82A-294 EXP.5017 | 1:44,000 | 10 | Thin Plate Spline | 3.139 × 10⁸ |
| SHEET 259 YR.1949 FILM 82A-294 EXP.5018 | 1:44,000 | 11 | Thin Plate Spline | 1.284 × 10⁷ |
| SHEET 259 YR.1949 FILM 82A-294 EXP.5019 | 1:44,000 | 10 | Thin Plate Spline | 3.216 × 10⁸ |
| SHEET 259 YR.1949 FILM 82D-612 EXP.5004 | 1:22,000 | 10 | Thin Plate Spline | 1.102 × 10⁷ |
| SHEET 259 YR.1949 FILM 82D-612 EXP.5005 | 1:22,000 | 10 | Thin Plate Spline | 1.130 × 10⁴ |
| SHEET 259 YR.1949 FILM 82D-612 EXP.5006 | 1:22,000 | 7 | Thin Plate Spline | 2.066 × 10⁷ |
| SHEET 259 YR.1969 ROLL 13 LINE 2 EXP. 48 | 1:68,000 | 10 | Thin Plate Spline | 4.431 × 10⁸ |
| SHEET 259 YR.1969 ROLL 13 LINE 2 EXP. 49 | 1:68,000 | 10 | Thin Plate Spline | 2.588 × 10⁹ |
| SHEET 259 YR.1969 ROLL 13 LINE 3 EXP. 84 | 1:68,000 | 10 | Thin Plate Spline | 1.311 × 10⁷ |
| SHEET 259 YR.1976 FILM 1829 LINE 73 EXP.24 | 1:50,000 | 12 | Thin Plate Spline | 4.242 × 10⁸ |
| SHEET 259 YR.1976 FILM 1829 LINE 73 EXP.25 | 1:50,000 | 11 | Thin Plate Spline | 1.819 × 10⁶ |
| SHEET 259 YR.1976 FILM 1829 LINE 73 EXP.35 | 1:50,000 | 15 | Thin Plate Spline | 1.660 × 10⁷ |
| SHEET 259 YR.1976 FILM 1829 LINE 73 EXP.36 | 1:50,000 | 11 | Thin Plate Spline | 7.282 × 10⁸ |
| SHEET 259 YR.1985 FILM 3 LINE 4 EXP.6631 | 1:25,000 | 10 | Thin Plate Spline | 1.840 × 10⁷ |
| SHEET 259 YR.1985 FILM 3 LINE 4 EXP.6632 | 1:25,000 | 11 | Thin Plate Spline | 9.097 × 10⁸ |
| SHEET 259 YR.1985 FILM 3 LINE 4 EXP.6633 | 1:25,000 | 11 | Thin Plate Spline | 1.377 × 10⁷ |
| SHEET 259 YR.1985 FILM 3 LINE 5 EXP.6628 | 1:25,000 | 11 | Thin Plate Spline | 3.115 × 10⁷ |
| SHEET 259 YR.1985 FILM 3 LINE 5 EXP.6629 | 1:25,000 | 20 | Thin Plate Spline | 2.688 × 10⁸ |
1 RMSE: Root Mean Squared Error.
Table A3.
Distance-based seedlings abundance and species counts in the southern portion of the study site under smallholder management, and in the northern portion of the study site that is inside a protected area.
Table A3.
Distance-based seedlings abundance and species counts in the southern portion of the study site under smallholder management, and in the northern portion of the study site that is inside a protected area.
| Distance from Forest Edge | Southern: Smallholder | Northern: Protected | ||||||||
|---|---|---|---|---|---|---|---|---|---|---|
| Number of Observations | NULL Count | Total No Seedlings | Species Count | Avg Sdln/Obs | Number of Observations | NULL Count | Total No Seedlings | Species Count | Avg Sdln/Obs | |
| 0–50 | 56 | 12 | 133 | 23 | 2.4 | 28 | 19 | 26 | 7 | 0.9 |
| 50–100 | 53 | 20 | 109 | 15 | 2.1 | 27 | 17 | 63 | 8 | 2.3 |
| 100–150 | 46 | 12 | 86 | 15 | 1.9 | 25 | 13 | 32 | 5 | 1.3 |
| 150–200 | 40 | 23 | 39 | 9 | 1.0 | 21 | 11 | 19 | 9 | 0.9 |
| 200–250 | 28 | 13 | 35 | 5 | 1.3 | 7 | 7 | 0 | 0 | 0.0 |
| 250–300 | 22 | 11 | 20 | 2 | 0.9 | 3 | 3 | 0 | 0 | 0.0 |
| 300–350 | 31 | 19 | 17 | 4 | 0.5 | NA | 0 | NA | 0 | NA |
| 350–400 | 15 | 10 | 10 | 7 | 0.7 | NA | 0 | NA | 0 | NA |
| Sum | 290 | 120 | 111 | 70 | ||||||
| Proportion | 0.41 | 0.63 | ||||||||
Table A4.
Sampling effort in the northern and in the southern portions of the study site, and the top three species encountered in each.
Table A4.
Sampling effort in the northern and in the southern portions of the study site, and the top three species encountered in each.
| Study Site Portion | No. Plots | Plots with NULL obs. | Seedlings Total | Species Count | No. Native Seedlings | Top Three Seedling Species |
|---|---|---|---|---|---|---|
| Overall | 401 | 190 | 589 | 32 | 484 | 1. Morella salicifolia subsp kilimandscharica; 2. Maesa lanceolata; 3. Pinus patula |
| Northern portion | 111 | 70 | 140 | 13 | 140 | 1. Maesa lanceolata; 2. Myrsine melanophloeos; 3. Morella salicifolia subsp kilimandscharica; |
| Southern portion | 290 | 120 | 449 | 28 | 344 | 1. Morella salicifolia subsp kilimandscharica; 2. Pinus patula; 3. Maesa lanceolata |
Table A5.
List of seedlings species encountered and their ecological significance [65].
Table A5.
List of seedlings species encountered and their ecological significance [65].
| Local Name | Scientific Name | # Circles | Seedling Tally | % Total Tally | Early Colonizer | Woodland Species | Slow-Growing Native | Fast-Growing Native | Planted/Exotic |
|---|---|---|---|---|---|---|---|---|---|
| msibisibi | Morella salicifolia subsp kilimandscharica | 103 | 169 | 28.7 | no | yes | yes | no | no |
| mkuti | Maesa lanceolata | 51 | 120 | 20.4 | yes | yes | yes | no | no |
| paina | Pinus patula | 67 | 93 | 15.8 | NA | NA | NA | NA | yes |
| msese | Myrsine melanophloeos | 8 | 32 | 5.4 | no | no | yes | no | no |
| msenye | Agarista salicifolia | 21 | 28 | 4.8 | yes | yes | yes | no | no |
| msya | Bridelia micrantha | 12 | 20 | 3.4 | no | no | yes | no | no |
| mporopotwa | Vernonia myriantha | 6 | 17 | 2.9 | yes | yes | no | yes | no |
| msangabale | Aphloia theiformis | 9 | 13 | 2.2 | no | no | yes | no | no |
| mkolya | Dodonaea viscosa var angustofolia | 6 | 10 | 1.7 | yes | yes | no | yes | no |
| msyunguti | Bersama abyssinica | 7 | 9 | 1.5 | no | no | yes | no | no |
| mtangasale | Albizia gummifera | 4 | 7 | 1.2 | no | yes | yes | no | no |
| mkandana | Parinari excelsa | 1 | 7 | 1.2 | no | no | yes | no | no |
| mpodo | Podocarpus latifolius | 4 | 6 | 1 | no | no | yes | no | no |
| mfwandilo | Ilex mitis | 6 | 6 | 1 | no | no | yes | no | no |
| msongwa dume | Garcinia kingaensis | 5 | 5 | 0.8 | no | no | yes | no | no |
| mkambokambo | Cupressus lusitanica | 4 | 5 | 0.8 | NA | NA | NA | no | yes |
| kipwa | Galiniera saxifraga | 2 | 5 | 0.8 | no | no | yes | no | no |
| mlimbo | Maytenus acuminata | 3 | 4 | 0.7 | no | no | yes | no | no |
| msiiti | Ficalhoa laurifolia | 2 | 3 | 0.5 | no | no | yes | no | no |
| mparachichi | Persea americana | 2 | 4 | 0.7 | NA | NA | NA | NA | yes |
| mlingoti | Eucalyptus maidenii | 3 | 3 | 0.5 | NA | NA | NA | NA | yes |
| Mturuhunga | Hagenia abyssinica | 1 | 2 | 0.3 | no | yes | yes | no | no |
| mswisa | Myrianthus holstii | 2 | 2 | 0.3 | no | no | yes | no | no |
| msuluti | Catha edulis | 2 | 2 | 0.3 | no | no | yes | no | no |
| msengela | Macaranga capensis var kilimandscharica | 2 | 2 | 0.3 | no | no | yes | no | no |
| mpembati | Polyscias fulva | 2 | 2 | 0.3 | no | no | yes | no | no |
| mkuyu | Ficus sur | 2 | 2 | 0.3 | no | no | yes | no | no |
| mtitisieli | Peperomia tetraphylla | 1 | 1 | 0.2 | yes | yes | no | yes | no |
| mbojo | Tecomaria capensis | 1 | 1 | 0.2 | yes | yes | no | yes | no |
| mberigati | Cornus volkensii | 1 | 1 | 0.2 | no | no | yes | no | no |
Figure A1.
Aerial photographs of Bujingijila Gap, from 1949, 1969, 1976, and 1985, overlaid with contemporary forest edges. Google Earth image (2014) indicates where modest forest regeneration has occurred in the northern, protected Gap between 1949 and 2014, and where forest was lost in the southern, peopled Gap between 1949 and 1969.

Figure A2.
Encounter rate (number of seedlings per sampling circle) encountered in the northern and the southern portions, and the species count in a given distance from the forest edge.
Figure A2.
Encounter rate (number of seedlings per sampling circle) encountered in the northern and the southern portions, and the species count in a given distance from the forest edge.

Figure A3.
Variation in grass height by land use.

References
- Margules, C.R.; Pressey, R.L. Systematic conservation planning. Nature 2000, 405, 243–253. [Google Scholar] [CrossRef] [PubMed]
- Fischer, J.; Lindenmayer, D.B. Landscape modification and habitat fragmentation: A synthesis. Glob. Ecol. Biogeogr. 2007, 16, 265–280. [Google Scholar] [CrossRef]
- Hilty, J.A.; Lidicker, W.Z., Jr.; Merenlender, A.M. Corridor Ecology: The Science and Practice of Linking Landscapes for Biodiversity Conservation; Island Press: Washington, DC, USA, 2006. [Google Scholar]
- Cincotta, R.P.; Wisnewski, J.; Engelman, R. Human population in the biodiversity hotspots. Nature 2000, 404, 990–992. [Google Scholar] [CrossRef] [PubMed]
- IUCN. UNEP-WCMC The World Database on Protected Areas (WDPA). Available online: www.protectedplanet.net (accessed on 1 November 2016).
- Newmark, W.D.; Mcneally, P.B. Impact of habitat fragmentation on the spatial structure of the Eastern Arc forests in East Africa: Implications for biodiversity conservation. Biodivers. Conserv. 2018, 27, 1387–1402. [Google Scholar] [CrossRef]
- Cordeiro, N.J.; Burgess, N.D.; Dovie, D.B.K.; Kaplin, B.A.; Plumptre, A.J.; Marrs, R. Conservation in areas of high population density in sub-Saharan Africa. Biol. Conserv. 2007, 134, 155–163. [Google Scholar] [CrossRef]
- Burgess, N.; Butynski, T.; Cordeiro, N.; Doggart, N.; Fjeldsa, J.; Howell, K.; Kilahama, F.; Loader, S.; Lovett, J.; Mbilinyi, B. The biological importance of the Eastern Arc Mountains of Tanzania and Kenya. Biol. Conserv. 2007, 134, 209–231. [Google Scholar] [CrossRef]
- National Bureau of Statistics. 2012 Population and Housing Census; Population Distribution by Adminstrative Areas; National Bureau of Statistics: Dar-es-Salaam, Tanzania, 2013.
- Ayebare, S.; Ponce-Reyes, R.; Segan, D.B.; Watson, J.E.M.; Possingham, H.P.; Seimon, A.; Plumptre, A.J. Identifying Climate-Resilient Corridors for Conservation in the Albertine Rift; Unpublished Report; The Wildlife Conservation Society to MacArthur Foundation: New York, NY, USA, 2013. [Google Scholar]
- Moilanen, A.; Wilson, K.; Possingham, H.P. (Eds.) Spatial Conservation Prioritization: Quantitative Methods and Computational Tools; Oxford Universiy Press: Oxford, UK, 2009. [Google Scholar]
- Wiens, J.A.; Safford, H.D.; McGarigal, K.; Romme, W.H.; Manning, M. What is the Scope of “History” in Historical Ecology? Issues of Scale in Management and Conservation. Hist. Environ. Var. Conserv. Nat. Resour. Manag. 2012, 63–75. [Google Scholar] [CrossRef]
- Chapman, C.A.; Chapman, L.J. Mid-Elevation Forests: A history of disturbance and Regeneration. In East African Ecosystems and Their Conservation; McClanahan, T.R., Young, T.P., Eds.; Oxford Universiy Press: Oxford, UK, 1996; pp. 385–400. [Google Scholar]
- Newmark, A.W.D. Forest area, fragmentation, and loss in the Eastern Arc Mountains: Implications for the conservation of biological diversity. J. East Afr. Nat. Hist. 1998, 87, 29–36. [Google Scholar] [CrossRef]
- Jackson, S.T.; Stephen, T. Vegetation, environment, and time: The origination and termination of ecosystems. J. Veg. Sci. 2006, 17, 549–557. [Google Scholar] [CrossRef]
- Holl, K.D.; Aide, T.M. When and where to actively restore ecosystems? For. Ecol. Manag. 2011, 261, 1558–1563. [Google Scholar] [CrossRef]
- Holl, K.D. Factors Limiting Tropical Rain Forest Regeneration in Abandoned Pasture: Seed Rain, Seed Germination Microclimate and Soil. Biotropica 1999, 31, 229–242. [Google Scholar] [CrossRef]
- De Souza, F.M.; Batista, J.L.F. Restoration of seasonal semideciduous forests in Brazil: Influence of age and restoration design on forest structure. For. Ecol. Manag. 2004, 191, 185–200. [Google Scholar] [CrossRef]
- Chapman, C.A.; Chapman, L.J. Forest restoration in abandoned agricultural land: A case study from East Africa. Conserv. Biol. 1999, 13, 1301–1311. [Google Scholar] [CrossRef]
- Chapman, C.A.; Chapman, L.J.; Kaufman, L.; Zanne, A.E. Potential causes of arrested succession in Kibale National Park: Growth and mortality of seedlings. Afr. J. Ecol. 1999, 37, 81–92. [Google Scholar] [CrossRef]
- Holl, K.D. Effect of shrubs on tree seedling establishment in an abandoned tropical pasture. J. Ecol. 2002, 90, 179–187. [Google Scholar] [CrossRef] [Green Version]
- Omeja, P.A.; Lwanga, J.S.; Obua, J.; Chapman, C.A. Fire control as a simple means of promoting tropical forest restoration. Trop. Conserv. Sci. 2011, 4, 287–299. [Google Scholar] [CrossRef]
- Piiroinen, T.; Valtonen, A.; Roininen, H. Exotic plantations can ignite forest succession in the Afrotropis where natural forest regeneration is slow. Afr. J. Ecol. 2016, 54, 478–484. [Google Scholar] [CrossRef]
- Feeney, P. Accountable Aid: Local Participation in Major Projects; Oxfoam Publications: Oxford, UK, 1998. [Google Scholar]
- Pusey, A.E.; Pintea, L.; Wilson, M.L.; Kamenya, S.; Goodall, J. The contribution of long-term research at Gombe National Park to chimpanzee conservation. Conserv. Biol. 2007, 21, 623–634. [Google Scholar] [CrossRef]
- Saad, M.; Regan, J.; Chen, J.; Muzungu, E.; Mwiza, F.; Paulson, C.; Weiser, J.; Willis, A. Highway for Apes: Using NASA EOS for Wildlife Corridor Planning in Rwanda. Available online: https://earthzine.org/2013/04/03/highway-for-apes-using-nasa-eos-for-wildlife-corridor-planning-in-rwanda/ (accessed on 1 January 2017).
- Lwanga, J.S. Forest succession in Kibale National Park, Uganda: Implications for forest restoration and management. Afr. J. Ecol. 2003, 41, 9–22. [Google Scholar] [CrossRef]
- UWA. FACE Natural High Forest Rehabilitation Project on Degraded Land of Kibale; UWA: Kampala, Uganda, 2011. [Google Scholar]
- Cerf, C. Jane Goodall’s Win-Win. Available online: https://www.usaid.gov/news-information/frontlines/depleting-resources/jane-goodalls-win-win (accessed on 1 January 2017).
- WCS REDD. Readiness in Southwest Tanzania The Development of Standardized Approaches for Establishing Baseline Information Monitoring Forest Degradation and Supporting Community Incentives Education and Resource Supply in Support of Redd in Tanzania with; WCS REDD: Mbeya, Tanzania, 2014. [Google Scholar]
- Ngaga, Y.M. Forest Plantations and Woodlots in Tanzania. Afr. For. Forum 2011, 16, 1–80. [Google Scholar]
- Pistorius, T.; Carodenuto, S.; Wathum, G. Implementing Forest Landscape Restoration in Ethiopia. Forests 2017, 8, 61. [Google Scholar] [CrossRef]
- Watkins, C.A. Natural resource use strategies in a forest-adjacent Ugandan village. Hum. Ecol. 2009, 37, 723–731. [Google Scholar] [CrossRef]
- Koskinen, J.; Leinonen, U.; Vollrath, A.; Ortmann, A.; Lindquist, E.; D’annunzio, R.; Pekkarinen, A.; Käyhkö, N. Participatory mapping of forest plantations with Open Foris and Google Earth Engine. ISPRS J. Photogramm. Remote Sens. 2019, 148, 63–74. [Google Scholar] [CrossRef]
- L’Roe, J.; Naughton-Treves, L. Forest edges in western Uganda: From refuge for the poor to zone of investment. For. Policy Econ. 2017, 84, 102–111. [Google Scholar] [CrossRef]
- Chapman, C.; Chapman, L. Exotic tree plantations and the regeneration of natural forests in Kibale National Park, Uganda. Biol. Conserv. 1996, 76, 253–257. [Google Scholar] [CrossRef]
- Chhetri, P.B.; Barrow, E.G.C.; Muhweezi, A. Securing Protected Area Integrity and Rural People’s Livelihoods: Lessons from Twelve Years of the Kibale and Semliki Conservation and Development Project; IUCN: Gland, Switzerland, 2004; ISBN 2831707811. [Google Scholar]
- Etongo, D.; Djenontin, I.N.S.; Kanninen, M.; Fobissie, K. Smallholders’ tree planting activity in the ziro province, southern burkina faso: Impacts on livelihood and policy implications. Forests 2015, 6, 2655–2677. [Google Scholar] [CrossRef]
- Jenbere, D.; Lemenih, M.; Kassa, H. Expansion of Eucalypt Farm Forestry and Its Determinants in Arsi Negelle District, South Central Ethiopia. Small Scale For. 2012, 11, 389–405. [Google Scholar] [CrossRef]
- Telila, H.; Hylander, K.; Nemomissa, S. The potential of small Eucalyptus plantations in farmscapes to foster native woody plant diversity: Local and landscape constraints. Restor. Ecol. 2015, 23, 918–926. [Google Scholar] [CrossRef]
- Salter, R.F.; Davenport, T.R.B. Orchids and Wildflowers of the Kitulo Plateau; WILDGuides: Old Basing, Hampshire, UK, 2011. [Google Scholar]
- WCS. The Tanzania–Norway Partnership on REDD Climate Change: REDD Readiness in Southwest Tanzania; WCS: Mbeya, Tanzania, 2013. [Google Scholar]
- Bracebridge, C.E.; Davenport, T.R.B.; Marsden, S.J. Can we extend the area of occupancy of the kipunji, a critically endangered African primate? Anim. Conserv. 2011, 14, 687–696. [Google Scholar] [CrossRef]
- Grosh, M.; Glewwe, P. Designing Household Survey Questionnaires for Developing Countries: Lessons from 15 Years of the Living Standards Measurement Study; Volume 1, 2 and 3; The World Bank: Washington, DC, USA, 2000. [Google Scholar]
- Zeileis, A.; Kleiber, C.; Jackman, S. Regression Models for Count Data in R. J. Stat. Softw. 2008, 27, 1–25. [Google Scholar] [CrossRef]
- Ridout, M.; Demetrio, C.G.; Hinde, J. Models for count data with many zeros. Int. Biom. Conf. 1998, 19, 179–192. [Google Scholar]
- Omoro, L.M.A.; Pellikka, P.K.E.; Rogers, P.C. Tree Species Diversity, Richness, and Similarity between Exotic and Indigenous Forests in the Cloud Forests of Eastern Arc Mountains, Taita Hills, Kenya. J. For. Res. 2010, 21, 255–264. [Google Scholar] [CrossRef]
- Mills, A.J.; Van der Vyver, M.; Gordon, I.J.; Patwardhan, A.; Marais, C.; Blignaut, J.; Sigwela, A.; Kgope, B. Prescribing innovation within a large-scale restoration programme in degraded subtropical thicket in South Africa. Forests 2015, 6, 4328–4348. [Google Scholar] [CrossRef]
- Mugwedi, L.; Rouget, M.; Egoh, B.; Sershen; Ramdhani, S.; Slotow, R.; Renteria, J. An Assessment of a Community-Based, Forest Restoration Programme in Durban (eThekwini), South Africa. Forests 2017, 8, 255. [Google Scholar] [CrossRef]
- WCS. Regenerating Rwanda’s Nyungwe Forest. Available online: https://www.usaid.gov/results-data/success-stories/regenerated-future-nyungwe-forest (accessed on 1 January 2017).
- Mutai, W. Face The Future: Payment for Ecosystem Services Training; Face The Future: Wageningen, The Netherlands, 2011; pp. 1–12. [Google Scholar]
- Lindenmayer, D.B.; Hobbs, R.J. Fauna conservation in Australian plantation forests—A review. Biol. Conserv. 2004, 119, 151–168. [Google Scholar] [CrossRef]
- Barlow, J.; Gardner, T.A.; Araujo, I.S.; Ávila-Pires, T.C.; Bonaldo, A.B.; Costa, J.E.; Esposito, M.C.; Ferreira, L.V.; Hawes, J.; Hernandez, M.I.M.; et al. Quantifying the biodiversity value of tropical primary, secondary, and plantation forests. Proc. Natl. Acad. Sci. USA 2007, 104, 18555–18560. [Google Scholar] [CrossRef] [Green Version]
- Lamb, D. Large-scale Ecological Restoration of Degraded Tropical Forest Lands: The Potential Role of Timber Plantations. Restor. Ecol. 1998, 6, 271–279. [Google Scholar] [CrossRef]
- Martino, R.M. Matrix and Edge Effects on the Maintenance of Ecological Function in an Afromontane Protected Area; Antioch University: Keene, NH, USA, 2015. [Google Scholar]
- Miller, D.C.; Muñoz-Mora, J.C.; Christiaensen, L. Prevalence, economic contribution, and determinants of trees on farms across Sub-Saharan Africa. For. Policy Econ. 2017, 84, 47–61. [Google Scholar] [CrossRef] [Green Version]
- Jones, T.; Caro, T.; Davenport, T.R.B. Wildlife Corridors in Tanzania; Tanzania Wildlife Research Institute: Arusha, Tanzania, 2009. [Google Scholar]
- Jones, T.; Bamford, A.J.; Ferrol-Schulte, D.; Hieronimo, P.; Mcwilliam, N.; Rovero, F. Vanishing wildlife corridors and options for restoration: A case study from Tanzania. Trop. Conserv. Sci. 2012, 5, 463–474. [Google Scholar] [CrossRef]
- Rovero, F.; Jones, T. Wildlife Corridors in the Udzungwa Mountains of Tanzania. Ecol. Restor. 2011, 30, 322–331. [Google Scholar] [CrossRef]
- Department of Forestry and Beekeeping (Tanzania) East Usambara Mountains. Resettlement Action Plan for Farm Plots Displaced for Biodiversity Conservation in the Derema Forest Corridor; Department of Forestry and Beekeeping (Tanzania) East Usambara Mountains: Dar es Salaam, Tanzania, 2006. [Google Scholar]
- Nyaligu, M.; Weeks, S. An Elephant Corridor in a Fragmented Conservation Landscape: Preventing the Isolation of Mount Kenya National Park and National Reserve. Parks 2013, 19, 91–102. [Google Scholar] [CrossRef]
- Great Ape Trust. Rwanda’s Forest of Hope to Expand by 21%, begin Corridor for Endangered Chimpanzees; Great Ape Trust: Des Moines, IA, USA, 2010; Available online: https://phys.org/news/2010-02-rwanda-forest-percent-corridor-endangered.html (accessed on 1 January 2017).
- Butynski, T.M.; De Jong, Y.A. South Western Mau Forest Reserve Game-Proof Barrier Feasibility Study. Available online: https://www.idhsustainabletrade.com/publication/south-western-mau-forest-reserve-game-proof-barrier-feasibility-study/ (accessed on 1 January 2017).
- Manumbu, E.; Mosha, M.; Masolwa, P. Integrated General Land Management Planning Meeting Report Pdf; The Nature Conservancy, The Jane Goodal Institute, The Frankfurt Zoological Society: Mpanda, Tanzania, 2012. [Google Scholar]
- Mpunga, N.E.; Machaga, S.J.; Kimiti, S.; Agritechnica, Hanover, Germany. List of seedlings species encountered at Bujingijila Gap and their ecological significance. Personal Communication, 2016. [Google Scholar]
Figure 1.
Considerations and strategies for attaining forest regeneration in densely-settled landscapes surrounding protected forests.
Figure 1.
Considerations and strategies for attaining forest regeneration in densely-settled landscapes surrounding protected forests.

Figure 2.
(A): Study location in Tanzania. (B): Bujingijila Gap with adjacent protected forests. Each circle in the outlined area is a survey location for tree seedlings. Black circles outside the outlined area are interviewee homesteads. (C): Parcel boundaries of surveyed farms in southern portion of the site, categorized by land use.

Figure 3.
Tree cover in the Gap from hand-digitization of aerial photographs (1949, 1969, 1975,1985) and Google Earth imagery (2008, 2014, 2017). Circle markers indicate native tree cover, and squares indicate woodlot tree cover.
Figure 3.
Tree cover in the Gap from hand-digitization of aerial photographs (1949, 1969, 1975,1985) and Google Earth imagery (2008, 2014, 2017). Circle markers indicate native tree cover, and squares indicate woodlot tree cover.

Figure 4.
Land-use apportioning by respondents. All charts on the left show forest-edge land use; on the right, non-forest edge land use. Chart size is proportional to average land area. Statistical significance determined by paired t-test (edge versus non-edge) for each land-use type, with the respondent as a response variable. *** p < 0.001.

Table 1.
Odds ratios of observed native tree seedlings density and richness based on three predictors: Height of grass (in meters), proximity to a remnant native tree, and distance from forest edge (m). The first and second columns are the odds ratios for the entire study site, then for the portion under Protect and Wait, then for the entire portion under smallholder management, and then for the locations with Woodlots. Count models describe seedlings distributions where seedlings were encountered, and Zero models describe patterns of true absences. DF: Degrees of Freedom. Statistical significance codes: *** p < 0.001; ** p = 0.01; * p = 0.05; and + p = 0.1.
| Metric | Predictors | Entire Site | Protect and Wait | Smallholder All | Woodlots | ||||
|---|---|---|---|---|---|---|---|---|---|
| Count Model | Zero Model | Count Model | Zero Model | Count Model | Zero Model | Count Model | Zero Model | ||
| Seedling abundance | Distance to Forest Edge (m) | 0.99 *** | 1.00 ** | 0.99 *** | 0.99 | 0.99 ** | 1.01 ** | 0.99 ** | 1.00 * |
| Near a Remnant Tree (Y/N) | 1.55 *** | 1.01 | 2.01 *** | 0.52 | 1.40 ** | 1.41 | 1.31+ | 2.56 | |
| Grass Height (m) | 0.99 | 1.44 *** | 0.92 | 1.22 | 0.92 | 1.37 ** | 0.96 | 1.85 * | |
| Log-Likelihood (DF) | −571(8) | −181.4(8) | −373(8) | −240(8) | |||||
| Seedling richness | Distance to Forest Edge (m) | 0.99 *** | 0.99 | 0.99 ** | 0.97 * | 0.99 *** | 1.00 | 0.99 ** | 1.92 |
| Near a Remnant Tree (Y/N) | 1.54 * | 1.73 | 1.83+ | 0.63 | 1.53 * | 15.6 | 1.42+ | 2.86E+43 | |
| Grass Height (m) | 0.93 | 1.77 * | 0.82+ | 1.08 | 0.98 | 3.3 * | 1.07 | 1.03E+25 | |
| Log-Likelihood (DF) | −370(8) | −109(8) | −248(8) | −140(8) | |||||
© 2019 by the authors. Licensee MDPI, Basel, Switzerland. This article is an open access article distributed under the terms and conditions of the Creative Commons Attribution (CC BY) license (http://creativecommons.org/licenses/by/4.0/).
Share and Cite
MDPI and ACS Style
Kimambo, N.E.; Naughton-Treves, L. The Role of Woodlots in Forest Regeneration outside Protected Areas: Lessons from Tanzania. Forests 2019, 10, 621. https://doi.org/10.3390/f10080621
AMA Style
Kimambo NE, Naughton-Treves L. The Role of Woodlots in Forest Regeneration outside Protected Areas: Lessons from Tanzania. Forests. 2019; 10(8):621. https://doi.org/10.3390/f10080621
Chicago/Turabian StyleKimambo, Niwaeli E., and Lisa Naughton-Treves. 2019. "The Role of Woodlots in Forest Regeneration outside Protected Areas: Lessons from Tanzania" Forests 10, no. 8: 621. https://doi.org/10.3390/f10080621
Note that from the first issue of 2016, this journal uses article numbers instead of page numbers. See further details here.