Article

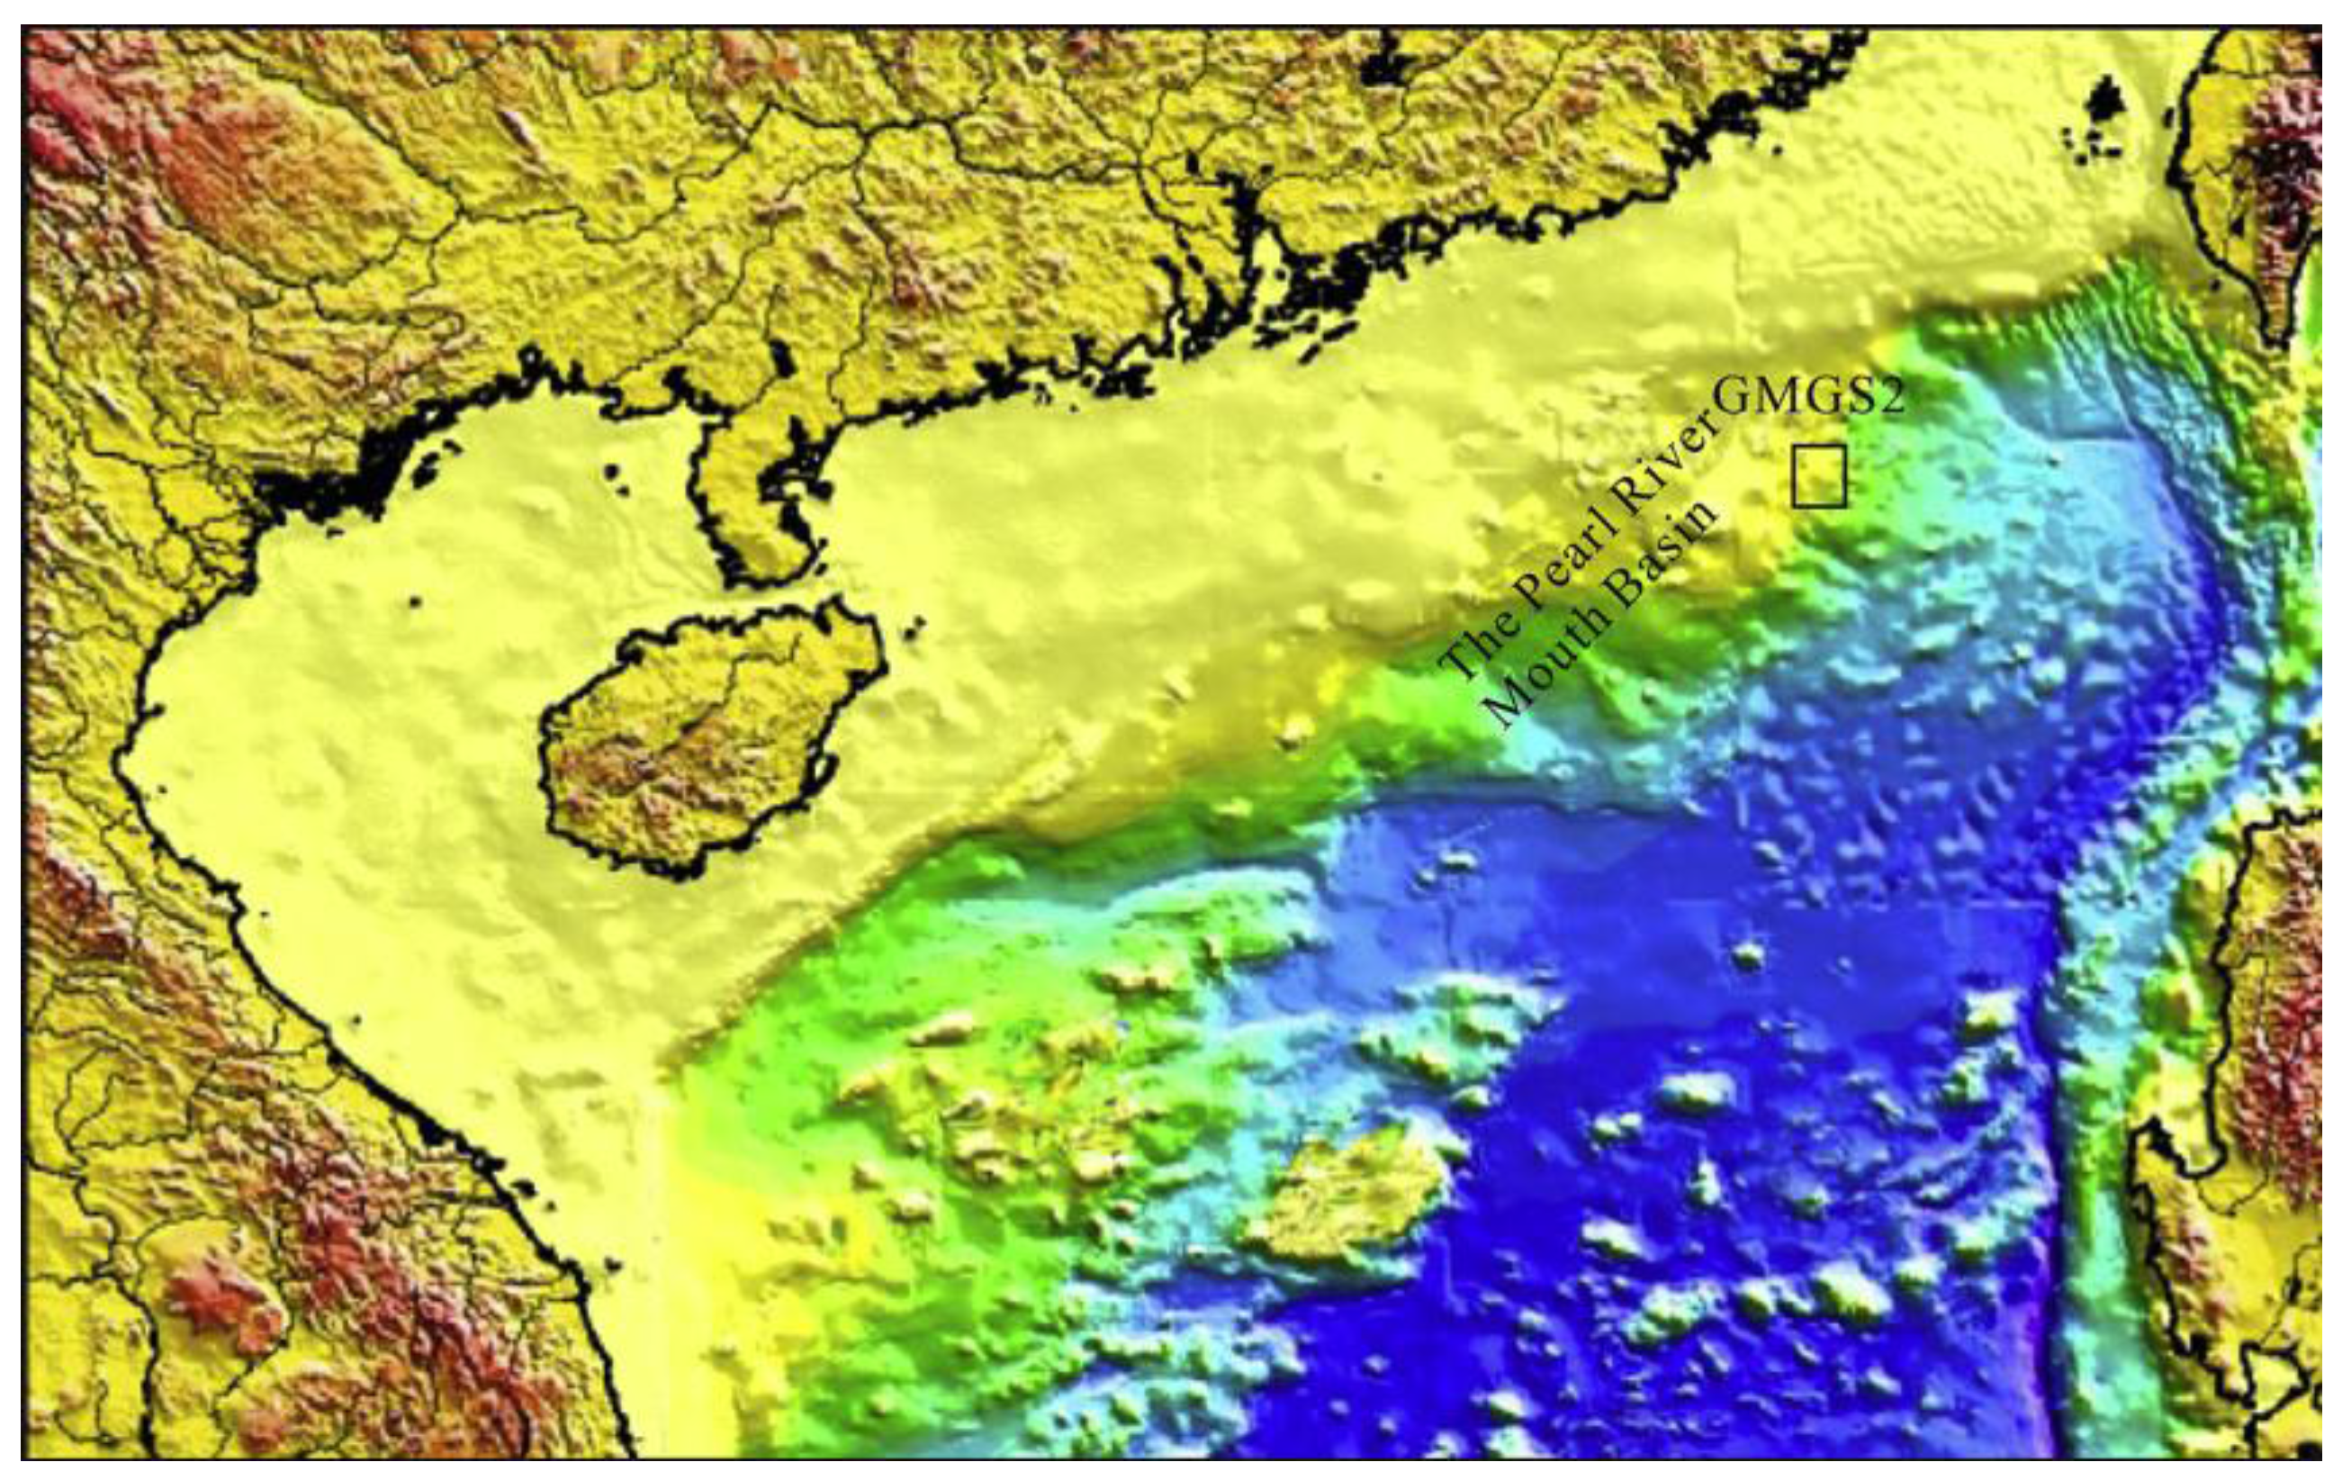
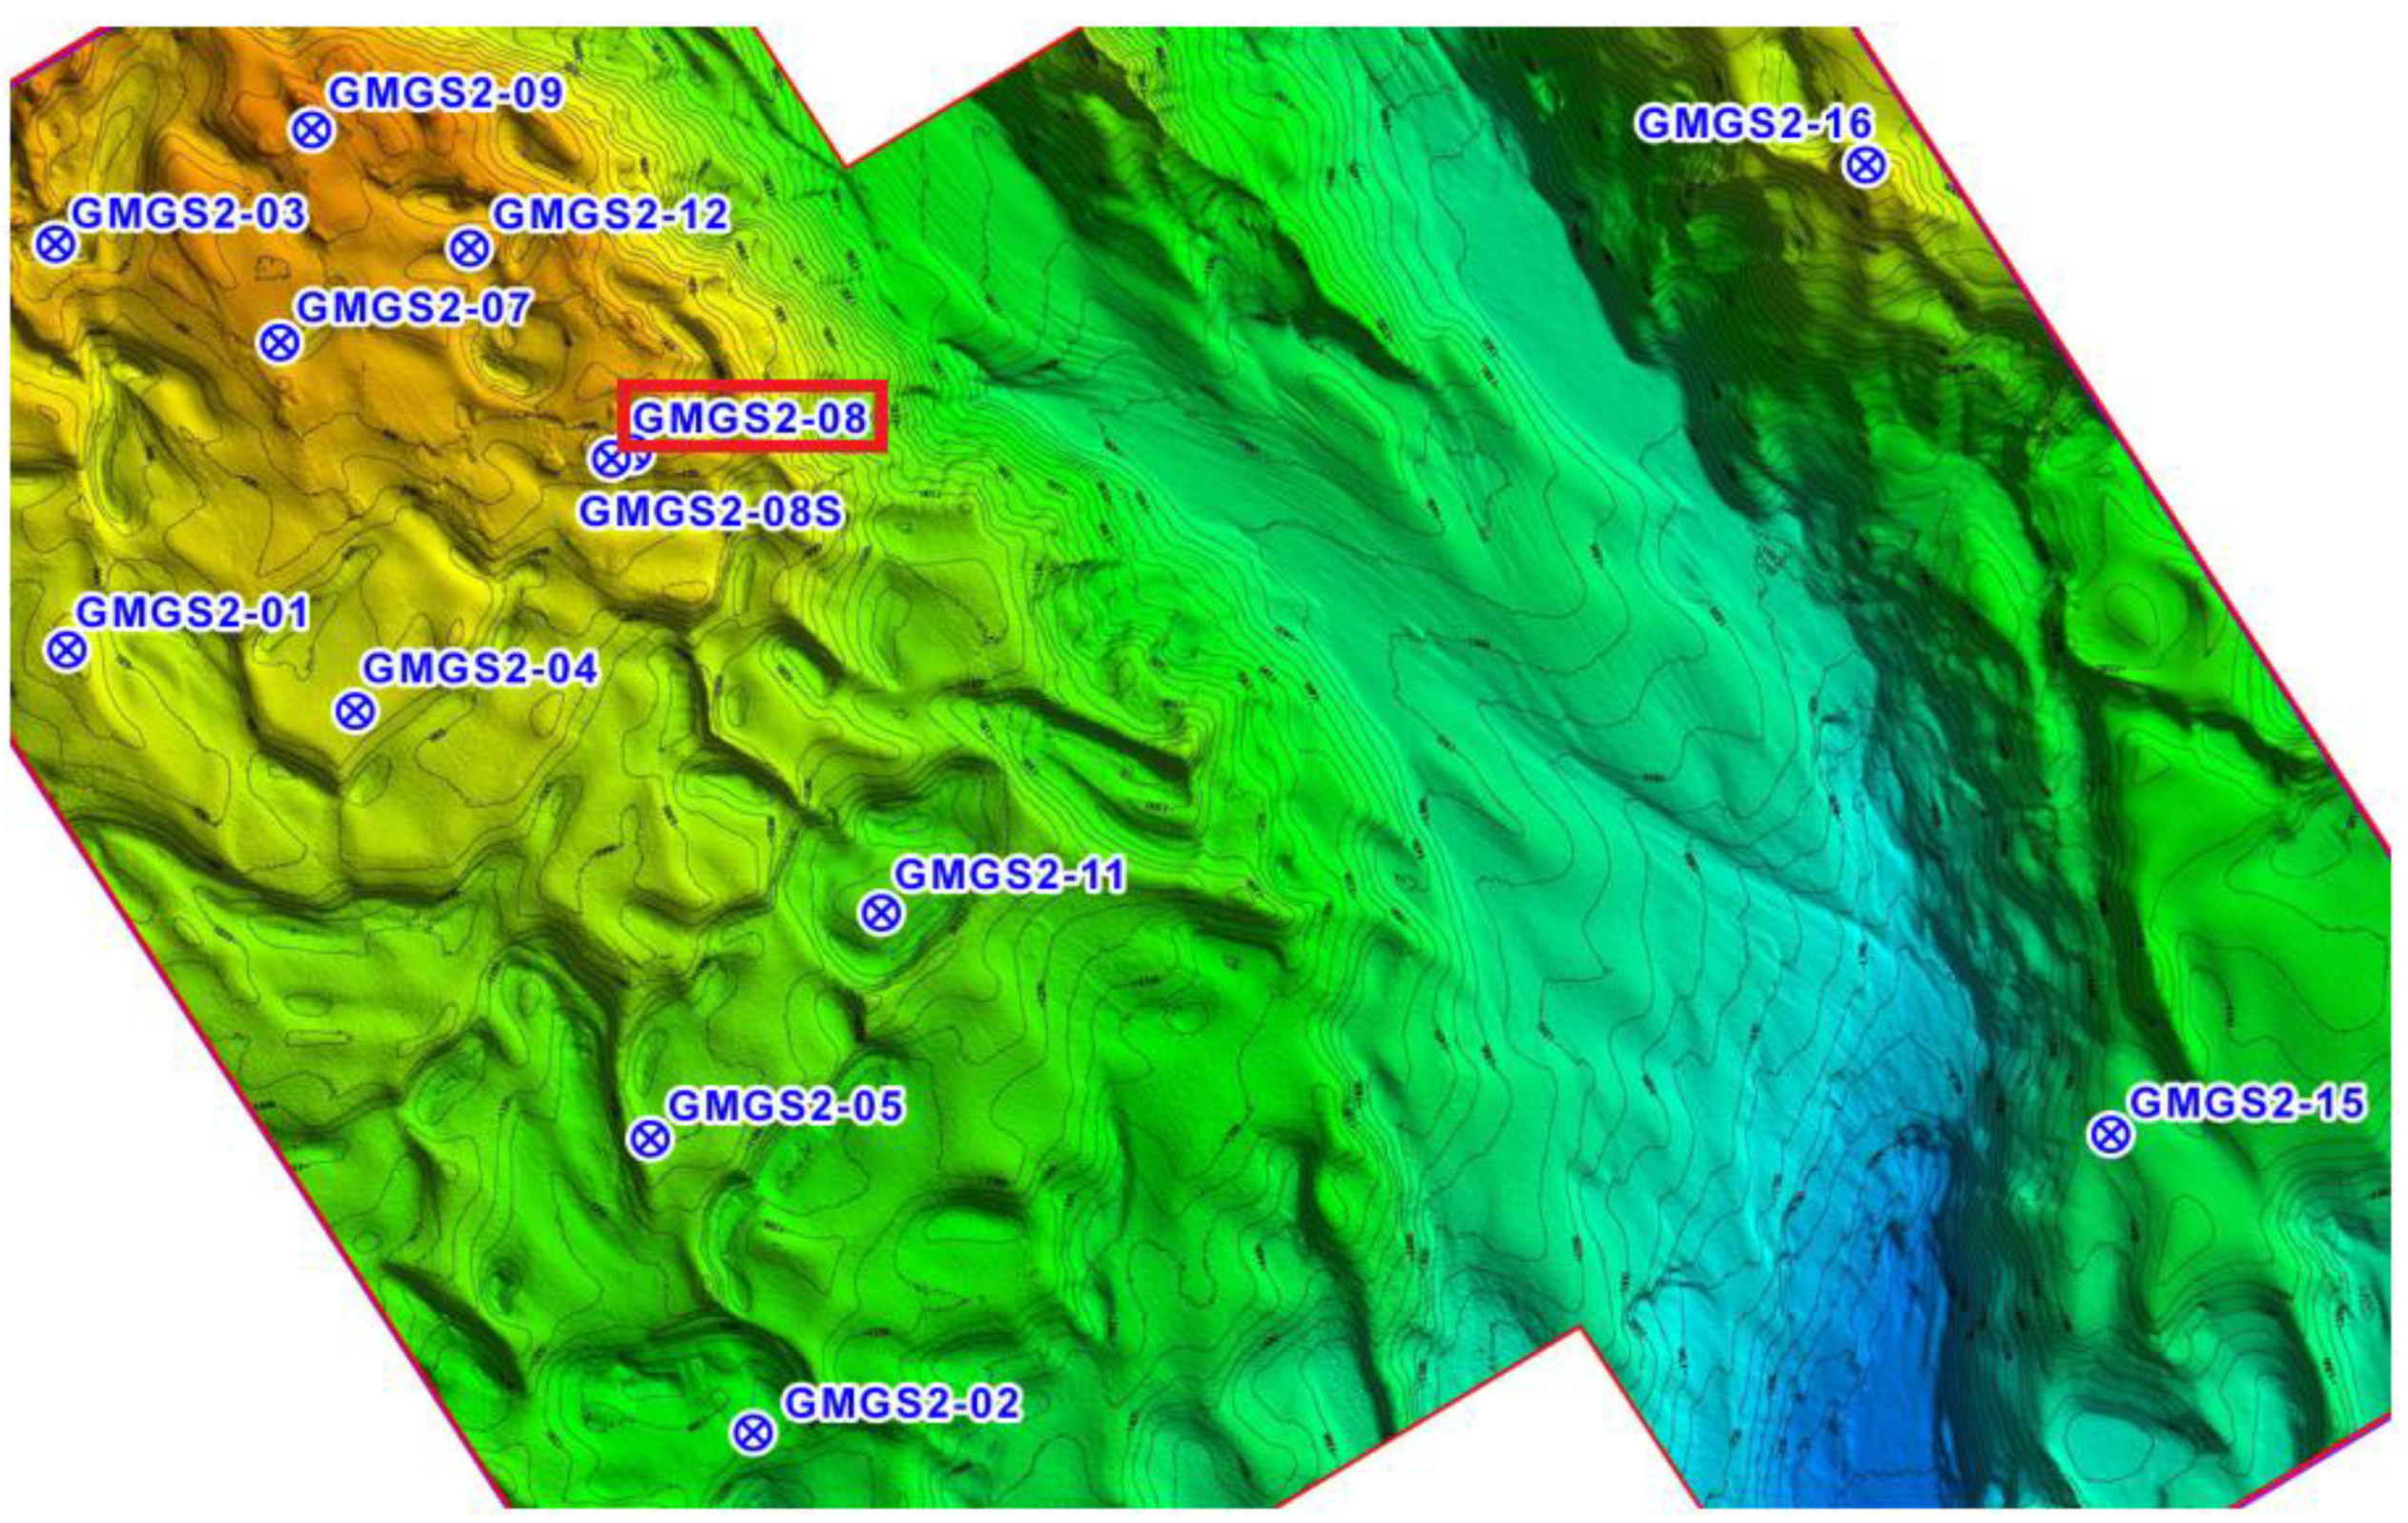
Evaluation of Gas Production from Marine Hydrate Deposits at the GMGS2-Site 8, Pearl River Mouth Basin, South China Sea

1
Key Laboratory of Gas Hydrate, Guangzhou Institute of Energy Conversion, Chinese Academy of Sciences, Guangzhou 510640, China
2
Guangzhou Center for Gas Hydrate Research, Chinese Academy of Sciences, Guangzhou 510640, China
3
Guangdong Key Laboratory of New and Renewable Energy Research and Development, Guangzhou 510640, China
4
University of Chinese Academy of Sciences, Beijing 100083, China
*
Author to whom correspondence should be addressed.
Energies 2016, 9(3), 222; https://doi.org/10.3390/en9030222
Submission received: 22 November 2015 / Revised: 18 January 2016 / Accepted: 23 February 2016 / Published: 21 March 2016

Abstract

:
Natural gas hydrate accumulations were confirmed in the Dongsha Area of the South China Sea by the Guangzhou Marine Geological Survey 2 (GMGS2) scientific drilling expedition in 2013. The drilling sites of GMGS2-01, -04, -05, -07, -08, -09, -11, -12, and -16 verified the existence of a hydrate-bearing layer. In this work gas production behavior was evaluated at GMGS2-8 by numerical simulation. The hydrate reservoir in the GMGS2-8 was characterized by dual hydrate layers and a massive hydrate layer. A single vertical well was considered as the well configuration, and depressurization was employed as the dissociation method. Analyses of gas production sensitivity to the production pressure, the thermal conductivity, and the intrinsic permeability were investigated as well. Simulation results indicated that the total gas production from the reference case is approximately 7.3 × 10⁷ ST m3 in 30 years. The average gas production rate in 30 years is 6.7 × 10³ ST m3/day, which is much higher than the previous study in the Shenhu Area of the South China Sea performed by the GMGS-1. Moreover, the maximum gas production rate (9.5 × 10³ ST m3/day) has the same order of magnitude of the first offshore methane hydrate production test in the Nankai Trough. When production pressure decreases from 4.5 to 3.4 MPa, the volume of gas production increases by 20.5%, and when production pressure decreases from 3.4 to 2.3 MPa, the volume of gas production increases by 13.6%. Production behaviors are not sensitive to the thermal conductivity. In the initial 10 years, the higher permeability leads to a larger rate of gas production, however, the final volume of gas production in the case with the lowest permeability is the highest.

1. Introduction

Natural gas hydrates are an ice-crystalline, naturally occurring compounds composed of water and gas molecules (methane CH4 is the most common ingredient). Natural gas hydrates form under certain thermodynamically favorable conditions of high pressure and relatively low temperature. Under these conditions, gas molecules are trapped in a cage constituted by hydrogen-bonded water molecules. When dissociated under standard conditions, one volume of solid natural gas hydrate will release approximately 160 volumes of natural gas [1], indicating that methane hydrates have a high energy density. In addition, hydrate technology can be applied in the process of the hydrogen storage [2], sea water desalination [3,4], gas separation [5], and capture of carbon dioxide [6].
The first confirmation of naturally-occurring gas hydrates came from the Siberia and the Black Sea. By the mid-1990s, it was estimated that the volume of the energy stored in gas hydrates could exceed that of all the world’s coal, oil, and conventional natural gas combined [7,8]. Nowadays, it is known that gas hydrate is a potential energy resource, which occurs naturally in the permafrost regions and in the ocean sediments of continental margins [7,8]. Therefore, developing methods for methane production from hydrate reservoirs and investigating their production behavior are attracting considerable attention from governments and scientists all over the world.
Recently, an increasing number of deep ocean drilling expeditions have been carried out to determine the location of the marine hydrate deposit sand gather the geological factors controlling the occurrence of gas hydrates. The premier drilling projects are the Ocean Drilling Program (ODP) [9] and the Integrated Ocean Drilling Program (IODP) [10]. The Department of Energy (DOE) of the USA and some oil companies sponsored the Joint Industry Project to address the challenges of gas hydrate exploration and exploitation in the Northern Gulf of Mexico [11]. In Asia, information about the occurrence of gas hydrate deposits in the sea area of the Indian Peninsula and the Andaman convergent margin was documented by the project of Indian National Gas Hydrate Program Expedition 01 [12]. Hydrate samples and the corresponding geologic data have been acquired in the Ulleung Basin located in the east sea of Korea by the Korea Gas Hydrate Expedition in 2007 and 2010, respectively [13,14]. In China, hydrate resources appear to be abundant. In 2007, the Guangzhou Marine Geological Survey (GMGS) successfully completed the GMGS1 hydrate exploration program in the Shenhu Area of the South China Sea [15,16]. Subsequently, the second Chinese marine hydrate expedition GMGS2 was performed in the Dongsha Area of the South China Sea in the summer of 2013.
Figure 1 shows the location map of the GMGS2 scientific drilling expedition in the Dongsha Area. The Dongsha Area explored by GMGS2 is situated at the east of the Pearl River Mouth Basin in the South China Sea [17]. An initial Logging While Drilling phase was employed by GMGS2, and then a coring and sampling phase were used. During the GMGS2expedition, a total of 13 sites (shown in Figure 2), which includes 10 logging-while-drilling (LWD) and three downhole wire line logging (DWL) pilot holes, were investigated, among which the existence of hydrate-bearing layers was confirmed at nine sites (sites GMGS2-01, -04, -05, -07, -08, -09, -11, -12, and -16). The water depth of the drilling sites ranged from 667 to 1747 m. As a result, the Dongsha area was concluded to be one of the most complex and the richest marine gas hydrate accumulations that exist.
At Site GMGS2-08, double gas hydrate intervals with saturation of 45%–55% have been detected. As shown in Figure 3, gas hydrates were identified at this site in fine grained sediments with vein, nodular, and laminated morphologies. In the shallow part (9.0–23.0 mbsf), a roughly 14 m-thick layer of gas hydrates, widely distributed in the form of nodules and veins, occurs in a range of 9.0 to 23.0 mbsf. In the middle part (58.0–63.0 mbsf), a 5 m-thick authigenic carbonates deposit was found just above the top of the lower hydrate-bearing sediments. In the deep part (63.0–98.0 mbsf), the interval is dominated by silty clay with some partially dispersed muddy carbonates. A 35-m-thick gas hydrate layer, tightly distributed with a massive form, was found in a range of 63.0–98.0 mbsf. Meanwhile, a 20 cm-thick section of pure gas hydrate was recovered in this interval [17]. Ideally, the best natural gas hydrate (NGH) is found in sands, in particular turbidite sands bounded by impermeable shales. This is because the industry already has the tools and the knowledge to produce natural gas from beds like it [18].
Obviously, production tests in the field are essential to assess the feasibility of exploiting methane hydrate deposits. However, until now, just a few short-term field tests have been conducted because of the huge cost [19]. Therefore, numerical studies and laboratory tests are underway to advance our understanding of the technologies to exploit this potential energy resource [15,19,20,21,22,23]. After the GMGS1hydrate exploration program in the Shenhu Area of the South China Sea, a series of numerical studies of gas production from the hydrate reservoir in the Shenhu Area were carried out [24,25,26,27]. The application of the vertical well [28], the single horizontal well [25], and the dual horizontal well [15] technologies in the hydrate reservoir at the Shenhu Area were investigated. Evaluations of the gas production from hydrate reservoir by depressurization [29], thermal stimulation [30], the huff and puff method [26], and depressurization in conjunction with warm brine stimulation [31] were also studied. However, up to now, there was little literature about the evaluation of gas production from the hydrate reservoir in the Dongsha Area.
In this work, the main objective was to evaluate the production potential of the gas hydrate accumulation at the Site GMGS2-8 of the Dongsha Area in the Pearl River Mouth Basin. This is the first time the gas production potential in this area has been studied using numerical tools. All of the parameter selection is based on the logging data and exploration data of the reservoir. On the other hand, the TOUGH-hydrate code is one of the most popular tools for evaluating the gas production in hydrate reservoirs, and this code has been verified by experiments in our previous work [32,33,34]. Therefore, the results of this paper should be valuable for the future hydrate exploitation in this area. The single vertical well is considered as the well configuration. Depressurization is employed as the dissociation method. Analyses of the sensitivity of gas production to various dissociation parameters were carried out as well.

2. System Description and Production Strategy

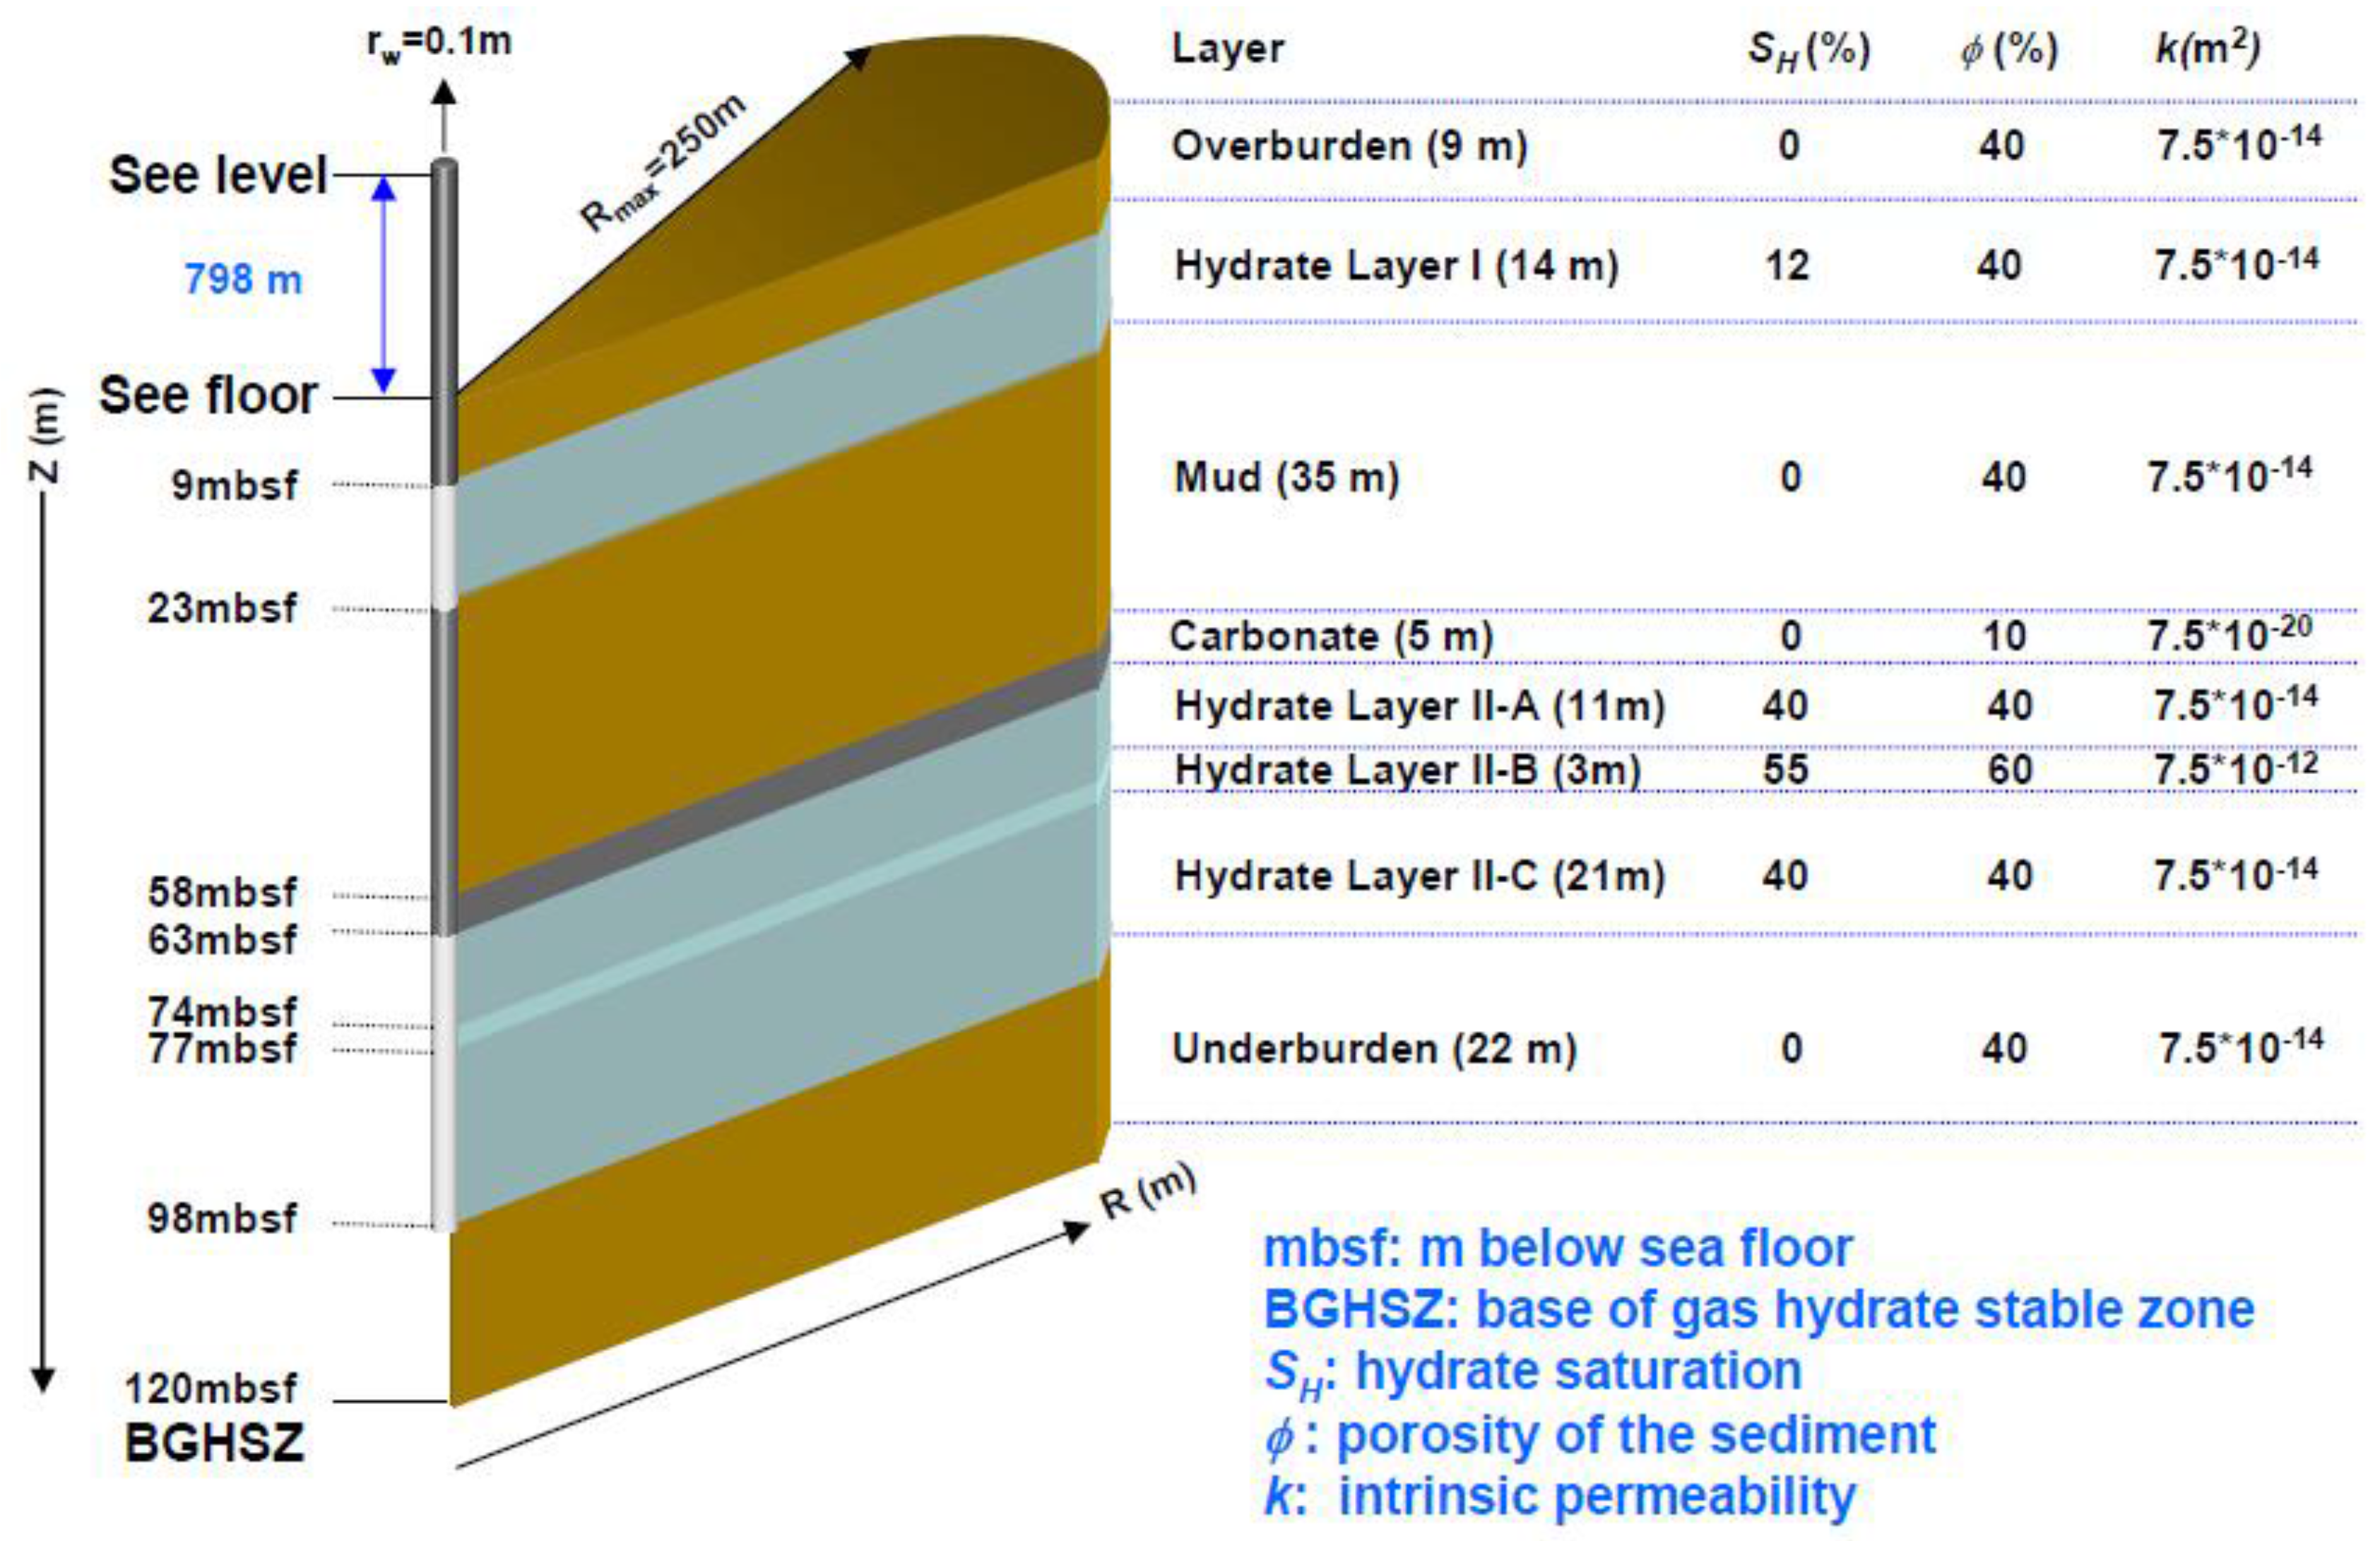
2.1. System Description and Geometry

Figure 4 shows a sketch of this system, and provides some basic information on the thickness of the various layers. All the data in Figure 4 are based on the best available data from Site GMGS2-8 of the Dongsha Area [16]. The water depth at the GMGS2-8 site is 798 m. Preliminary available information indicates that there are two hydrate-bearing layers at the GMGS2-8 site. The upper gas hydrate layer (Hydrate Layer I, HBL-I) is 9 m below the seafloor, and the thickness of this layer is 14 m. According to the drilling sample results, hydrate occurs within fine-grained sediments in this layer, and the saturation of the hydrate ranges from 10% to 14%. Thus, in this workhydrate saturation in this layer was selected as 12%. In the middle part (58–63 mbsf), a 5 m-thick authigenic carbonates deposited was found just above the top of the lower hydrate-bearing sediment. The permeability of this carbonates layer is very low. The lower gas hydrate layer (Hydrate Layer II, HBL-II) ranges from 63 to 98 mbsf with a thickness of 35 m, and the saturation of the hydrate in this layer ranges from 30% to 50%. Therefore, in this work the hydrate saturation in this layer was selected as 40%. Meanwhile, the analysis of pressure coring located at the depth of 74–77 mbsf indicates that this interval is rich of massive gas hydrates. A 20-cm-thick section of pure gas hydrate was recovered in this interval. Thus, in the cylindrical system used in the simulations (Figure 4), there is a massive hydrate interval ranges from 74 to 77 mbsf, which is characterized by high porosity, high intrinsic permeability, and high hydrate saturation. The upper hydrate layer is overlain by an overburden with a thickness of 9 m, and the lower hydrate layer is underlain by an underburden with a thickness of 22 m. Meanwhile, there is a 35m-thick mud between the upper and the lower hydrate layers. The cylindrical system extends over an area with a radius of 250 m.
Table 1 shows the geological and system properties based on the exploration results and the literature.
The intrinsic permeabilities of the overburden, the HBL, and the underburden, which are a function of the sediment structure only (not of the fluid and hydrate), are estimated according to the limited measuring data [17]. The drilling data show that the zone above the lower hydrate-bearing layer is highly impermeable carbonate. Thus, the intrinsic permeability of the carbonate layer is chosen as 7.5 × 10⁻²⁰ m2. The intrinsic permeability of the massive hydrate layer is chosen as 7.5 × 10⁻¹² m2 [36].

2.2. Method of Production and Well Design

The technologies for commercial production of natural gas from hydrate are still developing. The common methods for hydrate dissociation are: (1) the depressurization method, in which the hydrate reservoir pressure is reduced below the equilibrium decomposition pressure to decompose the hydrate [37,38]; (2) the thermal stimulation method, in which the hydrate reservoirs are heated above the equilibrium decomposition temperature to decompose the hydrate [21,39]; (3) the chemical injection method, in which chemicals (such as methanol or ethylene glycol) are injected into the reservoir to change the equilibrium hydrate decomposition conditions and induce hydrate dissociation [40,41]; and (4) the CO2 replacement method, in which CO2 is injected into the hydrate reservoirs to replace the methane gas [42,43]. A series of field production tests from the practical hydrate reservoirs have confirmed the availability of these methods, such as the test at the Mackenzie Delta (Northwest Territories, Canada) by thermal stimulation and depressurization methods [19], and the offshore test at the Nankai Trough, Japan by the depressurization method during 12–18 March 2013 [44]. Depressurization has been regarded as an effective method because of its economic and technical effectiveness [45]. Thus, in this work, depressurization is applied for the hydrate dissociation, and the effects of the hydrate dissociation by depressurization are analyzed.
The carbonate layer and the low intrinsic permeability of marine clays (muds) precluded the use of horizontal wells. Thus, a vertical well model was used exclusively in this study (Figure 4). The well design is quite simple and involves two perforated intervals that cover the entire upper and lower hydrate-bearing intervals. The well radius in this work is rw = 0.1m. The numerical representation of a constant Pw involves treating the well as an internal boundary. In the case of a vertical well, this boundary is placed in the grid block above the uppermost cell in the well.

3. The Numerical Models and Simulation Approach

3.1. The Numerical Simulation Codes

In this study, the parallel version of the numerical code TOUGH+HYDRATE, which consists of an equilibrium and a kinetic model, was employed for numerical simulation. Recently, both the equilibrium and the kinetic model have been validated by Li, et al. [32,33,34] and Moridis, et al. [45,46] using the experimental data.

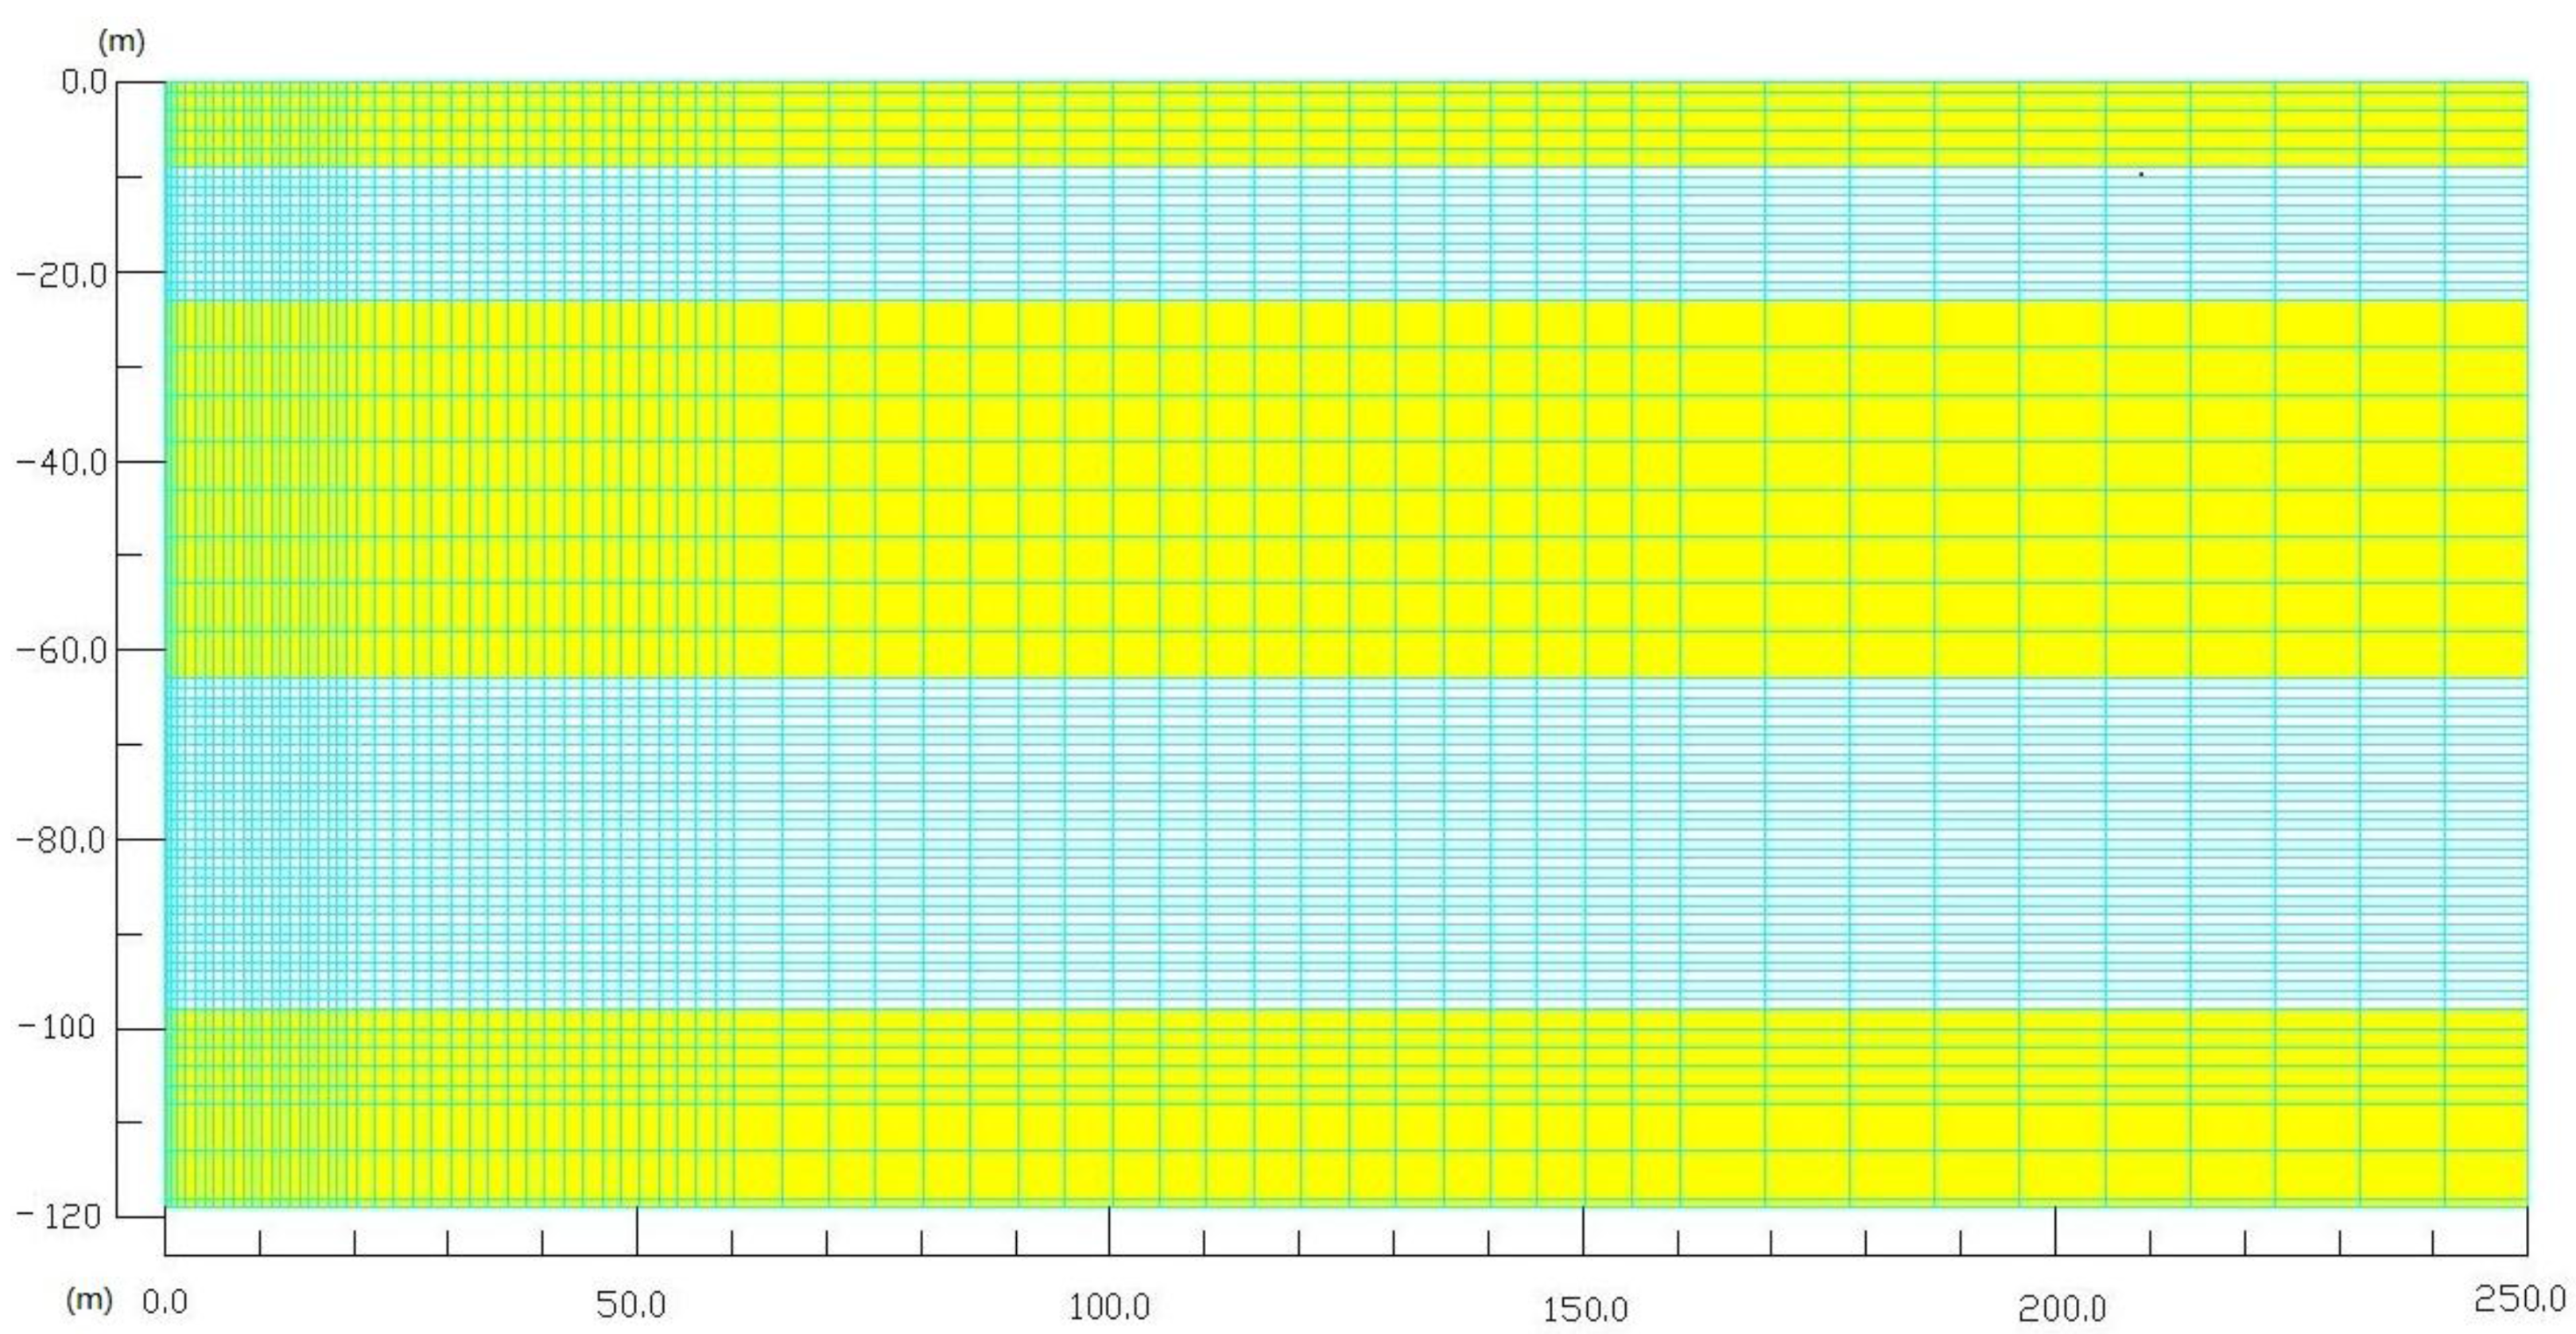
3.2. Domain Discretization

Figure 5 shows the mesh of the simulation system. The cylindrical domain of the single vertical well problem was discretized into 72 × 71 = 5112 gridblocks in (r,z). The hydrate dissociation was treated as an equilibrium reaction [47] and the effect of the salinity on hydrate dissociation was considered, which resulting in a system of 5112 equations. Discretization along the radial direction increases from rw to rmax, which was non-uniform. Discretization along the z-axis was uniform (with Δz = 1.0 m) within the upper and lower hydrate-bearing layers (Figure 5). The discretization was non-uniform in the overburden, center mud layer, and underburden.

3.3. Boundary and Initial Conditions

The pressure and temperature conditions in the uppermost overburden and the lowermost underburden are set as constant, which are corresponding to the inactive boundaries. The initial temperatures of the top and bottom boundaries are determined on the basis of the seafloor temperature and the geothermal gradient (shown in Table 1). Initial pressure at the top of the HBL-I (PT = 8.11 MPa) is determined by a hydrostatic distribution. Then, the P- and T- profiles in the domains are initialized through a short simulation using the boundary temperature, the hydrostatic gradient, and the adjusted brine density. Afterwards, the other initial parameters shown in Table 1 are simulated by another short simulation. Unless a perturbation occurs from the outside, any conditions in the system remain unchangeable. Figure 6 shows the distribution of the initial hydrate saturation, initial pressure, and initial temperature in this simulation. As shown in Figure 6, there are two hydrate-bearing layers at the Site GMGS2-8. The hydrate saturation in the upper gas hydrate layer is 12%, and the saturation of the hydrate in most area of the lower gas hydrate layer is 40%. However, there is a massive hydrate interval in the lower gas hydrate layer, and the hydrate saturation of this hydrate interval is 55%. The pressure and temperature distributions accord with geologic conditions.

3.4. Simulation Process and Approach

Because of significant uncertainties about the values of the important parameters, conditions and variables that affect gas production and the overall system behavior, our approach involved two steps. The first step involved the study of a reference case, which was based on the most likely (expected) values of all the critical parameters and properties. The second step involved extensive sensitivity analyses, which covered the spectrum of the possible variations in the parameter and property values, and thus defined the envelope of the expected system performance during long-term production. However, the 2D (r-z) model in this work is hard to capture all the characteristics of the flow dynamics. In this work, the geological conditions are assumed as rotational symmetry. If the comprehensive geological data for the hydrate deposit can be obtained, a 3D model can be established to evaluate the production potential in the future.

3.5. Evaluation Method

The production potential of the hydrate deposits in the GMGS2-8 site can be evaluated by two production criteria: an absolute criterion and a relative criterion. To satisfy the absolute criterion, production potential (i.e., QP, VP and QR, VR values) needs to be attained over the duration of the study. The relative criterion is satisfied when the water/gas ratio RWG = MW/VP is low, indicating low production cost because of low energy requirements for the water lift and water disposal problems.

4. Production from GMGS2-Site 8 in the Pearl River Mouth Basin: The Reference Case

In this work, the production pressure of the well is set as 4.5 MPa, which is the same as that in the field test of the Nankai Trough [44].

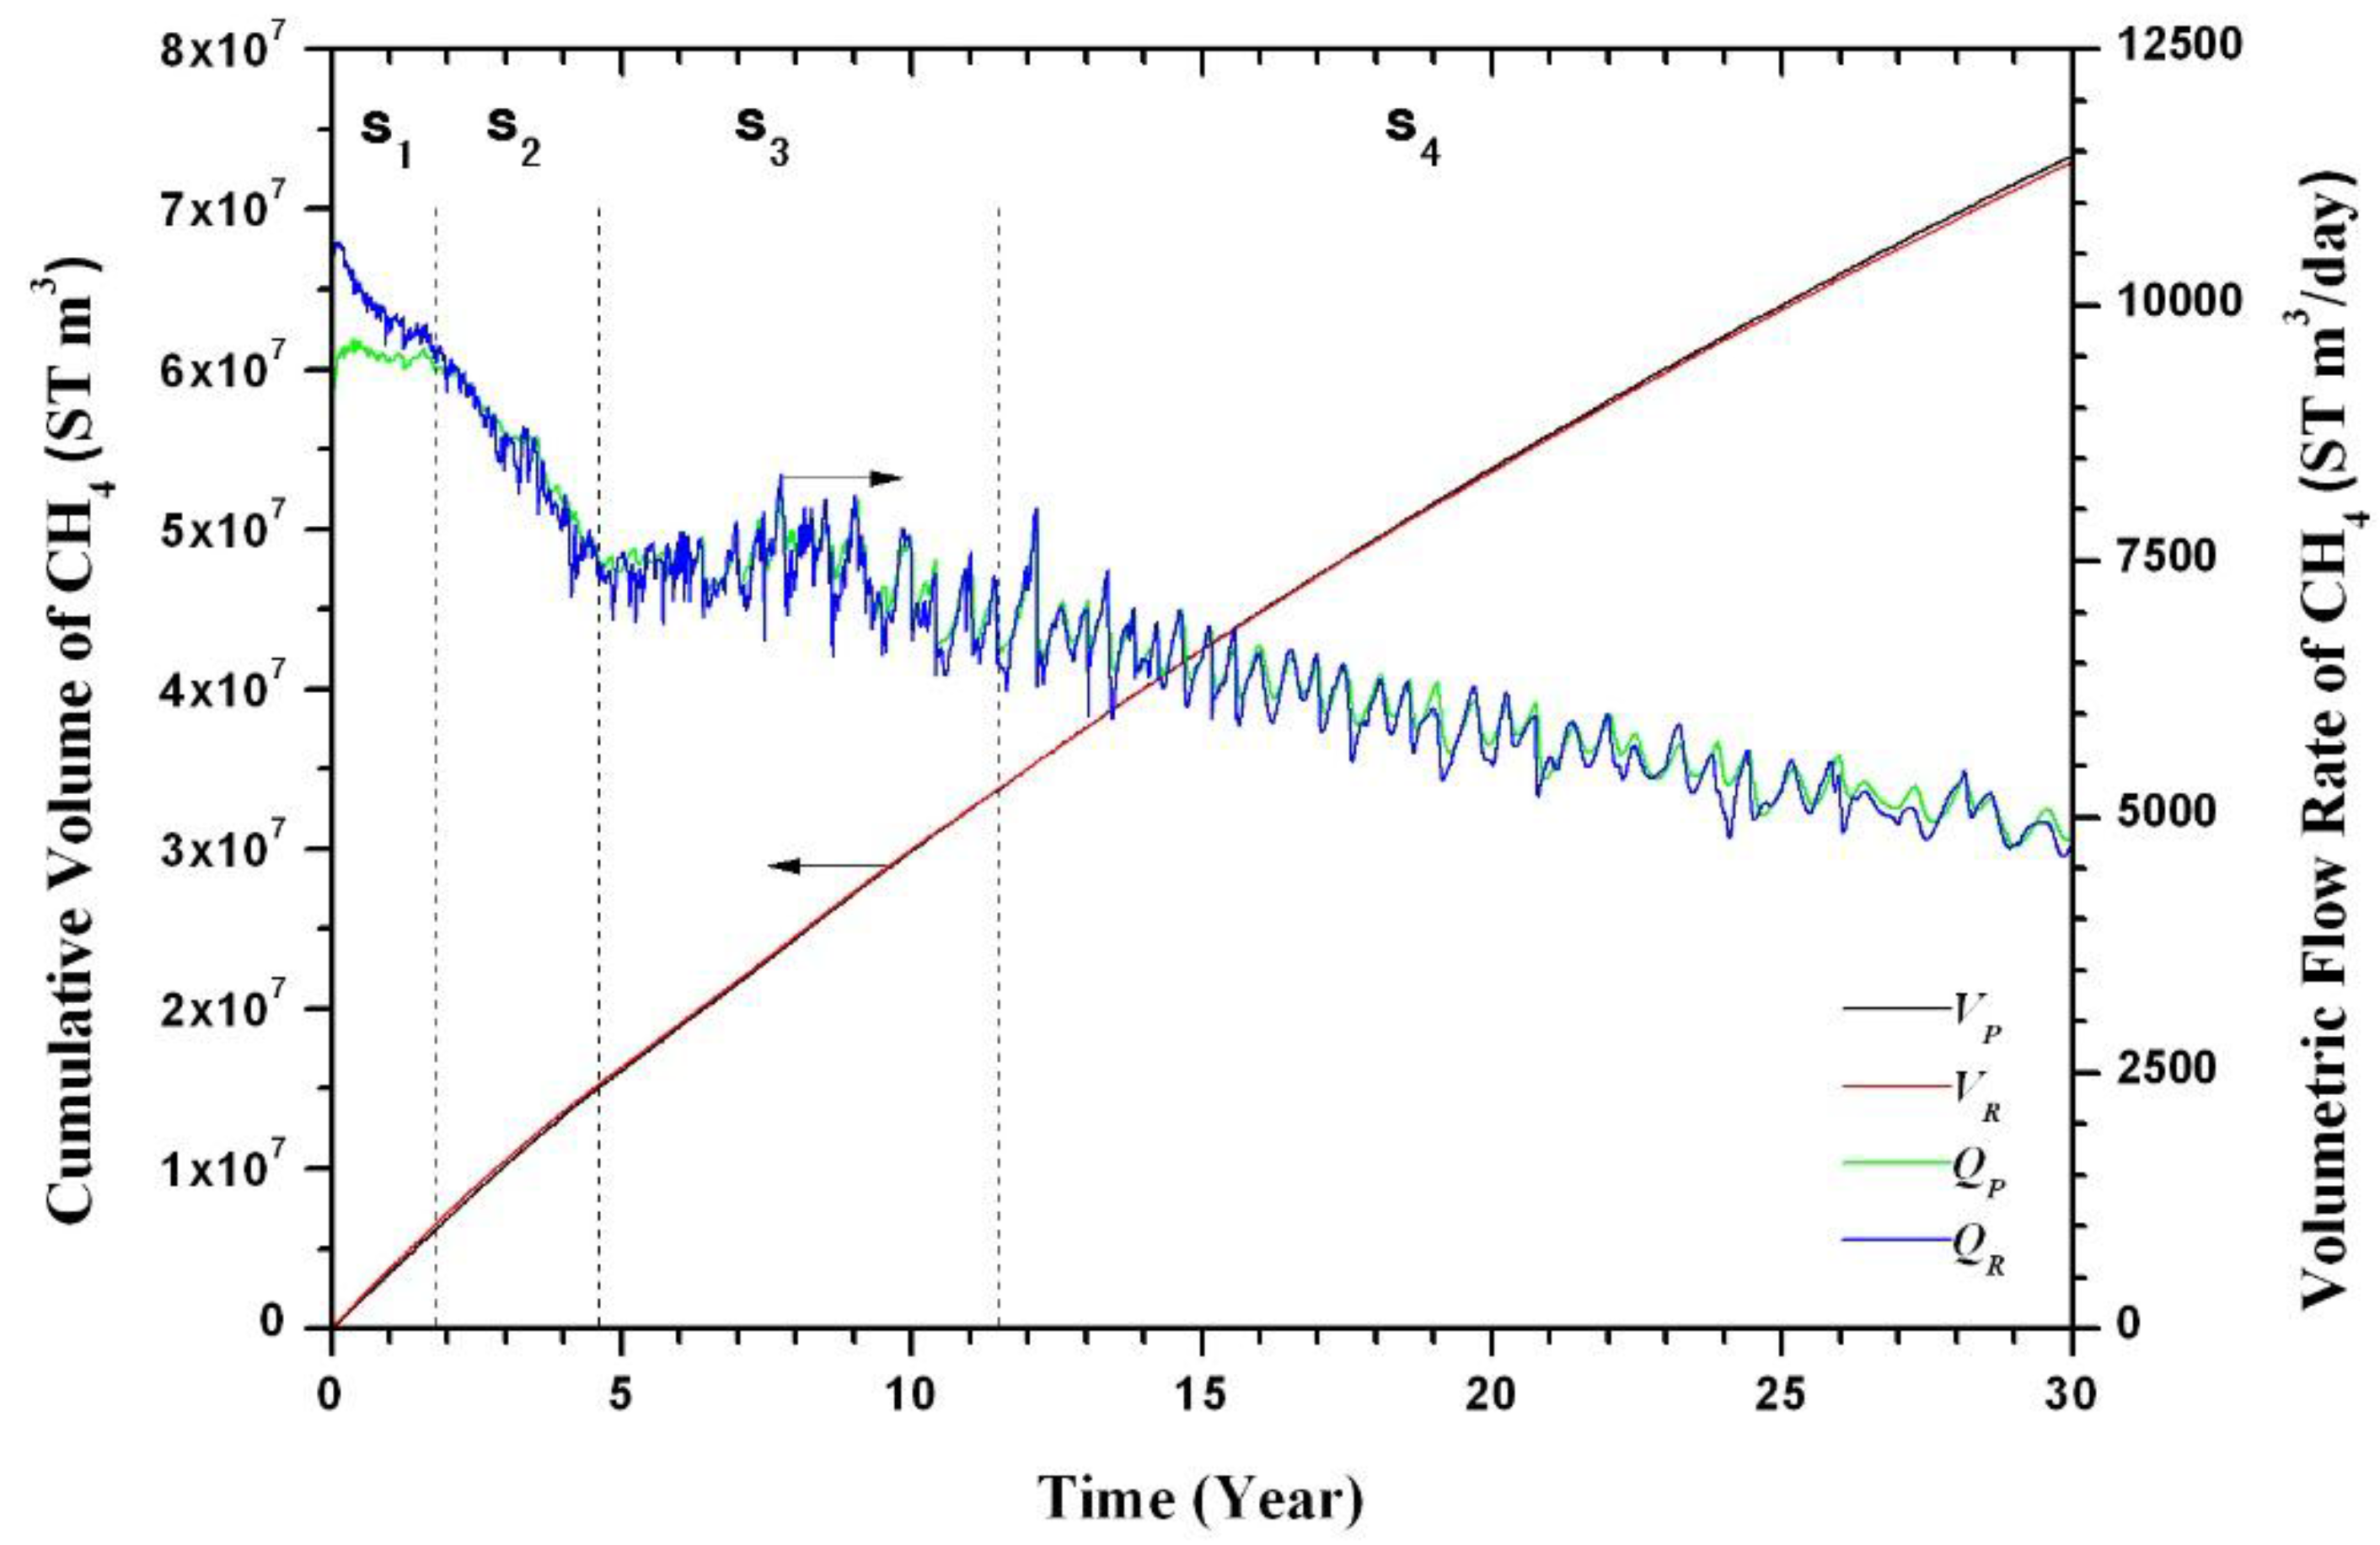
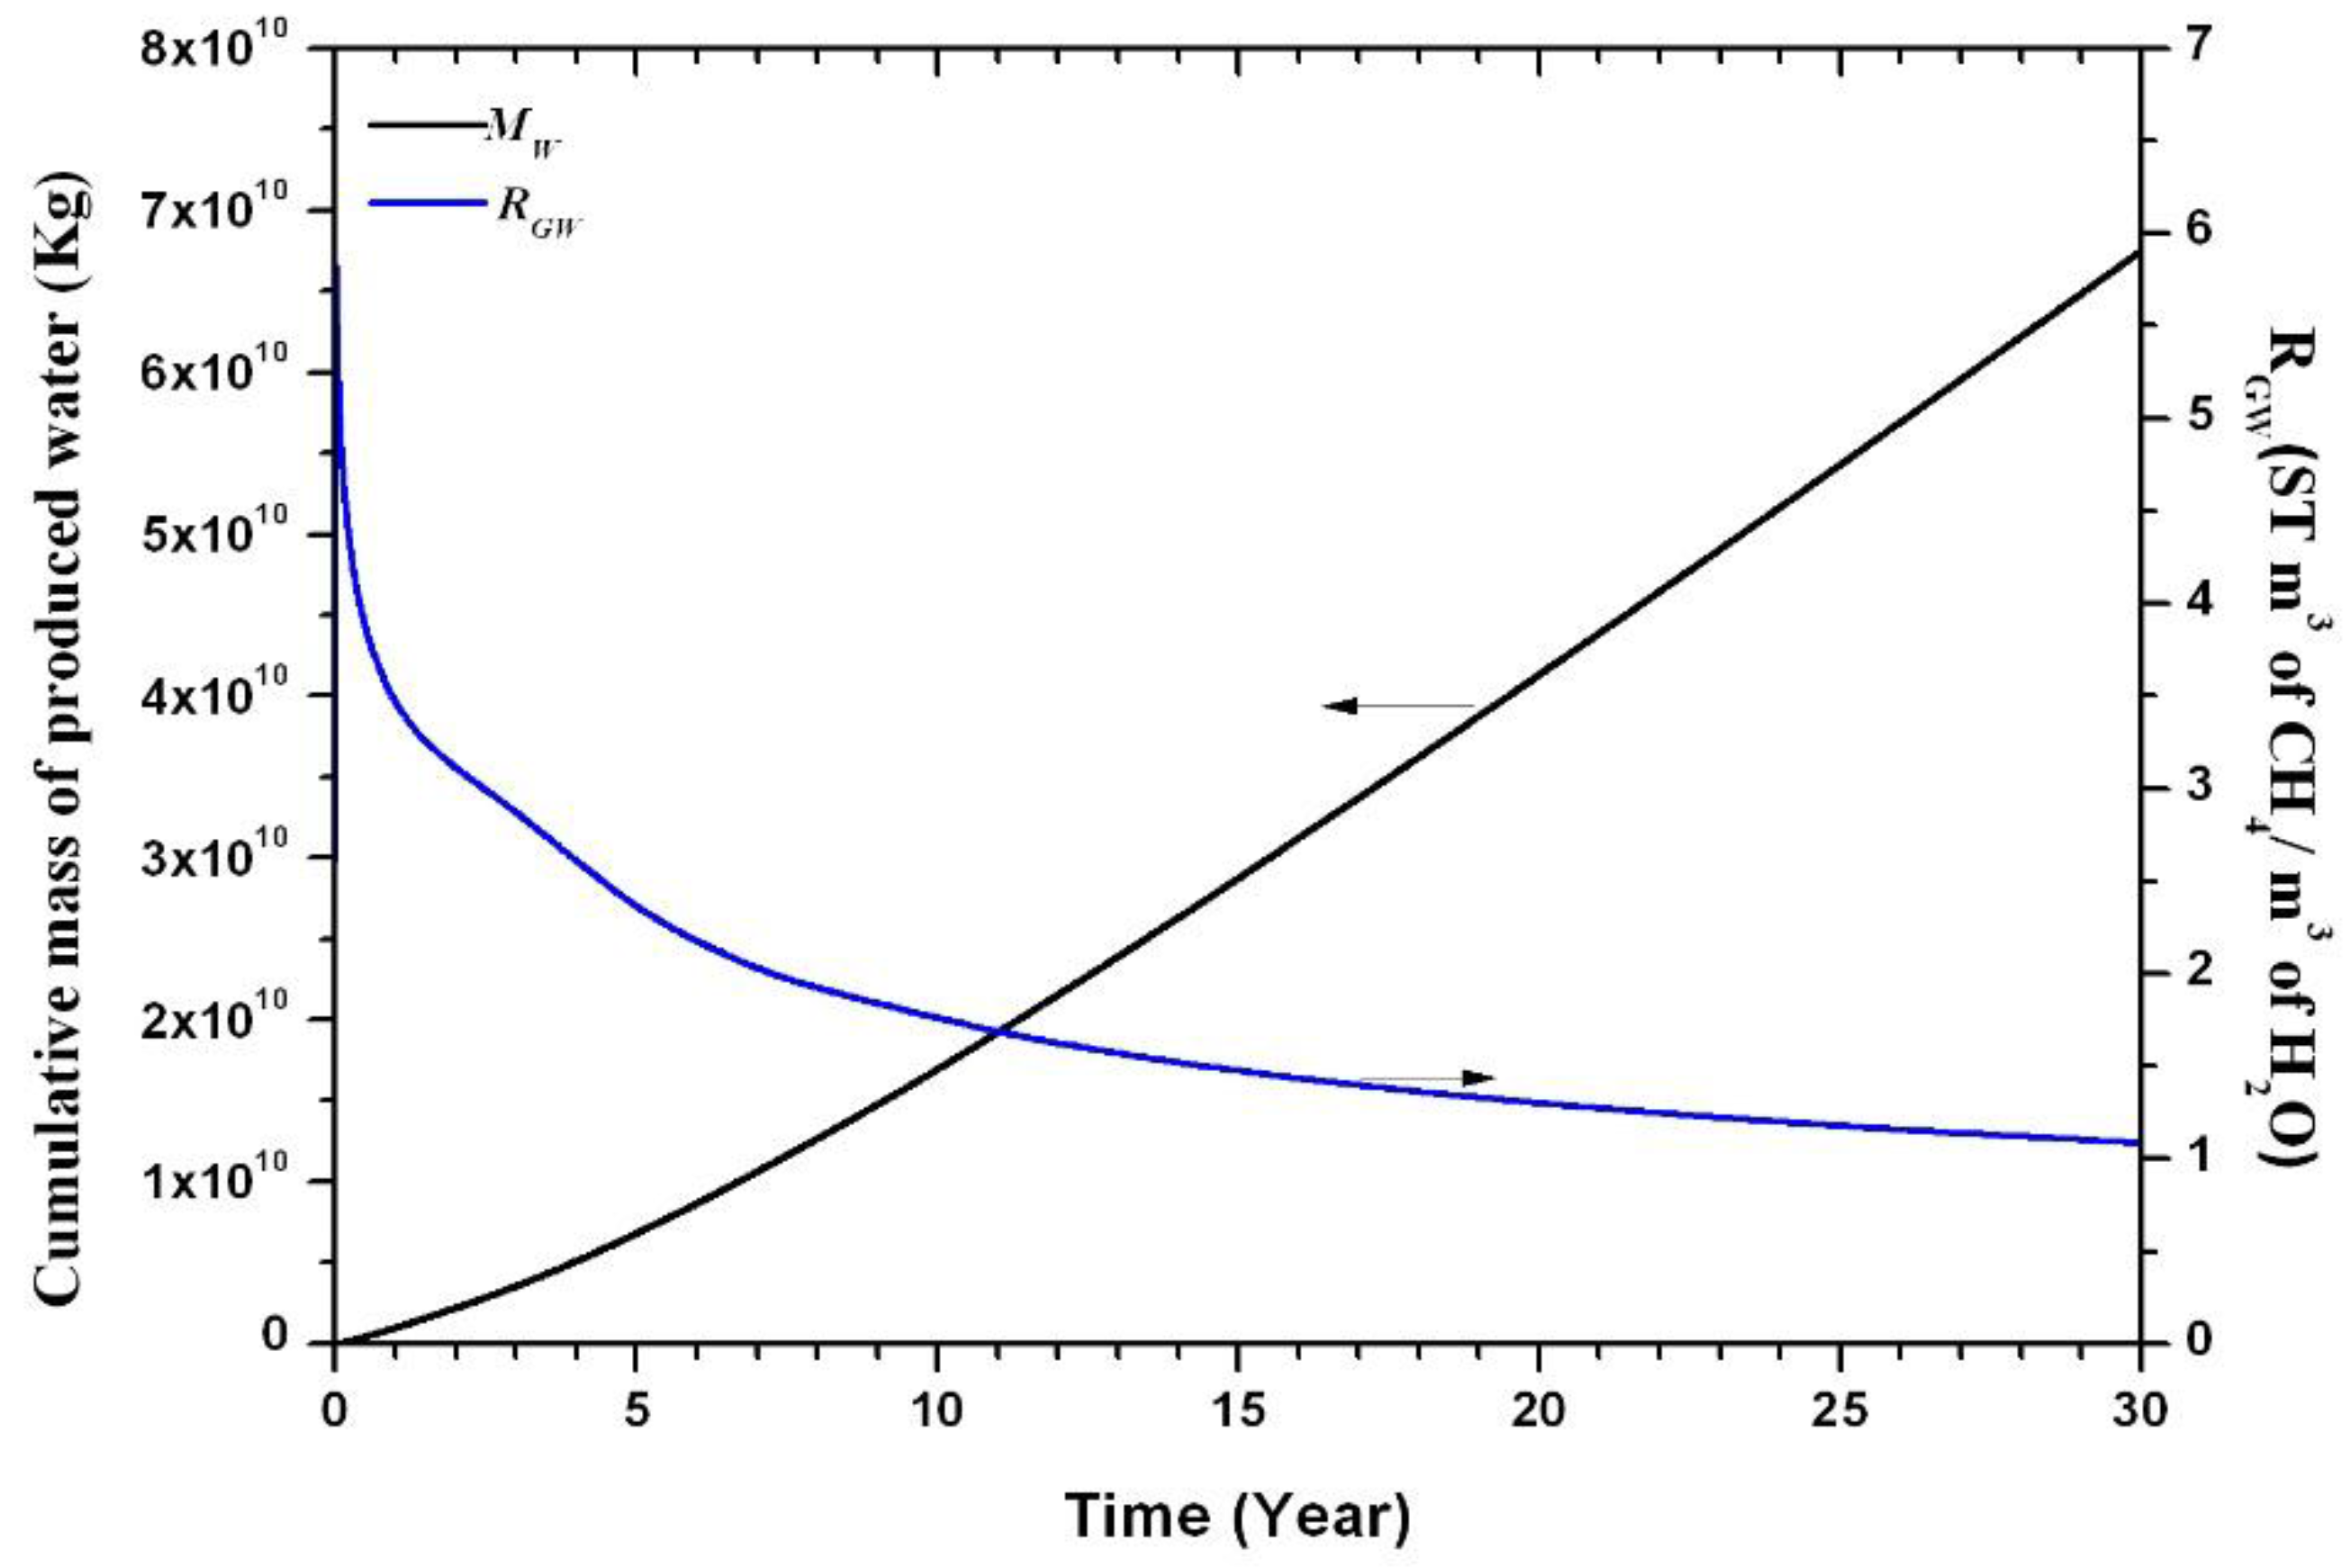
4.1. Gas and Water Production

Figure 7 shows the evaluations of the cumulative volume of produced gas (Vp), cumulative volume of dissociated gas (VR), volumetric flow rate of produced gas (Qp), and volumetric flow rate of dissociated gas (QR) overtime. As shown in Figure 7, the change of the volumetric flow rate of gas (Qp and QR) can be divided into four stages (S1–S4). In the S1 (0–1.8 years), the Qp and QR firstly reach to the maximum in 0.11 year (40 days). The maximum values for the Qp and QR are 9560 m3/day and 10,600 m3/day, respectively. Afterwards, in the remaining time of the S1, the value of the Qp keeps at approximately 9500 m3/day, and the QR decrease to 9500 m3/day. The QR is higher than the QP in the S1, because some of the dissociated gas remains in the hydrate reservoir. In the S2 (1.8–4.6 years), the Qp and QR rapidly decrease to approximately 7500 m3/day in a same rate. The decrease of QR and Qp is caused by the reduction of the hydrate saturation near the vertical well. In the S3 (4.6–11.5 years), the curves of Qp and QR fluctuate in a range from 7400 to 7800 m3/day, indicating that the rate of hydrate dissociation in this stage remains stable. It could be attributed to the fact that the water with a higher temperature in the underburden flows to the HBL-II, and the sensible heat of the water is applied for hydrate dissociation in this stage. This hypothesis will be discussed in the next figures of the temperature and hydrate distributions. In the last stage S4 (11.5–30 years), the Qp and QR gradually decrease from 7500 to 4700 m3/day, which is caused by the low permeability of the system.
The cumulative released and produced volumes of gas in this figure are consistent with the observations made on the relative magnitude of Qp and QR, and their evolution overtime. The total gas production is approximately 7.3 × 10⁷ ST m3 in 30 years. Thus, the average gas production rate in 30 years is 6.7 × 10³ ST m3/day, which is much higher than the previous study in the Shenhu Area of the South China Sea by GMGS-1 (211 ST m3/day) [48].
Moreover, the maximum gas production rate has the same order of magnitude of the first offshore methane hydrate production test in the Nankai Though, Japan (2 × 10⁴ ST m3/day) [49]. This work is based on the local conditions at GMGS2-Site 8 with limited resources. The actual gas production from hydrate deposits in the Dongsha area may obtain more economically feasible.
Figure 8 shows the evolution of the cumulative mass of the produced water (MW) and gas-to-water ratios (RGW = VP/MW) overtime. As shown in Figure 8, MW increases continuously, and the rate of water production increases over time. The final MW is 6.75 × 10¹⁰ kg, which leads to an average water production rate of 6.16 × 10⁶ kg/day. RGW also presents a continuous decreasing trend. After t = 30 days, RGW is smaller than 5, which is uneconomical [50]. The large amount of water production is mainly caused by the thin overburden of this system. The thickness of the overburden is just 9 meters, and the pressure difference between seawater and wellbore is over 3.5 MPa. Therefore, seawater easily flows through the overburden to the wellbore.

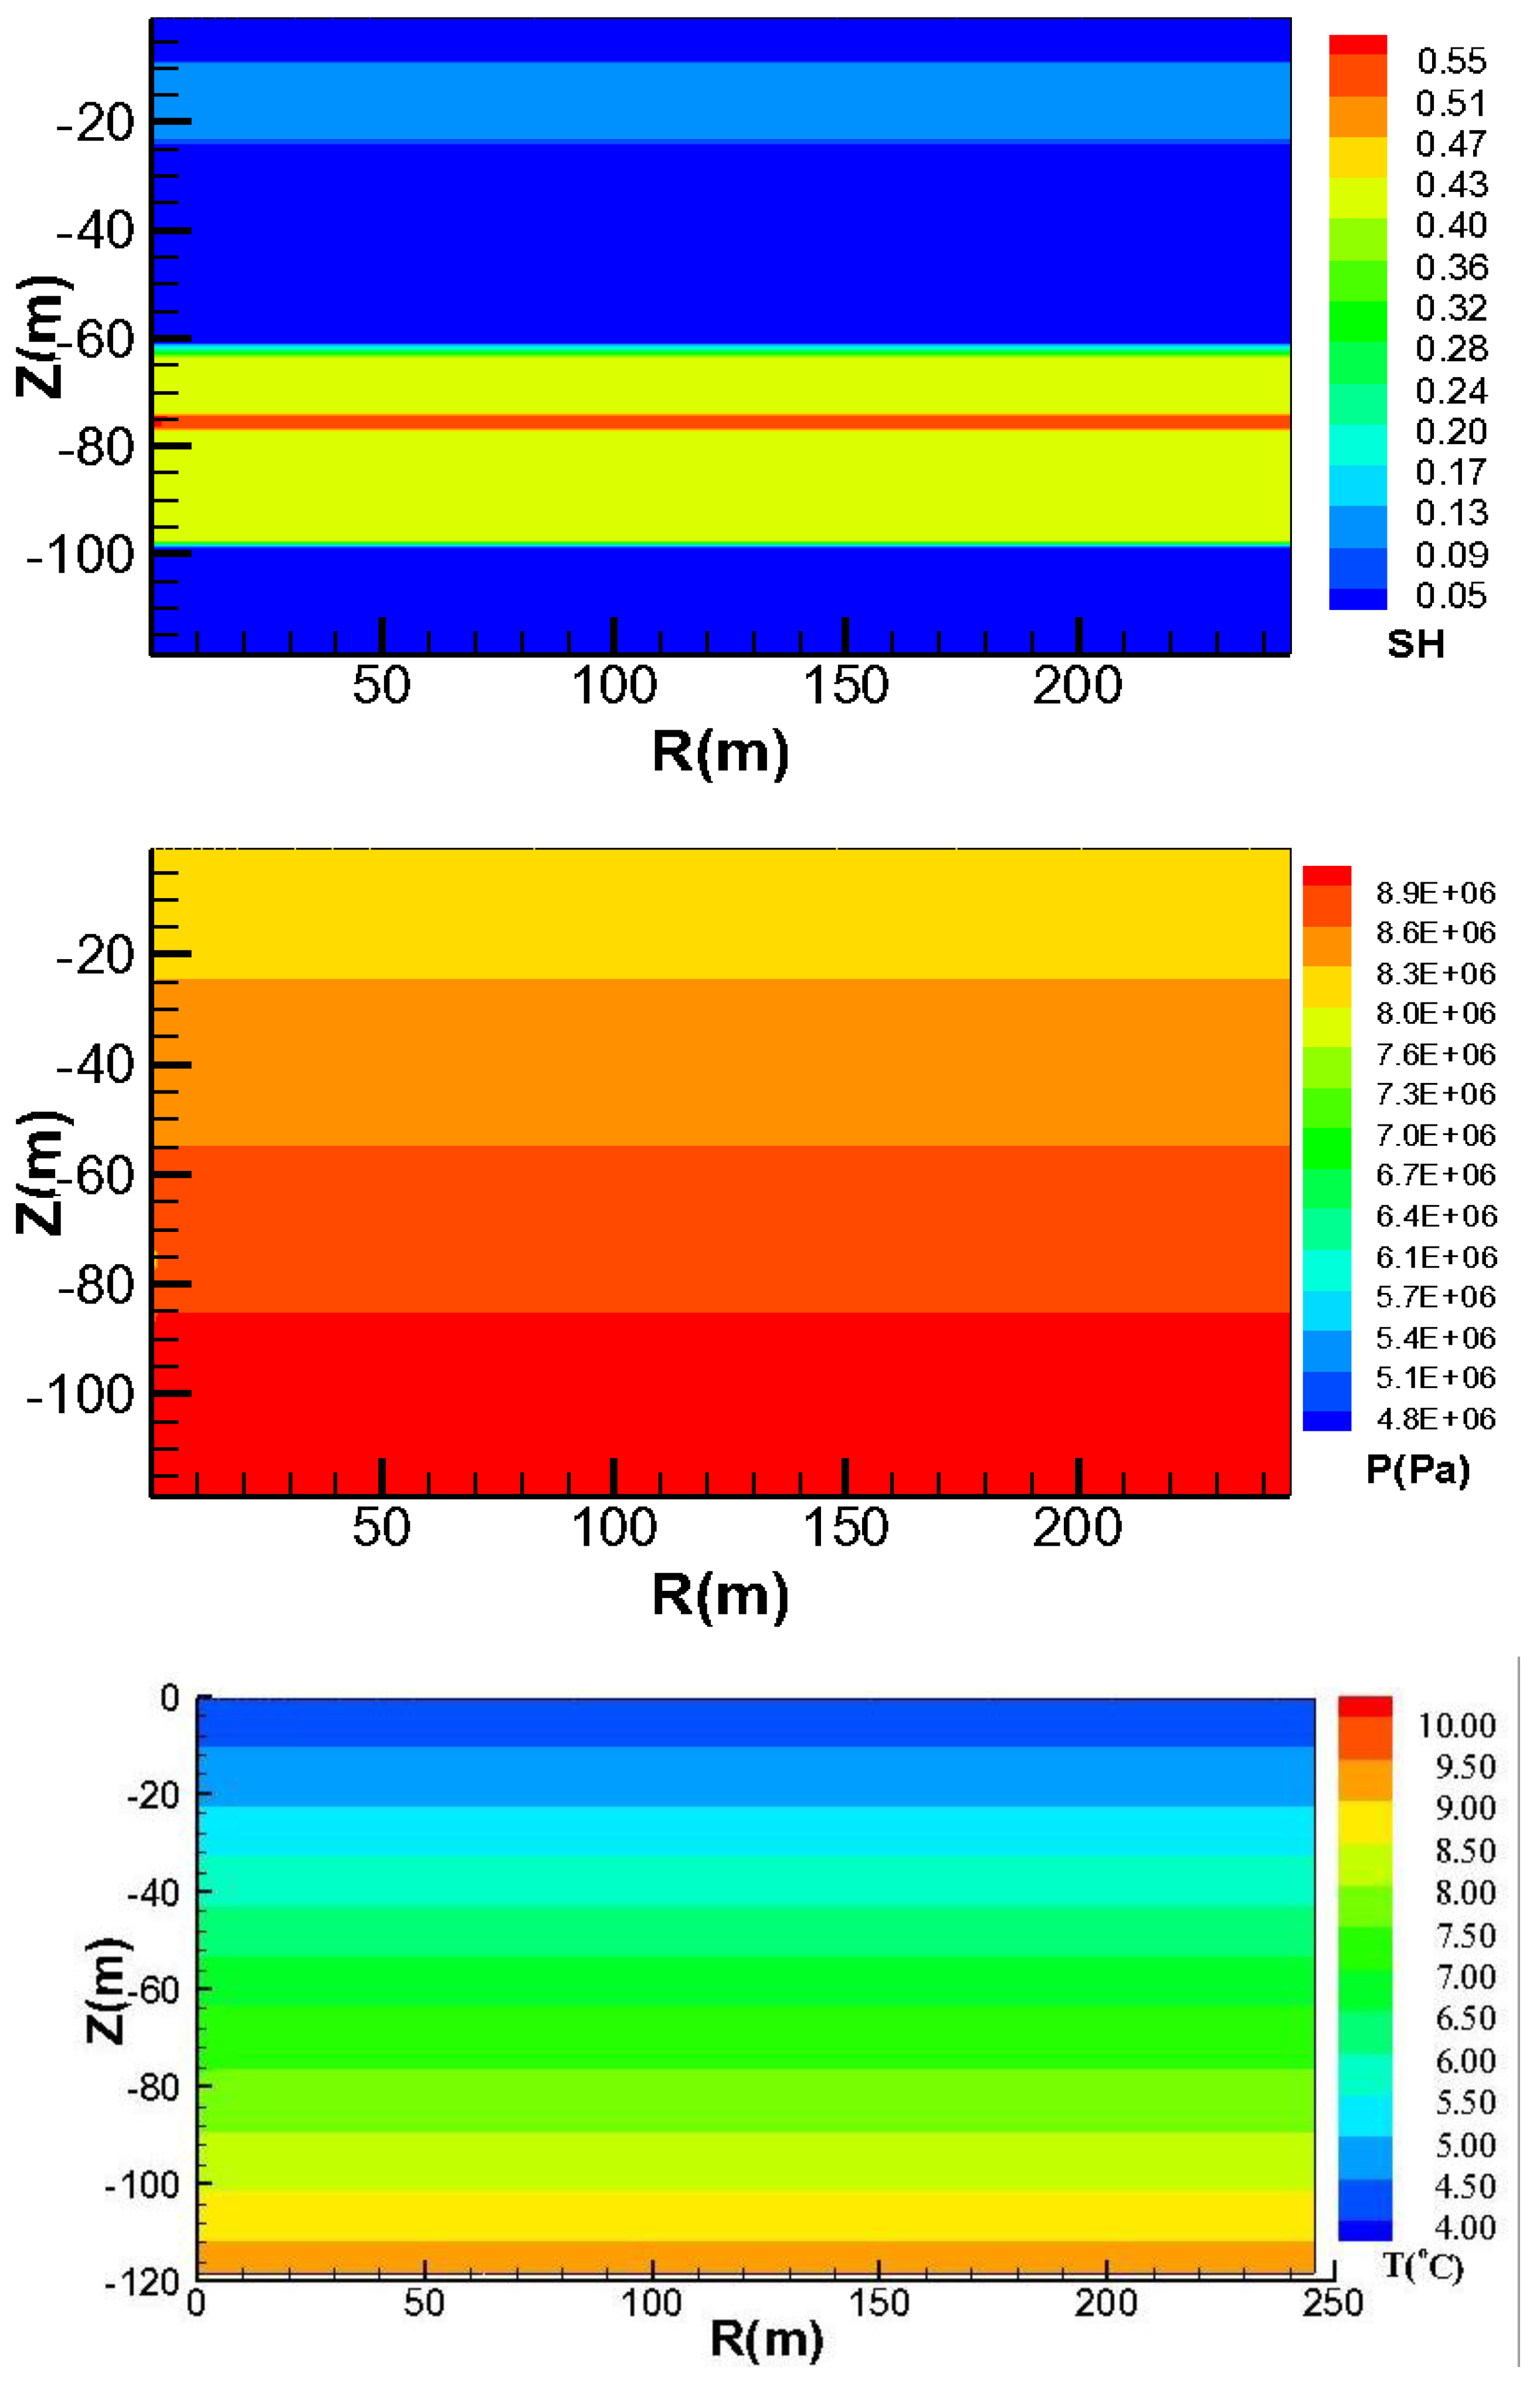
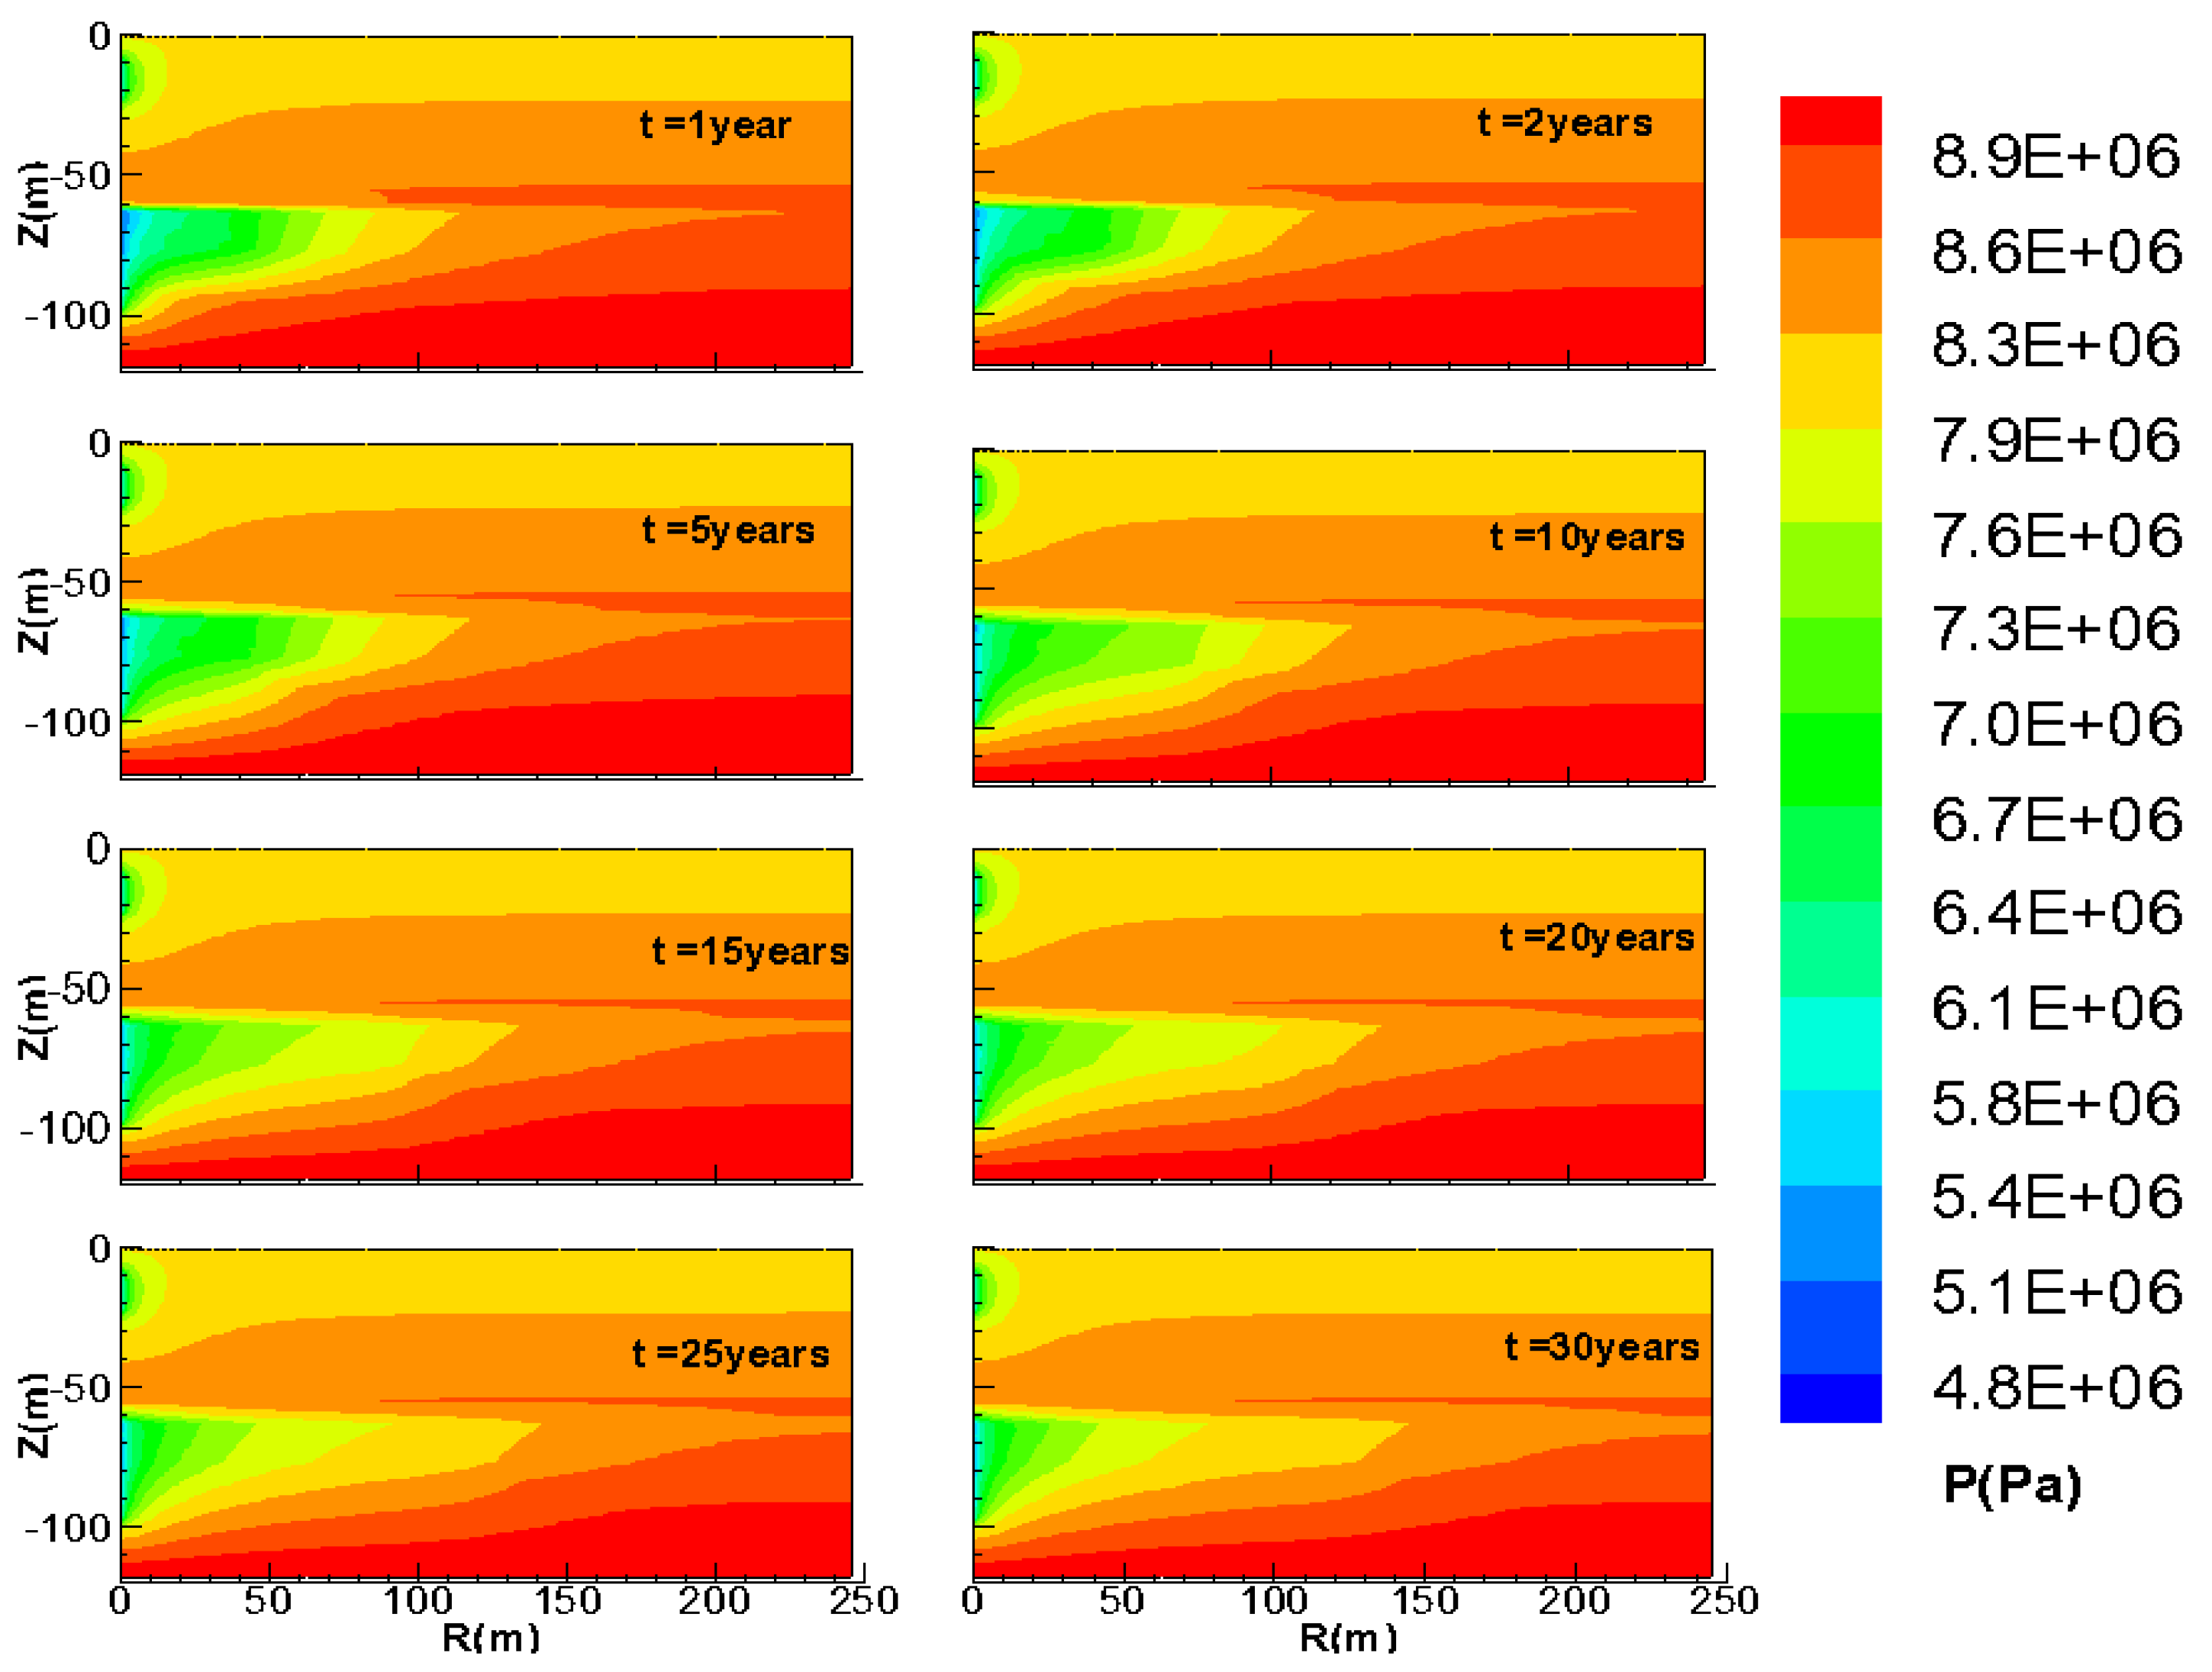
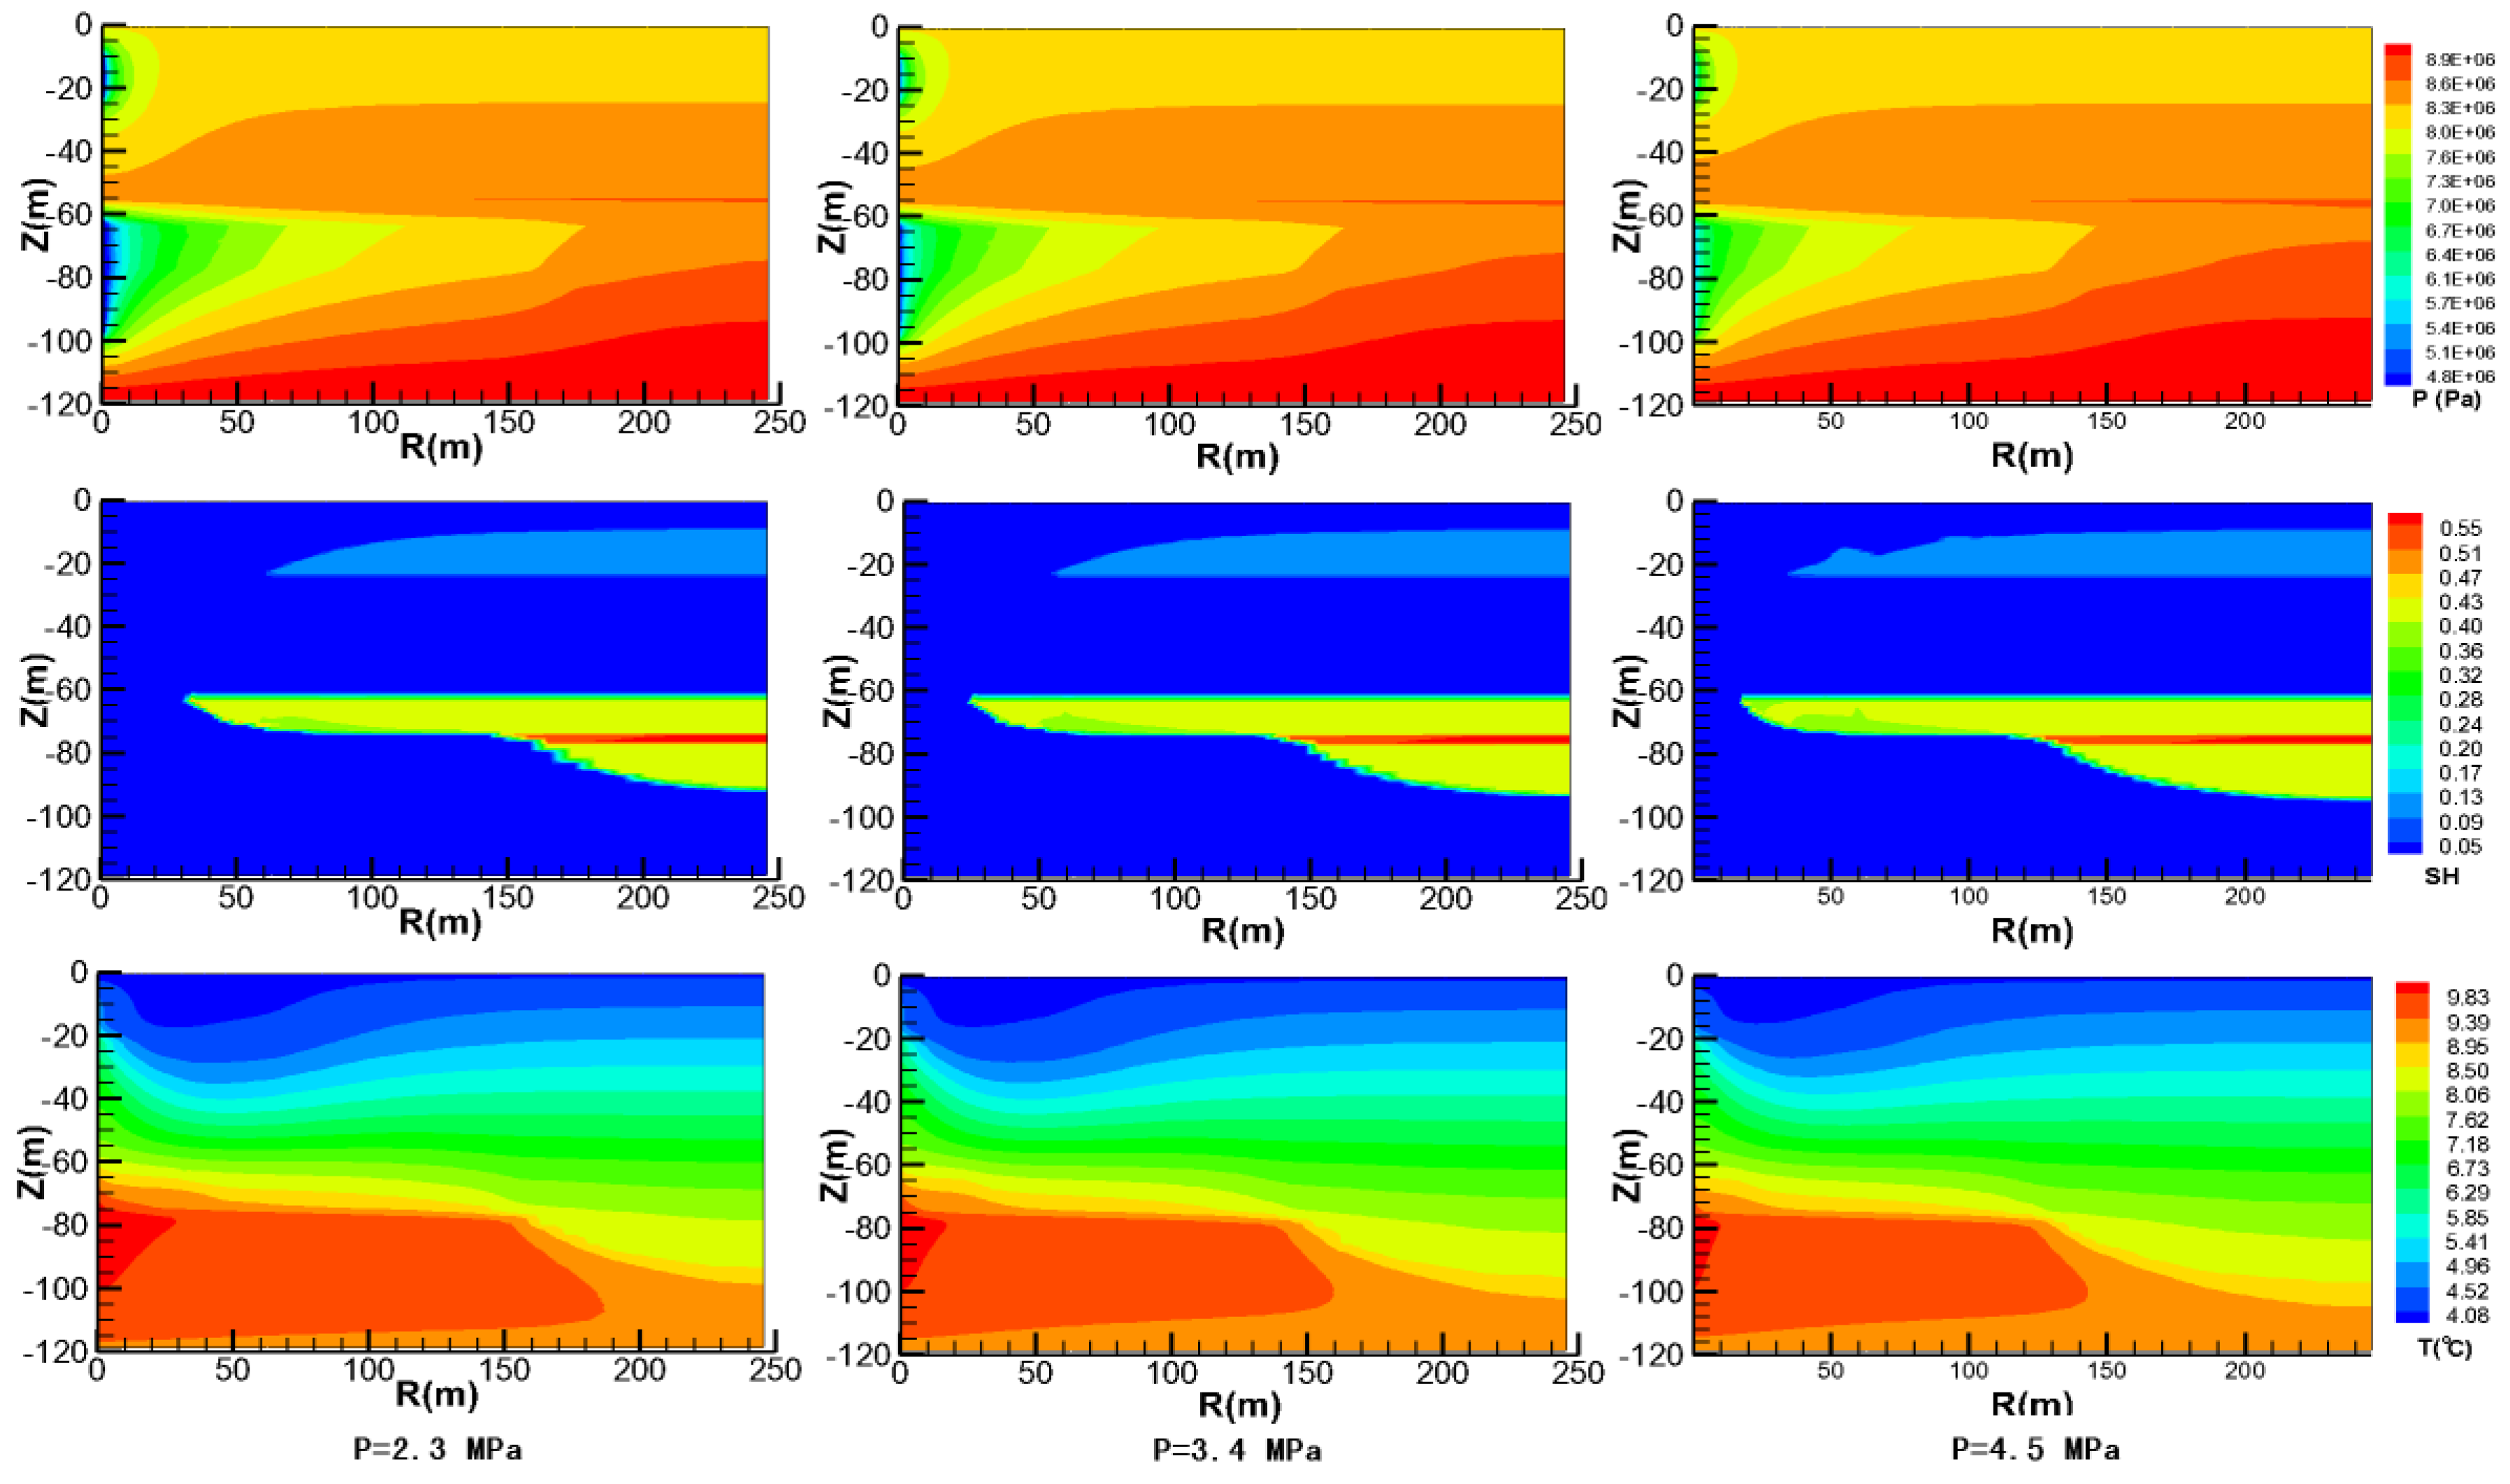
4.2. Spatial Distributions of P

Figure 9 shows the evolution of pore pressure distribution in the hydrate reservoir over time. As shown in Figure 9, the carbonate layer has initially lower permeability than the other layers, resulting in an obvious pressure interrupt between the HBL-II and the middle mud layer. Meanwhile, the 3m-layer of massive hydrate in the HBL-II has initially higher permeability, resulting in a larger pressure drop over a larger distance. As shown, the largest pressure drops in the domain occur near the well and correspond to the hydrate dissociation region. As time advances, the region effected by depressurization increases continuously in the HBL-II. As also shown in Figure 9, the pressure increases in the vicinity of the borehole after 10 years. The reason for this behavior may be that the dissociation gas migrates to the vicinity of the borehole because of the pressure gradient. The high gas saturation causes the increase of the relative permeability in this region before 10 years, which leads to a low pressure area. Afterwards, the decrease of the gas saturation in the vicinity of the borehole leads to the decrease of the relative permeability, causing the increase of pressure in the vicinity of the borehole. However, the pressure distributions in the HBL-I have little change, which indicates the influence by depressurization in the HBL-I has little change over time.

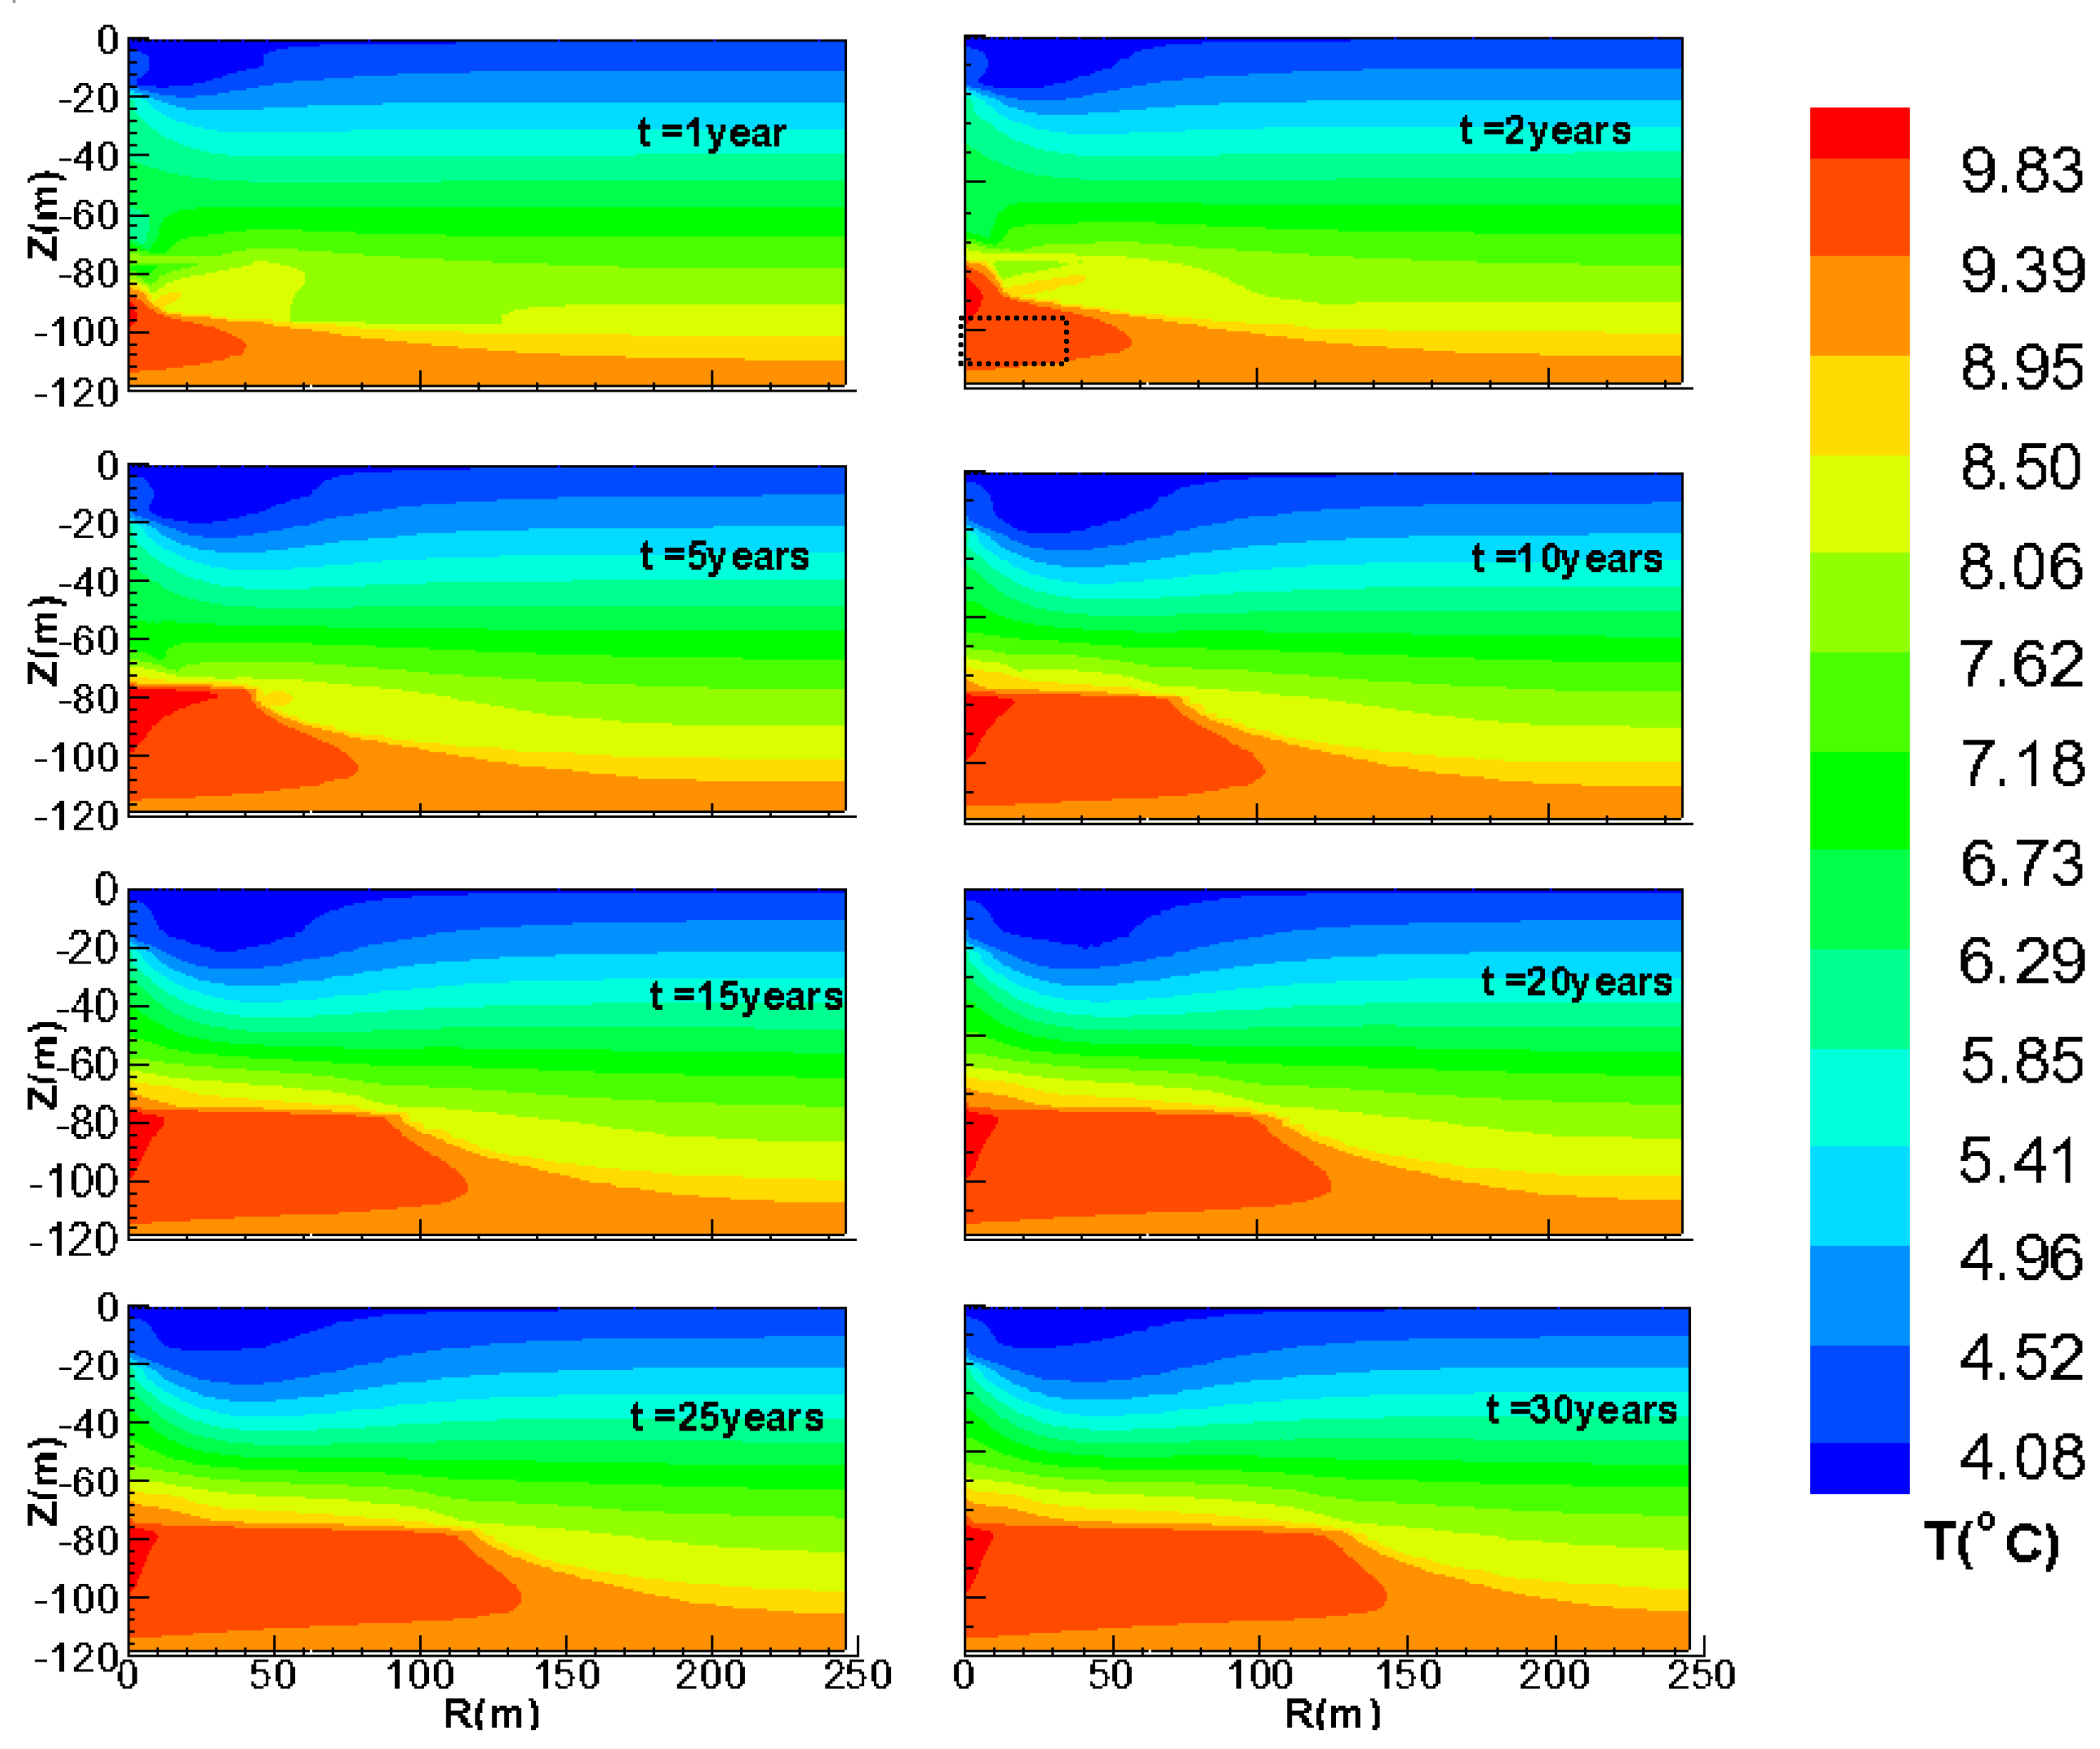
4.3. Spatial Distributions of T

Figure 10 shows the evolution of the T-distribution in the entire hydrate reservoir over time. As shown in this figure, the area in the HBL-I near the well is cooling down, which is due to the endothermic reaction of hydrate dissociation and the penetration of cooler water from the overburden.
The cooling area expands from t = 1–5 years. Afterwards, it remains unchanged, indicating that the corresponding area for hydrate dissociation also does not expend from t = 5–30 years, or there is an equilibrium between the hydrate dissociation (which may expend) and the heat transport from the environment. On the other hand, the area in the HBL-II near the well is continuously warmed up, and this area gradually expands from t = 1–30 years. This is because the warmer water from the underburden enters the system. The low temperature region (box with black dots line) appears in the figure of temperature distribution at t = 2 years, which is caused by the endothermic nature of the hydrate dissociation. The low temperature region disappears in the next figure, because hydrate in this region is exhausted and the warm water flows from the underburden into the HBL-II. The dissociation of hydrate increases the permeability of the HBL-II, and enhances the mobility of the warm water from the underburden. Therefore, the warm area and the corresponding area for hydrate dissociation expend continually.

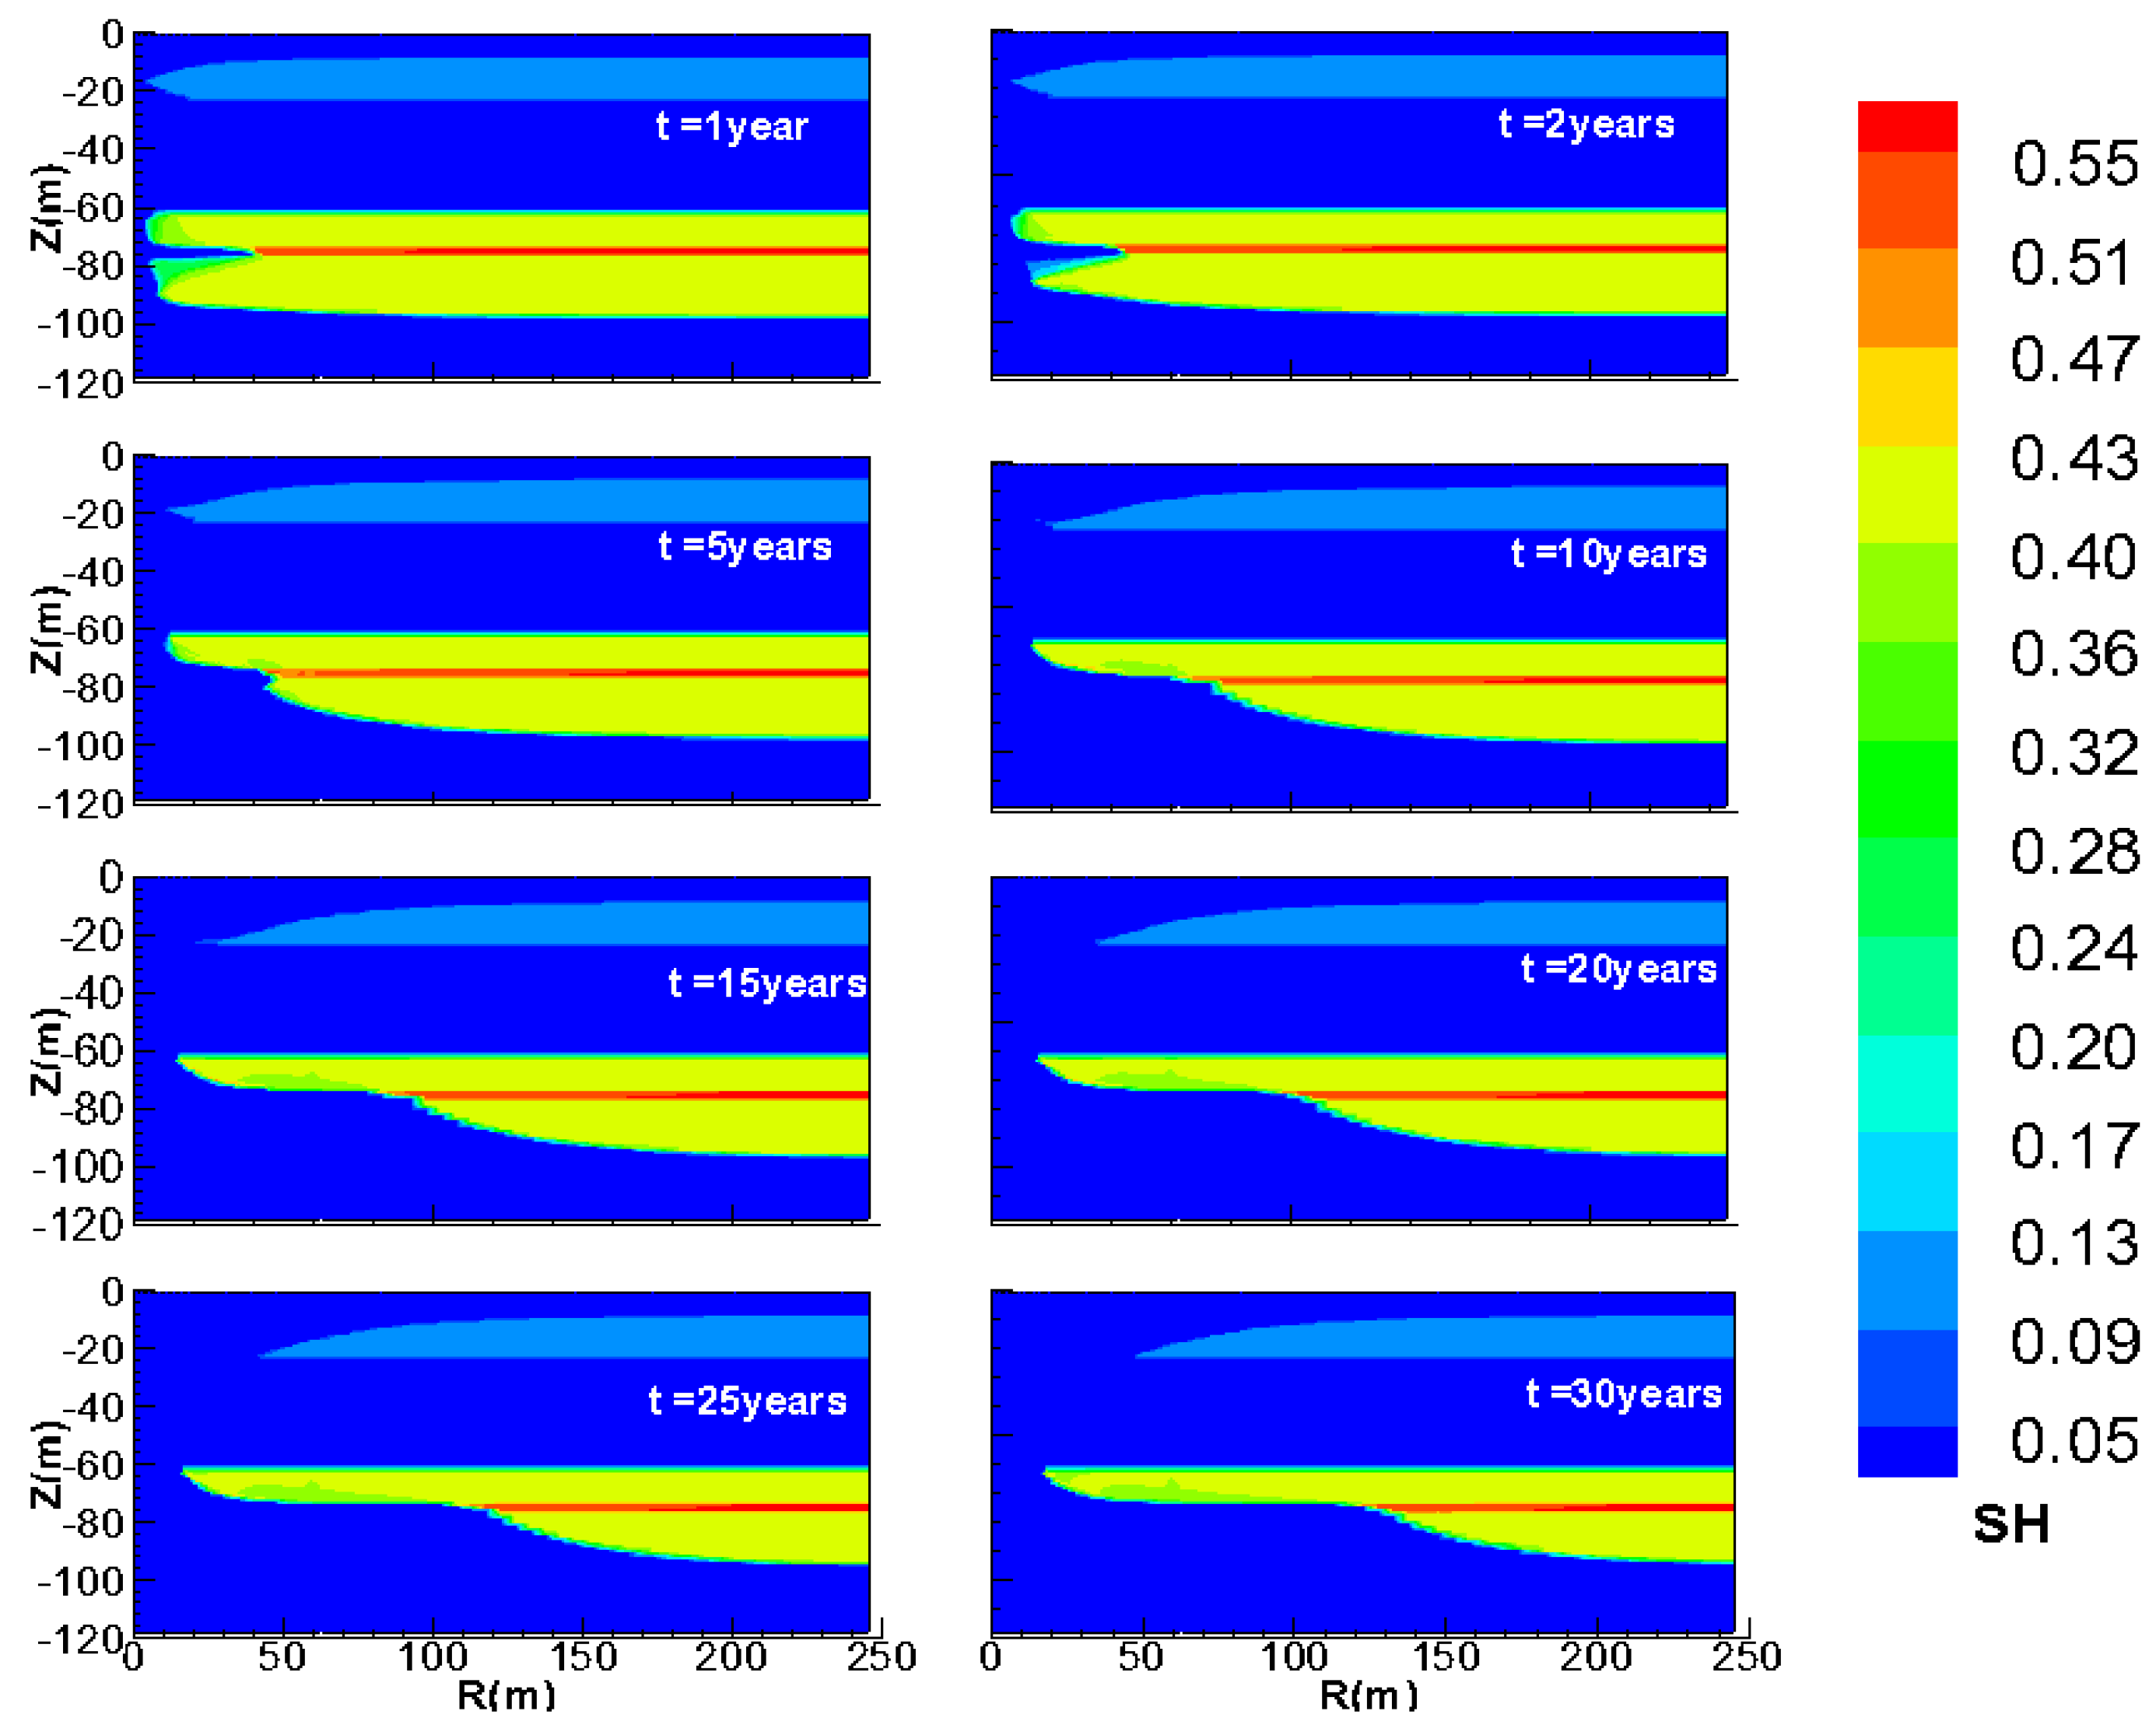
4.4. Spatial Distributions of SH

The evolution of SH distributions in Figure 11 shows the progressive destruction of the hydrate through dissociation. As seen in Figure 11, the hydrate dissociation area in the HBL-I expands slowly over time. The reason for the slow rate of hydrate dissociation in this layer is that (1) the pressure gradient for hydrate dissociation in HBL-I is lower than that in HBL-II; (2) the low permeability causes the limitation of the effect region by pressure drop; (3) the cool water from the overburden enters this layer. The change of the SH distribution of HBL-I has already been identified in the P-distribution of Figure 9 and T-distribution of Figure 10.
On the other hand, the change of SH distribution in the HBL-II can be divided into two stages. Stage 1 is shown in the figures of t = 1 year and 2 years. The 3-m massive hydrate layer is dissociated rapidly, and the dissociation region in the thin layer reaches to x = 50 m in the first year. At the same time, the other hydrate dissociation regions in the HBL-II expand very slowly. The dissociation region in the other layers in the HBL-II only reaches to x = 10 m in the first year. It may be because that the higher permeability in the massive hydrate layer leads to a higher rate of mass transfer, causing a higher hydrate dissociation rate in this layer. The rapid hydrate dissociation rate causes the lower temperature region in Figure 10. Stage 2 is shown in the figures of t = 5–30 years. In this stage, the hydrate in the layer below the massive hydrate layer is dissociated quickly, and the maximum region for hydrate dissociation reaches x = 190 m. This is due to the fact that the warm water from the underburden enters the lower layer of the HLB-II. However, the hydrate in the layer above the massive hydrate layer is dissociated slowly. The region for hydrate dissociation above the massive hydrate layer has almost no change from t = 5–30 years, which indicates that the warm water has little or no effect on the dissociation of hydrate in this region, because the warm water can directly flow into the wellbore through the dissociated massive hydrate layer.

5. Sensitivity Analysis of Production from GMGS2-Site 8 in Pearl River Mouth Basin

In this work, we investigated the sensitivity of gas production to the following conditions and parameters: the production pressure PW, the thermal conductivity kΘ, and the intrinsic permeability k of the reservoir.

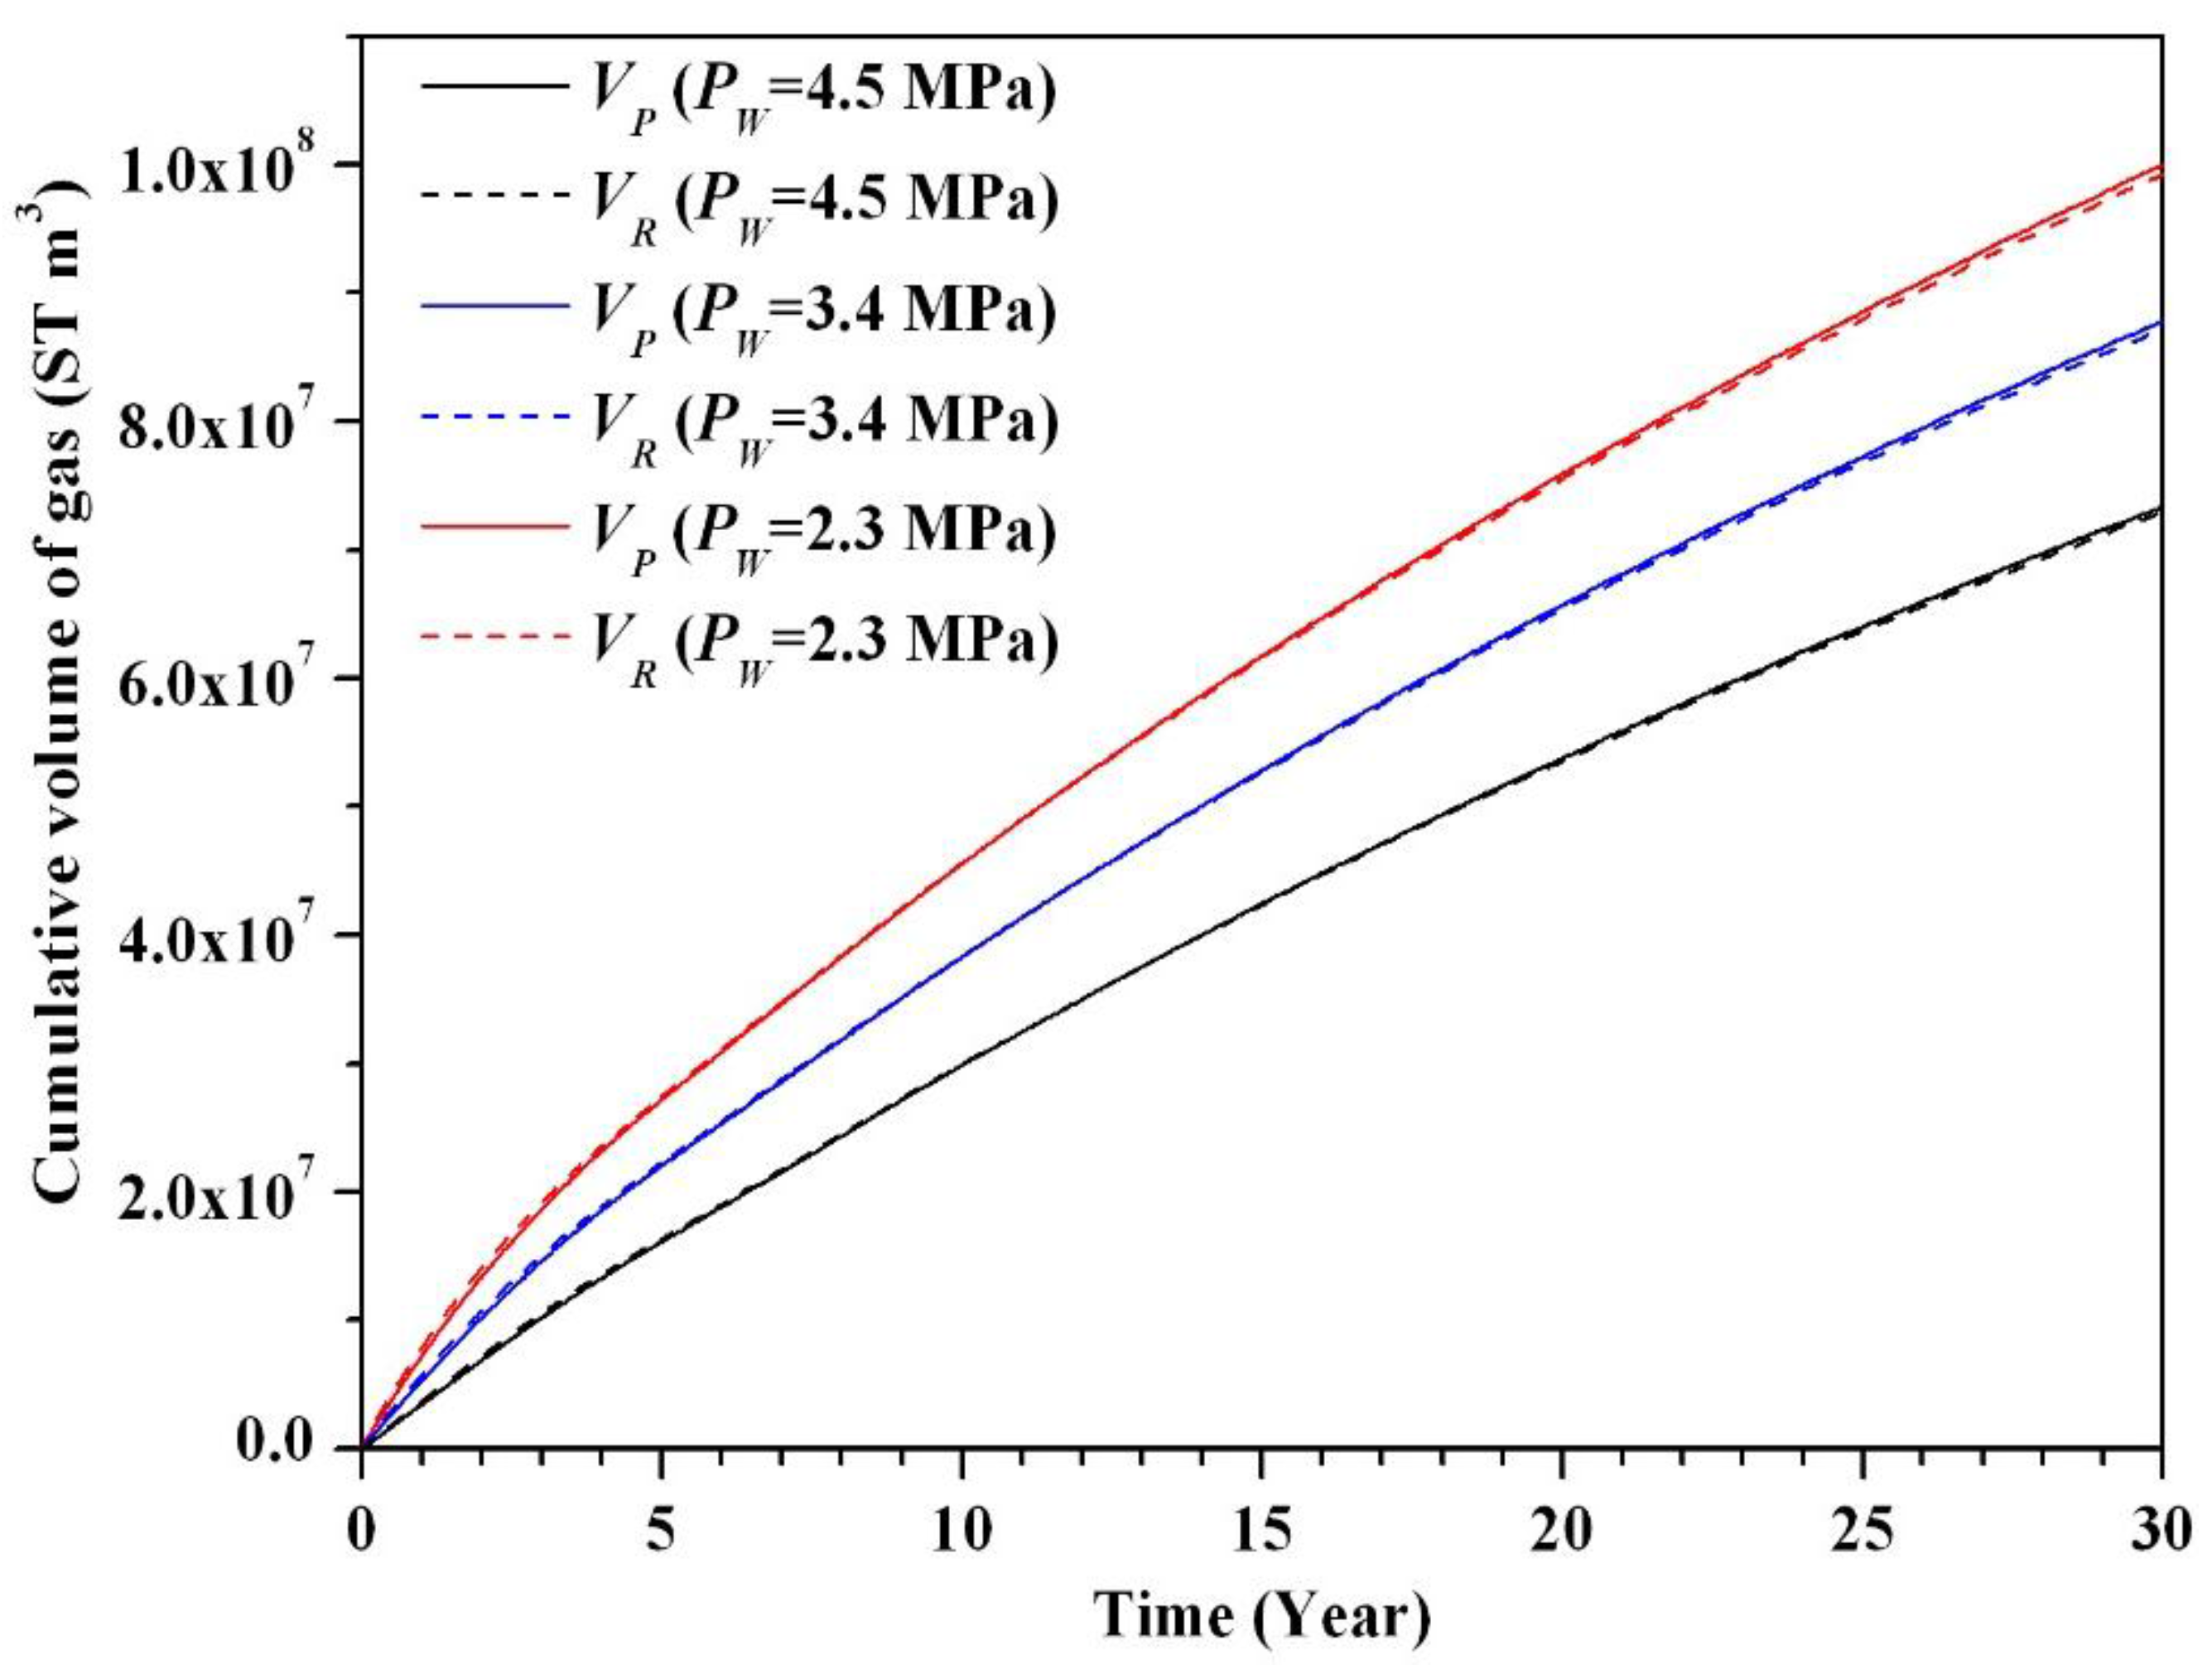
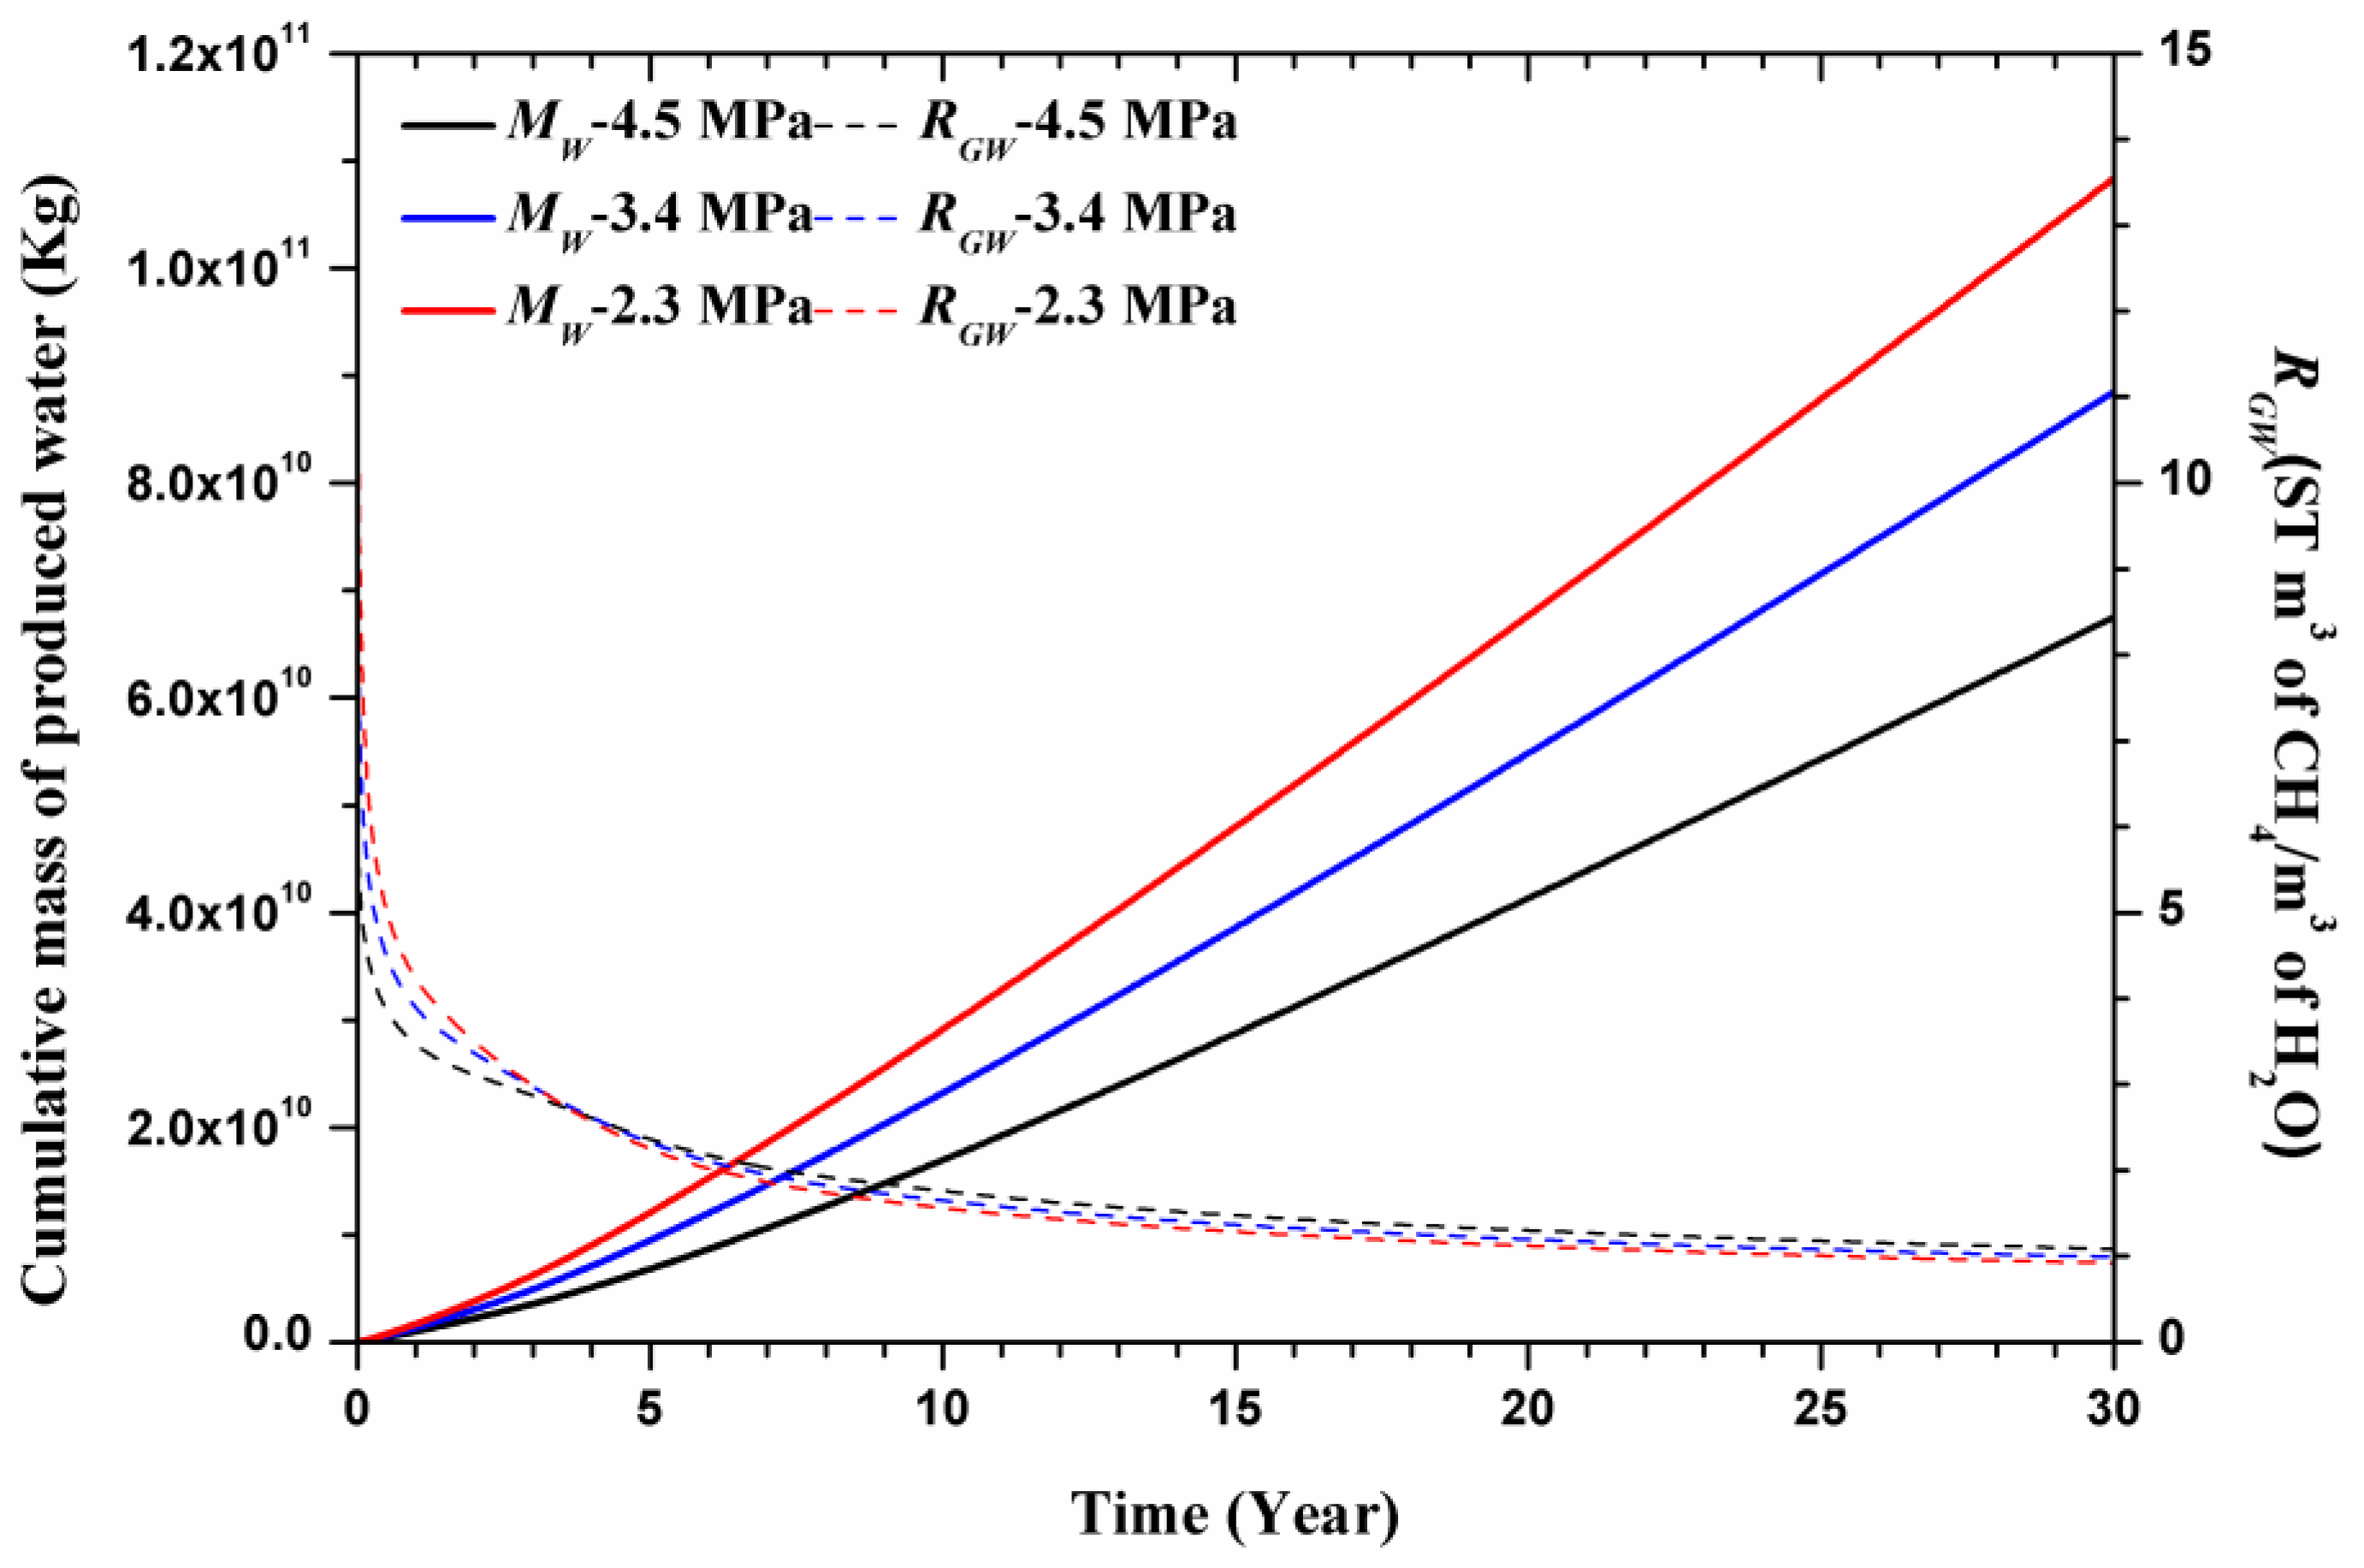
5.1. Sensitivity to the Production Pressure PW

Figure 12 and Figure 13 show the dependence of VP, VR, MW, RGW on the production pressure PW, respectively. As seen in Figure 12, the VP and VR increase with the decrease of the production pressure PW. The finial cumulative volumes of gas production for the cases with the PW = 2.3 MPa, 3.4 MPa, and 4.5 MPa are 1.0 × 10⁸ ST m3, 8.8 × 10⁷ ST m3, and 7.3 × 10⁷ ST m3, respectively. Thus, the corresponding average gas production rates are 9.1 × 10³ ST m3, 8.0 × 10³ ST m3, and 6.7 × 10³ ST m3, respectively. Obviously, the decrease of the PW can enhance the hydrate dissociation rate, which is caused by the larger pressure driving force for hydrate dissociation (difference between the pore pressure and the hydrate dissociation pressure) and the large pressure gradient for the movement of the warm water from the underburden to the HBL-II. When PW decreases from 4.5 to 3.4 MPa, the volume of gas production increases by 20.5%, and when PW decreases from 3.4 to 2.3 MPa, the volume of gas production increases by 13.6%. Additionally, the lowest PW is 2.3 MPa, which is lower than the quadruple point of methane hydrate (2.60 MPa [51]). However, the ice blocking does not happen in this case.
As seen in Figure 13, the cumulative mass of water production increases with the decline of the PW. The finial cumulative masses of water production for the cases with the PW = 2.3 MPa, 3.4 MPa, and 4.5 MPa are 1.08 × 10¹¹ Kg, 8.85 × 10¹⁰ Kg, and 6.75 × 10¹⁰ Kg, respectively. The RGW in the case with a lower production pressure before t = 3.7 years (1350 days) is higher. However, after t = 3.7 years, the RGW in the case with a lower production pressure is lower. The final RGW for the cases with the PW = 2.3 MPa, 3.4 MPa, and 4.5 MPa are 0.92, 0.99, and 1.09, respectively. The final RGW for these cases are close, because the gas production and water production both increase with the decrease of the PW.
Figure 14 shows the evolution of P, SH, and T distributions at t = 30 years for the cases with the PW = 2.3 MPa, 3.4 MPa, and 4.5 MPa, respectively. As seen in this figure, the regions effected by the depressurization, the hydrate dissociated area, as well as the low-temperature region in the HBL-I and high-temperature region in the HBL-II enlarge with the decline of the production pressure. The reason is that the larger pressure drop can supply the higher pressure driving force for hydrate dissociation, and the lower PW can enhance the flow rates of the water in the overburden and underburden into the hydrate bearing layers. In addition, the temperature distribution in the case with the PW = 2.3 MPa indicates that the temperatures of the HBL do not decrease to the freezing point, even when the PW is lower than the quadruple point.

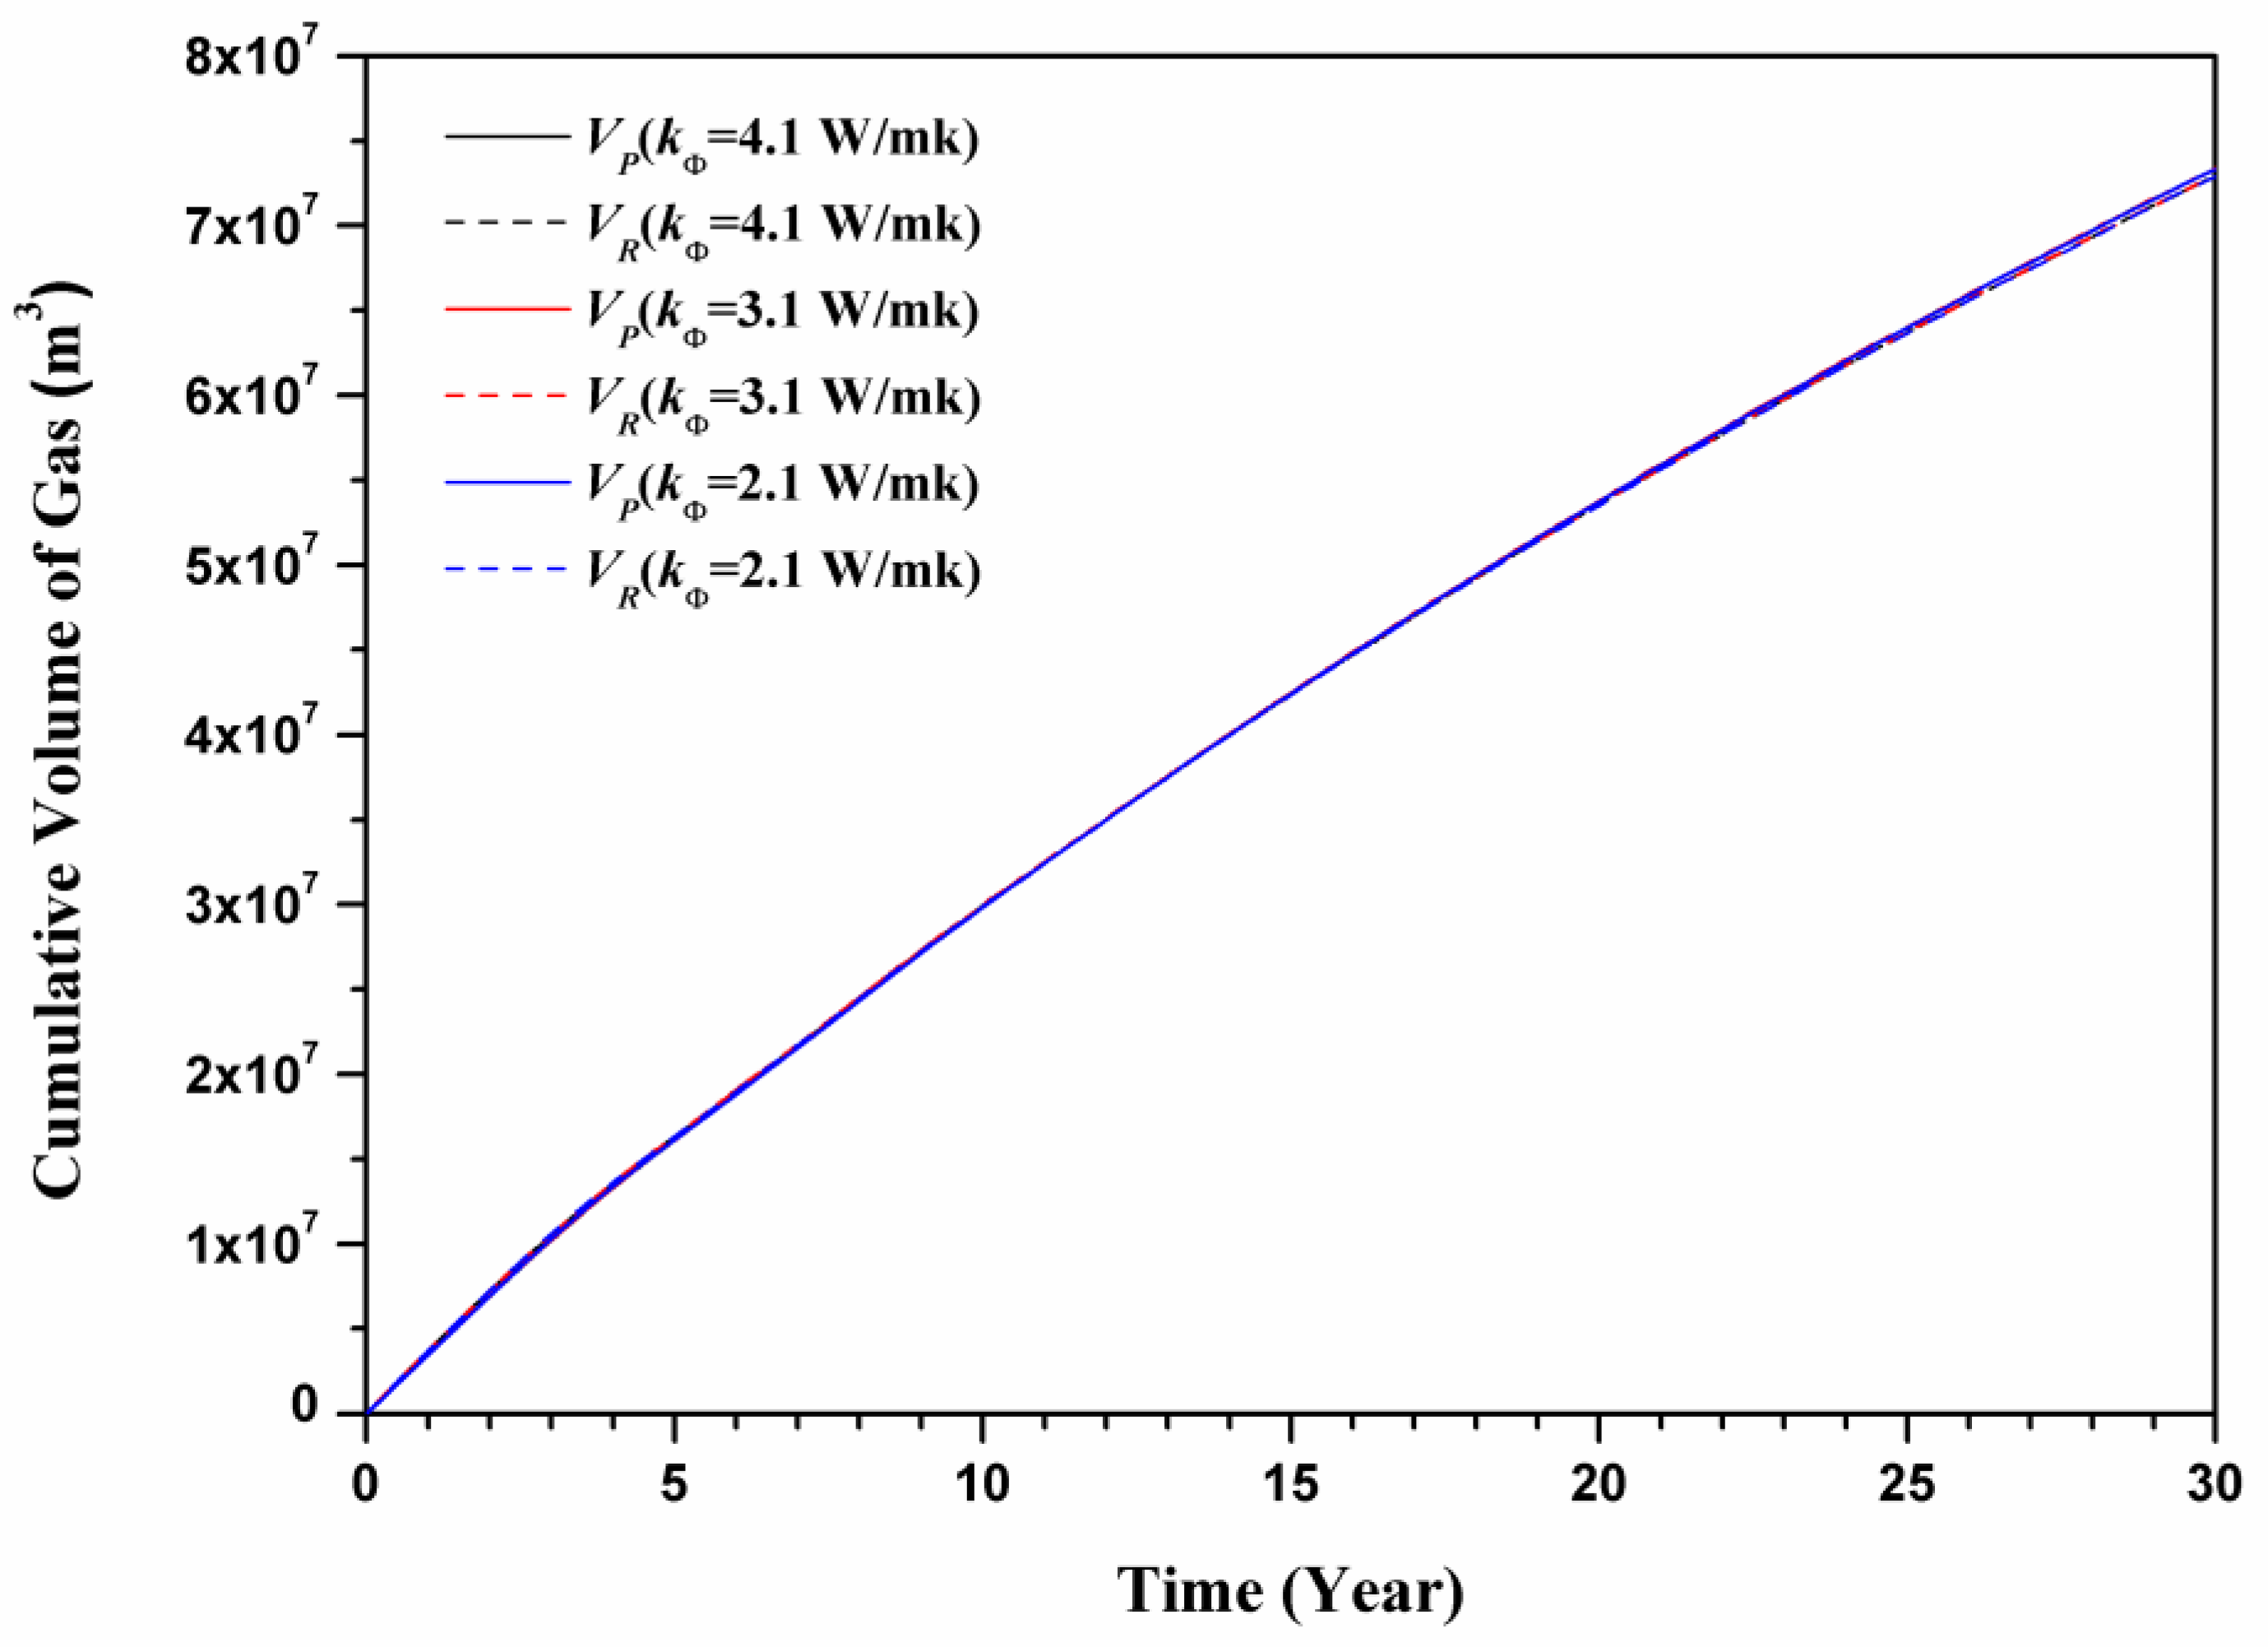
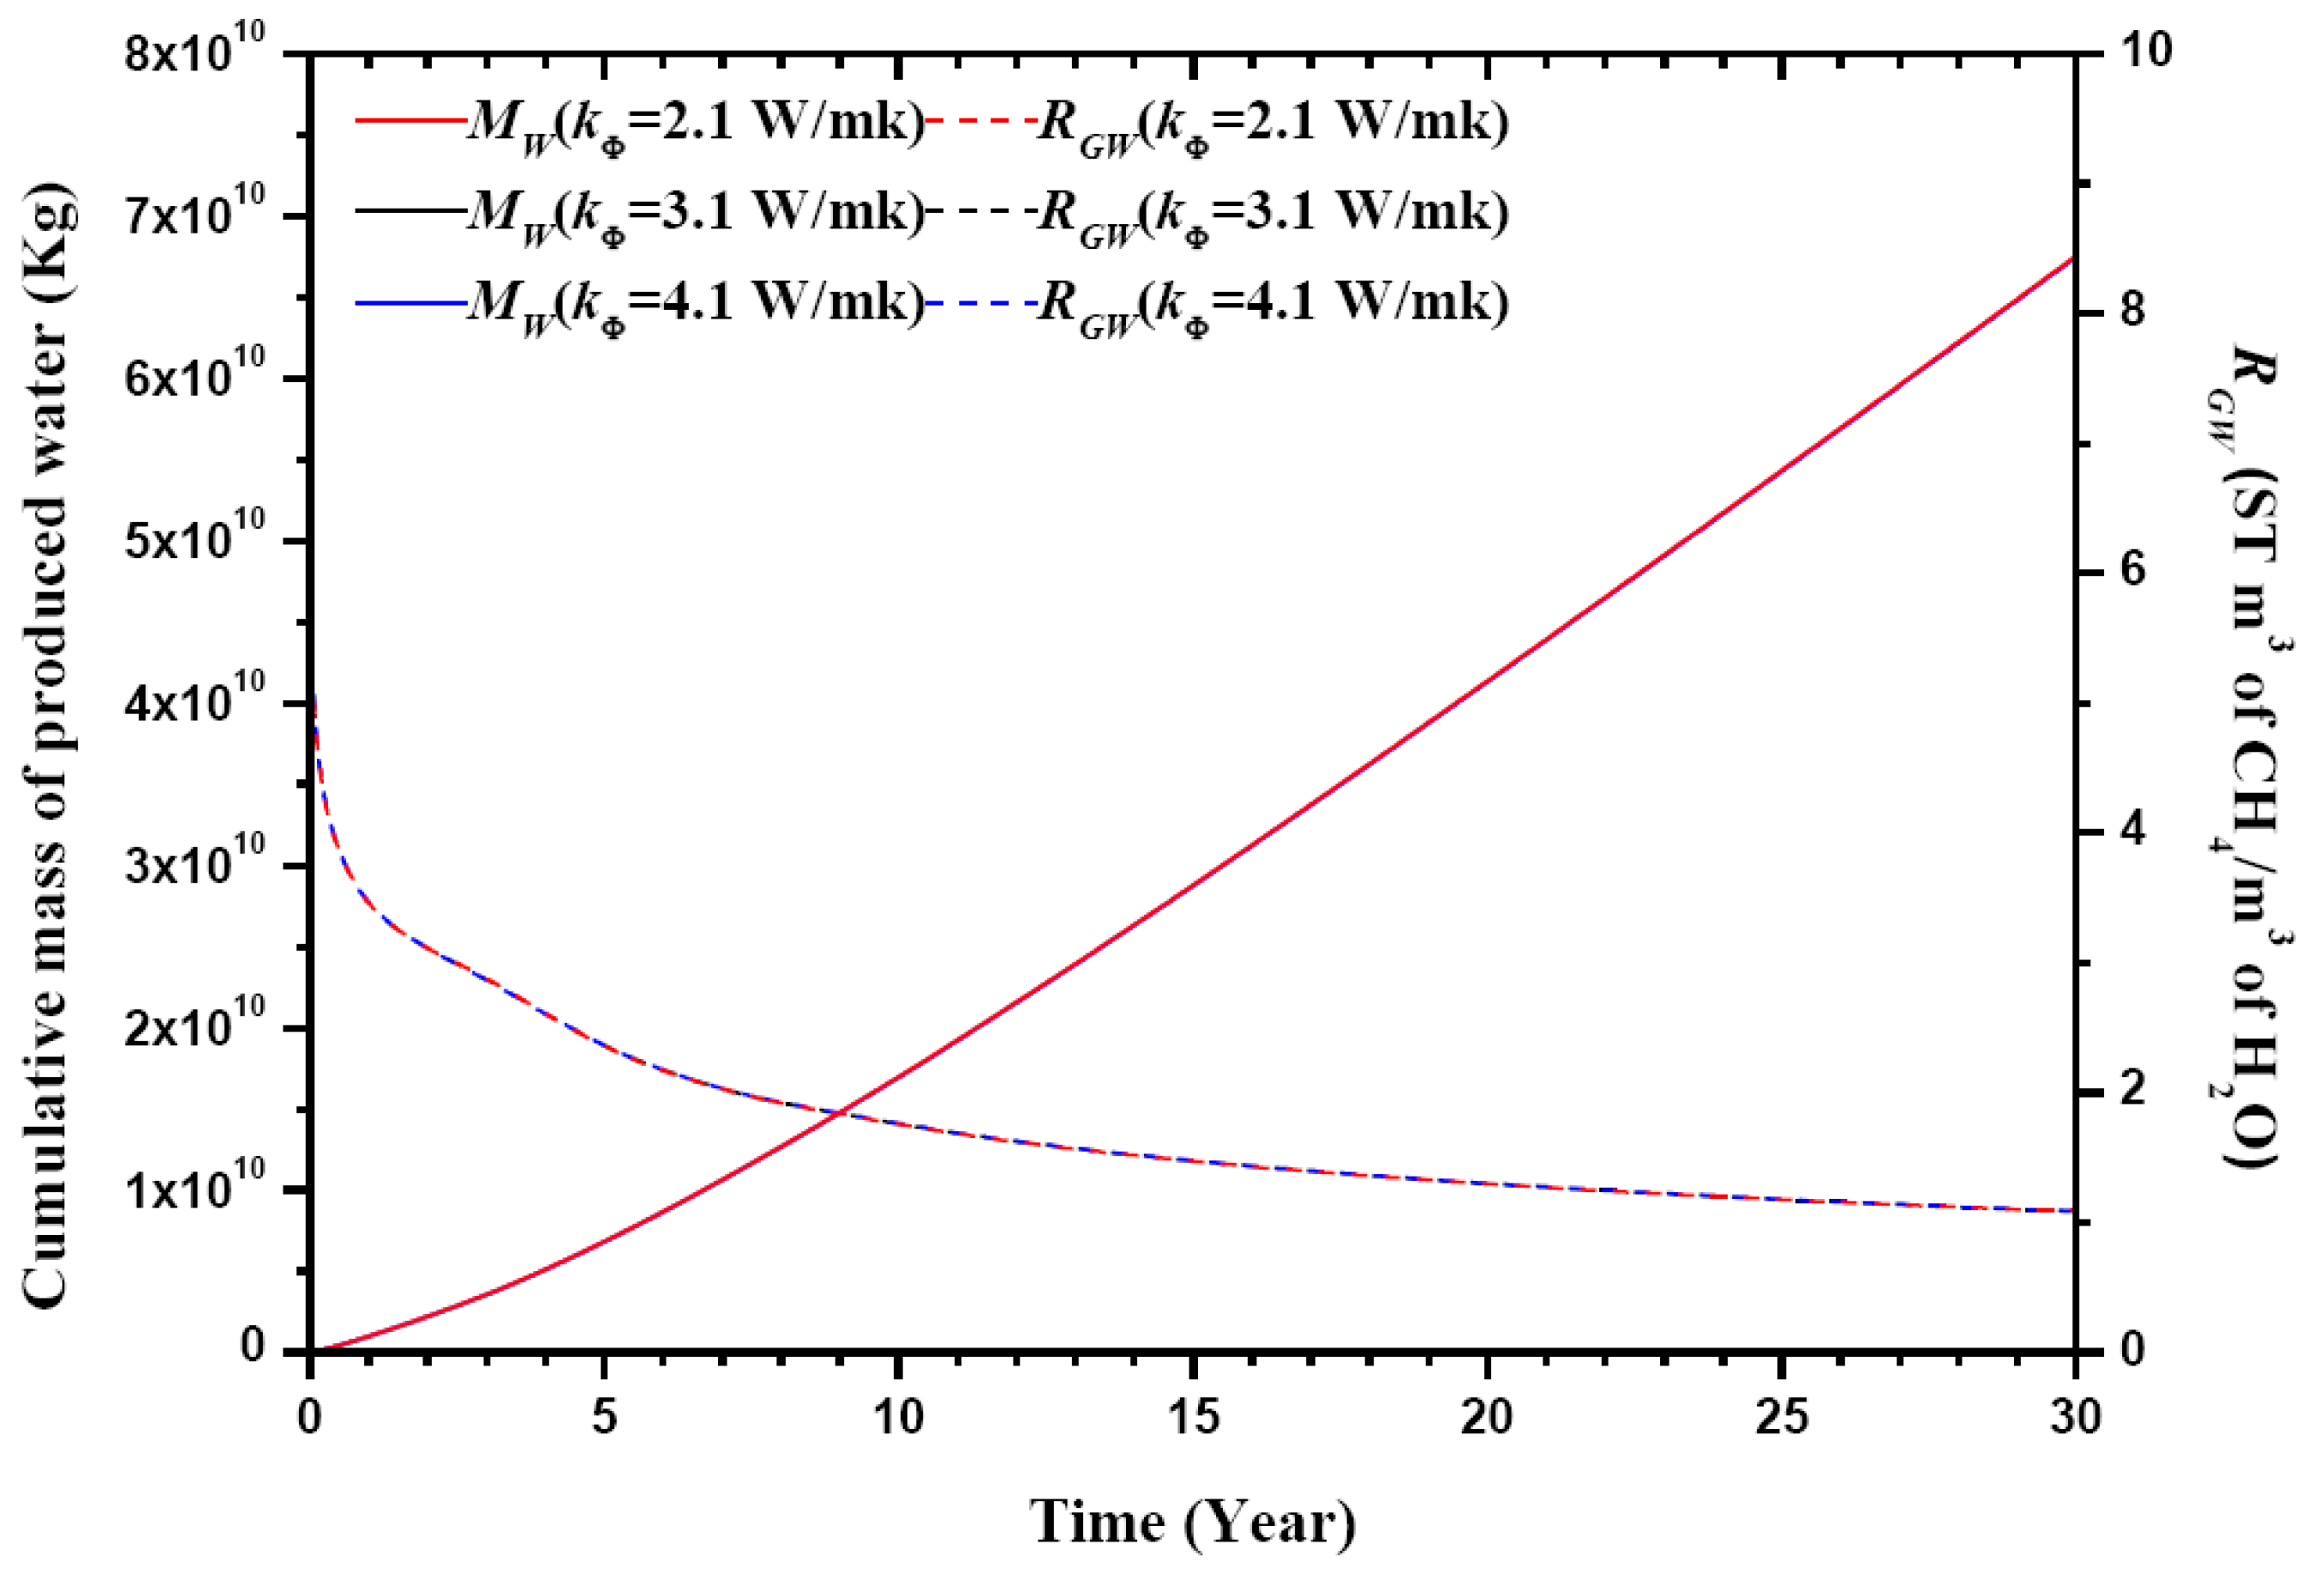
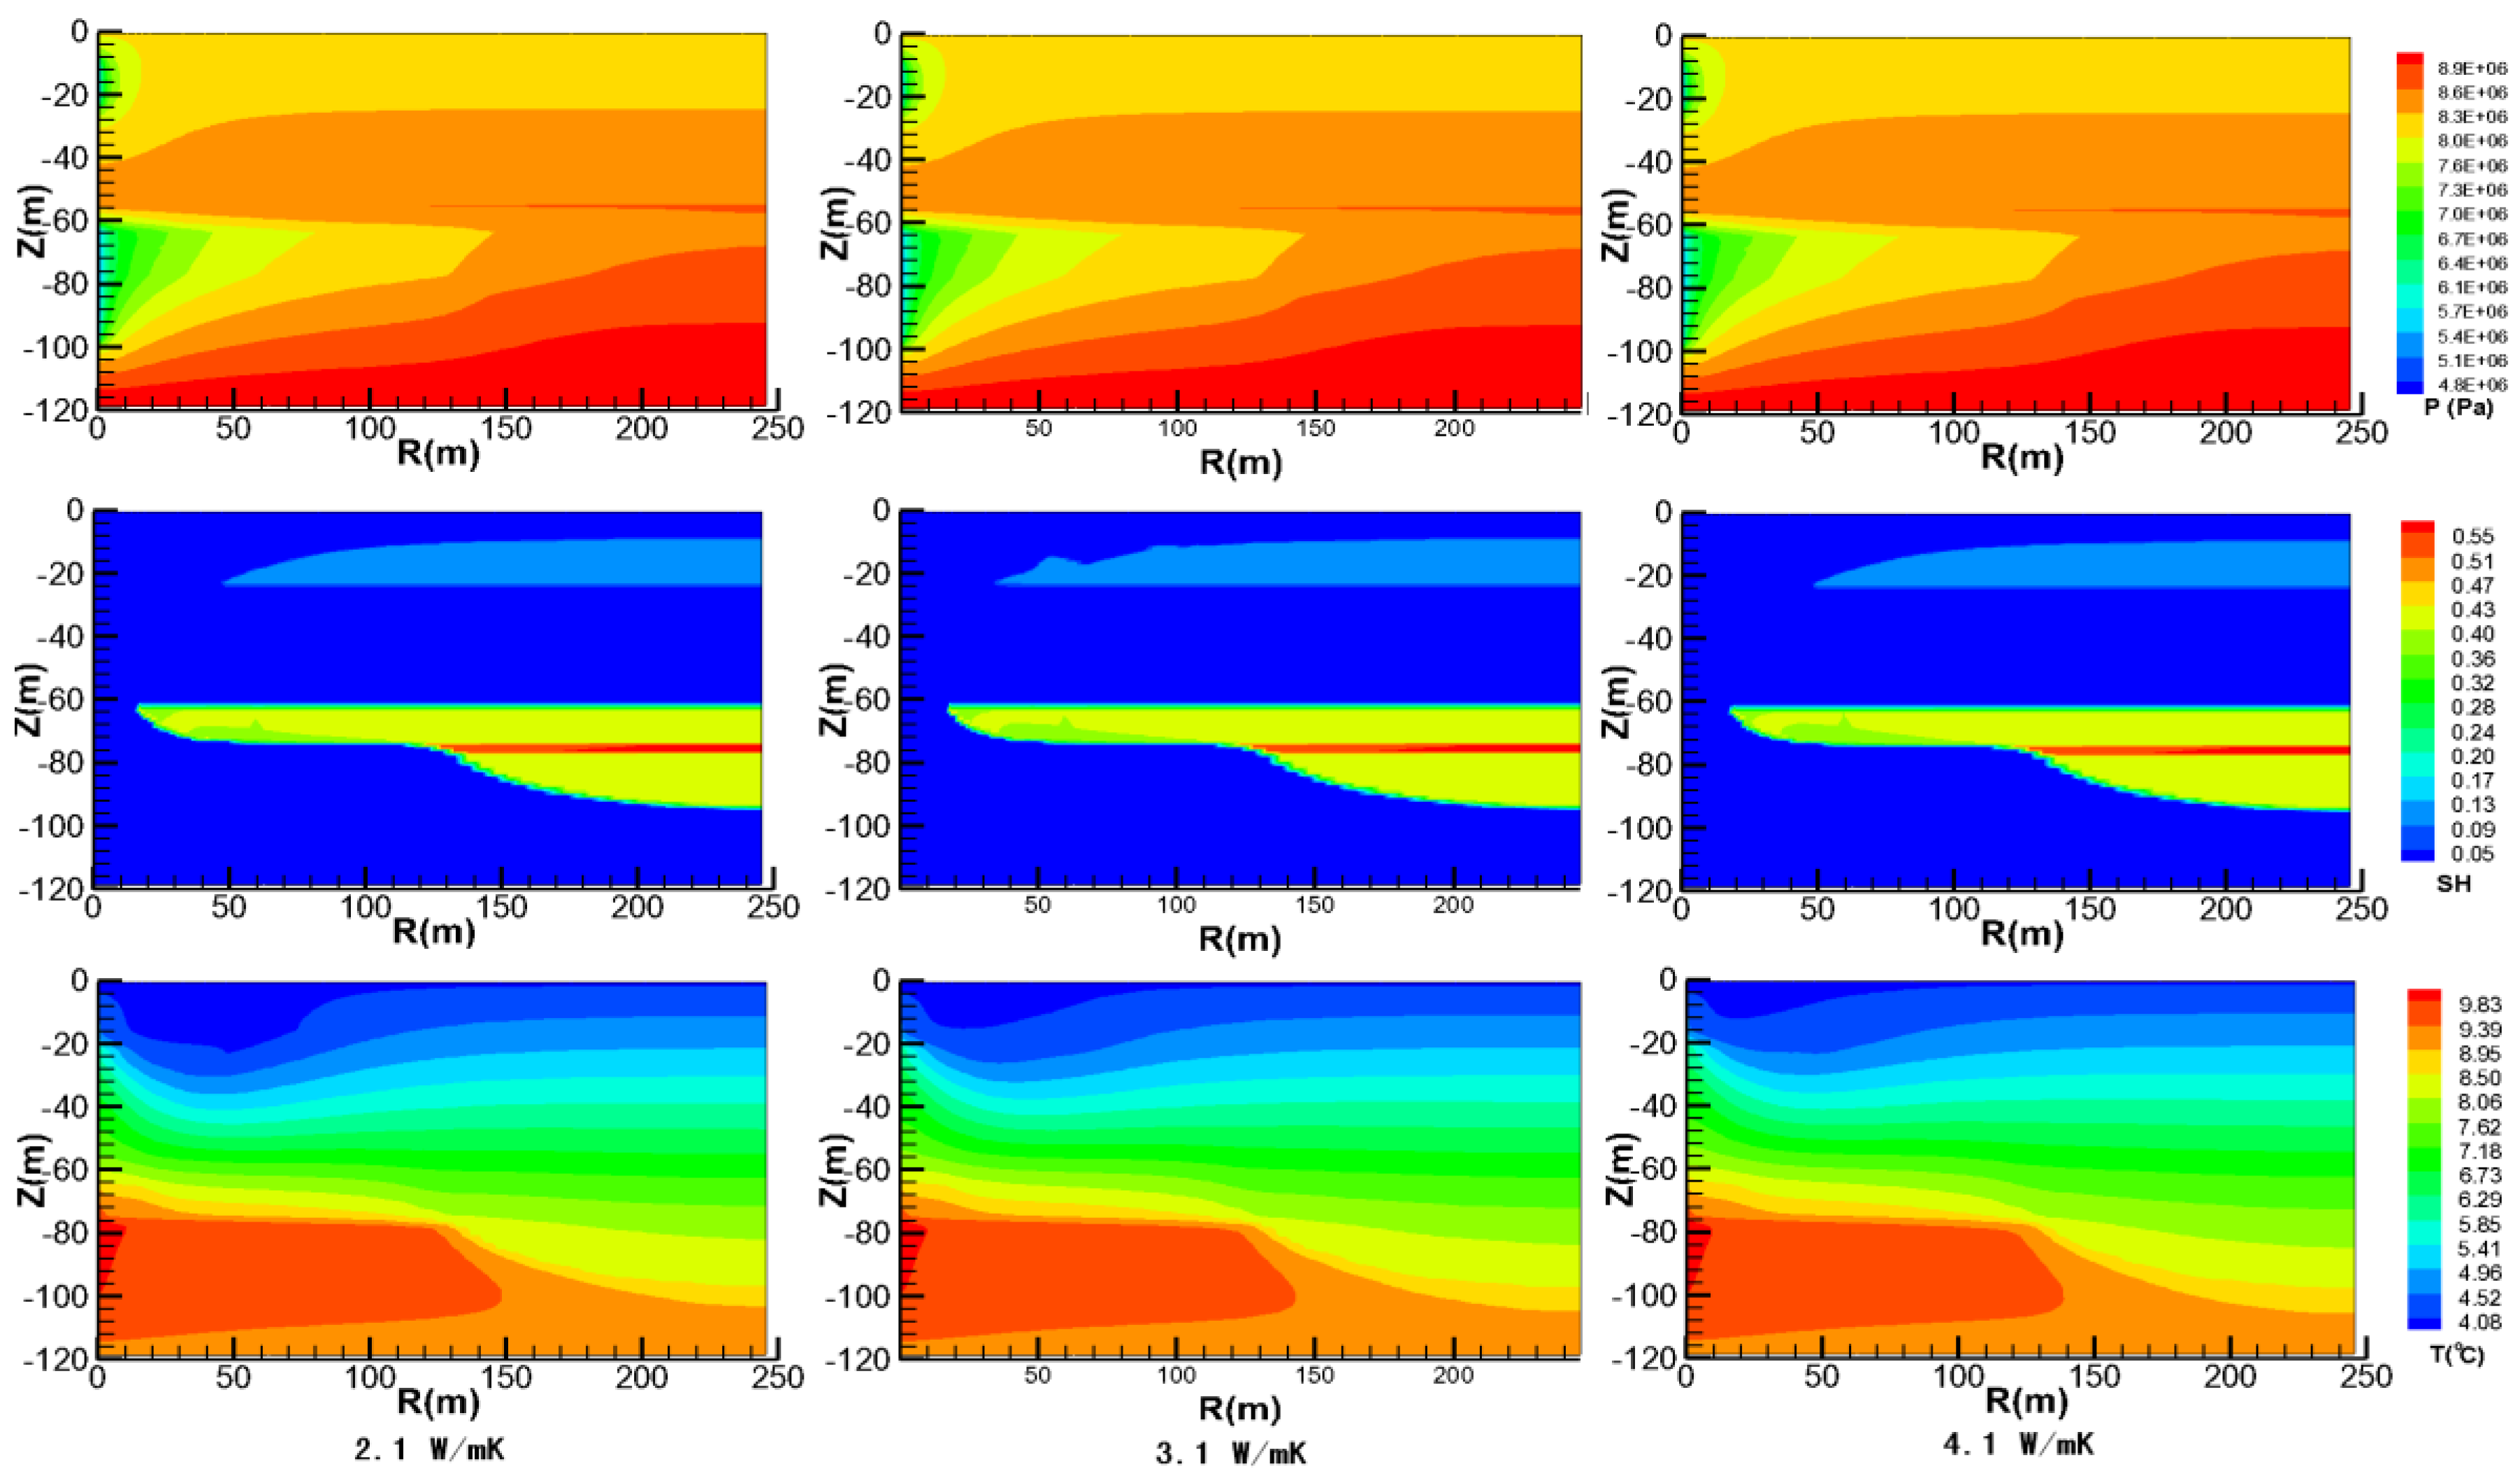
5.2. Sensitivity to the Thermal Conductivity kΘ

Figure 15 and Figure 16 show the dependence of VP, VR, MW, RGW on the thermal conductivity kΘ (describing fully water-saturated sediments), respectively. As seen in Figure 15 and Figure 16, a change of kΘ from 2.1 to 4.1 W/mK leads to almost no change for the VP, VR, MW, and RGW. This result indicates that the production behaviors are not sensitive for the thermal conductivity kΘ. Thus, the effect of the heat conduction during hydrate dissociation in this case is not obvious.
Figure 17 shows the evolution of P, SH, and T distributions at t = 30 years for the cases with the kΘ = 2.1 W/mK, 3.1 W/mK, and 4.5 W/mK, respectively. As seen in this figure, the P and SH distributions for the cases with the kΘ = 2.1 W/mK, 3.1 W/mK, and 4.5 W/mK are almost identical. However, the T distributions for these cases have a slight difference: the high-temperature region in the HBL-II with the lower kΘ is larger than that with the higher kΘ. However, this difference has no effect on the production behavior.

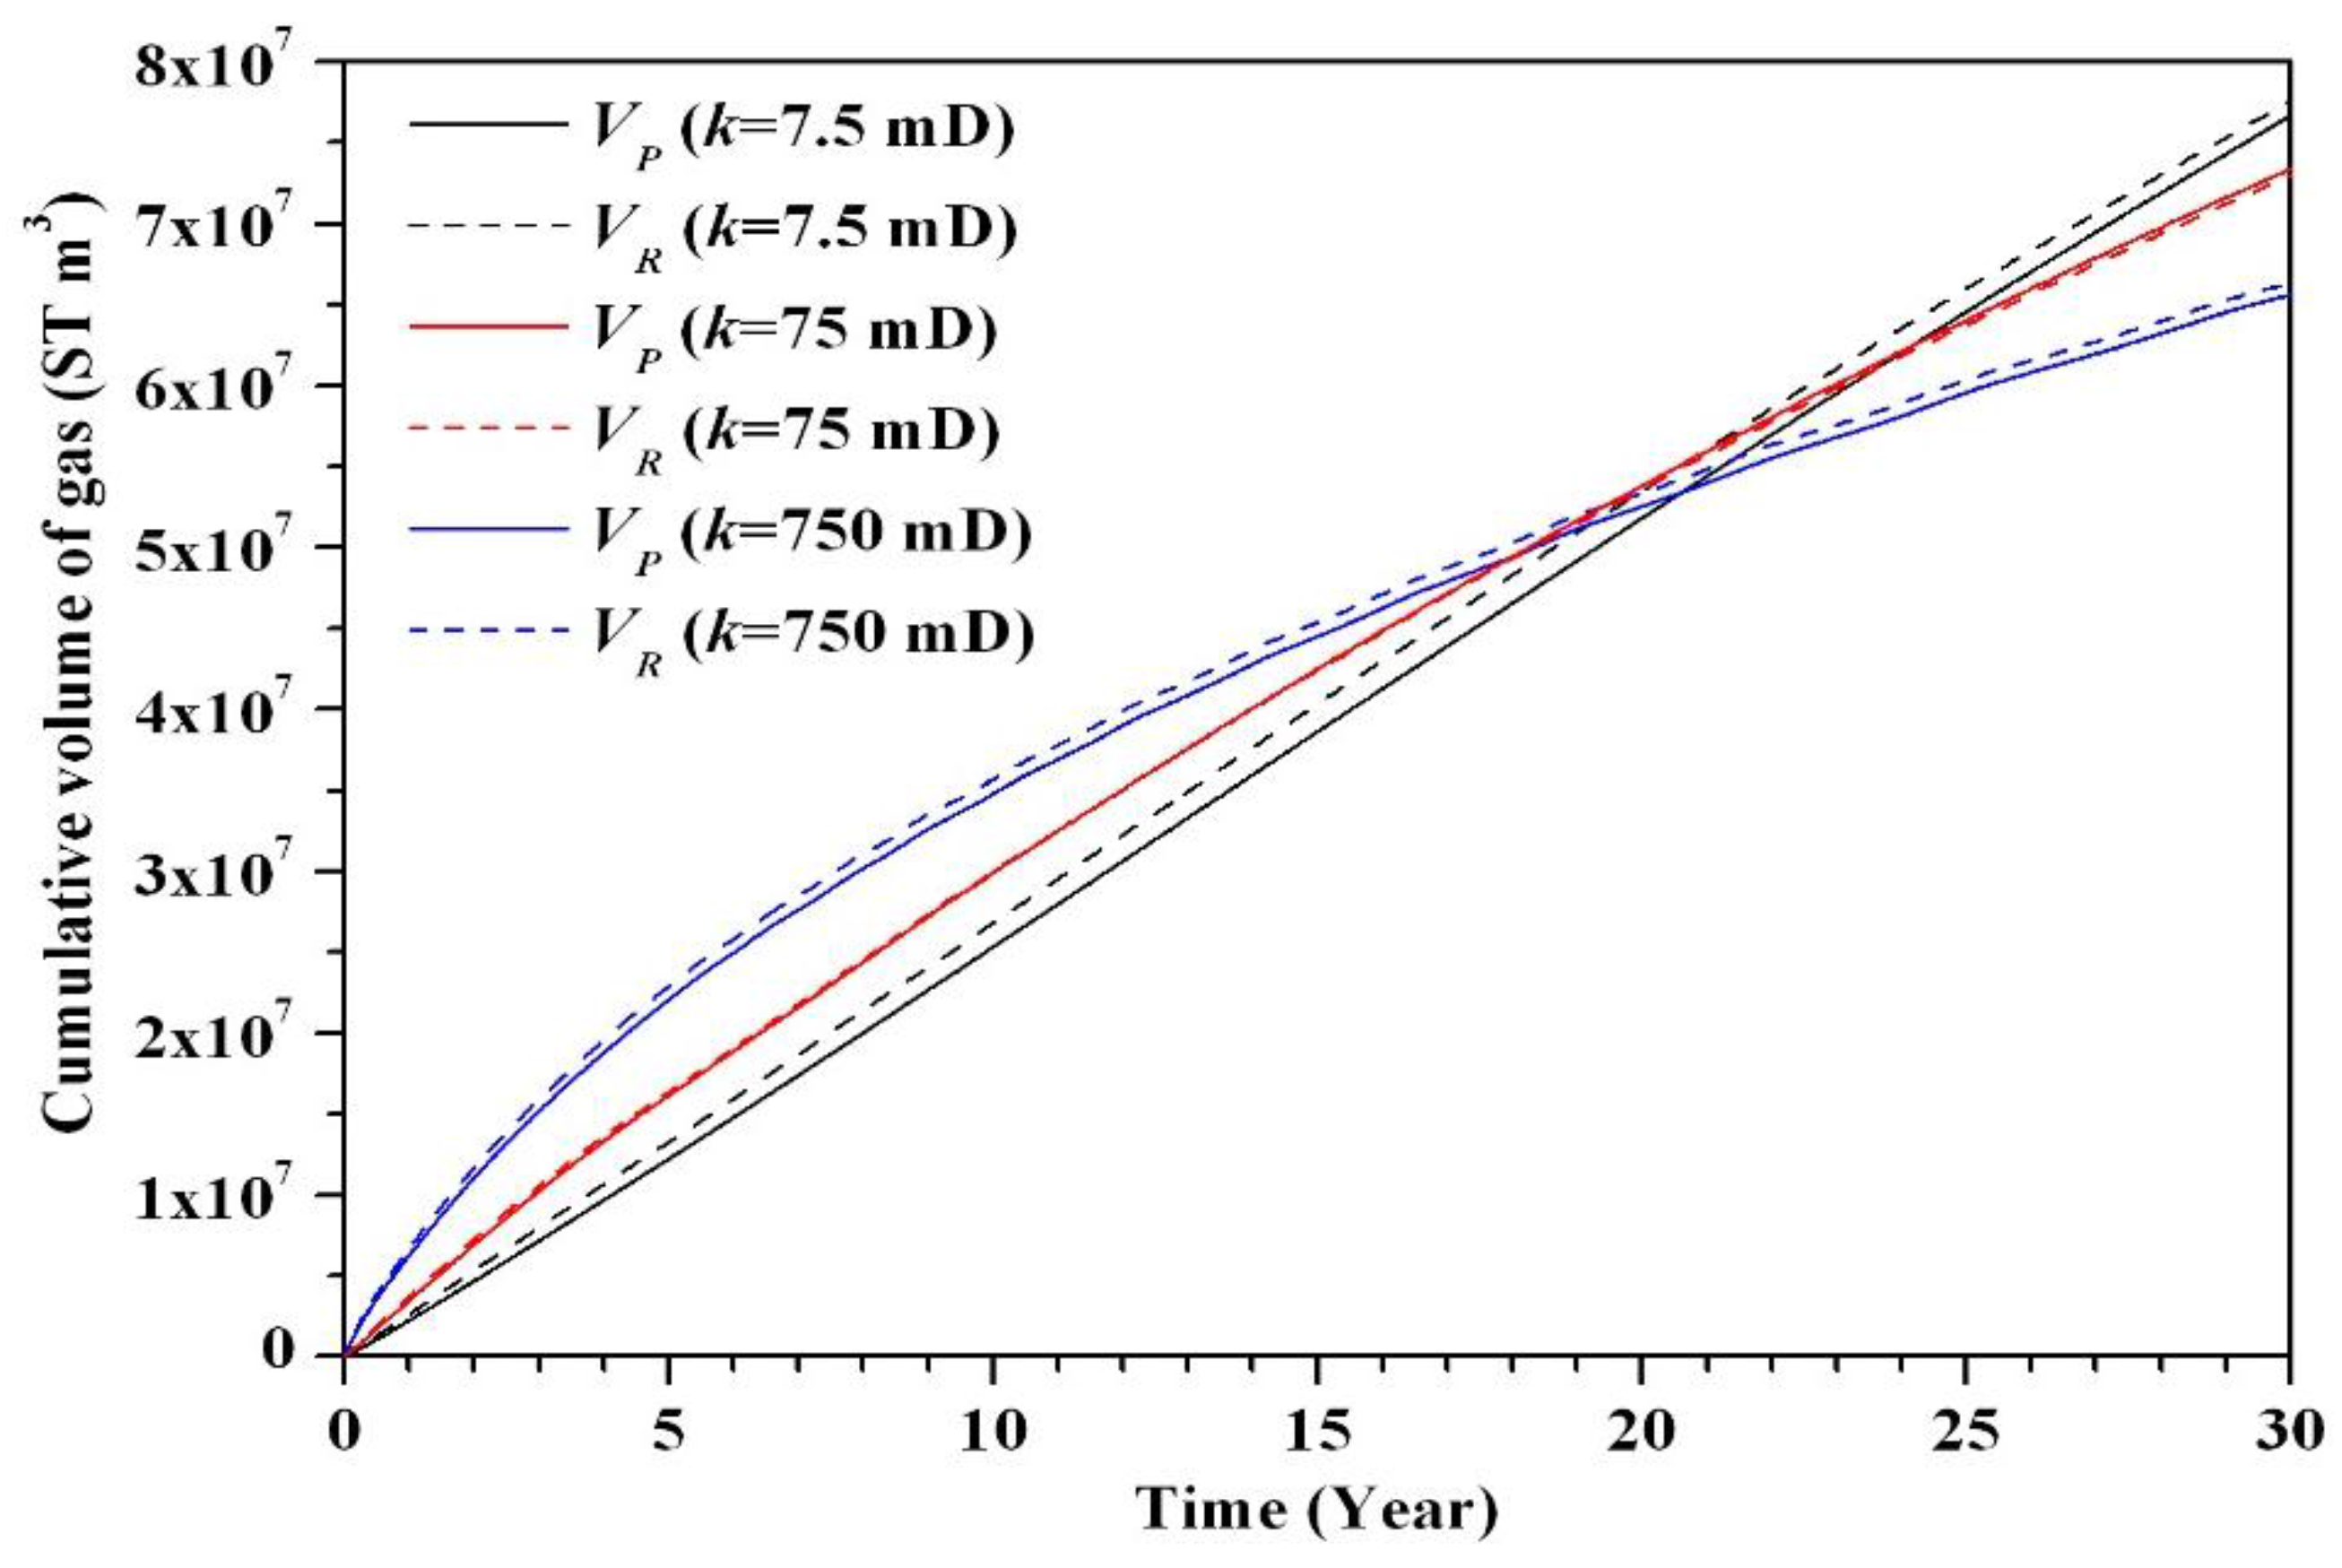
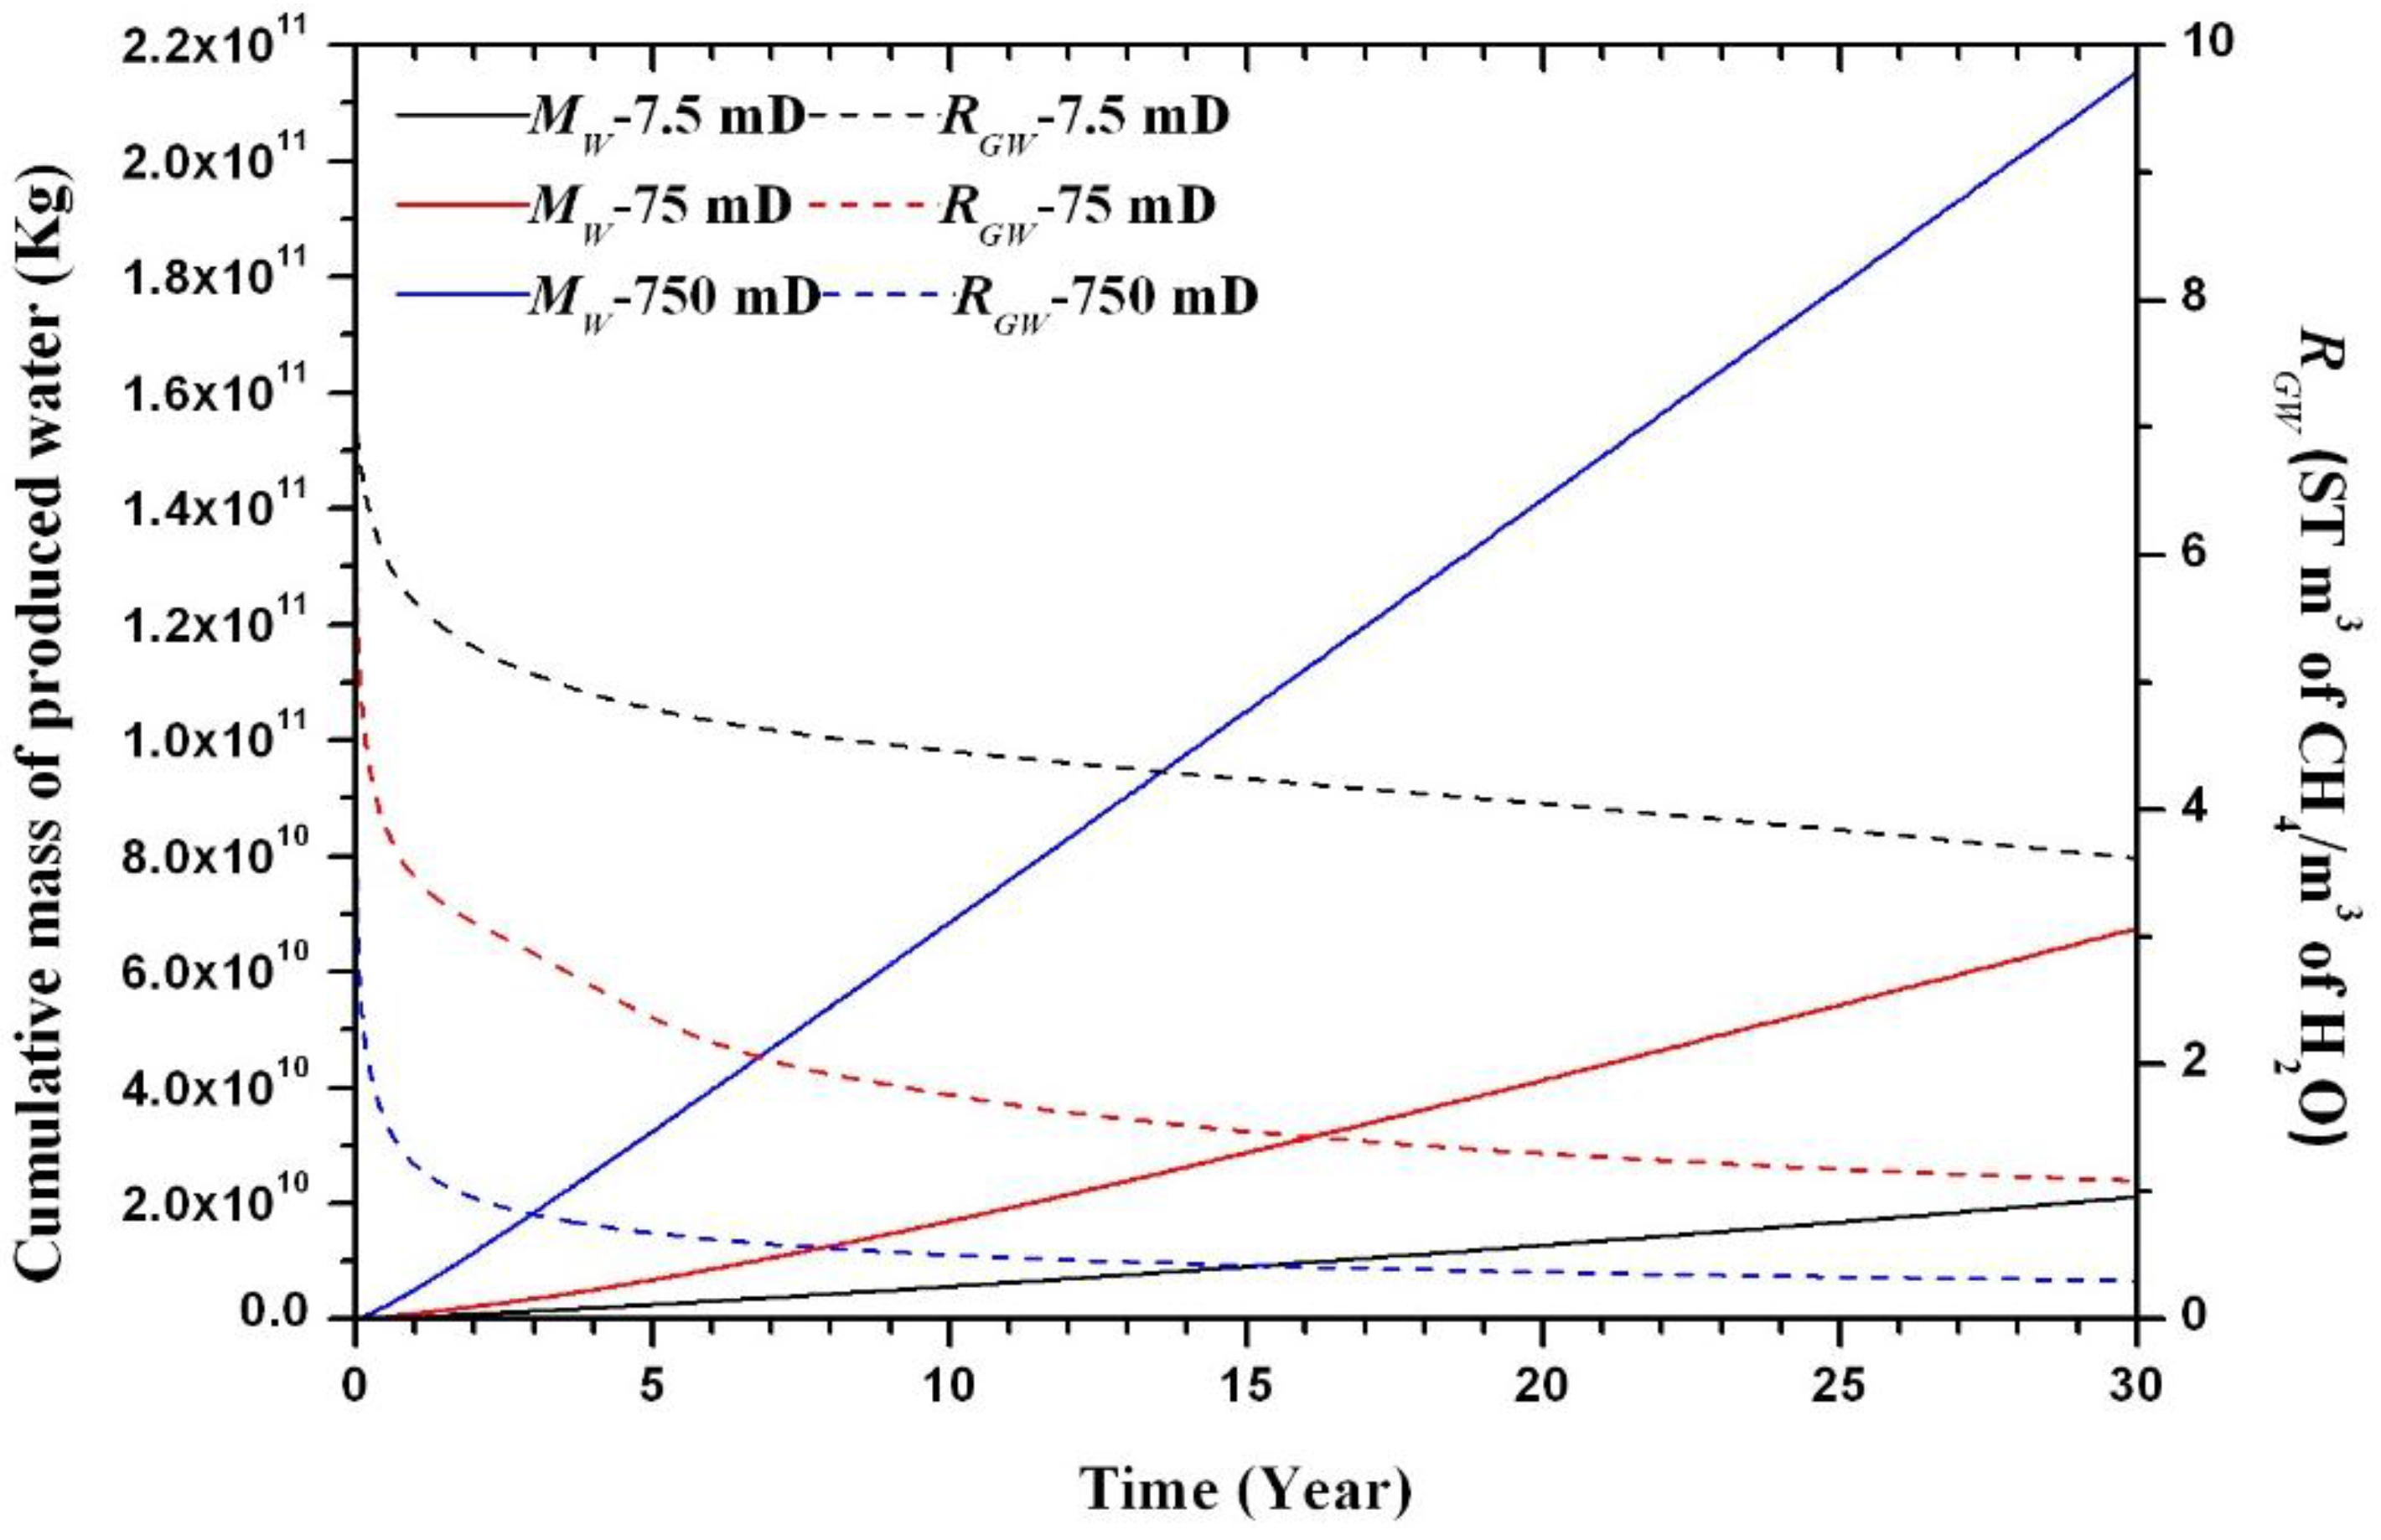
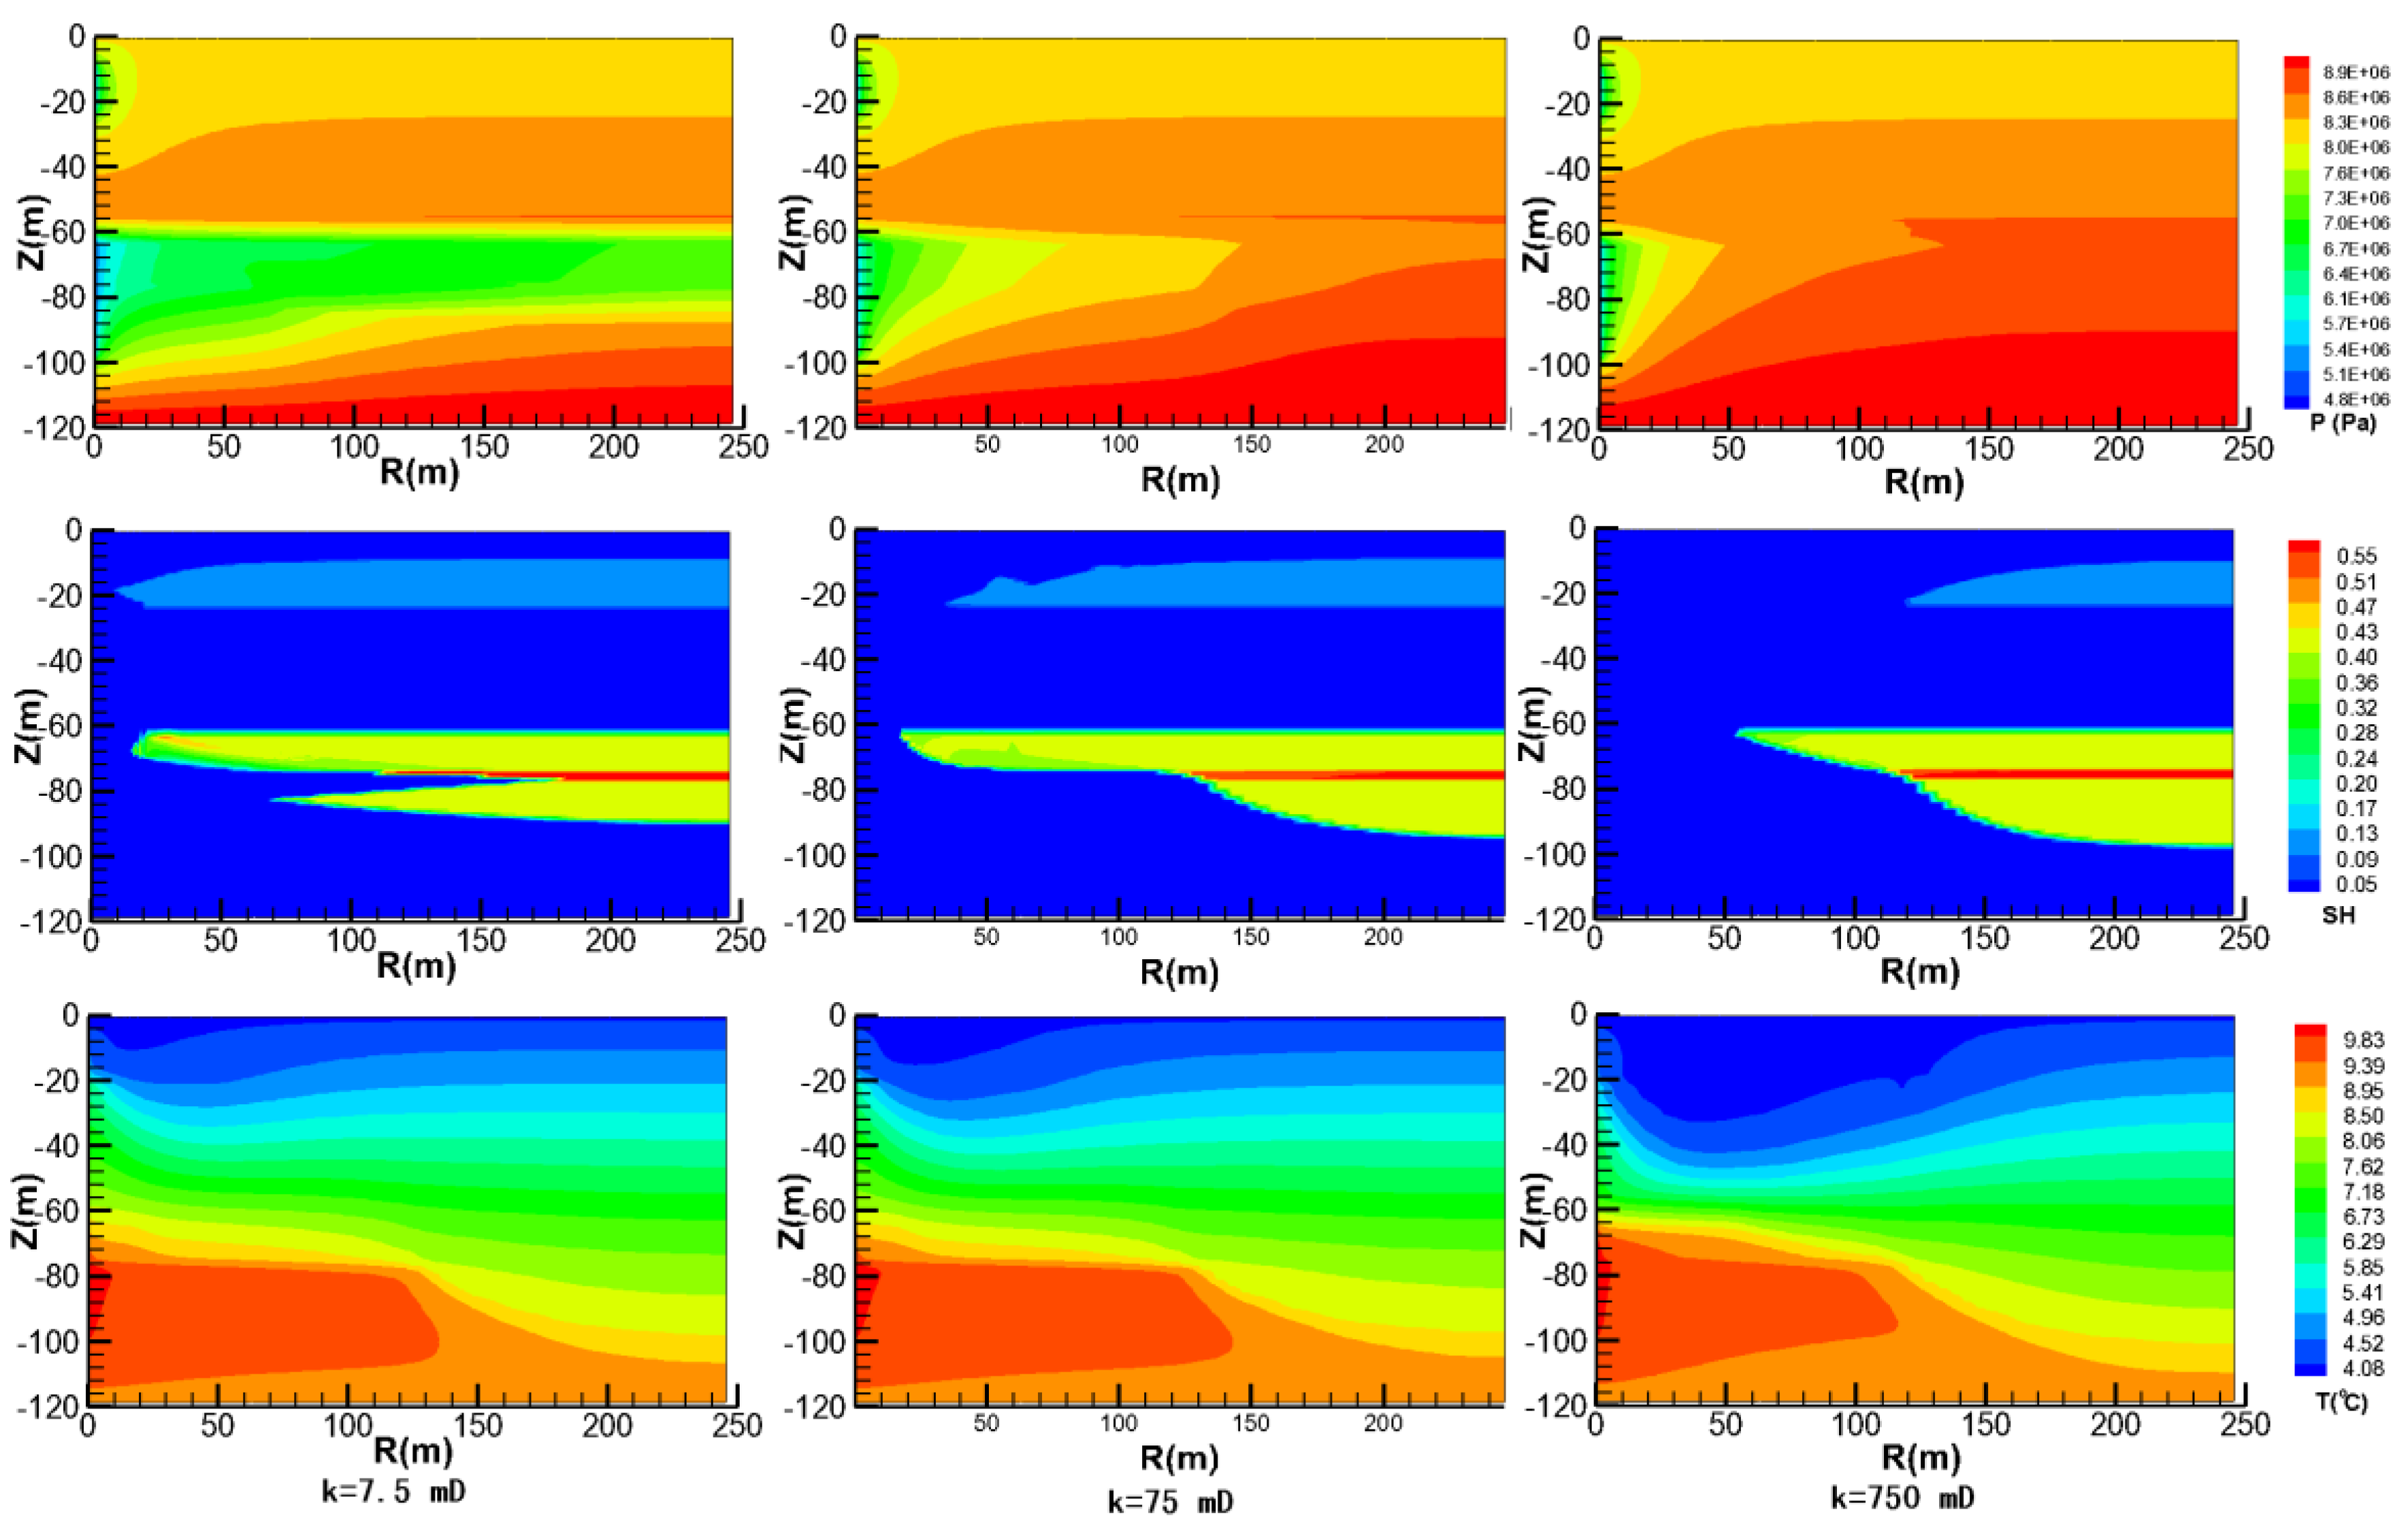
5.3. Sensitivity to the Intrinsic Permeability k

Figure 18 and Figure 19 show the dependence of VP, VR, MW, RGW on the intrinsic permeability k, respectively. In the sensitivity cases, the k of the 3 m-massive hydrate layer (7.5 × 10¹² m2) and the carbonate layer (7.5 × 10²⁰ m2) keep no change, and the k of the other layers changes from 7.5 × 10¹⁴ m2 (75 mD) into 7.5 × 10¹⁵ m2 (7.5 mD) and 7.5 × 10¹³ m2 (750 mD), respectively.
As seen in Figure 18, the changes of the VP and VR are evident. In the initial 10 years, the higher k leads to a larger rate of gas production. However, the rates of gas production gradually decrease, and the decrease of the gas production rate in the highest k case is the quickest. Finally, the final VP and VR in the case with the k = 7.5 mD are the highest. As seen in Figure 19, the MW in the case with lower k is smaller, and the RGW with lower k is higher. On the aspect of the water production, the production in the lower k case has a better commercial value and potential.
Figure 20 shows the evolution of P, SH, and T distributions at t = 30 years for the cases with the k = 7.5 mD, 75 mD, and 750 mD, respectively. As seen in the figure of P distributions, the regions influenced by the depressurization in the HBL-II enlarge with the decline of the k, and that in the HBL-I is similar in the cases with the different k. As seen in the figure of SH distributions, the dissociated hydrate area in HBL-I enlarges with the increase of the k. However, in the HBL-II, the regions of hydrate dissociation with different k are totally different. In the case with the k = 7.5 mD, the hydrate in the massive hydrate layer is dissociated rapidly, which is on account of the high intrinsic permeability and porosity of this layer. The dissociated region in this layer reaches about r = 180 m, which is the largest among the three cases. However, the hydrate in the other layer of the HBL-II is dissociated slowly. In the case with the k = 750 mD, the dissociated region in the massive hydrate layer only reaches about r = 120 m, but the dissociated region in the layer above the massive hydrate is the largest in the three cases. As seen in the figure of T distributions, the low temperature region in the HBL-I and the high temperature region in the HBL-II enlarge with the increase of k. This is because the reservoir with the higher k can enhance the mass of water from the over- and under-burden. Therefore, in the case with k = 7.5 mD, the hydrates in the HBL-II are mainly dissociated under the effect of depressurization. However, in the case with k = 750 mD, the hydrates in the HBL-II are mainly dissociated under the effect of warm water flow.

6. Conclusions

In this work, the production potential of the gas hydrate accumulation at Site GMGS2-8 of the Dongsha Area in the Pearl River Mouth Basin has been firstly evaluated by the TOUGH-Hydrate code. A single vertical well is considered as the well configuration, and depressurization is employed as the dissociation method. Analyses of gas production sensitivity to the production pressure PW, the thermal conductivity kΘ, and the intrinsic permeability k of the reservoir are investigated as well. The following conclusions can be obtained:
  • The total gas production is approximately 7.3 × 10⁷ ST m3 in 30 years. Thus, the average gas production rate in the entire 30 years is 6.7 × 10³ ST m3/day, which is much higher than the previous study in the Shenhu Area of the South China Sea by the GMGS-1. Moreover, the maximum gas production rate (9.5 × 10³ ST m3/day) has the same order of magnitude of the first offshore methane hydrate production test in the Nankai Though.
  • The decrease of the PW can enhance the hydrate dissociation rate. When PW decreases from 4.5 to 3.4 MPa, the volume of gas production increases by 20.5%, and when PW decreases from 3.4 to 2.3 MPa, the volume of gas production increases by 13.6%. Furthermore, the lowest PW is 2.3 MPa, which is lower than the quadruple point of methane hydrate. However, the ice blocking does not happen in this case.
  • Production behaviors are not sensitive to the thermal conductivity kΘ.
  • In the initial 10 years, the higher k leads to a larger rate of gas production, but the final VP and VR in the case with the lowest k are the highest.

Acknowledgments

This work is supported by National Science Fund for Distinguished Young Scholars of China (51225603), National Natural Science Foundation of China (51406210 and 51476174), and Key Arrangement Programs of the Chinese Academy of Sciences (KGZD-EW-301-2) which are gratefully acknowledged.

Author Contributions

Yi Wang and Jing-Chun Feng conceived and designed the models; Yi Wang and Jing-Chun Feng performed the experiments; Yi Wang, Gang Li, and Yu Zhang analyzed the data; Xiao-Sen Li contributed analysis tools; Yi Wang wrote the paper.

Conflicts of Interest

The authors declare no conflict of interest.

Notation

G
thermal gradient within the sea (°C/m)
H
depth of the sea water (m)
k
intrinsic permeability (m2)
keff
effective permeability (m2)
krA
aqueous relative permeability (m2)
krG
gas relative permeability (m2)
kΘC
thermal conductivity (W/m/K)
kΘRD
thermal conductivity of dry porous medium (W/m/K)
kΘRW
thermal conductivity of fully saturated porous medium (W/m/K)
kΘI
thermal conductivity of ice (W/m/K)
VP
cumulative volume of produced gas (m3)
VR
cumulative volume of released gas (m3)
MW
cumulative mass of produced water (kg)
P
pressure (MPa)
PB
initial pressure at base of HBL (MPa)
P0
atmosphere pressure (MPa)
PW
working pressure at the well (MPa)
PW0
initial pressure at the well (MPa)
Q
injected heat (J)
Qavg
average gas production rate (ST m3/day/m of well)
Qinj
heat injection rate (W/m of well)
r
radius (m)
RGW
the gas to water production ratio (ST m3 of CH4 / m3 of H2O)
S
phase saturation
t
time (days)
T
temperature (°C)
T0
the temperature of the sea floor (°C)
TW
injected warm water temperature (°C)
TB
initial temperature at the base of HBL (°C)
TT
initial temperature at the top of HBL (°C)
W
pump work (J)
x,y,z
cartesian coordinates (m)
SH
hydrate saturation
SG
gas saturation
XS
the mass fraction of salt in the aqueous phase
ΔHc
combustion enthalpy of produced methane (J)
ΔPW
driving force of depressurization, PW0PW (MPa)
Δx
discretization along the x-axis (m)
Δy
discretization along the y-axis (m)
Δz
discretization along the z-axis (m)
φ
porosity
η
energy ratio
λ
van Genuchten exponent—Table 1

Subscripts and Superscripts 

0
denotes initial state
A
aqueous phase
B
base of HBL
cap
Capillary
G
gas phase
H
solid hydrate phase

References

  1. Sloan, E.D. Fundamental principles and applications of natural gas hydrates. Nature 2003, 426, 353–359. [Google Scholar] [CrossRef] [PubMed]
  2. Veluswamy, H.P.; Kumar, R.; Linga, P. Hydrogen storage in clathrate hydrates: Current state of the art and future directions. Appl. Energy 2014, 122, 112–132. [Google Scholar] [CrossRef]
  3. Babu, P.; Kumar, R.; Linga, P. Unusual behavior of propane as a co-guest during hydrate formation in silica sand: Potential application to seawater desalination and carbon dioxide capture. Chem. Eng. Sci. 2014, 117, 342–351. [Google Scholar] [CrossRef]
  4. Osegovic, J.P.; Blake-Collins, B.; Slattery, I.M.; Max, M.D. Accelerated Hydrate Formation and Dissociation. U.S. Patent 8,334,418, 18 December 2012. [Google Scholar]
  5. Kumar, A.; Kumar, R. Role of Metallic Packing and Kinetic Promoter in Designing a Hydrate-Based Gas Separation Process. Energy Fuels 2015, 29, 4463–4471. [Google Scholar] [CrossRef]
  6. Yang, S.H.B.; Babu, P.; Chua, S.F.S.; Linga, P. Carbon dioxide hydrate kinetics in porous media with and without salts. Appl. Energy 2016, 162, 1131–1140. [Google Scholar] [CrossRef]
  7. Koh, C.A.; Sum, A.K.; Sloan, E.D. Gas hydrates: Unlocking the energy from icy cages. J. Appl. Phys. 2009, 106. [Google Scholar] [CrossRef]
  8. Sloan, E.D.; Koh, C.A. Clathrate Hydrates of Natural Gases; Marcel Dekker Inc.: New York, NY, USA, 2008. [Google Scholar]
  9. Bohrmann, G.; Kuhs, W.F.; Klapp, S.A.; Techmer, K.S.; Klein, H.; Murshed, M.M.; Abegg, F. Appearance and preservation of natural gas hydrate from Hydrate Ridge sampled during ODP Leg 204 drilling. Mar. Geol. 2007, 244, 1–14. [Google Scholar] [CrossRef]
  10. Pohlman, J.W.; Kaneko, M.; Heuer, V.B.; Coffin, R.B.; Whiticar, M. Methane sources and production in the northern Cascadia margin gas hydrate system. Earth Planet. Sci. Lett. 2009, 287, 504–512. [Google Scholar] [CrossRef]
  11. Ruppel, C.; Boswell, R.; Jones, E. Scientific results from Gulf of Mexico Gas Hydrates joint Industry Project Leg 1 drilling: Introduction and overview. Mar. Petrol. Geol. 2008, 25, 819–829. [Google Scholar] [CrossRef]
  12. Sain, K.; Rajesh, V.; Satyavani, N.; Subbarao, K.V.; Subrahmanyam, C. Gas-hydrate stability thickness map along the Indian continental margin. Mar. Petrol. Geol. 2011, 28, 1779–1786. [Google Scholar] [CrossRef]
  13. Moridis, G.J.; Reagan, M.I.; Kim, S.J.; Seol, Y.; Zhang, K. Evaluation of the Gas Production Potential of Marine Hydrate Deposits in the Ulleung Basin of the Korean East Sea. Spe J. 2009, 14, 759–781. [Google Scholar] [CrossRef]
  14. Kwon, T.H.; Lee, K.R.; Cho, G.C.; Lee, J.Y. Geotechnical properties of deep oceanic sediments recovered from the hydrate occurrence regions in the Ulleung Basin, East Sea, offshore Korea. Mar. Petrol. Geol. 2011, 28, 1870–1883. [Google Scholar] [CrossRef]
  15. Feng, J.C.; Li, X.S.; Li, G.; Li, B.; Chen, Z.Y.; Wang, Y. Numerical Investigation of Hydrate Dissociation Performance in the South China Sea with Different Horizontal Well Configurations. Energies 2014, 7, 4813–4834. [Google Scholar] [CrossRef]
  16. Ning, F.; Zhang, K.; Wu, N.; Zhang, L.; Li, G.; Jiang, G.; Yu, Y.; Liu, L.; Qin, Y. Invasion of drilling mud into gas-hydrate-bearing sediments. Part I: Effect of drilling mud properties. Geophys. J. Int. 2013, 193, 1370–1384. [Google Scholar] [CrossRef]
  17. Liu, C.L.; Meng, Q.G.; He, X.L.; Li, C.F.; Ye, Y.G.; Zhang, G.X.; Liang, J.Q. Characterization of natural gas hydrate recovered from Pearl River Mouth basin in South China Sea. Mar. Petrol. Geol. 2015, 61, 14–21. [Google Scholar] [CrossRef]
  18. Max, M.D.; Johnson, A.H. Hydrate petroleum system approach to natural gas hydrate exploration. Petrol. Geosci. 2014, 20, 187–199. [Google Scholar] [CrossRef]
  19. Moridis, G.J.; Collett, T.S.; Pooladi-Darvish, M.; Hancock, S.; Santamarina, C.; Boswell, R.; Kneafsey, T.; Rutqvist, J.; Kowalsky, M.B.; Reagan, M.T.; et al. Challenges, Uncertainties, and Issues Facing Gas Production From Gas-Hydrate Deposits. Spe Reserv. Eval. Eng. 2011, 14, 76–112. [Google Scholar] [CrossRef]
  20. Li, X.-S.; Wang, Y.; Li, G.; Zhang, Y. Experimental Investigations into Gas Production Behaviors from Methane Hydrate with Different Methods in a Cubic Hydrate Simulator. Energy Fuels 2011, 26, 1124–1134. [Google Scholar] [CrossRef]
  21. Wang, Y.; Li, X.-S.; Li, G.; Zhang, Y.; Li, B.; Feng, J.-C. A three-dimensional study on methane hydrate decomposition with different methods using five-spot well. Appl. Energy 2013, 112, 83–92. [Google Scholar] [CrossRef]
  22. Chong, Z.R.; Yang, S.H.B.; Babu, P.; Linga, P.; Li, X.-S. Review of natural gas hydrates as an energy resource: Prospects and challenges. Appl. Energy 2016, 162, 1633–1652. [Google Scholar] [CrossRef]
  23. Li, X.S.; Yang, B.; Li, G.; Li, B. Numerical Simulation of Gas Production from Natural Gas Hydrate Using a Single Horizontal Well by Depressurization in Qilian Mountain Permafrost. Ind. Eng. Chem. Res. 2012, 51, 4424–4432. [Google Scholar] [CrossRef]
  24. Chen, D.X.; Wu, S.G.; Dong, D.D.; Mi, L.J.; Fu, S.Y.; Shi, H.S. Focused fluid flow in the Baiyun Sag, northern South China Sea: Implications for the source of gas in hydrate reservoirs. Chin. J. Oceanol. Limnol. 2013, 31, 178–189. [Google Scholar] [CrossRef]
  25. Li, G.; Li, X.S.; Chen, Q.; Chen, Z.Y. Numerical Simulation of Gas Production from Gas Hydrate Zone in Shenhu Area, South China Sea. Acta Chim. Sin. 2010, 68, 1083–1092. [Google Scholar]
  26. Li, G.; Moridis, G.J.; Zhang, K.; Li, X.S. The use of huff and puff method in a single horizontal well in gas production from marine gas hydrate deposits in the Shenhu Area of South China Sea. J. Petrol. Sci. Eng. 2011, 77, 49–68. [Google Scholar] [CrossRef]
  27. Su, Z.; Cao, Y.C.; Wu, N.Y.; Chen, D.F.; Yang, S.X.; Wang, H.B. Numerical investigation on methane hydrate accumulation in Shenhu Area, northern continental slope of South China Sea. Mar. Petrol. Geol. 2012, 38, 158–165. [Google Scholar] [CrossRef]
  28. Su, Z.; Moridis, G.J.; Zhang, K.N.; Wu, N.Y. A huff-and-puff production of gas hydrate deposits in Shenhu area of South China Sea through a vertical well. J. Petrol. Sci. Eng. 2012, 86–87, 54–61. [Google Scholar] [CrossRef]
  29. Li, G.; Li, X.S.; Zhang, K.N.; Moridis, G.J. Numerical simulation of gas production from hydrate accumulations using a single horizontal well in Shenhu Area, South China Sea. Chin. J. Geophys. 2011, 54, 2325–2337. [Google Scholar]
  30. Su, Z.; Cao, Y.C.; Wu, N.Y.; He, Y. Numerical Analysis on Gas Production Efficiency from Hydrate Deposits by Thermal Stimulation: Application to the Shenhu Area, South China Sea. Energies 2011, 4, 294–313. [Google Scholar] [CrossRef]
  31. Feng, J.C.; Li, G.; Li, X.S.; Li, B.; Chen, Z.Y. Evolution of Hydrate Dissociation by Warm Brine Stimulation Combined Depressurization in the South China Sea. Energies 2013, 6, 5402–5425. [Google Scholar] [CrossRef]
  32. Li, B.; Li, G.; Li, X.S.; Li, Q.P.; Yang, B.; Zhang, Y.; Chen, Z.Y. Gas Production from Methane Hydrate in a Pilot-Scale Hydrate Simulator Using the Huff and Puff Method by Experimental and Numerical Studies. Energy Fuels 2012, 26, 7183–7194. [Google Scholar] [CrossRef]
  33. Li, B.; Li, X.S.; Li, G. Kinetic studies of methane hydrate formation in porous media based on experiments in a pilot-scale hydrate simulator and a new model. Chem. Eng. Sci. 2014, 105, 220–230. [Google Scholar] [CrossRef]
  34. Li, G.; Li, B.; Li, X.S.; Zhang, Y.; Wang, Y. Experimental and Numerical Studies on Gas Production from Methane Hydrate in Porous Media by Depressurization in Pilot-Scale Hydrate Simulator. Energy Fuels 2012, 26, 6300–6310. [Google Scholar] [CrossRef]
  35. Kneafsey, T.J.; Moridis, G.J. X-Ray computed tomography examination and comparison of gas hydrate dissociation in NGHP-01 expedition (India) and Mount Elbert (Alaska) sediment cores: Experimental observations and numerical modeling. Mar. Petrol. Geol. 2014, 58, 526–539. [Google Scholar] [CrossRef]
  36. Moridis, G.J.; Kim, J.; Reagan, M.T.; Kim, S.J. Feasibility of gas production from a gas hydrate accumulation at the UBGH2–6 site of the Ulleung basin in the Korean East Sea. J. Petrol. Sci. Eng. 2013, 108, 180–210. [Google Scholar] [CrossRef]
  37. Li, X.-S.; Yang, B.; Zhang, Y.; Li, G.; Duan, L.-P.; Wang, Y.; Chen, Z.-Y.; Huang, N.-S.; Wu, H.-J. Experimental investigation into gas production from methane hydrate in sediment by depressurization in a novel pilot-scale hydrate simulator. Appl.Energy 2012, 93, 722–732. [Google Scholar] [CrossRef]
  38. Wang, Y.; Feng, J.C.; Li, X.S.; Zhang, Y.; Li, G. Large Scale Experimental Evaluation to Methane Hydrate Dissociation below Quadruple Point in Sandy Sediment. Applied Energy. 2016, 162, 372–381. [Google Scholar] [CrossRef]
  39. Wang, Y.; Feng, J.C.; Li, X.S.; Zhang, Y. Analytic Modeling and Large-scale Experimental Study of Mass and Heat Transfer during Hydrate Dissociation in Sediment with Different Dissociation Methods. Energy 2015, 90, 1931–1948. [Google Scholar] [CrossRef]
  40. Li, X.S.; Wan, L.H.; Li, G.; Li, Q.P.; Chen, Z.Y.; Yan, K.F. Experimental Investigation into the Production Behavior of Methane Hydrate in Porous Sediment with Hot Brine Stimulation. Ind. Eng. Chem. Res. 2008, 47, 9696–9702. [Google Scholar] [CrossRef]
  41. Li, G.; Li, X.S.; Tang, L.G.; Zhang, Y. Experimental investigation of production behavior of methane hydrate under ethylene glycol injection in unconsolidated sediment. Energy Fuels 2007, 21, 3388–3393. [Google Scholar] [CrossRef]
  42. Bai, D.S.; Zhang, X.R.; Chen, G.J.; Wang, W.C. Replacement mechanism of methane hydrate with carbon dioxide from microsecond molecular dynamics simulations. Energy Environ. Sci. 2012, 5, 7033–7041. [Google Scholar] [CrossRef]
  43. Komatsu, H.; Ota, M.; Smith, R.L.; Inomata, H. Review of CO2-CH4 clathrate hydrate replacement reaction laboratory studies—Properties and kinetics. J. Taiwan Inst. Chem. E 2013, 44, 517–537. [Google Scholar] [CrossRef]
  44. Konno, Y.; Jin, Y.; Shinjou, K.; Nagao, J. Experimental evaluation of the gas recovery factor of methane hydrate in sandy sediment. RSC Adv. 2014, 4, 51666–51675. [Google Scholar] [CrossRef]
  45. Moridis, G.J.; Collett, T.S.; Boswell, R.; Kurihara, M.; Reagan, M.T.; Koh, C.; Sloan, E.D. Toward Production From Gas Hydrates: Current Status, Assessment of Resources, and Simulation-Based Evaluation of Technology and Potential. Spe Reserv. Eval. Eng. 2009, 12, 745–771. [Google Scholar] [CrossRef]
  46. Birkedal, K.A.; Freeman, C.M.; Moridis, G.J.; Graue, A. Numerical Predictions of Experimentally Observed Methane Hydrate Dissociation and Reformation in Sandstone. Energy Fuels 2014, 28, 5573–5586. [Google Scholar] [CrossRef]
  47. Kowalsky, M.B.; Moridis, G.J. Comparison of kinetic and equilibrium reaction models in simulating gas hydrate behavior in porous media. Energy Convers. Manag. 2007, 48, 1850–1863. [Google Scholar] [CrossRef]
  48. Su, Z.; He, Y.; Wu, N.Y.; Zhang, K.N.; Moridis, G.J. Evaluation on gas production potential from laminar hydrate deposits in Shenhu area of south China sea through depressurization using vertical wells. J. Petrol. Sci. Eng. 2012, 86–98. [Google Scholar] [CrossRef]
  49. Yamamoto, K. Japan Completes First Off shore Methane Hydrate Production Test—Methane Successfully Produced from Deepwater Hydrate Layers. Fire Ice 2013, 13, 1–2. [Google Scholar]
  50. Li, G.; Moridis, G.J.; Zhang, K.N.; Li, X.S. Evaluation of Gas Production Potential from Marine Gas Hydrate Deposits in Shenhu Area of South China Sea. Energy Fuels 2010, 24, 6018–6033. [Google Scholar] [CrossRef]
  51. Li, X.S.; Zhang, Y.; Li, G.; Chen, Z.Y.; Yan, K.F.; Li, Q.P. Gas hydrate equilibrium dissociation conditions in porous media using two thermodynamic approaches. J. Chem. Thermodyn. 2008, 40, 1464–1474. [Google Scholar] [CrossRef]
Figure 1. Map of northeastern part of South China Sea. The rectangle shows the location of the drilling area.
Energies 09 00222 g001
Figure 2. Bathymetric map of gas hydrate drilling area and sites.
Energies 09 00222 g002
Figure 3. Gas hydrate morphologies in core samples recovered from GMGS2 drilling sites, South China Sea. 1 and 2 (Site GMGS2-08F) massive; 3 and 4 (Site GMGS2-08E) laminated; 5 (Site GMGS2-08E) and 6 (Site GMGS2-08C) nodular; 7 (Site GMGS2-08E) vein; 8 (Site GMGS2-16D) disseminated.
Energies 09 00222 g003
Figure 4. Description of the cylindrical system used in the simulations.
Energies 09 00222 g004
Figure 5. Domain discretization of the hydrate reservoir in the simulations.
Energies 09 00222 g005
Figure 6. Spatial distributions of hydrate saturation, pressure, and temperatureat t = 0 day.
Energies 09 00222 g006
Figure 7. Reference case: evolution of cumulative volume of produced gas (Vp), cumulative volume of dissociated gas (VR), volumetric flow rate of produced gas (Qp), and volumetric flow rate of dissociated gas (QR) overtime.
Energies 09 00222 g007
Figure 8. Reference case: evolution of the cumulative mass of produced water (Mw) and gas to water ratio (RGW) overtime.
Energies 09 00222 g008
Figure 9. Reference case: evolution of the pore pressure (P) distribution overtime.
Energies 09 00222 g009
Figure 10. Reference case: evolution of the Temperature (T) distribution overtime.
Energies 09 00222 g010
Figure 11. Reference case: evolution of the hydrate saturation (SH) distribution overtime.
Energies 09 00222 g011
Figure 12. Sensitivity to the production pressure (PW): evolution of VP and VR overtime.
Energies 09 00222 g012
Figure 13. Sensitivity to the production pressure (PW): evolution of MW and RGW overtime.
Energies 09 00222 g013
Figure 14. Sensitivity to the production pressure (PW): evolution of P, SH, and T distribution at t = 30 years.
Energies 09 00222 g014
Figure 15. Sensitivity to the thermal conductivity (kΘ): evolution of VP and VR overtime.
Energies 09 00222 g015
Figure 16. Sensitivity to the thermal conductivity (kΘ): evolution of MW and RGW overtime.
Energies 09 00222 g016
Figure 17. Sensitivity to the thermal conductivity (kΘ): evolution of P, SH, and T distribution at t = 30 years.
Energies 09 00222 g017
Figure 18. Sensitivity to the intrinsic permeability (k): evolution of VP and VR overtime.
Energies 09 00222 g018
Figure 19. Sensitivity to the intrinsic permeability (k): evolution of MW and RGW overtime.
Energies 09 00222 g019
Figure 20. Sensitivity to the intrinsic permeability (k): evolution of P, SH, and T distribution at t = 30 years.
Energies 09 00222 g020
Table 1. Geophysical properties and simulation models in marine hydrate reservoir at Site GMGS2-8 of the Pearl River Mouth Basin.
ParameterValue
Layer thicknesses and porositiesAs in Figure 4
Hydrate saturation of HBLAs in Figure 4
Initial pressure at top of HBL (PT)8.11 MPa
Initial temperature at top of HBL(TT)277.60 K
Initial temperature at base of HBL (TB)281.53 K
Water depth798 m
Intrinsic permeability of sediment of each layerAs in Figure 4
Capillary pressure model [35]Pcap = −P01 [(S×)−1/λ−1] 1−λ
S× = (SASirA)/(SmxASirA)
P01 [23]105 Pa
λ0.45
Dry thermal conductivity (kΘRD) (all formations) [23]1.0 W/m/K
Wet thermal conductivity (kΘRW) (all formations) [23]3.1 W/m/K
Composite thermal conductivity modelkΘC = kΘRD + (SA1/2 + SH1/2) (kΘRWkΘRD) + φSIkΘI
Relative permeabilityModel [20]krA = (SA×)n
krG= (SG×)nG
SA×= (SASirA)/(1 − SirA)
SG×= (SGSirG)/(1 − SirA)
n [23]3.572
nG [23]3.572
SirG [23]0.05
SirA [23]0.30
Sea floor temperature T0 [23]277.15 K
Geothermal gradient G [23]0.045 K/m
Water salinity (mass fraction)3.50%

