Experimental Investigation and Discussion on the Mechanical Endurance Limit of Nafion Membrane Used in Proton Exchange Membrane Fuel Cell †

Abstract
:
1. Introduction
2. Experimental Section
2.1. Materials
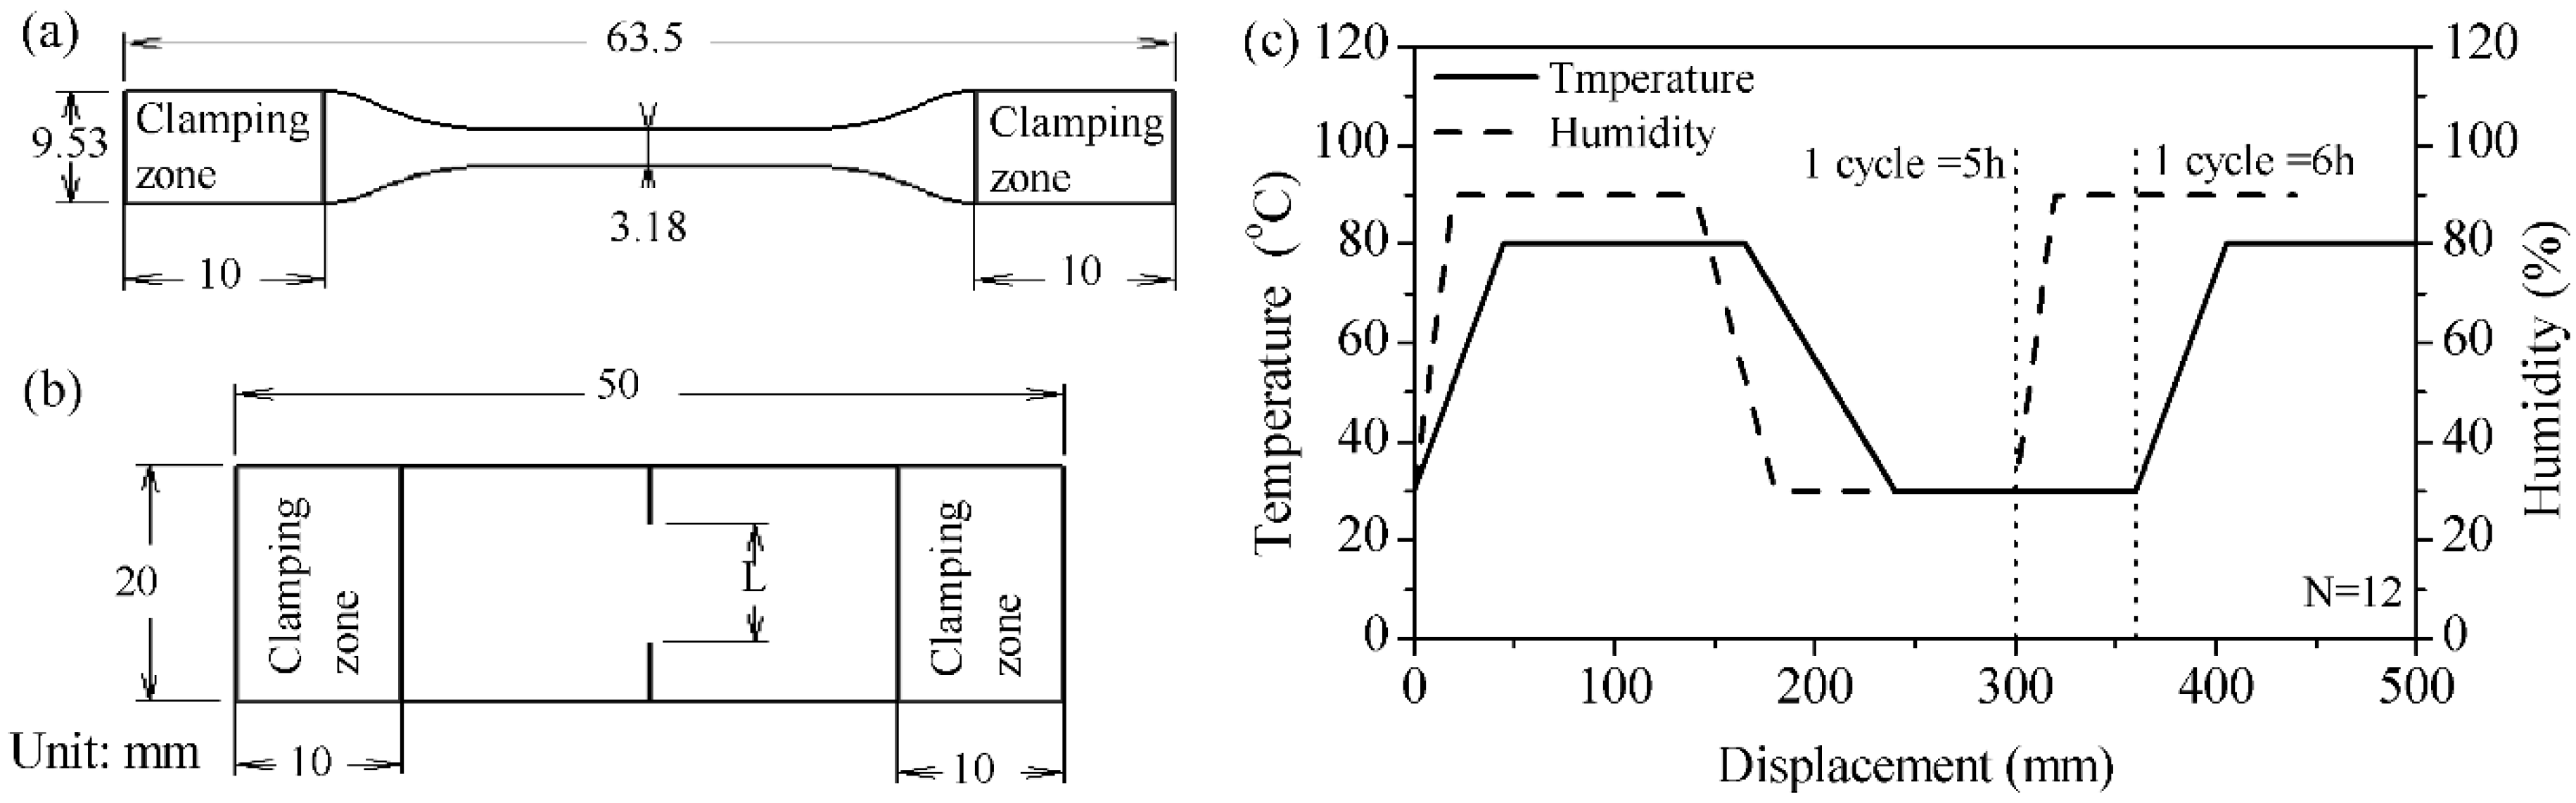
2.2. Specimen

2.3. Mechanical Properties
2.4. Observation and Measurement
3. Results and Discussion
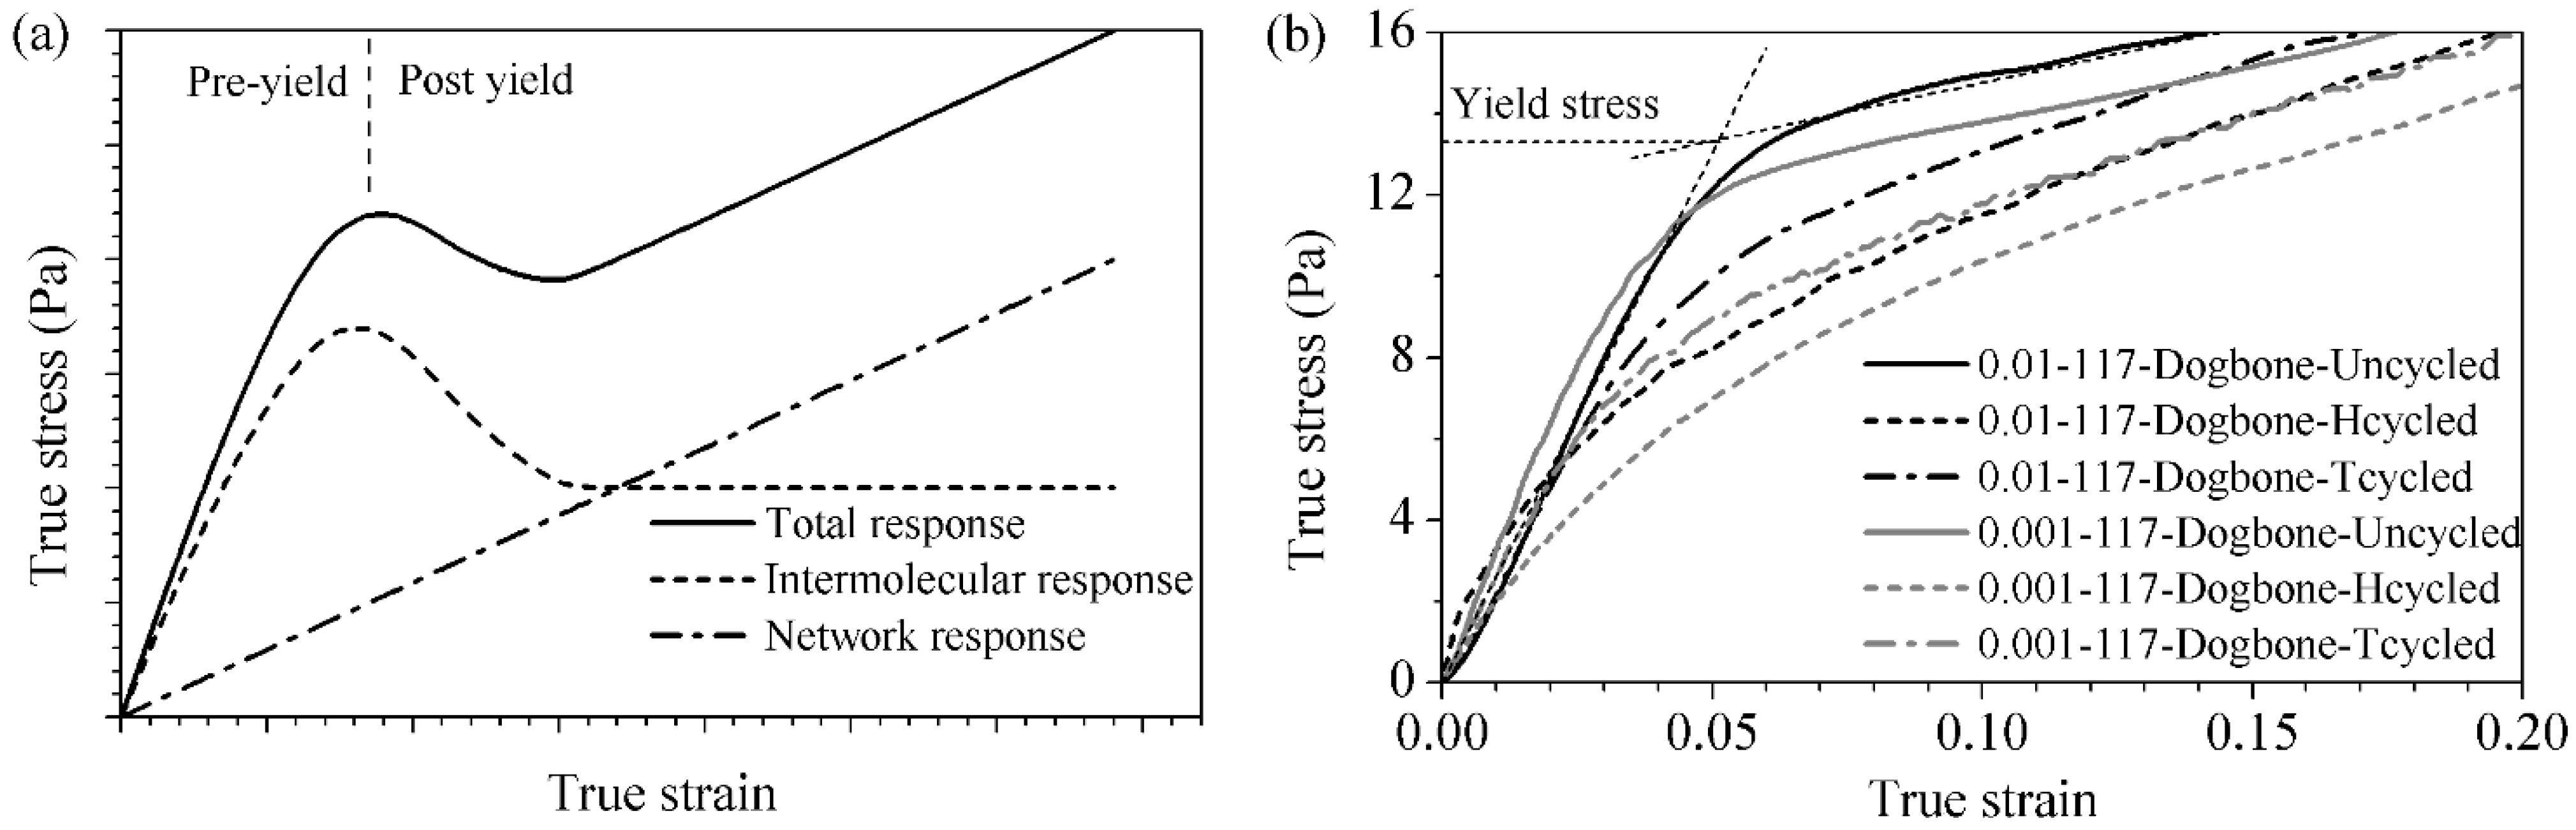
3.1. Dog-Bone Tensile Test


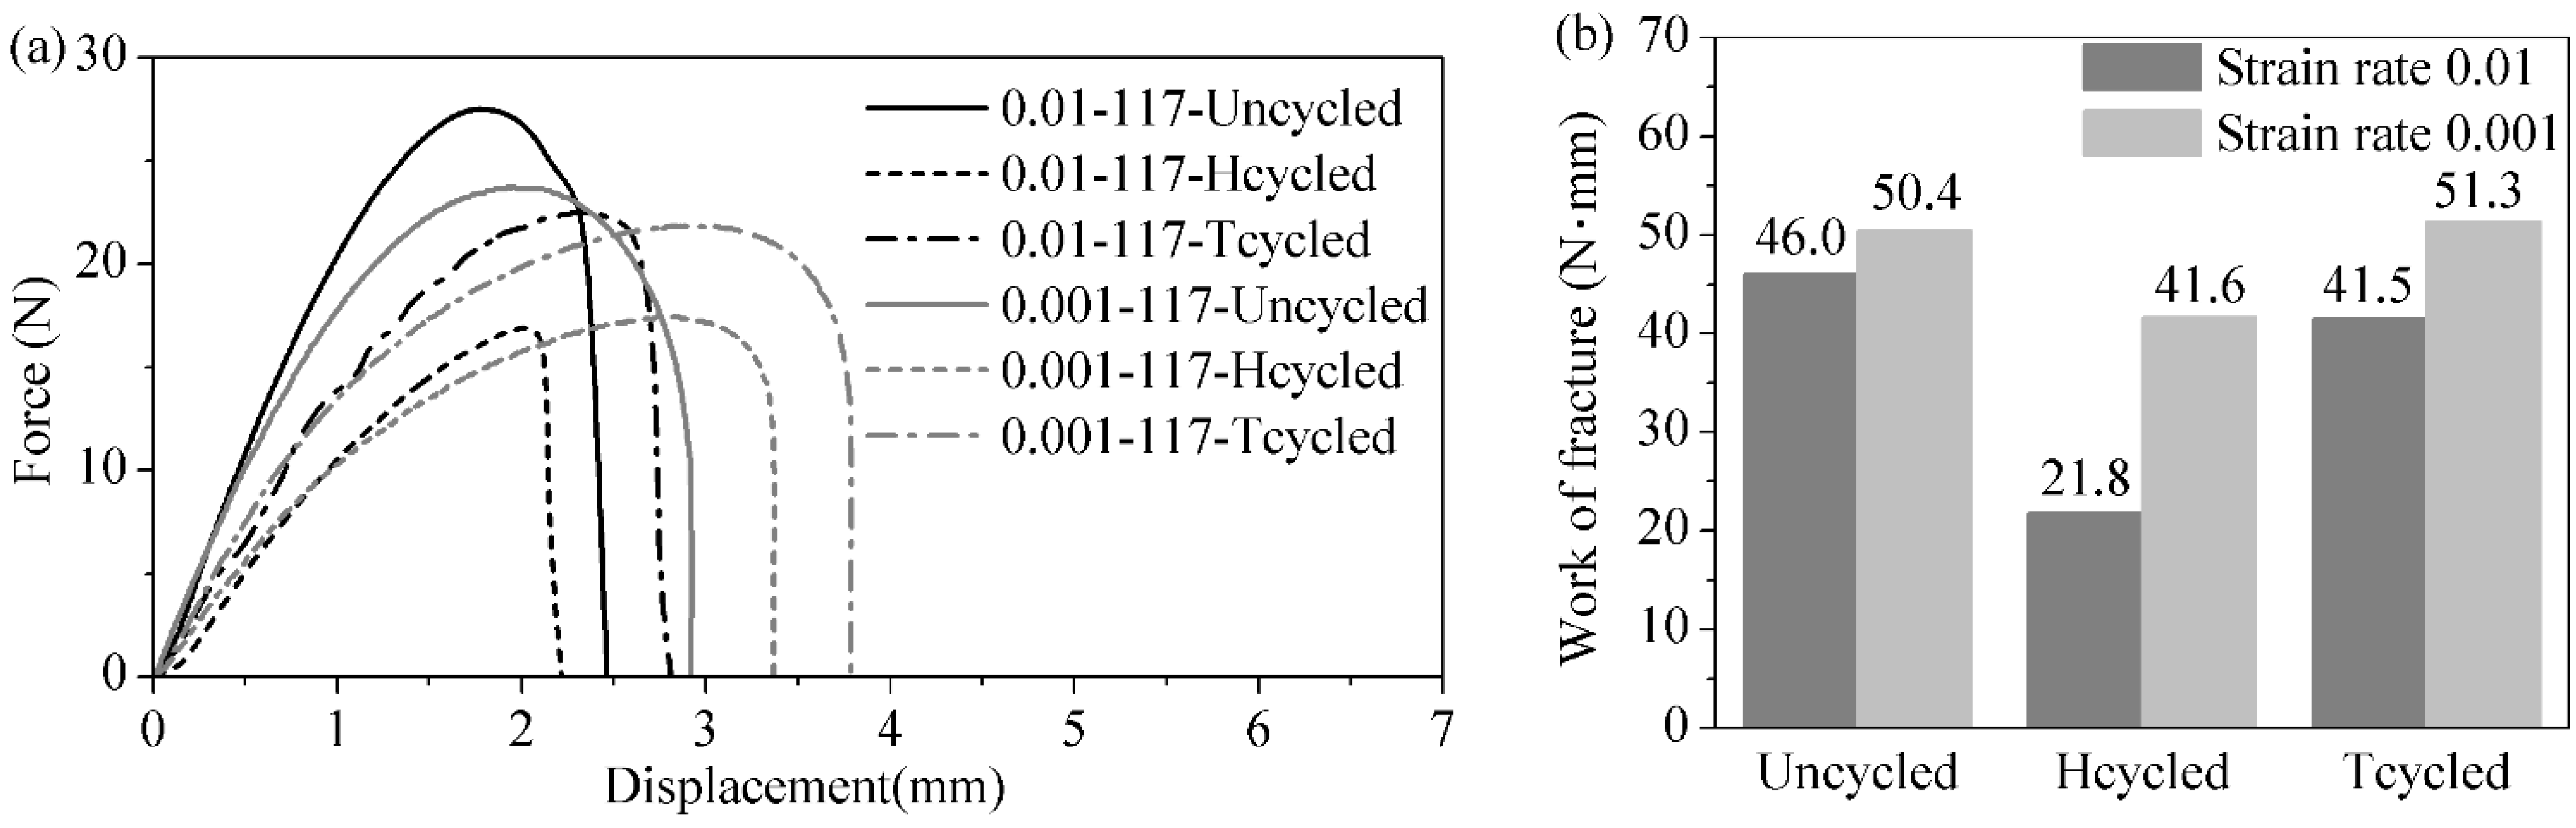
3.2. Deeply Double Edge Notched Test

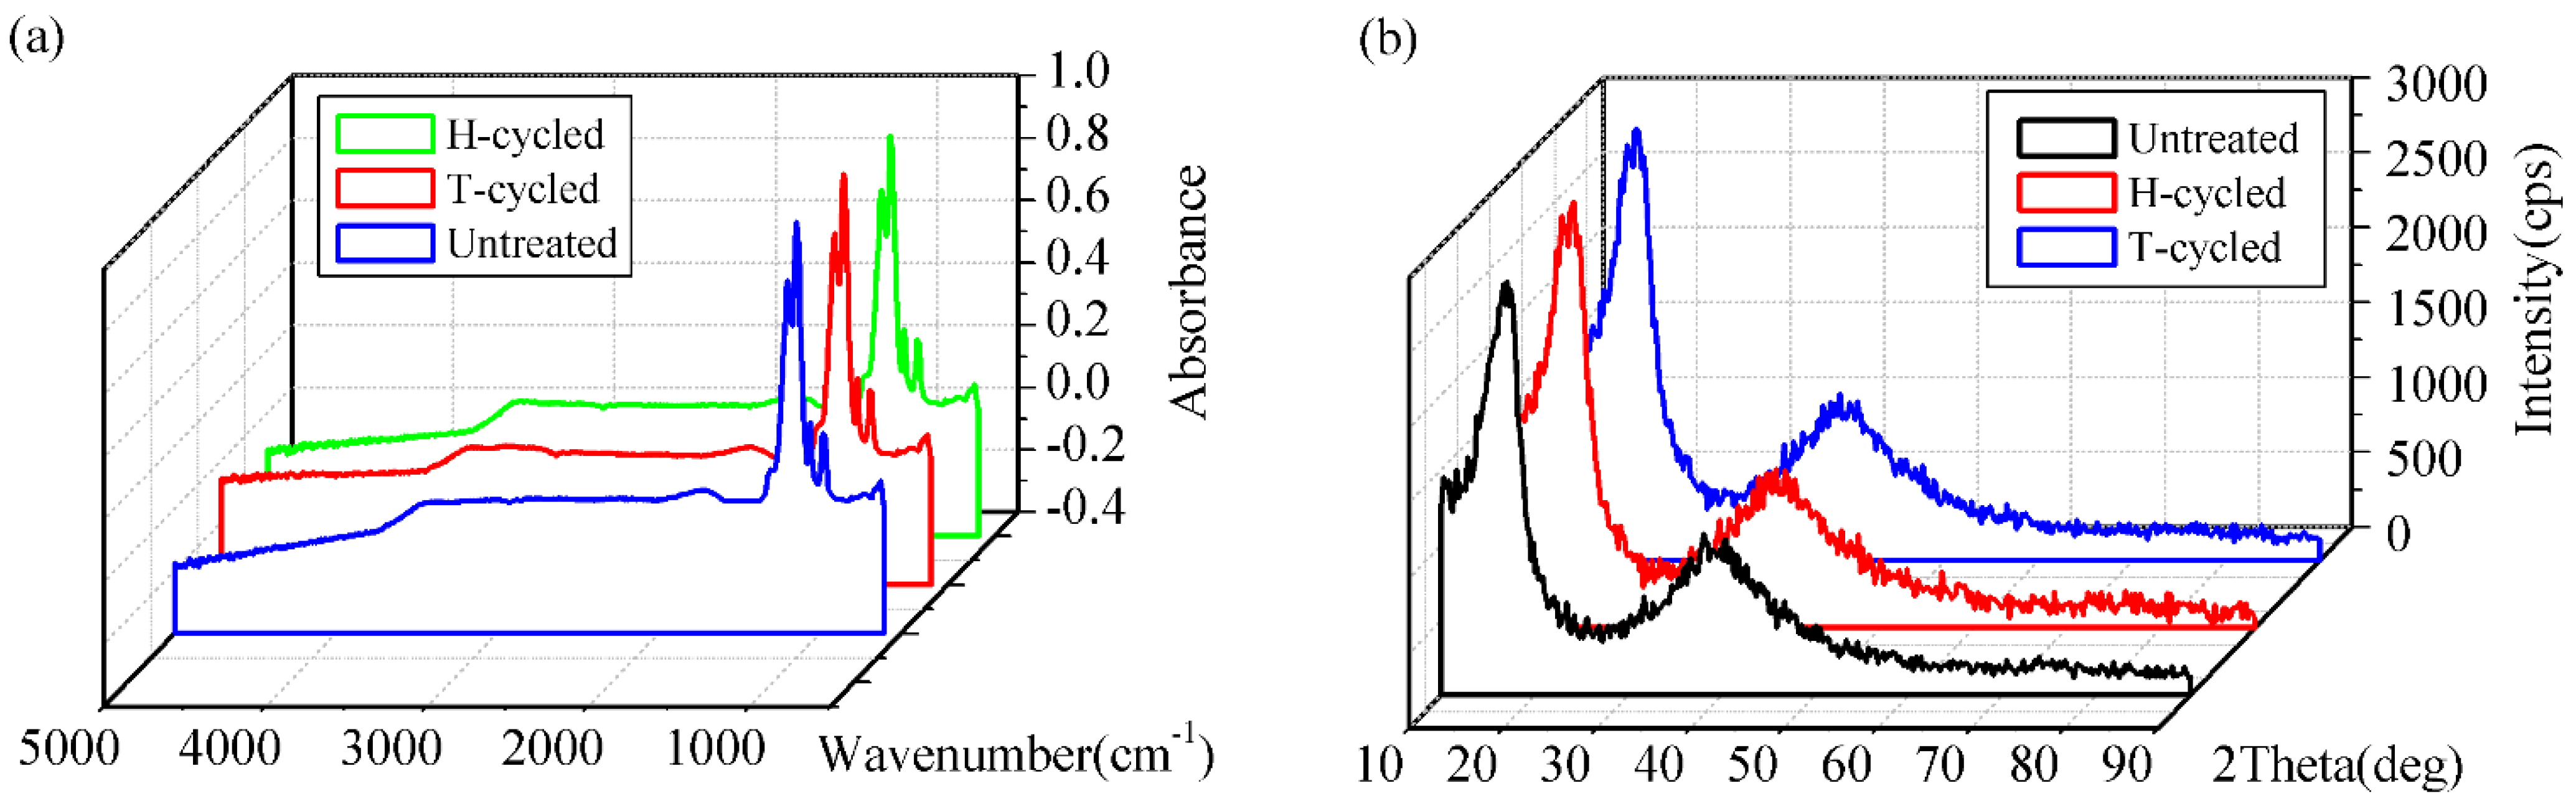
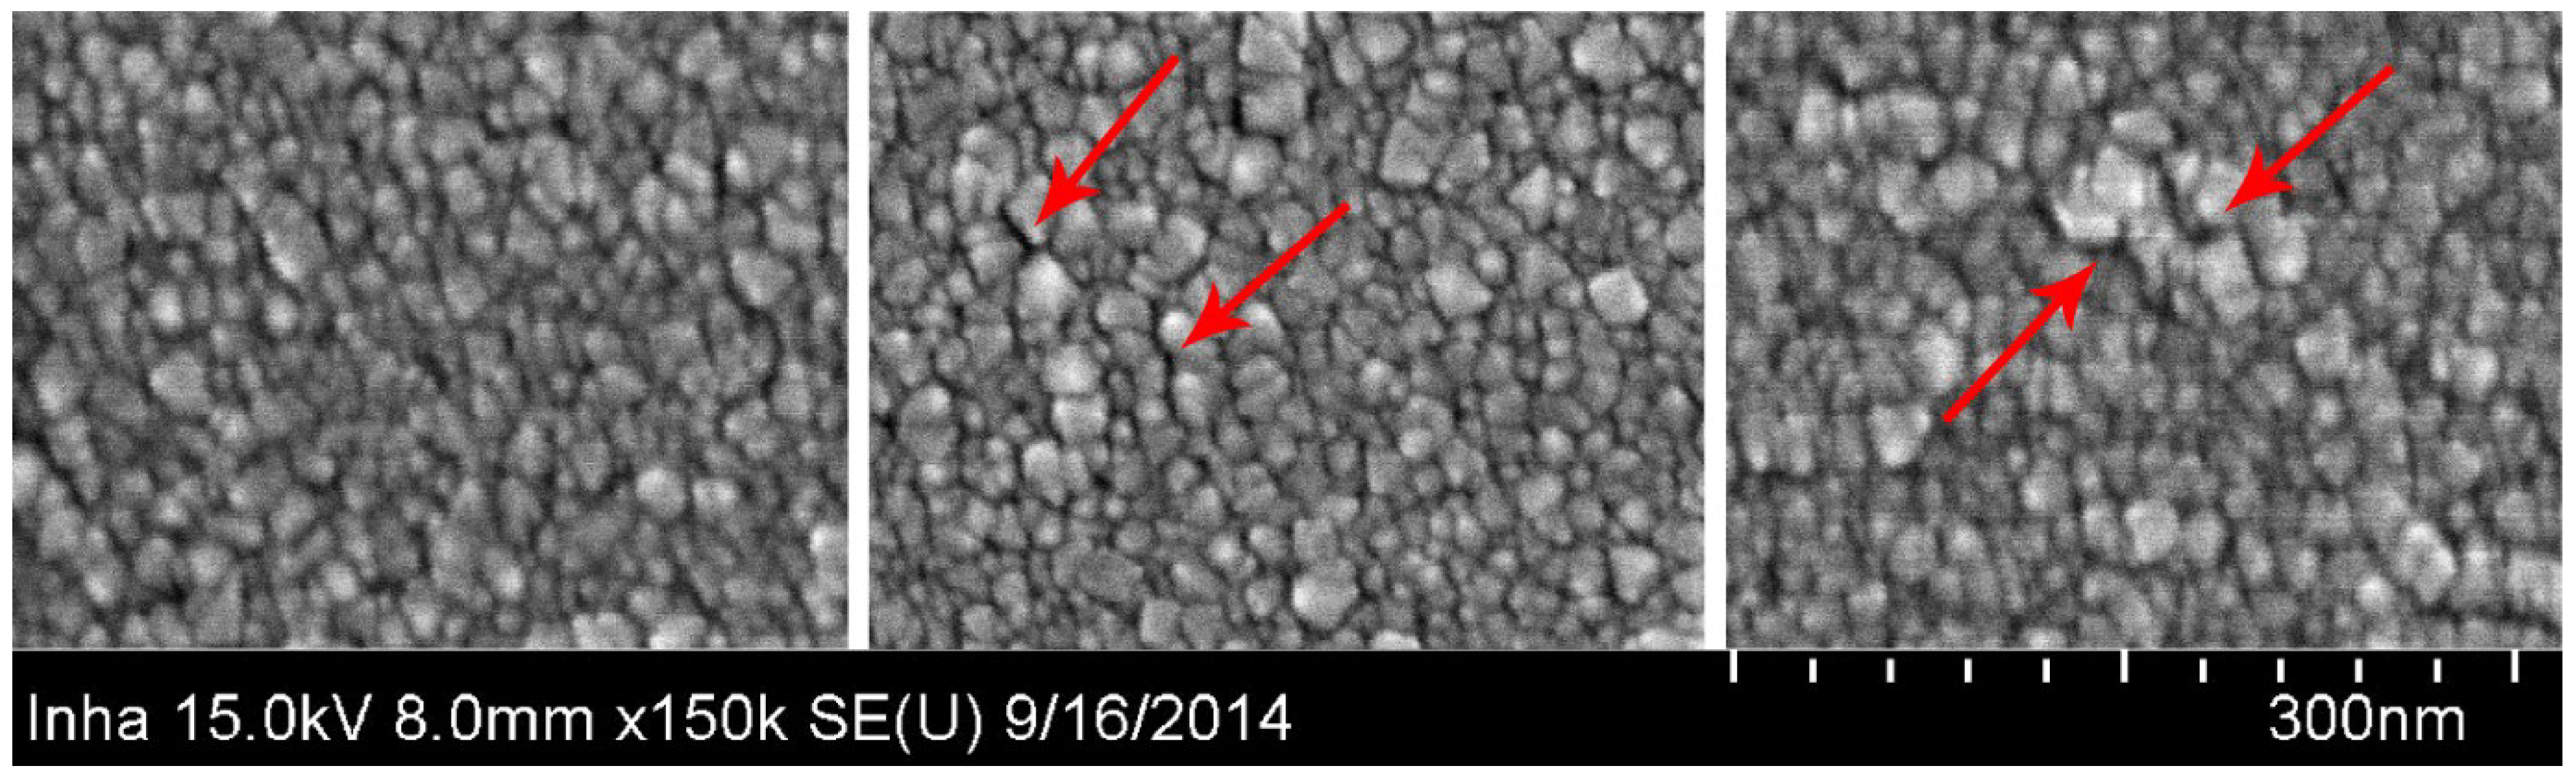
3.3. Observation and Measurement


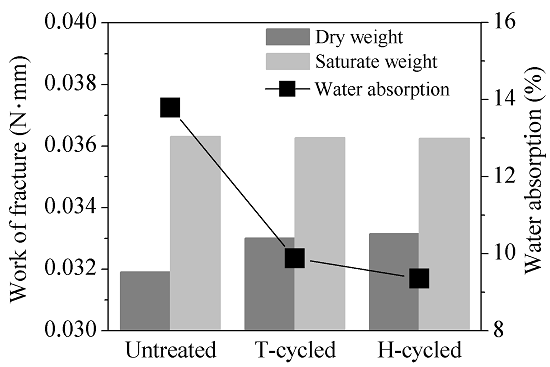
| Treatment | Dry Weight (g) | Saturate Weight (g) | Water Absorption (%) |
|---|---|---|---|
| Untreated | 0.03191 | 0.03631 | 13.79 |
| T-cycled | 0.03301 | 0.03627 | 9.88 |
| H-cycled | 0.03315 | 0.03625 | 9.36 |


4. Conclusions
Acknowledgments
Author Contributions
Conflicts of Interest
References
- Barbir, F.; Gomez, T. Efficiency and economics of proton exchange membrane (PEM) fuel cells. Int. J. Hydrog. Energy 1996, 21, 891–901. [Google Scholar] [CrossRef]
- Wang, Y.; Chen, K.S.; Mishler, J.; Cho, S.C.; Adroher, X.C. A review of polymer electrolyte membrane fuel cells: Technology, applications, and needs on fundamental research. Appl. Energy 2011, 88, 981–1007. [Google Scholar] [CrossRef]
- Peker, M.F.; Cora, O.N.; Koc, M. Investigations on the variation of corrosion and contact resistance characteristics of metallic bipolar plates manufactured under long-run conditions. Int. J. Hydrog. Energy 2011, 36, 15427–15436. [Google Scholar] [CrossRef]
- Xie, J.; Wood, D.L.; Wayne, D.M.; Zawodzinski, T.A.; Atanassov, P.; Borup, R.L. Durability of PEFCs at high humidity conditions. J. Electrochem. Soc. 2005, 152, A104–A113. [Google Scholar] [CrossRef]
- Zhang, S.S.; Yuan, X.Z.; Wang, H.J.; Merida, W.; Zhu, H.; Shen, J.; Wu, S.H.; Zhang, J.J. A review of accelerated stress tests of MEA durability in PEM fuel cells. Int. J. Hydrog. Energy 2009, 34, 388–404. [Google Scholar] [CrossRef]
- Kundu, S.; Fowler, M.W.; Simon, L.C.; Grot, S. Morphological features (defects) in fuel cell membrane electrode assemblies. J. Power Sources 2006, 157, 650–656. [Google Scholar] [CrossRef]
- Kusoglu, A.; Karlsson, A.M.; Santare, M.H.; Cleghorn, S.; Johnson, W.B. Mechanical behavior of fuel cell membranes under humidity cycles and effect of swelling anisotropy on the fatigue stresses. J. Power Sources 2007, 170, 345–358. [Google Scholar] [CrossRef]
- Solasi, R.; Zou, Y.; Huang, X.; Reifsnider, K.; Condit, D. On mechanical behavior and in-plane modeling of constrained PEM fuel cell membranes subjected to hydration and temperature cycles. J. Power Sources 2007, 167, 366–377. [Google Scholar] [CrossRef]
- Kim, S.; Ahn, B.K.; Mench, M.M. Physical degradation of membrane electrode assemblies undergoing freeze/thaw cycling: Diffusion media effects. J. Power Sources 2008, 179, 140–146. [Google Scholar] [CrossRef]
- Sahu, A.K.; Pitchumani, S.; Sridhar, P.; Shukla, A.K. Nafion and modified-Nafion membranes for polymer electrolyte fuel cells: An overview. Bull. Mater. Sci. 2009, 32, 285–294. [Google Scholar] [CrossRef]
- Fernandes, A.C.; Ticianelli, E.A. A performance and degradation study of Nafion 212 membrane for proton exchange membrane fuel cells. J. Power Sources 2009, 193, 547–554. [Google Scholar] [CrossRef]
- Yoon, W.; Huang, X. A nonlinear viscoelastic-viscoplastic constitutive model for ionomer membranes in polymer electrolyte membrane fuel cells. J. Power Sources 2011, 196, 3933–3941. [Google Scholar] [CrossRef]
- Silberstein, M.N.; Boyce, M.C. Constitutive modeling of the rate, temperature, and hydration dependent deformation response of Nafion to monotonic and cyclic loading. J. Power Sources 2010, 195, 5692–5706. [Google Scholar] [CrossRef]
- Kusoglu, A.; Karlsson, A.M.; Santare, M.H.; Cleghorn, S.; Johnson, W.B. Mechanical response of fuel cell membranes subjected to a hygro-thermal cycle. J. Power Sources 2006, 161, 987–996. [Google Scholar] [CrossRef]
- Xiao, Y.; Wendling, L.; Cho, C. Experimental investigation on the mechanical endurance limit of nafion membrane used in proton exchange membrane fuel cell. In Proceedings of the 1st International e-Conference on Energies, Basel, Switzerland, 14–31 March 2014; Volume 1, p. d005.
- American Society for Testing and Materials (ASTM). Tensile Properties of Plastics; ASTM D638–10; ASTM: West Conshohocken, PA, USA, 2010; p. D638. [Google Scholar]
- Silberstein, M.N.; Boyce, M.C. Hygro-thermal mechanical behavior of Nafion during constrained swelling. J. Power Sources 2011, 196, 3452–3460. [Google Scholar] [CrossRef]
- Arruda, E.M.; Boyce, M.C.; Jayachandran, R. Effects of strain-rate, temperature and thermomechanical coupling on the finite strain deformation of glassy-polymers. Mech. Mater. 1995, 19, 193–212. [Google Scholar] [CrossRef]
- Mulliken, A.D.; Boyce, M.C. Mechanics of the rate-dependent elastic-plastic deformation of glassy polymers from low to high strain rates. Int. J. Solids Struct. 2006, 43, 1331–1356. [Google Scholar] [CrossRef]
- Riku, I.; Mimura, K. Computational characterization on mechanical behavior of polymer electrolyte membrane based on nonaffine molecular chain network model. Int. J. Mech. Sci. 2010, 52, 287–294. [Google Scholar] [CrossRef]
- Ludvigsson, M.; Lindgren, J.; Tegenfeldt, J. Crystallinity in cast Nafion. J. Electrochem. Soc. 2000, 147, 1303–1305. [Google Scholar] [CrossRef]
© 2014 by the authors; licensee MDPI, Basel, Switzerland. This article is an open access article distributed under the terms and conditions of the Creative Commons Attribution license (http://creativecommons.org/licenses/by/4.0/).
Share and Cite
Xiao, Y.; Cho, C. Experimental Investigation and Discussion on the Mechanical Endurance Limit of Nafion Membrane Used in Proton Exchange Membrane Fuel Cell. Energies 2014, 7, 6401-6411. https://doi.org/10.3390/en7106401
Xiao Y, Cho C. Experimental Investigation and Discussion on the Mechanical Endurance Limit of Nafion Membrane Used in Proton Exchange Membrane Fuel Cell. Energies. 2014; 7(10):6401-6411. https://doi.org/10.3390/en7106401
Chicago/Turabian StyleXiao, Yang, and Chongdu Cho. 2014. "Experimental Investigation and Discussion on the Mechanical Endurance Limit of Nafion Membrane Used in Proton Exchange Membrane Fuel Cell" Energies 7, no. 10: 6401-6411. https://doi.org/10.3390/en7106401