
Financial Development, Clean Energy, and Human Capital: Roadmap towards Sustainable Growth in América Latina


1
School of Economics, Universidad Nacional de Loja, Loja 11050, Ecuador
2
Financial Economy and Accounting Department, Faculty of Business, Finance and Tourism, University of Extremadura, 10071 Cáceres, Spain
3
Business Management and Marketing Department, Faculty of Business Sciences and Tourism, University of Vigo, 32004 Ourense, Spain
*
Author to whom correspondence should be addressed.
Energies 2021, 14(13), 3763; https://doi.org/10.3390/en14133763
Submission received: 8 May 2021
/
Revised: 19 June 2021
/
Accepted: 21 June 2021
/
Published: 23 June 2021
Abstract
:The consumption of renewable energy has become a substitute for fossil fuels to mitigate environmental degradation. However, this substitution of energy raises many questions regarding its possible impact on economic growth. In this context, this research aims to examine the long-term relationship between economic growth and financial development, non-renewable energy, renewable energy, and human capital in 16 Latin American countries. Panel data techniques during the period 1988–2018 and statistical information compiled by the World Bank and Penn Word Table databases were used. Second-generation econometric techniques (cross-sectionally augmented Dickey–Fuller (CADF) and cross-sectionally augmented IPS (CIPS) were used in the work methodology, which allow the presence of cross-sectional dependence between sections to be controlled. The main results indicate that there is a long-term equilibrium relationship between financial development, non-renewable energy consumption, renewable energy consumption, human capital, and economic growth. The results show that the consumption of renewable energy does not compromise economic growth; the 1% increase in renewable energy consumption is related to the 1% increase in economic growth. The policy implications suggest some measures to ensure economic growth considering the role of green energy and human capital.
1. Introduction
The World Economic Outlook report developed by the World Bank [1] indicates that the world economy showed the worst performance since World War II, which, according to its forecasts, will have declined by 5.2% by 2020. In addition, due to serious domestic supply and demand distortions, prolonged trade conflicts, and financial instability, economic activities are expected to contract in 2020 by 7% in advanced economies and by 2.5% in emerging and developing economies (EMDEs). According to forecasts, all this will cause a reduction in per capita income of 3.6%, pushing millions of inhabitants into extreme poverty, and therefore, inequalities will increase [1]. As for Latin America, the report based on the preliminary balance of the economies of Latin America and the Caribbean developed by the Economic Commission for Latin America and the Caribbean (ECLAC) [2] mentions that between the years 2014 and 2019, there was a low economic growth of 0.3% (specifically, in 2019, it reached a growth rate of 1%) and for the year 2020, a decrease of 7.7% is expected. These data show that Latin America and the Caribbean are facing the worst economic, social, and productive crisis in the last 120 years, caused by the implementation of social confinement policies, the fall of merchandise exports, and the closure of economic activities (mainly in the tourism sector), causing an increase in unemployment and as a result an increase in poverty and inequality.
Several theoretical and empirical studies have been published in the economic literature that explain the effect of financial development, non-renewable energy consumption, renewable energy consumption, and human capital on economic growth. Abubakar et al. [3] reveal that financial development contributes significantly to economic growth in the Economic Community of West African States (ECOWAS) region, either directly or through human capital. In contrast, Shahbaz et al. [4] recommend that implementing an investment climate and improving human resources will foster economic growth, given that sustainable and unsustainable energies incentivise economic growth in a sample of 38 renewable-energy-consuming countries. First, the literature emphasises that financial services are the main engine of economic growth, being important for innovation and productive investment [5]. In addition, studies such as Boukhatem and Ben [6], Ali et al. [7], and Pradhan et al. [8] prove that financial development contributes positively to economic growth, indicating that finances help improve families’ standard of living. Another line of studies indicates that the consumption of non-renewable energy is a key input for economies worldwide since it plays a major role in the level of production and holds a key place in consumer spending [9]. In this regard, the higher the non-renewable energy consumption is, the higher the economic growth, with a high spread of contamination in 193 countries [10]. In this sense, limiting this type of energy will exacerbate growth [11]. Therefore, polluting energy is crucial for economic growth, and economic growth also drives polluting energy consumption in emerging market and developing economies (EMDEs) [12]. Similarly, the literature assumes that renewable energy is a strategic element that is positively related to economic growth and sustainable development. For example, Alvarado et al. [13] show that sustainable energy has a positive effect on economic growth in Latin American countries. Likewise, for D8 countries, Mahjabeen et al. [14] find that renewable energy has a strong positive association with economic development. Consequently, removing financial and political obstacles are important paths towards the deployment of renewable sources [4]. Finally, there is strong evidence suggesting that human capital accumulation has a beneficial effect on long-term economic growth [3,15].
In this context, the aim of this research is to examine the causal link between financial development, non-renewable energy consumption, renewable energy consumption, and human capital on long-term economic growth for 16 Latin American economies, during the period 1988–2018. The hypothesis that supports this research is the existence of a positive effect of the explanatory variables on economic growth. Data collected from the World Bank [1] and Penn World Table [16] were used, and in order to determine the most efficient tests of the series under study, the existence of cross-sectional dependence was determined through the Pesaran test [17]. In order to support the findings of the previous test, second-generation unit root tests of Pesaran [18] were performed. Next, through the cointegration tests of Westerlund [19] and fully modified ordinary least squares (FMOLS), a long-term relationship between the variables under analysis was observed. Finally, the Granger-type causality test developed by Dumitrescu and Hurlin [20] was used to examine the causality and direction of the variables.
The main findings provided by the estimates refer to the existence of a long-term equilibrium relationship between financial development, non-renewable energy consumption, renewable energy consumption, and human capital with economic growth. Similarly, through the fully modified ordinary least squares (FMOLS) test, it is observed that there is a positive and statistically significant relationship between the explanatory variables of financial development, non-renewable energy consumption, renewable energy consumption, and human capital on long-term economic growth. Finally, bidirectional and unidirectional causalities are found among the variables analysed.
Finally, it is worth mentioning that this research contributes new knowledge to the current scientific field regarding the analysis of the variations in economic growth caused by financial development, non-renewable energy consumption, renewable energy consumption, and human capital in 16 Latin American countries at a global level. In this regard, the main novelty of the research conducted is based on two aspects. First, unlike the work of Williams [21], this study includes other explanatory variables, such as non-renewable energy consumption, renewable energy consumption, and the role of human capital, which contributes by obtaining new evidence to the current economic literature for Latin American countries. Second, the presence of cross-sectional dependence between countries is controlled by applying second-generation cointegration tests that control this type of problem and are more effective in assessing the effects of the determinants of long-term economic growth.
This document includes four sections in addition to the introduction. Section 2 shows the literature review related to current research on the subject. Section 3 describes the data to be used, and the methodological strategy is proposed. Section 4 reports and discusses the empirical results of the research. Finally, Section 5 presents the conclusions and policy implications of the study.
2. Literature Review
The theory that supports the relationship between financial development and economic growth is that of Schumpeter [5], who identifies financial services as the primary engine of economic dynamism because they are relevant for innovation and productive investment. Thus, by raising the transcendental value of credit for implementing the entrepreneur’s activities, it gives the entrepreneur the role of the primary actor in economic growth. The value arises from the entrepreneur’s need for credit in the event of creating, to perform his/her business combinations and thus boost the production process. However, other factors that determine economic growth should be considered in a complementary way. In this regard, this section divides the studies into four groups, depending on the explanatory variables used: financial development, non-renewable energy consumption, renewable energy consumption, and human capital.
The most recent studies such as Boukhatem and Ben [6] are in the first group. By using fully modified ordinary least squares (FMOLS) regressions grouped for the Middle East and North Africa (MENA) Region, it is found that Islamic financial development has a positive impact on economic growth, but this impact is obstructed by lagging institutional frameworks. In contrast, in a sample for 100 countries categorised according to their political stability, Ali et al. [7] reveal that financial development is more beneficial in free countries than in partially free and non-free countries in the long term. They also state that there is bidirectional causality between financial development and GDP per capita in all groups of countries. In addition, by using the autoregressive distributed lag (ARDL) model based on past historical trends of financial development with interaction to GDP per capita, Wu et al. [22] find that there is a bidirectional causal relationship for China, Japan, and India with the virtue of positive supply and negative demand in the short term. On the other hand, when Pradhan et al. [8] use Granger cointegration and causality tests for 49 European countries, they determine that financial development and innovation are drivers of long-term economic growth. In addition, they explain that there is bidirectional causality of financial development and innovation with economic growth.
On the contrary, when using the system dynamic panel strategy (generalised method of moment (GMM)), Williams [21] argues that financial development does not significantly contribute to economic growth in 32 emerging Latin American countries since credit is provided more to households than to businesses. Therefore, applying appropriate measures to financial development can regain the link between finance and growth [23]. Another study carried out by Ouyang and Li [24] in 30 provinces of China finds that the financial sector has a negative influence on economic growth due to the excessive advance in tangible assets instead of knowledge-based assets; they also find unidirectional causality that advances from economic growth to financial development only for the central region, while at a global level, as in the eastern and western regions, they determine unidirectional causality from financial development to economic growth. However, Swamy and Dharani [25] state that non-linearity is shown in the group of 29 advanced economies due to the pre-existence of an inverted U-shaped relationship between financial development and long-term economic growth, arguing that excessive financing is harmful; they also argue that there is bidirectional causality, that is, financial development must be related to an improvement in economic growth. Finally, Polemis et al. [26] identify that in developed and developing countries, financial indicators (domestic credit to the private sector and money in the broad sense) have a weak and slightly non-linear relationship on economic growth.
The second group relates non-renewable energy consumption with economic growth. Therefore, when using GLS estimators (generalised least squares) for 34 OECD economies in the research by Kahouli [9], it is argued that the consumption of non-renewable energy is a primary factor for economic development, indicating that a decrease in this energy can limit the production process; furthermore, the presence of bidirectional causality between non-renewable energy towards economic growth is suggested, which implies that both variables are jointly determined. The implementation of energy strategies and policies are therefore important to manage economic growth [8]. Furthermore, after analysing 10 energy-consuming countries (China, the United States, Russia, India, Japan, Canada, Germany, Brazil, France, and South Korea), Shahbaz et al. [26] find that there is a positive association between energy consumption and economic growth, with the presence of different variations according to the characteristics of each country. In contrast, studies that include other determinants of the economic boom such as Baz et al. [27], show the existence of asymmetric cointegration between non-renewable energy consumption, agriculture, capital, and economic growth when using a nonlinear autoregressive distributed lag (NARDL) model; they also corroborate unidirectional causality from the use of polluting energy to economic growth. However, Wu [28] affirms that polluting energy has an asymmetric effect on economic growth; however, reducing this energy reduces economic growth in the long term but not in the short term in the United States. For this reason, financial systems must consider environmental aspects in their current operations [29].
On the other hand, Le [11] examines 46 emerging market and developing economies (EMDEs) by using second-generation econometric techniques; augmented mean group (AMG) estimator, mean groups (MG), and common correlated effects MG (CCEMG) estimators. Their findings state that the use of non-renewable energy positively affects long-term economic growth. In addition, they determine bidirectional causality between the use of energy and economic growth, indicating that both variables are interdependent. Similarly, Le and Van [12] and Adams et al. [30] agree that non-renewable energy consumption and renewable energy consumption have a positive impact on long-term economic growth; furthermore, they detect the presence of bidirectional causality between the components of energy consumption (non-renewable and renewable fuels) and economic growth. However, after analysing Ecuador by Pinzón [31], causality is confirmed, in which the argument advances from energy consumption evaluated by oil consumption to economic growth in Ecuador, given that it is an oil-exporting country and an importer of oil products. Moreover, when using cointegration and causality for the Association of Southeast Asian Nations (ASEAN) by Chontanawat [32], a long-term equilibrium relationship between energy consumption, CO2 emissions, and economic growth is found; furthermore, he concludes that there is unidirectional causality from GDP per capita to long-term non-renewable energy consumption. Therefore, it is necessary to sensitise public opinion and carry out structural reforms that help mitigate environmental pollution [33].
Maji and Sulaiman [34] is in the third group, which relates renewable energy consumption with economic growth, and who claim that renewable energy consumption slows down economic growth, whereby the main source of energy is biomass from wood, which is dirty and polluting when burned in West African countries. Meanwhile, Chen et al. [35] state that developing countries seeking a positive effect of renewable energy investment on economic growth must exceed a particular threshold for clean energy consumption. By using an autoregressive distributed lag (ARDL) model, Smolović et al. [36] find that in the short term, the consumption of renewable energy has a negative effect on economic growth, while in the long term, the consumption of renewable energy has positive effects on growth in the member states of the European Union (EU). Similarly, Shahbaz et al. [4] ensure that the consumption of renewable energy has a positive impact on long-term economic growth.
On the other hand, Alvarado et al. [13] and Zafar et al. [37] detect the presence of a long-term equilibrium relationship between renewable and non-renewable energy consumption and economic growth when applying cointegration and causality approaches; they also find that both types of energy have a positive effect on long-term economic growth. Similarly, Mafizur and Velayutham [38] suggest that renewable and non-renewable energies are drivers of long-term economic growth and, in addition, they detect unidirectional causality that moves from economic growth to the consumption of renewable energies. Therefore, countries must opt for the combination of energy types and a progressive transition towards clean energy sources, supported by policies and technological advances to create, preserve and transmit renewable energy generation [14].
Finally, the fourth group contains studies that relate human capital with economic growth. For example, Fang and Chang [39] ensure the existence of a long-term equilibrium relationship between human capital and economic growth through cointegration techniques, and they show that human capital has an insignificant positive impact on long-term economic growth. As for Abubakar et al. [3] and Fahimi et al. [15], by using FMOLS estimators, they reveal that the accumulation of human capital contributes significantly to economic growth, and they also indicate that there is bidirectional causality between economic growth and human capital. However, Hamdan et al. [40] confirm unidirectional causality ranging from economic growth to human capital. Finally, Ogundari and Awokuse [41] determine that the positive impacts of education depend on the development level of countries.
3. Data and Methodology
3.1. Data
The data used in this investigation of GDP per capita (USD at constant 2010 prices), internal credit to the private sector (USD at constant 2010 prices), non-renewable energy consumption (Kg of oil equivalent per capita), and renewable energy consumption (% of total final energy consumption) were obtained from the World Development Indicators database [42] of the World Bank. The human capital index was obtained from the Penn World Table [16], version 9.1 database of the Centre for Growth and Development of the University of Groningen. These variables were selected according to the previous literature review since there are no studies that have considered these variables together in their analyses. Therefore, for the econometric regressions, per capita GDP as an economic growth indicator was considered a dependent variable, and domestic credit to the private sector as a proxy for financial development was considered an independent variable, given that it is the main source of financial intermediation for savers and investors who channel the private sector in developing countries; three control variables were also included: non-renewable energy consumption because it is the main input to decide the degree of production of goods and services in a country; renewable energy consumption since it comes from clean and inexhaustible resources that help mitigate climate change and guarantee sustainable economic growth; the human capital index since it is a fundamental factor of knowledge and skills that individuals acquire through education that allows improving the workforce. On the other hand, the research analysis covered 16 Latin American countries that have data available for the five variables for the period 1988–2018: Argentina, Bolivia, Brazil, Chile, Colombia, Costa Rica, Ecuador, Guatemala, Honduras, Mexico, Nicaragua, Panama, Paraguay, Peru, Dominican Republic, and Uruguay. In addition, the data of all the variables were transformed into logarithms in order to reduce the measurement heterogeneity of the variables. Following this, Table 1 shows the description of each of the variables used in the econometric models.
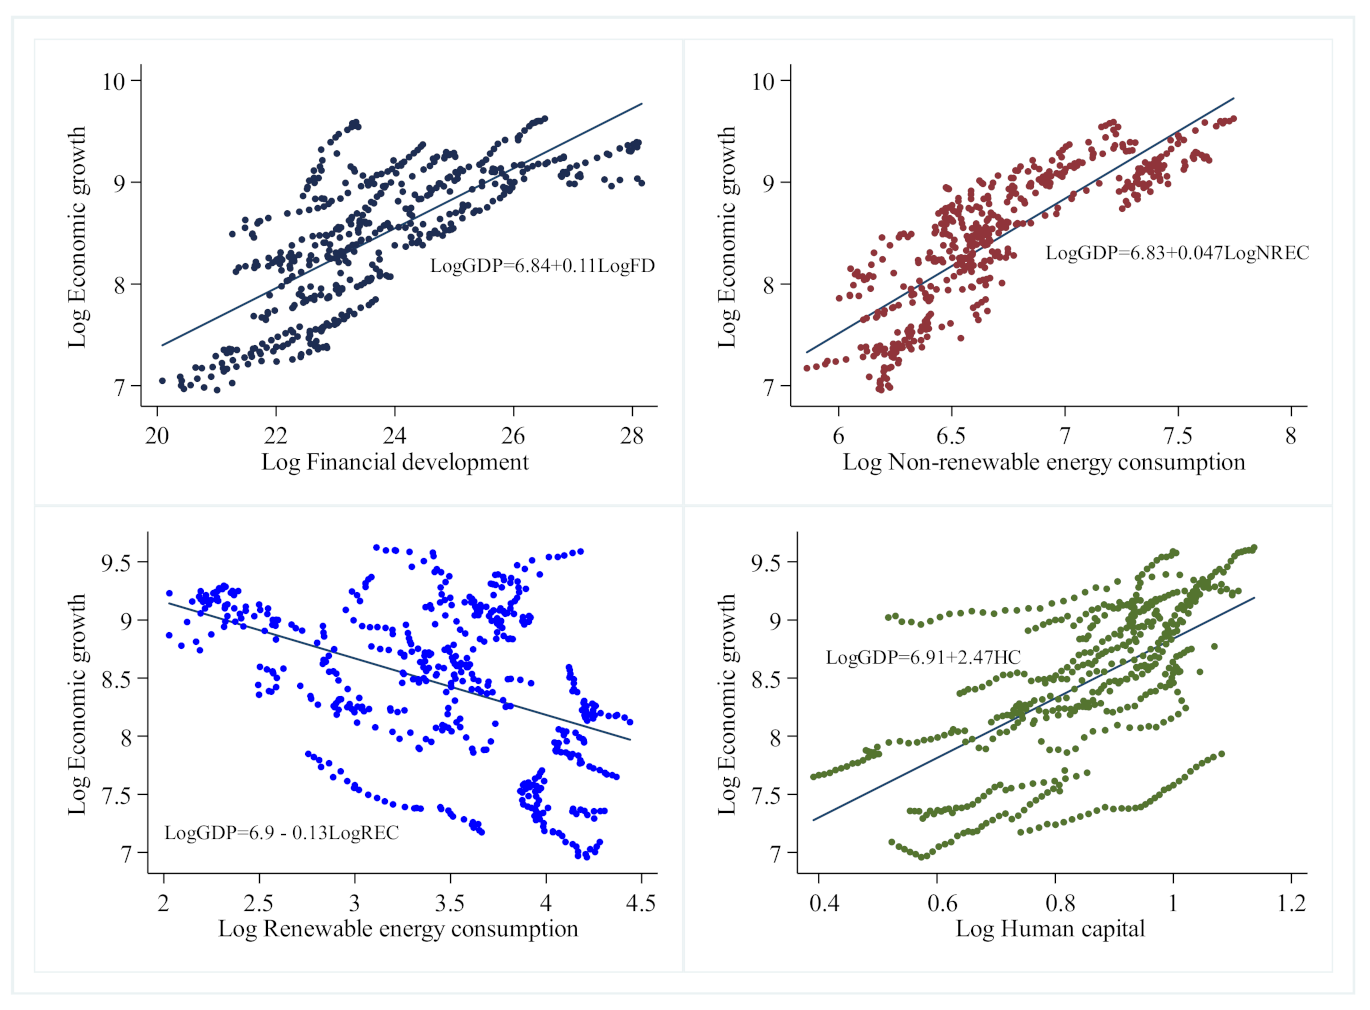
Figure 1 shows the correlations between the variables, namely, financial development, non-renewable energy consumption, human capital, and economic growth in a preliminary way, which have a high and significant positive correlation, suggesting that these variables play an important role in promoting economic production in Latin American countries. However, the renewable energy consumption variable shows a negative correlation with economic growth.
Table 2 summarises the correlations between economic growth and the variables financial development, non-renewable energy consumption, renewable energy consumption, and human capital at a significance level of 1%.
Table 3 collects the descriptive statistics of all the variables included in the research, where it is observed that the data panel is balanced because it consists of 496 data in general that involve 16 countries corresponding to a time period of 31 years. In addition, the mean, standard deviation, minimum and maximum values, and the number of observations are shown. In general, economic growth, financial development, non-renewable energy consumption, renewable energy consumption, and human capital show greater variability at the general level than between countries and within each country.
The descriptive statistics that include the mean, standard deviation, minimum, and maximum of the variables are illustrated in Figure 2 below.
3.2. Econometric Strategy
Several approaches were adopted in the econometric strategy. First, we started from a baseline regression to the theoretical contribution of Schumpeter [5], who indicates that economic growth is a function of financial development, as formalised in Equation (1).
To determine what other variables affect the economic growth of Latin American countries, a new model is presented, which includes control variables such as non-renewable energy consumption, renewable energy consumption, and human capital, as shown in Equation (2).
In Equations (1) and (2), GDP represents the logarithm of economic growth; FD represents the logarithm of financial development; NREC represents the logarithm of non-renewable energy consumption; REC indicates the logarithm of renewable energy consumption; HC is the logarithm of human capital; for countries i = 1, 2, 3,…, 16 in the period t = 1988, 1989,…, 2018 and finally, εit is the error term.
Then, to avoid biased and inconsistent results, we tested for cross-sectional dependence using the Pesaran [17] diagnostic test, which is recommended for balanced and unbalanced panels. The statistic of the Pesaran test [17] has the following expression:
where N denotes the number of cross sections (countries), T denotes the period, and shows the ordered pairwise correlation that corresponds to the cross sections in each period, as described in Equation (6).
where and denote the scaled residuals of the specific ordinary least squares (OLS) regressions for each cross section (countries) i = 1, 2, 3,…, N.
Next, for the panel with the presence of cross-sectional dependence, the second-generation unit root tests were estimated, which are more robust and reliable in this case, for which the cross-sectionally augmented Dickey–Fuller (CADF) tests and the cross-sectionally augmented IPS (CIPS) proposed by Pesaran [17] were estimated. Therefore, the first known Dickey–Fuller augmented cross-sectional test (CADF) is specified in Equation (5).
where, and is the regression error.
As for the second test, it is calculated from the average of the individual ADF statistics increased in the cross section (CADF) and is called CIPS*, which analyses the unit root properties of the whole panel as shown in Equation (6).
where indicates the cross-sectional augmented Dickey–Fuller statistic for i representing each cross-sectional unit.
Subsequently, in the presence of cross-sectional dependence, the Westerlund [19] error correction test was applied to verify the long-term relationship between the variables. The test allowed us to conclude whether there is cointegration for individual panels and the entire panel as a whole, considering that the variables analysed are stationary. Equation (7) expresses the error correction that defines the speed of correction towards equilibrium as follows:
where ; and express the deterministic components; represents the constant term; and denote the orders and advances of each of the countries.
The Westerlund test [19] yields four statistics, where and indicate that at least one cross section is cointegrated, and the statistics and reveal that the entire panel is cointegrated, to evaluate the null hypothesis of non-cointegration as shown in Equations (8)–(11).
Then, for the cointegration between the studied variables, the fully modified ordinary least squares (FMOLS) method proposed by Phillips and Hansen [43] was used, who analysed the semi-parametric correction to eliminate bias problems. Next, the following equation formalises the FMOLS:
Finally, as part of the econometric strategy, the Granger causality test [44] was applied for panel data developed by Dumitrescu and Hurlin [20] to examine the causality and direction of the variables. Therefore, causality can be shown in two ways, either unidirectional when causes but does not cause or bidirectional when and cause each other. As stated below in Equation (13),
where indicates the slope intersection; shows the lag orders in all units assuming the panel is balanced; is the autoregressive parameter; indicates the regression coefficient differing between cross sections.
4. Results Discussion
The existence of cross-sectional dependence indicates that violation of independence assumption estimates often leads to undesirable finite model properties. In fact, the diagnostic test of cross-sectional dependence proposed by Pesaran [17] was applied, which uses the correlation coefficients between the series of each of the countries. Table 4 shows the results of the cross-sectional dependence (CD) test of Pesaran [17]; given that the p-value is less than 0.001, the null hypothesis of cross-sectional dependence between countries is strongly rejected, and it is concluded that the variables show cross-sectional dependence between countries at a significance level of 0.1%.
Subsequently, the presence of cross-sectional dependence justifies the application of second-generation unit root tests to verify the stationarity of panel data series [37,45]. In this regard, the CADF and CIPS tests of Pesaran [17] were applied, which are more robust and reliable in the presence of cross-sectional dependence [46]. Table 5 shows the results obtained from the unit root tests in levels (constant and constant–trend), in which it is observed that two series of five are non-stationary at level I (0). Therefore, the second difference was performed on all the variables to make them stationary (constant and constant-trend), establishing that the series has an order of integration II (2) at a significance level of 0.1% at the global level of countries.
In the next step, the stationarity of the series made it possible to determine the long-term equilibrium relationship between the variables included in the model. Therefore, in the presence of cross-sectional dependence of each of the variables, the cointegration test developed by Westerlund [19] was applied. In this context, Table 6 shows the results of the statistics of the four panel-wide tests, where the Gt and Ga test statistics define the alternative hypothesis that at least one cross-sectional unit is cointegrated, and the Pt and Pa tests define the alternative hypothesis that the entire panel is cointegrated. Therefore, the null hypothesis of non-cointegration is rejected and the existence of an equilibrium between the variables included in the long-term model is confirmed at a significance level of 0.1% and 5%, respectively. Consequently, there is a joint variation in financial development, non-renewable energy consumption, renewable energy consumption, and human capital, which is related to variations in long-term economic growth at the level of the countries examined.
In the next step, once the existence of long-term equilibrium was proven, the fully modified ordinary least squares (FMOLS) regression was estimated at the global level for Latin American countries in order to determine the elasticities of the independent variables on the explained variable. Table 7 reveals that financial development, non-renewable energy consumption, renewable energy consumption, and human capital have a positive and statistically significant relationship with economic growth. In other words, financial development constitutes an advantage in the economy for individuals who wish to invest in an economic activity since they have a greater possibility of obtaining financing, and consequently, there is an expansion of aggregate demand. These results are validated by the theoretical contribution of Schumpeter [5], who determines that financial services are important to determine the production of entrepreneurs since they are important for innovation and productive investment. Moreover, our results are supported by the study of Boukhatem and Ben [6], who confirm that financial development has a positive impact on long-term economic growth. Similarly, our findings coincide with those of Ali et al. [7], who show that financial development generates a positive effect on long-term economic growth, thus concluding that financial development is more beneficial in free countries than in partially free and non-free countries. They also agree with those found by Pradhan et al. [8], who state that a 1% increase in financial development leads to an increase of 0.38% and 1.41% in long-term economic growth in European economies. Finally, our results are contrary to those found by Swamy and Dharani [25], who point out that there is an inverted U-shaped relationship between financial development and long-term economic growth in advanced countries.
In the case of non-renewable energy consumption, it is positively related to long-term economic growth. That is, the growth of the economy is based on the consumption of fossil fuels, although it generates environmental degradation. These findings are similar to those found in the study by Adams et al. [30], who state that a 10% increase in non-renewable energy consumption results in a 0.27% increase in long-term economic growth. Similarly, the results are aligned with Le [11] and Le and Van [12], who corroborate that non-renewable energy consumption produces a positive impact on long-term economic growth. However, this result differs from that of Wu [28], who states that reducing polluting energy reduces economic growth in the long term but not in the short term in the United States.
On the other hand, the consumption of renewable energy is positively related to the overall long-term economic growth of Latin American countries. In other words, the use of clean energy does not condition the expansion of economic activity. On the contrary, it proves that sustainable development can be achieved with the use of renewable energies in production processes. These findings are similar to those found by Zafar et al. [37], who point out that the use of renewable energy has a positive impact on long-term economic growth and highlight the importance of its implementation since it helps to eradicate poverty and ensures energy efficiency. Likewise, the results of this research are consistent with those of Mahjabeen et al. [14] and Shahbaz et al. [47], who confirm that renewable and non-renewable energy consumption are positively related to long-term economic growth. They also highlight that renewable energy consumption contributes less than non-renewable energy consumption to economic development in the long term. However, renewable energy consumption allows for sustainable growth, in contrast to the use of fossil fuels.
Finally, it is found that an improvement in human capital contributes to an increase in the overall long-term economic growth of Latin American countries. The accumulation of human capital leads to greater specialisation and improvement in economic activities, which results in higher added value and generates efficient use of resources, generating positive externalities in production processes. Thus, these results are in line with the findings by Abubakar et al. [3], who observe that the accumulation of human capital contributes to economic growth in the long term. However, the results contrast with those of Fang and Chang [39], who reveal that human capital has a positive and insignificant effect on long-term economic growth.
The last step of the econometric strategy consisted of performing the Granger causality test developed by Dumitrescu and Hurlin [20] to test the direction of causality of the variables examined. From the above, Table 8 shows a bidirectional relationship between financial development and economic growth, which indicates that both variables are mutually causal. This result is in line with those found in the studies by Nawaz et al. [48], Swamy and Dharani [25], and Wu et al. [22], who corroborate that there is a presence of bidirectional causality between financial development and economic growth. However, our findings contradict those provided by Stamatiou and Papadopoulou [45], who find unidirectional causality from economic growth to financial development. Likewise, they contradict those found by Ouyang and Li [24] who find one-way causality for the regions of China, which ranges from economic growth to financial development only for the central region, while at a global level, as well as for the eastern and western regions, there is a one-way causality from financial development to economic growth.
Similarly, unidirectional causality is found from non-renewable energy consumption to economic growth. These results are consistent with those by Deng et al. [49], who find that non-renewable energy consumption causes economic growth. However, our findings contradict those by Chontanawat [32] and Kahouli [9], who determine the existence of unidirectional causality from economic growth to long-term non-renewable energy consumption. In addition, there is unidirectional causality from economic growth to renewable energy consumption. In other words, when the country has great economic growth, there is a greater concern for environmental care issues. These results are consistent with those by Mafizur and Velayutham [38], who determine the existence of unidirectional causality from economic growth to renewable energy consumption. However, they differ from those found by Alvarado et al. [13] and Zafar et al. [37], who observed bidirectional causality, that is, renewable energy consumption and economic growth are mutually causal.
5. Conclusions and Policy Implications
This study aims to contribute to the scientific field with tools that contribute to the discussion on the determinants of economic growth, which is why this study analysed the relationship between financial development, non-renewable energy consumption, renewable energy consumption, and capital human growth with economic growth for 16 Latin American countries, during the period 1988–2018, through econometric techniques of panel data based on cointegration and causality.
In this regard, first, it is found that there is a long-term equilibrium relationship between financial development, non-renewable energy consumption, renewable energy consumption, human capital, and long-term economic growth. Second, the FMOLS shows that there is a positive relationship between the variables of financial development, non-renewable energy consumption, renewable energy consumption, and human capital with economic growth, which indicates that an increase in these variables generates an improvement in long-term economic growth. Third, evidence of bidirectional causality is found for the variables of financial development and human capital with economic growth, respectively. Unidirectional causality from non-renewable energy consumption to economic growth and from economic growth to renewable energy consumption is observed. Based on the results for the overall sample of Latin American countries, policymakers should consider the following recommendations:
- Focus on offering policy reforms that encourage financial deepening and effective financial intermediation that alleviates credit restrictions in the region so that financial resources are effectively allocated to companies and households in order to help boost the economy. It is also important that banks offer new financial services such as digitalisation of payments, use of mobile wallets or electronic money, creation of savings accounts for rural populations through agents and cell phones, etc. at low costs and with lower risk in order to achieve greater financial deepening.
- Regarding the consumption of non-renewable energy, the findings of this study confirm that the use of polluting energy encourages economic growth in Latin America. That is why it is determined that reducing this type of energy limits growth in the region; knowing that it is one of the main inputs that help stimulate economic growth in these countries, it is recommended to design policies that cause the efficient use of consumption of energy, replacing obsolete technologies with modern and efficient ones.
- Furthermore, the results suggest that governments should guarantee a transition from non-renewable to renewable energies that does not compromise economic growth by strategies such as reducing subsidies for polluting energies, designing cooperation programs that encourage the transfer of financial resources and technology, and finally, establishing green trade policies that help encourage sustainable development in the region with the use of carbon-free energy that guarantees energy efficiency and helps mitigate climate change.
- Finally, governments should promote investment policies in human capital that guarantee access to education at all levels, which are important for raising and improving economic growth.
The limitation of the research is the low number of econometric studies that use panel data with cointegration and causality techniques that relate to the analytical variables for Latin America. It is recommended that in future research, the analysis be extended to other regions of the world or globally by groups of countries according to their income level. The second limitation refers to the availability of information for all Latin American countries; thus, the analysis focused only on 16 countries. Consequently, the research contributes to the scientific field, firstly, in terms of how sustained growth is generated through financial development, use of non-renewable energies, renewable energies, and human capital; secondly, it covers the breadth of the literature for the Latin American region since it is evident that there are no studies to date that analyse this group of variables for the region.
Author Contributions
Conceptualization, Investigation, Methodology, Formal Analysis, Writing—Original Draft, Preparation and Writing—Review & Editing, P.P., J.Á.-G., J.M. and M.d.l.C.d.R.-R. All authors have read and agreed to the published version of the manuscript.
Funding
This research received no external funding.
Institutional Review Board Statement
Not applicable.
Informed Consent Statement
Not applicable.
Data Availability Statement
Not applicable.
Conflicts of Interest
The authors declare no conflict of interest.
References
- World Bank. World Development Indicators. 2020. Available online: https://datacatalog.worldbank.org/dataset/world-development-indicators (accessed on 21 June 2020).
- ECLAC. Preliminary Overview of the Economies of Latin America and the Caribbean. Economic Commission for Latin America and the Caribbean (ECLAC). 2021. Available online: https://www.cepal.org/sites/default/files/publication/files/46501/S2000990_es.pdf (accessed on 21 June 2020).
- Abubakar, A.; Kassim, S.; Yusoff, M. Financial Development, Human Capital Accumulation and Economic Growth: Empirical Evidence from the Economic Community of West African States (ECOWAS). Procedia-Soc. Behav. Sci. 2015, 172, 96–103. [Google Scholar] [CrossRef] [Green Version]
- Shahbaz, M.; Raghutla, C.; Chittedi, K.; Jiao, Z.; Vo, X.V. The effect of renewable energy consumption on economic growth: Evidence from the renewable energy country attractive index. Energy 2020, 207, 118162. [Google Scholar] [CrossRef]
- Schumpeter, J. Theory of Economic Development: An Inquiry into Profits, Capital, Credit, Interest, and the Business Cycle; Harvard University Press: Cambridge, MA, USA, 1934. [Google Scholar]
- Boukhatem, J.; Ben, F. The effect of Islamic banks on GDP growth: Some evidence from selected MENA countries. Borsa Istanb. Rev. 2018, 18, 231–247. [Google Scholar] [CrossRef]
- Ali, Q.; Raza, A.; Narjis, S.; Saeed, S.; Iqbal, M. Potential of renewable energy, agriculture, and financial sector for the economic growth: Evidence from politically free, partly free and not free countries. Renew. Energy 2020, 162, 934–947. [Google Scholar] [CrossRef]
- Pradhan, R.P.; Arvin, M.B.; Bahmani, S. Are innovation and financial development causative factors in economic growth? Evidence from a panel granger causality test. Technol. Forecast. Soc. Chang. 2018, 132, 130–142. [Google Scholar] [CrossRef]
- Kahouli, B. Does static and dynamic relationship between economic growth and energy consumption exist in OECD countries? Energy Rep. 2019, 5, 104–116. [Google Scholar] [CrossRef]
- Khan, S.; Peng, Z.; Li, Y. Energy consumption, environmental degradation, economic growth and financial development in globe: Dynamic simultaneous equations panel analysis. Energy Rep. 2019, 5, 1089–1102. [Google Scholar] [CrossRef]
- Le, H. The energy-growth nexus revisited: The role of financial development, institutions, government expenditure and trade openness. Heliyon 2020, 6, e04369. [Google Scholar] [CrossRef]
- Le, H.; Van, D. The energy consumption structure and African EMDEs’ sustainable development. Heliyon 2020, 6, e03822. [Google Scholar] [CrossRef]
- Alvarado, R.; Ponce, P.; Alvarado, R.; Ponce, K.; Huachizaca, V.; Toledo, E. Sustainable and non-sustainable energy and output in Latin America: A cointegration and causality approach with panel data. Energy Strategy Rev. 2019, 26, 100369. [Google Scholar] [CrossRef]
- Mahjabeen, S.Z.A.; Chughtai, S.; Simonetti, B. Renewable energy, institutional stability, environment and economic growth nexus of D-8 countries. Energy Strategy Rev. 2020, 29, 100484. [Google Scholar] [CrossRef]
- Fahimi, A.; Akadiri, S.; Seraj, M.; Akadiri, A. Testing the role of tourism and human capital development in economic growth. A panel causality study of micro states. Tour. Manag. Perspect. 2018, 28, 62–70. [Google Scholar] [CrossRef]
- Penn Word Table. Statistical Review of PWT 9.1 of Income, Output, Inputs and Productivity. 2019. Available online: https://www.rug.nl/ggdc/productivity/pwt/pwt-releases/pwt9.1 (accessed on 21 June 2020).
- Pesaran, M.H. Testing Weak Cross-Sectional Dependence in Large Panels. Econom. Rev. 2015, 34, 1089–1117. [Google Scholar] [CrossRef] [Green Version]
- Pesaran, M.H. A simple panel unit root test in the presence of cross-section dependence. J. Appl. Econom. 2007, 22, 265–312. [Google Scholar] [CrossRef] [Green Version]
- Westerlund, J. Testing for Error Correction in Panel Data. Oxf. Bull. Econ. Stat. 2007, 69, 709–748. [Google Scholar] [CrossRef] [Green Version]
- Dumitrescu, E.-I.; Hurlin, C. Testing for Granger non-causality in heterogeneous panels. Econ. Model. 2012, 29, 1450–1460. [Google Scholar] [CrossRef] [Green Version]
- Williams, K. Has the finance–growth link been broken? Panel data evidence from Latin America and the Caribbean. Economia 2018, 19, 404–423. [Google Scholar] [CrossRef]
- Wu, C.F.; Huang, S.C.; Chang, T.; Chiou, C.C.; Hsueh, H.P. The nexus of financial development and economic growth across major Asian economies: Evidence from bootstrap ARDL testing and machine learning approach. J. Comput. Appl. Math. 2020, 372, 112660. [Google Scholar] [CrossRef]
- Demetriades, P.; Rewilak, J. Recovering the finance-growth nexus. Econ. Lett. 2020, 196, 109563. [Google Scholar] [CrossRef]
- Ouyang, Y.; Li, P. On the nexus of financial development, economic growth, and energy consumption in China: New perspective from a GMM panel VAR approach. Energy Econ. 2018, 71, 238–252. [Google Scholar] [CrossRef]
- Swamy, V.; Dharani, M. The dynamics of finance-growth nexus in advanced economies. Int. Rev. Econ. Financ. 2019, 64, 122–146. [Google Scholar] [CrossRef]
- Polemis, M.; Stengos, T.; Tzeremes, N. Revisiting the impact of financial depth on growth: A semi-parametric approach. Financ. Res. Lett. 2020, 36, 101322. [Google Scholar] [CrossRef]
- Baz, K.; Xu, D.; Ampofo, G.; Ali, I.; Khan, I.; Cheng, J.; Ali, H. Energy consumption and economic growth nexus: New evidence from Pakistan using asymmetric analysis. Energy 2019, 189, 116254. [Google Scholar] [CrossRef]
- Wu, H.M. The impact of non-clean energy consumption on economic growth: Evidence from symmetric and asymmetric analyses in the US. Energy Environ. 2020, 31, 291–307. [Google Scholar] [CrossRef]
- Bekhet, H.A.; Matar, A.; Yasmin, T. CO2 emissions, energy consumption, economic growth, and financial development in GCC countries: Dynamic simultaneous equation models. Renew. Sustain. Energy Rev. 2017, 70, 117–132. [Google Scholar] [CrossRef]
- Adams, S.; Kwame, E.; Klobodu, M.; Apio, A. Renewable and non-renewable energy, regime type and economic growth. Renew. Energy 2018, 125, 755–767. [Google Scholar] [CrossRef]
- Pinzón, K. Dynamics between energy consumption and economic growth in Ecuador: A granger causality analysis. Econ. Anal. Policy 2018, 57, 88–101. [Google Scholar] [CrossRef] [Green Version]
- Chontanawat, J. Relationship between energy consumption, CO2 emission and economic growth in ASEAN: Cointegration and causality model. Energy Rep. 2020, 6, 660–665. [Google Scholar] [CrossRef]
- Pata, U. Renewable energy consumption, urbanization, financial development, income and CO2 emissions in Turkey: Testing EKC hypothesis with structural breaks. J. Clean. Prod. 2018, 187, 770–779. [Google Scholar] [CrossRef]
- Maji, I.; Sulaiman, C. Renewable energy consumption and economic growth nexus: A fresh evidence from West Africa. Energy Rep. 2019, 5, 384–392. [Google Scholar] [CrossRef]
- Chen, C.; Pinar, M.; Stengos, T. Renewable energy consumption and economic growth nexus: Evidence from a threshold model. Energy Policy 2020, 139, 111295. [Google Scholar] [CrossRef]
- Smolović, J.; Muhadinović, M.; Radonjić, M.; Đurašković, J. How does renewable energy consumption affect economic growth in the traditional and new member states of the European Union? Energy Rep. 2020, 6, 505–513. [Google Scholar] [CrossRef]
- Zafar, M.; Shahbaz, M.; Hou, F.; Sinha, A. From nonrenewable to renewable energy and its impact on economic growth: The role of research & development expenditures in Asia-Pacific Economic Cooperation countries. J. Clean. Prod. 2019, 212, 1166–1178. [Google Scholar] [CrossRef]
- Mafizur, M.; Velayutham, E. Renewable and non-renewable energy consumption-economic growth nexus: New evidence from South Asia. Renew. Energy 2020, 147, 339–408. [Google Scholar] [CrossRef]
- Fang, Z.; Chang, Y. Energy, human capital and economic growth in Asia Pacific countries—Evidence from a panel cointegration and causality analysis. Energy Econ. 2016, 56, 177–184. [Google Scholar] [CrossRef]
- Hamdan, A.; Sarea, A.; Khamis, R.; Anasweh, M. A causality analysis of the link between higher education and economic development: Empirical evidence. Heliyon 2020, 6, e04046. [Google Scholar] [CrossRef]
- Ogundari, K.; Awokuse, T. Human capital contribution to economic growth in Sub-Saharan Africa: Does health status matter more than education? Econ. Anal. Policy 2018, 58, 131–140. [Google Scholar] [CrossRef]
- World Development Indicators Database. 2020. Available online: https://databank.worldbank.org/source/world-development-indicators (accessed on 21 June 2020).
- Phillips, P.C.B.; Hansen, B.E. Statistical inference in instrumental variables regression with i(1) processes. Rev. Econ. Stud. 1990, 57, 99–125. [Google Scholar] [CrossRef]
- Granger, C.W.J. Investigating Causal Relations by Econometric Models and Cross-Spectral Methods. Econom. J. Econom. Soc. 1969, 37, 424–438. [Google Scholar] [CrossRef]
- Stamatiou, P.; Papadopoulou, M. Financial Development and Economic Growth: Evidence from the Eurozone. Int. J. Account. Financ. Stud. 2021, 4, 7. [Google Scholar] [CrossRef]
- Ponce, P.; Khan, S.A.R. A causal link between renewable energy, energy efficiency, property rights, and CO2 emissions in developed countries: A road map for environmental sustainability. Environ. Sci. Pollut. Res. 2021. [Google Scholar] [CrossRef]
- Shahbaz, M.; Zakaria, M.; Shahzad, S.; Mahalik, M.K. The energy consumption and economic growth nexus in top ten energy-consuming countries: Fresh evidence from using the quantile-on-quantile approach. Energy Econ. 2018, 71, 282–301. [Google Scholar] [CrossRef] [Green Version]
- Nawaz, K.; Lahiani, A.; Roubaud, D. Natural resources as blessings and finance-growth nexus: A bootstrap ARDL approach in an emerging economy. Resour. Policy 2019, 60, 277–287. [Google Scholar] [CrossRef]
- Deng, Q.; Alvarado, R.; Toledo, E.; Caraguay, L. Greenhouse gas emissions, non-renewable energy consumption, and output in South America: The role of the productive structure. Environ. Sci. Pollut. Res. 2020, 27, 14477–14491. [Google Scholar] [CrossRef] [PubMed]
Figure 1.
Correlation between financial development, non-renewable energy consumption, renewable energy consumption, human capital, and economic growth.
Figure 1.
Correlation between financial development, non-renewable energy consumption, renewable energy consumption, human capital, and economic growth.

Figure 2.
Descriptive statistics.


Table 1.
Description of the variables.
| Type of Variable | Variable | Symbol | Unit of Measurement | Source | Description |
|---|---|---|---|---|---|
| Dependent | Economic growth | GDP | Log USD at constant 2010 prices | WDI 2020 [42] | Known as GDP, income, or income per capita that measures the relationship between economic growth and the total population of a country. |
| Independent | Domestic credit to the private sector as a proxy for financial development | FD | Log USD at constant 2010 prices | WDI 2020 [42] | Internal credit to the private sector refers to financial resources, such as loans, purchases of non-equity securities and commercial credits, and other accounts receivable that establish a right of reimbursement. |
| Of control | Non-renewable energy consumption | NREC | Log Kg of oil equivalent per capita | WDI 2020 [42] | It is the consumption of primary energy before transformation into other final fuels, which is equivalent to national production plus imports and changes in inventories, minus exports and fuels supplied to ships and aeroplanes assigned to international transport. |
| Renewable energy consumption | REC | Log % of total final energy consumption | WDI 2020 [42] | They are inexhaustible and unlimited sources of energy that are produced from natural sources (sun, wind, water, plant, or animal biomass, among others). | |
| Human capital | HC | Log Index | PWT 2019 [16] | It consists of the value given to the professional skills that an individual has, based on accumulated knowledge and experiences that allow them to function within society. |
Table 2.
Correlation matrix of the variables.
| Log GDP | Log FD | Log NREC | Log REC | Log HC | |
|---|---|---|---|---|---|
| Log GDP | 1.0000 | ||||
| Log FD | 0.7423 * | 1.0000 | |||
| Log NREC | 0.8431 * | 0.7083 * | 1.0000 | ||
| Log REC | −0.4288 * | −0.4316 * | −0.5285 * | 1.0000 | |
| Log HC | 0.6128 * | 0.4205 * | 0.5649 * | −0.5649 * | 1.0000 |
Note. * indicates significance at the 5% level.
Table 3.
Descriptive statistics.
| Variable | Mean | Standard Deviation | Minimum | Maximum | Observations | |
|---|---|---|---|---|---|---|
| Log Economic growth | In general | 8.453 | 0.676 | 6.958 | 9.624 | N = 496 |
| Between | 0.661 | 7.226 | 9.218 | n = 16 | ||
| Within | 0.215 | 7.872 | 9.057 | T = 31 | ||
| Log Financial development | In general | 23.678 | 1.706 | 20.089 | 28.154 | N = 496 |
| Between | 1.636 | 21.242 | 27.458 | n = 16 | ||
| Within | 0.631 | 22.155 | 25.053 | T = 31 | ||
| Log Non-renewable energy consumption | In general | 6.709 | 0.431 | 5.859 | 7.745 | N = 496 |
| Between | 0.410 | 6.240 | 7.449 | n = 16 | ||
| Within | 0.166 | 6.145 | 7.141 | T = 31 | ||
| Log Renewable energy consumption | In general | 3.444 | 0.596 | 2.028 | 4.439 | N = 496 |
| Between | 0.588 | 2.299 | 4.225 | n = 16 | ||
| Within | 0.173 | 2.962 | 4.892 | T = 31 | ||
| Log Human Capital | In general | 0.849 | 0.161 | 0.391 | 1.137 | N = 496 |
| Between | 0.140 | 0.511 | 1.047 | n = 16 | ||
| Within | 0.088 | 0.584 | 1.148 | T = 31 |
Table 4.
Cross-sectional dependence tests.
| Pesaran Test | ||
|---|---|---|
| Variables | CD | p-Value |
| GDP | 60.985 *** | 0.000 |
| FD | 60.979 *** | 0.000 |
| NREC | 60.977 *** | 0.000 |
| REC | 60.880 ** | 0.000 |
| HC | 60.857 *** | 0.000 |
Note: t denotes significance ** p < 0.01, *** p < 0.001.
Table 5.
Results of the unit root tests in levels and second differences.
| CADF Test Statistics | |||||
|---|---|---|---|---|---|
| Levels | Second Differences | ||||
| Variables | Constant | Constant and Trend | Constant | Constant and Trend | Order |
| Log Economic growth | −1.136 | 0.276 | −9.014 *** | −6.830 *** | II (2) |
| Log Financial development | −1.247 | 2.221 | −8.223 *** | −5.837 *** | II (2) |
| Log Non-renewable energy consumption | −3.163 ** | −2.543 ** | 13.123 *** | −11.298 *** | II (2) |
| Log Renewable energy consumption | 1.393 | 3.514 | −14.193 *** | −12.287 *** | II (2) |
| Log Human Capital | −3.815 *** | −1.488 | −3.399 *** | −0.968 | II (2) |
| CIPS test statistics | |||||
| Log Economic growth | −2.347 | −2.436 | −5.981 *** | −6.072 *** | II (2) |
| Log Financial development | −2.163 | −2.243 | −5.938 *** | −6.088 *** | II (2) |
| Log Non-renewable energy consumption | −2.980 *** | −3.248 *** | −6.190 *** | −6.410 *** | II (2) |
| Log Renewable energy consumption | −1.975 | −2.416 | −6.190 *** | −6.370 *** | II (2) |
| Log Human Capital | −3.156 *** | −3.150 *** | −3.578 *** | −3.649 *** | II (2) |
Note: t denotes significance ** p < 0.01, *** p < 0.001.
Table 6.
Results of the Westerlund [19] cointegration test.
Table 6.
Results of the Westerlund [19] cointegration test.
| Statistical | Value | z-Value | p-Value | Robust p-Value |
|---|---|---|---|---|
| Gt | −2.630 ** | −1.698 | 0.045 | 0.010 |
| Ga | −3.967 *** | 4.041 | 1.000 | 0.000 |
| Pt | −8.098 *** | −0.468 | 0.320 | 0.000 |
| Pa | −3.399 *** | −2.330 | 0.990 | 0.000 |
Note: t denotes the significance ** p < 0.01, *** p < 0.001.
Table 7.
Results of the FMOLS of Phillips and Hansen [43].
Table 7.
Results of the FMOLS of Phillips and Hansen [43].
| Economic Growth | ||
|---|---|---|
| Variable | Coefficient | t-Stat |
| FD | 0.20 *** | 64.27 |
| NREC | 0.39 *** | 39.98 |
| REC | 0.13 *** | 19.30 |
| HC | 2.41 *** | 4.48 |
Note: *** denotes the significance 1% level.
Table 8.
Results of the causality test of Dumitrescu and Hurlin [20].
Table 8.
Results of the causality test of Dumitrescu and Hurlin [20].
| Causal Direction | W-Bar | Z-Bar | p-Value | Conclusion |
|---|---|---|---|---|
| GDP → FD | 4.1533 | 8.9187 | 0.0000 | There is a causal relationship |
| FD → GDP | 7.2343 | 17.6332 | 0.0000 | There is a causal relationship |
| GDP → Log NREP | 1.4406 | 1.2462 | 0.6000 | There is no causal relationship |
| NREC → GDP | 5.2328 | 11.9721 | 0.0000 | There is a causal relationship |
| GDP → REC | 1.4406 | 5.0895 | 0.0000 | There is a causal relationship |
| REC → GDP | 2.2868 | 3.6395 | 0.4000 | There is no causal relationship |
| GDP → HC | 5.4919 | 10.8674 | 0.0000 | There is a causal relationship |
| HC → GDP | 4.6863 | 10.4265 | 0.0000 | There is a causal relationship |
Publisher’s Note: MDPI stays neutral with regard to jurisdictional claims in published maps and institutional affiliations. |
© 2021 by the authors. Licensee MDPI, Basel, Switzerland. This article is an open access article distributed under the terms and conditions of the Creative Commons Attribution (CC BY) license (https://creativecommons.org/licenses/by/4.0/).
Share and Cite
MDPI and ACS Style
Ponce, P.; Álvarez-García, J.; Medina, J.; del Río-Rama, M.d.l.C. Financial Development, Clean Energy, and Human Capital: Roadmap towards Sustainable Growth in América Latina. Energies 2021, 14, 3763. https://doi.org/10.3390/en14133763
AMA Style
Ponce P, Álvarez-García J, Medina J, del Río-Rama MdlC. Financial Development, Clean Energy, and Human Capital: Roadmap towards Sustainable Growth in América Latina. Energies. 2021; 14(13):3763. https://doi.org/10.3390/en14133763
Chicago/Turabian StylePonce, Pablo, José Álvarez-García, Johanna Medina, and María de la Cruz del Río-Rama. 2021. "Financial Development, Clean Energy, and Human Capital: Roadmap towards Sustainable Growth in América Latina" Energies 14, no. 13: 3763. https://doi.org/10.3390/en14133763
Note that from the first issue of 2016, this journal uses article numbers instead of page numbers. See further details here.