
Model-Based System Performance Analysis of a Solid Oxide Fuel Cell System with Anode Off-Gas Recirculation


1
Department of Clean Fuel and Power Generation, Korea Institute of Machinery & Materials (KIMM), 156 Gajeongbuk-ro, Yuseong-gu, Daejeon 34103, Korea
2
School of Mechanical Engineering, Chungnam University, 99, Daehak-ro, Yuseong-gu, Daejeon 34134, Korea
*
Author to whom correspondence should be addressed.
Energies 2021, 14(12), 3607; https://doi.org/10.3390/en14123607
Submission received: 23 May 2021
/
Revised: 11 June 2021
/
Accepted: 14 June 2021
/
Published: 17 June 2021
(This article belongs to the Topic Hydrogen Energy Technologies)
Abstract
:Designing proper solid oxide fuel cell (SOFC) system configurations is essential for their high efficiency. The present study analyzes the performance improvement of the SOFC system with anode off-gas recirculation (AOGR). Two AOGR configurations are suggested. Depending on the heat flows of off gases, the configurations are called AOGR #1 and #2, respectively. Additionally, a reference system is examined for comparison. This study aims to numerically evaluate the characteristics and performance of each system under various operating conditions such as fuel and air utilization factors. The operating current density and steam to carbon ratio are fixed at 0.3 A/cm2 and 2.5, respectively. The results indicate that the system performance shows a large difference depending on the system configurations. The SOFC system with AOGR has better performance than the reference system under the operating conditions considered in this paper. However, it is also revealed that depending on the system configuration and operating conditions, AOGR can be effective or ineffective for system performance. Therefore, a deliberate operating strategy for AOGR systems needs to be developed based on the load conditions.
1. Introduction
Solid oxide fuel cells (SOFCs) have recently received attention as an alternative power source since they have especially high electrical efficiency, low emission and fuel flexibility. Challenging issues for SOFC commercialization are having long-term durability and enhancing economic efficiency. Due to the long operation time of a SOFC, it is mainly utilized as a stationary power plant. Therefore, achieving high system efficiency and fuel utilization becomes important because it is directly linked to economic efficiency [1,2]. To improve system efficiency, designing an appropriate system configuration is necessary in addition to applying highly efficient components. The overall system efficiency varies according to the layout of the system components.
Generally, thermal energy from stack off-gas and system exhaust gas are utilized in order to improve system efficiency. The heat is recovered at heat recovery heat exchangers (HR-HEs) and often supplied to the fuel/air preheater and reformer or used to generate steam necessary for the reforming reaction [3,4]. The SOFC combined heat and power (CHP) system has also been widely suggested for efficient SOFC systems [5,6,7,8,9]. In utilizing exhaust heat from the stack and system, the system composition and its configuration highly affect the system’s overall efficiency. Therefore, many studies on designing system configurations have been conducted [6,7].
In order to improve system efficiency, anode off-gas recirculation (AOGR) can be adopted for the SOFC system. Anode off-gas (AOG) contains unreacted hydrocarbons and a high content of steam. The recirculated AOG reacts as fuel inside a fuel cell, leading to an increase in the fuel utilization efficiency. The efficiency of the steam methane reforming (SMR) reaction is also promoted by additionally supplied steam from AOG [10,11].
In the study of Powell et al. [12], a 2 kW class SOFC system with AOGR was experimentally verified. Heat and steam from AOG were delivered to an adiabatic steam reformer. As a result, the overall fuel utilization efficiency was increased up to 93%, and the system achieved a maximum net LHV efficiency of 57% at 1.7 kW. Additionally, a parametric study of the SOFC system with AOGR was conducted by Lee et al. [10]. In this study, a turbocharger and an ejector were suggested to supply air and recirculated AOG. The effects of the external reforming (ER) ratio, fuel utilization and steam to carbon (S/C) ratio were examined. The suggested system showed electrical efficiency of 64.6% when the ER ratio, fuel utilization and S/C ratio were 0.4, 0.75 and 2.5, respectively. Through the sensitivity analysis, it was revealed that fuel utilization was the most influential factor in the system efficiency. Table 1 presents a literature summary of the SOFC system with AOGR analyzed by many researchers.
Additionally, the method that can generate additional electricity by utilizing SOFC exhaust gas has been widely studied. SOFC hybridization with other power generation systems allows the system efficiency to be effectively improved [7,18,19]. Kuchonthara et al. [19] evaluated a combined power generation system with a SOFC and various gas turbine (GT) cycles. The results indicated that the humid air turbine promoted the thermal efficiency of the overall system. The effectiveness of a SOFC-engine hybrid system was experimentally demonstrated by Kim et al. [18]. A 5 kW class SOFC stack and internal combustion engine were combined, and the electrical efficiency of the hybrid system increased by up to 26%.
In this paper, two SOFC system configurations with AOGR were developed. The differences between the first AOGR system (AOGR #1) and the second AOGR system (AOGR #2) were the heat flows of AOG, cathode off-gas (COG) and catalytic combustor off-gas (CCOG). The details were described in Section 2. The performances of each system were evaluated in comparison with those of a reference system. For comparison, component-level mathematical modeling was conducted. Analysis of the effect of the fuel/air utilization factor and recirculation ratio was conducted based on the simulation result. In particular, the temperature of each component, net power, and electrical and thermal efficiency were examined.
2. System Configurations
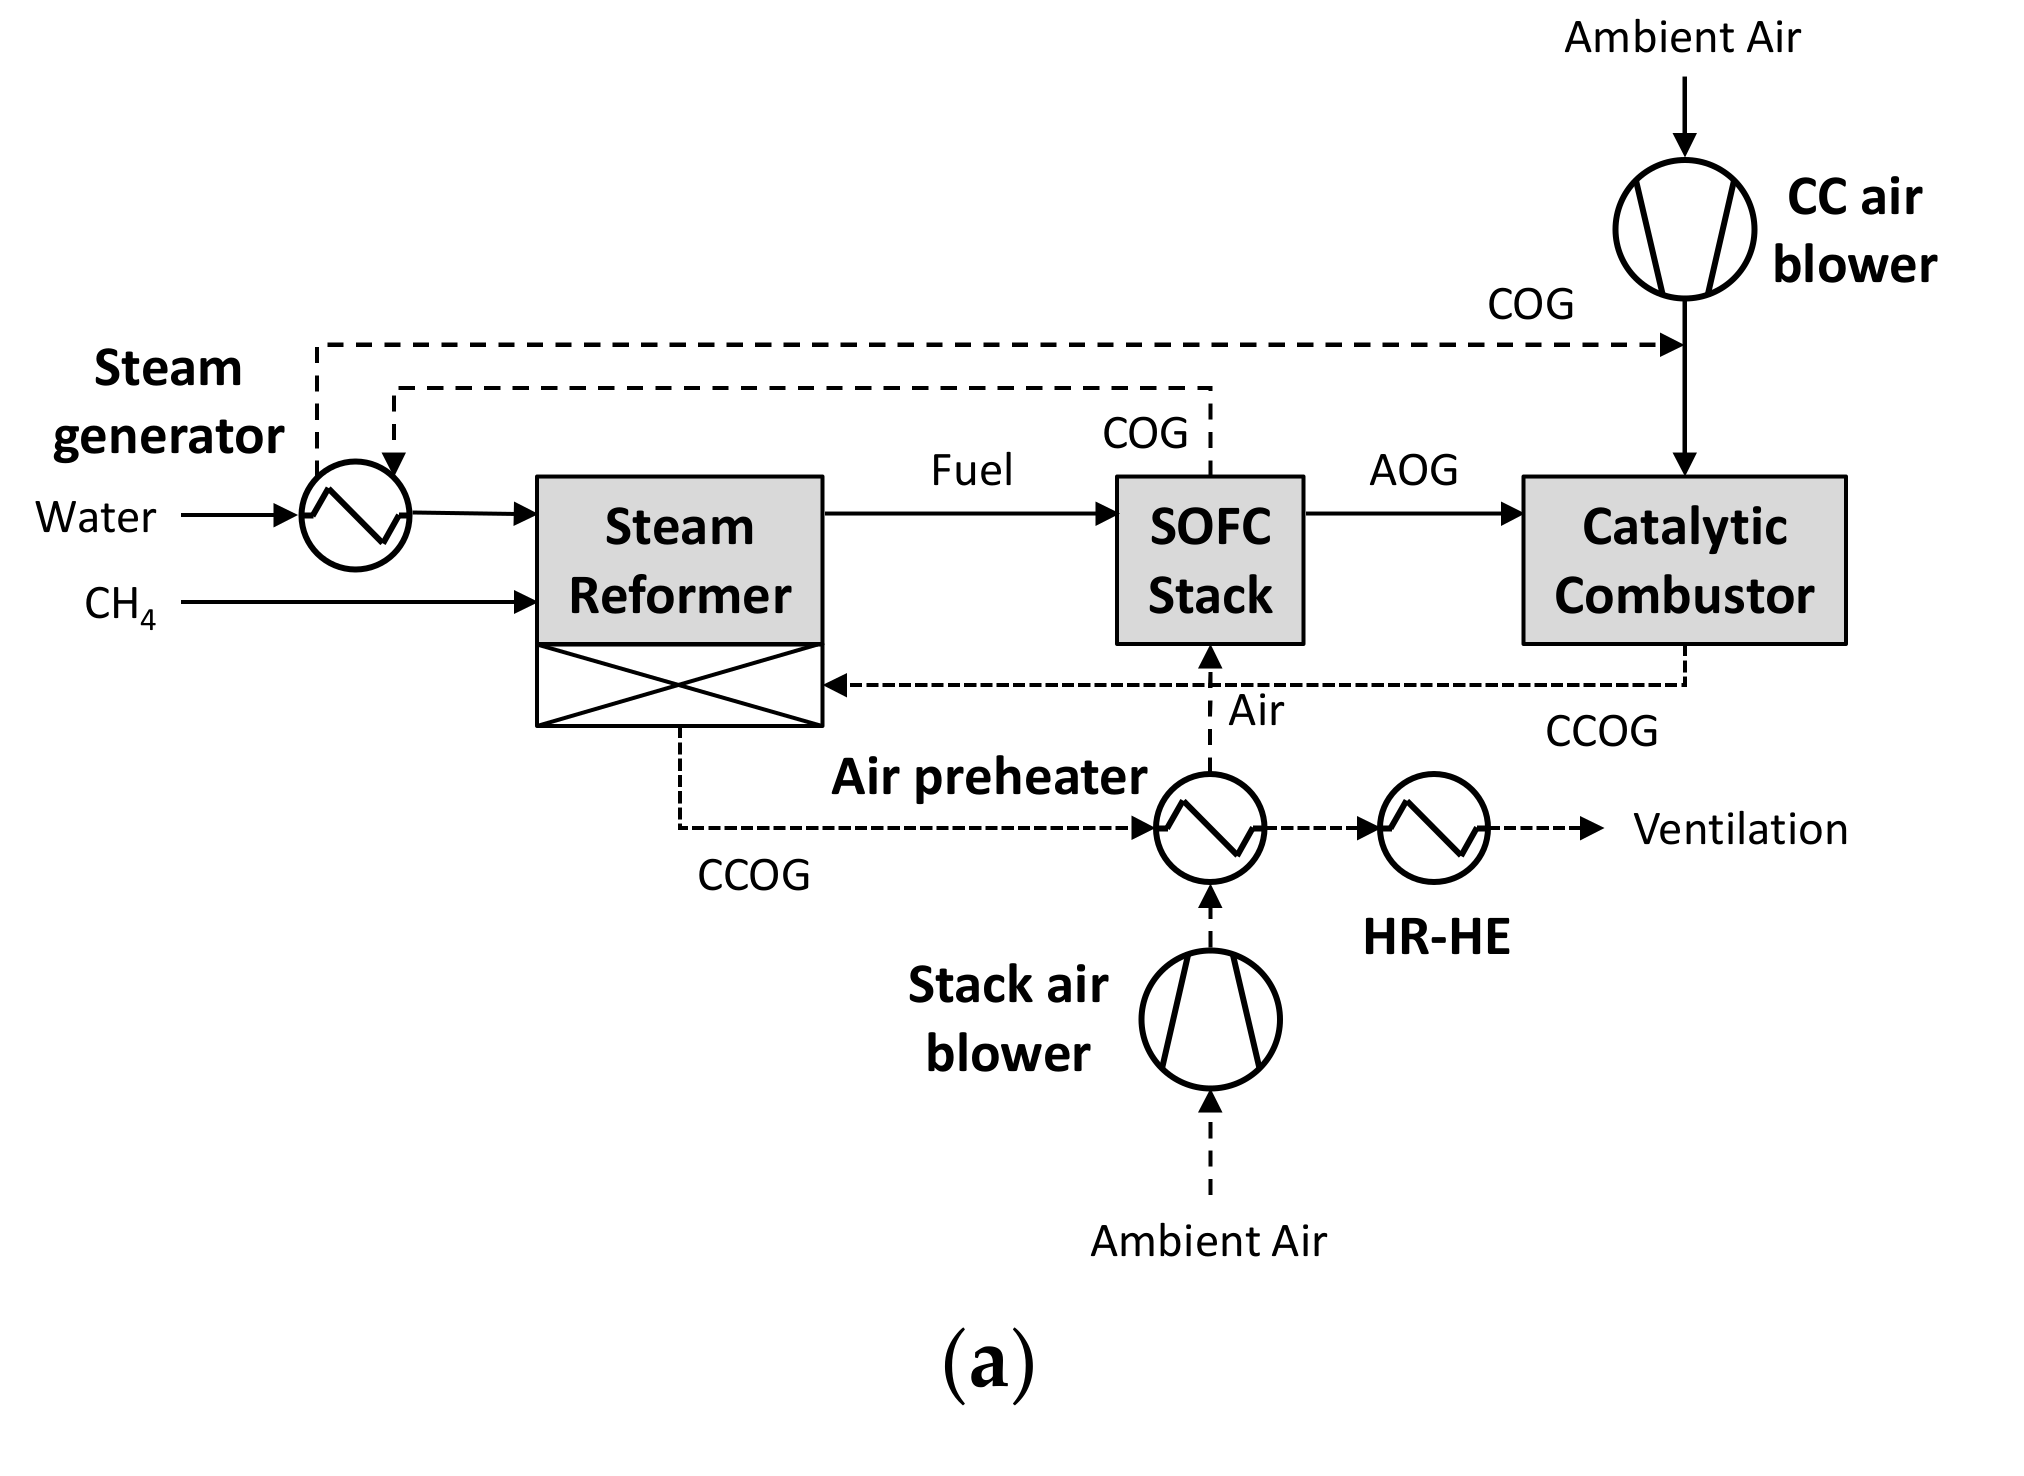
To evaluate the system efficiency of various SOFC system configurations, the reference SOFC system and the system with AOGR were analyzed. The reference system shown in Figure 1a consists of an external steam reformer (ESR), a SOFC stack, a catalytic combustor (CC), air blowers, a steam generator, an air preheater and an HR-HE. For an efficient system, a direct internal reforming (DIR) SOFC was suggested. The DIR stack enables hydrocarbons to be reformed directly inside a stack [20,21]. As the steam reforming reaction is highly endothermic, the ESR needs a large amount of heat. In the reference system, ESR thermally integrated with CC was used, in other words the heat of combustion from CC was directly provided to the ESR. This ESR is called an allothermal reformer [4]. Due to the thermal stability of CC, additional air to the CC blows when needed to keep the temperature of the CC lower than 1123.15 K [22]. Thermal energy from COG was used to generate the steam required for the steam reforming process. Cooled COG has the effect on preventing the excessive temperature increase of the CC. CCOG supplies heat to the ESR and stack air flow. The rest of the CCOG thermal energy was recovered from the HR-HE.
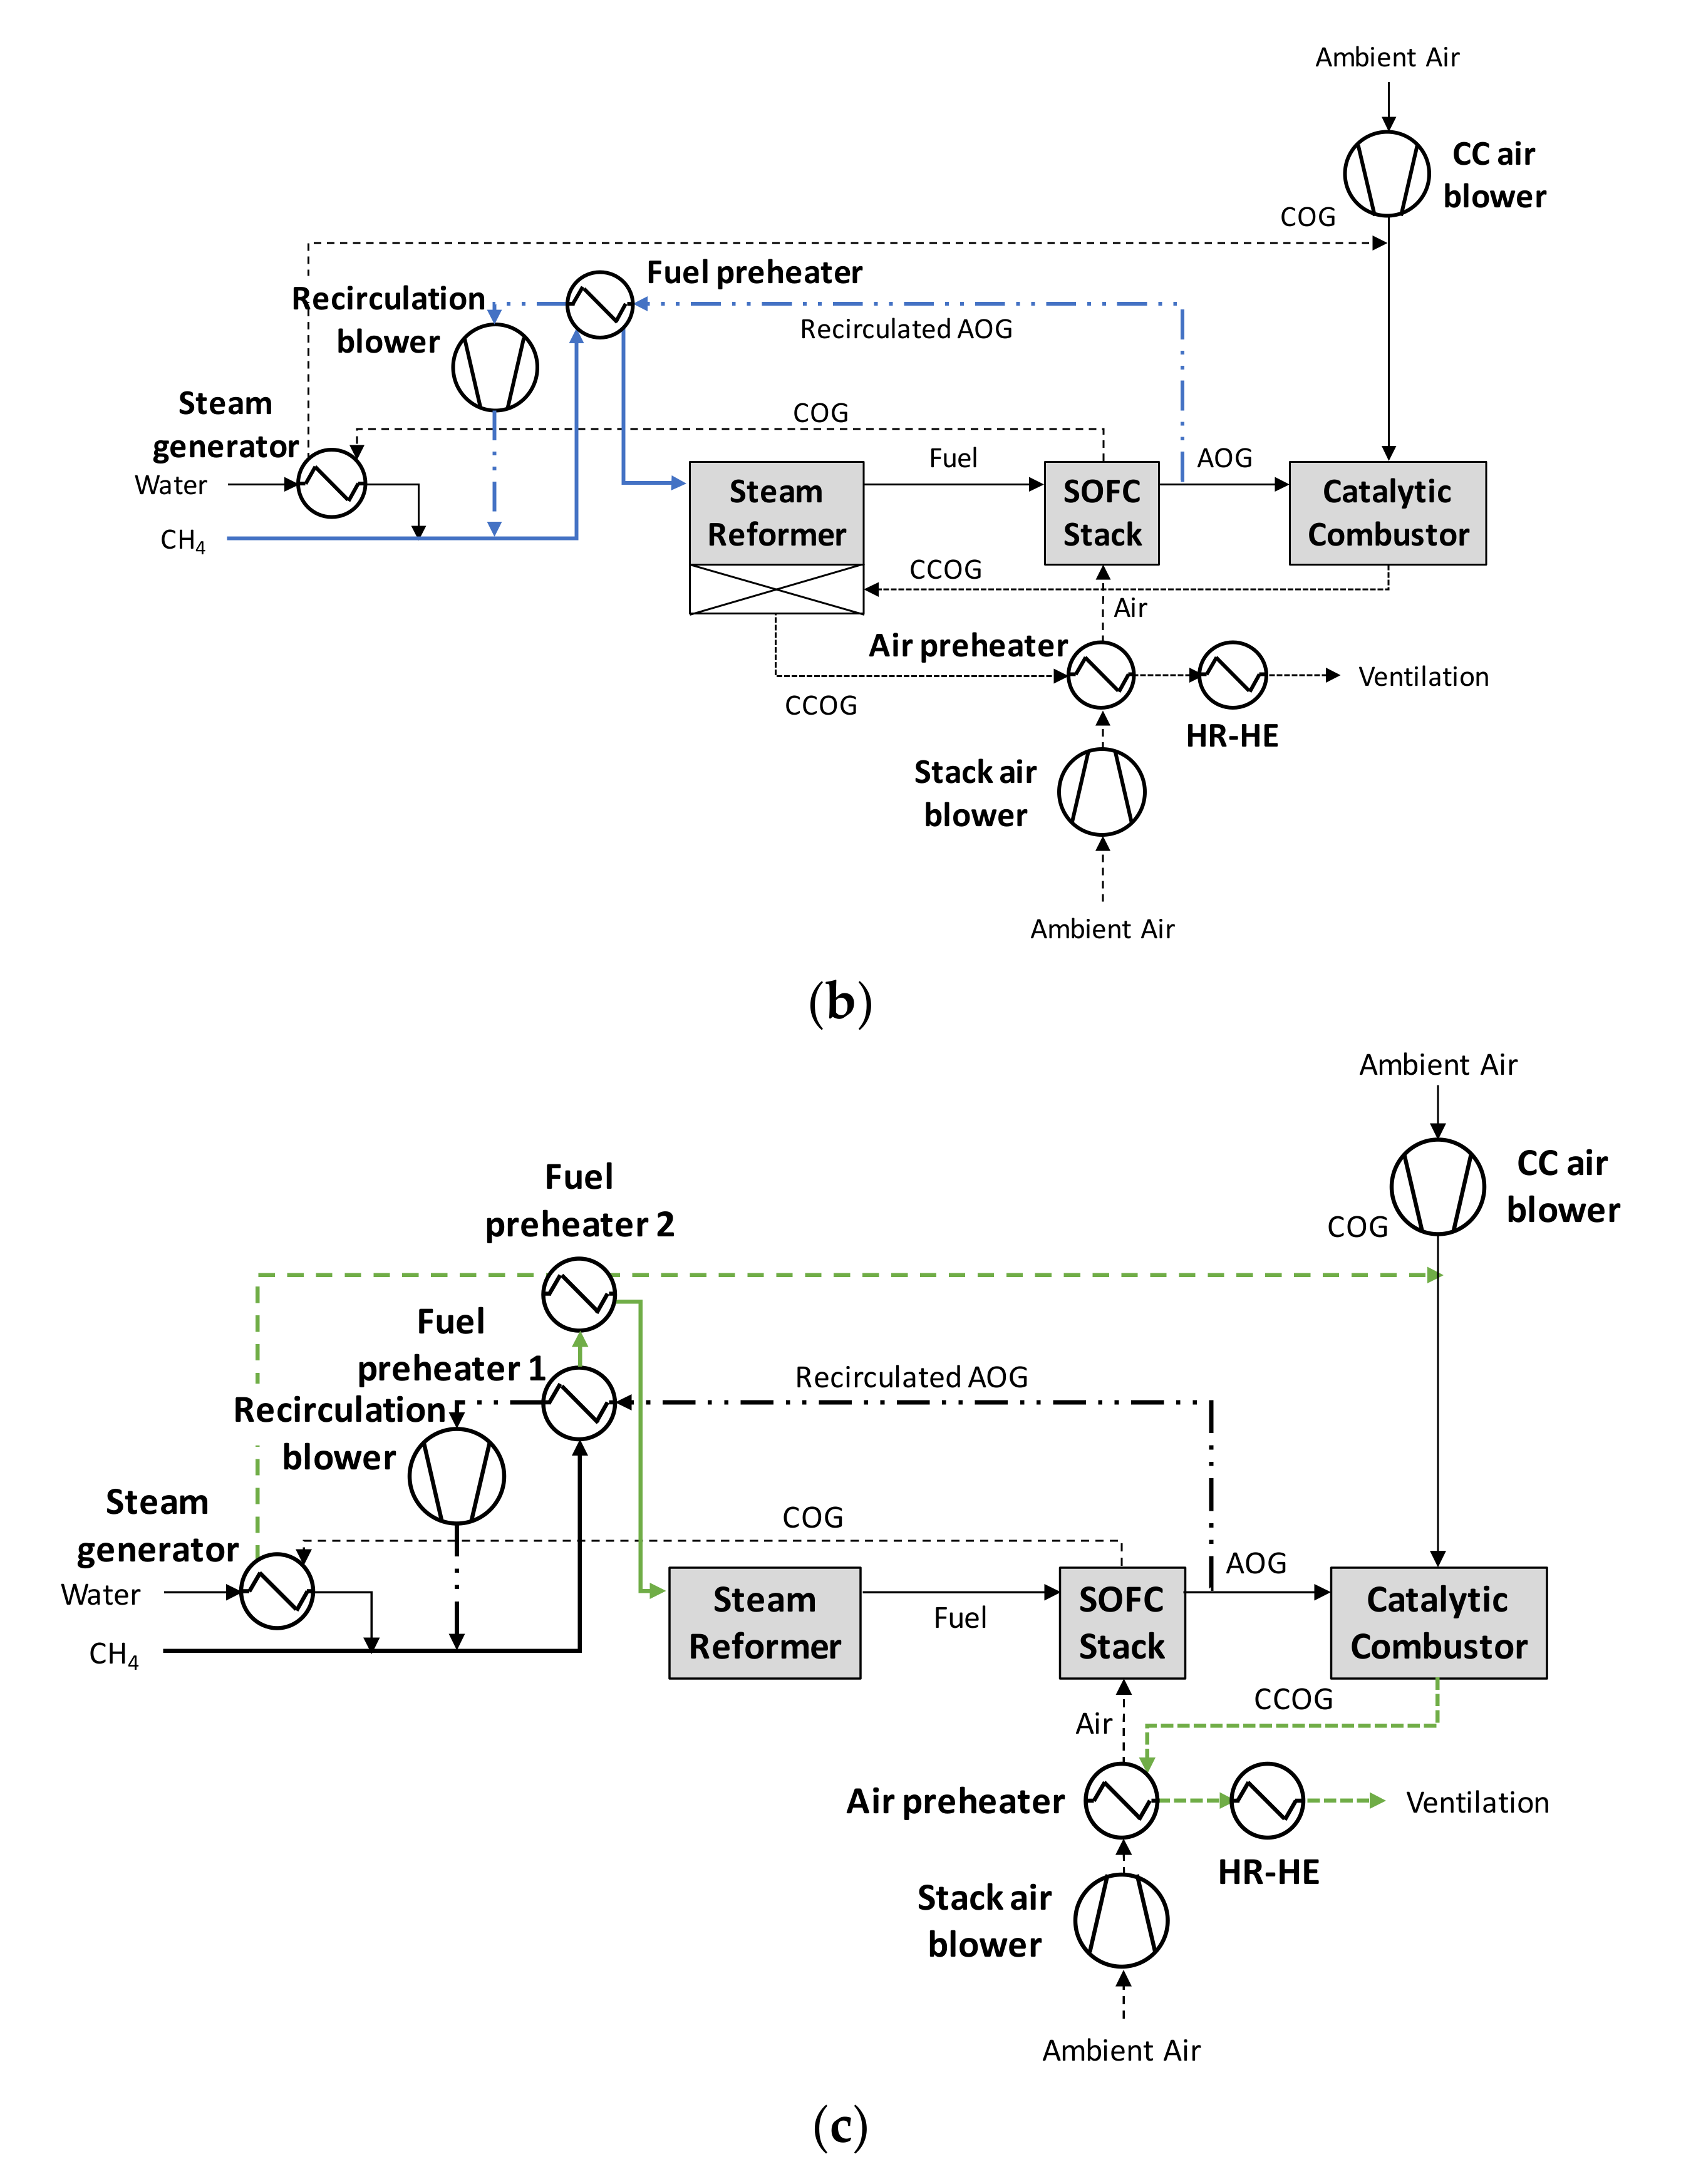
The first concept of the SOFC system with AOGR is suggested in Figure 1b, and it is named the AOGR #1 system. AOG flowed into the fuel preheater through a recirculation blower. The recirculation blower was generally able to withstand hot gas up to 1073.15 K, so recirculated AOG needed to be cooled at the fuel preheater. The recirculated AOG is able to warm the ESR and simultaneously provide the additional steam required for the SMR reactions. Distinctive flows of AOG and fuel are marked with blue lines in Figure 1b.
Figure 1c shows the second concept of the SOFC system with AOGR, which is called the AOGR #2 system. While the ESRs shown in Figure 1a,b were thermally integrated to the CC, the ESR shown in Figure 1c obtained the required heat only from the reactant flows, namely, the adiabatic reformer. It has been demonstrated that the SMR reaction can occur using only the sensible heat of the inlet gas [4,12]. The inlet fuel to the ESR was heated in two stages by the heat from recirculated AOG and COG. The heat of CCOG was used to warm up the stack supplied air and was recovered at the HR-HE. The differences of the AOGR #2 system compared to the AOGR #1 system are highlighted with green lines in Figure 1b.
3. Model Description
The purpose of the model developed in this paper was firstly to compare the performance and efficiency of various configurations and then to develop a control strategy in subsequent research. To check the system response according to the control design, the model has to be dynamic and not too complex [1,23]. In addition, the needs of dynamic models have been addressed by several authors because of the high operating temperature of SOFCs [24,25]. Therefore, a dynamic and lumped component model was developed in the SIMULINK environment. First, the steady-state characteristics of each system were examined to check the effectiveness of the systems. Dynamic characteristics and control strategies will be analyzed in future papers. In the following sections, the descriptions of each component model are discussed.
3.1. A SOFC Stack
In this model, a 1 kW class DIR stack has been adopted for an efficient SOFC system, and it is a planar SOFC stack with an anode-supported cell. The conditions inside a SOFC stack are appropriate for the SMR reaction because of its proper operating temperature and electrochemically generated steam. Additionally, internal reforming has several advantages, such as reducing the size of the external reformer and air blower power consumption by means of decreasing the stack air flow rate for stack cooling [23,26,27].
The SOFC stack is composed of reactant channels and the positive-electrolyte-negative (PEN) structure. The model accounts for mass balances, thermal balances and electrochemical reactions. Specifications of the stack are presented in Table 2. Fuel and air mixtures are assumed to follow the ideal gas law.
3.1.1. Mass Balance Model
In the mass transfer model, the species in the anode channel are considered as CH4, H2O, CO, H2 and CO2, and those in the cathode channel are only N2 and O2. Four reactions inside a stack are considered. All the reactions are presented in Table 3.
Mass balance dynamics for species in fuel and air channels are given in Equations (1) and (2). In the fuel channel, (R1)—(R3) reactions described in Table 3 take place. (R4) reaction occurs in the air channel. is the molar rate of formation for species, and is obtained from the equations below.
For calculating the reaction rates of (R1) and (R2), there are various relations accounting for the reaction rates of SMR and WGS [1,20,28]. Among the equations, Chinda et al. [29] model presented in Equations (3)–(8) has been used. Chinda et al. derived the reaction rate from Arhenius’ curve fits using the data by Lehnert et al. [30]. and represent the reaction rate and forward reaction rate constant of reaction k, respectively. Chinda et al. considered that the SMR reaction occurs at the surface of the anode and the WGS reaction takes place inside the void volume of the anode.
indicates the equilibrium constant of reaction k and can be calculated by Equations (7) and (8) [2], Z is defined as (1000/T(K)-1), The unit of is , and is a dimensionless constant.
The reaction rates of (R3) and (R4) are equal to the electrochemical reaction rate of the fuel cell and can be obtained by Faraday’s law as shown in Equation (9).
From Equations (3)–(9), the molar rate of formation per volume () can be inferred. Nitrogen does not react, so is zero.
The pressure decrease () through the anode and cathode channels is calculated using Equation (16). Equations (17) and (18) represent the friction factor () for laminar and turbulent flow, respectively. is the aspect ratio of the channel, and is the gas velocity.
3.1.2. Electrochemical Reaction Model
3.1.3. Thermal Balance Model
For thermal energy calculations, the lumped capacitance method was used. Homogeneous temperature among the fuel cell components was assumed, so the temperature of the fuel cell was considered the same as . Heat absorption and release related to the reactions inside the fuel cell and convective heat transfer between the fuel cell and fuel/air bulk flows were considered in this model. Consequently, three temperatures were achieved from the thermal balance model: air, fuel bulk flow temperature and PEN temperature. The relevant equation for thermal balances in the PEN structure appears as follows.
For the calculation of heat transfer at gas channels, the Nusselt number () was considered to be a constant value of 3.39. Anode and cathode channels can act as fins of uniform rectangular cross-sectional areas, so relations for heat transfer at extended surfaces are used, as shown below, where is the fin efficiency and the convective heat transfer coefficient is obtained from .
3.2. Steam Methane Reformer
The methane steam reforming process requires a large amount of heat; thus, exhaust gas from the system is generally used as a heat source for the ESR, namely, an allothermal reformer. The reference and AOGR #1 systems suggested in this paper adopted this type of ESR. However, DIR stacks can mitigate the demand for high-performance ESR [4]. ESR can operate at a lower temperature range than the normal operating temperature (973.15–1073.15 K) [32]. Hence, an adiabatic reformer was also examined in the AOGR #2 system. A shell and tube type catalytic steam reformer was selected in this paper, and the suggested specifications of the reformer are detailed in Table 5. The model consists of mass and thermal balance models. Gas mixtures are considered ideal gases, and the porosity of the bed is constant.
For catalytic steam reformers, it is important to find the most appropriate catalyst because it directly affects the performance of the reformer. Among various active metals, nickel (Ni) is widely used because of its high reactivity and long durability [33,34]. Xu and Froment examined the kinetics of the SMR process with a catalyst under an operating range of approximately 675–1000 K. The results are the most widely used for SMR kinetcis [35]. The SMR model in this paper has been developed based on the Xu and Froment model. While various reactions take place in catalytic SMR, only the SMR reaction, the WGS reaction, and the direct steam reforming (DSR) reaction are considered. The SMR (R1) and WGS (R2) reactions are defined in Table 3, and the DSR (R6) reaction is presented below. It is assumed that the species in the reactant flow are CH4, H2O, CO, H2 and CO2. The SMR kinetics based on Xu and Froment model are organized in Table 6 [35].
Mass and thermal balances in both the gas and solid phases are presented below. Equations (25) and (26) represent the mass balance in the gas and solid phases for each species , respectively [28]. The mass transfer coefficient () is presented in Equations (27) and (28) [36].
Equations (29) and (30) are the thermal balances in the gas and solid phases. The convective heat transfer coefficient () in Equation (30) is known from the Chilton–Colburn j-factor (). For forced convection through a packed bed, Yoshida et al. [37] suggested empirical correlations of . is an empirical coefficient depending on the particle shape, and its value is 1 for a sphere.
3.3. Catalytic Combustor
To compute the temperature and species in the CC, a mathematical model including mass and thermal balances was developed. A Pt-catalyzed monolithic combustor is analyzed. Specifications of CC are given in Table 7. The oxidation reactions over Pt considered in this model are CO, CH4 and H2 oxidation. The rate expressions and reaction rate per Pt surface area are organized in Table 8 based on Ref. [38]. Chemical reactions are assumed to occur only on the external surface of the catalytic wall.
Homogeneous temperature, concentration and velocity within the channel are assumed for mass and thermal balance computations. Equations (34) and (35) describe the mass balances for the gas and solid phases for each species , where refers to CH4, H2O, H2, CO, CO2, O2 and N2. The corresponding equations for thermal balances for the gas and solid phases are presented in Equations (36) and (37). For the heat transfer coefficient () calculation, Nu is considered to have a constant value of 3.39.
3.4. Balance of Plant
3.4.1. Air and Recirculation Blower
A model of air and recirculation blowers was employed to examine the outlet temperature and power consumption. The stack air flow rate was determined by the air utilization factor, and the CC air flow rate was controlled to maintain a CC temperature below 1123.15 K. In terms of the recirculation blower, the target recirculation ratio determines the flow rate. The blower outlet temperature and power consumption are obtained from Equations (38) and (39). In the computation, the values of , and were 0.8, 0.9 and 0.9, respectively.
3.4.2. Heat Exchanger
Heat exchangers are employed to recover heat from AOG, COG and exhaust gas. They act as fuel/air preheaters, a steam generator and a HR-HE. The outlet temperature of each gas and heat transfer rate are defined by the effectiveness-NTU method, as shown in Equation (40) since the information is insufficient to use the LMTD method. indicates the effectiveness of a heat exchanger and was set to 0.75.
3.5. Performance Factor
and indicate the fuel and air utilization factors, respectively. Methane is only supplied as fuel in this model. If there are other hydrocarbons in fuel, they should be added to the denominator in Equation (41). The fuel and air flow rates of the stack are determined from the target utilization factor. Recirculated hydrogen, however, is not considered when the fuel flow rate is calculated.
The electrical, thermal and total efficiencies are shown in Equations (43)–(45). The electrical efficiency of the system is the ratio of the net generated energy of the system to the chemical energy of the supplied fuel. To estimate the thermal efficiency, the temperature of the final exhaust gas from the CC () is assumed to become 393.15 K after the HR-HE.
4. Results and Discussion
4.1. Model Validation
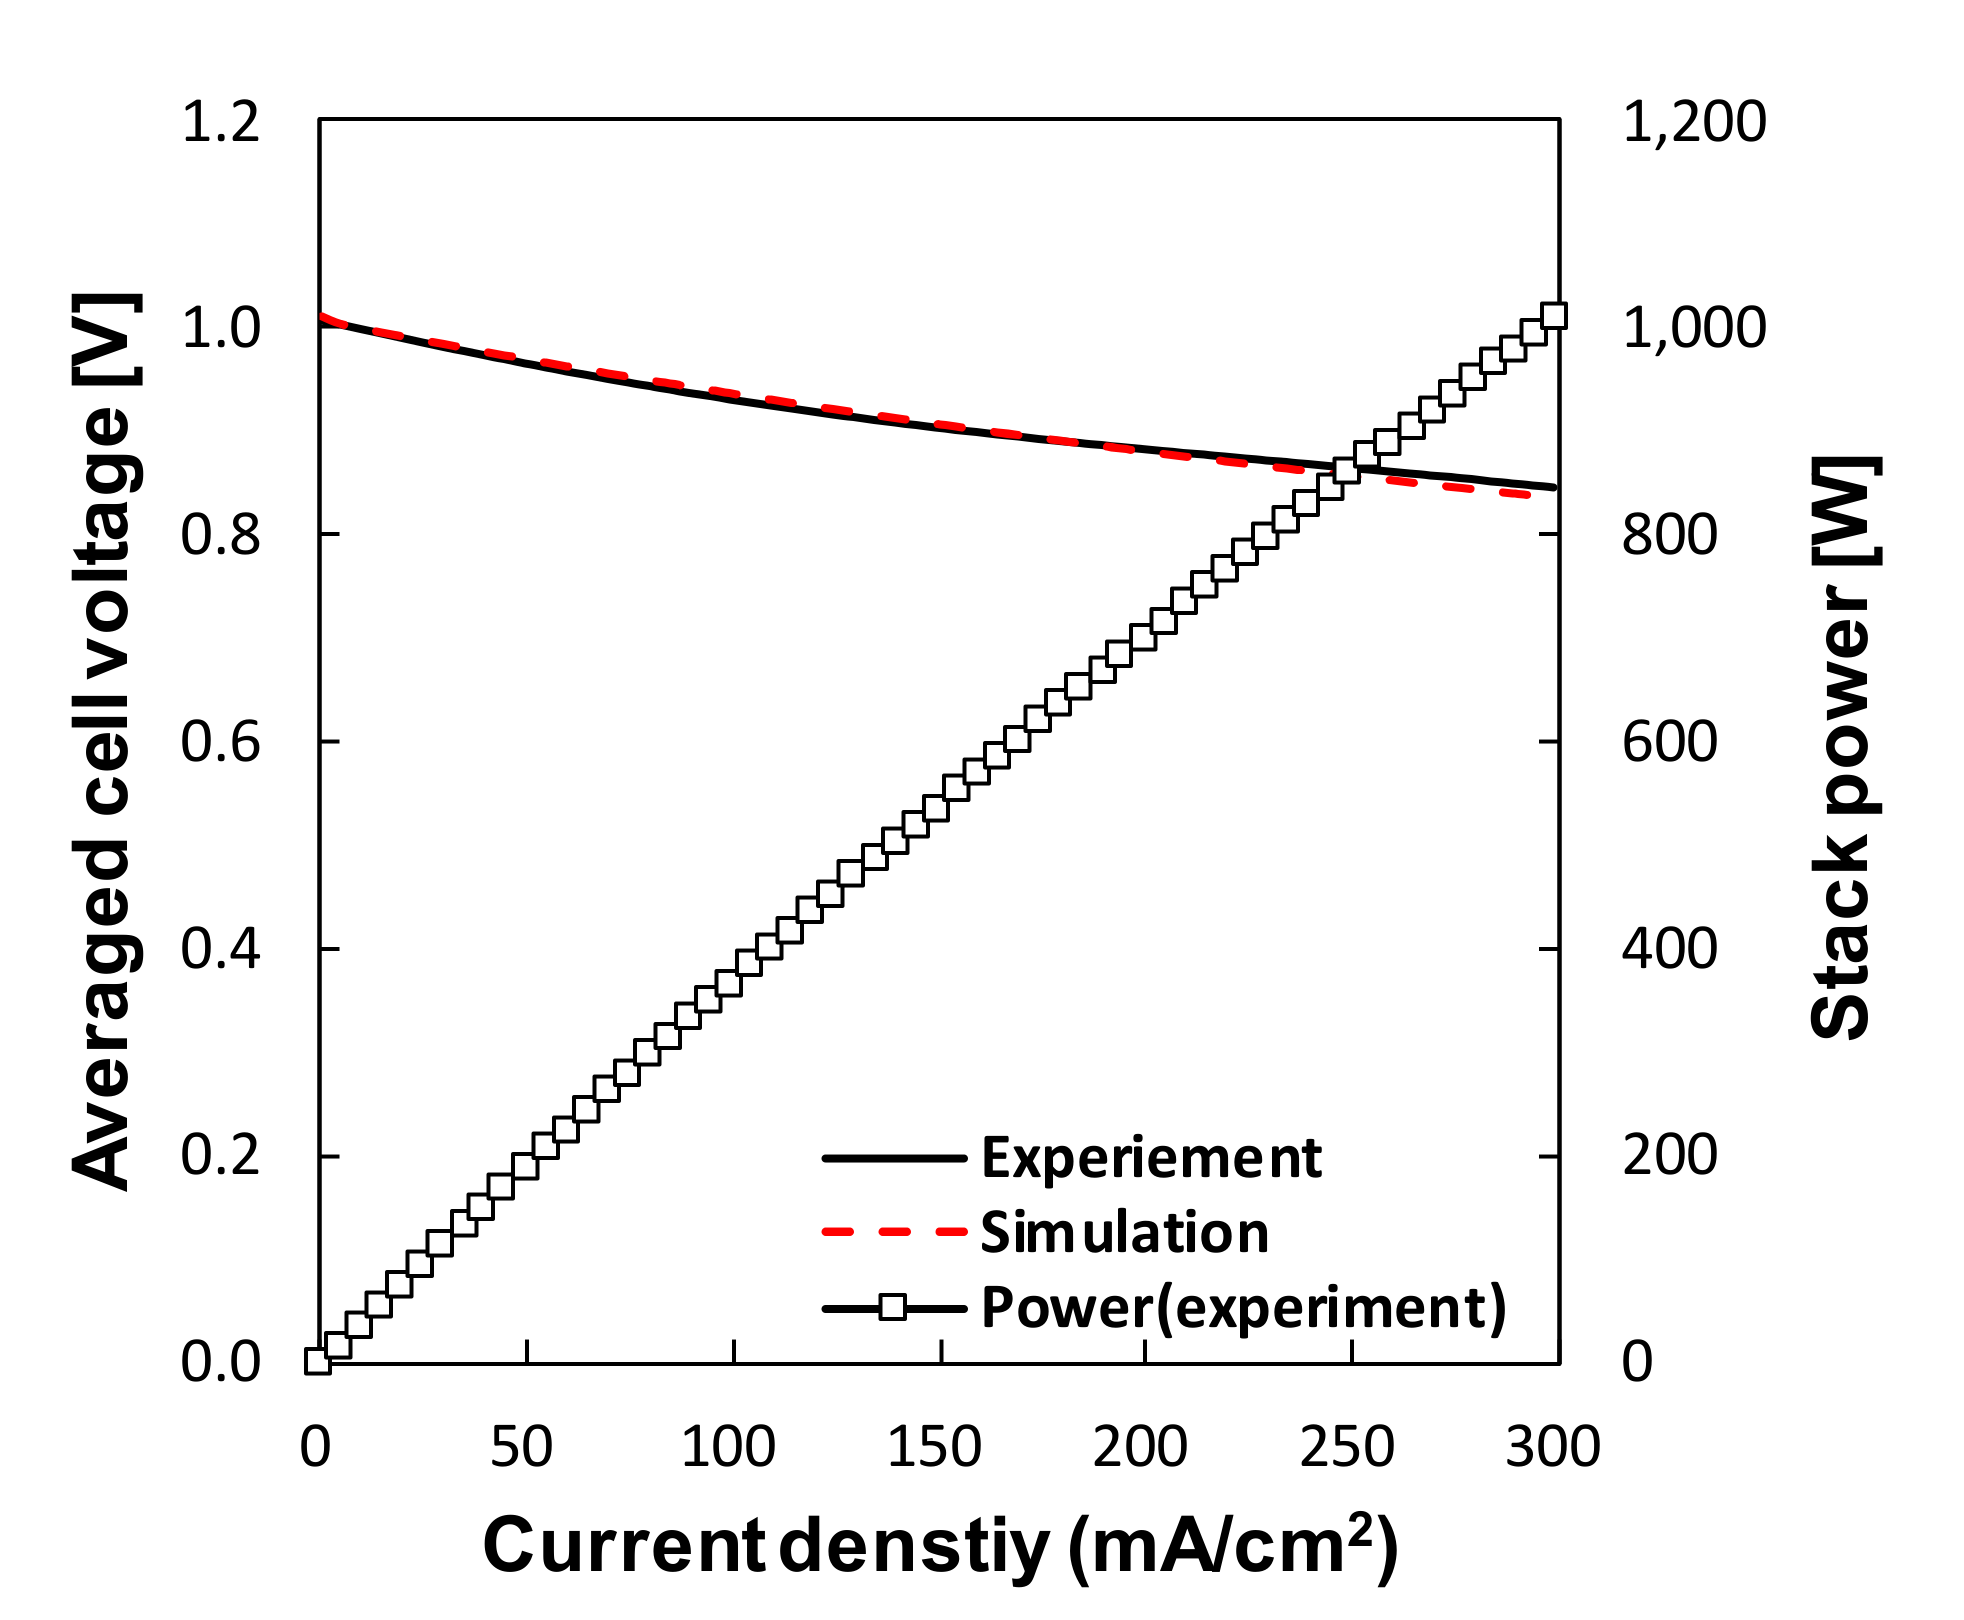
To demonstrate the reliability of the developed model, a model validation process is essential. Comparing the simulation results to the experimental data of the whole system is the best way to validate a model, however, the purpose of this paper was to estimate the performance depending on the system configuration. Thus, only the model of the most complex component, which is a SOFC stack, is demonstrated in this paper. A 1 kW class stack as described in Table 1 was used for the experiment. During the experiments, the fuel and air flow rates were constant regardless of the current. H2 and CO2 were supplied at 27.96 and 10.61 lpm, respectively, as fuel. The air flow rate was fixed at 66.10 lpm. The load current was varied from 0 to 29.92 A. The stack temperature was maintained at 1023.15 K during the experiment. The model validation results are displayed in Figure 2. As a result, the model was able to accurately predict the performance of the stack.
4.2. Operating Conditions for Simulation
The operating conditions for the simulation are presented in Table 9. Methane was used as fuel. The fuel and air flow rates were determined depending on the fuel/air utilization factor and operating current density. Steam flow rate was calculated based on the fuel flow rate and S/C ratio. The steam was generated at steam generator using thermal energy from off-gas. The PI controller adjusted the CC air flow rate so that the temperature of the CC did not exceed 1123.75 K. In this study, the performance of each system was investigated with various fuel/air utilization factors and recirculation ratios. We define the reference condition of the simulation as the condition with both a utilization factor of 0.6 and a recirculation ratio of 0.2.
4.3. Result 1: The Effect of the Fuel/Air Utilization Factors
4.3.1. Reference System
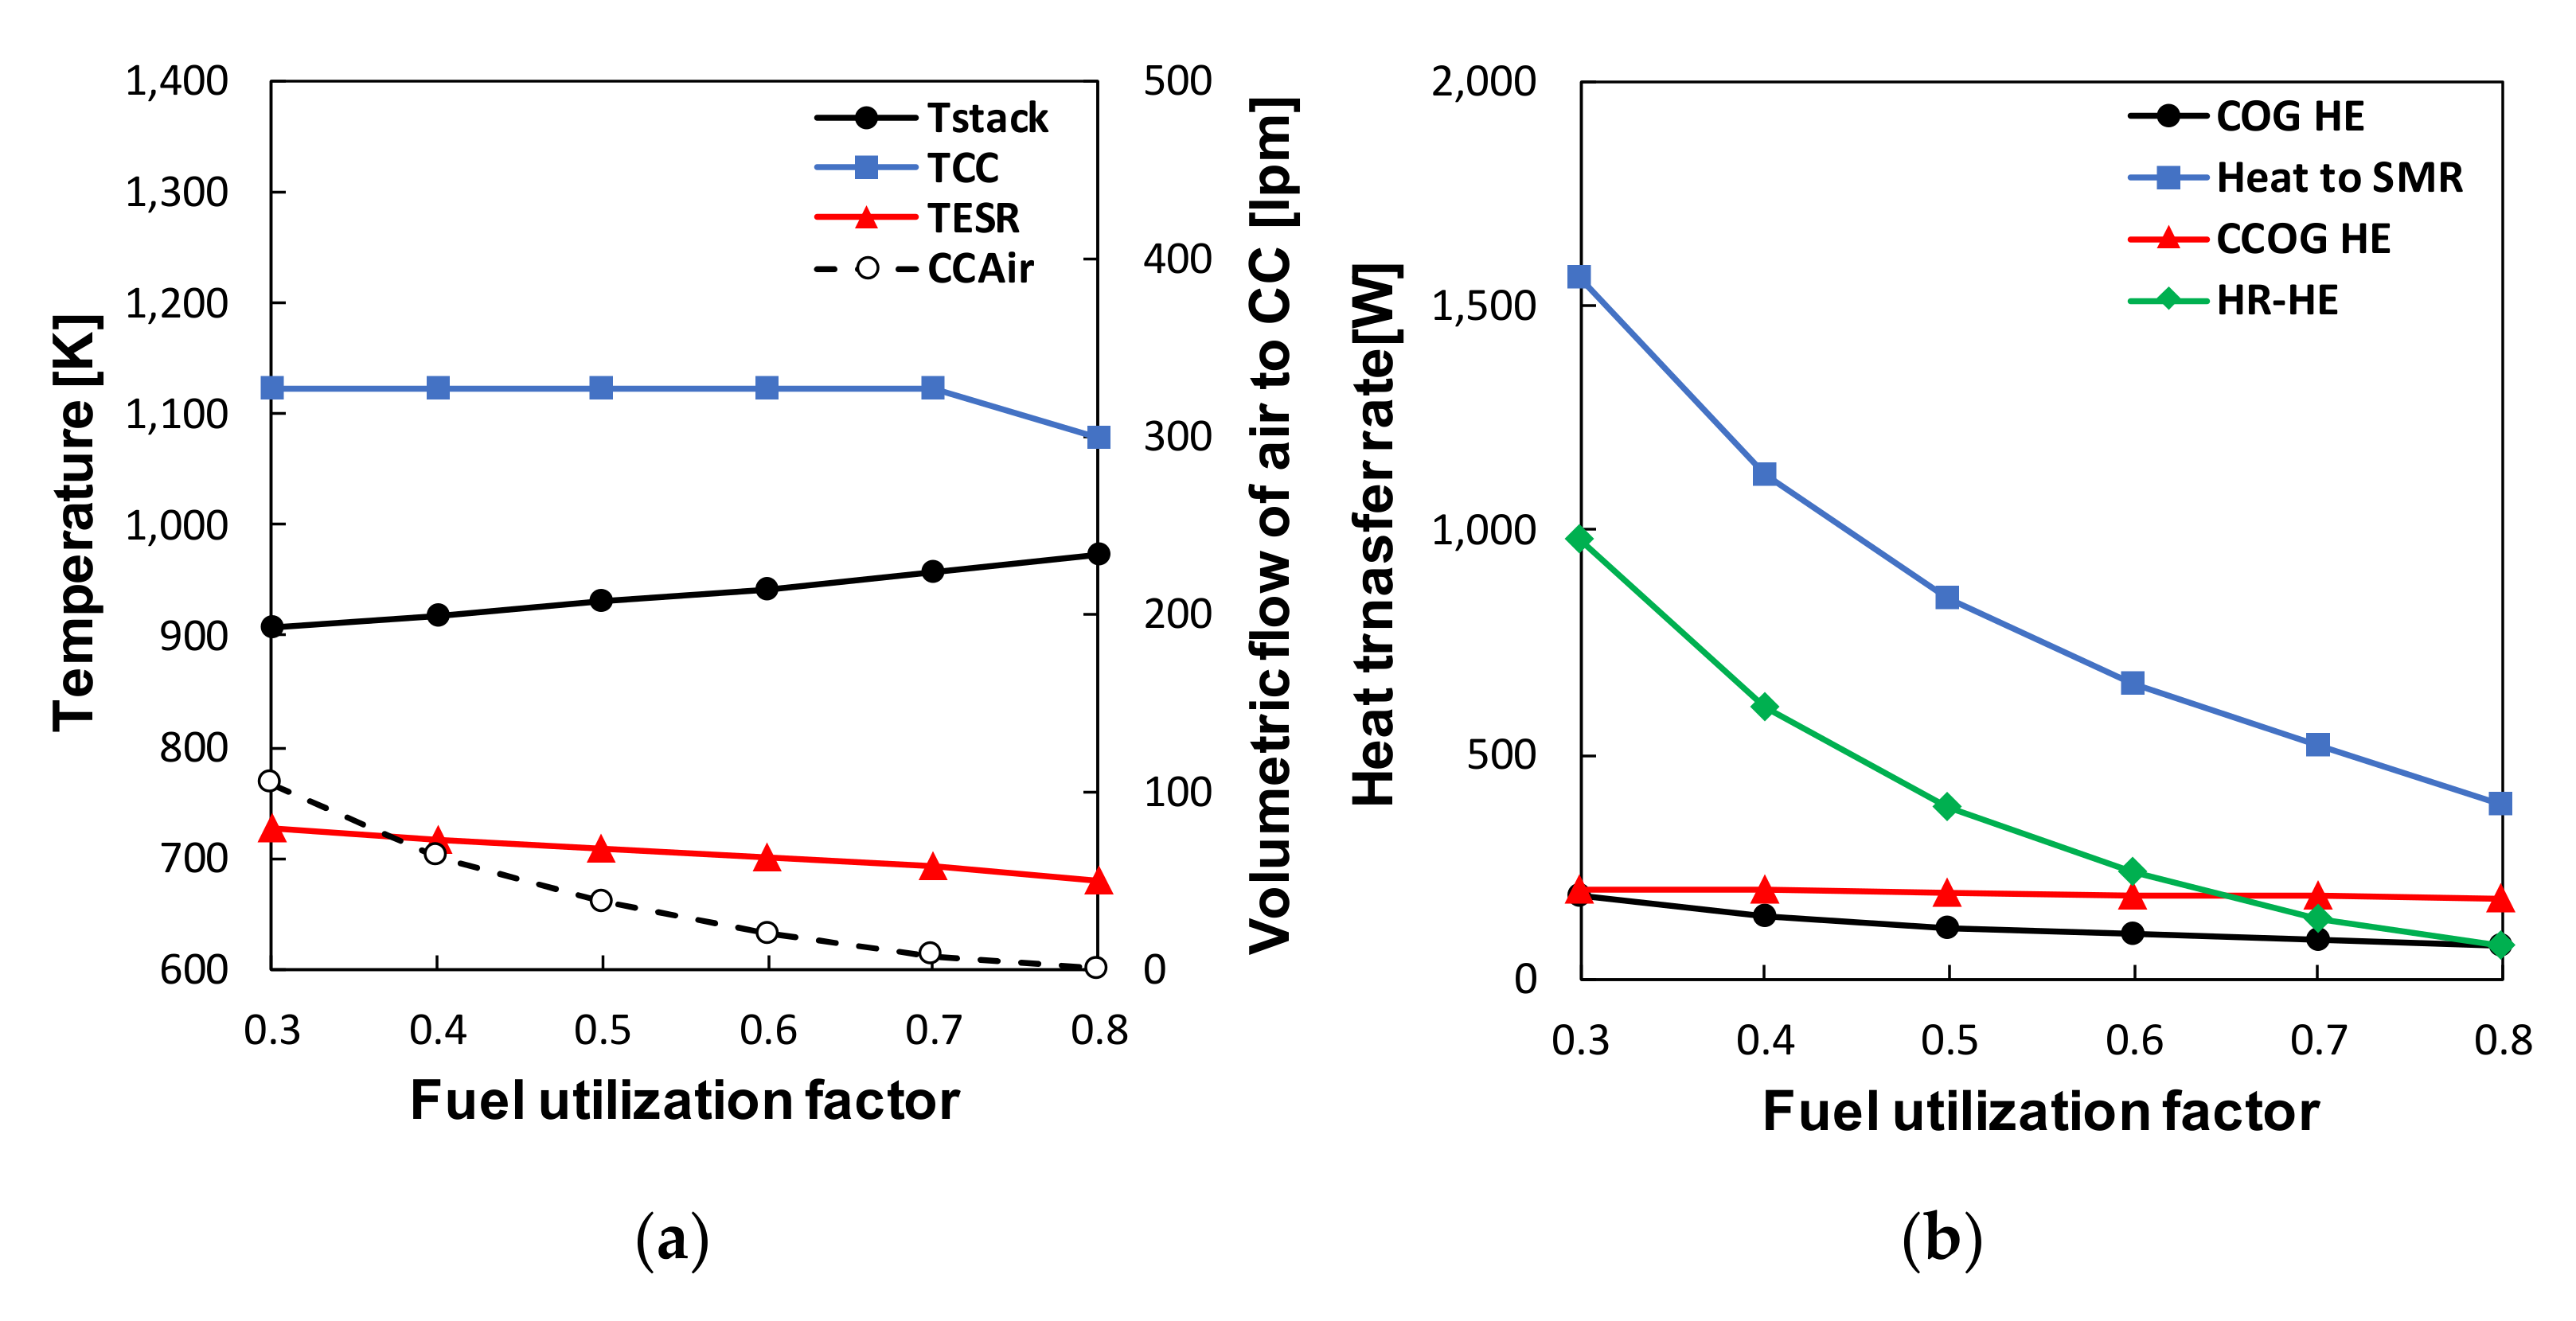
The fuel flow rate changed from 6.42 to 2.41 lpm in accordance with the fuel utilization factor of 0.3 to 0.8. The air flow rate was fixed at 30.57 lpm. Figure 3a,b indicate the temperature of each component, the CC air flow rate and the heat transfer rate of each heat exchanger. As the fuel utilization factor increased, less fuel was supplied to the system. This decreased the combustion energy at the CC and the additional CC air flow rate for cooling. When the fuel utilization factor was 0.8, the temperature of CC became lower than 1123.15 K without additional air flow to the CC. The ESR was thermally integrated with CCOG in the reference system; therefore, the temperature of the ESR decreased. In Figure 3b, it was observed that the heat transfer rate from CCOG to ESR and the amount of recovered heat were rapidly reduced. On the other hand, the stack temperature increased due to the lowered internal reforming rate. The SMR process is a strong endothermic process, so the more abundance the internal reforming reactions are, the lower the temperature of the stack.
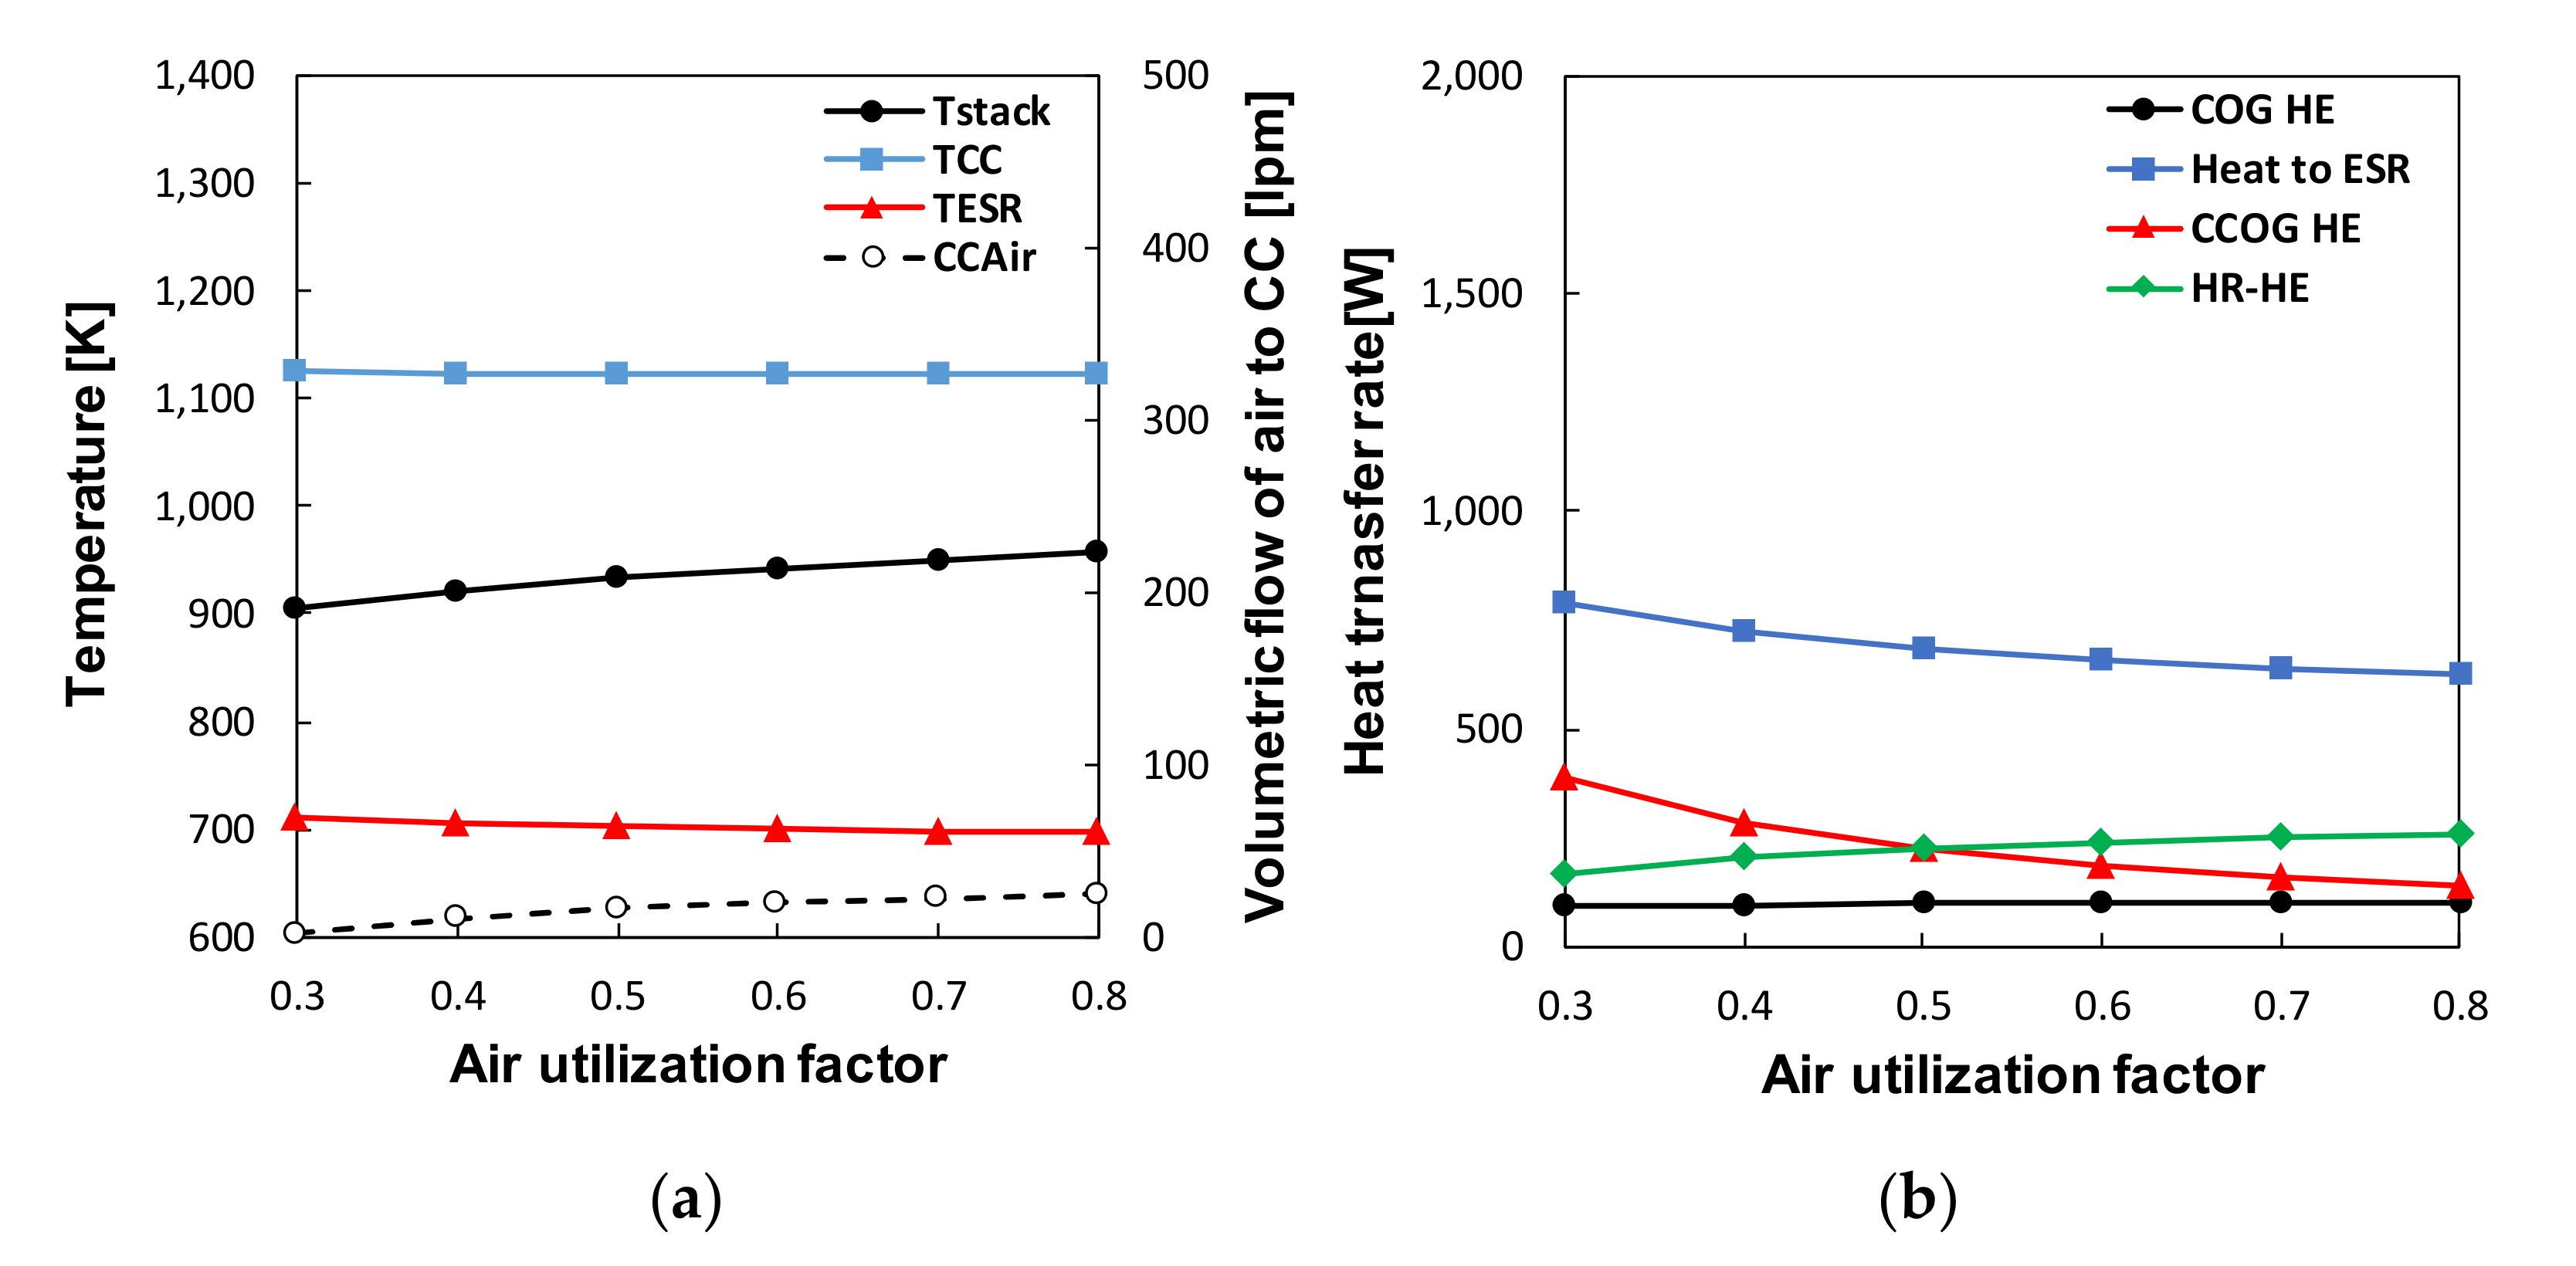
To examine the effect of the air utilization factor, the fuel utilization factor was fixed at 0.6 and the air utilization factor was changed from 0.3 to 0.8. The results are depicted in Figure 4a,b. A decreased stack air flow rate led to a temperature rise in the stack, and the raised temperature accelerated the internal reforming reaction. Consequently, the hydrogen molar flow rate to the CC increased, causing larger heat generation in the CC. Although extra air was supplied to the CC, the total amount of air diminished because the stack air flow rate decreased further. Less heat was transferred from the CCOG to the ESR, thus, the temperature of the ESR slightly decreased.
4.3.2. SOFC System with AOGR #1
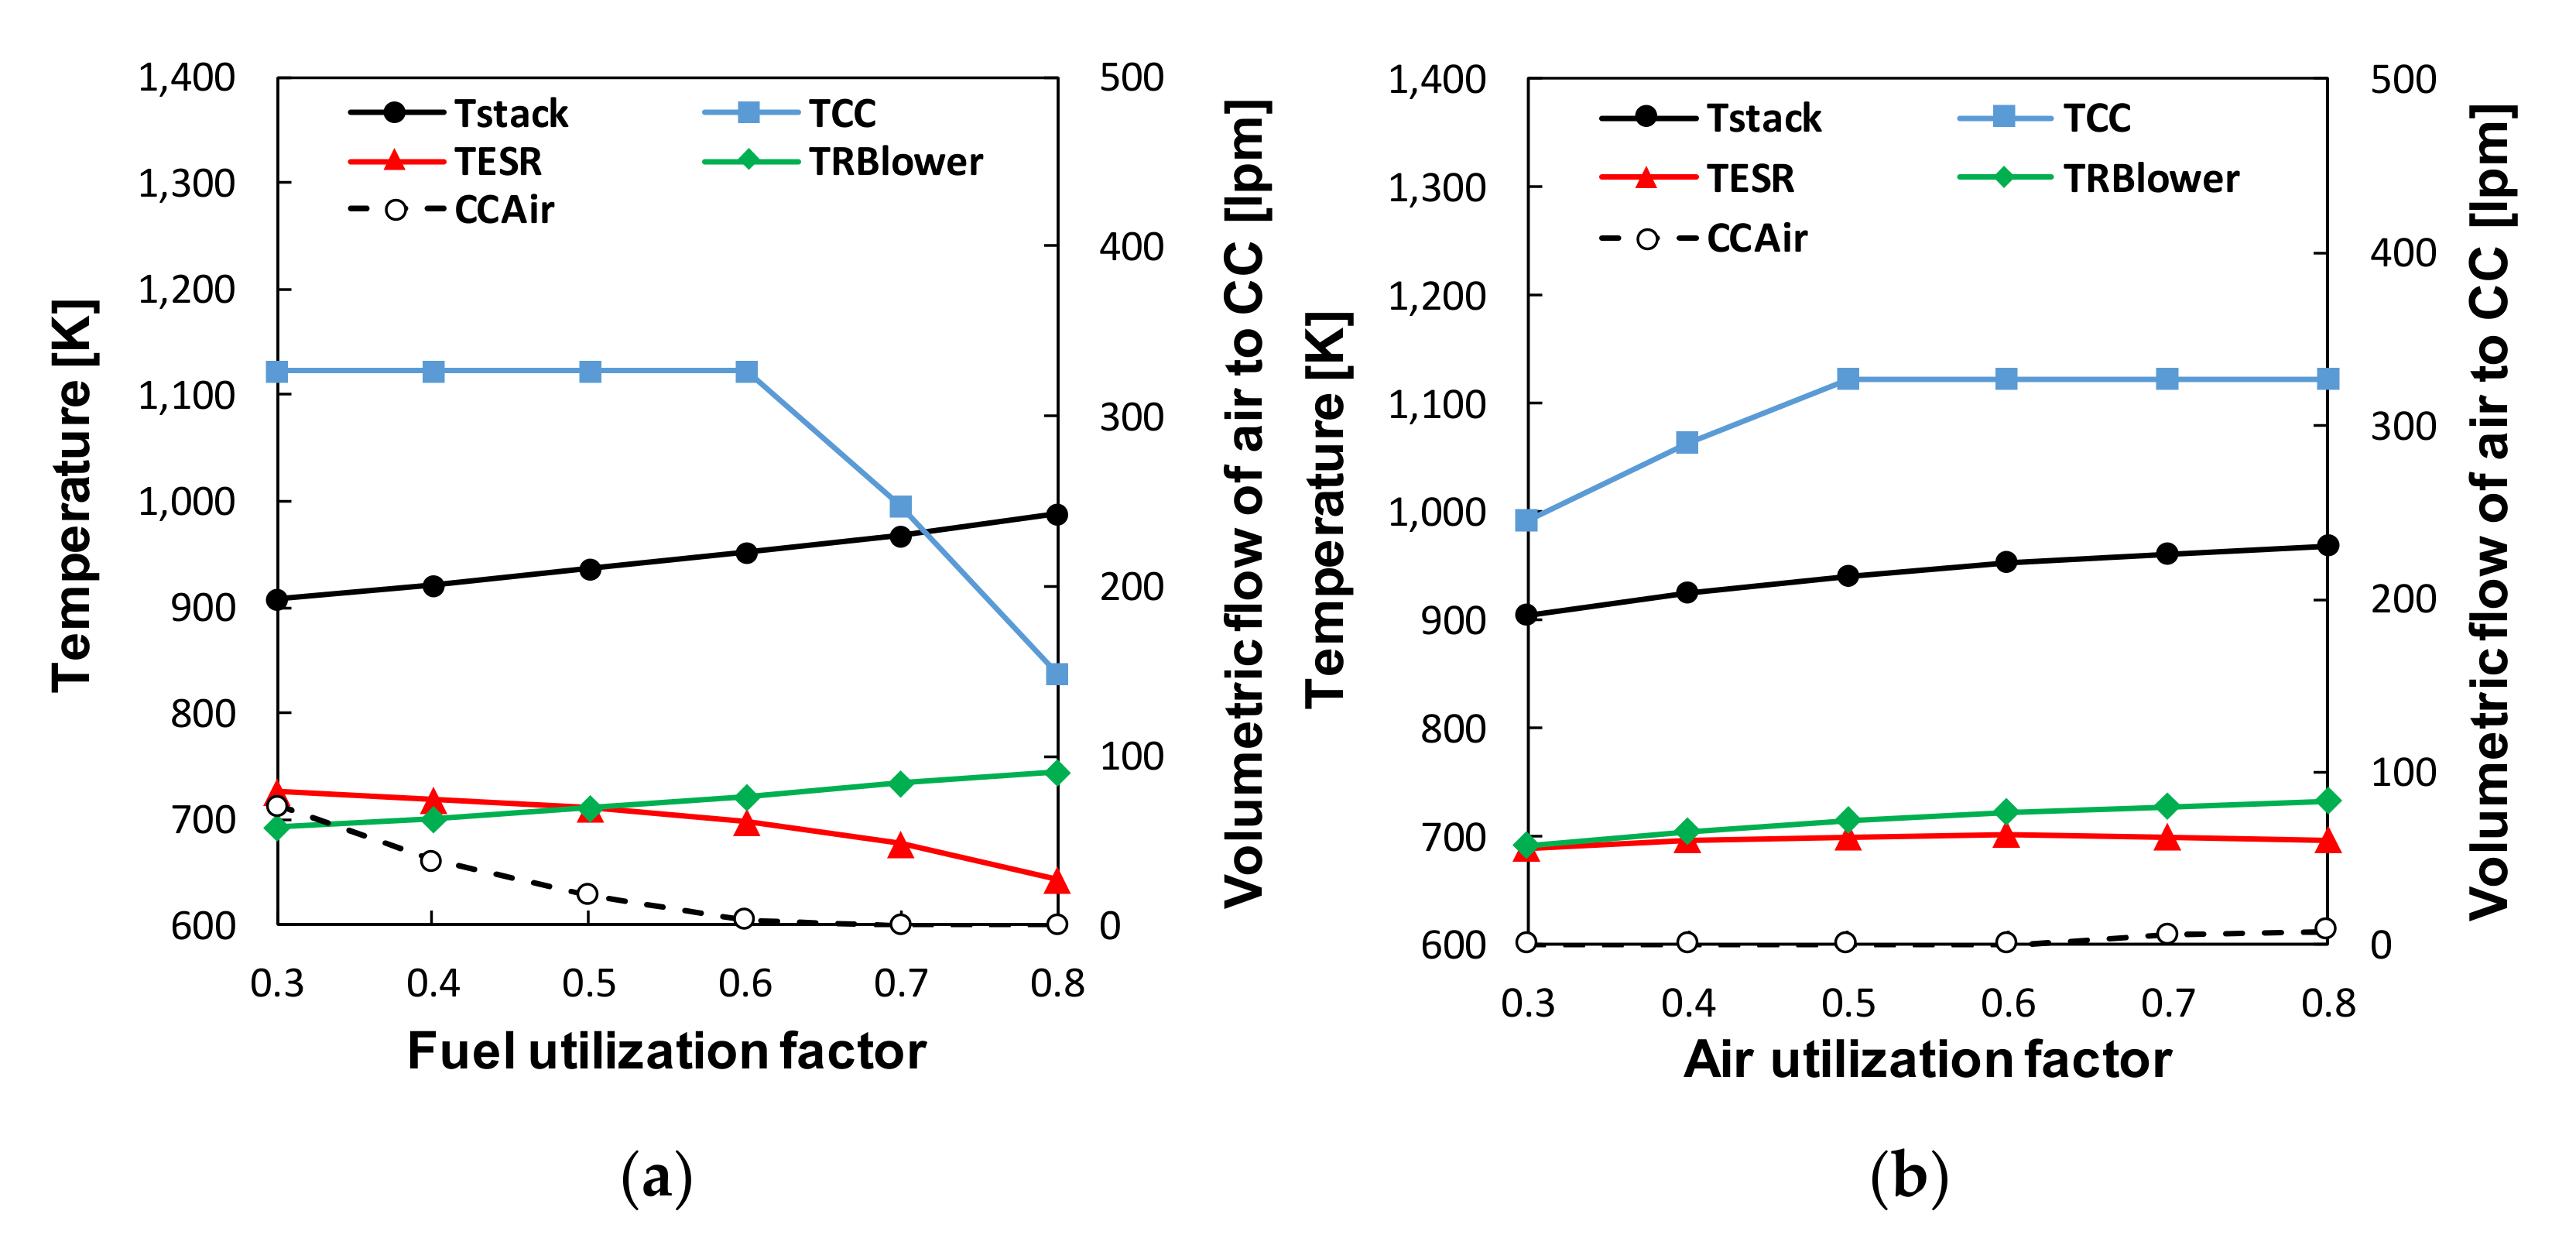
In this section, the AOGR #1 system is examined. As the condition described in Section 4.3.1, the fuel or air utilization factor was changed from 0.3 to 0.8. For the calculation, the recirculation ratio was held constant at 0.2. The results of the fuel and air utilization factors are presented in Figure 5a,b, respectively. Overall, the results are similar to those presented in Figure 3 and Figure 4. By comparing the CC air flow rate, the generated heat of the CC of this system was slightly lower than that of the reference system. The AOGR system enhanced the efficiency of fuel utilization, so the available energy in CC becomes reduced. The temperature of the recirculation blower is also shown in Figure 5a,b, and it falls within the appropriate operating temperature. The recirculation blower temperature was between 691.79 and 745.86 K.
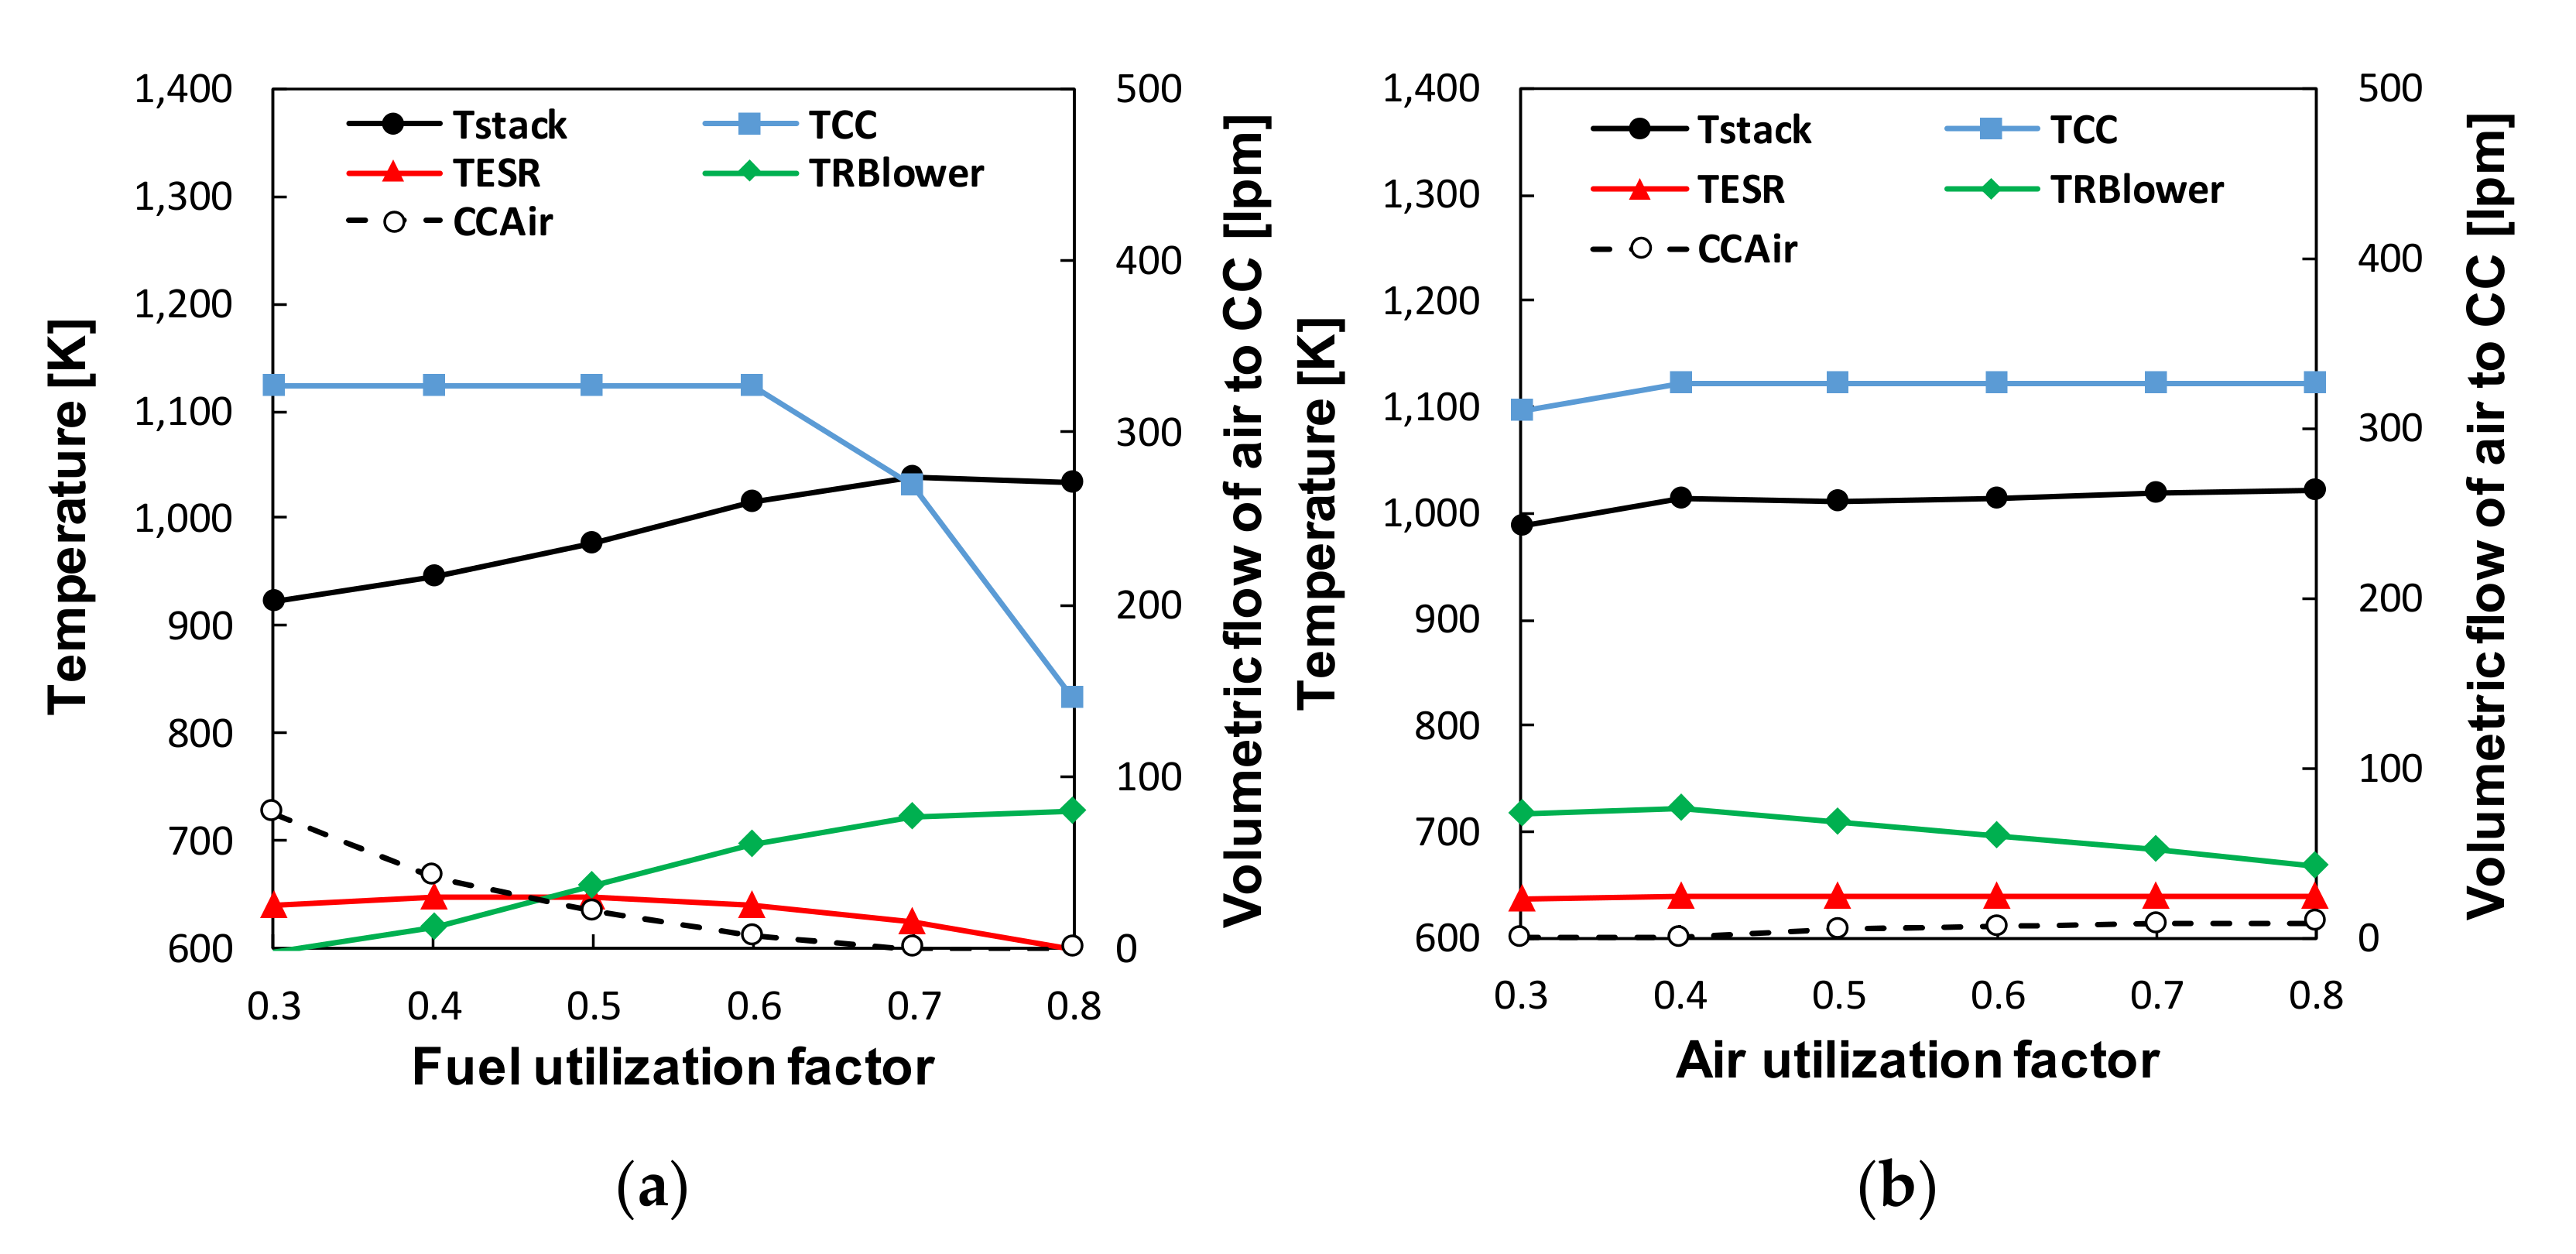
The difference between the AOGR #1 and AOGR #2 systems is the heat supply method for the ESR. As mentioned in Section 2, the ESR applied in the system with AOGR #1 was thermally integrated with the CC to directly absorb heat from the CCOG. Meanwhile, the ESR used in the AOGR #2 system received the required heat only from the reactants. Fuel preheater 2 was also added to recover additional heat from the COG, as shown in Figure 1c. The effect of fuel and air utilization factors on component temperatures is presented in Figure 6a,b. The changes in temperature of the stack, ESR and CC were similar to those presented in Section 4.3.2. However, CCOG did not directly flow to the ESR, and the temperatures of the stack and CC in the AOGR #2 system became higher than those in the AOGR #1 system. When the fuel utilization factor was 0.8, the stack temperature slightly decreased. Under this condition, the effect of the stack temperature reduction because of the lowered inlet air temperature became greater than the effect of the stack temperature increase caused by the weakened internal reforming reaction.
With regard to the recirculation blower, the temperature of the recirculation blower increased to 728.02 K at the fuel utilization factor of 0.8. The heat supply amount at the fuel preheater diminished in accordance with the increase in the fuel utilization factor. On the other hand, the temperature of the recirculation blower decreased as the air utilization factor increased because of the reduced heat transfer rate in the steam generator.
4.4. Result 2: Performance Analysis
4.4.1. Comparison of Net Power
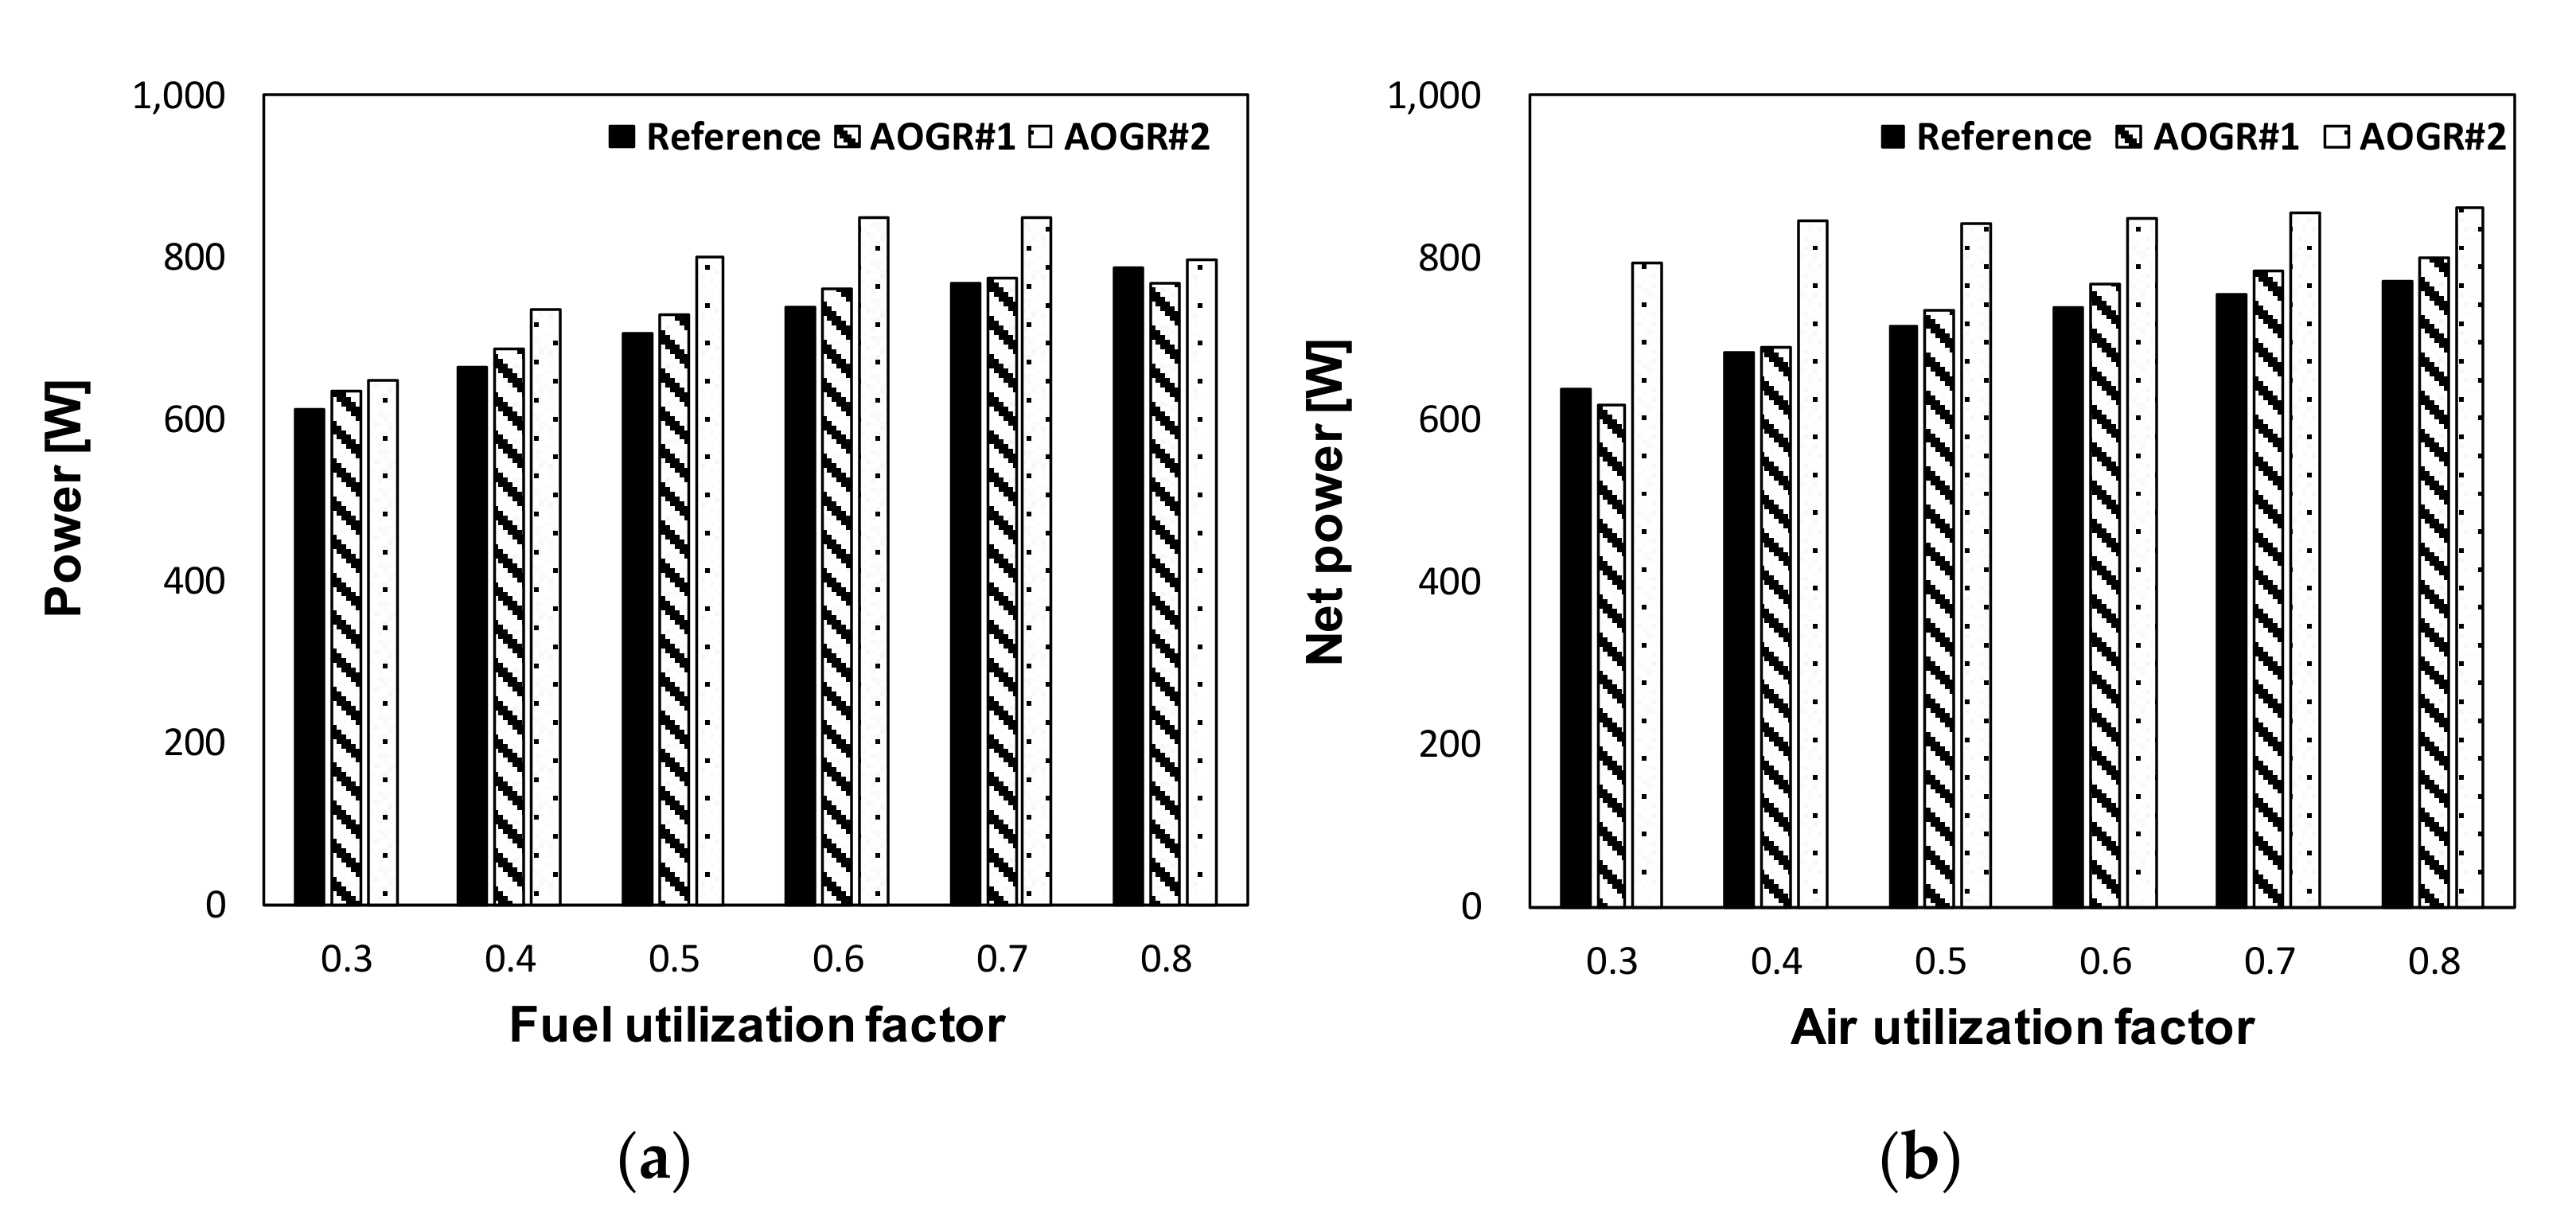
Figure 7a represents the net power of each system with various fuel utilization factors. For the computation of net power, the power consumptions of the stack air blower, CC air blower and recirculation blower were considered. According to the result of the reference system, the net power continuously increases with increasing fuel utilization factor. An increased stack temperature affected the enhancement of net power. For the AOGR #1 and AOGR #2 systems, however, the net power decreased when the fuel utilization factor reached a certain value. The maximum net power of AOGR #1 and AOGR #2 was 774.92 and 848.88 W, respectively, at a fuel utilization factor of 0.7. An increase in the stack temperature had a positive effect on power enhancement, on the other hand, the power was simultaneously negatively affected since a relatively high fuel utilization factor caused a fuel dilution problem at the anode. The effect of the air utilization factor on the net power is depicted in Figure 7b. The weakened cooling effect by lower stack air flow resulted in performance improvement for all systems.
When comparing the results of each system, the net power of the AOGR #2 system was higher than that of the other systems. This was because the AOGR #2 system applied the heat of CCOG only to the stack inlet air, increasing the stack temperature. The performance improvement became noticeable with a high fuel utilization factor (except for 0.8) and low air utilization factor. The net power of the AOGR #2 system was on average 9.48% and 7.24% higher than that of the reference system and the AOGR #1 system in Figure 7a and on average 17.70% and 15.55% higher in Figure 7b, respectively. This result explains that when a DIR stack is used, a high temperature at the ESR is not necessarily required. DIR reactions sufficiently compensate for lowered ESR performance, and a temperature rise in the stack develops the performance.
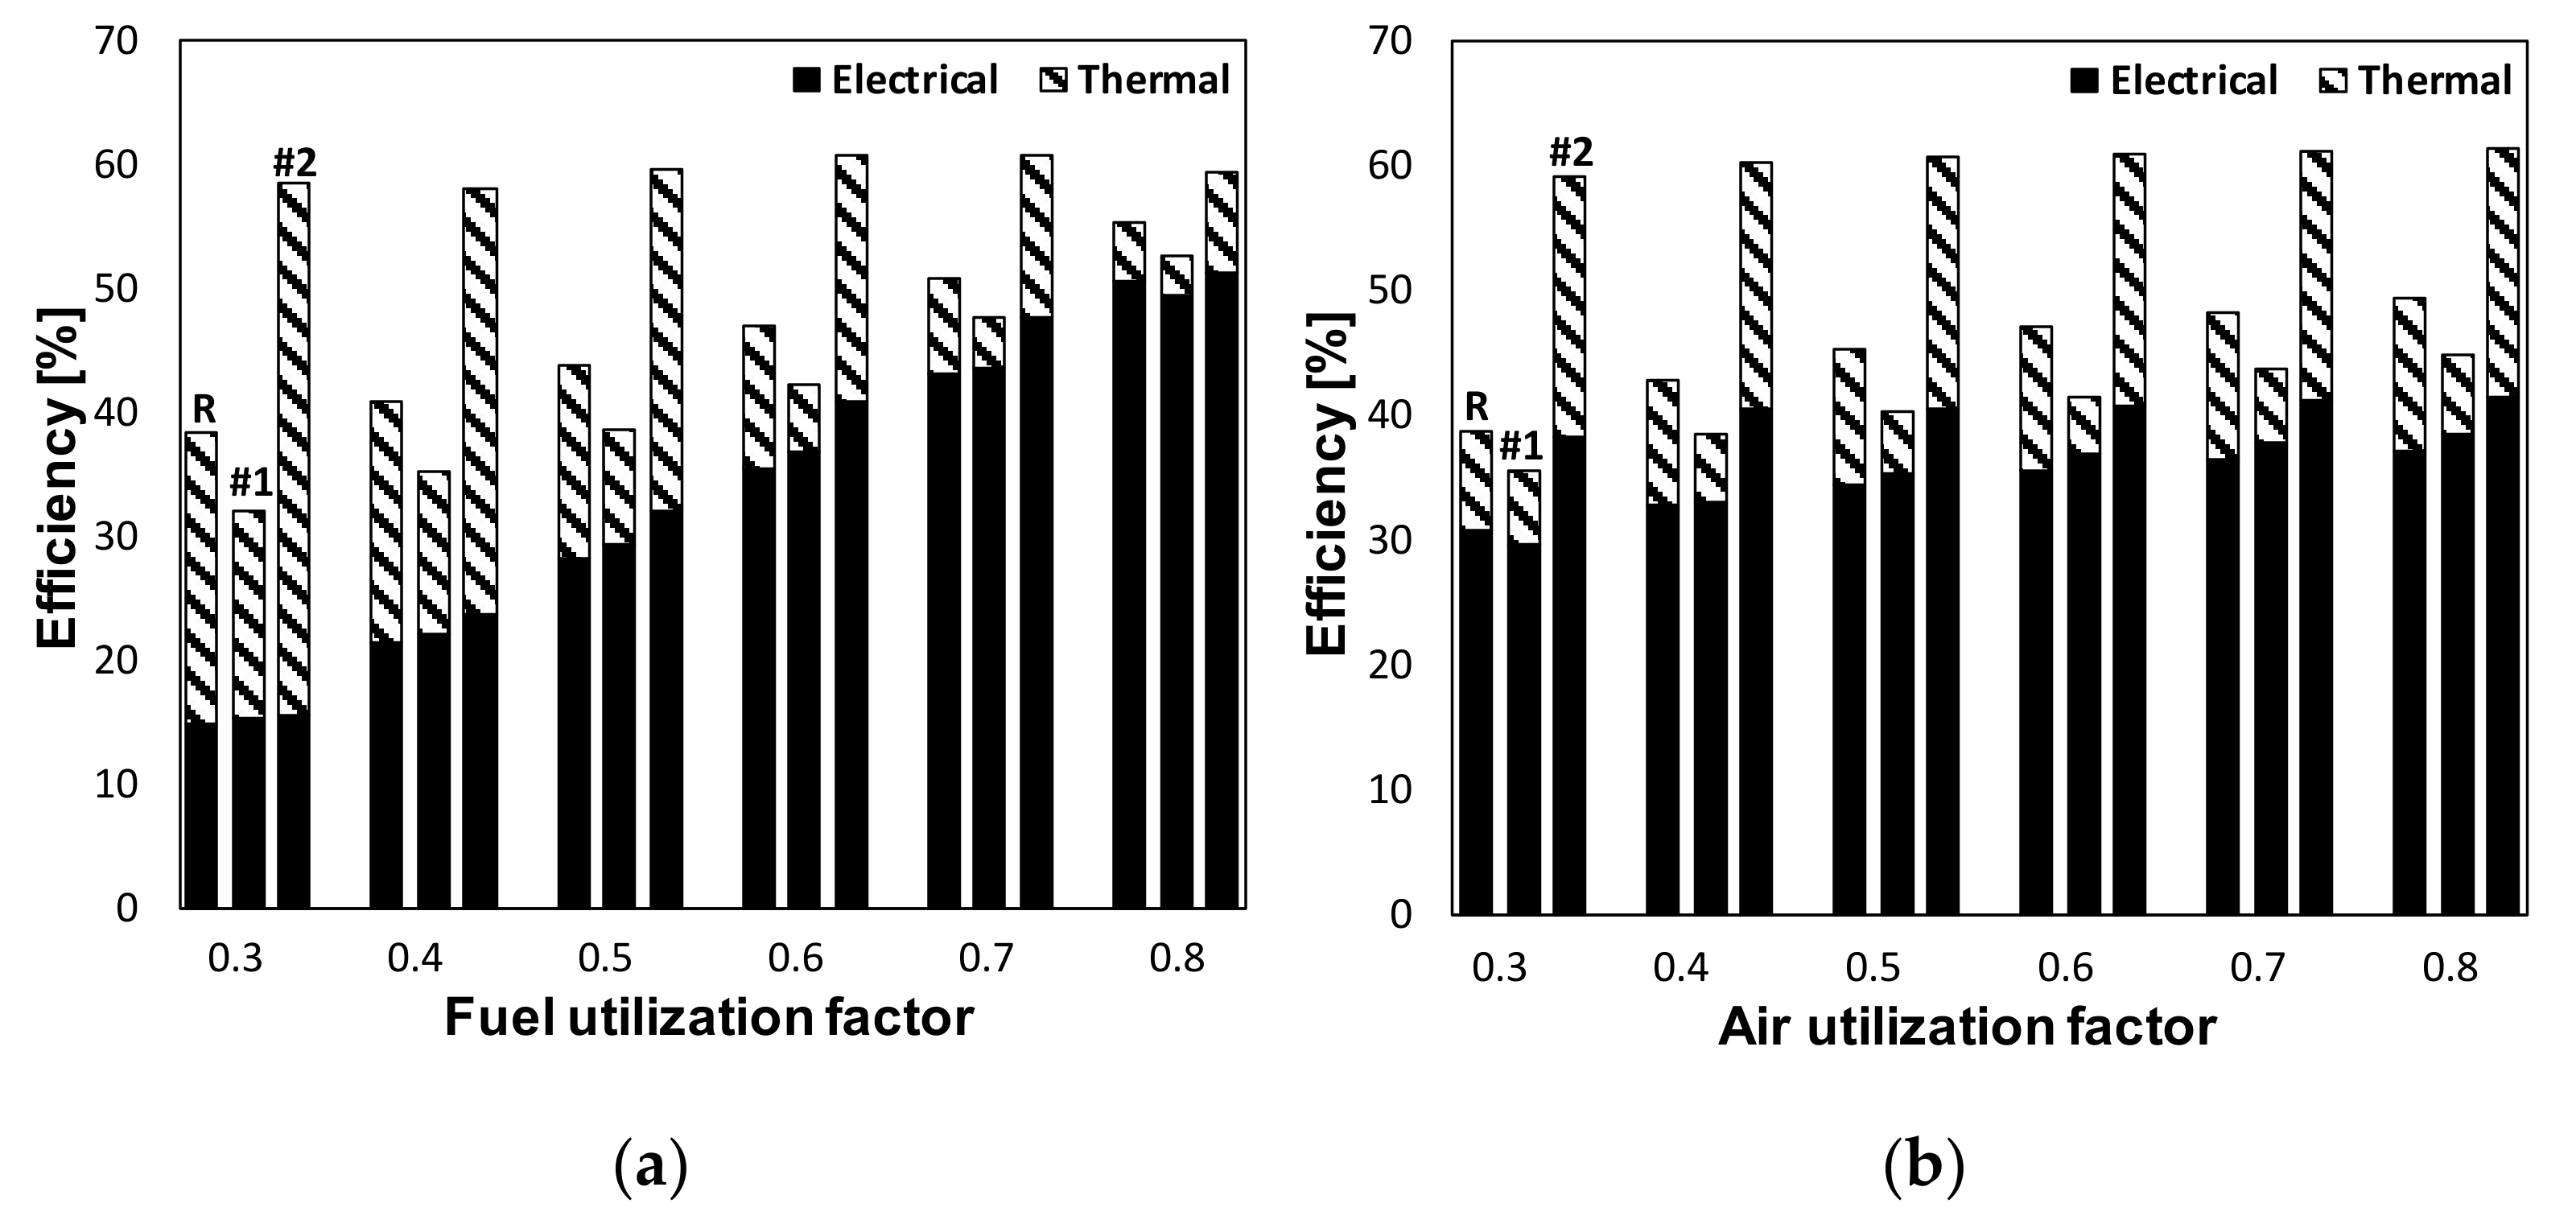
4.4.2. Comparison of Efficiency
The electrical and thermal efficiency of each system depending on the fuel and air utilization factor is described in Figure 8a,b. In Figure 8a, decreased amount of input fuel energy resulted in an increase in electrical efficiency for all systems when the fuel utilization factor increased. Meanwhile, the thermal efficiency was reduced as the amount of generated heat at the CC diminished because of the lower fuel supply. The total efficiency of the reference system and AOGR #1 system was enhanced from 38.25 to 55.35% and from 31.94 to 52.58%, respectively. Despite the higher net power of the AOGR #1 system than the reference system, the reference system had higher total efficiency due to the larger heat recovery amount. The AOGR #2 system showed relatively higher total efficiency with little change. The maximum total efficiency was 60.81% when the electrical and thermal efficiencies were 40.83 and 19.98%, respectively. When the stack air flow rate decreased, the electrical efficiency of the stack improved owing to the rise in the stack temperature for all systems, as shown in Figure 8b. The maximum total efficiency was 49.35% for the reference system, 44.90% for the AOGR #1 system and 61.36% for the AOGR #2 system when the air utilization factor was 0.8.
In Figure 8a,b, the AOGR #2 system shows the highest total efficiency among the system configurations. Unlike the other two systems, a large amount of heat can be recovered at the HR-HE of AOGR #2. Therefore, the thermal efficiency of this system was superior to that of the other systems. By comparing the results shown in Figure 7 and Figure 8, the fuel flow rate was a relatively influential factor in the system performance.
4.5. Result 3: The Effect of Recirculation Ratio
4.5.1. The SOFC System with AOGR #1
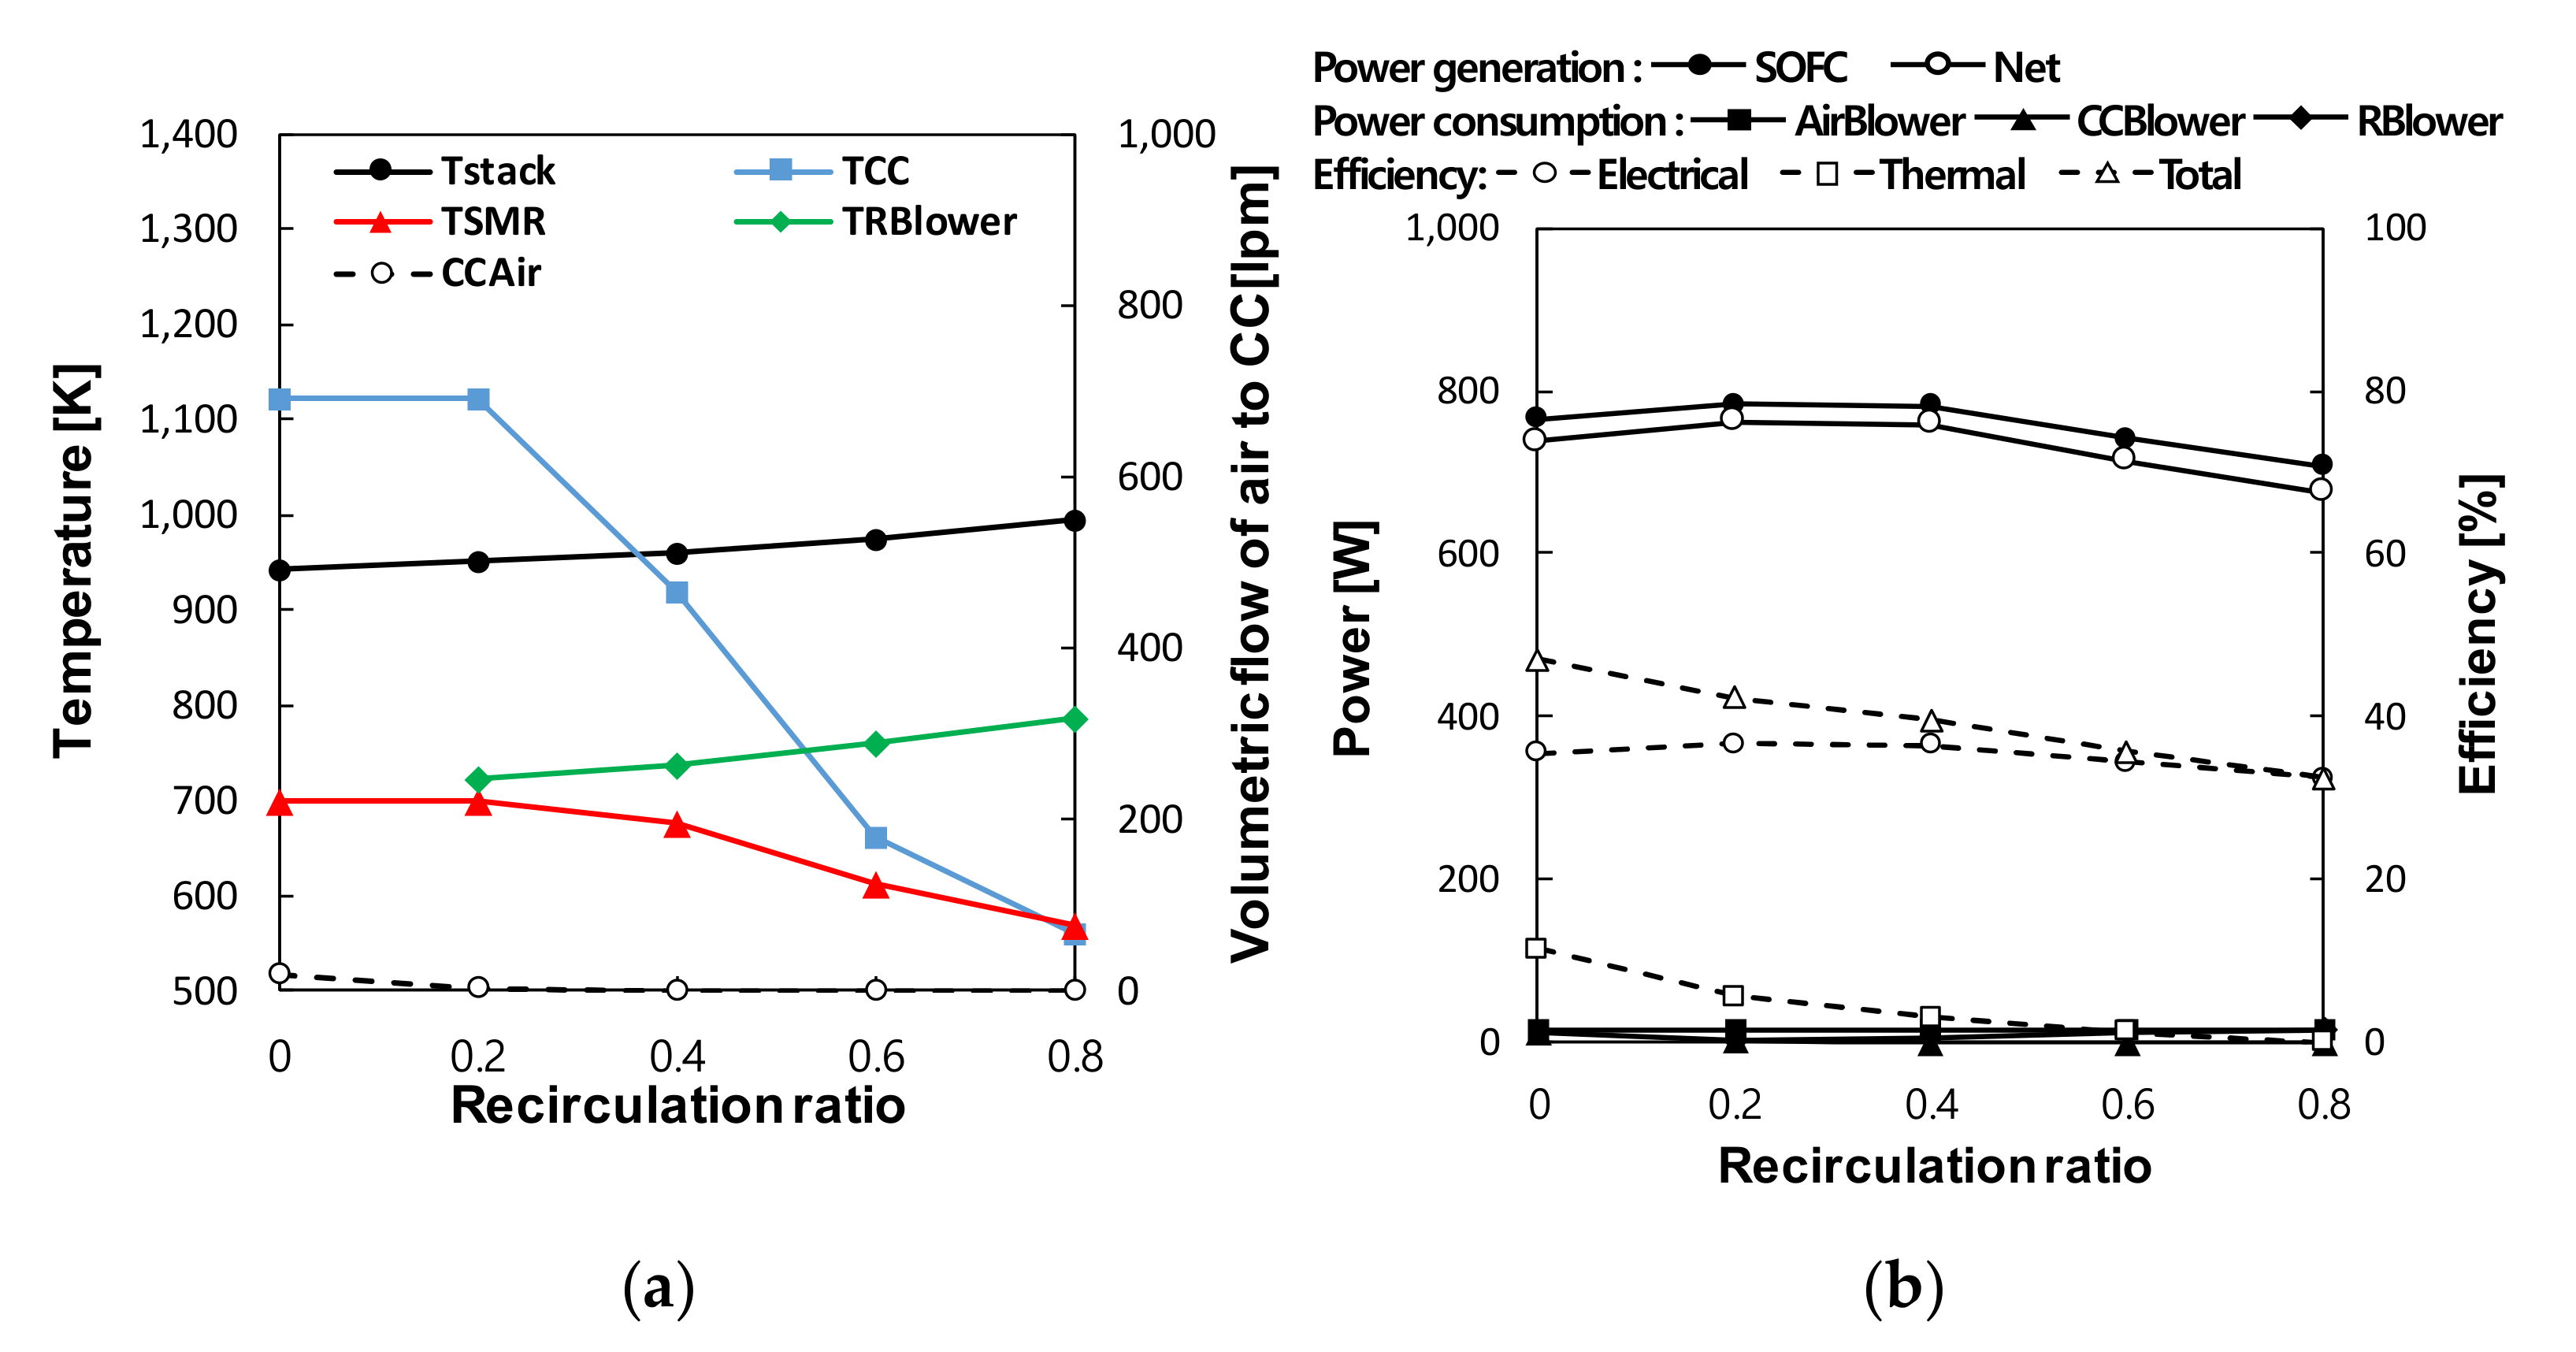
Figure 9a shows the effect of the recirculation ratio in the AOGR #1 system. Both the air and fuel utilization factors were 0.6, and the recirculation ratio changed from 0 to 0.8. As the recirculation ratio increased, the inlet fuel flow rate to the CC decreased, causing a reduction in the temperature of the ESR and CC. The recirculated fuel diluted the anode fuel at a high recirculation ratio and then weakened the internal reforming reaction in the stack. This phenomenon increased the temperature of the stack.
Power and efficiency changes are presented in Figure 9b. The maximum net power and electrical efficiency were 762.6 W and 36.7% at a recirculation ratio of 0.2. The maximum thermal efficiency was observed when AOG was not recirculated. Because heat generation of CC kept decreasing as the recirculation ratio increased, the AOGR system was unable to achieve higher thermal efficiency. Therefore, the total efficiency fell as more hydrogen was recirculated.
4.5.2. The SOFC System with AOGR #2
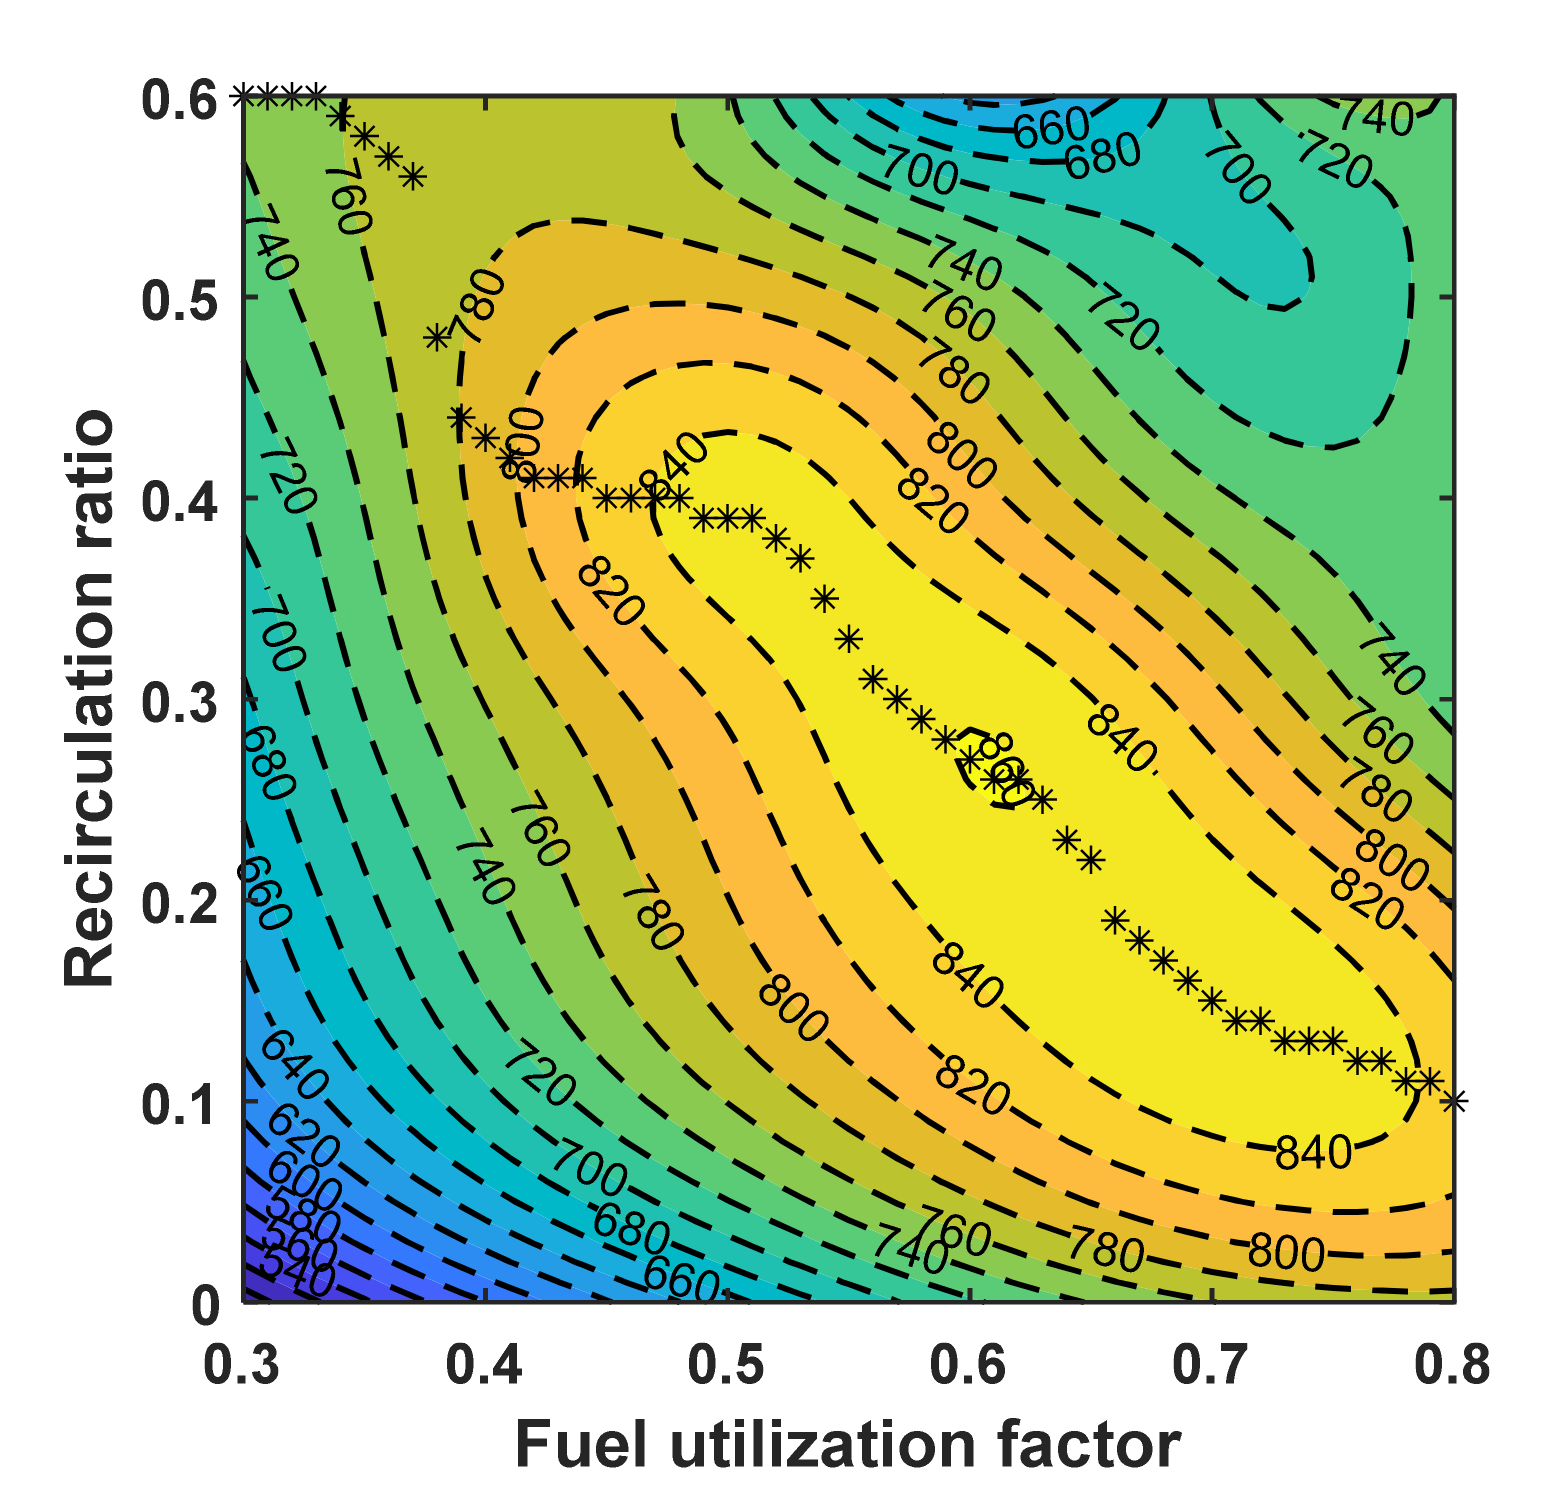
The effect of the recirculation ratio varied according to the operation condition. In this paper, the fuel and air flow rates to the system were considered as the main parameters. It was revealed that the effect of the air utilization factor on the performance of the AOGR #2 system was relatively small in the previous section, thus, power and efficiency changes with various fuel utilization factors and recirculation ratios were investigated in this section with a fixed air utilization factor of 0.6. Recirculation did not exceed 0.6 to prevent CC temperatures that were too low at high fuel utilization factors. Figure 10 shows the generated power of the stack, and the black asterisk marker indicates the maximum power points at each fuel utilization factor. The result shows that when inlet fuel flow was high, a high recirculation ratio has the advantage of power generation. However, a low recirculation ratio was better at an excessively high fuel utilization factor. An optimized point generating the maximum power of 860.82 W was achieved when the fuel utilization factor was 0.61 and the recirculation ratio was 0.26.
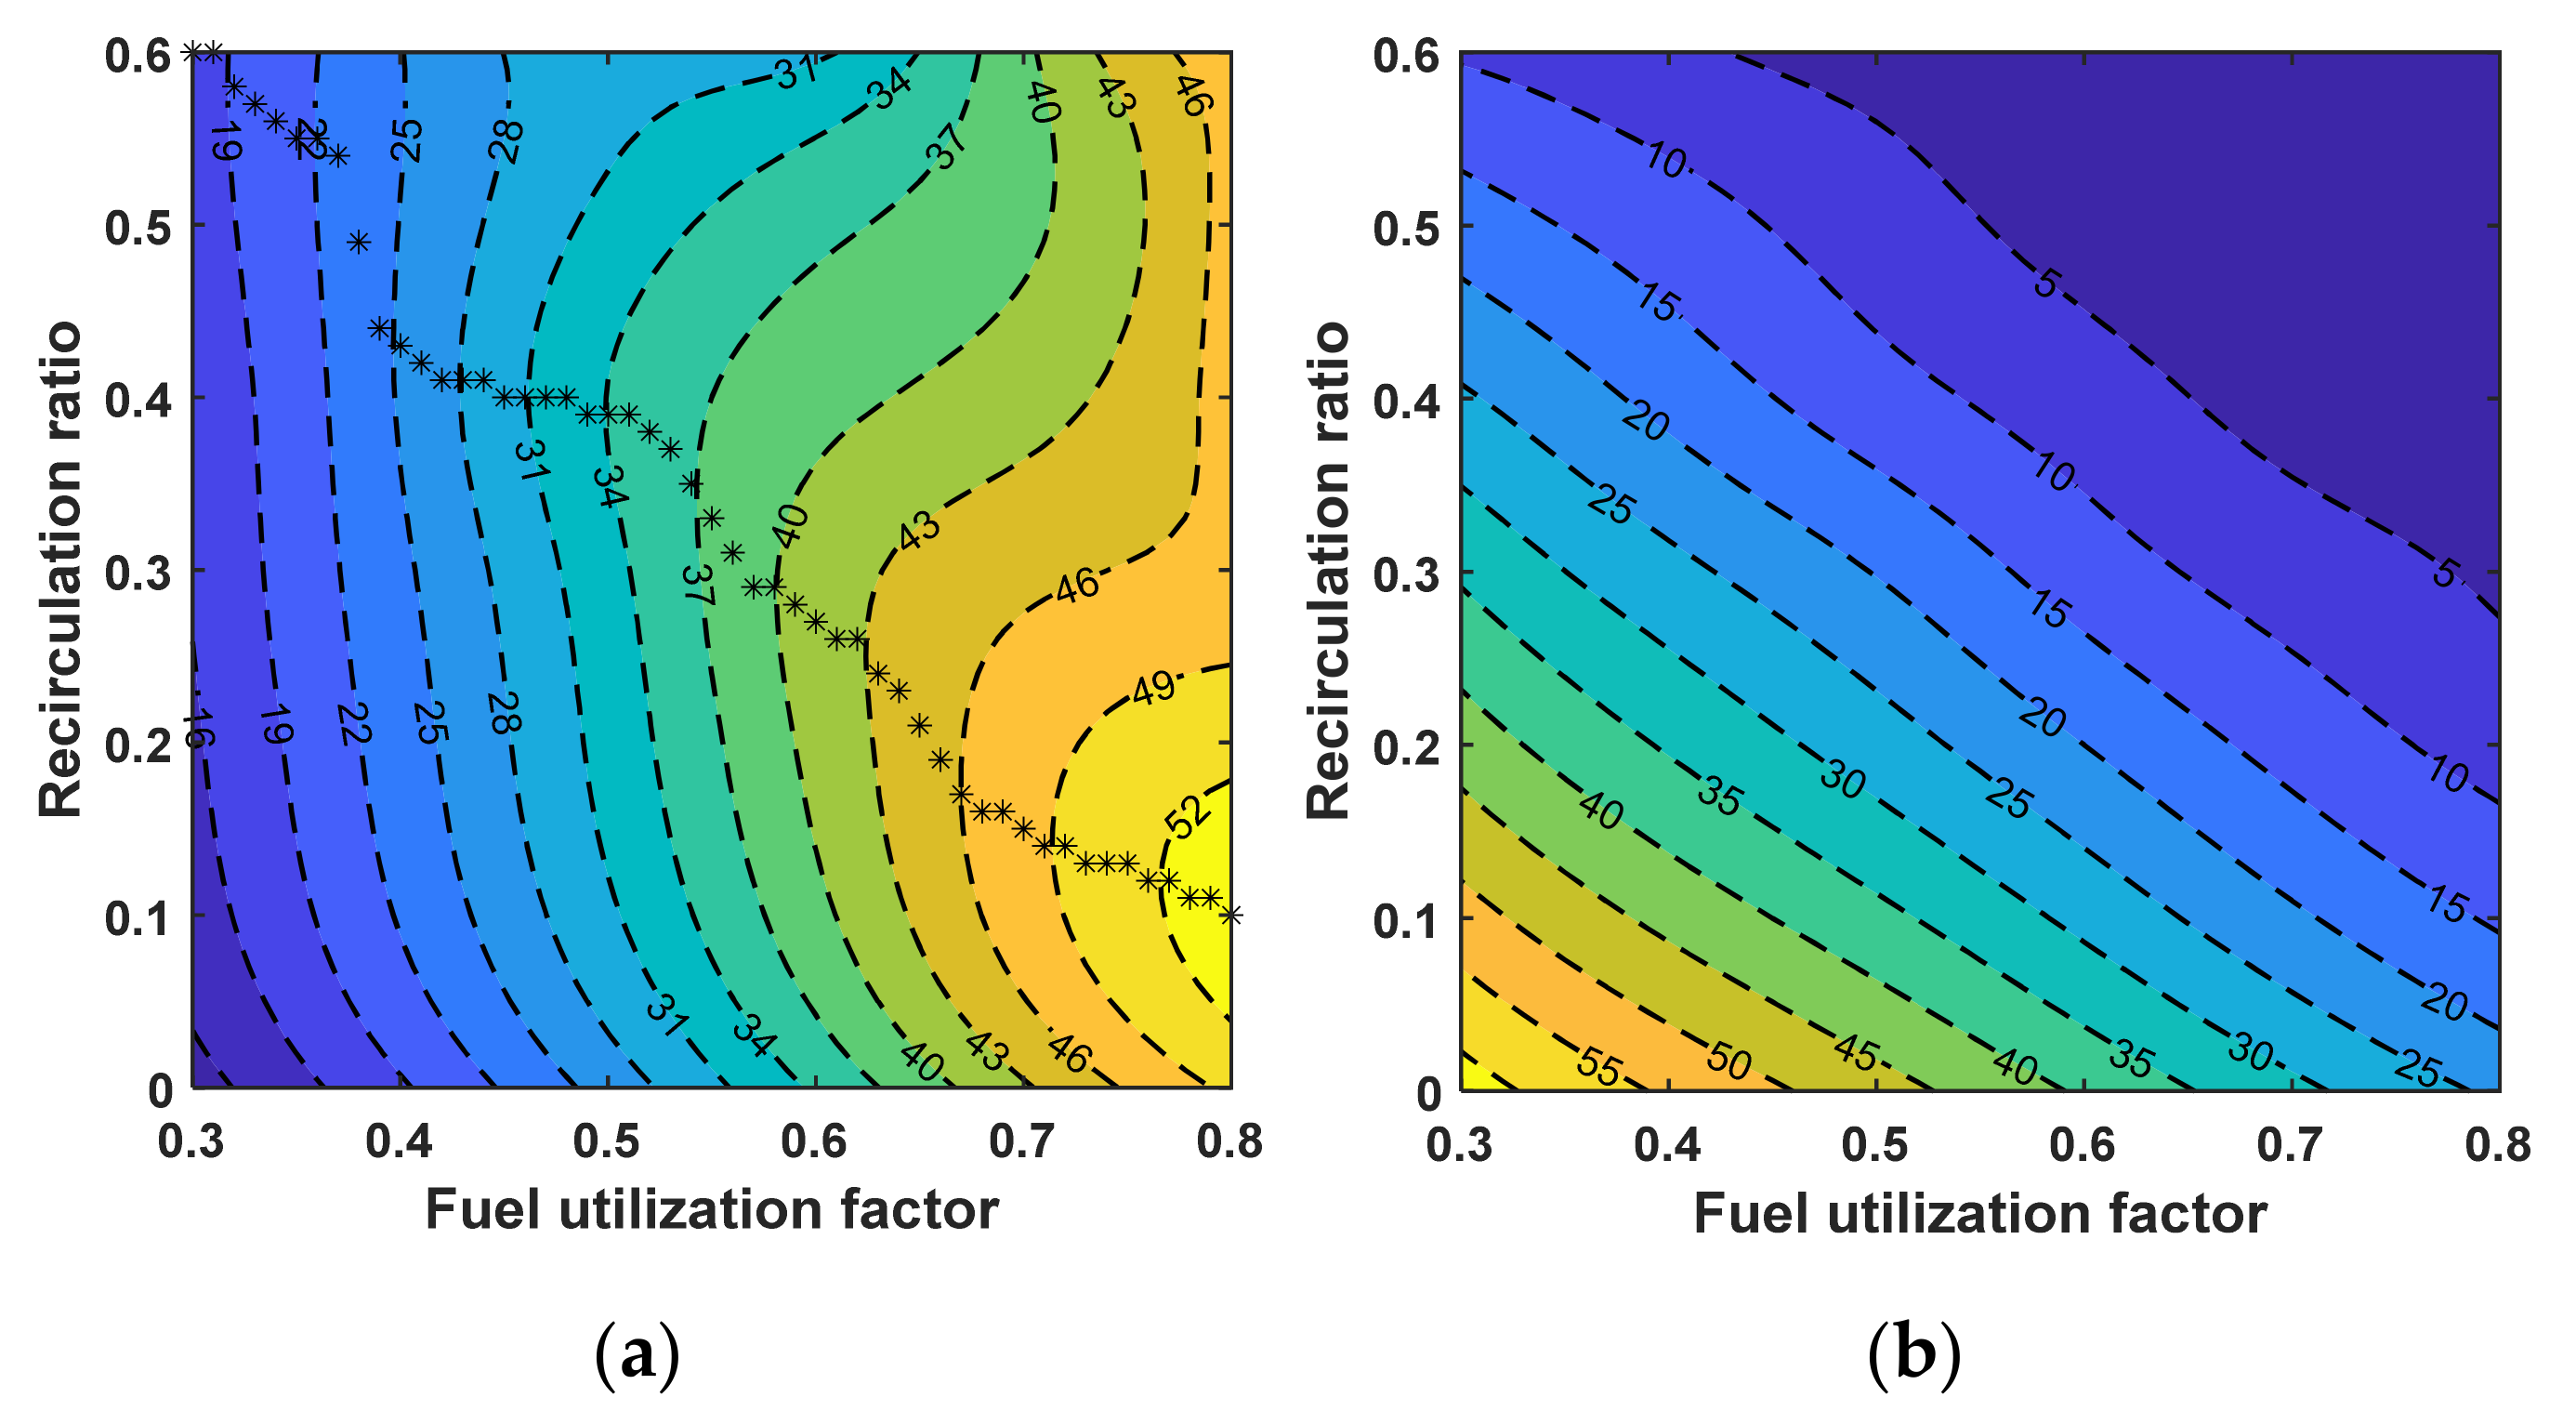
Electrical and thermal efficiency changes are presented in Figure 11. The change in electrical efficiency is similar to the result of Figure 9b. The black asterisk marker in Figure 11a represents the point of the maximum electrical efficiency at each fuel utilization factor. At a fixed fuel utilization factor, the electrical efficiency increased along the raised recirculation ratio until fuel dilution occurred. The maximum value was 53.44% when the fuel utilization factor and recirculation ratio were 0.80 and 0.10, respectively. In Figure 11b, the thermal efficiency always showed a maximum value as there was no recirculated hydrogen. The thermal efficiency continued decreasing when the fuel flow rate decreased.
5. Conclusions
To validate the effectiveness of the SOFC system with AOGR, three configurations of the SOFC system were numerically evaluated. Two different system configurations with AOGR systems using recirculation blowers were examined, and the results were compared to those of a reference system. With a developed dynamic model, the temperature of each component, power, and system efficiency were analyzed under various fuel/air utilization factors and recirculation ratios.
As the fuel and air utilization factors increased, the net power and total efficiency of the systems were enhanced because of the rise in the stack temperature. For the SOFC system with AOGR, the performance began to decrease after a certain fuel utilization factor because of fuel dilution by recirculated AOG. The AOGR #1 system showed greater electricity generation than the reference system, but the total efficiency of the reference system was higher than that of the AOGR #1 system since the reference system can recover more heat from the exhaust gas. Both the electrical and total efficiency of AOGR #2 had the highest values among the three systems. The ESR of the AOGR #2 system did not absorb additional heat from CCOG, so the thermal energy utilization of the AOGR #2 system was much higher than that of the other systems.
Anode off-gas recirculation can improve fuel utilization efficiency but also diminish the performance because of fuel dilution. The performance change with various recirculation ratios and fuel utilization factors was examined for AOGR #1 and AOGR #2 systems, and the results indicate that there is an optimum recirculation ratio depending on the operating conditions. The maximum power and electrical efficiency of AOGR #2 were 860.82 W with a fuel utilization factor of 0.61 and recirculation ratio of 0.26 and 53.44% with a fuel utilization factor of 0.80 and recirculation ratio of 0.10, respectively. In terms of thermal efficiency, however, the maximum value was achieved when the recirculation ratio was 0. While operating the SOFC system, the requirements of electricity and heat varied according to the situation. Therefore, considering the electrical and thermal load, the system operating conditions need to be controlled. Based on this study, research analyzing the dynamic characteristics of each system and developing optimized control strategies are in progress.
Author Contributions
Conceptualization, E.-J.C. and S.-M.L.; simulation, E.-J.C. and S.Y.; investigation, E.-J.C. and J.-M.K.; writing, E.-J.C.; supervision, S.-M.L. and E.-J.C. All authors have read and agreed to the published version of the manuscript.
Funding
This work was supported by the Technology Innovation Program funded by the Korea Evaluation Institute of Industrial Technology (KEIT) and the Ministry of Trade, Industry & Energy (MOTIE) of the Republic of Korea (No. 20004963).
Institutional Review Board Statement
Not applicable.
Informed Consent Statement
Not applicable.
Conflicts of Interest
The authors declare no conflict of interest.
Nomenclature
| area (m2) | |
| external surface area per unit volume of catalyst bed (m2 m−3) | |
| molar concentration (mole m−3) | |
| specific heat capacity (J kg−1 K−1) | |
| effective diffusion coefficient (m2 s−1) | |
| hydraulic diameter (m) | |
| particle diameter (m) | |
| Nernst voltage (V) | |
| Faraday constant (C mole−1) | |
| friction factor | |
| heat of reaction (kJ mole−1) | |
| convective heat transfer coefficient (W m−2 K−1) | |
| current (A) | |
| current density (A cm−2) | |
| exchange current density (A cm−2) | |
| Chilton-Colburn factor for mass and heat transfer | |
| limit current density (A cm−2) | |
| equilibrium constant (described in the paper) | |
| forward reaction rate constant (described in the paper) | |
| gas to solid mass transfer coefficient (m3 m−2 s−1) | |
| mass transfer coefficient (m s−1) | |
| cell length (m) | |
| mass flow rate (kg s−1) | |
| number of channels | |
| Nusselt number | |
| molar flow rate (mole s−1) | |
| convective heat transfer rate (W m−2) | |
| partial pressure (pa), power (W) | |
| Prandtl number | |
| ideal gas constant 8.314 (J mole−1 K−1) | |
| reaction rate (, described in the paper) | |
| Reynolds number | |
| molar rate of formation or consumption (mole m−3 s−1) | |
| molar rate of formation or consumption at SMR (mole s−1) | |
| geometric surface area per unit reactor volume (m2 m−3) | |
| Schmidt number | |
| temperature (K) | |
| time (s), thickness (m) | |
| anode electrode thickness (m) | |
| utilization factor | |
| velocity (m s−1) | |
| voltage (V) | |
| anode volume (m3) | |
| cathode volume (m3) | |
| superficial velocity of the gas (m s−1) | |
| cell width (m) | |
| molar fraction | |
| catalytic surface area per unit reactor volume (m2 m−3), ion transfer coefficients | |
| porosity | |
| overpotential (V), efficiency | |
| effectiveness factor of reaction | |
| specific heat ratio | |
| density (kg m−3) | |
| electrode conductivity (S m−1) | |
| aspect ratio | |
| Subscripts | |
| air, anode | |
| bed, base | |
| cathode | |
| catalyst | |
| channel | |
| electrode | |
| electrical | |
| fuel, fin | |
| gas | |
| species, inlet | |
| reaction | |
| monolith | |
| outlet | |
| solid | |
| Abbreviations | |
| AOG | anode off-gas |
| AOGR | anode off gas recirculation |
| CC | catalytic combustor |
| COG | cathode off-gas |
| CCOG | catalytic combustor off-gas |
| DIR | direct inter reforming |
| ESR | external steam reformer |
| ER | external reforming |
| HE | heat exchanger |
| HR-HE | heat recovery heat exchanger |
| PEN | positive-electrolyte-negative |
| RBlower | recirculation blower |
| S/C | steam to carbon |
| SMR | steam methane reforming |
| SOFC | solid oxide fuel cell |
| WGS | water gas shift |
References
- Xi, H.; Sun, J.; Tsourapas, V. A control oriented low order dynamic model for planar SOFC using minimum Gibbs free energy method. J. Power Sources 2007, 165, 253–266. [Google Scholar] [CrossRef]
- Haberman, B.A.; Young, J.B. Three-dimensional simulation of chemically reacting gas flows in the porous support structure of an integrated-planar solid oxide fuel cell. Int. J. Heat Mass Transf. 2004, 47, 3617–3629. [Google Scholar] [CrossRef]
- Yin, F.; Ji, S.; Chen, B.; Zhao, L.; Liu, H.; Li, C. Preparation and characterization of LaFe1−xMgxO3/Al2O3/FeCrAl: Catalytic properties in methane combustion. Appl. Catal. B Environ. 2006, 66, 265–273. [Google Scholar] [CrossRef]
- Van Biert, L.; Visser, K.; Aravind, P.V. A comparison of steam reforming concepts in solid oxide fuel cell systems. Appl. Energy 2020, 264, 114748. [Google Scholar] [CrossRef]
- Farhad, S.; Hamdullahpur, F.; Yoo, Y. Performance evaluation of different configurations of biogas-fuelled SOFC micro-CHP systems for residential applications. Int. J. Hydrogen Energy 2010, 35, 3758–3768. [Google Scholar] [CrossRef] [Green Version]
- Braun, R.J.; Klein, S.A.; Reindl, D.T. Evaluation of system configurations for solid oxide fuel cell-based micro-combined heat and power generators in residential applications. J. Power Sources 2006, 158, 1290–1305. [Google Scholar] [CrossRef]
- Zhang, X.; Chan, S.H.; Li, G.; Ho, H.K.; Li, J.; Feng, Z. A review of integration strategies for solid oxide fuel cells. J. Power Sources 2010, 195, 685–702. [Google Scholar] [CrossRef]
- Suzuki, M.; Sogi, T.; Higaki, K.; Ono, T.; Takahashi, N.; Shimazu, K.; Shigehisa, T. Development of SOFC residential cogeneration system at Osaka gas and Kyocera. ECS Trans. 2007, 7, 27–30. [Google Scholar] [CrossRef]
- Riensche, E.; Stimming, U.; Unverzagt, G. Optimization of a 200 kW SOFC cogeneration power plant: Part I: Variation of process parameters. J. Power Sources 1998, 73, 251–256. [Google Scholar] [CrossRef]
- Lee, K.; Kang, S.; Ahn, K.Y. Development of a highly efficient solid oxide fuel cell system. Appl. Energy 2017, 205, 822–833. [Google Scholar] [CrossRef]
- Lisbona, P.; Corradetti, A.; Bove, R.; Lunghi, P. Analysis of a solid oxide fuel cell system for combined heat and power applications under non-nominal conditions. Electrochim. Acta 2007, 53, 1920–1930. [Google Scholar] [CrossRef]
- Powell, M.; Meinhardt, K.; Sprenkle, V.; Chick, L.; McVay, G. Demonstration of a highly efficient solid oxide fuel cell power system using adiabatic steam reforming and anode gas recirculation. J. Power Sources 2012, 205, 377–384. [Google Scholar] [CrossRef]
- Koo, T.; Kim, Y.S.; Lee, D.; Yu, S.; Lee, Y.D. System Simulation and Exergetic Analysis of Solid Oxide Fuel Cell Power Generation System with Cascade Configuration. Energy 2021, 214, 119087. [Google Scholar] [CrossRef]
- Wagner, P.H.; Wuillemin, Z.; Constantin, D.; Diethelm, S.; van Herle, J.; Schiffmann, J. Experimental Characterization of a Solid Oxide Fuel Cell Coupled to a Steam-Driven Micro Anode off-Gas Recirculation Fan. Appl. Energy 2020, 262. [Google Scholar] [CrossRef]
- Baba, S.; Takahashi, S.; Kobayashi, N.; Hirano, S. Performance of Anodic Recirculation by a Variable Flow Ejector for a Solid Oxide Fuel Cell System under Partial Loads. Int. J. Hydrogen Energy 2020, 45, 10039–10049. [Google Scholar] [CrossRef]
- Tanaka, Y.; Sato, K.; Yamamoto, A.; Kato, T. Development of Anode Off-Gas Recycle Blowers for High Efficiency SOFC Systems. ECS Trans. 2013, 57, 443–450. [Google Scholar] [CrossRef]
- Dietrich, R.-U.; Lindermeir, A.; Immisch, C.; Spieker, C.; Spitta, C.; Stenger, S.; Leithner, R.; Kuster, T.; Oberland, A. SOFC System Using a Hot Gas Ejector for Offgas Recycling for High Efficient Power Generation from Propane. ECS Trans. 2013, 57, 171–184. [Google Scholar] [CrossRef]
- Kim, Y.S.; Lee, Y.D.; Ahn, K.Y. System integration and proof-of-concept test results of SOFC–engine hybrid power generation system. Appl. Energy 2020, 277, 115542. [Google Scholar] [CrossRef]
- Kuchonthara, P.; Bhattacharya, S.; Tsutsumi, A. Combinations of solid oxide fuel cell and several enhanced gas turbine cycles. J. Power Sources 2003, 124, 65–75. [Google Scholar] [CrossRef]
- Aguiar, P.; Adjiman, C.S.; Brandon, N.P. Anode-supported intermediate temperature direct internal reforming solid oxide fuel cell I: Model-based steady-state performance. J. Power Sources 2004, 138, 120–136. [Google Scholar] [CrossRef]
- Kendall, K.; Singhal, S.C. High-Temperature Solid Oxide Fuel Cells: Fundamentals, Design and Applications, 1st ed.; Elsevier Science: Amsterdam, The Netherlands, 2013. [Google Scholar]
- Kong, Q.; Yin, Y.; Xue, B.; Jin, Y.; Feng, W.; Chen, Z.G.; Su, S.; Sun, C. Improved catalytic combustion of methane using CuO nanobelts with predominantly (001) surfaces. Beilstein J. Nanotechnol. 2018, 9, 2526–2532. [Google Scholar] [CrossRef]
- Van Biert, L.; Godjevac, M.; Visser, K.; Aravind, P.V. Dynamic modelling of a direct internal reforming solid oxide fuel cell stack based on single cell experiments. Appl. Energy 2019, 250, 976–990. [Google Scholar] [CrossRef]
- Ota, T.; Koyama, M.; Wen, C.J.; Yamada, K.; Takahashi, H. Object-based modeling of SOFC system: Dynamic behavior of micro-tube SOFC. J. Power Sources 2003, 118, 430–439. [Google Scholar] [CrossRef]
- Achenbach, E. Three-dimensional and time-dependent simulation of a planar solid oxide fuel cell stack. J. Power Sources 1994, 49, 333–348. [Google Scholar] [CrossRef]
- Nakagawa, N.; Sagara, H.; Kato, K. Catalytic activity of Ni–YSZ–CeO2 anode for the steam reforming of methane in a direct internal-reforming solid oxide fuel cell. J. Power Sources 2001, 92, 88–94. [Google Scholar] [CrossRef]
- Lee, A.L.; Zabransky, R.; Huber, W. Internal reforming development for solid oxide fuel cells. Ind. Eng. Chem. Res. 1990, 29, 766–773. [Google Scholar] [CrossRef]
- Abbas, S.Z.; Dupont, V.; Mahmud, T. Kinetics study and modelling of steam methane reforming process over a NiO/Al2O3 catalyst in an adiabatic packed bed reactor. Int. J. Hydrogen Energy 2017, 42, 2889–2903. [Google Scholar] [CrossRef]
- Chinda, P.; Chanchaona, S.; Brault, P.; Wechsatol, W. A planar anode-supported solid oxide fuel cell model with internal reforming of natural gas. Eur. Phys. J. Appl. Phys. 2011, 54, 23405. [Google Scholar] [CrossRef]
- Lehnert, W.; Meusinger, J.; Thom, F. Modelling of gas transport phenomena in SOFC anodes. J. Power Sources 2000, 87, 57–63. [Google Scholar] [CrossRef]
- Campanari, S.; Iora, P. Definition and sensitivity analysis of a finite volume SOFC model for a tubular cell geometry. J. Power Sources 2004, 132, 113–126. [Google Scholar] [CrossRef]
- Mbodji, M.; Commenge, J.M.; Falk, L.; di Marco, D.; Rossignol, F.; Prost, L.; Valentin, S.; Joly, R.; Del-Gallo, P. Steam methane reforming reaction process intensification by using a millistructured reactor: Experimental setup and model validation for global kinetic reaction rate estimation. Chem. Eng. J. 2012, 207–208, 871–884. [Google Scholar] [CrossRef]
- Rostrup-Nielsen, J.R. Catalytic Steam Reforming; Springer: Berlin, Germany, 1984. [Google Scholar]
- Twigg, M.V. Catalyst Handbook; Wolfe Publishing: London, UK, 1989. [Google Scholar]
- Xu, J.; Froment, G.F. Methane steam reforming, methanation and water-gas shift: I. Intrinsic kinetics. AIChE J. 1989, 35, 88–96. [Google Scholar] [CrossRef]
- Geankoplis, C.J. Transport Processes and Unit Operations; Pearson: London, UK, 1993. [Google Scholar]
- Yoshida, F.; Ramaswami, D.; Hougen, O.A. Temperatures and partial pressures at the surfaces of catalyst particles. AIChE J. 1962, 8, 5–11. [Google Scholar] [CrossRef]
- Oh, S.H.; Cavendish, J.C. Transients of monolithic catalytic converters. Response to step changes in feed stream temperature as related to controlling automobile emissions. Ind. Eng. Chem. Prod. Res. Dev. 1982, 21, 29–37. [Google Scholar] [CrossRef]
Figure 1.
Schematic diagram of the system configuration; (a) reference system, (b) AOGR #1 system, and (c) AOGR #2 system.
Figure 1.
Schematic diagram of the system configuration; (a) reference system, (b) AOGR #1 system, and (c) AOGR #2 system.


Figure 2.
Comparison between the predictions and experimental data.

Figure 3.
The effect of fuel utilization factor on the reference system; (a) temperature of each component, (b) heat transfer rate at each heat exchanger (COG HE: steam generator, CCOG HE: air pre-heater, HR HE: heat recovery heat exchanger).
Figure 3.
The effect of fuel utilization factor on the reference system; (a) temperature of each component, (b) heat transfer rate at each heat exchanger (COG HE: steam generator, CCOG HE: air pre-heater, HR HE: heat recovery heat exchanger).

Figure 4.
The effect of air utilization factor on the reference system; (a) temperature of each component, (b) heat transfer rate at each heat exchanger (COG HE: steam generator, CCOG HE: air pre-heater, HR HE: heat recovery heat exchanger).
Figure 4.
The effect of air utilization factor on the reference system; (a) temperature of each component, (b) heat transfer rate at each heat exchanger (COG HE: steam generator, CCOG HE: air pre-heater, HR HE: heat recovery heat exchanger).

Figure 5.
The effect of (a) fuel and (b) air utilization factors on the AOGR #1 system.4.3.3. SOFC System with AOGR #2.
Figure 5.
The effect of (a) fuel and (b) air utilization factors on the AOGR #1 system.4.3.3. SOFC System with AOGR #2.

Figure 6.
The effect of (a) fuel and (b) air utilization factors on the AOGR #2 system.

Figure 7.
Net power of each configuration with various (a) fuel and (b) air utilization factors.

Figure 8.
Efficiency of each configuration with various (a) fuel and (b) air utilization factors. (R: reference system, #1: AOGR #1 system, #2: AOGR #2 system).
Figure 8.
Efficiency of each configuration with various (a) fuel and (b) air utilization factors. (R: reference system, #1: AOGR #1 system, #2: AOGR #2 system).

Figure 9.
The effect of recirculation ratio on the AOGR #1 system; (a) temperature of each component and (b) power and efficiency.
Figure 9.
The effect of recirculation ratio on the AOGR #1 system; (a) temperature of each component and (b) power and efficiency.

Figure 10.
Generated power of AOGR #2 system with various fuel utilization factors and recirculation ratios.
Figure 10.
Generated power of AOGR #2 system with various fuel utilization factors and recirculation ratios.

Figure 11.
Efficiency of the AOGR #2 system with various fuel utilization factors and recirculation ratios; (a) electrical and (b) thermal efficiency.
Figure 11.
Efficiency of the AOGR #2 system with various fuel utilization factors and recirculation ratios; (a) electrical and (b) thermal efficiency.


Table 1.
A literature summary of the SOFC system with AOGR.
| Authors | SOFC Power | (Max.) | AOGR Device | Comments |
|---|---|---|---|---|
| Lee et al. [10] | 5 kW | 64.6% | Ejector | The turbocharger and ejector are used to blow the cathode air and AOG. Sensitivity analysis has been conducted to determine the optimal operating schemes. |
| Powell et al. [12] | 1.7–2.2 kW | 56.6% (LHV) | Blower | The system uses adiabatic ESR and AOGR system. Required heat and steam for SMR are provided by recirculated AOG. |
| Koo et al. [13] | 113.8 kW | 66% (LHV) | Blower | A cascade system having a double SOFC system and a single SOFC system with AOGR was analyzed using the exergy-based analysis method. |
| Wagner et al. [14] | 6 kW | 66% (LHV) | Fan | A novel micro AOGR fan has been introduced and experimentally coupled to SOFC system. |
| Baba et al. [15] | 1 kW | - | Ejector | SOFC system with a variable flow ejector was examined under partial load and full load conditions. |
| Tanaka et al. [16] | 10 kW | 58.7% (LHV) | Blower | Tow AOGR blowers were developed and coupled with SOFC system simulator. |
| Dietrich et al. [17] | 0.3 kW | 41% (LHV) | Injector | SOFC running on propane with AOGR was experimentally examined and compared to a partial oxidation system. |
Table 2.
A SOFC stack specifications.
| Parameter | Values |
|---|---|
| Cell length (m) | 0.1 |
| Cell width (m) | 0.1 |
| Number of cells | 40 |
| Anode electrode thickness (m) | 1 × 10⁻³ |
| Cathode electrode thickness (m) | 3 × 10⁻⁴ |
| Electrolyte thickness (m) | 2 × 10⁻⁵ |
| Anode channel height (m) | 3 × 10⁻⁴ |
| Cathode channel height (m) | 5 × 10⁻⁴ |
| Channel width (m) | 1 × 10⁻³ |
| Number of channels | 60 |
| Anode porosity | 0.4 |
| Density of PEN (kg m−3) | 5300 |
| Specific heat of PEN (J kg−1 K−1) | 500 |
Table 3.
Reactions considered inside a stack.
| Reaction | Equation | |
|---|---|---|
| Steam methane reforming reaction (SMR) | (R1) | |
| Water gas shift reaction (WGS) | (R2) | |
| H2 oxidation reaction (Ox) | (R3) | |
| O2 reduction reaction (Red) | (R4) | |
| Overall reaction | (R5) |
Table 4.
Equations for the overpotentials of the stack based on Ref. [29].
Table 4.
Equations for the overpotentials of the stack based on Ref. [29].
| Equation |
|---|
| Activation overpotential |
| Ohmic overpotential |
| Concentration overpotential |
Table 5.
Reformer specifications.
| Parameter | Values |
|---|---|
| Length (m) | 0.3 |
| Diameter (m) | 0.2 |
| Particle diameter (m) | 1.2 × 10⁻³ |
| Catalyst pore radius (m) | 1 × 10⁻⁸ |
| Bed porosity | 0.4 |
| Density of reformer (kg m−3) | 3970 |
| Specific heat of reformer (J kg−1 K−1) | 765 |
Table 6.
The equations for SMR kinetics based on Xu and Froment model based on Ref. [35].
Table 6.
The equations for SMR kinetics based on Xu and Froment model based on Ref. [35].
| Equation |
|---|
| Reaction rate |
| Kinetic rate constant |
| Equilibrium constant |
| Rate of formation or consumption of each species |
Table 7.
Catalytic combustor specifications.
| Parameter | Values |
|---|---|
| Length (m) | 0.25 |
| Width (m) | 0.25 |
| Height (m) | 0.1 |
| Number of cells | 10,000 |
| Hydraulic diameter (m) | 1.2 × 10⁻³ |
| Catalyst pore radius (m) | 1 × 10⁻⁸ |
| Tortuosity | 14 |
| Monolith porosity | 0.63 |
| Density of solid (kg m−3) | 430 |
| (m2 m−3) | 26,895 |
| (m2 m−3) | 25 |
Table 8.
Equations for the reaction rate of CC based on Ref. [38].
Table 8.
Equations for the reaction rate of CC based on Ref. [38].
| Equation | |
|---|---|
| Oxidation reactions of CC | (R1) (R2) (R3) |
| Reaction rate Rate constant | |
| Adsorption equilibrium constant |
Table 9.
Operating conditions for the simulation.
| Parameter | Values |
|---|---|
| Inlet fuel | CH4 |
| Operating pressure of the system (bar) | 1.2 |
| Operating current density (A cm−2) | 0.3 |
| Maximum temperature of CC (K) | 1123.15 |
| Exhaust gas temperature (K) | 393.15 |
| S/C ratio at ESR | 2.5 |
| Ambient temperature (K) | 298.15 |
| Fuel/Air utilization factor (Reference value) | 0.3–0.8 (0.6) |
| Recirculation ratio (Reference value) | 0–0.8 (0.2) |
Publisher’s Note: MDPI stays neutral with regard to jurisdictional claims in published maps and institutional affiliations. |
© 2021 by the authors. Licensee MDPI, Basel, Switzerland. This article is an open access article distributed under the terms and conditions of the Creative Commons Attribution (CC BY) license (https://creativecommons.org/licenses/by/4.0/).
Share and Cite
MDPI and ACS Style
Choi, E.-J.; Yu, S.; Kim, J.-M.; Lee, S.-M. Model-Based System Performance Analysis of a Solid Oxide Fuel Cell System with Anode Off-Gas Recirculation. Energies 2021, 14, 3607. https://doi.org/10.3390/en14123607
AMA Style
Choi E-J, Yu S, Kim J-M, Lee S-M. Model-Based System Performance Analysis of a Solid Oxide Fuel Cell System with Anode Off-Gas Recirculation. Energies. 2021; 14(12):3607. https://doi.org/10.3390/en14123607
Chicago/Turabian StyleChoi, Eun-Jung, Sangseok Yu, Ji-Min Kim, and Sang-Min Lee. 2021. "Model-Based System Performance Analysis of a Solid Oxide Fuel Cell System with Anode Off-Gas Recirculation" Energies 14, no. 12: 3607. https://doi.org/10.3390/en14123607
Note that from the first issue of 2016, this journal uses article numbers instead of page numbers. See further details here.