Flexibility of CFB Combustion: An Investigation of Co-Combustion with Biomass and RDF at Part Load in Pilot Scale


Institute for Energy Systems and Technology, Technical University of Darmstadt, Otto-Berndt-Straße 2, 64287 Darmstadt, Germany
*
Author to whom correspondence should be addressed.
Energies 2020, 13(18), 4665; https://doi.org/10.3390/en13184665
Submission received: 30 July 2020
/
Revised: 28 August 2020
/
Accepted: 31 August 2020
/
Published: 8 September 2020
(This article belongs to the Section I: Energy Fundamentals and Conversion)
Abstract
:Co-combustion of biomass and solid fuels from wastes in existing highly efficient power plants is a low-cost solution that can be applied quickly and with low effort to mitigate climate change. Circulating fluidized bed combustion has several advantages when it comes to co-combustion, such as high fuel flexibility. The operational flexibility of circulating fluidized bed (CFB) co-combustion is investigated in a 1 MWth pilot plant. Straw pellets and refuse-derived fuel (RDF) are co-combusted with lignite at full load and part loads. This study focusses on the impact on the hydrodynamic conditions in the fluidized bed, on the heat transfer to the water/steam side of the boiler, and on the flue gas composition. The study demonstrates the flexibility of CFB combustion for three low-rank fuels that differ greatly in their properties. The co-combustion of RDF and straw does not have a negative effect on hydrodynamic stability. How the hydrodynamic conditions determine the temperature and pressure development along the furnace height is shown. The heat transfer in the furnace linearly depends on the thermal load. It increases slightly with an increasing share of straw and the influence of the hydrodynamic conditions on the heat transfer was low.
1. Introduction
The world population is growing rapidly and with it the demand for energy, which is necessary to sustain the social and economic development of the world. By far the largest part of the energy is still provided by fossil fuels [1], which results in the emission of carbon dioxide. To reduce greenhouse gas emissions and mitigate climate change, new technologies are needed and they must be applied quickly. In addition to fluctuating renewable energy sources, such as wind and solar, other technologies must be applied to compensate for their volatility and secure the energy supply. Carbon capture technologies [2,3,4,5,6] have the potential to deliver this on-demand energy with low CO2 emissions. However, retrofitting existing power plants with post-combustion carbon capture or building new plants is currently not always economically feasible and the realization of these projects will take time. A promising technology that can be applied quickly and at low costs is to use existing high-efficiency coal power plants and utilize biomass or substitute fuels to displace fossil fuels. By combining the combustion of biomass fuels and carbon capture technologies, even negative CO2 emissions are conceivable. CFB technology is an efficient option for combustion of biomass and substitute fuels due to its high flexibility for different types of fuel and high combustion efficiency.
CFB combustion is a well-proven technology that is utilized all over the world [7,8,9] with power outputs up to 600 MWel [10,11,12]. In circulating fluidized bed combustion, solid fuel particles are fluidized by air. Thereby, the mixing of particles enhances the heat and mass transfer between the particles and the gas [13,14,15,16]. The technology comes with low NOx and SOx emissions [8,14,17]. It can be operated over a wide range of thermal loads and is capable of compensating fluctuating energy input. The combustion efficiency of CFB furnaces depends on several factors, but it can be similar to that of pulverized coal boilers [18]. The flexibility for different types of fuels and fuel properties is one of the major advantages of CFB boilers. The operation is possible for a wide range of particle densities, heating values, particle sizes, particle shapes, and chemical compositions [15,19]. Therefore, CFB boilers are highly suitable to combust a large range of biomass and substitute fuels. The largest biomass combined heat and power CFB boiler has a size of 300 MWel [20]. The high fuel flexibility also offers the possibility of co-combustion of solid fuels. By replacing a share or even all of the fossil fuel by a carbon-neutral fuel, the carbon emissions can be reduced. Co-combustion and fuel flexibility also saves operational costs of the power plant, when the type of fuel is selected according to seasonal and regional availability.
There are several approaches for co-firing. During direct co-firing the fuels are combusted in the same furnace, causing low investment costs. Another option is the indirect co-firing approach, where biomass is gasified, the syngas is potentially cleaned, and then burned in the existing conventional boiler. During parallel co-firing, the fuels are burned separately in two different boilers and the steam is utilized in the same steam cycle. Direct co-firing is the least expensive and a very simple approach, and it is mostly applied at the industrial scale [9,21]. The type of co-firing technology can also be differentiated by other properties, such as the principal boiler technology (e.g., pulverized coal (PC), bubbling fluidized bed combustion (BFB) or circulating fluidized bed combustion (CFB)) or the type of fuel feeding and burner arrangement (separate/common feed lines and/or burners). There are several review papers on specific aspects of co-combustion. Sami et al. [22] present a review of a large variety of fuel blends, properties, and technologies for the co-firing of biomass and substitute fuels from waste material. Roni et al. [23] review the policies, challenges, and potential of biomass co-firing over the world. The majority of the co-firing plants are installed in European countries followed by Northern America [9,23,24]. Many publications focus on emissions, such as SO2, NOx, CO, and other pollutants, during co-combustion of coal and biomass [25,26,27,28,29] or coal and fuels from waste materials [30,31,32,33]. Other authors evaluate the fly ash quality or other issues resulting from the co-combustion of fuels with a high alkali content in the ash (e.g., corrosion, fouling) [34,35,36,37,38,39], while others perform kinetic analysis of fuel blend combustion reactions [40,41,42] or assess the impact of co-combustion on hydrodynamics [43] or the combustion efficiency [44]. Baxter et al. [45] and Dai et al. [46] review the challenges of co-combustion of coal and biomass. Other papers present numerical simulations of CFB co-combustion [44,47,48,49].
This work investigates the flexibility of CFB co-combustion in a 1 MWth plant concerning fuel flexibility and varying loads. The impact of co-combustion on several parameters is shown, such as the hydrodynamic stability/behavior, the heat transfer, the emissions, and other parameters. The objectives and the novelty of this article are summarized as:
- This study presents highly valuable experimental data for direct CFB co-combustion at full load and part load (60–100% load) at the pilot scale, which is not available in the literature so far.
- The presented data is of special interest for the retrofitting of existing coal power plants for co-combustion. It shows the feasibility of the direct co-combustion approach in CFBs at MW-scale with a CFB combustor that is not designed for any of the three fuels, as would be the case for retrofitting commercial-scale boilers.
- The impact of co-combustion on the hydrodynamic conditions is presented. The experimental setup is ideally suited to show the influence of hydrodynamics on the temperature in the furnace. A direct correlation between the fluidization state of the fluidized bed and the temperature development along the furnace height is presented.
- Very few studies exist that evaluate the influence of varying fuel mixtures on the heat transfer inside the furnace. In this study, the heat transfer inside the furnace and to the flue gas cooler are investigated.
- The influence of strongly varying chemical and physical fuel properties is shown with the combustion of three low-rank fuels, namely crushed lignite, fluffy refuse-derived fuel (RDF), and straw pellets.
- The experimental setup and boundary conditions are described in detail to allow researchers all over the world to further utilize the available data for modeling purposes for the numerical analysis of CFB co-combustion.
2. Experimental
A pilot-scale CFB combustor with a nominal load of 1 MWth is located at Technische Universität Darmstadt. In three test series, the operational flexibility of CFB combustion is investigated regarding co-combustion of lignite and straw pellets as well as lignite and RDF fluff. The impact of the type of fuel, the share of the co-fuel, and the varying load are studied in an overall testing time of around 240 h.
2.1. Experimental Setup
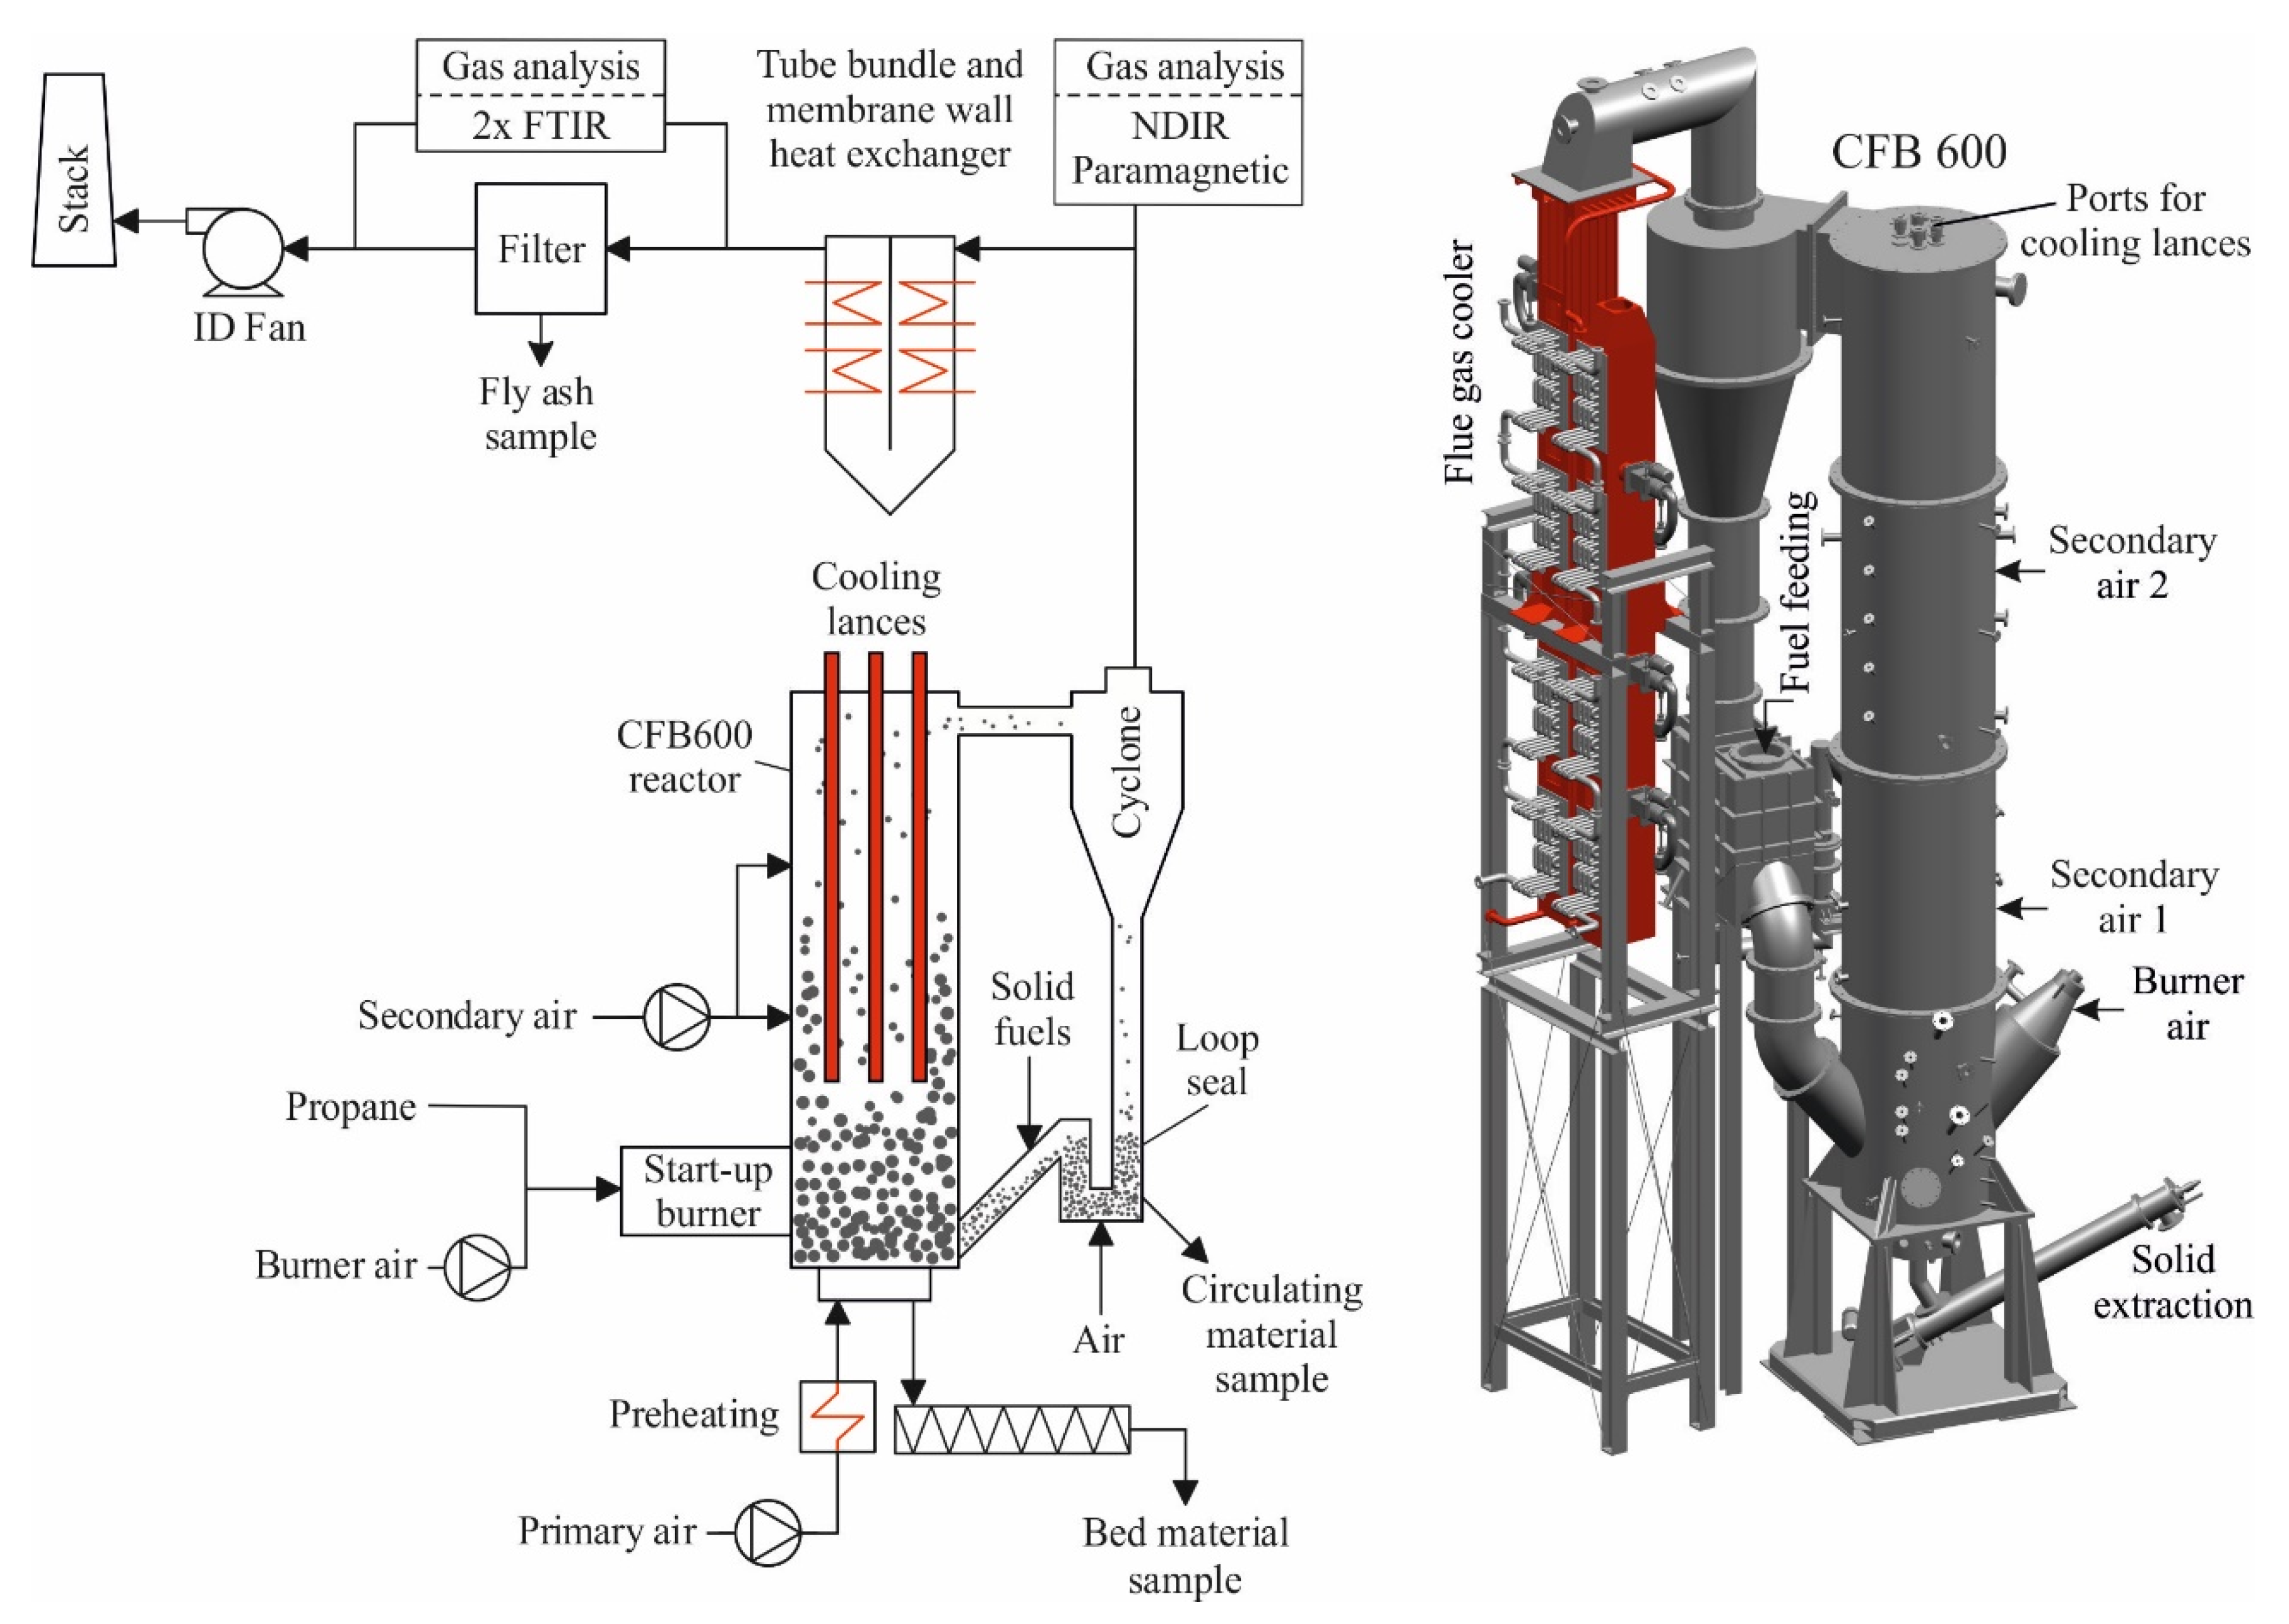
A scheme and a 3D-model of the utilized CFB boiler are shown in Figure 1. The pilot plant consists of the main components: CFB reactor (called CFB600), cooling lances, solid recirculation, air supply systems, fuel feeding systems, and the flue gas path including a venturi, a fabric filter, and an induced draft fan. It has an inner diameter of 590 mm and a total inner reactor height of 8.6 m. Five water-cooled cooling lances can be immersed into the riser to cool the particles and flue gas. The immersion depth of the lances can be varied between 0 and 8 m. The cooling lance design is described in detail in the later sections of this chapter. After leaving the riser, the major fraction of the particles is separated from the flue gas by a cyclone. Depending on their size and density, some particles (fly ash) are not separated from the flue gas by the cyclone. The flue gas and fly ash particles enter the downstream flue gas path, while coarser and higher-density particles flow downwards into the standpipe. At the bottom end of the standpipe, these particles enter the loop seal. The loop seal serves as a pressure seal between the standpipe and the reactor. Particles are recirculated to the reactor by fluidization of the loop seal with air. Two air nozzles are installed in the lower part: one nozzle is installed at the bottom pointing upwards, another nozzle points in the direction of the loop seal outlet. The particles re-enter the reactor at a height of 0.48 m via the “return leg” that connects the loop seal and reactor. Bed material is regularly extracted by a water-cooled extraction screw from the bottom of the reactor to maintain a certain inventory inside the reactor. Solid samples can be taken from the “bottom ash” and the circulating material at the loop seal. The CFB reactor, including the hot-loop circulation, is fully refractory-lined to resist temperatures of up to 1100 °C and to minimize heat losses. The outer diameter of the reactor is 1300 mm. The pilot plant is equipped with multiple measurement devices, such as temperature and pressure along with the riser height. Some selected measurement devices, their measurement principle, and their position in the pilot plant are shown in Table 1. The maximum measurement uncertainty for the temperature measurement is 0.4% (relative) of the measurement signal in °C. The maximum measurement uncertainty for the pressure measurement is 0.5% (relative) of the measurement signal in mbar.
The primary combustion air is electrically preheated up to 300 °C by radiant heaters before entering the reactor via a nozzle grid. The nozzle grid consists of 30 nozzles. These nozzles cause a certain pressure drop, which ensures uniform distribution of fluidizing air over the cross-section of the reactor and prevents the backflow of particles to the primary air line. Secondary air is injected at two heights (2.7 and 6.0 m) at ambient temperature (around 25 °C). During start-up, propane and air are injected via a start-up burner at a height of around 0.70 m to heat the plant. During the tests, only air (no fuel) is injected into the burner for cooling purposes and to prevent backflow of particles. The primary air, secondary air, and burner air are provided by air fans. The volume flow rates of air are measured with orifice plates and controlled to a certain setpoint by a PI controller adjusting the rotational speed of the fans.
All solids (fuels and sand) are fed to the return leg and enter the riser at a height of 0.48 m. An air- and nitrogen-flushed rotary valve is installed on top of the solids inlet to provide pressure sealing between the reactor and the solid feeding systems. The fuel feeding systems are especially suitable for the respective fuels. The feeding system for low-rank lignite is capable of feeding high volumes of fuel, which is necessary as the heating value is very low. Additionally, it is suitable for feeding fuels with maximum particle sizes of up to 20–30 mm, which corresponds to the maximum fuel particle size that can be combusted in the pilot plant. The feeder is weighed with four load cells. The fuel is transported from the hopper to the return leg with a conveying screw with a coil diameter of 120 mm and a shaft diameter of 65 mm. The speed of the conveying screw is controlled with the speed of a hydraulic motor. The hopper of the feeder is automatically refilled from a big bag when the weight of the feeder falls below a pre-defined value. The straw pellet feeder is suitable for feeding different kinds of fuels and solids such as pellets or ground particles. It is equipped with a twin-screw feeder that has an advantage, that it is self-cleaning; one screw cleans the other when they rotate. Therefore it is especially suitable for solids that tend to wrap themselves around the screw, such as fibrous pellets (e.g., pellets from straw or other biomass), or particles that tend to stick to the screw, such as fine powders. It is weighed to determine the mass flow rate and refilled automatically when the weight falls below a certain setpoint. The refilling-hopper is located above the feeder and is filled pneumatically from a big bag. RDF fluff is a very difficult fuel to feed with a constant flow rate. The composition of the fuel, as well as the particle size and shape, are very inhomogeneous. The average density is only 190 kg/m3 (lignite: 716 kg/m3) and varies strongly. Additionally, low calorific RDF consists of a large variety of materials such as plastics, biomass, fibers/textiles, glass, metals, and others. These properties require the use of unconventional concepts for the feeding of RDF. In the pilot plant, RDF is fed by a conveying belt which transports the fuel upwards at an angle of around 45°. Orthogonal plates are attached to the belt to transport the fluff upwards. A rubber tire rotates above the belt to ensure a uniform height of the fluff by removing the surplus material. The fuel mass flow is controlled by the speed of the conveying belt. At the upper end, the fuel falls into a downpipe connected to the rotary valve above the return leg. The RDF feeder is weighed with four load cells to determine the mass flow rate and is refilled automatically when the weight falls below a defined value. The mass flow of all fuels and other solids is calculated by mass loss over time. During the refilling of the feeders, the mass flow cannot be determined and is assumed to be equal to the mass flow before refilling.
The flue gas composition is measured after leaving the cyclone by an NDIR sensor (nondispersive infrared sensor) and a paramagnetic sensor. Here, the dry volume fractions of O2, CO2, CO, NO, and SO2 are determined. Flue gas and fly ash enter the flue gas cooler. The flue gas flows downwards through the first row, where it passes a tube bundle and a membrane wall heat exchanger in the countercurrent flow direction. Then it is redirected upwards and streams in the co-current flow through a tube bundle heat exchanger in the second row. After leaving the heat exchanger, the flue gas temperature is around 150–200 °C. The flue gas and the fly ash flow through a venture measurement to measure the volume flow rate of the gas. Then they enter a fabric filter, where the fly ash is separated from the flue gas by 49 PTFE (polytetrafluoroethylene) filter hoses. Before and after the fabric filter, the flue gas composition is measured with two FTIR (Fourier-transform infrared spectroscopy) measurement devices and additional oxygen sensors. With these devices, the main components of the flue gas O2, CO2, and H2O are measured (N2 can be calculated by Equation (4)), as well as other trace gases such as HCl, SO2, NOx, and CO. From the bottom of the fabric filter, fly ash is extracted and weighed. Solid samples are taken from this point. The particle-free flue gas streams through an induced draft fan (ID fan) and leaves the pilot plant to the environment via a stack. The ID fan maintains constant pressure at the cyclone outlet of around 1 mbar below ambient pressure.
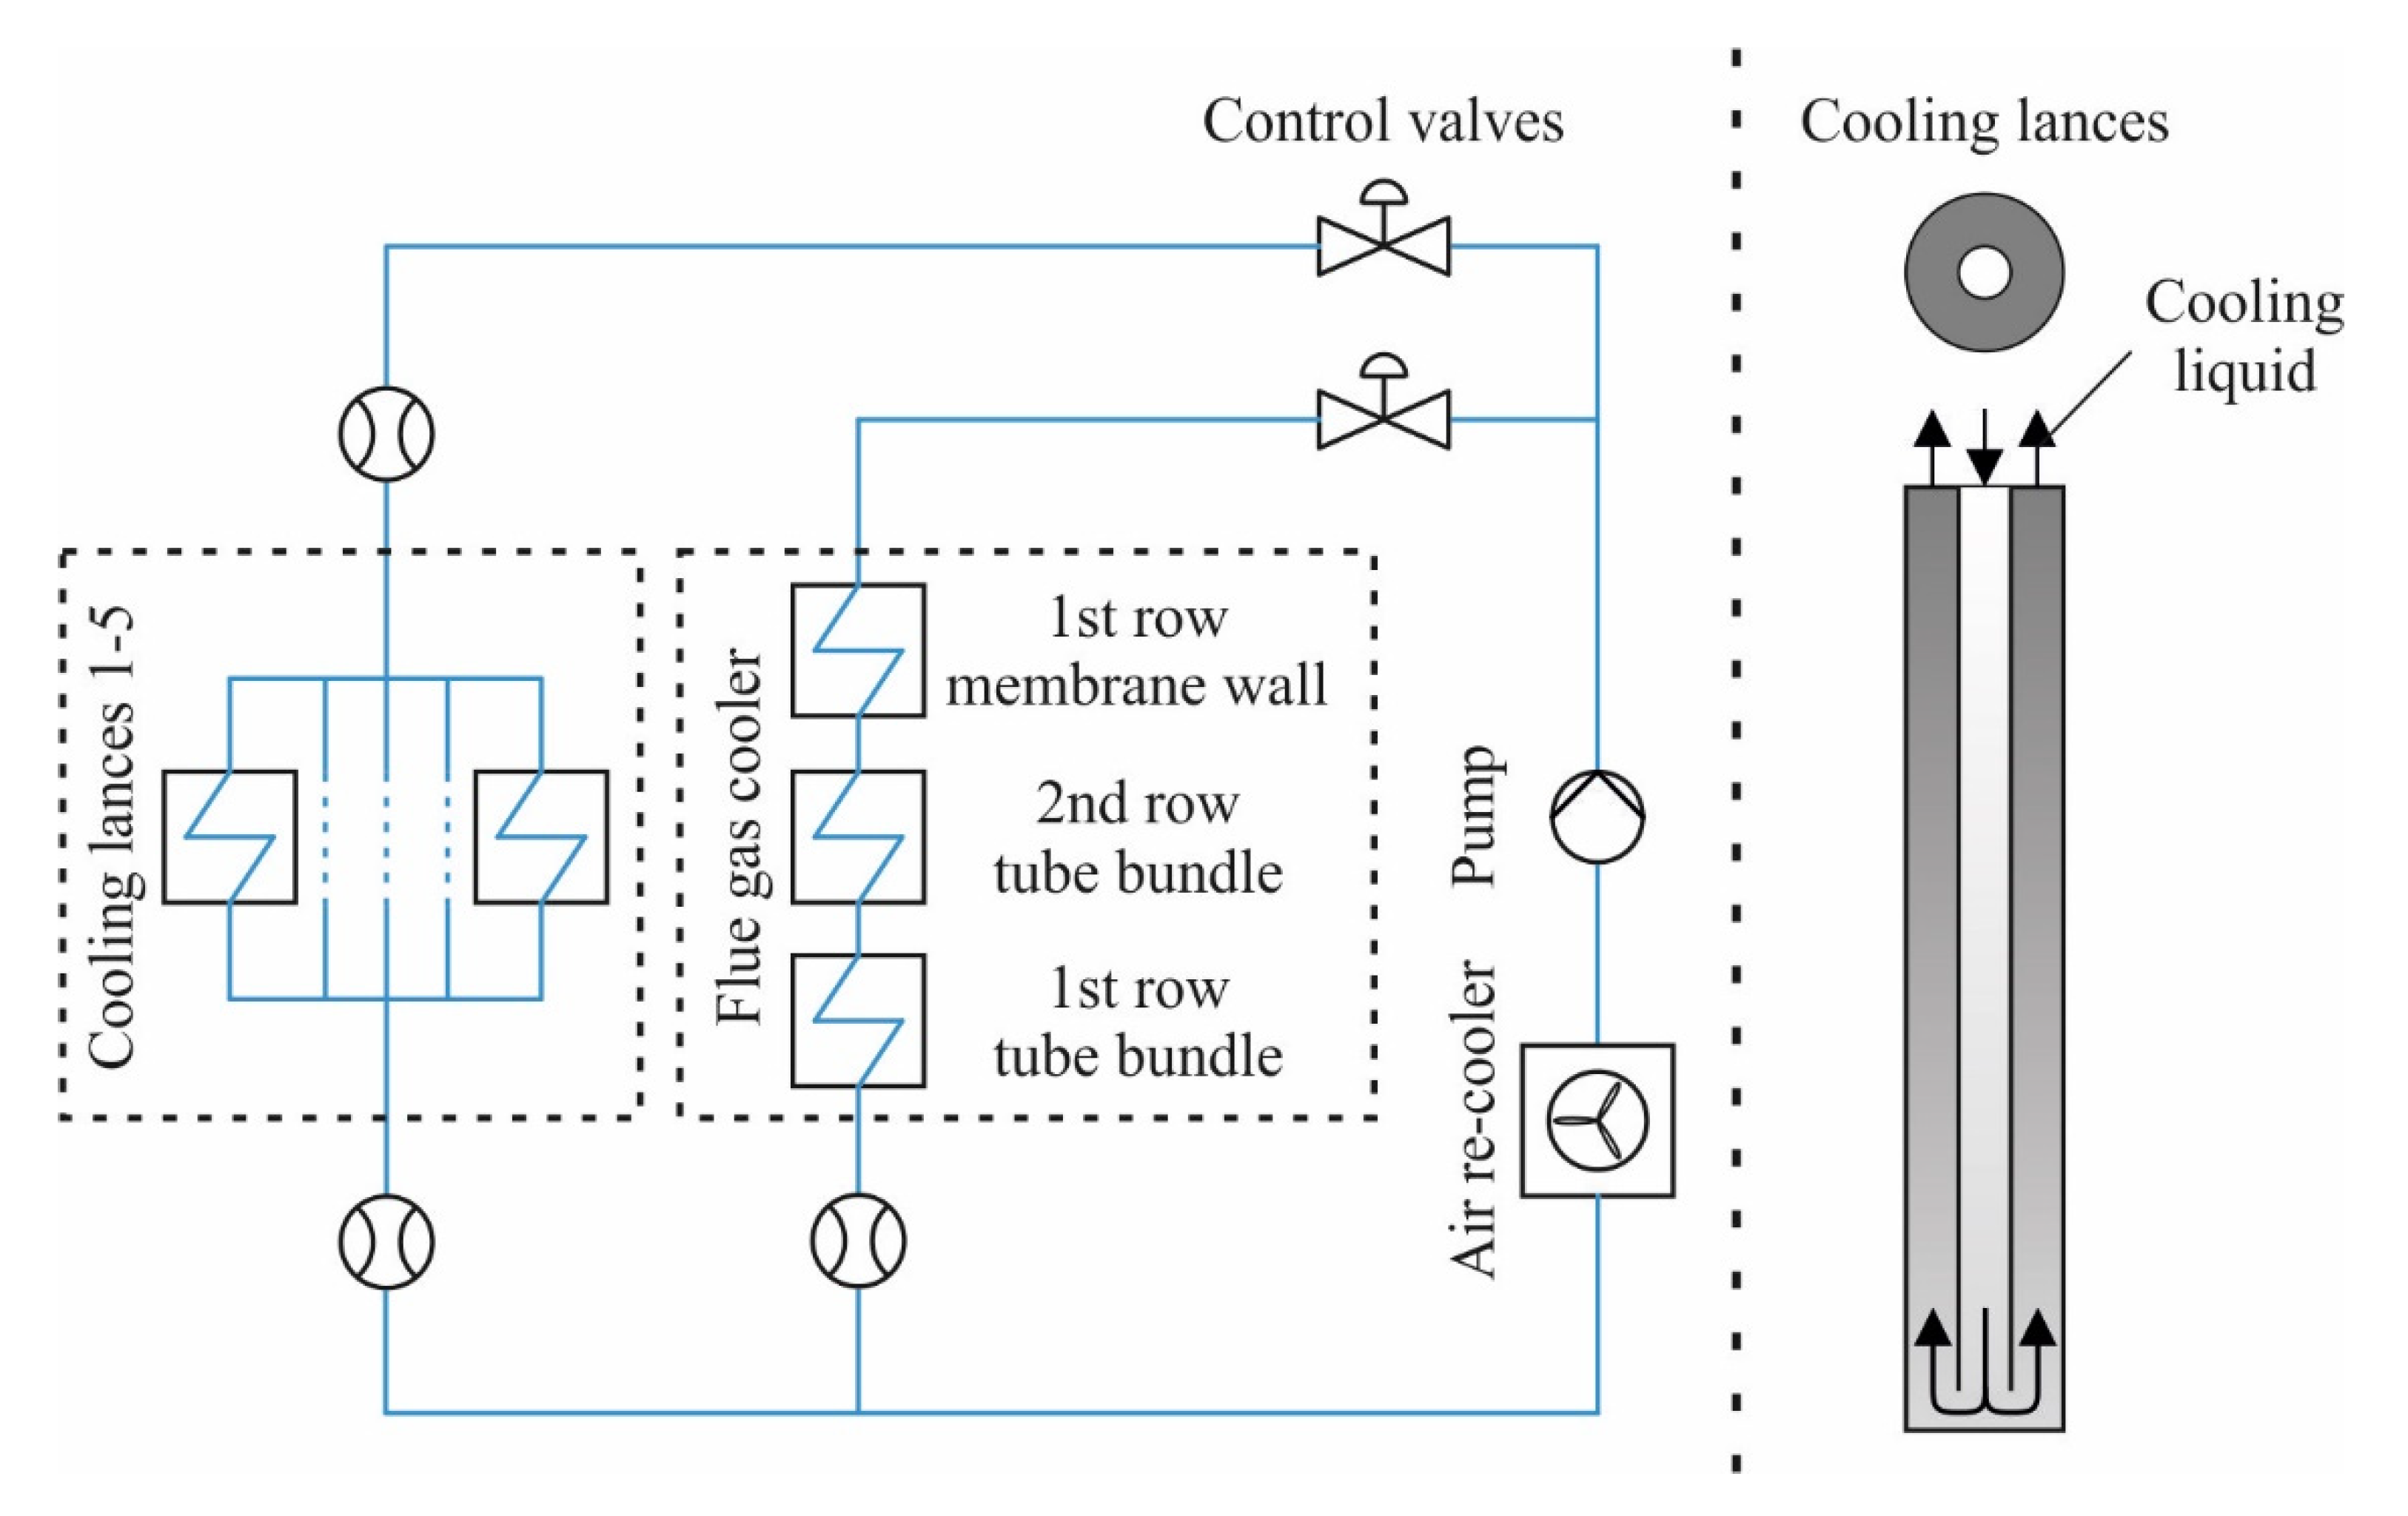
A simplified flow diagram of the cold side of the cooling system is shown in Figure 2 on the left. The total mass flow of cooling liquid through the cooling system is provided by a speed-controlled pump. Control valves distribute the cooling liquid to the heat exchanger sub-systems with pre-defined setpoints for the mass flow rates. The sub-systems that are important for CFB combustion, “cooling lances” and “flue gas cooler” are shown in the flow diagram. The cooling lances can be immersed into the reactor individually up to a depth of 8 m. The mass flow rate through all cooling lances is measured before and after the lances with orifice plates. The lances inlet temperature, the individual outlet temperature of each lance, and the outlet temperature of the combined flow are measured with resistance temperature detectors (RTDs) to determine the enthalpy increase of the cooling liquid. The cooling lances are designed with a double-tube design. The cold liquid flows through an inner tube from top to bottom and flows back up through the outer tube, which is in contact with the gas side. The principal design is shown in Figure 2, right-hand side. The dimensions of the cooling lances are shown in Table 2. The cold side of the flue gas cooler is divided into three sections, the membrane wall and tube bundle heat exchanger of the first row and the tube bundle heat exchanger of the second row. The inlet temperature, the temperatures between the three sections, and the outlet temperature are measured with RTDs. The mass flow rate is measured with an orifice plate at the outlet of the heat exchanger. After leaving the cooling lances and the flue gas cooler, the hot cooling liquid is cooled to a defined temperature of 110 °C with an air re-cooling unit to ensure a constant temperature at the pump. The cooling liquid is a mixture of water and the commercially available antifreeze agent Antifrogen L, which reduces the freezing point to –19 °C. Important properties of the cooling liquid are shown in Table 3.
2.2. Materials
Three different low-rank fuels were combusted: non-dried crushed lignite, straw pellets, and RDF fluff. In total, 46 tons of solid fuels were used. Due to the high amount of fuel, the fuel is provided in total in 108 big bags. Fuel samples of Lignite and RDF are collected from every big bag during the tests. These samples are combined to one sample and then analyzed to gain representative fuel compositions for the whole test. The straw sample is taken from one big bag. Table 4 presents the lower heating value, the proximate, and the ultimate analyses of the fuels. Additionally, characteristic particle sizes and temperatures to assess the ash melting behavior are shown. The lignite originates from Western Germany. The moisture content of around 51 wt% is in a typical range for non-dried low-rank lignite. The fuel is crushed before the tests to a particle size of <40 mm to meet the requirements of the pilot plant. The straw originates from different kinds of cereals (e.g., barley, wheat, rye, and oats) and it is harvested in the countryside of North-Western Germany. The straw pellets are not pre-dried or torrefied and during the production process, no other substances were added. The high volatile content is typical for fast-growing biogenic fuels [50]. The RDF fluff has a high moisture content. The volatile content is even higher than it is for the straw pellets. The bulk density of the RDF is only 190 kg/m3 and most of the particles are flat (e.g., foils, paper, textiles). The large surface area and low weight make them easy to fluidize.
Manual sorting of a sample of the RDF shows the large variety of materials inside the RDF fluff, see Table 5. The manual sorting is done with a sample from another batch of the fuel from the same supplier before the tests. Therefore, it may differ from the tested RDF, but it illustrates the large variety of different materials inside the fuel. Sand is dosed during some of the tests. The properties of the sand are shown in Table 6.
2.3. Evaluation
In this section, selected parameters are presented, that are relevant for the assessment of the experimental data. The thermal load during co-combustion of multiple fuels is calculated by summation of the thermal load of all fuels, based on the lower heating value of the fuels , see Equation (1). The load share of each fuel is calculated according to Equation (2). It is defined by dividing the specific load of each fuel by the total thermal load. The share of a fuel is, therefore, based on its lower heating value.
The flue gas flow rate is a key parameter to quantify the gas velocity in the reactor. The gas velocity is highly relevant, as it determines the hydrodynamic conditions in circulating fluidized beds [13,14]. The flue gas flow rate is measured with a venture measurement device, based on the principle of differential pressure over a venture nozzle. This measurement system is only accurate when no solids are present in the gas. The varying fly ash load in the flue gas distorts the measurement of the flue gas flow rate. Therefore, the flue gas flow rate needs to be calculated by balance equations (i.e., mass balance, elemental balances). Nitrogen accounts for the main share of flue gas and combustion air and is, therefore, particularly suitable for the calculation of the flue gas flow rate. When neglecting trace gases such as nitrogen oxides, the flue gas flow rate mainly depends on the combustion air mass flow, see Equation (3). The influence of the nitrogen content in the fuel is small compared to the nitrogen from combustion air, which makes variations in the fuel composition less important.
The heat transfer from gas and ash particles to the cooling system in circulating fluidized bed combustion depends on different mechanisms. Convective heat transfer from gas to heat exchanger surface (gas convection) and convective heat transfer by particle movement and contact to the heat exchanger surfaces (particle convection) are the dominant mechanisms. The heat transfer coefficient and the dominance of one of these mechanisms are mainly dependent on the gas velocity, the gas composition, and the particle properties (size and density) [15,51]. Potential deviations in heat transfer during co-combustion may be caused by changing ash properties. The heat transfer in the tests is calculated with the enthalpy increase at the waterside. The cooling system is operated only with a cooling fluid in liquid state (no vaporization) at a constant pressure. The inlet and outlet temperatures of the heat exchangers are in a temperature range, where the density and the heat capacity of the cooling liquid do not change significantly. Therefore, they are assumed to be constant. The flow rate of cooling liquid is fixed during all experiments to reduce the influence of changing conditions at the waterside on the heat transfer. The heat transfer to the heat exchanger can be calculated with Equation (5) with these assumptions.
In this study, the hydrodynamic conditions are assessed by investigating the entrainment. In circulating fluidized beds, the major portion of the particles is located in the lower area of the reactor, called bed zone or dense phase. Above the bed, the void fraction between particles increases significantly. This area is called freeboard or lean phase. In fluidized beds, the pressure difference along a certain length in the riser is directly related to the mass of particles in this volume. Therefore, the normalized pressure-drop in the freeboard is a measurement for the mass of particles in the lean phase. The pressure-drop in the freeboard of the pilot plant is divided by the total pressure-drop over the riser in Equation (6). This coefficient will be called “entrainment coefficient” , as it is a suitable indicator for the entrainment. It is defined here, that the freeboard starts at a height of 1.1 m.
The temperature profile inside the CFB depends on the design of the boiler, the operating parameters, and the hydrodynamic conditions. Major temperature differences are not expected to be found inside the bed zone of a CFB. The large fraction of well-mixed inert particles homogenizes the temperature in this area. Above the bed, however, two mechanisms mainly influence the temperature profile. Combustion reactions (e.g., between fuel and secondary air) increase the temperature, while heat transfer to the cooling system or heat losses to the refractory wall reduces the temperature. The temperature difference between the bed and the top of the riser is a suitable parameter to assess whether either the combustion reactions or the heat transfer/heat losses are dominant. It is calculated by Equation (7).
The combustion efficiency is defined as the ratio of heat released by the fuel to the heat input by the fuel. It describes how much of the combustible components of the fuel have been converted and can be determined by considering the unburned carbon in the ash (bottom ash and fly ash) and the unburned components of the flue gas, see Equation (8).
2.4. Experimental Procedure
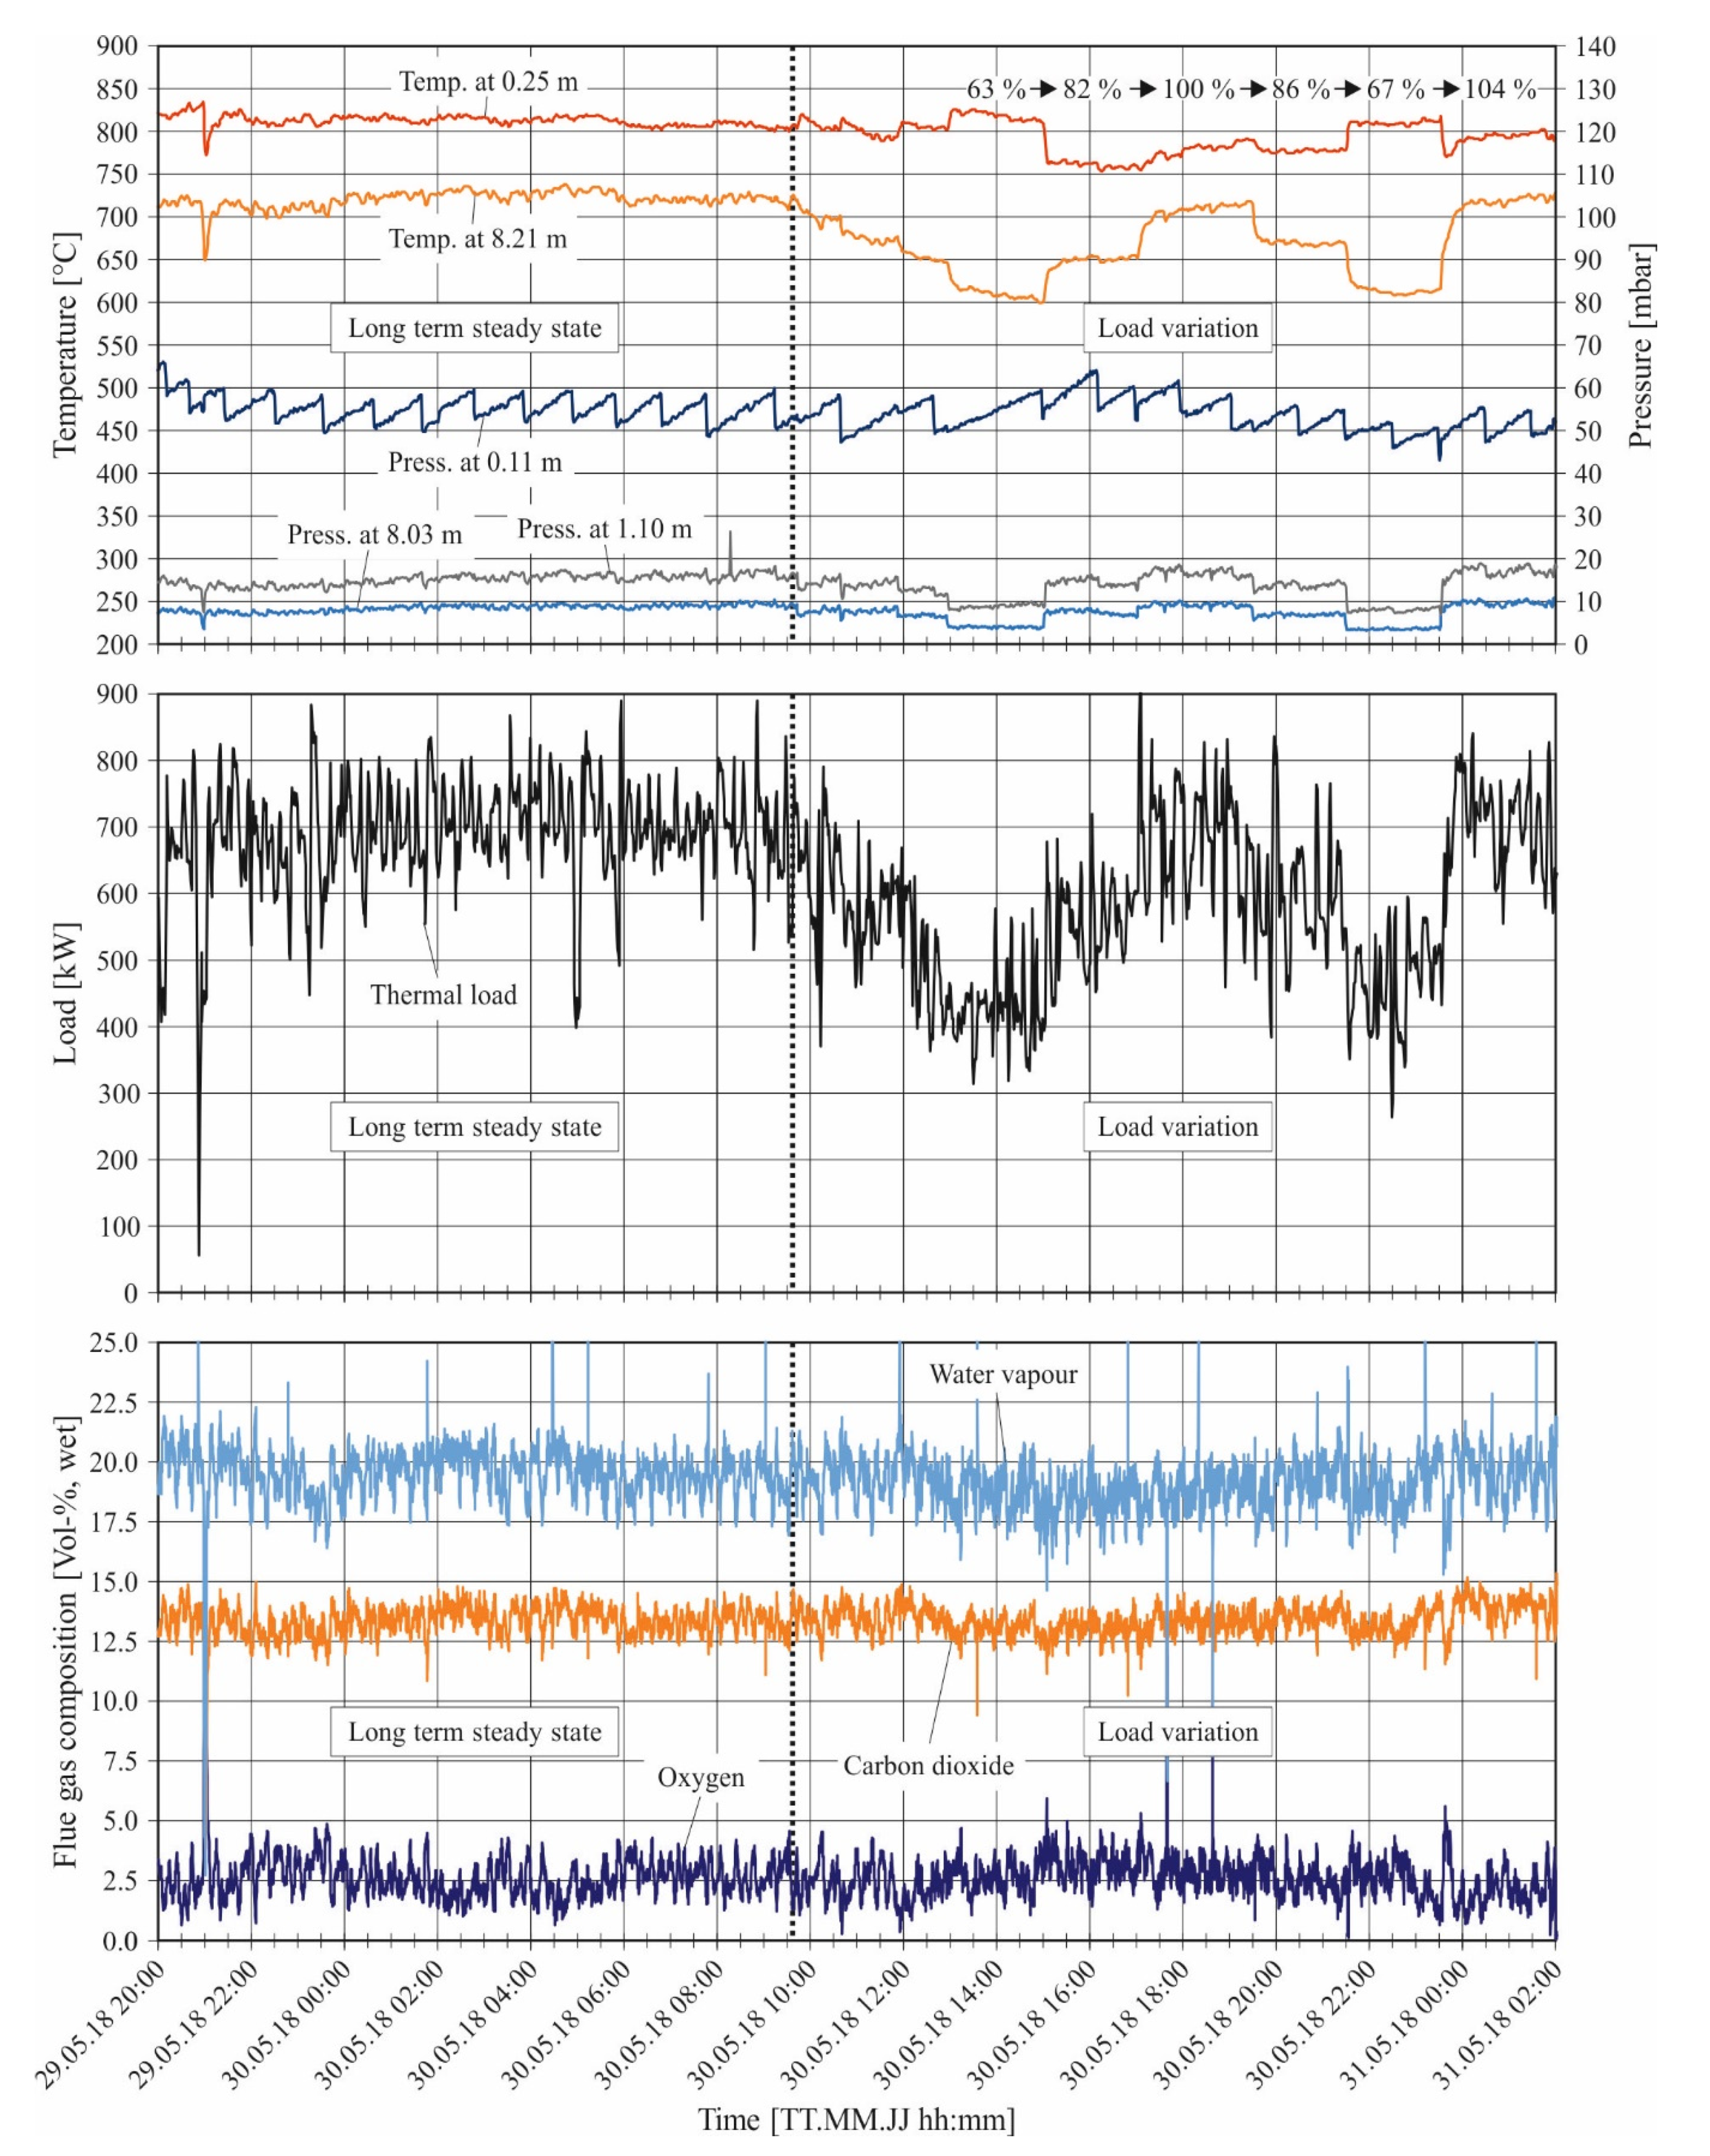
Co-combustion tests in a 1 MWth CFB combustion pilot plant were carried out. Low-rank German lignite is combusted as a reference case for co-combustion. As co-fuels, straw pellets, and a low calorific RDF were selected. Lignite and straw pellets were co-combusted with a load share of 7–23% of straw. Lignite and RDF were co-combusted with load shares of 16-28% of RDF. Long-term tests were carried out for several hours up to several days to see the long-term effects of the co-combustion. After the full load long-term tests, the load was reduced to around 60% load. The percentages shown here are based on the thermal load, while 100% load refers to the load that was present during the steady-state tests. After the long-term test, the load was increased stepwise to around 80 and 100%. Then, the load was reduced back to 80 and 60%, before the test series ended with a load increase from 60% to 100%. The procedure for the load changes is illustrated exemplarily for the straw tests in Figure 3. On the left side of the dotted line, the long-term steady-state test is presented, while the right-hand side of the dotted line shows the part load tests. The right-hand side of Figure 3 shows numbers from 63–104% load. This refers to the thermal load in these test points. For example, 104% means that the load is 4% higher than in the steady-state test point. The combustion air flow was adjusted at the beginning of each load change to match the targeted load changes (100% air flow at ~100% load, 80% at ~80% load, and 60% at ~60% load). The air flow rate was then kept constant until the next load change. However, the fuel mass flow was constantly subject to short-term fluctuations due to inhomogeneities in flowability, density, or particle size distribution of the fuel. Therefore, the fuel mass flow was adjusted to keep an oxygen excess in the flue gas of around 2–3 vol%wet in average. The bed pressure was kept in a range of 50–60 mbar by batch-wise extraction of bed material, as soon as the bed pressure reached ~60 mbar.
Regarding the dynamic tests, all tests were evaluated after a stabilization time after the load change. It needs to be mentioned, that steady-state conditions were not fully achieved for the part load tests. However, the significance of the results is not affected by this, as this study intends to show the impact of part load during co-combustion, which is possible without waiting for steady-state conditions. The tests were carried out for lignite combustion and for lignite and RDF co-combustion with a similar procedure. The results are discussed in detail in Section 3. Detailed boundary conditions of the test series are presented in Table A1 in Appendix A.
3. Results and Discussion
The hydrodynamic conditions during part load will be presented for varying loads and varying share of straw and RDF. Afterward, the heat transfer during co-combustion is discussed in detail, before the flue gas composition is evaluated. Table A2 in the Appendix A lists the main results of the test series.
3.1. Hydrodynamics during Co-Combustion
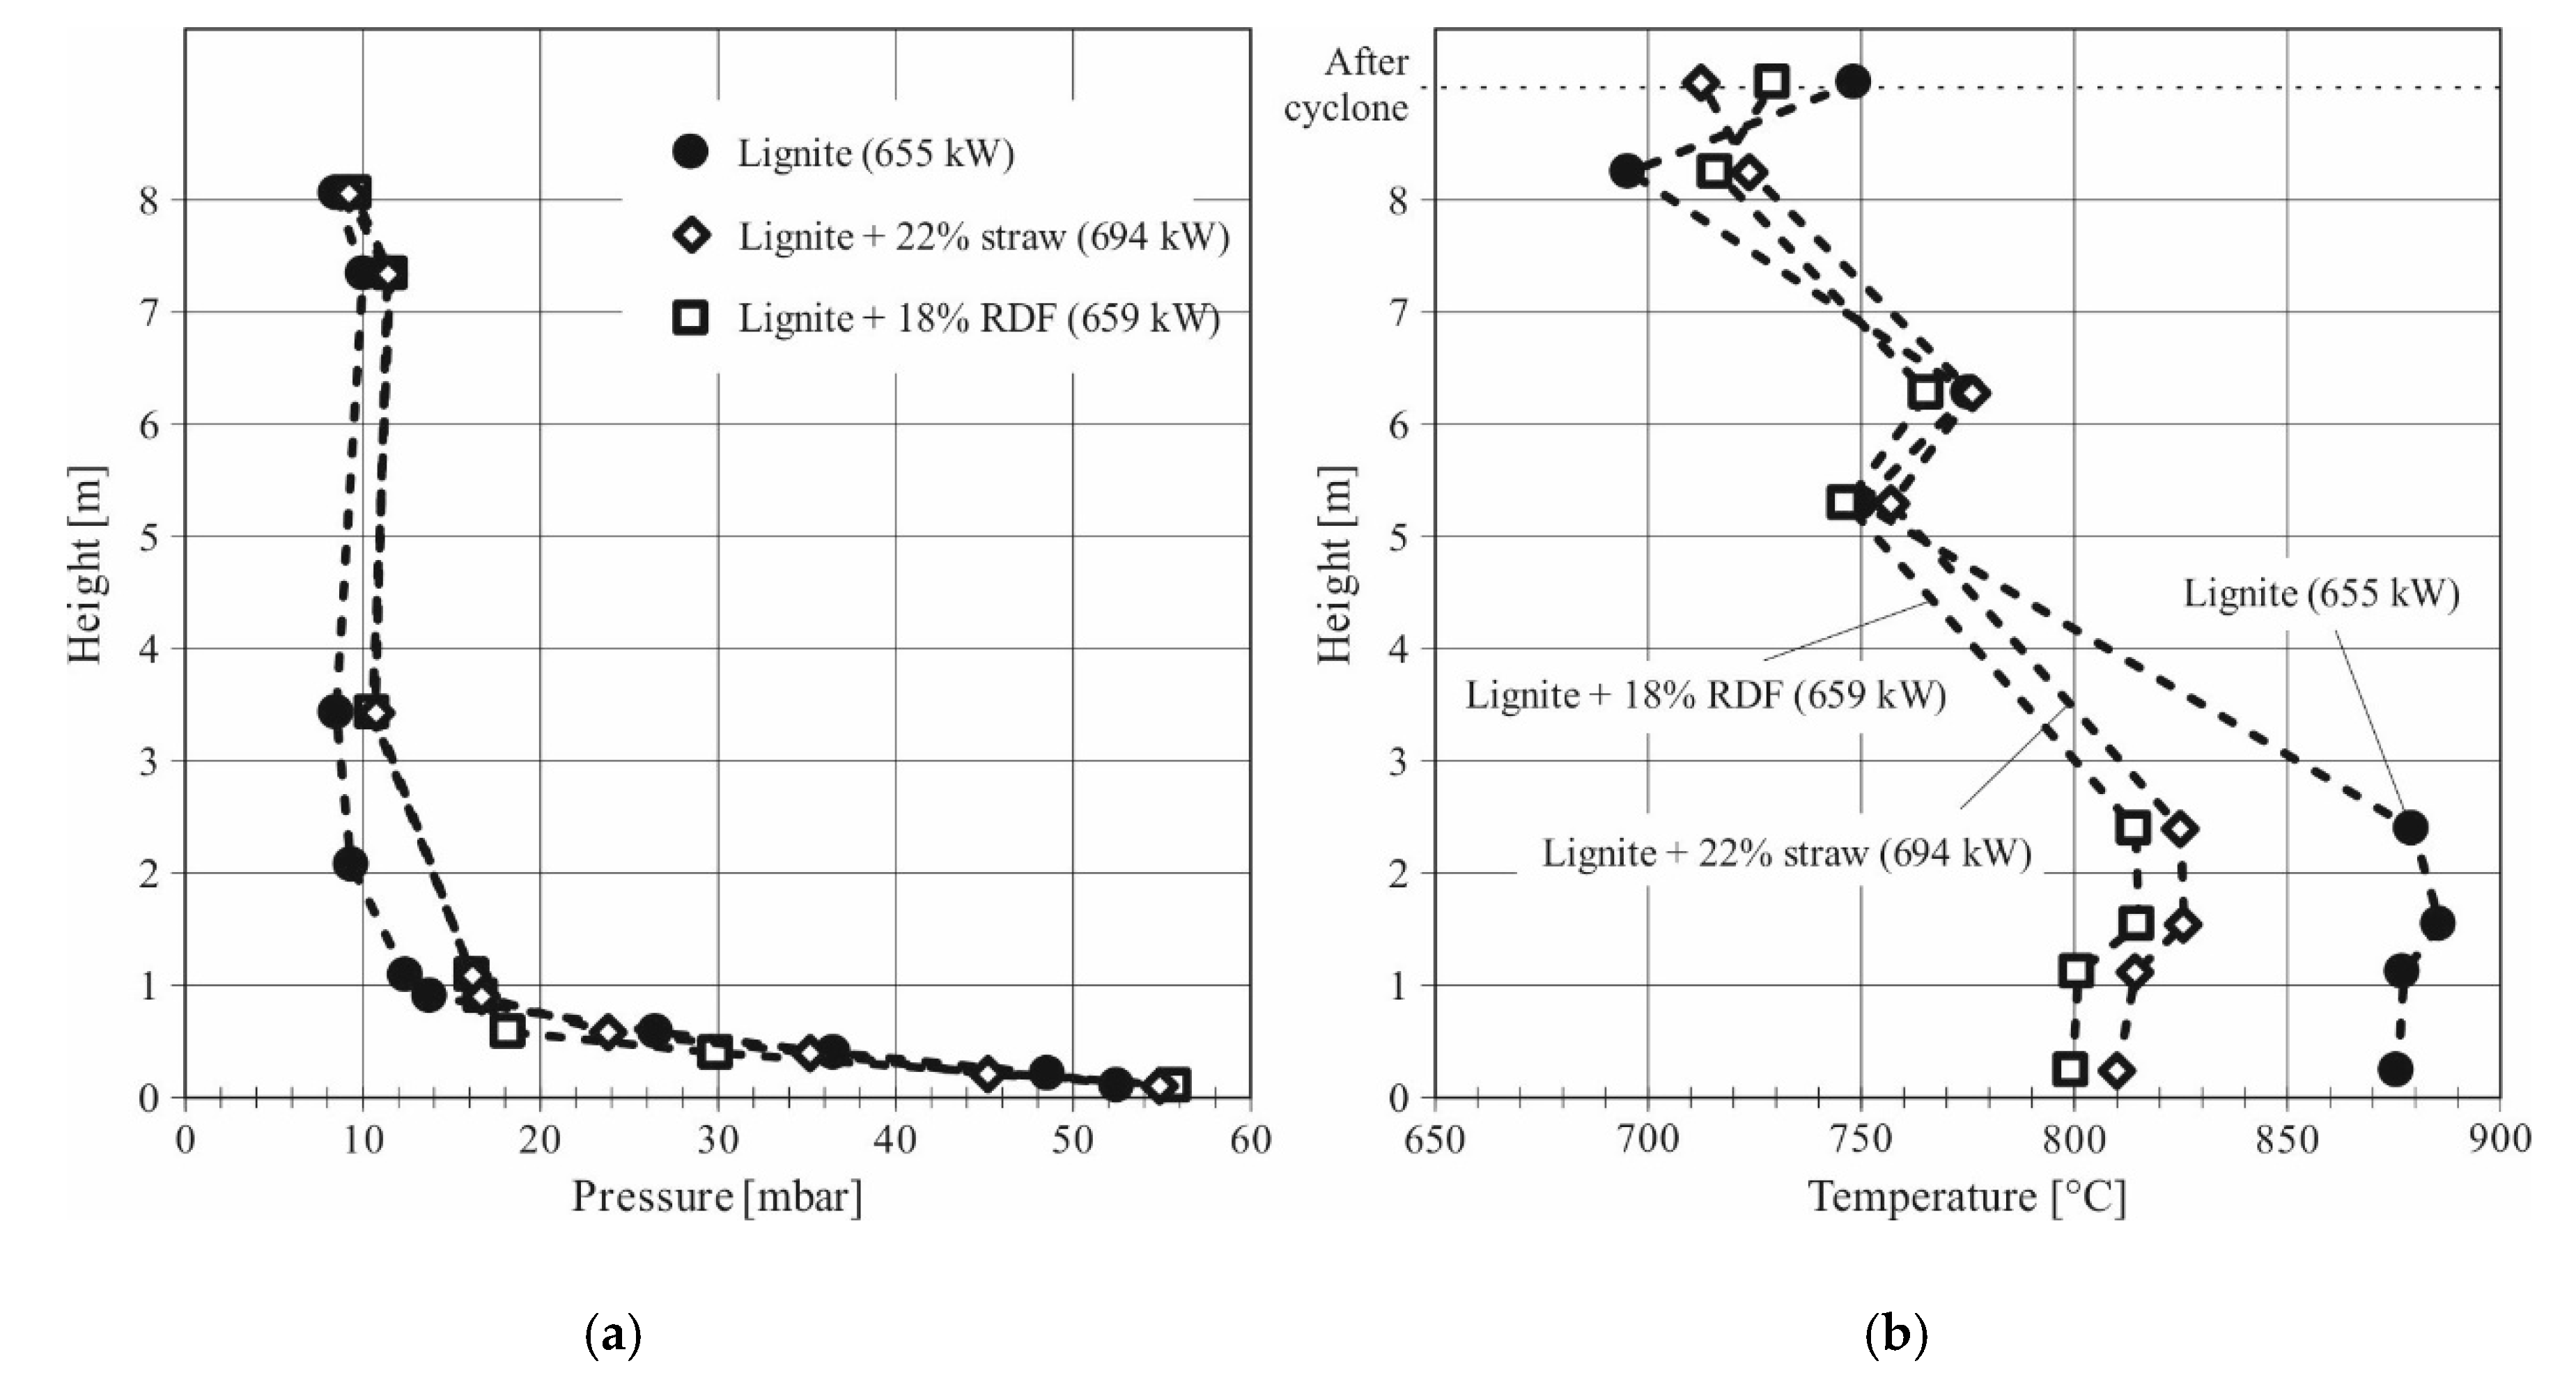
In this chapter, the hydrodynamics of the CFB combustion tests with lignite and the co-combustion tests are compared. The pressure and temperature profiles (pressure/temperature development over the reactor height) are shown for the three fuels/fuel mixtures in Figure 4. Tests with a similar load are selected for comparison of the fuel mixtures for better comparability. The pressure profiles have a typical shape for circulating fluidized beds. The pressure drop in the lower part is much higher than the pressure drop in the freeboard indicating a high solids concentration in the bed zone. The void fraction between the particles is much lower in the freeboard above 1.1 m, resulting in a decreasing pressure drop with the height. The pressure drop along the bed is very similar for all three fuel mixtures. However, the pressure drop in the freeboard is nearly reduced by the factor of 2 for the lignite test compared to co-combustion, which indicates a decreased entrainment during these tests. The entrainment is decreased due to the high average diameter of the bottom ash particles during the lignite tests, see Table 7. Agglomerates were found in the bottom ash during the lignite tests. Therefore, sand was fed during the co-combustion tests to extract potential agglomerates regularly. This measure shifts the particle sizes to a more suitable range for CFB combustion. As a result, the entrainment increases. The slope of the pressure drop increases again between 7.3 and 8.0 m for all tests, due to particles hitting the ceiling of the reactor, which decelerates them before they stream to the cyclone or fall downwards. This results in a solid fraction increase at the top and to an increased pressure drop.
The temperature profiles of the same tests are shown in Figure 4b. In the dense zone, the temperature is very uniform due to the strong mixing of particles and the high solid inventory. The temperature level in the bed is similar for the co-combustion tests but significantly higher for the lignite test. The temperatures slightly increase above 1.1 m due to the combustion reactions with the incoming burner air. The lower secondary air inlet is located at 2.7 m. However, above this height, the temperature decreases as the effect of the cooling lances compensate for the combustion reactions. A temperature increase is observed between 5.3 and 6.3 m due to the secondary air injection at 6.0 m and the resulting combustion reactions. Above this height, the temperature decreases again between 6.3 and 8.2 m, due to the cooling lances. Generally, the temperature difference between the bed and top is much higher in the lignite test compared to the tests with straw and RDF. Several factors affect the temperature profile in the riser. High entrainment of carbon particles shifts the combustion reactions to the freeboard, which potentially results in lower bed temperatures and higher freeboard temperatures. Additionally, entrained inert particles are cooled in the upper reactor by contact with the heat exchanger surface and the surrounding gas. These cool particles re-enter the bed, lowering the temperature there. Additionally, changing gas flow rates have a significant impact on the temperature profile. The residence time for cooling the flue gas decreases with higher velocities/loads. Therefore, the temperature-drop inside the reactor decreases. As another major factor, the high volatile content of RDF and straw promotes high temperatures in the upper part and lower temperatures in the dense bed. The volatile components are not retained in the bed like solid carbon, so the combustion reactions occur in the upper areas of the reactor. Additionally, other effects such as heat losses contribute to the temperature profile. However, as the load and the flue gas flow rates are similar, the great differences in the bed temperature and the temperature drop during the lignite tests seem to originate from low entrainment.
In addition to the temperatures in the riser, the temperature measurement of the flue gas after the cyclone is included in the temperature profile in Figure 4b. The temperature between reactor and cyclone increases strongly by more than 50 K during the lignite test. A temperature increase between the reactor and outlet of the cyclone indicates that the combustion of carbon and/or burnable gases is not completed at the top of the riser. Inside the cyclone, the tangential inflow and the high velocities provide an excellent mixing of oxygen and burnable gases, which results in post-combustion inside the cyclone, leading to a temperature increase. The fluidization and the mixing of particles and gas inside the bed decrease with increasing particle size. This results in less efficient combustion of carbon inside the riser. Agglomerate formation during the lignite tests might explain the high magnitude of post-combustion. However, the combustion efficiency is similar for the lignite test and the co-combustion test with lignite and straw, see Table 7. The post-combustion in the cyclone during the lignite tests seems to compensate well for the poor combustion efficiency in the riser. While the carbon content in the bottom ash and the fly ash are similar for the three fuel blends, the CO content is significantly higher for RDF, which is a known phenomenon due to its low density and high volatile content. This results in a lower combustion efficiency of 98.3%. In commercial scale, the CO content can be reduced by a higher excess air factor. For this study, the high CO content was accepted during the tests to ensure comparable conditions (similar air flow rates) between the fuel mixtures.
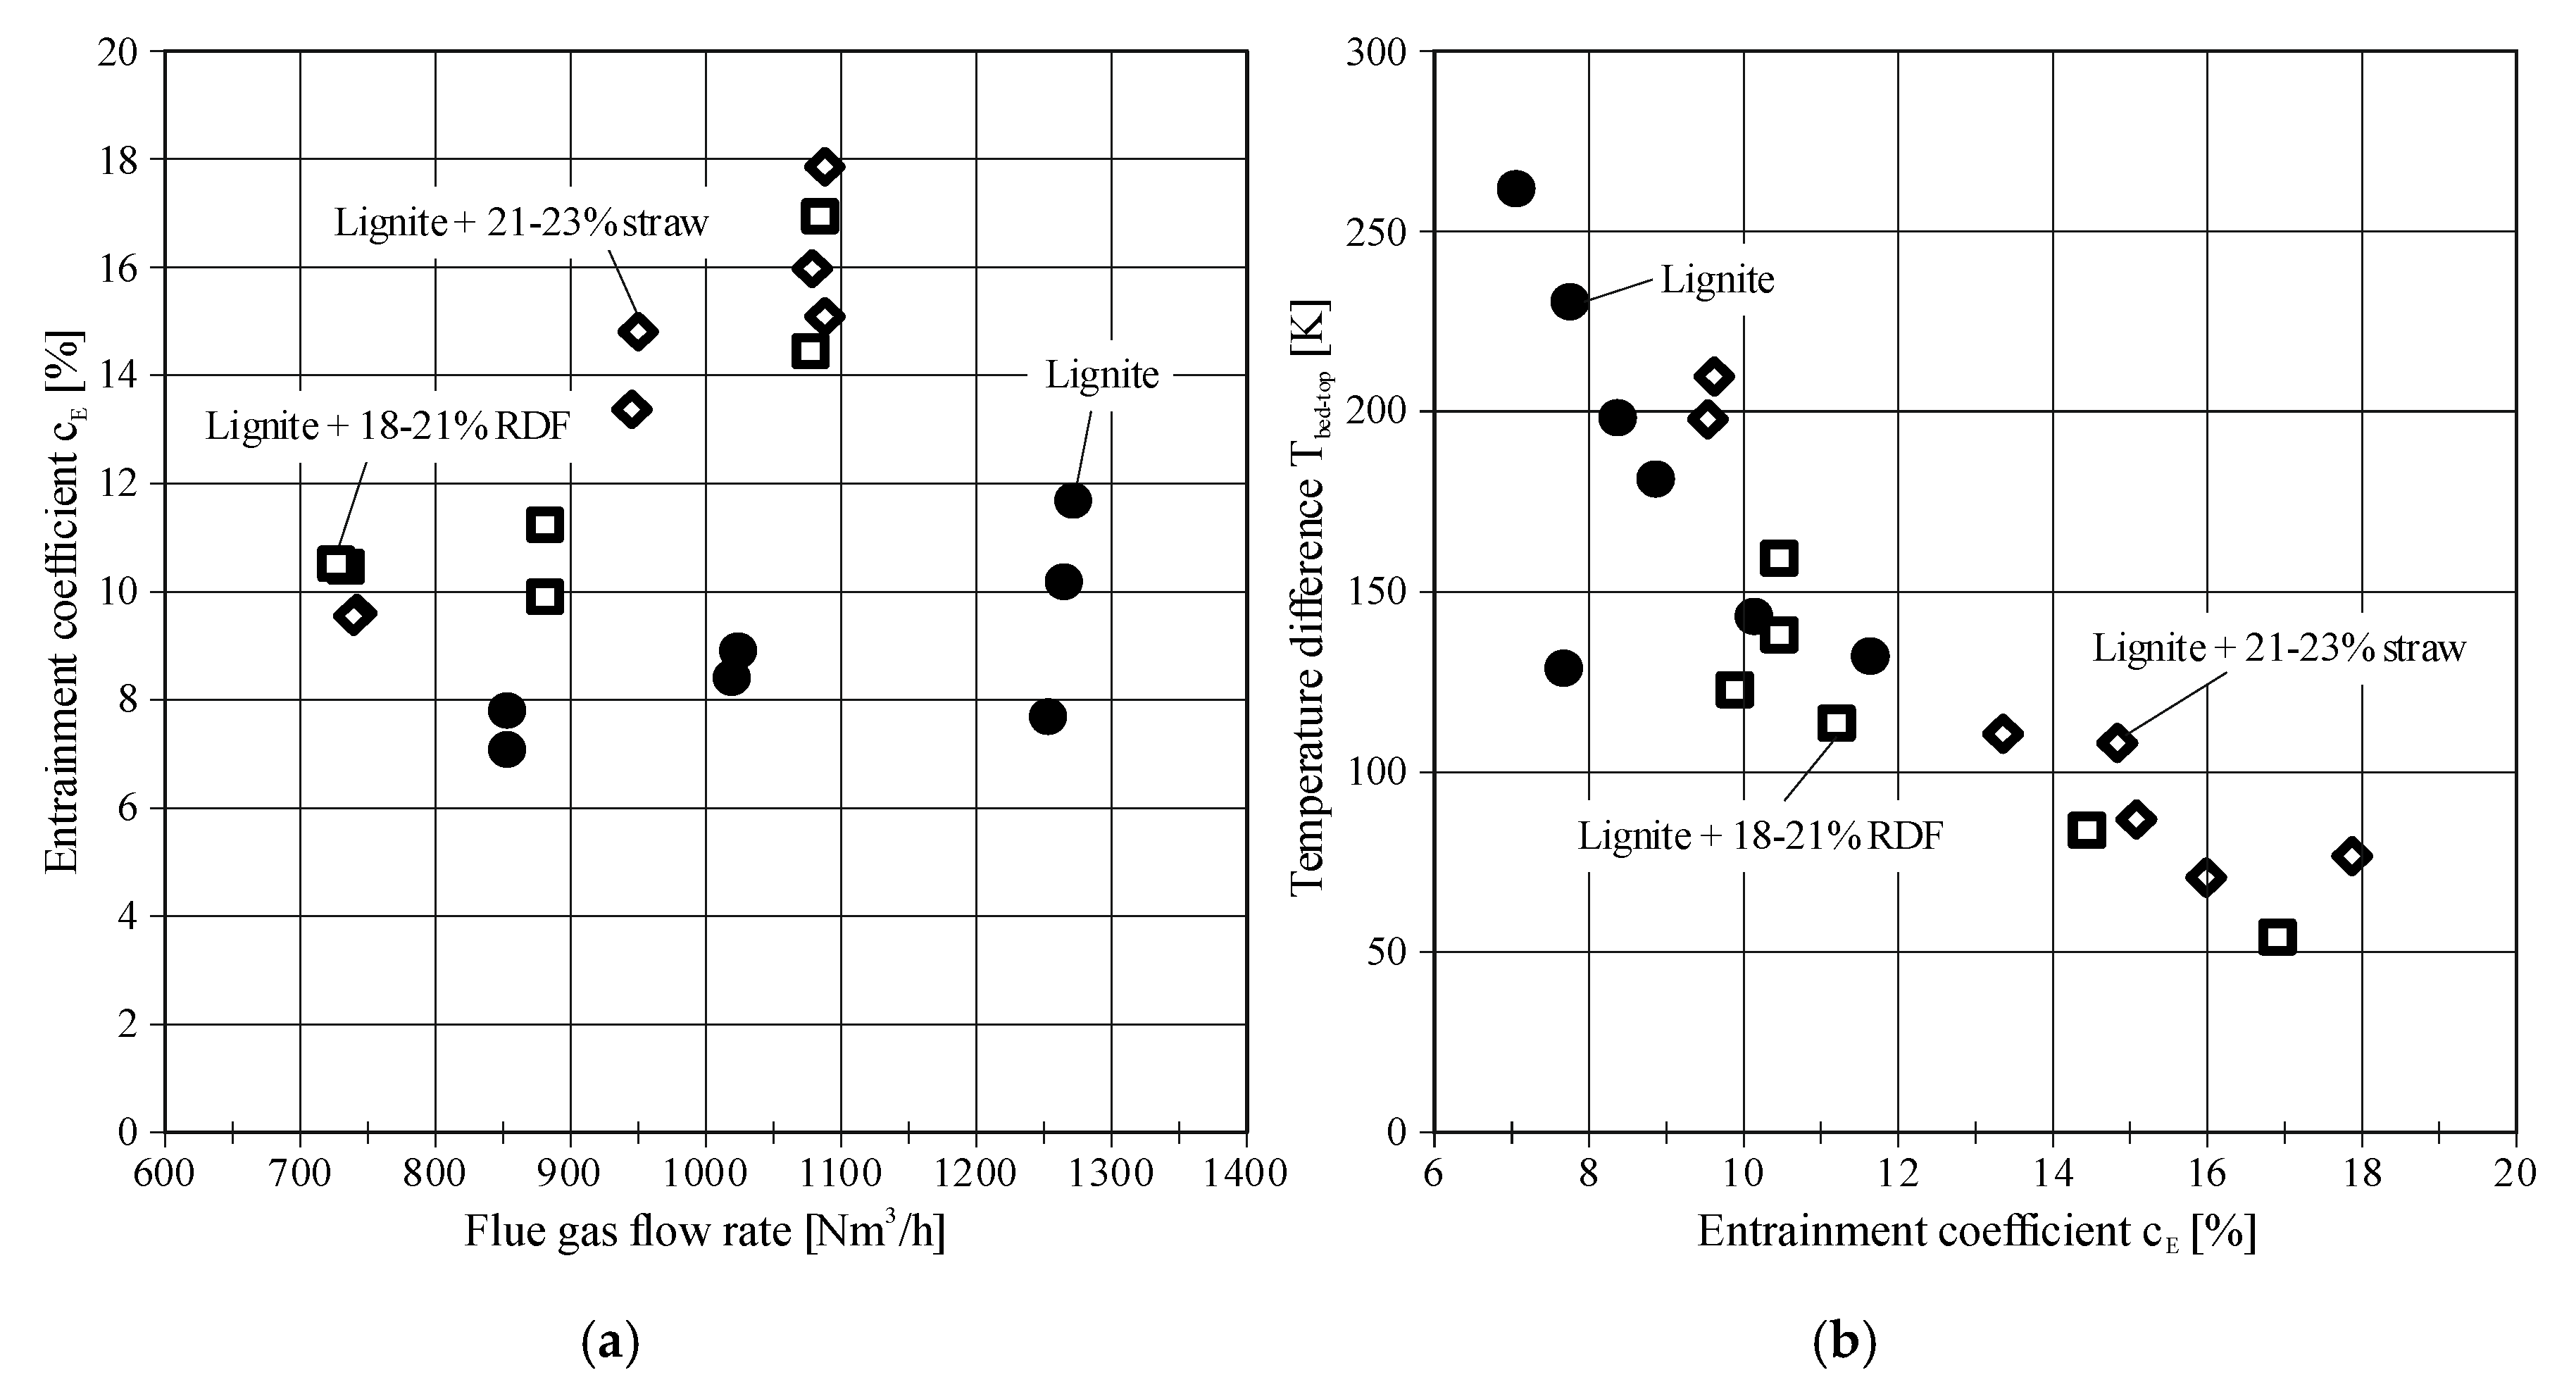
The pressure and temperature profiles indicate that the temperature difference between bed and top is mostly dependent on the entrainment of particles when the thermal load and flue gas flow rate are similar. This relation is confirmed with the results shown in Figure 5. In Figure 5a, the entrainment coefficient is plotted over the flue gas flow rate. The entrainment increases with increasing flue gas flow rate for all fuel mixtures. However, the entrainment is significantly lower during the lignite tests, which confirms the conclusions drawn from the pressure profiles (Figure 4a). The entrainment is in a similar magnitude for both co-combustion tests with straw and RDF. Besides the feeding of sand, the entrainment also increases with a higher content of fine ash particles. The ash content of RDF and straw is significantly higher than the ash content of lignite, see Table 4. Additionally, both co-fuels have a high content of volatile components, which increases the particle entrainment by a rapid gas release in the bed. However, it is conclusive that the entrainment can be significantly increased with sand feeding also during the CFB combustion of lignite.
The impact of the varying entrainment on the temperature-drop along the reactor is presented in Figure 5b. No direct relation between load (or flue gas flow rate) and the temperature difference could be found. Instead, the figure shows a direct relation between the entrainment coefficient and temperature difference between bed and top. Increasing entrainment reduces the temperature-drop. Low temperatures at the reactor top can have negative effects on the burn-out of char particles. Additionally, high temperatures in the dense zone can favor the formation of agglomerates. To prevent negative effects like these, suitable temperature control in the CFB furnace is of the highest importance for the process stability.
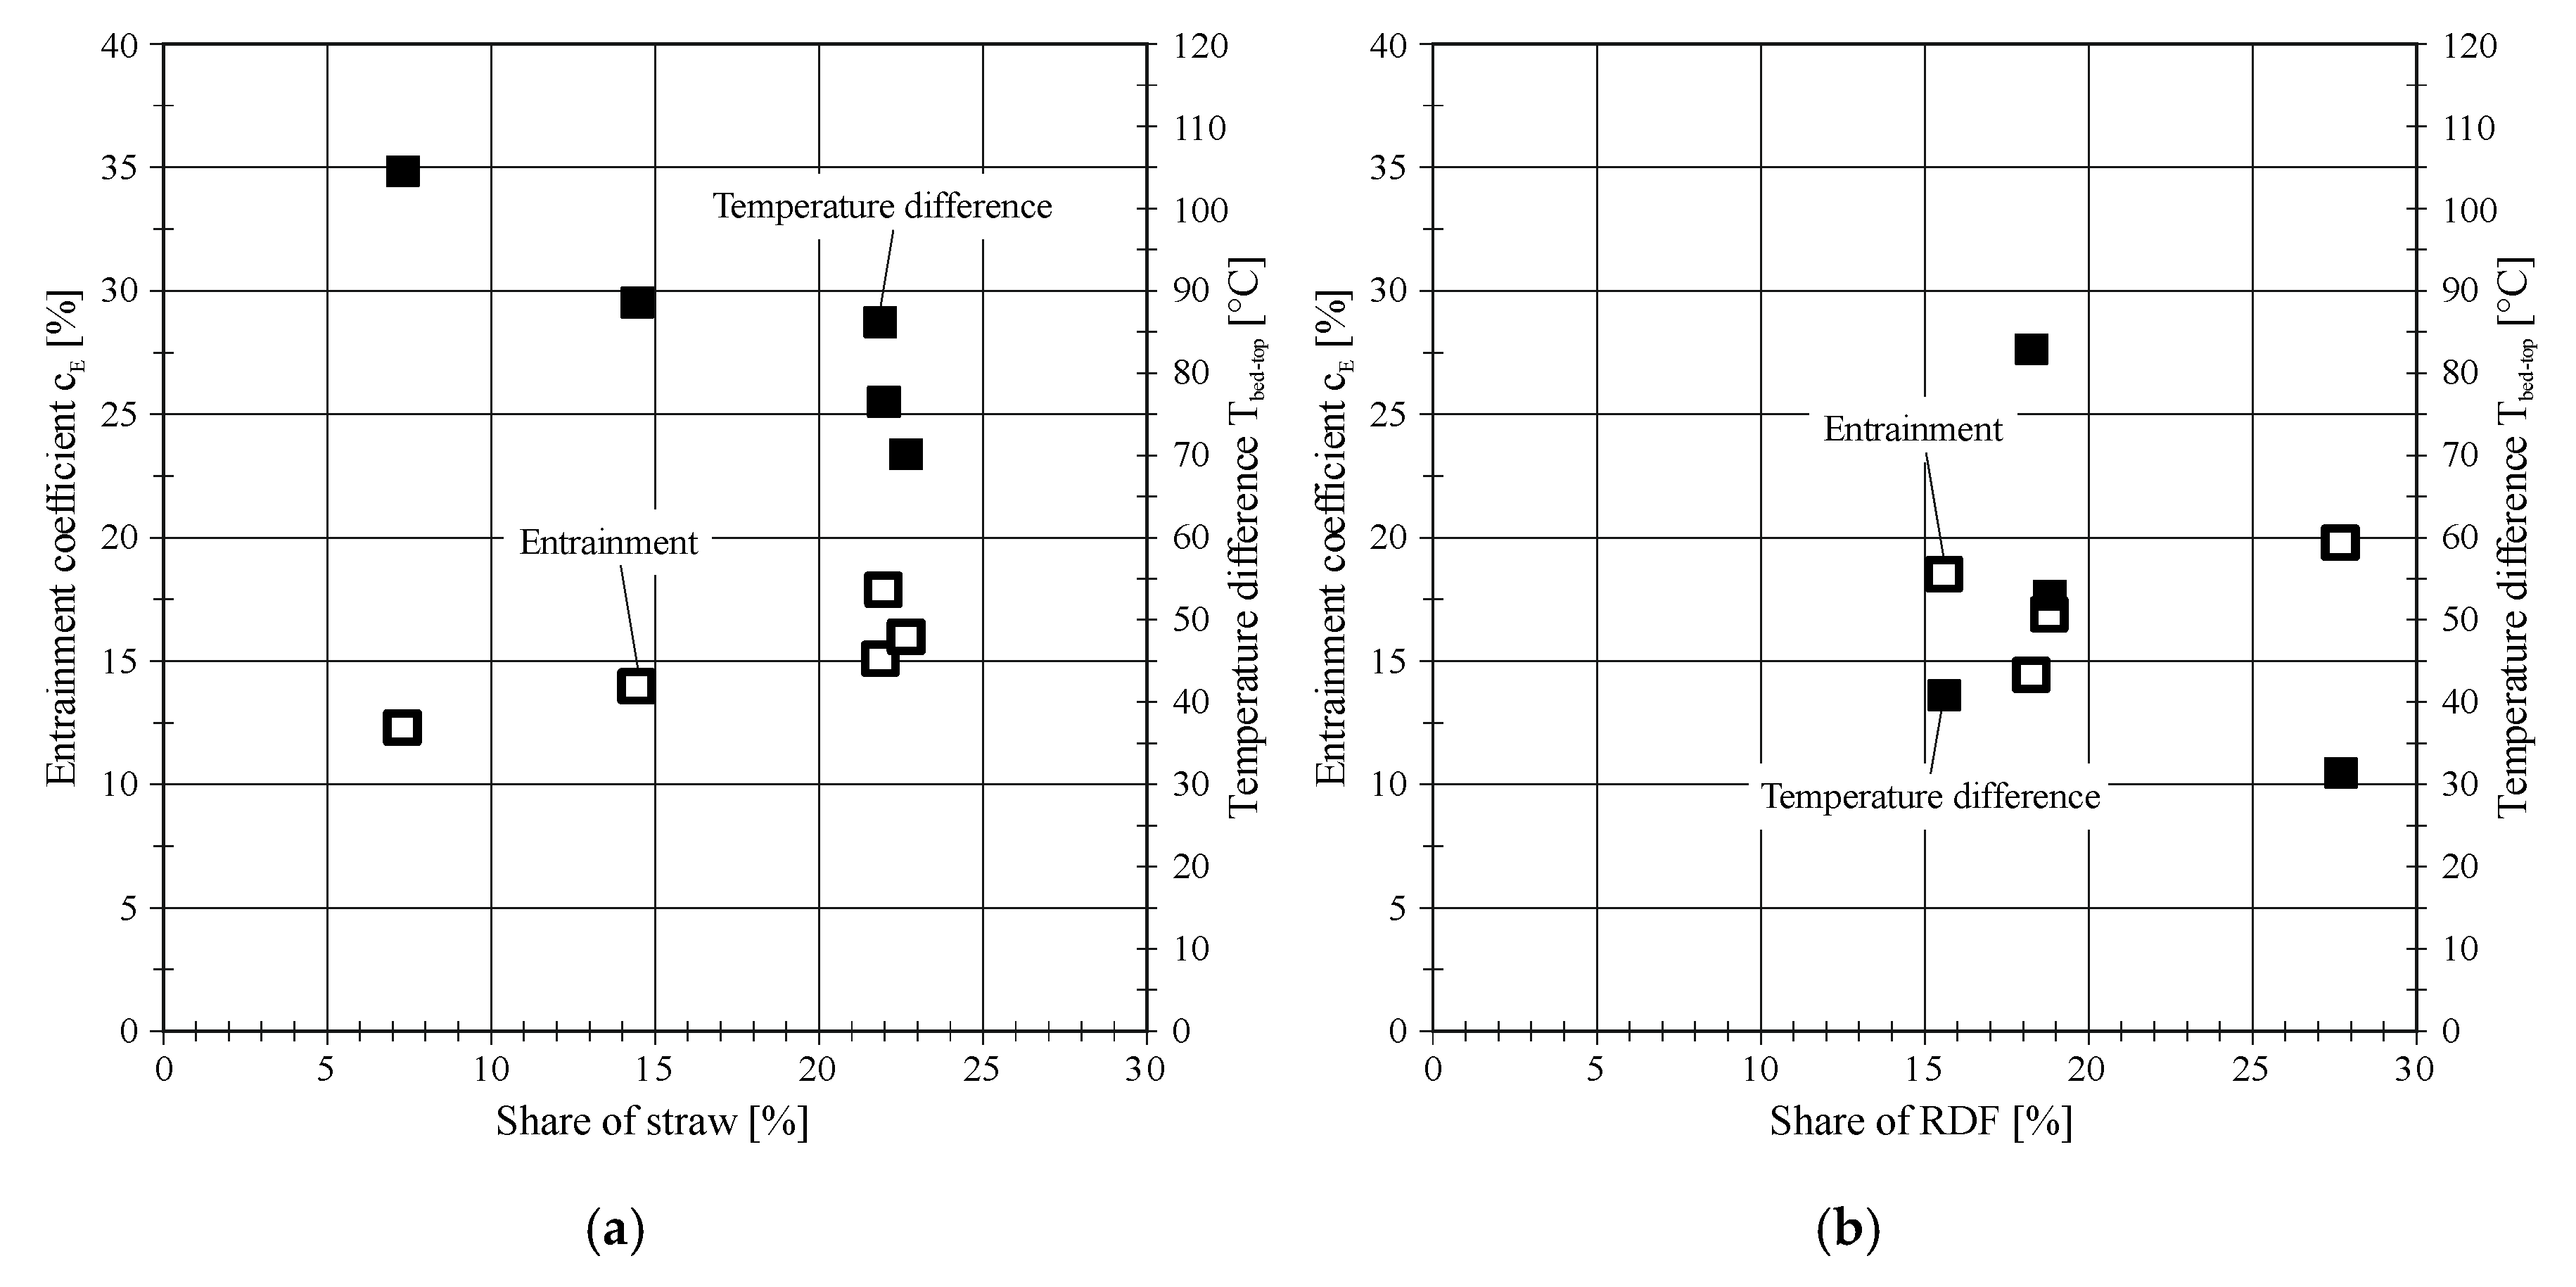
The influence of varying share of the co-fuel on the entrainment coefficient and the temperature difference between bed and top is presented in Figure 6. When the share of straw increases, the entrainment slightly increases. As discussed before, higher entrainment decreases the temperature drop along the reactor. The increasing entrainment is potentially due to the high volatile content of the straw pellets. The volatile gases are released in the bed zone of the riser and increase the gas velocity there.
A similar behavior could be expected for the RDF tests, but the results are not conclusive. At a lower load share of RDF (16–19%), high deviations are observed, which is possibly due to the varying properties of the RDF. At a higher load share, the entrainment slightly increases. However, no conclusive statement is possible here, as the difference is small compared to the deviations at low load share.
3.2. Heat Transfer during Co-Combustion
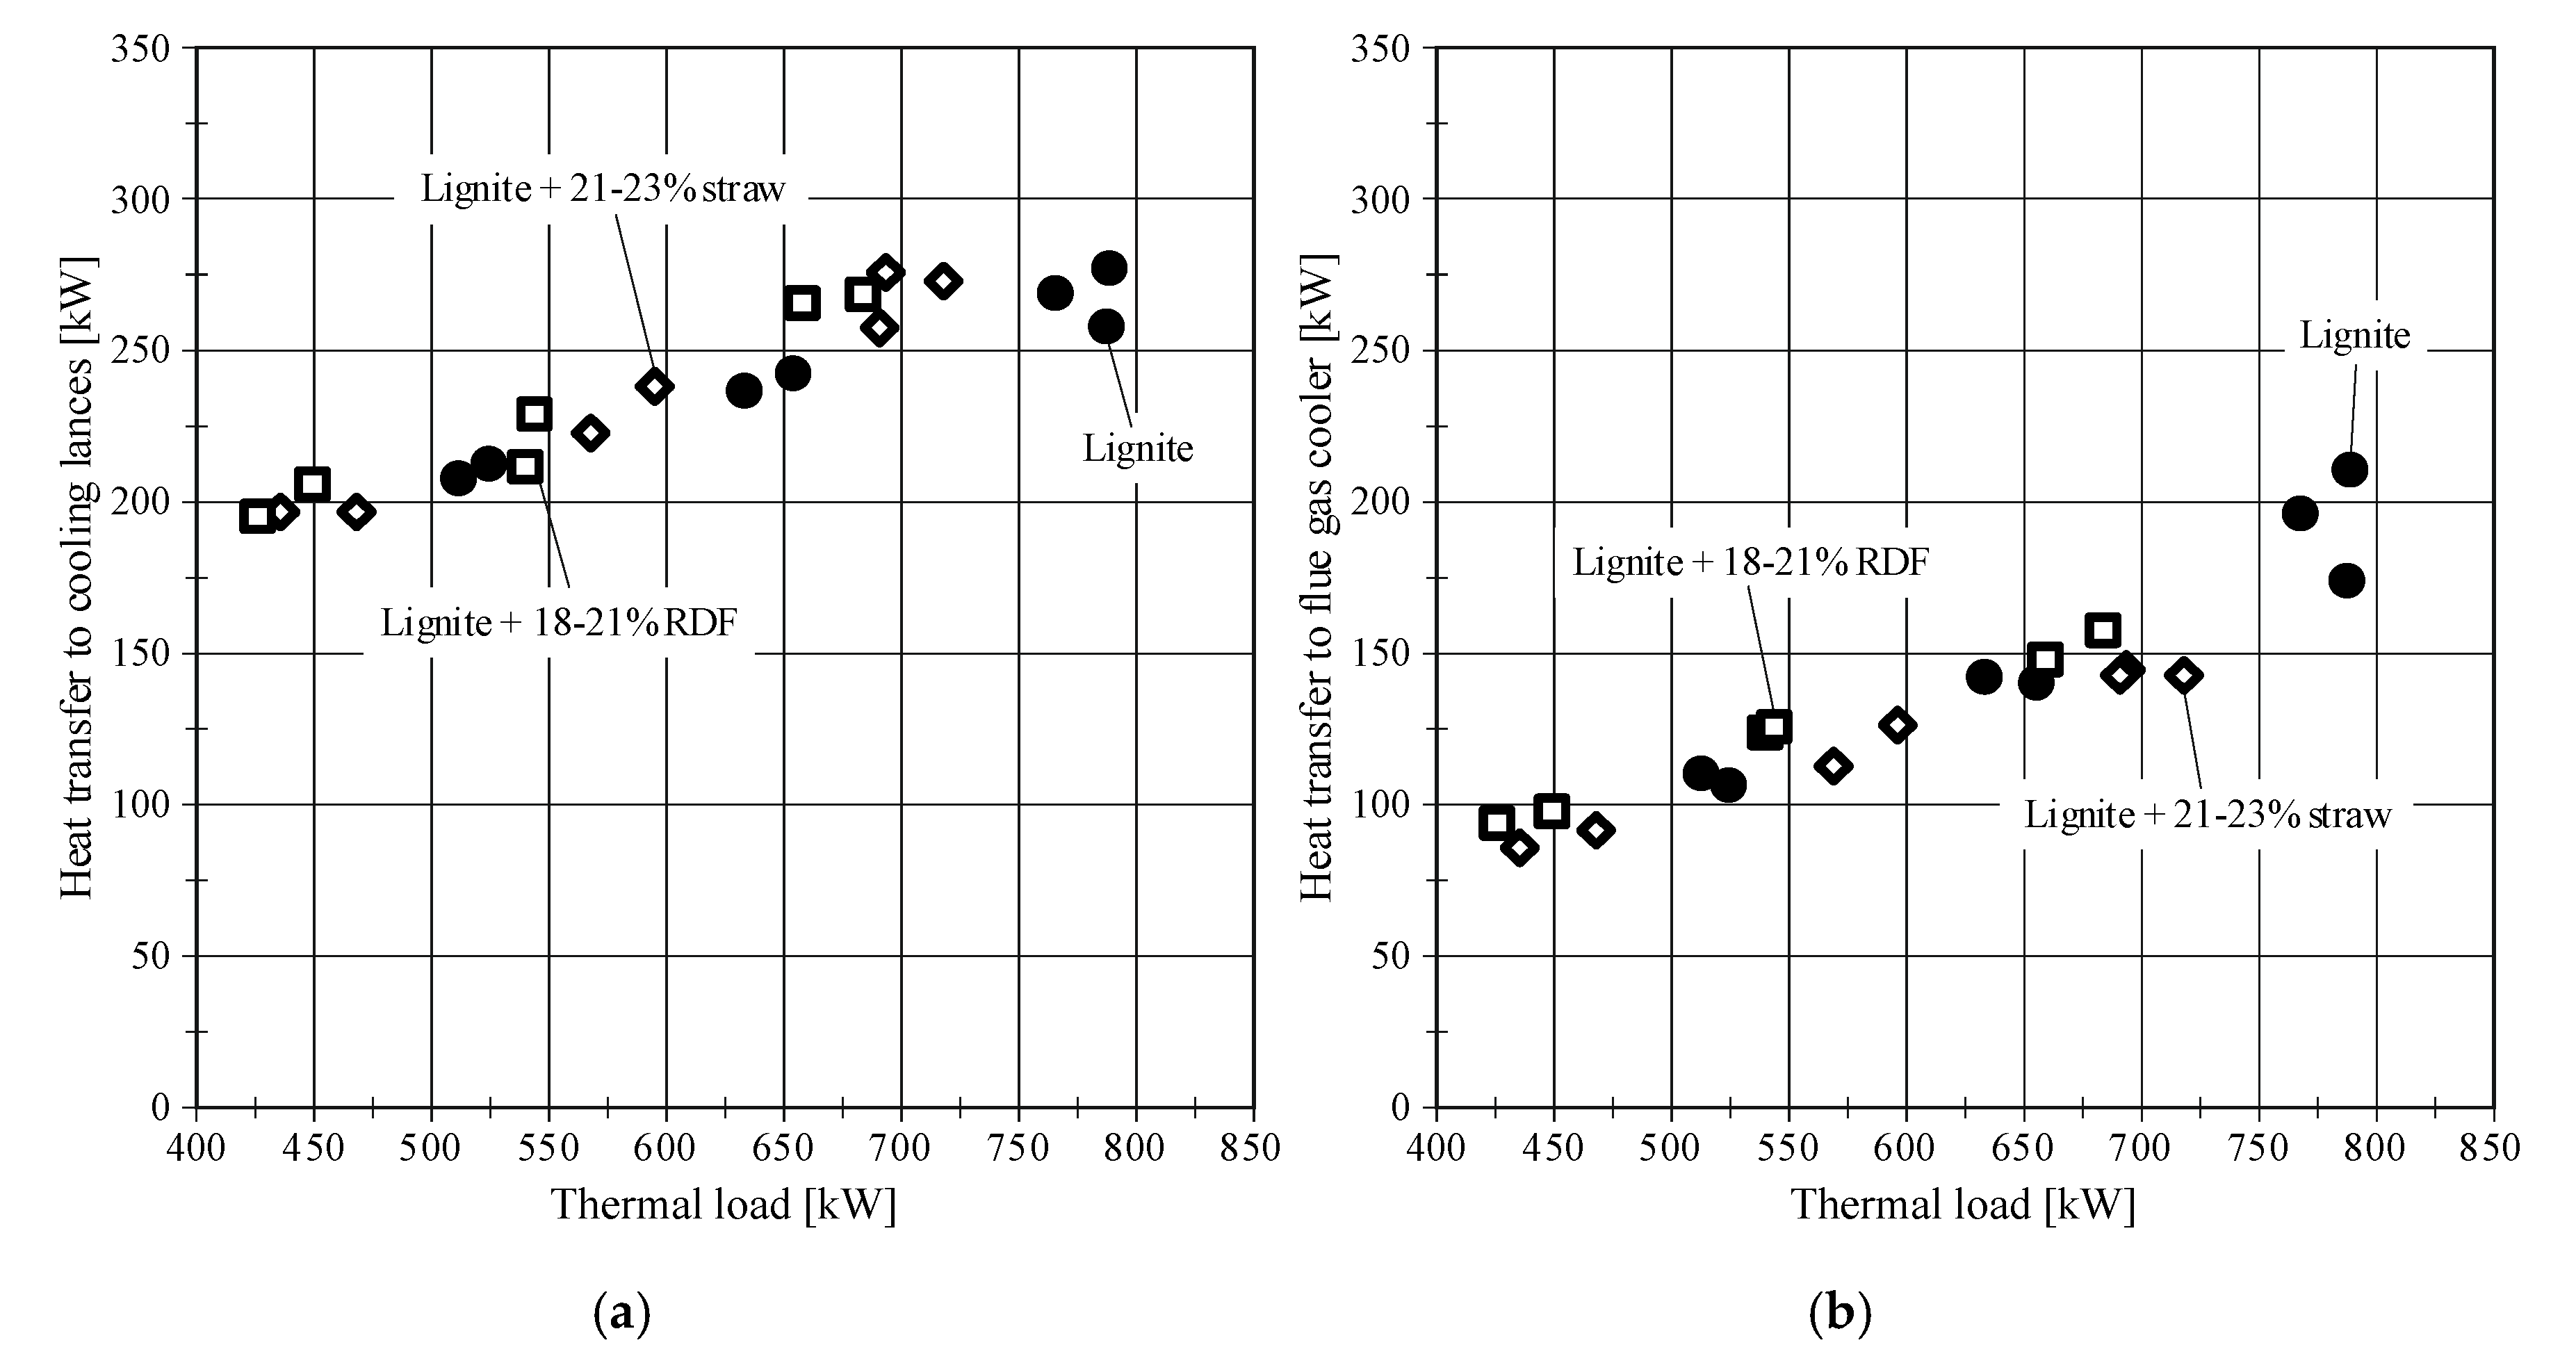
The heat transfer to the cooling lances and the flue gas cooler is shown in Figure 7. The cooling lances take up the heat inside the reactor by particle convection and gas convection [14,15,52]. The dominant mechanism for the flue gas cooler is gas convection due to the low solid fraction in the flue gas. In the tests, around 2/3 of the transferred heat is transferred to the cooling lances, while 1/3 is transferred to the flue gas cooler. The transferred heat linearly increases with the thermal load for both heat exchangers and all tested fuels/fuel mixtures. The heat transfer is not changing significantly when changing the fuel. The heat transfer to the cooling lances is only slightly reduced at higher loads in the lignite tests, despite the different hydrodynamic conditions. However, from the literature, it is known that the heat transfer coefficient for particle convection is highly dependent on the hydrodynamics and the solid fraction at the heat exchanger surface [14]. The minor differences for the heat transfer might be explained by the higher temperature level in the lignite tests (see Figure 4b), which compensates for lower heat transfer coefficients. Additionally, in the freeboard, the fraction of particles is much lower than in the bed, so the gas convection mechanism and not the particle convection may be the dominant heat transfer mechanism inside the pilot.
Even though the heat transfer to the cooling lances is similar, the temperature drop along the reactor is significantly higher in the lignite tests, see Figure 4b. This indicates that mainly the flue gas is cooled in the lignite tests, while the particles remain in the bed. In the co-combustion tests, the bed material acts as a buffer, which takes up the heat from the combustion reactions due to the considerably higher volumetric heat capacity of solids compared to gases. This reduces the temperature drop along the reactor.
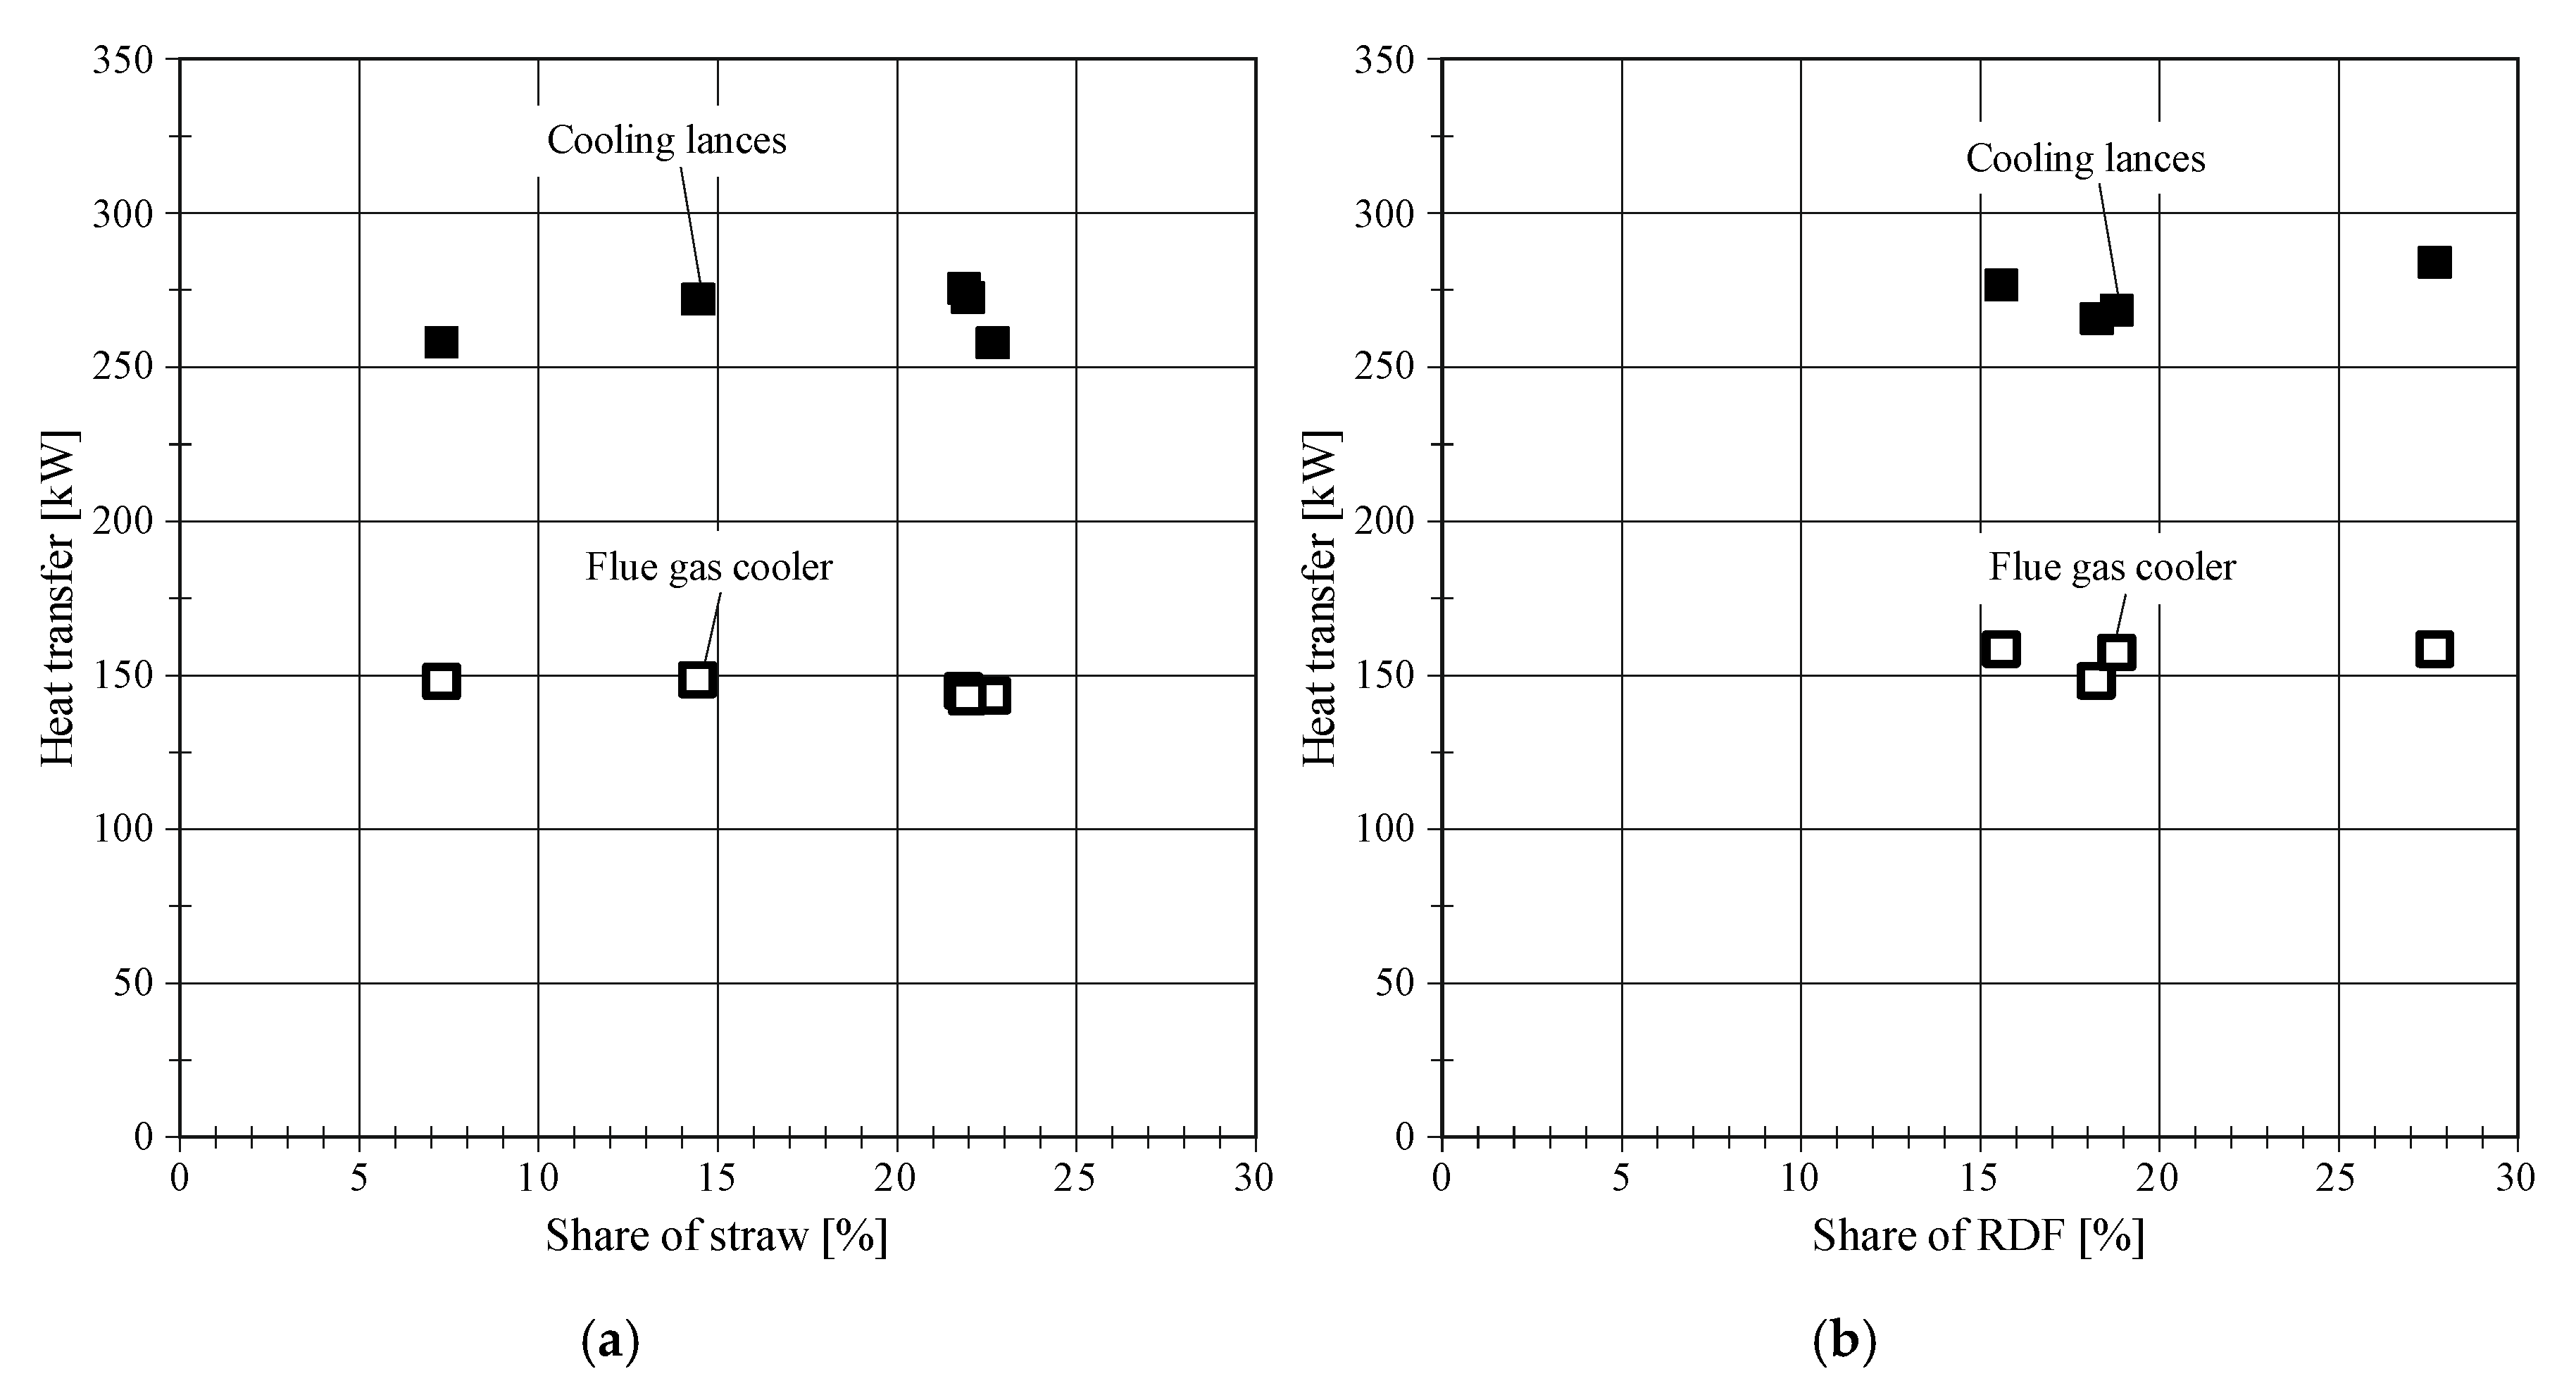
Figure 8 presents the heat transfer to the cooling lances and the flue gas cooler with a similar load and varying share of the co-fuels. There is a slightly increasing trend for the heat transfer to the cooling lances in the straw tests. This result is supported by the increasing entrainment (see Figure 6a), which increases the freeboard temperatures and enhances the heat transfer coefficient slightly. During RDF co-combustion, there is no significant influence of the load share on the heat transfer.
3.3. Flue Gas Composition during Co-Combustion
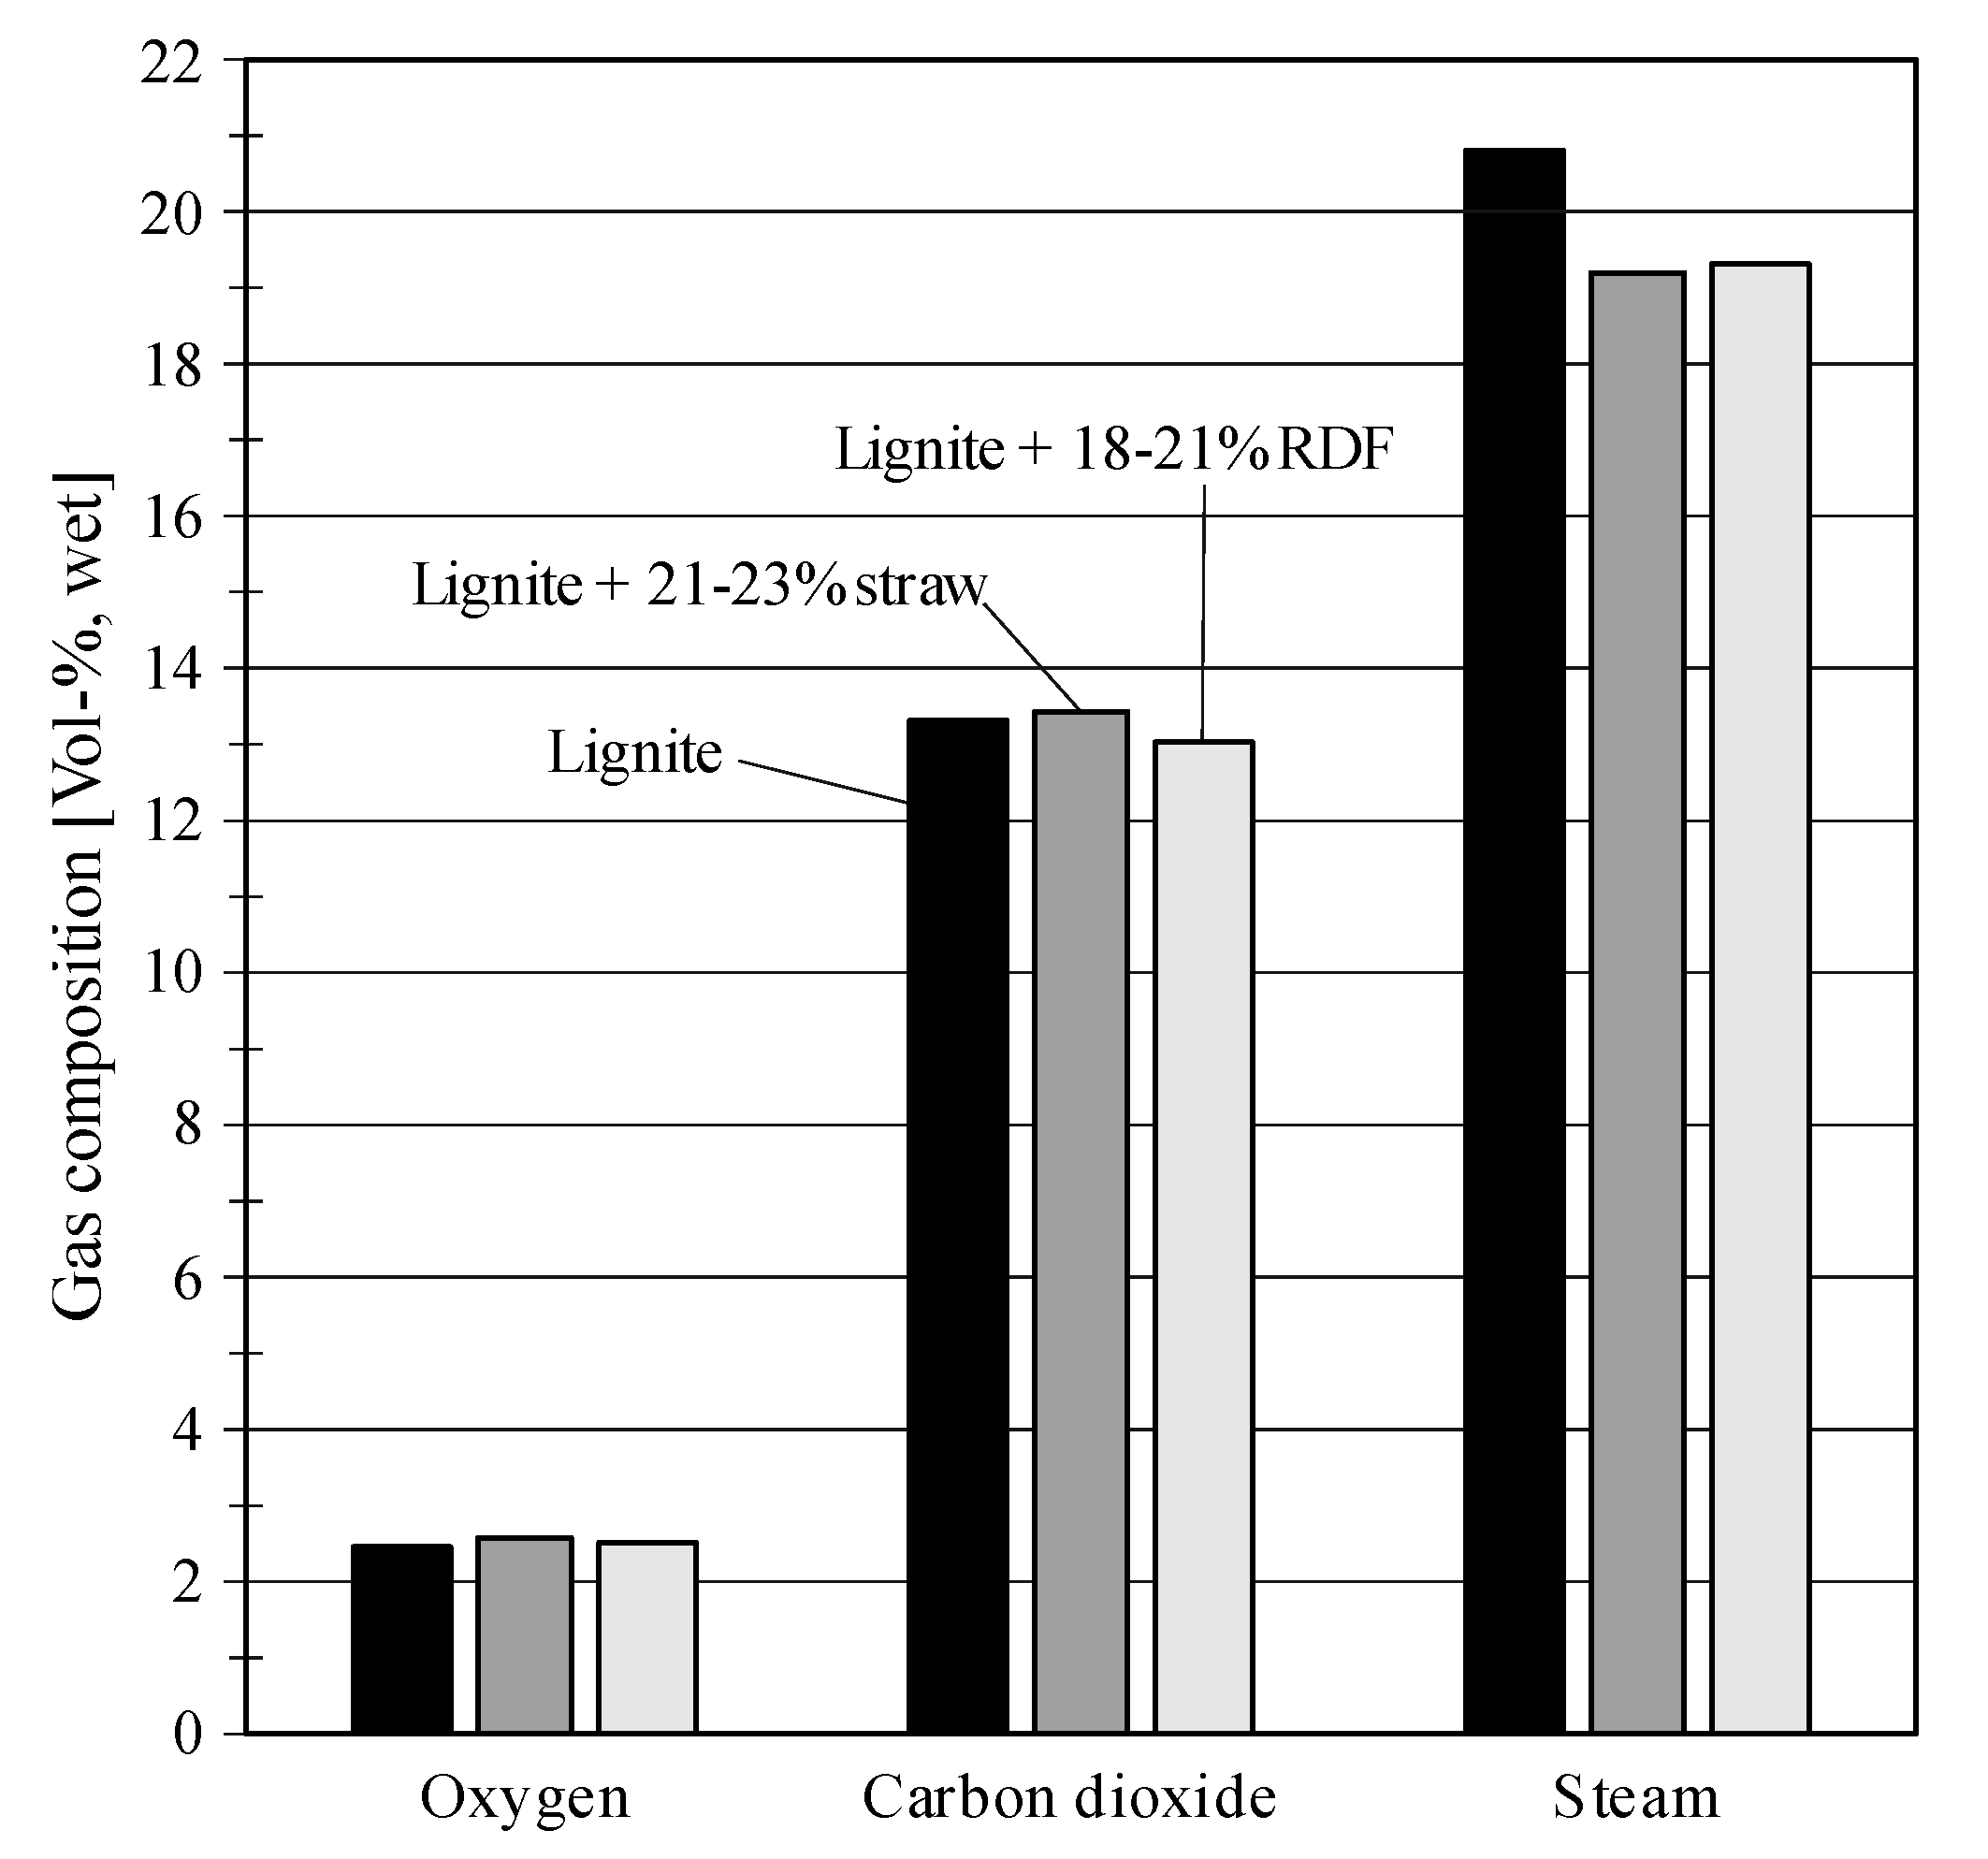
The flue gas composition for the three fuels/fuel mixtures is presented in Figure 9. The shown values are averaged over time while the average includes both full load and part load tests. The target during the tests was to keep the oxygen content at around 2.5 vol%wet. During the lignite and the straw co-combustion tests, the carbon dioxide content is similar, while it is only slightly lower during the RDF tests. The largest difference is noticeable for the water vapor concentration in the flue gas. It is around 1.5 vol%wet lower during the co-combustion tests. The difference in the moisture content of lignite and straw can explain the different water vapor concentrations in the flue gas for the straw test series. However, according to the analyzed sample, the RDF should have a similar moisture content as the lignite, see Table 4. RDF is known to have strongly varying properties and composition, so that the analyses of the fuel samples may distort the results. According to the supplier of the RDF fluff, the typical moisture content is between 9 and 21 wt%, which would explain the difference in the water vapor content in the flue gas. Despite the different water vapor content, the differences in the flue gas composition are only marginal. Therefore, the physical properties of the flue gas are similar, which supports the results, that the heat transfer to the flue gas cooler does not vary strongly with changing fuels in these pilot tests.
4. Conclusions
Three test series were carried out in a 1 MWth CFB boiler pilot plant to investigate the impact of co-combustion on several parameters. RDF fluff and straw pellets were co-combusted with low-rank lignite at different thermal loads. A third test series was carried out for reference where only lignite was combusted. The fuel flexibility of CFB combustion was proven with three low-rank fuels that differ strongly regarding their chemical and physical properties. The conclusions are as follows:
- The entrainment of particles from the fluidized bed highly depended on the bed particle properties and, therefore, it depended on the fuel ash. Sand feeding can provide similar conditions in the furnace for different fuels.
- The hydrodynamic conditions determined the temperature profile along the reactor. No direct relation between thermal load and temperature profile was found.
- The heat transfer to the heat exchanger inside the furnace was in the same magnitude for all fuel mixtures. It linearly increased with the thermal load and slightly raised when the share of straw pellets increased.
- The heat transfer to the flue gas cooler was mainly dependent on the load. Varying share of co-fuel did not have a major impact on the test results.
- The entrainment increased when the share of straw pellets increased, which is probably due to the high volatile content.
The experiments were carried out in a pilot plant unit with 1 MWth, which makes them relevant for commercial CFB combustion power plants. The study shows that the fuel and operational flexibility of CFB combustors offer a feasible low-cost solution to decrease the CO2 emissions by a significant amount.
Author Contributions
Conceptualization, J.P., J.S. and B.E.; methodology, J.P. and J.S.; formal analysis, J.P.; investigation, J.P. and J.M.; resources, J.S. and B.E.; writing—original draft preparation, J.P.; writing—review and editing, J.P., J.M. and J.S.; visualization, J.P.; supervision, J.S. and B.E.; project administration, J.P., J.S. and B.E.; funding acquisition, J.S. and B.E.; All authors have read and agreed to the published version of the manuscript.
Funding
Financial support is acknowledged from the RFCS project of the European Commission under grant agreement no. 754,032 (FLEXible operation of FB plants co-Firing LOw rank coal with renewable fuels compensating vRES–FLEX FLORES). The authors gratefully acknowledge fruitful collaboration with the project partners. We acknowledge support by the German Research Foundation and the Open Access Publishing Fund of Technical University of Darmstadt.
Conflicts of Interest
The authors declare no conflict of interest.
Nomenclature
| Roman Symbols | Subscripts | ||
| Entrainment coefficient (%) | Electrical | ||
| Specific heat capacity (kJ/kgK) | Thermal | ||
| Lower heating value (kJ/kg) | Abbreviations | ||
| Molar mass (kg/kmol) | a.r. | As received | |
| Mass flow (kg/h) | BFB | Bubbling Fluidized Bed | |
| Standard conditions (0 °C, 1.01325 bar) | CFB | Circulating Fluidized Bed | |
| Pressure (bar/mbar) | FG | Flue gas | |
| Heat flow (kW) | FTIR | Fourier-transform infrared spectroscopy | |
| Temperature (°C) | ID | Induced draft | |
| Volume flow rate (Nm3/h) | LHV | Lower heating value | |
| Mass fraction (wt%) | n.a. | Not analyzed | |
| Volume fraction (vol%) | NDIR | Nondispersive infrared sensor | |
| Greek symbols | PC | Pulverized coal | |
| Combustion efficiency (%) | PTFE | Polytetrafluoroethylene | |
| Density (kg/m3) | RDF | Refuse derived fuel | |
| RTD | Resistance temperature detectors | ||
Appendix A

Table A1.
Boundary conditions of test series.
| Share of Fuels (% *) | Thermal Load (kW) | Thermal Load (% **) | Sand Mass Flow (kg/h) | Duration (hh:mm) | |||
|---|---|---|---|---|---|---|---|
| Lignite | Straw | RDF | |||||
| L.1 | 100 | 0 | 0 | 790 | 100 | 0 | 52:00 |
| L.2 | 100 | 0 | 0 | 513 | 65 | 0 | 00:36 |
| L.3 | 100 | 0 | 0 | 634 | 80 | 0 | 01:10 |
| L.4 | 100 | 0 | 0 | 788 | 100 | 0 | 00:40 |
| L.5 | 100 | 0 | 0 | 655 | 83 | 0 | 00:43 |
| L.6 | 100 | 0 | 0 | 525 | 67 | 0 | 02:04 |
| L.7 | 100 | 0 | 0 | 766 | 97 | 0 | 00:57 |
| S.1 | 93 | 7 | 0 | 659 | 25 | 04:00 | |
| S.2 | 86 | 14 | 0 | 699 | 24 | 02:45 | |
| S.3 | 78 | 22 | 0 | 694 | 100 | 24 | 05:35 |
| S.4 | 79 | 21 | 0 | 436 | 63 | 15 | 01:17 |
| S.5 | 78 | 22 | 0 | 568 | 82 | 21 | 01:38 |
| S.6 | 77 | 23 | 0 | 691 | 100 | 16 | 02:10 |
| S.7 | 79 | 21 | 0 | 596 | 86 | 18 | 01:40 |
| S.8 | 79 | 21 | 0 | 468 | 67 | 13 | 01:43 |
| S.9 | 78 | 22 | 0 | 718 | 104 | 22 | 01:52 |
| R.1 | 82 | 0 | 18 | 659 | 100 | 20 | 28:00 |
| R.2 | 80 | 0 | 20 | 427 | 65 | 13 | 01:57 |
| R.3 | 79 | 0 | 21 | 541 | 82 | 2 | 02:37 |
| R.4 | 81 | 0 | 19 | 684 | 104 | 13 | 02:43 |
| R.5 | 80 | 0 | 20 | 545 | 83 | 5 | 02:45 |
| R.6 | 81 | 0 | 19 | 450 | 68 | 12 | 02:36 |
| R.7 | 84 | 0 | 16 | 703 | 107 | 21 | 01:42 |
| R.8 | 72 | 0 | 28 | 681 | 20 | 02:30 | |
* Percentage based on thermal load (lower heating value). ** Percentage based on thermal load of corresponding long term test.
Table A2.
Temperatures, flue gas flow rate, entrainment, and heat transfer during tests.
| Temperatures (°C) | Flue Gas Flow Rate (Nm3/h) | (%) | Heat Transfer (kW) | ||||
|---|---|---|---|---|---|---|---|
| T (0.25 m) | T (8.21 m) | Tout | Cooling Lances | Flue Gas Cooler | |||
| L.1 | 875 | 748 | 820 | 1255 | 7.7 | 293 | 223 |
| L.2 | 884 | 623 | 699 | 854 | 7.1 | 219 | 117 |
| L.3 | 876 | 678 | 736 | 1022 | 8.4 | 250 | 150 |
| L.4 | 863 | 721 | 769 | 1265 | 10.1 | 273 | 184 |
| L.5 | 876 | 696 | 749 | 1026 | 8.9 | 256 | 149 |
| L.6 | 876 | 646 | 708 | 855 | 7.8 | 225 | 112 |
| L.7 | 862 | 732 | 787 | 1270 | 11.6 | 269 | 196 |
| S.1 | 816 | 712 | 711 | 1102 | 12.3 | 273 | 157 |
| S.2 | 816 | 727 | 720 | 1100 | 14.0 | 288 | 157 |
| S.3 | 810 | 724 | 713 | 1088 | 15.1 | 291 | 153 |
| S.4 | 817 | 608 | 651 | 742 | 9.6 | 208 | 91 |
| S.5 | 761 | 651 | 672 | 947 | 13.4 | 236 | 119 |
| S.6 | 779 | 709 | 707 | 1079 | 16.0 | 273 | 152 |
| S.7 | 778 | 670 | 707 | 951 | 14.8 | 252 | 134 |
| S.8 | 810 | 613 | 664 | 739 | 9.5 | 208 | 97 |
| S.9 | 794 | 718 | 716 | 1089 | 17.9 | 288 | 151 |
| R.1 | 800 | 717 | 730 | 1080 | 14.4 | 281 | 157 |
| R.2 | 771 | 613 | 663 | 734 | 10.4 | 207 | 100 |
| R.3 | 768 | 646 | 684 | 883 | 9.9 | 224 | 131 |
| R.4 | 770 | 717 | 713 | 1087 | 16.9 | 284 | 166 |
| R.5 | 783 | 670 | 701 | 883 | 11.2 | 242 | 133 |
| R.6 | 763 | 626 | 671 | 730 | 10.5 | 217 | 103 |
| R.7 | 757 | 716 | 709 | 1094 | 18.5 | 293 | 167 |
| R.8 | 753 | 722 | 729 | 994 | 19.8 | 300 | 167 |
References
- IEA. World Energy Balances 2019; OECD: Paris, France, 2019. [Google Scholar]
- Heinze, C.; May, J.; Peters, J.; Ströhle, J.; Epple, B. Techno-economic assessment of polygeneration based on fluidized bed gasification. Fuel 2019, 250, 285–291. [Google Scholar] [CrossRef]
- Haaf, M.; Peters, J.; Hilz, J.; Unger, A.; Ströhle, J.; Epple, B. Combustion of solid recovered fuels within the calcium looping process—Experimental demonstration at 1 MWth scale. Exp. Therm. Fluid Sci. 2020, 113, 110023. [Google Scholar] [CrossRef]
- Hilz, J.; Helbig, M.; Haaf, M.; Daikeler, A.; Ströhle, J.; Epple, B. Investigation of the fuel influence on the carbonate looping process in 1 MWth scale. Fuel Process. Technol. 2018, 169, 170–177. [Google Scholar] [CrossRef]
- Ohlemüller, P.; Ströhle, J.; Epple, B. Chemical looping combustion of hard coal and torrefied biomass in a 1 MW th pilot plant. Int. J. Greenh. Gas Control. 2017, 65, 149–159. [Google Scholar] [CrossRef]
- Liang, Z.H.; Rongwong, W.; Liu, H.; Fu, K.; Gao, H.; Cao, F.; Zhang, R.; Sema, T.; Henni, A.; Sumon, K.; et al. Recent progress and new developments in post-combustion carbon-capture technology with amine based solvents. Int. J. Greenh. Gas Control. 2015, 40, 26–54. [Google Scholar] [CrossRef] [Green Version]
- Basu, P. Combustion and Gasification in Fluidized Beds; CRC Press: Boca Raton, FL, USA, 2006. [Google Scholar]
- Basu, P. Combustion of coal in circulating fluidized-bed boilers: A review. Chem. Eng. Sci. 1999, 54, 5547–5557. [Google Scholar] [CrossRef]
- Al-Mansour, F.; Zuwała, J. An evaluation of biomass co-firing in Europe. Biomass Bioenergy 2010, 34, 620–629. [Google Scholar] [CrossRef]
- Nuortimo, K.; Wheeler, V.F. Lagisza, world’s largest CFB boiler, begins commercial operation. Modern Power Syst. 2010, 30, 30–31. [Google Scholar]
- Lyu, J.; Yang, H.; Ling, W.; Nie, L.; Yue, G.; Li, R.; Chen, Y.; Wang, S. Development of a supercritical and an ultra-supercritical circulating fluidized bed boiler. Front. Energy 2019, 13, 114–119. [Google Scholar] [CrossRef]
- Jäntti, T.; Nuortimo, K.; Ruuskanen, M.; Kalenius, J.; Oy, F.W.E. Samcheok Green Power 4 × 550 MWe Supercritical Circulating Fluidized-Bed Steam Generators in South Korea. In Proceedings of the Power-Gen Europe 2012, Cologne, Germany, 12–14 June 2012. [Google Scholar]
- Kunii, D.; Levenspiel, O. Fluidization Engineering; Butterworth-Heinemann: Stoneham, MA, USA, 1991. [Google Scholar]
- Grace, J.R.; Knowlton, T.; Avidan, A. Circulating Fluidized Beds; Blackie Academic and Professional: London, UK, 1997. [Google Scholar]
- Oka, S. Fluidized Bed Combustion; Marcel Dekker, Inc.: New York, NY, USA, 2003. [Google Scholar]
- Yates, J.G.; Lettieri, P. Fluidized-Bed Reactors: Processes and Operating Conditions; Springer International Publishing: Basel, Switzerland, 2016. [Google Scholar]
- Miller, B.G. Clean Coal Engineering Technology; Elsevier: Oxford, UK, 2010. [Google Scholar]
- Lockwood, T. Techno-Economic Analysis of PC Versus CFB Combustion Technology; Report CCC/226; IEA Clean Coal Centre: London, UK, 2013. [Google Scholar]
- Walter, H.; Epple, B. Numerical Simulation of Power Plants and Firing Systems; Springer: Vienna, Austria, 2017. [Google Scholar]
- Nuortimo, K.; Eriksson, T.; Nevalainen, T. Large Scale Utility CFB Technology in Worlds Largest Greenfield 100% Biomass Power Plant. Available online: https://www.shi-fw.com/2017/06/12/large-scale-utility-cfb-technology-in-worlds-largest-greenfield-100-biomass-power-plant/ (accessed on 1 August 2020).
- Basu, P.; Butler, J.; Leon, M.A. Biomass co-firing options on the emission reduction and electricity generation costs in coal-fired power plants. Renew. Energy 2011, 36, 282–288. [Google Scholar] [CrossRef]
- Sami, M.; Annamalai, K.; Wooldridge, M. Co-firing of coal and biomass fuel blends. Prog. Energy Combust. Sci. 2001, 27, 171–214. [Google Scholar] [CrossRef]
- Roni, M.S.; Chowdhury, S.; Mamun, S.; Marufuzzaman, M.; Lein, W.; Johnson, S. Biomass co-firing technology with policies, challenges, and opportunities: A global review. Renew. Sustain. Energy Rev. 2017, 78, 1089–1101. [Google Scholar] [CrossRef]
- Hansson, J.; Berndes, G.; Johnsson, F.; Kjärstad, J. Co-firing biomass with coal for electricity generation—An assessment of the potential in EU27. Energy Policy 2009, 37, 1444–1455. [Google Scholar] [CrossRef]
- Nussbaumer, T. Combustion and Co-combustion of Biomass: Fundamentals, Technologies, and Primary Measures for Emission Reduction. Energy Fuels 2003, 17, 1510–1521. [Google Scholar] [CrossRef]
- Munir, S.; Nimmo, W.; Gibbs, B. The effect of air staged, co-combustion of pulverised coal and biomass blends on NOx emissions and combustion efficiency. Fuel 2011, 90, 126–135. [Google Scholar] [CrossRef]
- Åmand, L.-E.; Leckner, B. Metal emissions from co-combustion of sewage sludge and coal/wood in fluidized bed. Fuel 2004, 83, 1803–1821. [Google Scholar] [CrossRef]
- Spliethoff, H.; Hein, K. Effect of co-combustion of biomass on emissions in pulverized fuel furnaces. Fuel Process. Technol. 1998, 54, 189–205. [Google Scholar] [CrossRef]
- Leckner, B.; Åmand, L.-E.; Lucke, K.; Werther, J. Gaseous emissions from co-combustion of sewage sludge and coal/wood in a fluidized bed. Fuel 2004, 83, 477–486. [Google Scholar] [CrossRef] [Green Version]
- Chyang, C.-S.; Han, Y.-L.; Wu, L.-W.; Wan, H.-P.; Lee, H.-T.; Chang, Y.-H. An investigation on pollutant emissions from co-firing of RDF and coal. Waste Manag. 2010, 30, 1334–1340. [Google Scholar] [CrossRef]
- Wei, X.; Wang, Y.; Liu, D.; Sheng, H.; Tian, W.; Xiao, Y. Release of Sulfur and Chlorine during Cofiring RDF and Coal in an Internally Circulating Fluidized Bed. Energy Fuels 2009, 23, 1390–1397. [Google Scholar] [CrossRef] [Green Version]
- Suksankraisorn, K.; Patumsawad, S.; Vallikul, P.; Fungtammasan, B.; Accary, A. Co-combustion of municipal solid waste and Thai lignite in a fluidized bed. Energy Convers. Manag. 2004, 45, 947–962. [Google Scholar] [CrossRef]
- Zhang, S.; Jiang, X.; Lv, G.; Wu, L.; Li, W.; Wang, Y.; Fang, C.; Jin, Y.; Yan, J. Co-combustion of Shenmu coal and pickling sludge in a pilot scale drop-tube furnace: Pollutants emissions in flue gas and fly ash. Fuel Process. Technol. 2019, 184, 57–64. [Google Scholar] [CrossRef]
- Zhang, B.; Zhong, Z.; Xue, Z.; Xue, J.; Xu, Y. Release and transformation of potassium in co-combustion of coal and wheat straw in a BFB reactor. Appl. Therm. Eng. 2018, 144, 1010–1016. [Google Scholar] [CrossRef]
- Zhou, H.; Zhang, J.; Ma, W.; Xu, Y.; Zhao, M. Fouling Characteristics of Coal Biomass Co-combustion and the Influence of the Deposition Surface. Energy Fuels 2017, 31, 7069–7075. [Google Scholar] [CrossRef]
- Fuller, A.; Maier, J.; Karampinis, E.; Kalivodová, J.; Grammelis, P.; Kakaras, E.; Scheffknecht, G. Fly Ash Formation and Characteristics from (co-)Combustion of an Herbaceous Biomass and a Greek Lignite (Low-Rank Coal) in a Pulverized Fuel Pilot-Scale Test Facility. Energies 2018, 11, 1581. [Google Scholar] [CrossRef] [Green Version]
- Pronobis, M. The influence of biomass co-combustion on boiler fouling and efficiency. Fuel 2006, 85, 474–480. [Google Scholar] [CrossRef]
- Niu, Y.; Tan, H.; Hui, S. Ash-related issues during biomass combustion: Alkali-induced slagging, silicate melt-induced slagging (ash fusion), agglomeration, corrosion, ash utilization, and related countermeasures. Prog. Energy Combust. Sci. 2016, 52, 1–61. [Google Scholar] [CrossRef]
- Xue, Z.; Zhong, Z.; Zhang, B.; Zhang, J.; Xie, X. Potassium transfer characteristics during co-combustion of rice straw and coal. Appl. Therm. Eng. 2017, 124, 1418–1424. [Google Scholar] [CrossRef]
- Wang, G.; Zhang, J.-L.; Shao, J.; Liu, Z.; Zhang, G.-H.; Xu, T.; Guo, J.; Wang, H.; Xu, R.; Lin, H. Thermal behavior and kinetic analysis of co-combustion of waste biomass/low rank coal blends. Energy Convers. Manag. 2016, 124, 414–426. [Google Scholar] [CrossRef]
- Hu, S.; Ma, X.; Lin, Y.; Yu, Z.; Fang, S. Thermogravimetric analysis of the co-combustion of paper mill sludge and municipal solid waste. Energy Convers. Manag. 2015, 99, 112–118. [Google Scholar] [CrossRef]
- Liu, Z.; Quek, A.; Hoekman, S.K.; Srinivasan, M.; Balasubramanian, R. Thermogravimetric investigation of hydrochar-lignite co-combustion. Bioresour. Technol. 2012, 123, 646–652. [Google Scholar] [CrossRef] [PubMed]
- Zhang, K.; Yu, B.; Chang, J.; Wu, G.; Wang, T.; Wen, D. Hydrodynamics of a fluidized bed co-combustor for tobacco waste and coal. Bioresour. Technol. 2012, 119, 339–348. [Google Scholar] [CrossRef] [PubMed]
- Gayán, P.; Adanez, J.; De Diego, L.F.; García-Labiano, F.; Cabanillas, A.; Bahillo, A.; Aho, M.; Veijonen, K.; Curieses, M.B.; García-Labiano, F. Circulating fluidised bed co-combustion of coal and biomass. Fuel 2004, 83, 277–286. [Google Scholar] [CrossRef] [Green Version]
- Baxter, L.L. Biomass-coal co-combustion: Opportunity for affordable renewable energy. Fuel 2005, 84, 1295–1302. [Google Scholar] [CrossRef] [Green Version]
- Dai, J.; Sokhansanj, S.; Grace, J.R.; Bi, X.; Lim, C.J.; Melin, S. Overview and some issues related to co-firing biomass and coal. Can. J. Chem. Eng. 2008, 86, 367–386. [Google Scholar] [CrossRef]
- Ghenai, C.; Janajreh, I. CFD analysis of the effects of co-firing biomass with coal. Energy Convers. Manag. 2010, 51, 1694–1701. [Google Scholar] [CrossRef]
- Tabet, F.; Gokalp, I. Review on CFD based models for co-firing coal and biomass. Renew. Sustain. Energy Rev. 2015, 51, 1101–1114. [Google Scholar] [CrossRef]
- Kong, D.; Wang, S.; Zhou, M.; Luo, K.; Hu, C.; Li, D.; Fan, J. Three-dimensional full-loop numerical simulation of co-combustion of coal and refuse derived fuel in a pilot-scale circulating fluidized bed boiler. Chem. Eng. Sci. 2020, 220, 115612. [Google Scholar] [CrossRef]
- Jenkins, B.M.; Baxter, L.; Miles, T., Jr. Combustion properties of biomass. Fuel Process. Technol. 1998, 54, 17–46. [Google Scholar] [CrossRef]
- Baskakov, A.; Berg, B.; Vitt, O.; Filippovsky, N.; Kirakosyan, V.; Goldobin, J.; Maskaev, V. Heat transfer to objects immersed in fluidized beds. Powder Technol. 1973, 8, 273–282. [Google Scholar] [CrossRef]
- Molerus, O.; Mattmann, W. Heat transfer mechanisms in gas fluidized beds. Part 3: Heat transfer in circulating fluidized beds. Chem. Eng. Technol. Ind. Chem. Plant Equip. Process Eng. Biotechnol. 1992, 15, 291–294. [Google Scholar] [CrossRef]
Figure 1.
Flow scheme and 3D-model of the 1 MWth combustor pilot plant.

Figure 2.
Flow diagram of cooling system (cold side) and scheme of cooling lances.

Figure 3.
Temperature, pressure, load, and gas composition (co-combustion of lignite and straw).

Figure 4.
Pressure-profiles (a) and Temperature-profiles (b).

Figure 5.
Entrainment coefficient (a) and temperature difference (b) (similar share of co-fuel).

Figure 6.
Entrainment coefficient and temperature difference (similar load/flue gas flow rate): straw (a) and RDF (b).
Figure 6.
Entrainment coefficient and temperature difference (similar load/flue gas flow rate): straw (a) and RDF (b).

Figure 7.
Heat transfer to cooling lances (a) and flue gas cooler (b) (similar share of co-fuel).

Figure 8.
Heat transfer (similar load/flue gas flow rate): straw (a) and RDF (b).

Figure 9.
Flue gas composition during co-combustion (similar share of co-fuel).

Table 1.
Measurement devices of the CFB pilot plant.
| Measured Quantity | Measurement Device/Principle | Position |
|---|---|---|
| Temperature | Thermocouples/Seebeck effect | Height in riser (m): 0.25, 1.12, 1.55, 2.38, 5.27, 6.25, 8.21; 2× loop seal, 2× standpipe, cyclone outlet |
| Pressure | Pressure transducers/piezoresistive sensor | Height in riser (m): 0.11, 0.22, 0.4, 0.58, 0.91, 1.10, 2.07, 3.42, 7.31, 8.03; 2× loop seal, 2× standpipe, cyclone outlet |
| Volume flow rate | Orifice, venturi/pressure difference | Combustion air lines (orifices), flue gas line after flue gas cooler (venturi) |
| Gas composition | NDIR-sensor, paramagnetic sensor, FTIR | NDIR and Paramagnetic after cyclone, FTIR before and after fabric filter |
| Mass flow | Weight sensors/strain gauges | Solid feeding systems for lignite, RDF, straw-pellets, sand |
Table 2.
Dimensions and boundary conditions of the heat exchangers.
| Sub-System | Property | Unit | Value |
|---|---|---|---|
| Cooling lances | Number of cooling lances | - | 5 |
| Length of cooling lances | m | 8 | |
| Outer diameter of inner tube | mm | 33.6 | |
| Inner diameter of inner tube | mm | 42.4 | |
| Outer diameter of outer tube | mm | 53.1 | |
| Inner diameter of outer tube | mm | 60.3 | |
| Inlet temperature of cooling liquid | °C | 107–109 | |
| Flue gas cooler | Cross-sectional area of 1st row | m2 | 0.165 |
| Height of 1st row | m | 6.63 | |
| Cross-sectional area of 2nd row | m2 | 0.148 | |
| Height of 2nd row | m | 5.41 | |
| Inlet temperature of cooling liquid | °C | 108–109 |
Table 3.
Properties of the cooling liquid.
| Property | Unit | Value |
|---|---|---|
| Volume fraction of water H2O | vol% | 62 |
| Volume fraction of Antifrogen L | vol% | 38 |
| Density (115 °C) | kg/m3 | 964 |
| Heat capacity (115 °C) | kJ/kgK | 4.01 |
Table 4.
Fuel properties (a.r. = as received, n.a. = not analyzed).
| Property | Unit | Lignite | Straw Pellets | RDF Fluff |
|---|---|---|---|---|
| Lower heating value | MJ/kg, a.r. | 10.81 | 14.59 | 12.29 |
| Lower heating value | MJ/kg, dry | 24.73 | 16.78 | 23.43 |
| Total moisture | wt%, a.r. | 51.2 | 11.4 | 43.1 |
| Volatiles | wt%, dry | 49.70 | 74.4 * | 78.3 |
| Fixed carbon (100%-rest) | wt%, dry | 46.20 | 17.40 * | 5.40 |
| Ash (815 °C) | wt%, dry | 4.10 | 8.20 | 16.30 |
| C | wt%, dry | 66.10 | 45.00 | 54.80 |
| H | wt%, dry | 4.70 | 5.50 | 7.30 |
| N | wt%, dry | 0.76 | 0.68 | 0.96 |
| S | wt%, dry | 0.30 | 0.11 | 0.29 |
| Cl | wt%, dry | 0.022 | 0.10 | 1.53 |
| F | wt%, dry | 0.002 | <0.001 | <0.001 |
| O (100%-rest) | wt%, dry | 24.02 | 40.41 | 18.82 |
| Bulk density | kg/m3 | 716 | 487 | 190 |
| d(10) | mm | 0.1 | n.a. | n.a. |
| d(50) | mm | 2.8 | n.a. | 50 * |
| d(90) | mm | 11.9 | n.a. | 120 * |
| Typical particle length | mm | n.a. | 6.7 | n.a. |
| Typical particle diameter | mm | n.a. | 6.1 | n.a. |
| Ash softening temperature * | °C | ≥1100 | 851 | 1179 |
| Ash flow temperature * | °C | ≥1250 | 1298 | 1225 |
* Analysis is done with another batch of the fuel.
Table 5.
Manual sorting of RDF fluff.
| Category | Mass Fraction (wt%) | Material | Mass Fraction (wt%) |
|---|---|---|---|
| Plastics | 25.6 | Plastic foils | 4.6 |
| 3-dimensional plastic | 19.7 | ||
| Foam | 1.3 | ||
| Biomass | 32.0 | Paper, cardboard | 20.9 |
| Wood | 11.0 | ||
| Other biomass | 0.1 | ||
| Inerts | 3.0 | Glas, stones | 2.2 |
| Metal | 0.8 | ||
| Others | 39.4 | Plastic + metal hybrid | 0.1 |
| Textiles, fibers, fabrics | 13.5 | ||
| Fine particles (undefined) | 25.8 |
Table 6.
Sand properties.
| Property | Unit | Sand |
|---|---|---|
| Bulk density | kg/m3 | 1400 |
| Density | kg/m3 | 2650 |
| d(50) | mm | 0.240 |
| Particle size > 0.355 mm | wt% | 5 |
| Particle size 0.250–0.355 mm | wt% | 28 |
| Particle size 0.180–0.250 mm | wt% | 49 |
| Particle size 0.125–0.180 mm | wt% | 16 |
| Particle size 0.090–0.125 mm | wt% | 2 |
| Particle size < 0.090 mm | wt% | 0 |
| SiO2-content | wt% | 99.7 |
Table 7.
Properties of the ash samples and combustion efficiency (long-term steady-state tests).
| Property | Unit | Lignite Tests | Co-Combustion with Straw | Co-Combustion with RDF |
|---|---|---|---|---|
| D(10) bottom ash | mm | 0.21 | 0.18 | 0.16 |
| D(50) bottom ash | mm | 0.34 | 0.25 | 0.23 |
| D(90) bottom ash | mm | 0.70 | 0.45 | 0.47 |
| Bulk density bottom ash | kg/m3 | 1072 | 1393 | 1477 |
| Total carbon bottom ash | wt%, dry | 0.2 | 0.1 | 0.3 |
| Total carbon fly ash | wt%, dry | 3.1 | 4 | 4 |
| Bottom ash mass flow | kg/h | 0.9 | 25.7 | 23.4 |
| Fly ash mass flow | kg/h | 5.3 | 4.9 | 3.8 |
| CO in flue gas | ppm, wet | 68 | 139 | 2328 |
| Combustion efficiency | % | 99.8 | 99.6 | 98.3 |
© 2020 by the authors. Licensee MDPI, Basel, Switzerland. This article is an open access article distributed under the terms and conditions of the Creative Commons Attribution (CC BY) license (http://creativecommons.org/licenses/by/4.0/).
Share and Cite
MDPI and ACS Style
Peters, J.; May, J.; Ströhle, J.; Epple, B. Flexibility of CFB Combustion: An Investigation of Co-Combustion with Biomass and RDF at Part Load in Pilot Scale. Energies 2020, 13, 4665. https://doi.org/10.3390/en13184665
AMA Style
Peters J, May J, Ströhle J, Epple B. Flexibility of CFB Combustion: An Investigation of Co-Combustion with Biomass and RDF at Part Load in Pilot Scale. Energies. 2020; 13(18):4665. https://doi.org/10.3390/en13184665
Chicago/Turabian StylePeters, Jens, Jan May, Jochen Ströhle, and Bernd Epple. 2020. "Flexibility of CFB Combustion: An Investigation of Co-Combustion with Biomass and RDF at Part Load in Pilot Scale" Energies 13, no. 18: 4665. https://doi.org/10.3390/en13184665
Note that from the first issue of 2016, this journal uses article numbers instead of page numbers. See further details here.