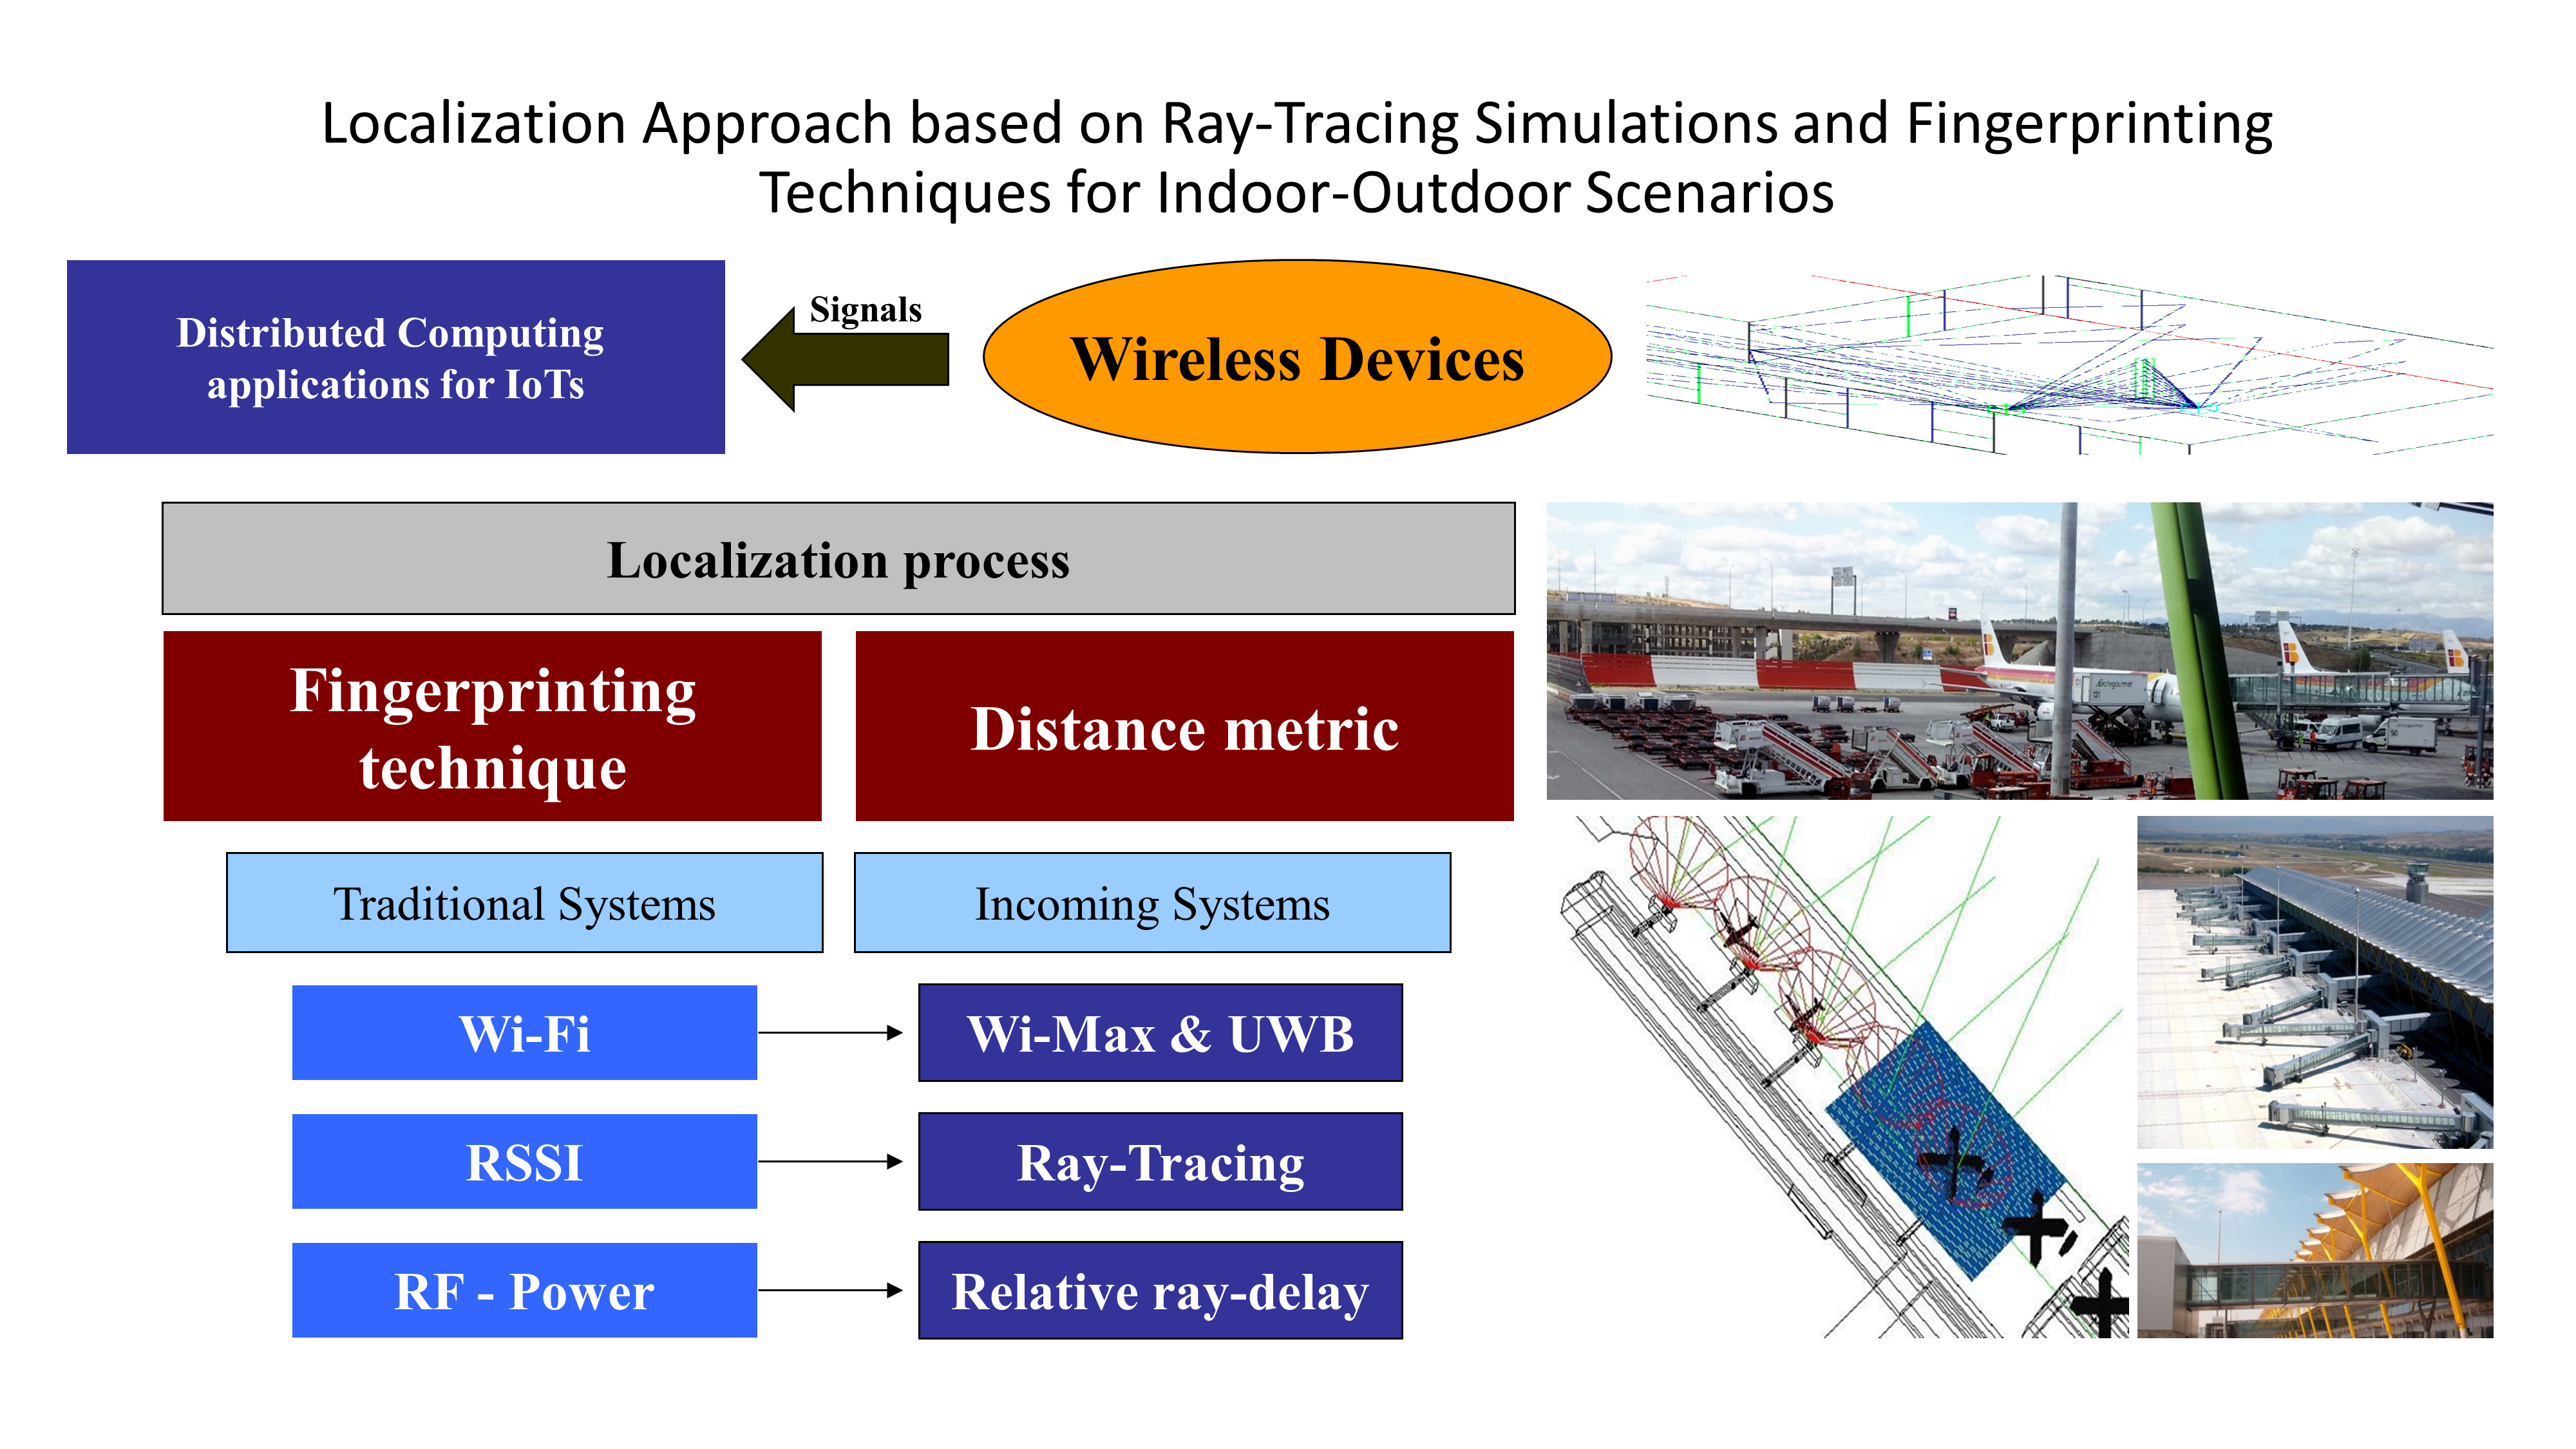
Localization Approach Based on Ray-Tracing Simulations and Fingerprinting Techniques for Indoor–Outdoor Scenarios

 , and
, and
Abstract
:
1. Introduction
2. Review of Techniques for Localization
- Time of arrival (ToA)
- Time difference of arrival (TDoA)
- Angle of arrival (AoA)
- Received signal strength (RSS)
- Hybrid techniques
- Fingerprinting technique
2.1. Time of Arrival
2.2. Time Difference of Arrival
2.3. Angle of Arrival
2.4. Received Signal. Strength (RSS)
2.5. Hybrid. Techniques
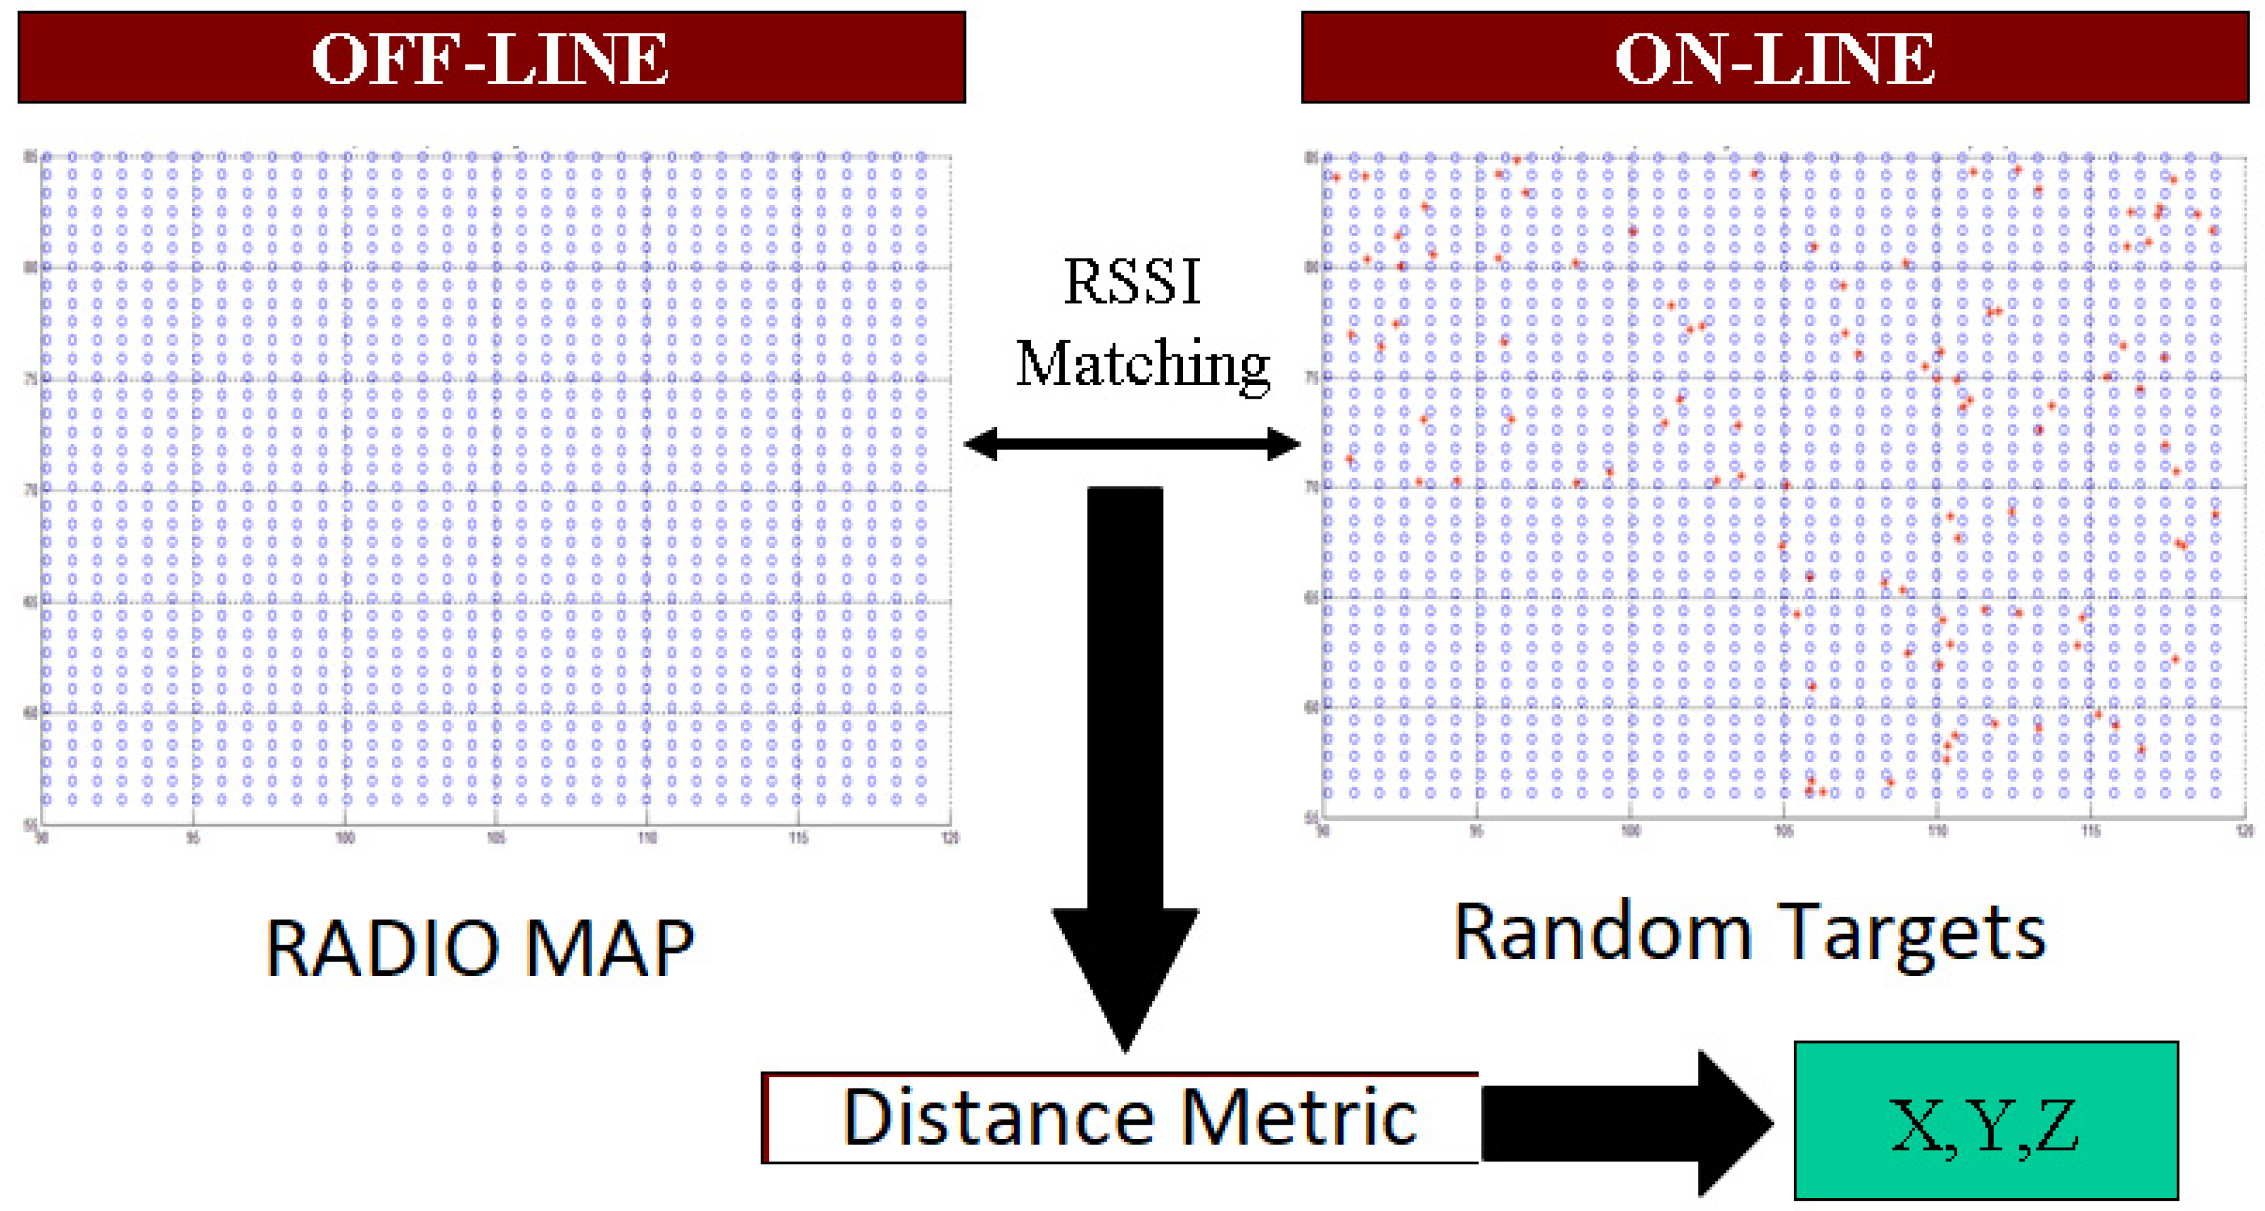
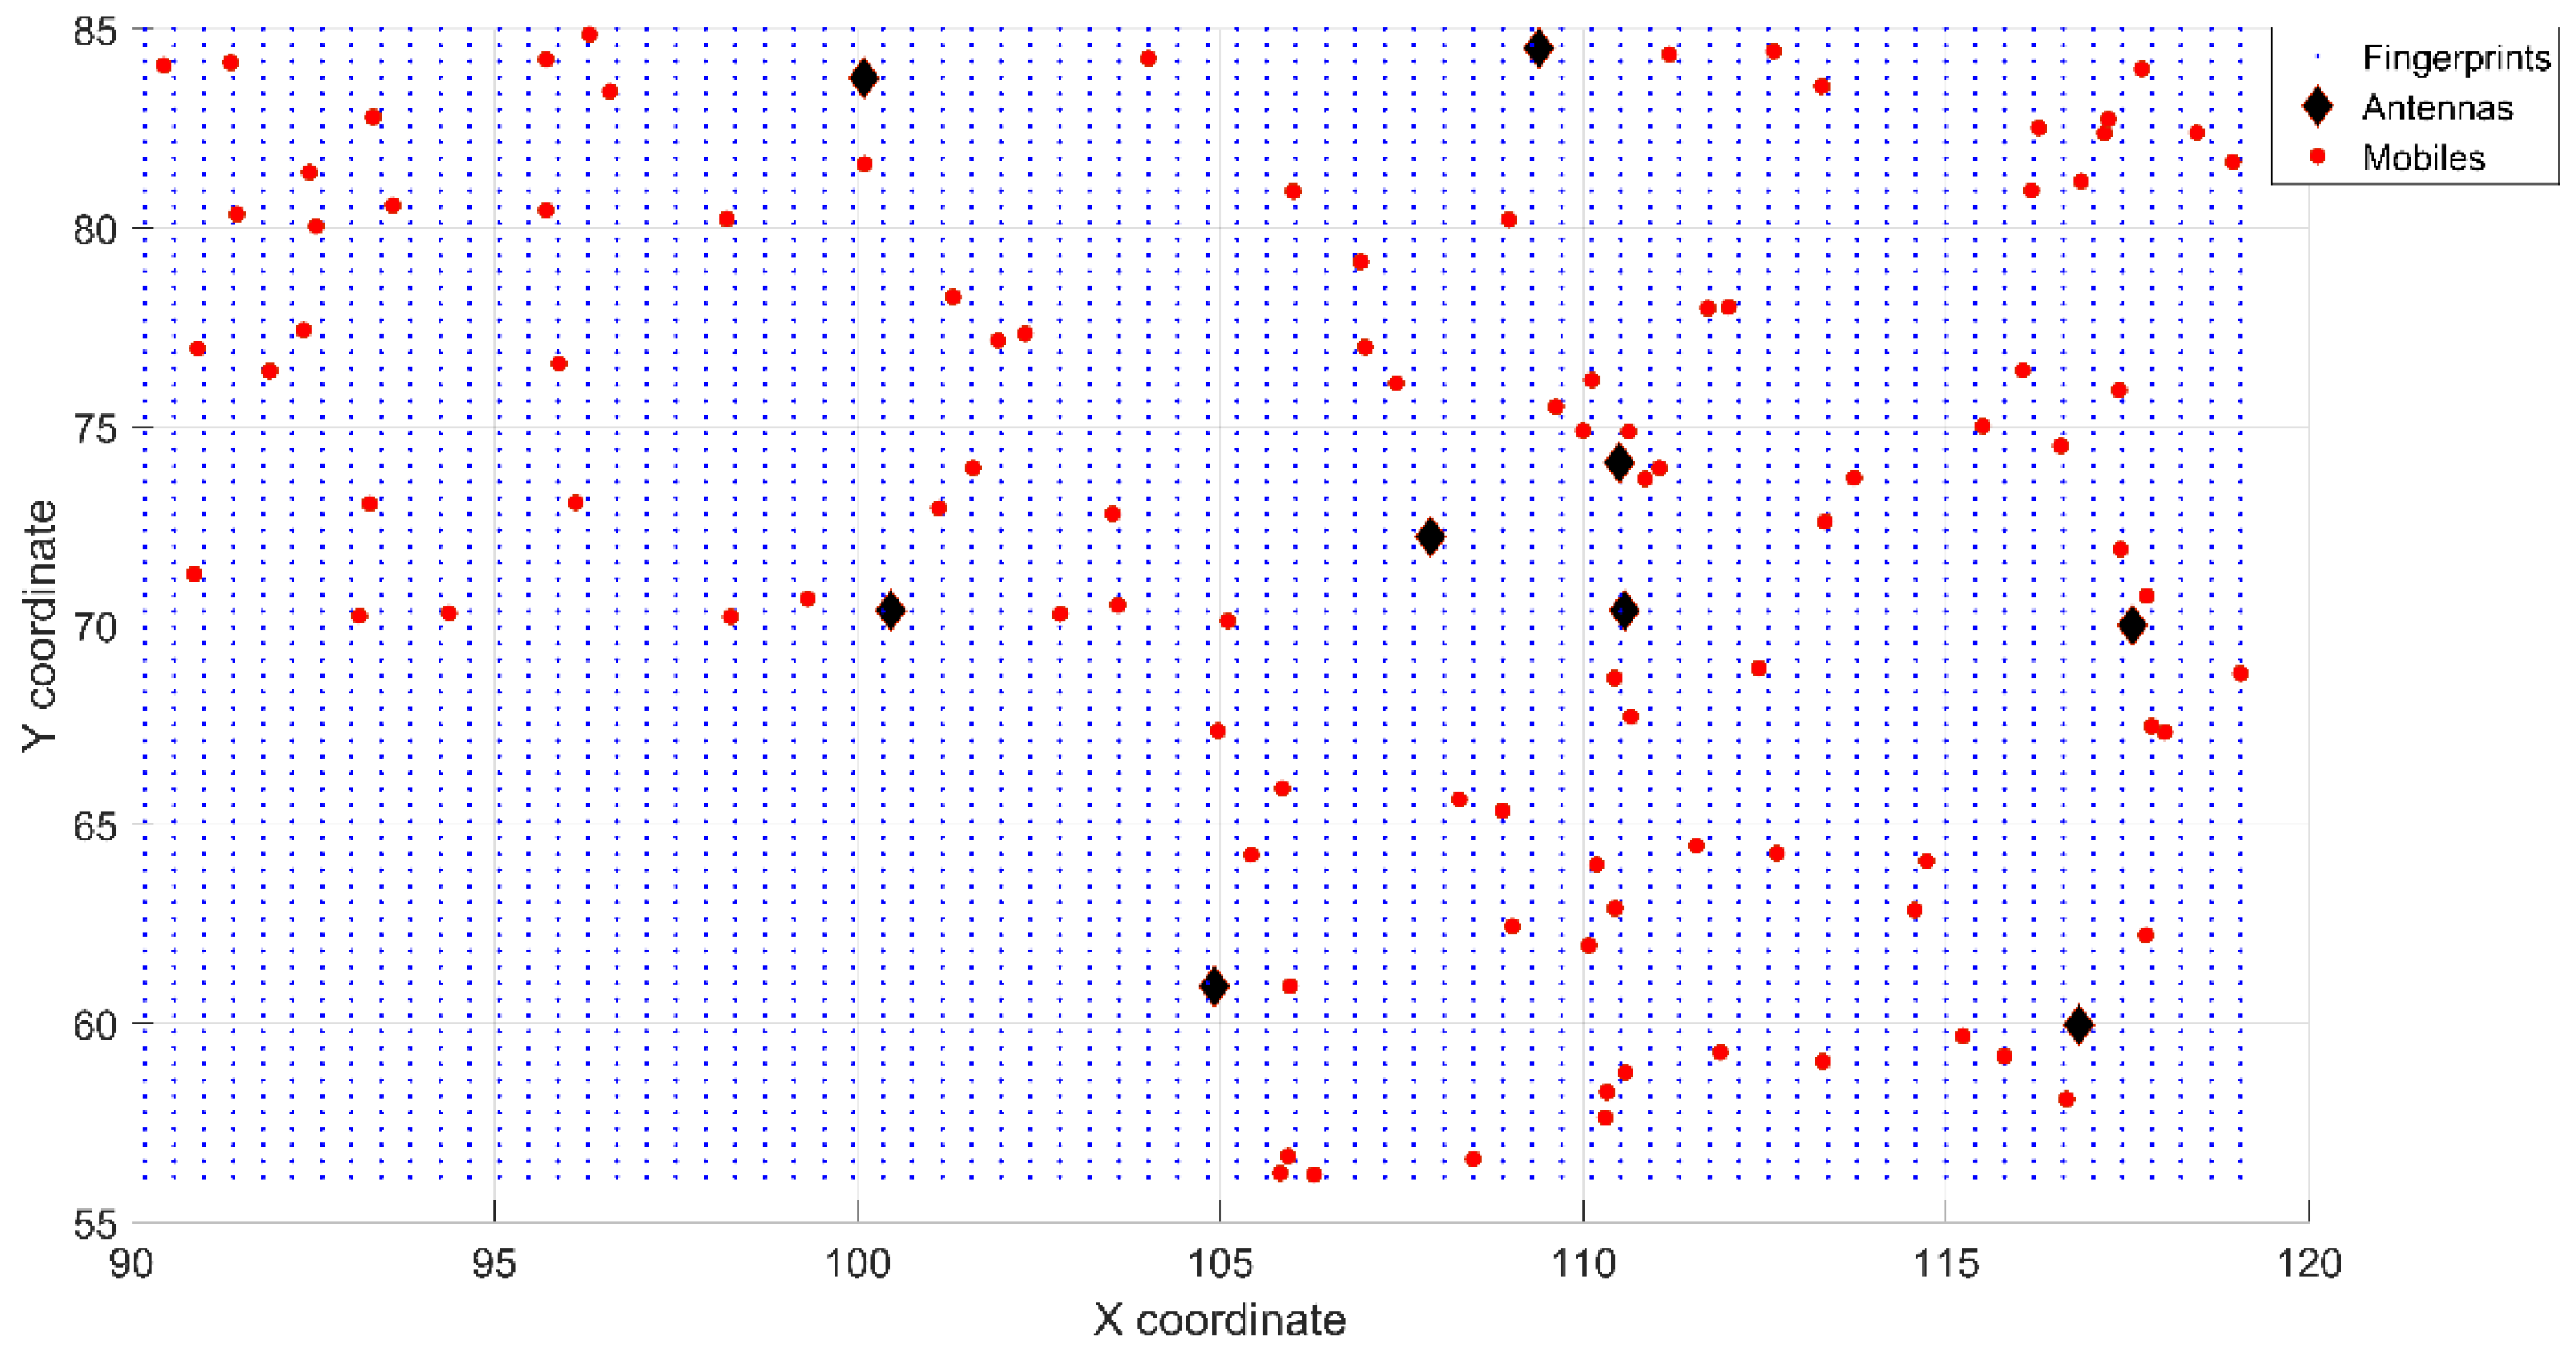
2.6. Fingerprinting Techniques
- Off-line phase: It constitutes the calibration phase in which a database or radio-map is generated with the power measurements obtained on the mesh fingerprinting when excited by the antennas of the environment.
- On-line phase: it constitutes the testing phase; a significant number of mobile stations are randomly located within the coverage area of the radio-map to obtain the corresponding power measurements when excited by the same antennas.
2.7. Summary
3. Novel Localization Techniques
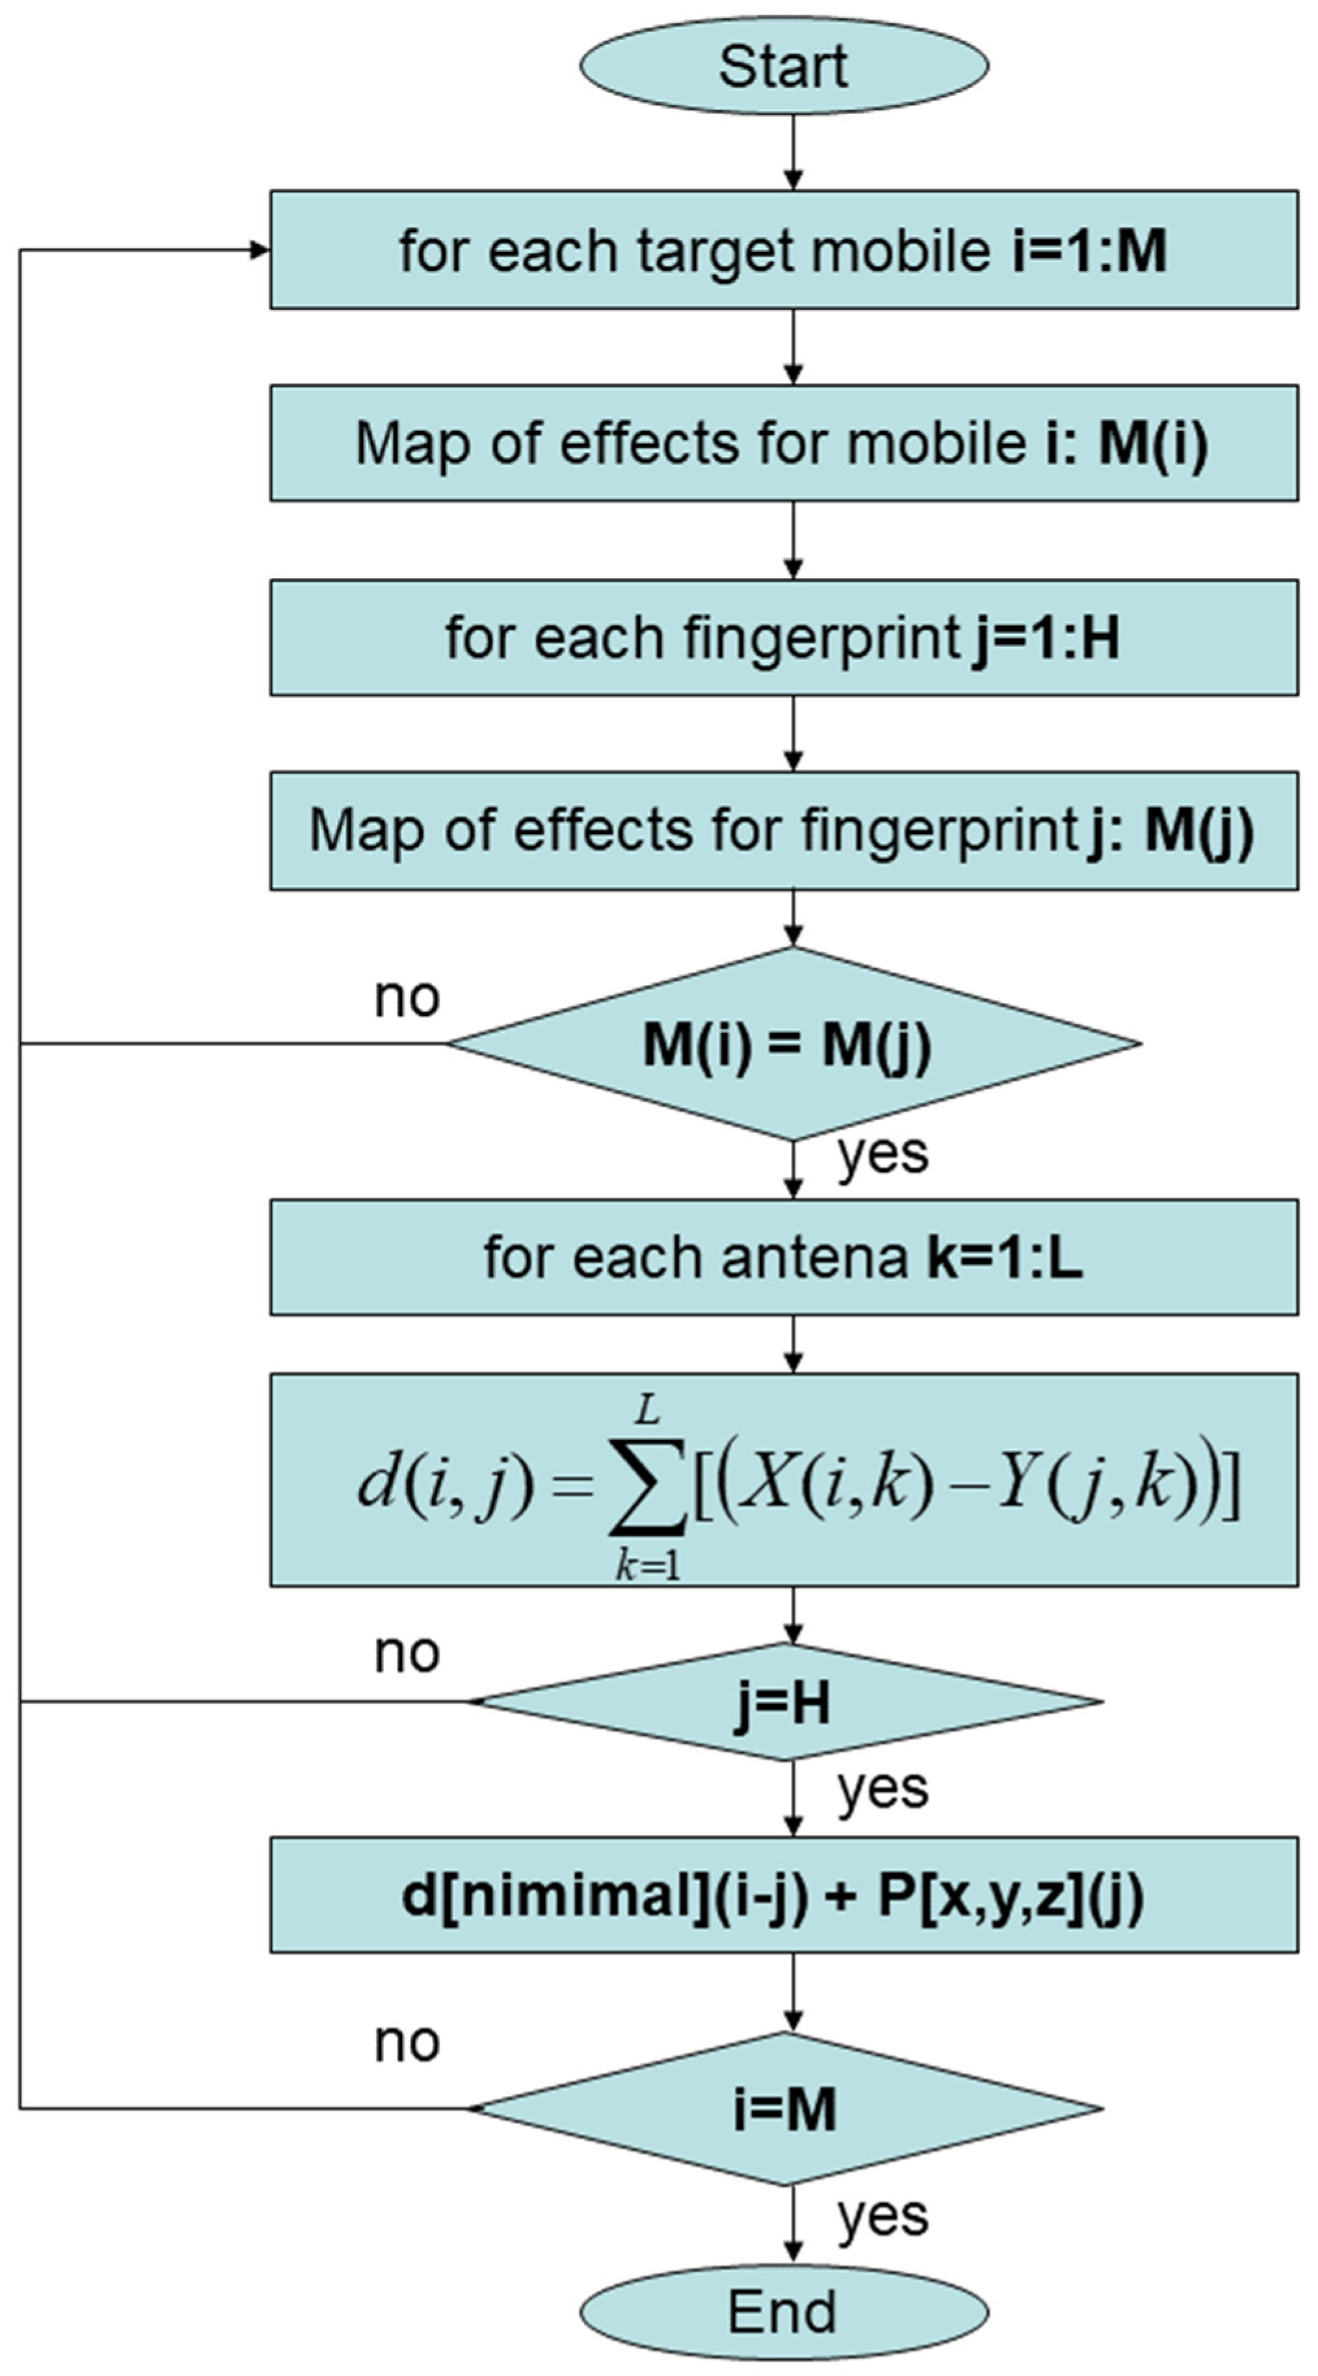
3.1. Distance Metrics
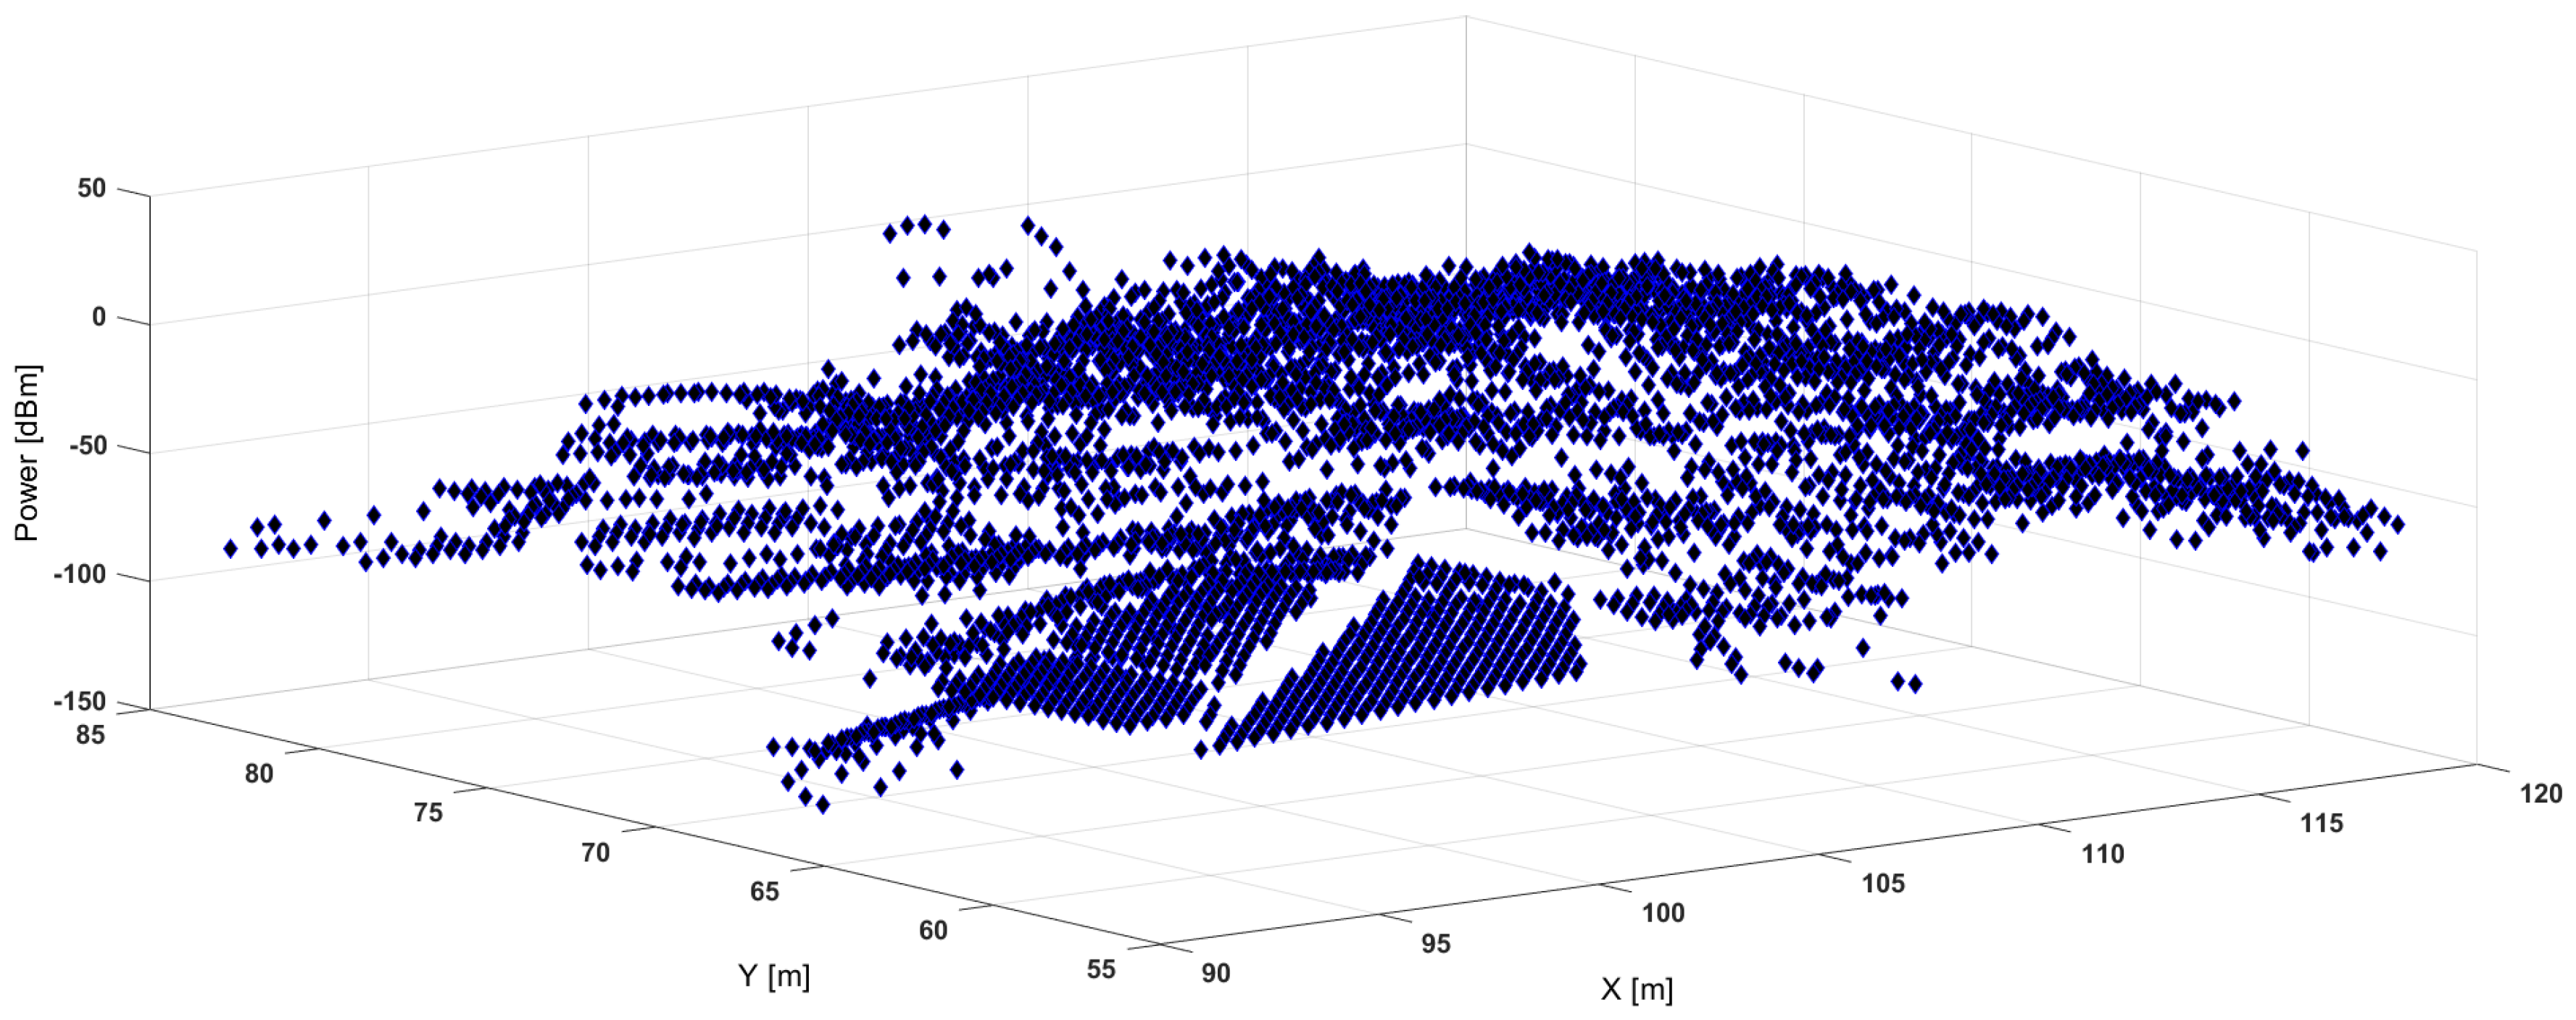
3.2. Cost Function Based on RSSI
3.3. Cost Function Based on Relative Ray-Delay
3.4. Hybrid. Detection
3.5. Interpolation
4. Ray-Tracing Theory
- Obtain all points that define the ray-path (reflection and diffraction points).
- Discard the rays occluded by any part of the geometry to perform the shadowing test.
5. Validations and Results
5.1. Indoor Scenarios
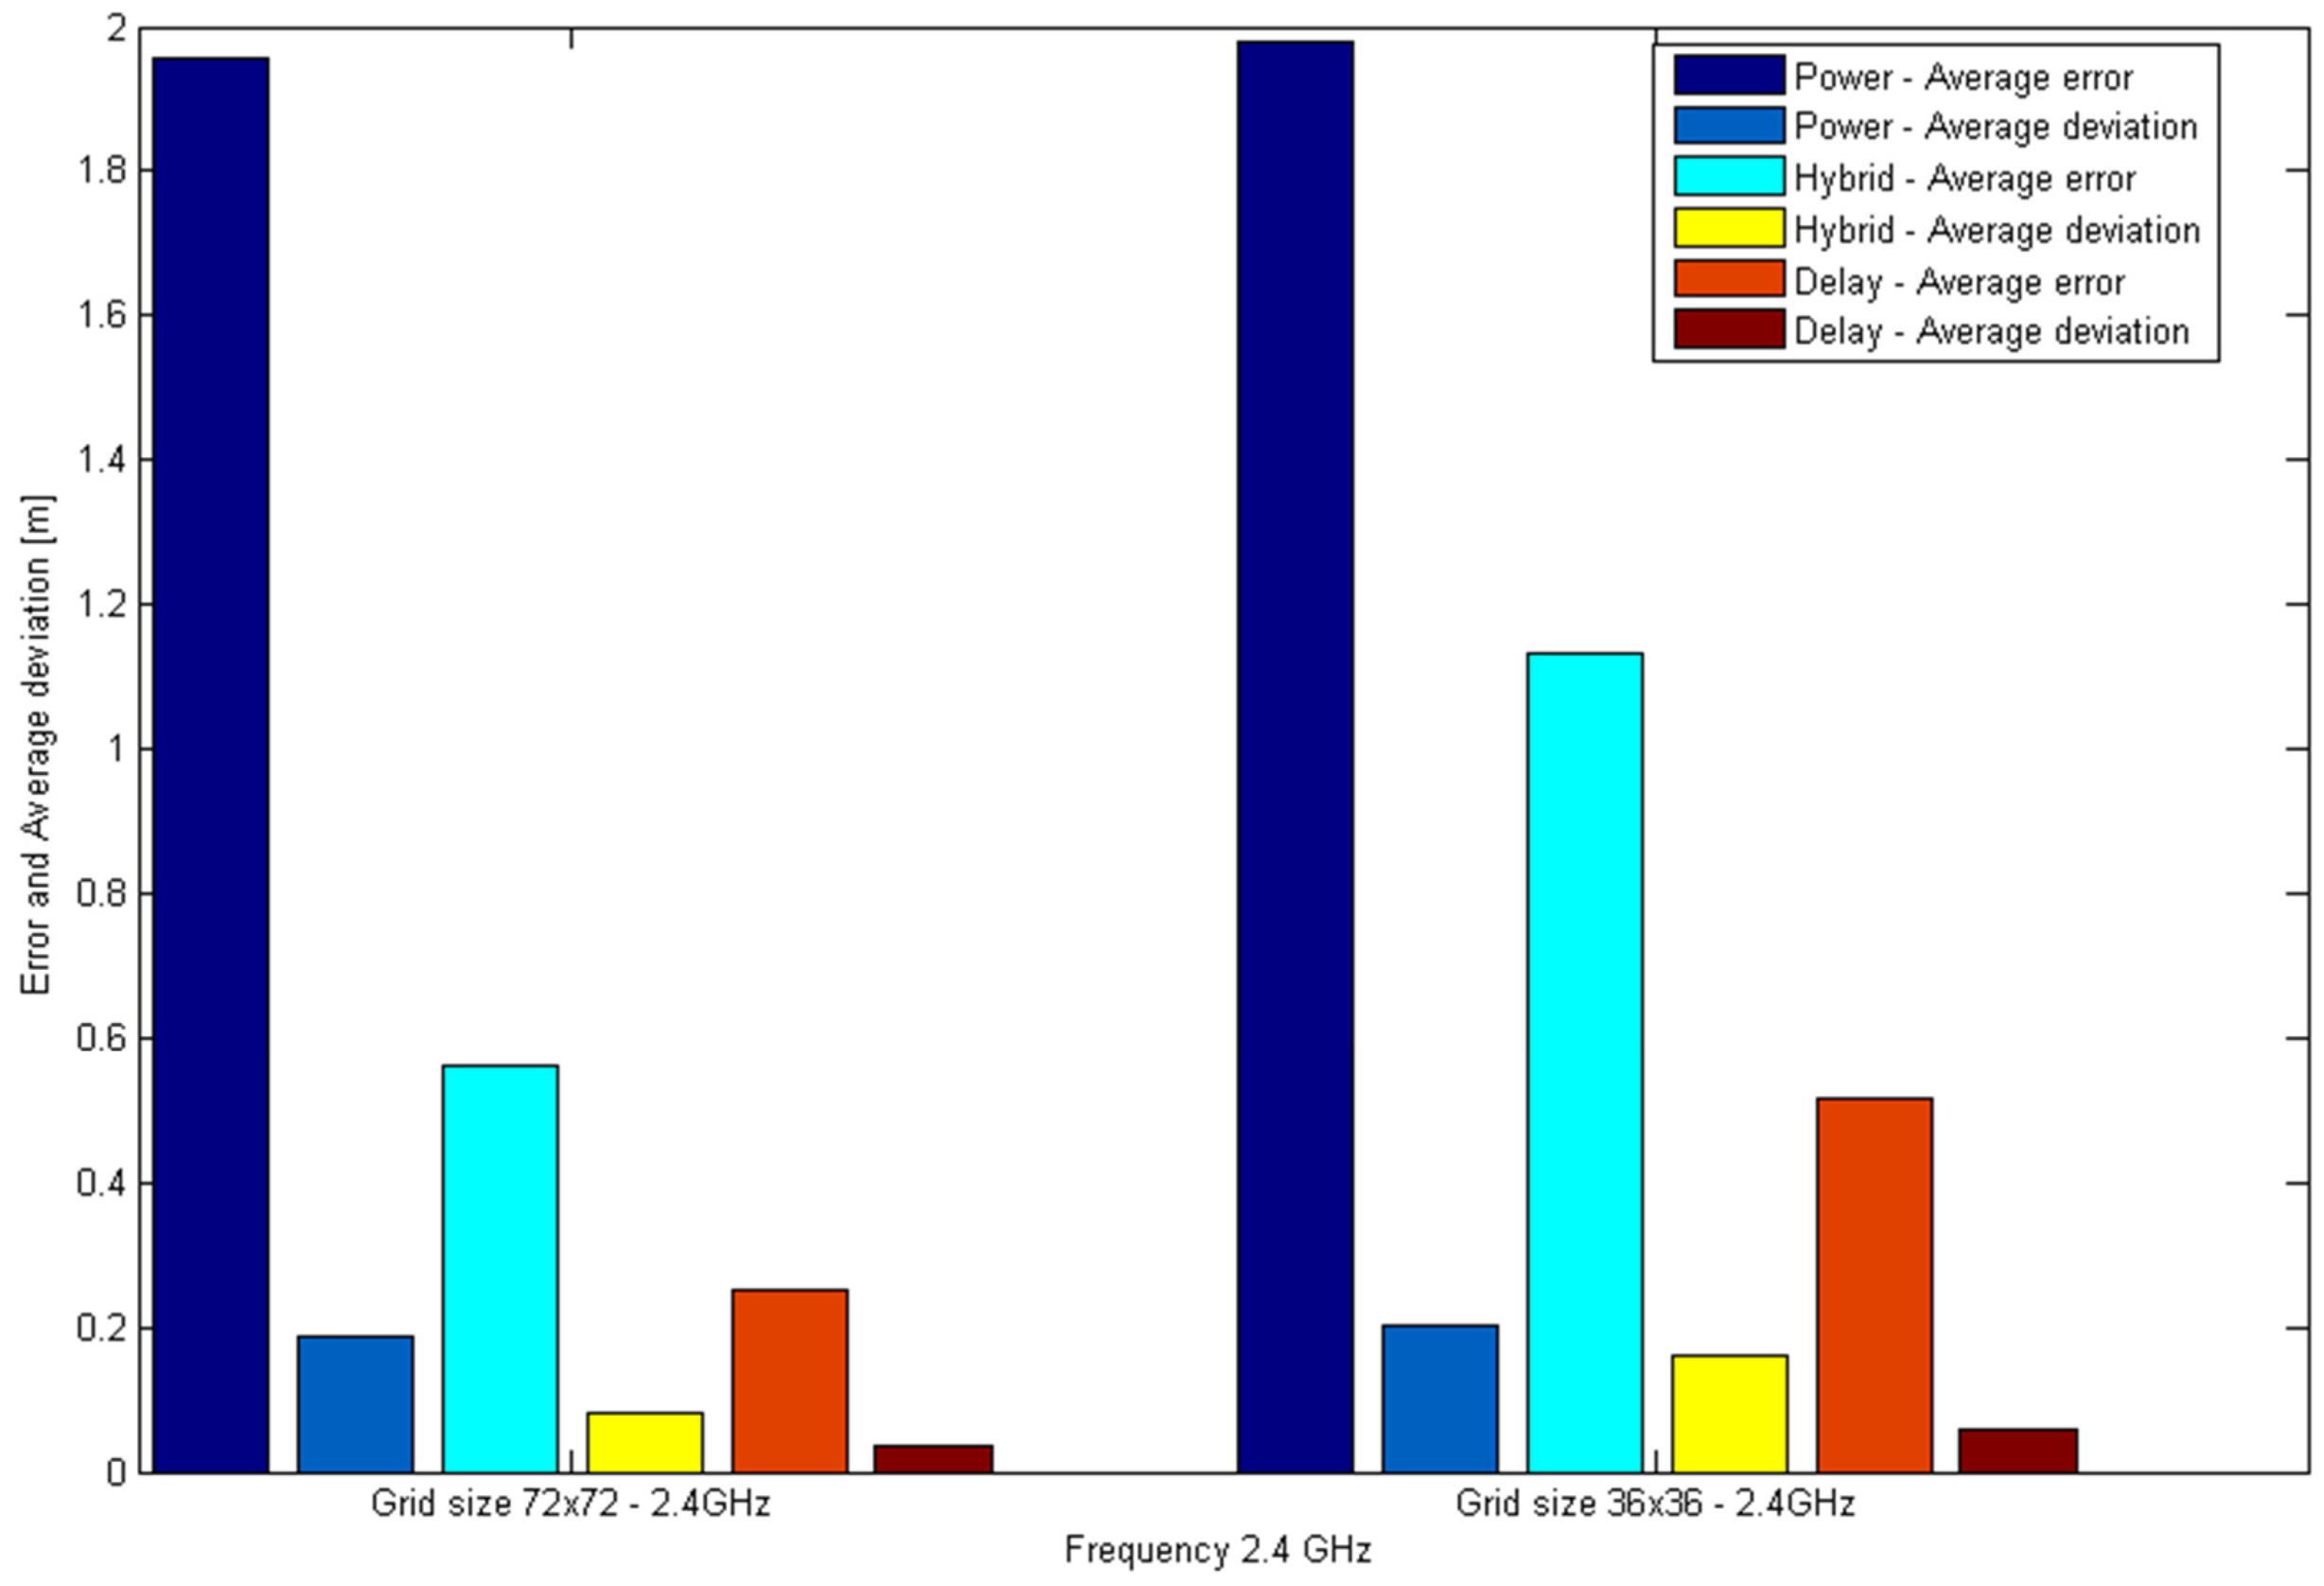
- Grid size of 72 × 72 m with 5184 fingerprints at 2.4 GHz
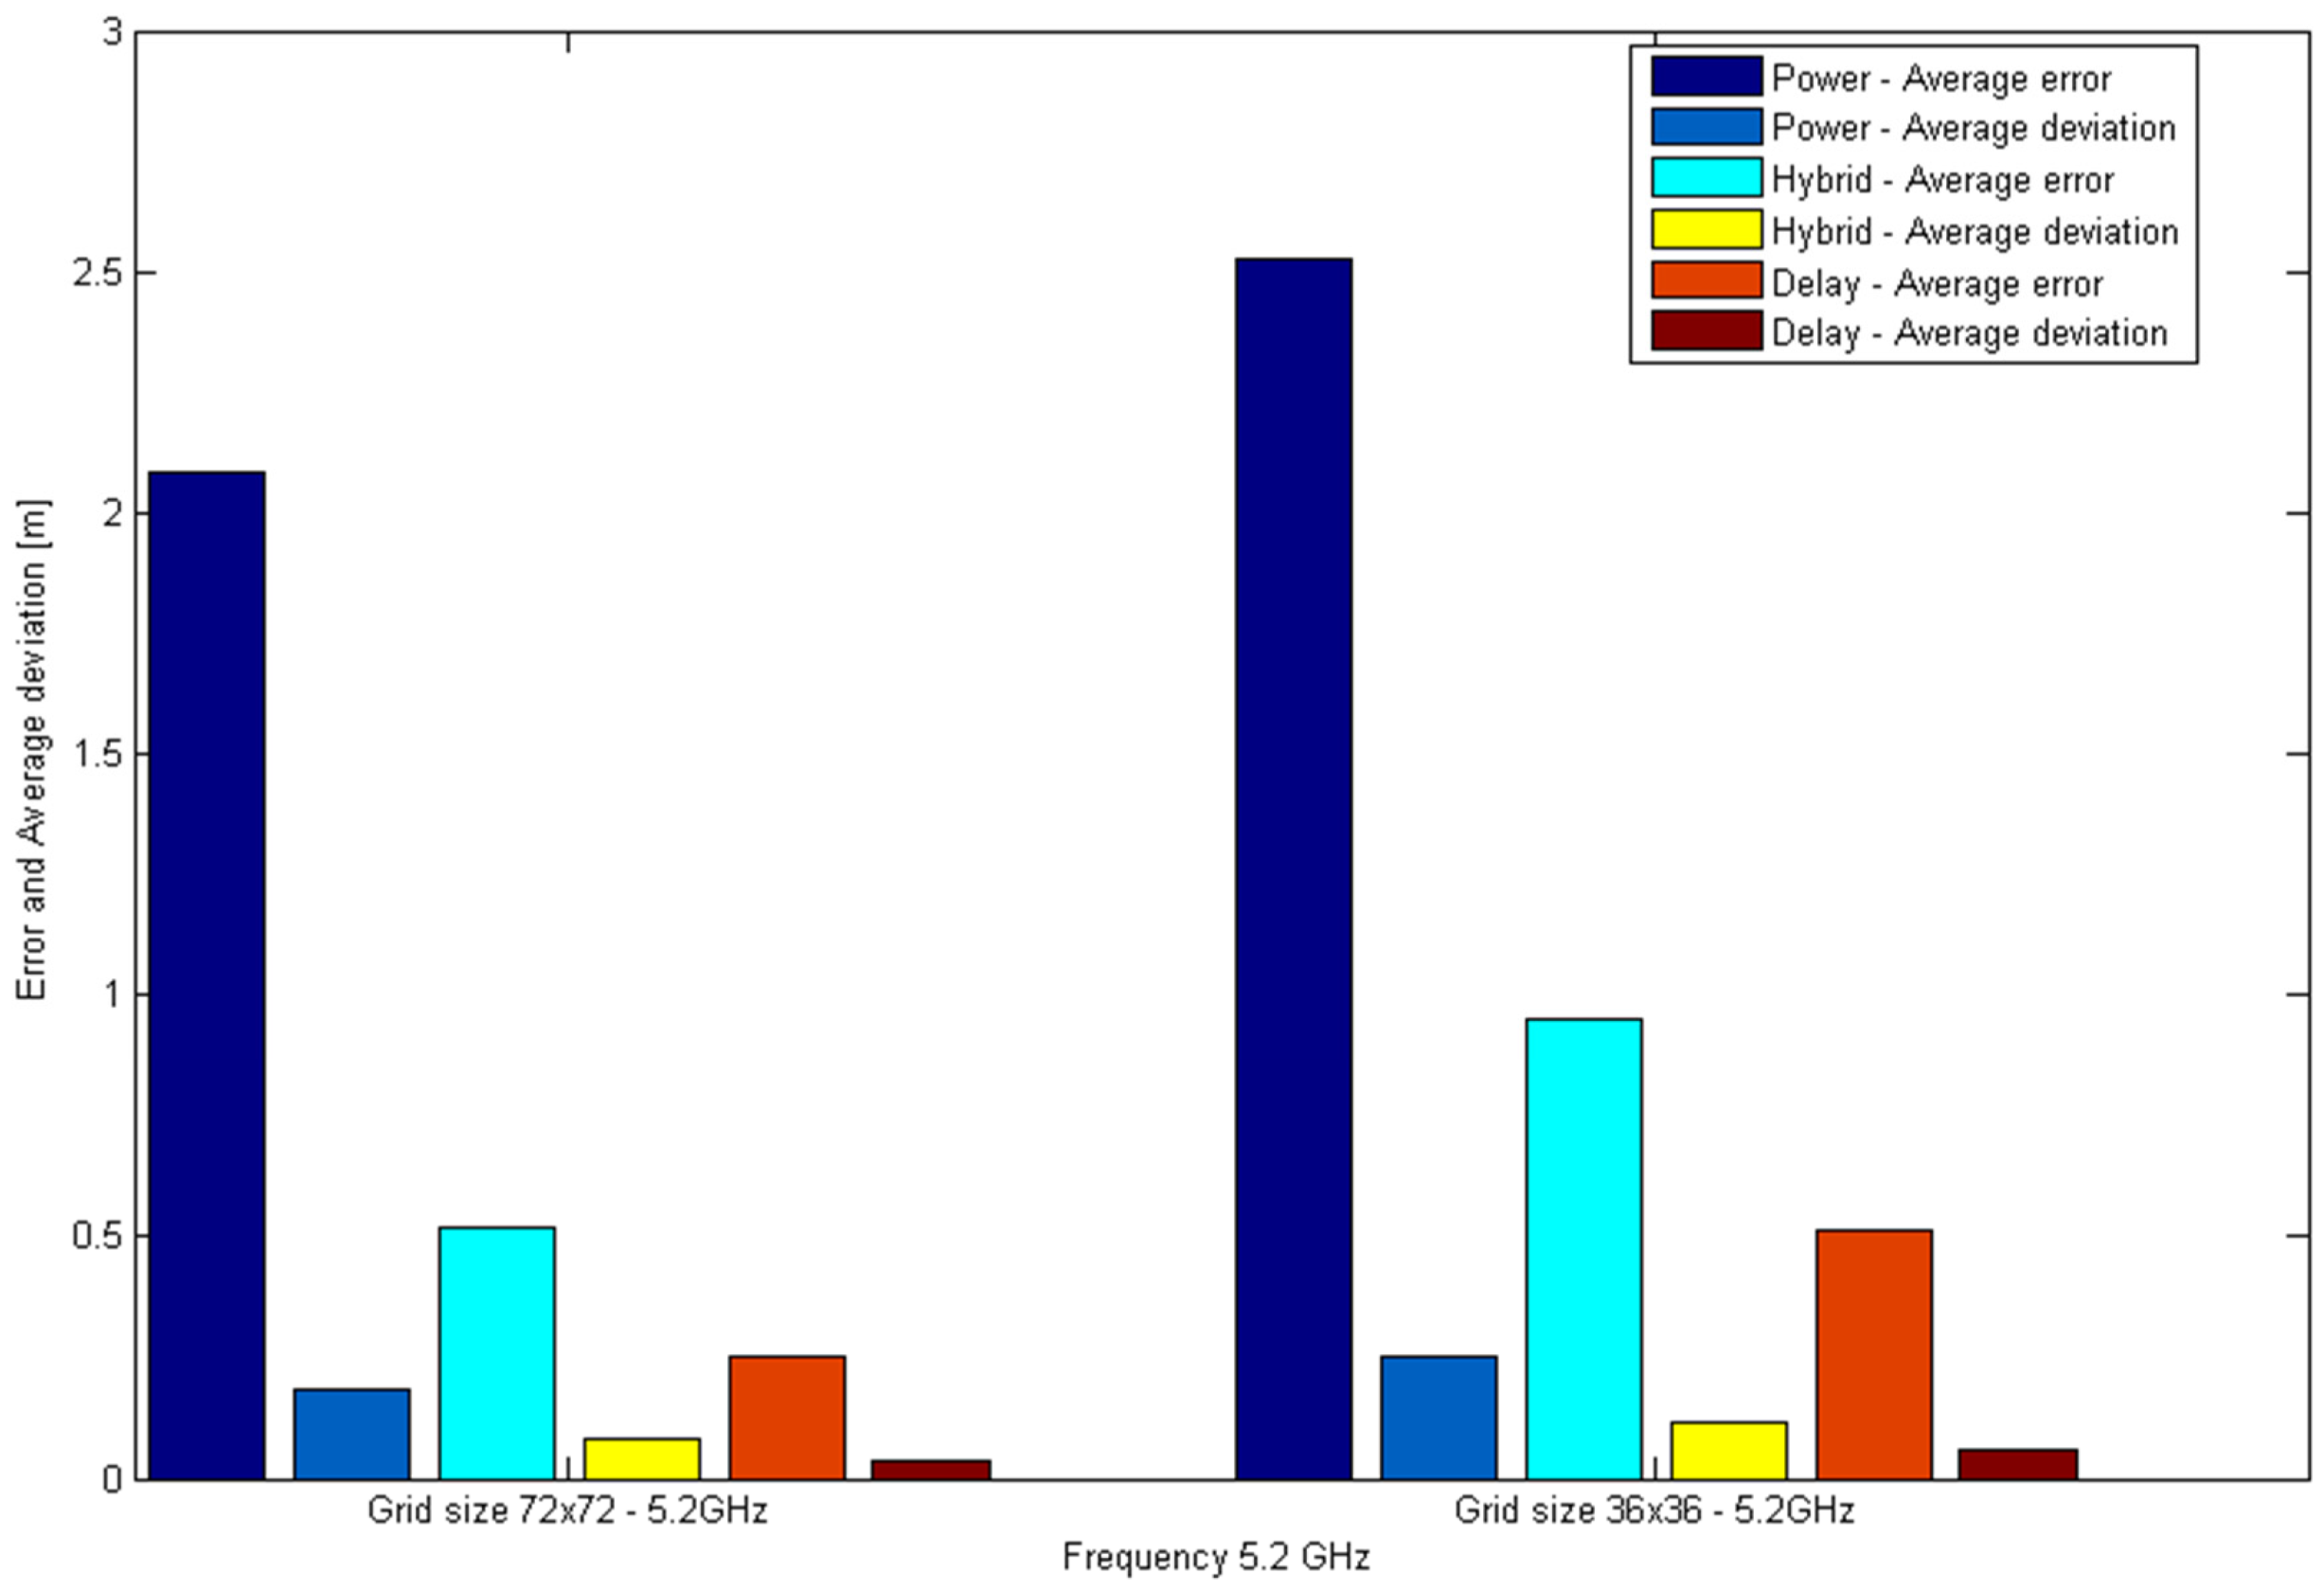
- Grid size of 72 × 72 m with 5184 fingerprints at 5.2 GHz
- Grid size of 36 × 36 m with 1296 fingerprints at 2.4 GHz
- Grid size of 36 × 36 m with 1296 fingerprints at 5.2 GHz
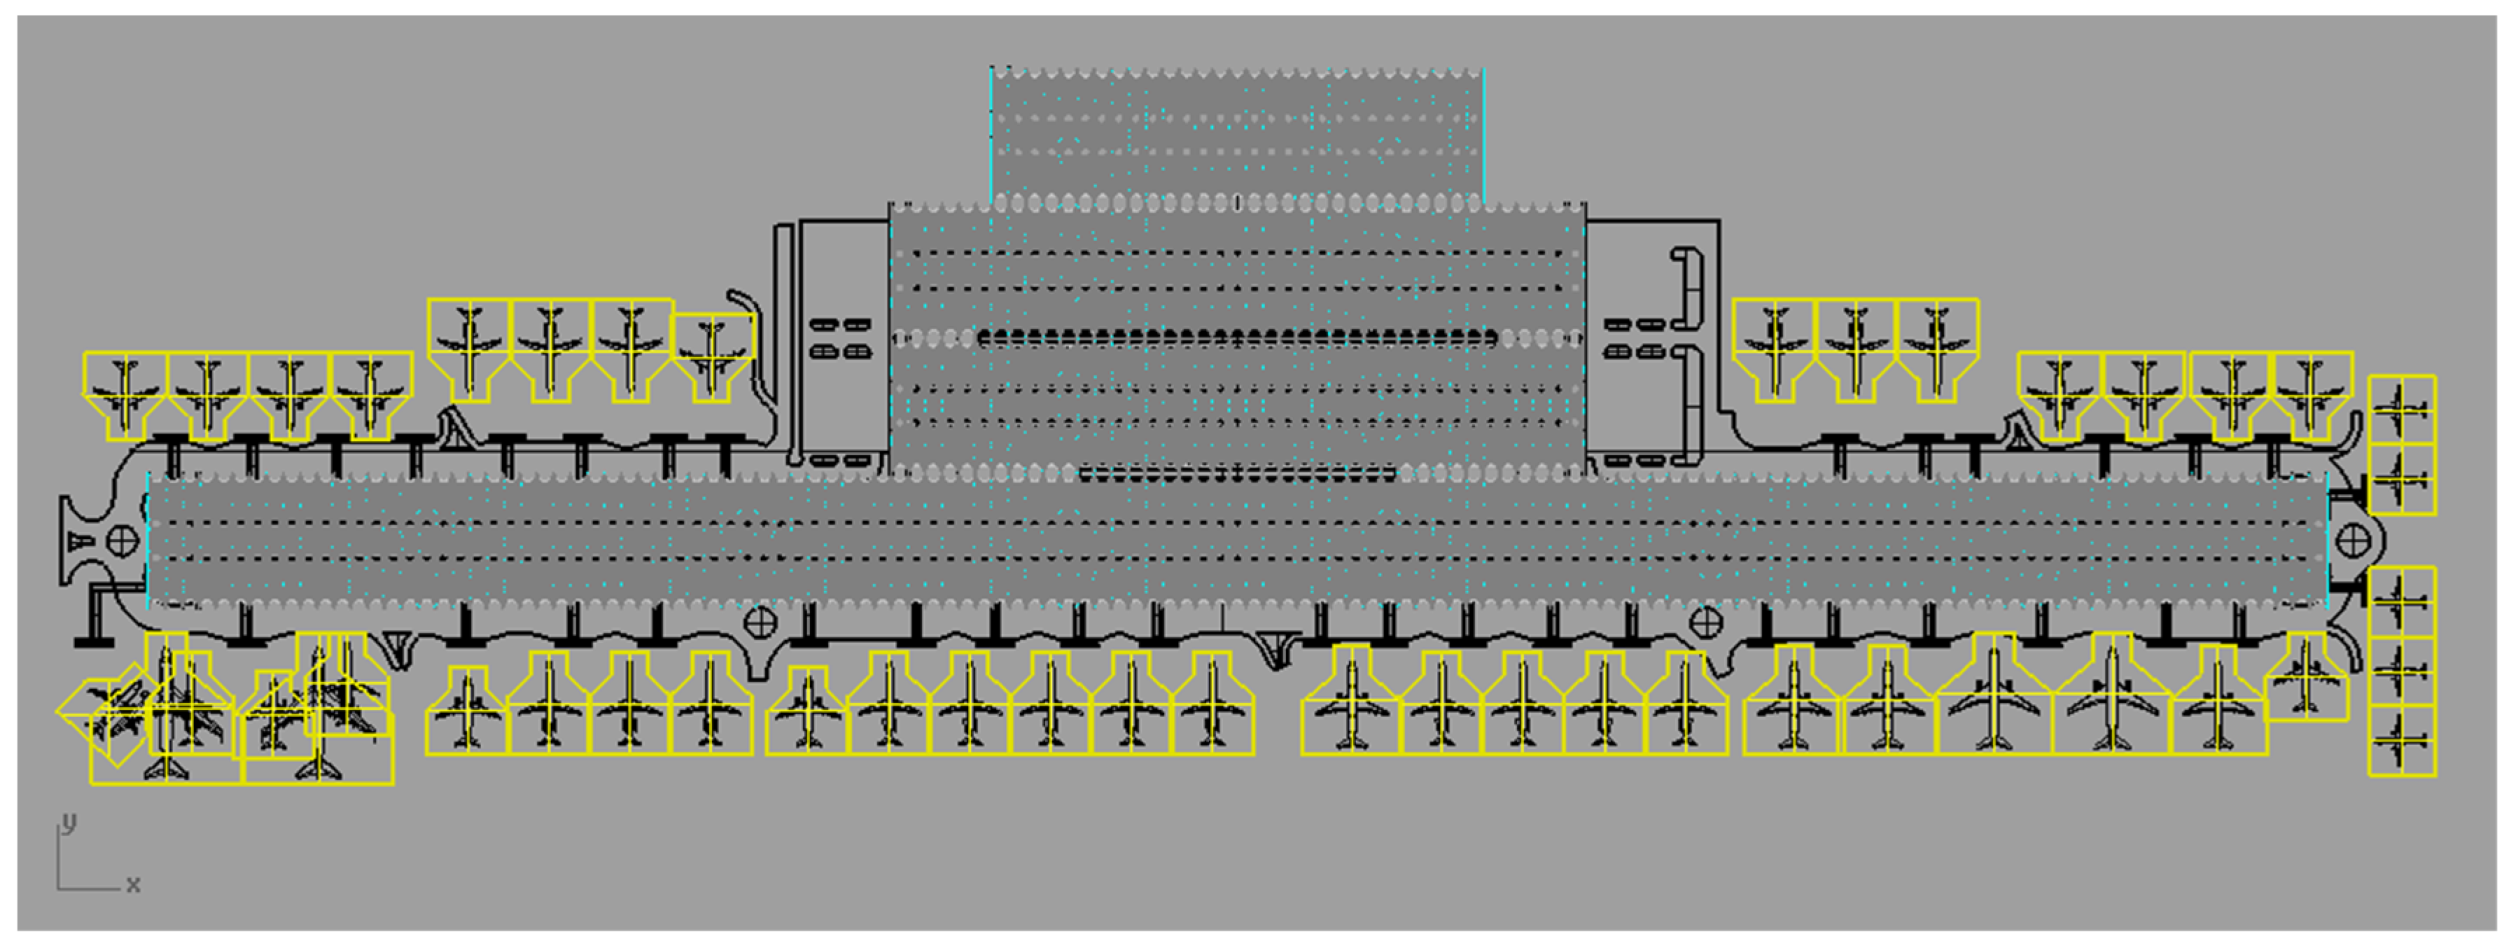
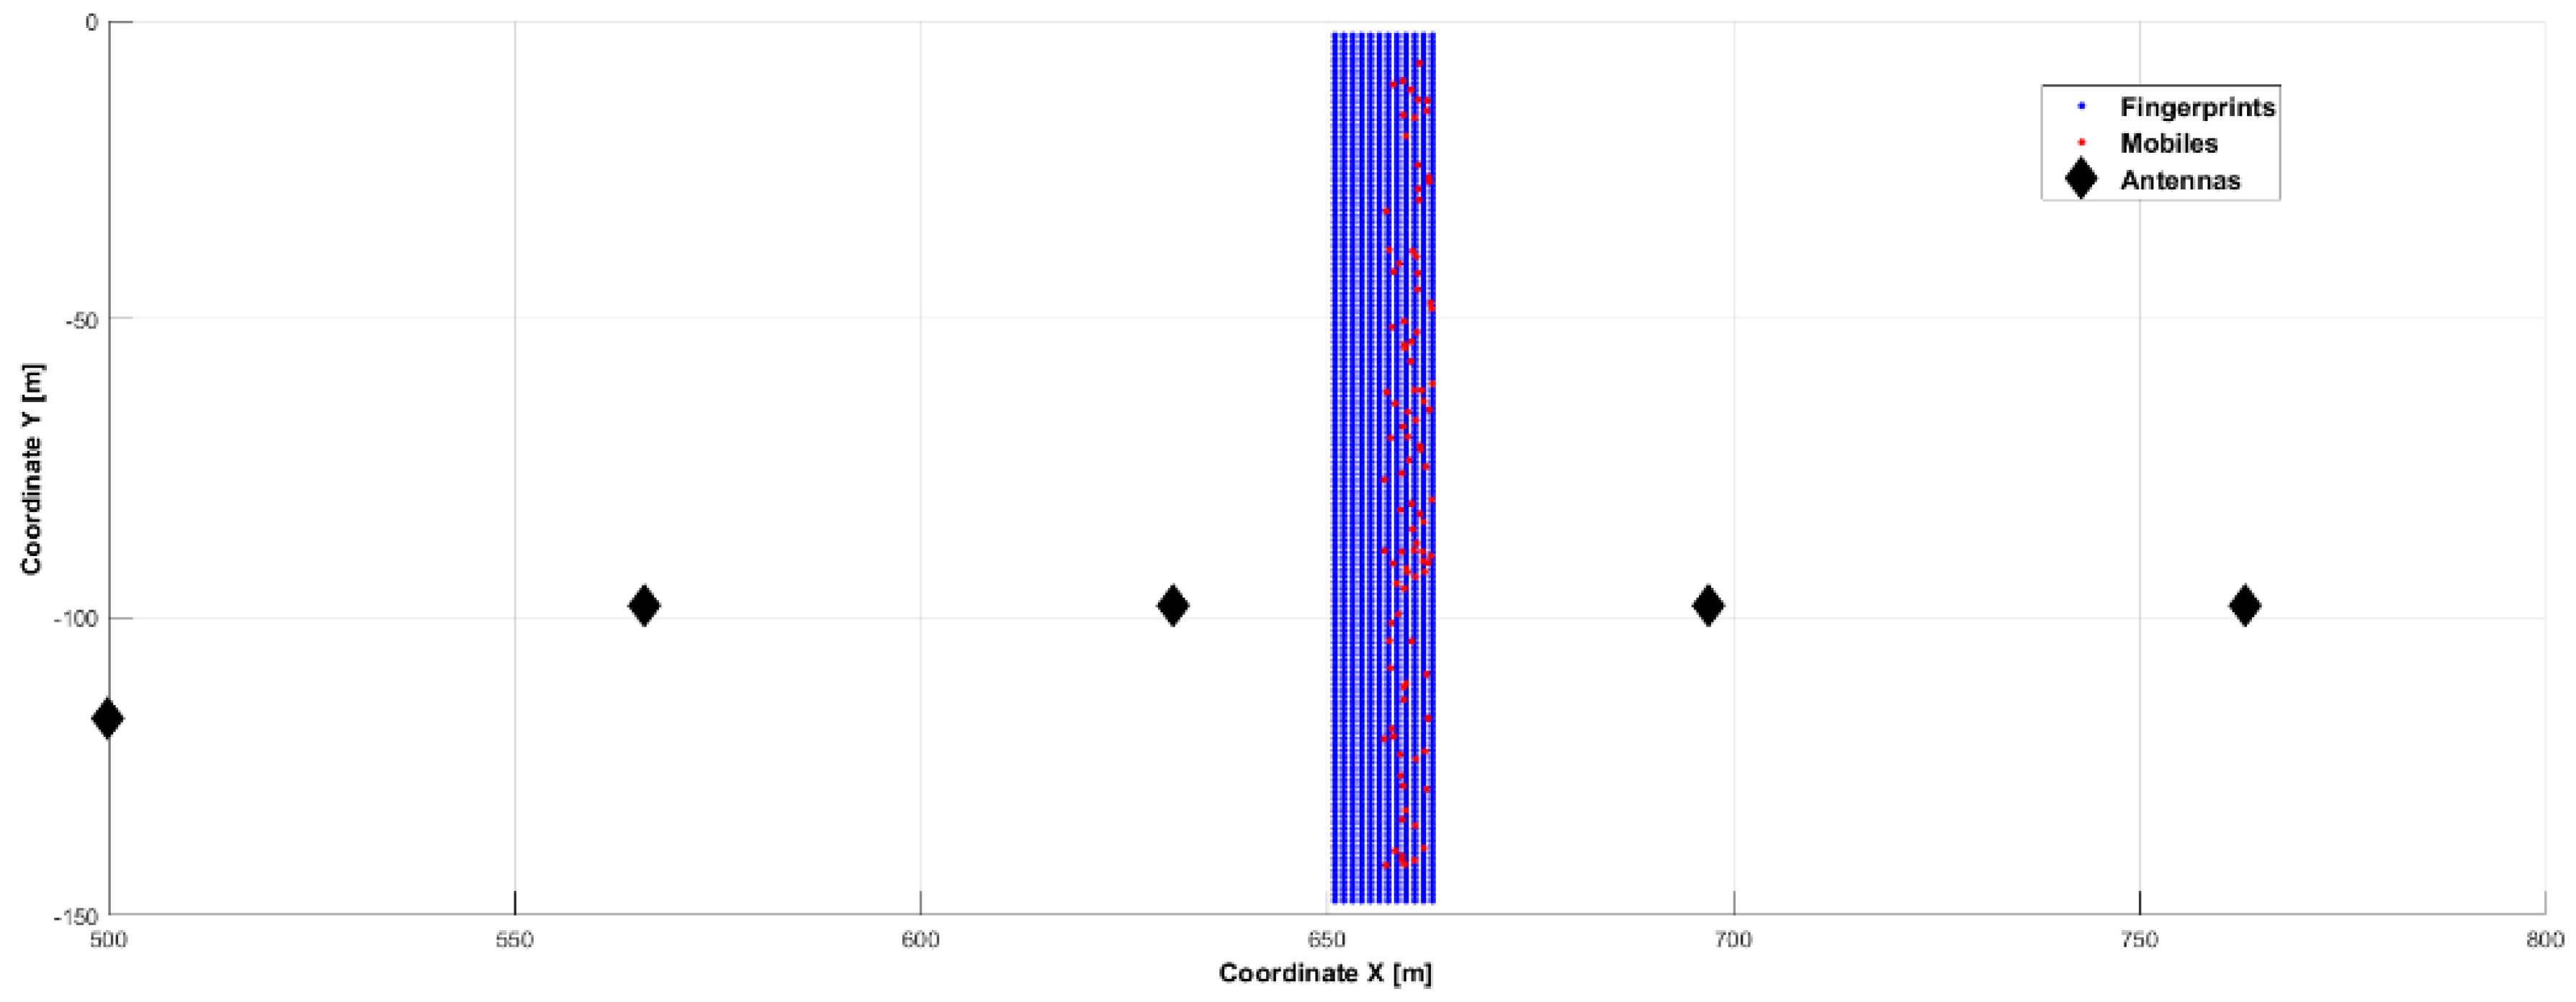
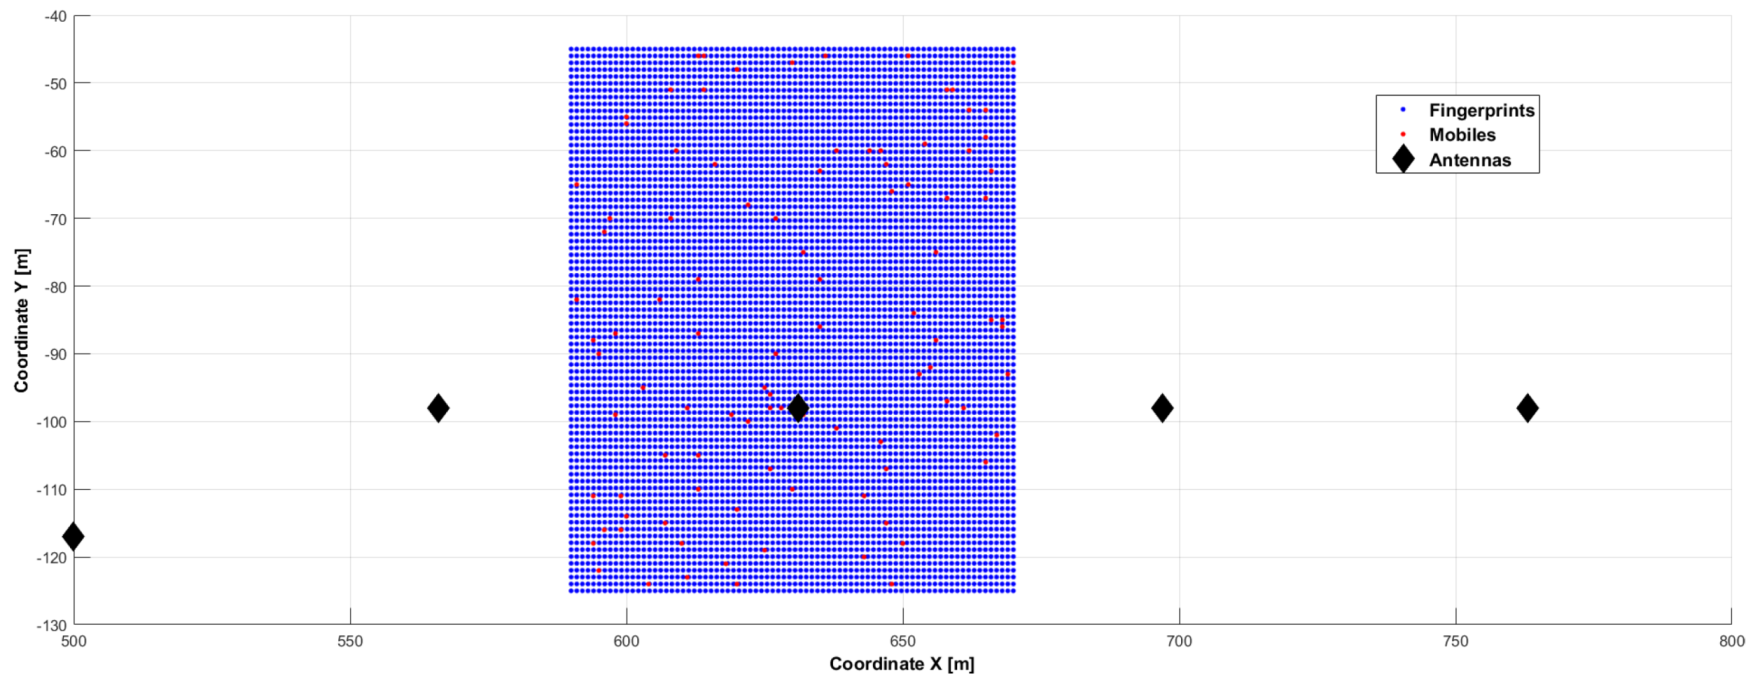
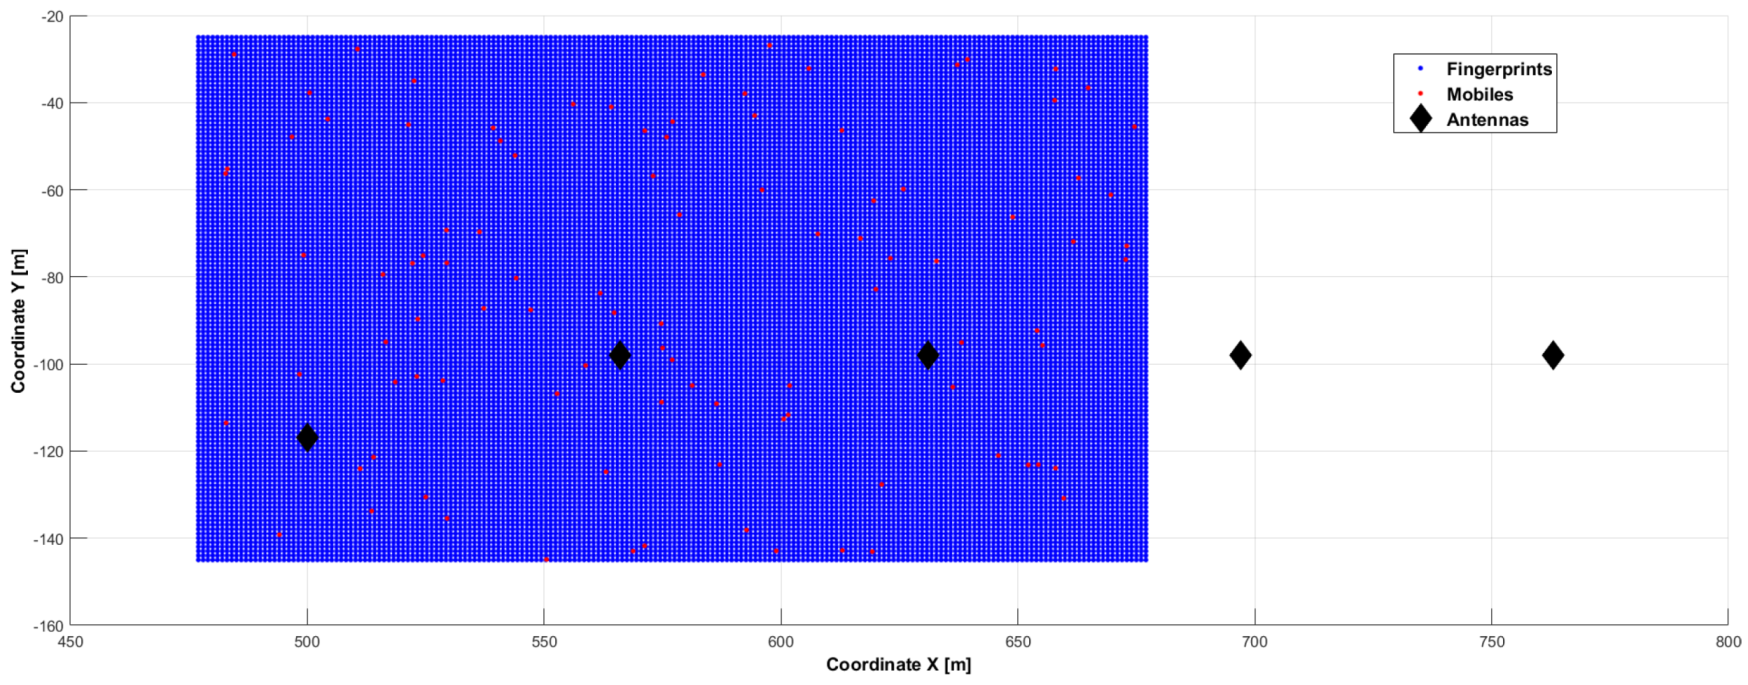
5.2. Outdoor Scenarios
6. Discussion, Assumptions and Further Work
7. Conclusions
Author Contributions
Funding
Conflicts of Interest
References
- Aernouts, M.; Berkvens, R.; Van Vlaenderen, K.; Weyn, M. Sigfox and LoRaWAN datasets for fingerprint localization in large urban and rural areas. Data 2018, 3, 13. [Google Scholar] [CrossRef]
- Guo, X.; Li, L.; Xu, F.; Ansari, N. Expectation maximization indoor localization utilizing supporting set for internet of things. IEEE Internet Things J. 2019, 6, 2573–2582. [Google Scholar] [CrossRef]
- Ciftler, B.; Kadri, A.; Guevenc, I. IoT localization for bistatic passive UHF RFID systems with 3-D radiation pattern. IEEE Internet Things J. 2017, 4, 905–916. [Google Scholar] [CrossRef]
- Ko, H.; Ko, I.; Lee, D. Multi-criteria matrix localization and integration for personalized collaborative filtering in IoT environments. Multimed. Tools Appl. 2018, 77, 4697–4730. [Google Scholar] [CrossRef]
- Hu, E.; Deng, Z.; Hu, M.; Yin, L.; Liu, W. Cooperative indoor positioning with factor graph based on FIM for wireless sensor network. Future Gener. Comput. Syst. 2018, 89, 126–136. [Google Scholar] [CrossRef]
- Kumar, S.; Chaurasiya, V. A multisensor data fusion strategy for path selection in internet-of-things oriented wireless sensor network (WSN). Concurr. Comput. Pract. Exp. 2018, 30, e4477. [Google Scholar] [CrossRef]
- Shit, R.C.; Sharma, S.; Puthal, D.; Zomaya, A.Y. Location of things (LoT): A review and taxonomy of sensors localization in IoT infrastructure. IEEE Commun. Surv. Tutor. 2018, 20, 2028–2061. [Google Scholar] [CrossRef]
- Sotenga, P.Z.; Djouani, K.; Kurien, A.M.; Mwila, M.M. Indoor localization of wireless sensor nodes towards internet of things. Procedia Comput. Sci. 2017, 109, 92–99. [Google Scholar] [CrossRef]
- Wang, J.; Bolic, M. Indoor localization using augmented ultra-high-frequency radio frequency identification system for Internet of Things. Int. J. Distrib. Sens. Netw. 2017, 13, 1550147717739814. [Google Scholar] [CrossRef]
- Pedro, F.; Villa, K.; Elena, S. Wireless positioning in IoT: A look at current and future trends. Sensor 2018, 18, 2470. [Google Scholar]
- Molina, B.; Olivares, E.; Palau, C.E.; Esteve, M. A multimodal fingerprint-based indoor positioning system for airports. IEEE Access 2018, 6, 10092–10106. [Google Scholar] [CrossRef]
- Chen, L.; Thombre, S.; Järvinen, K.; Lohan, E.S.; Alén-Savikko, A.; Leppäkoski, H.; Bhuiyan, M.Z.; Bu-Pasha, S.; Ferrara, G.N.; Honkala, S.; et al. Robustness, security and privacy in location-based services for future IoT: A survey. IEEE Access 2017, 5, 8956–8977. [Google Scholar] [CrossRef]
- Sadowski, S.; Spachos, P. RSSI-based indoor localization with the internet of things. IEEE Access 2018, 6, 30149–30161. [Google Scholar] [CrossRef]
- Peng, L.; Dhaini, A.; Ho, P. Toward integrated cloud-fog networks for efficient IoT provisioning: Key challenges and solutions. Future Gener. Comput. Syst. 2018, 88, 606–613. [Google Scholar] [CrossRef]
- Saurabh, K.; Mukesh, A. Even localization in the internet of things environment. In Proceedings of the 7th International Conference on Advances in Computing and Communications, Cochin, India, 22–24 August 2017. [Google Scholar]
- Park, C.; Chang, J. Robust TOA source localization algorithm using prior location. IET 2019, 13, 384–391. [Google Scholar]
- Chen, H.; Ansari, N. Improved robust TOA-based localization via NLOS balancing parameter estimation. IEEE Trans. Veh. Technol. 2019, 68, 6177–6181. [Google Scholar] [CrossRef]
- Bellili, F.; Ben, A.; Affes, S.; Ghrayeb, A. Maximum likelihood joint angle and delay estimation from multipath and multicarrier transmissions with application to indoor localization over IEEE 802.11ac radio. IEEE Trans. Mob. Comput. 2019, 18, 1116–1132. [Google Scholar] [CrossRef]
- Alebrahim, M.; Zarka, N.; Orabi, M.; Dlaikan, S. GSM Navigation Techniques. 2015. Available online: https://www.researchgate.net/publication/288180429_GSM_Navigation_Techniques (accessed on 30 July 2019).
- Zhang, Y.; Zhang, L.; Han, J.; Ban, Z.; Yang, Y. An indoor gas leakage source localization algorithm using distributed maximum likelihood estimation in sensor networks. J. Ambient Intell. Humaniz. Comput. 2017, 10, 1703–1712. [Google Scholar]
- Sahlli, E.; Ismail, M.; Nordin, R.; Abdulah, N. Beamforming techniques for massive MIMO systems in 5G: Overview, classification, and trends for future research. Front. Inf. Technol. Electron. Eng. 2017, 18, 753–772. [Google Scholar]
- Gong, W.; Liu, J. RoArray: Towards more robust indoor localization using sparse recovery with commodity WIFI. IEEE Trans. Mob. Comput. 2018, 18, 1380–1392. [Google Scholar] [CrossRef]
- Gomez, J.; Cejudo, S.; Gonzalez, I.; Catedra, F. Application of high frequencies techniques for location systems. In Proceedings of the International Symposium on Electromagnetic Theory, Ottawa, ON, Canada, 26–28 July 2007. [Google Scholar]
- Huang, Y.; Hsu, Y. Indoor localization with adaptive channel model estimation in WiFi networks. In Proceedings of the International Conference on Mobile and Wireless Technology, Hong Kong, China, 25–27 June 2019. [Google Scholar]
- Krishnamurthy, P. WiFi Location Fingerprinting. In Advanced Location-Based Technologies and Services; Karimi, H.A., Ed.; CRC Press, University of Pittsburgh: Pittsburgh, PA, USA, 2017. [Google Scholar]
- Oguejiofor, O. Outdoor localization system using RSSI measurement of wireless sensor network. Int. J. Innov. Technol. Explor. Eng. 2013, 2, 1–6. [Google Scholar]
- Huang, H.; Lin, B.; Feng, L.; Lv, H. Hybrid indoor localization scheme with image sensor-based visible light positioning and pedestrian dead reckoning. Appl. Opt. 2019, 58, 3214. [Google Scholar] [CrossRef] [PubMed]
- Zhao, Y.; Zhou, H.; Li, M.; Kong, R. Implementation of indoor positioning system based on location fingerprinting in wireless networks. In Proceedings of the 4th International Conference on Wireless Communications, Networking and Mobile Computing, Dalian, China, 12–14 October 2008. [Google Scholar]
- Kaemarungsi, K.; Krishnamurthy, P. Properties of indoor received signal strength for wlan location fingerprinting. In Proceedings of the First Annual International Conference on Mobile and Ubiquitous Systems: Networking and Services (MOBIQUITOUS 2004), Boston, MA, USA, 26 August 2004. [Google Scholar]
- Lemelson, H.; Kjaergaard, M.; Hansen, R.; King, T. Error estimation for indoor 802.11 location fingerprinting. In Proceedings of the International Symposium on Location- and Context-Awareness, Tokyo, Japan, 7–8 May 2009. [Google Scholar]
- Martín, H.; Tarrío, P.; Bernardos, A.M.; Casar, J.R. Experimental Evaluation of Channel Modelling and Fingerprinting Localization Techniques for Sensor Networks. In Advances in Soft Computing, Proceedings of the International Symposium on Distributed Computing and Artificial Intelligence, 22–24 October 2009; Corchado, J.M., Rodríguez, S., Llinas, J., Molina, J.M., Eds.; Springer: Berlin/Heidelberg, Germany, 2009. [Google Scholar]
- Zhao, Y.; Zhou, H.; Li, M. A novel overlap area matching algorithm based on location fingerprinting in wireless networks. In Proceedings of the 5th International Conference on Wireless Communications, Networking and Mobile Computing, Beijing, China, 24–26 September 2009. [Google Scholar]
- Sertthin, C.; Fujii, T.; Ohtsuki, T.; Nakagawa, M. Multi-band received signal strength fingerprinting based indoor location system. IEICE Trans. Commun. 2010, 93, 1993–2003. [Google Scholar] [CrossRef]
- Arya, A.; Godlewski, P.; Melle, P. Performance analysis of outdoor localization systems based on RSS fingerprinting. In Proceedings of the 6th International Symposium on Wireless Communication Systems, Tuscany, Italy, 7–10 September 2009. [Google Scholar]
- Kaemarungsi, K. Efficient design of indoor positioning systems based on location fingerprinting. In Proceedings of the International Conference on Wireless Networks, Communications and Mobile Computing, Maui, HI, USA, 13–16 June 2005. [Google Scholar]
- Kaemarungsi, K.; Krishnamurthy, P. Modeling of indoor positioning systems based on location fingerprinting. In Proceedings of the IEEE INFOCOM 2004, Hong Kong, China, 7–11 March 2004. [Google Scholar]
- Wu, Y.; Chen, P.; Gu, F.; Zheng, X.; Shang, J. HTrack: An efficient heading-aided map matching for indoor localization and tracking. IEEE Sens. J. 2019, 19, 3100–3110. [Google Scholar] [CrossRef]
- Stella, M.; Russo, M.; Begusic, D. Location determination in indoor environment based on RSS fingerprinting and artificial neural network. In Proceedings of the 9th International Conference on Telecommunications, Zagreb, Croatia, 13–15 June 2007. [Google Scholar]
- Farivar, R.; Wiczer, D.; Gutierrez, A.; Campbell, R. A statistical study on the impact of wireless signals’ behavior on location estimation accuracy in 802.11 fingerprinting systems. In Proceedings of the IEEE International Symposium on Parallel & Distributed Processing, Rome, Italy, 23–29 May2009. [Google Scholar]
- Hamza, L.; Nerguizian, C. Neural network and fingerprinting-based localization in dynamic channels. In Proceedings of the 6th IEEE International Symposium on Intelligent Signal Processing, Budapest, Hungary, 26–28 August 2009. [Google Scholar]
- Lemelson, H.; Kopf, S.; King, T.; Effelsberg, W. Improvements for 802.11-based location fingerprinting systems. In Proceedings of the 33rd Annual IEEE International Computer Software and Applications Conference, Seattle, WA, USA, 20–24 July 2009. [Google Scholar]
- Cherntanomwong, P.; Takada, J.; Tsuji, H.; Gray, D. New radio source localization using array antennas based on fingerprinting techniques in outdoor environment. In Proceedings of the Asia-Pacific Microwave Conference, Bangkok, Thailand, 11–14 December 2007. [Google Scholar]
- Bshara, M.; Orguner, U.; Gustafsson, F.; Van Biesen, L. Fingerprinting localization in wireless networks based on received-signal-strength measurements: A case study on WIMAX networks. IEEE Trans. Veh. Technol. 2010, 59, 283–294. [Google Scholar] [CrossRef]
- Bisio, I.; Lavagetto, F.; Marchese, M.; Sciarrone, A. GPS/HPS and Wi-Fi fingerprint-based location recognition for check-in applications over smartphones in cloud-based LBSs. IEEE Trans. Multimed. 2013, 15, 858–869. [Google Scholar] [CrossRef]
- Azin, A.; Godlewski, P.; Melle, P. A hierarchical clustering technique for radio map compression in location fingerprinting systems. In Proceedings of the IEEE 71st Vehicular Technology Conference, Taipei, Taiwan, 16–19 May 2010. [Google Scholar]
- Suroso, D.; Cherntanomwong, P.; Sooraksa, P.; Takada, J. Location fingerprint technique using fuzzy C-Means clustering algorithm for indoor localization. In Proceedings of the IEEE Region 10 Annual International Conference, Bali, Indonesia, 21–24 November 2011. [Google Scholar]
- Kjaergaard, M.; Munk, C. Hyperbolic location fingerprinting: A calibration-free solution for handling differences in signal strength. In Proceedings of the 6th Annual IEEE International Conference on Pervasive Computing and Communications, Hong Kong, China, 17–21 March 2008. [Google Scholar]
- Bolliger, P.; Partridge, K.; Chu, M.; Langheinrich, M. Improving location fingerprinting through motion detection and asynchronous interval labeling. In Proceedings of the International Symposium on Location and Context-Awareness, Tokyo, Japan, 7–8 May 2009. [Google Scholar]
- Pirzad, N.; Yunus, M.; Subhan, F.; Abro, A.; Hassan, M. Location fingerprinting technique for WLAN device-free indoor localization system. Wirel. Pers. Commun. 2017, 95, 445–455. [Google Scholar] [CrossRef]
- Soro, B.; Lee, C. A wavelet scattering feature extraction approach for deep neural network based indoor fingerprinting localization. Sensors 2019, 19, 1790. [Google Scholar] [CrossRef]
- Steiner, C.; Wittneben, A. Low complexity location fingerprinting with generalized UWB energy detection receivers. IEEE Trans. Signal. Process. 2010, 58, 1756–1767. [Google Scholar] [CrossRef]
- Kimoto, R.; Yamamoto, T.; Ishida, S.; Tagashira, S.; Fukuda, A. Evaluation of multi ZigLoc: Indoor ZigBee localization system using inter-channel characteristics. In Proceedings of the 11th International Conference on Mobile Computing and Ubiquitous Network, Auckland, New Zealand, 5–8 October 2018. [Google Scholar]
- Wu, J.; Zhu, M.; Xiao, B.; Qiu, Y. The improved fingerprint-based indoor localization with RFID/PDR/MM technologies. In Proceedings of the IEEE 24th International Conference on Parallel and Distributed Systems (ICPADS), Singapore, 11–13 December 2018. [Google Scholar]
- Li, Y.; Gao, Z.; He, Z.; Zhuang, Y.; Radi, A.; Chen, R.; El-Sheimy, N. Wireless fingerprinting uncertainty prediction based on machine learning. Sensors 2019, 19, 324. [Google Scholar] [CrossRef]
- Zheng, H.; Gao, M.; Chen, Z.; Liu, X.; Feng, X. An adaptive sampling scheme via approximate volume sampling for fingerprint-based indoor localization. IEEE Internet Things J. 2019, 6, 2338–2353. [Google Scholar] [CrossRef]
- Fang, S.; Lin, T. A dynamic system approach for radio location fingerprinting in wireless local area networks. IEEE Trans. Commun. 2010, 58, 1020–1025. [Google Scholar] [CrossRef]
- Nicholaus, M.; Minga, D. A comparison review of indoor positioning techniques. IJC 2016, 21, 42–49. [Google Scholar]
- Aksu, H.; Aksoy, D.; Korpeoglu, I. A study of localization metrics: Evaluation of position errors in wireless sensor networks. Comput. Netw. 2011, 55, 3562–3577. [Google Scholar] [CrossRef]
- Gonzalez, I.; Lozano, L.; Cejudo, S.; Saez de Adana, F.; Catedra, F. New version of FASANT code. In Proceedings of the IEEE Antennas and Propagation Society International Symposium, San Diego, CA, USA, 5–11 July 2008. [Google Scholar]
- Navarro, A.; Guevara, D.; Cardona, N.; López, J. Measurement-based ray-tracing models calibration in urban environments. In Proceedings of the 2012 IEEE International Symposium on Antennas and Propagation, Chicago, IL, USA, 8–14 July 2012. [Google Scholar]
- Evangelo, M.; Andrew, N.; Geoffrey, S. Ray-tracing urban macrocell propagation statistics and comparison with WINNER II/+ measurements and models. In Proceedings of the Loughborough Antennas & Propagation Conference (LAPC), Loughborough, UK, 12–13 November 2012. [Google Scholar]
- Junpe, M.; Tetsur, I.; Koshir, K. Ray-tracing system for predicting propagation characteristics on world wide web. In Proceedings of the 3rd European Conference on Antennas and Propagation (EuCAP 2009), Berlin, Germany, 23–27 March 2009. [Google Scholar]
- Sáez de Adana, F.; Gutierrez, O.; Gonzalez, I.; Lozano, L.; Felipe Cátedra, M. Practical Applications of Asymptotic Techniques in Electromagnetics; Artech House Electromagnetics Series; Artech House: Boston, MA, USA, 2011. [Google Scholar]
- Catedra, M.; Perez-Arriaga, J. Cell Planning for Wireless Communications; Artech House Publishers: Norwood, OH, USA, 1999. [Google Scholar]
- Lozano, L.; Algar, M.; García, E.; González, I.; Catedra, F. Efficient combination of acceleration techniques applied to high frequency methods for solving radiation and scattering problems. Comput. Phys. Commun. 2017, 221, 28–41. [Google Scholar] [CrossRef]
- Chen, Y.; Francisco, J.; Trappe, W.; Martin, R. A practical approach to landmark deployment for indoor localization. In Proceedings of the 3rd Annual IEEE Communications Society on Sensor and Ad Hoc Communications and Networks, Reston, VA, USA, 28 September 2006. [Google Scholar]
- Perez-Ramirez, J.; Borah, D.; Voelz, D. Optimal 3-D Landmark Placement for Vehicle Localization Using Heterogeneous Sensors. IEEE Trans. Veh. Technol. 2013, 62, 2987–2999. [Google Scholar] [CrossRef]
- Kent, H.; Michael, T. Comparison of predicted and measured multipath impulse responses. IEEE Trans. Aerosp. Electron. Syst. 2011, 3, 1696–1709. [Google Scholar]
- Giuseppe, C.; Mai, T.; Luca, N.; Maria-Gabriella, B. Performance comparison of WiFi and UWB fingerprinting indoor positioning systems. Technologies 2018, 6, 14. [Google Scholar]
- Sinan, G.; Zhi, T.; Georgios, G.; Hisashi, K.; Andreas, M.; Zafer, S. Localization via ultrawideband radios. IEEE Signal Process. Mag. 2005, 22, 70–84. [Google Scholar]


| Algorithm | Cost | Precision | Efficiency | Complexity | Hardware |
|---|---|---|---|---|---|
| ToA | high | medium | low | large | large |
| TDoA | low | high | high | large | medium |
| AoA | high | low | medium | large | large |
| RSS | low | medium | medium | low | small |
| Hybrid | low | high | high | low | small |
| Fingerprinting | medium | high | high | low | small |
| Configuration | X Points | Y Points | Total Points | Computational Cost (Hours) |
|---|---|---|---|---|
| 5 antennas 2 reflections | 140 | 120 | 16,800 | 70 |
| 5 antennas 3 reflections | 12 | 145 | 1740 | 104 |
| 10 antennas 2 reflections | 100 | 50 | 5000 | 55 |
| Power | Hybrid | Delay | Hybrid vs. Power | Delay vs. Power | |
|---|---|---|---|---|---|
| Grid size Frequency | |||||
| 72 × 72 2.4 GHz | 1.9554 0.1871 | 0.5621 0.0821 | 0.2504 0.0366 | 71.28 | 87.17 |
| 72 × 72 5.2 GHz | 2.0844 0.1843 | 0.5207 0.0841 | 0.2504 0.0366 | 75 | 87.98 |
| 36 × 36 2.4 GHz | 1.9801 0.2029 | 1.1337 0.1610 | 0.5155 0.0572 | 32.82 | 74.24 |
| 36 × 36 5.2 GHz | 2.5275 0.2548 | 0.9497 0.1142 | 0.5155 0.0572 | 62.69 | 75.48 |
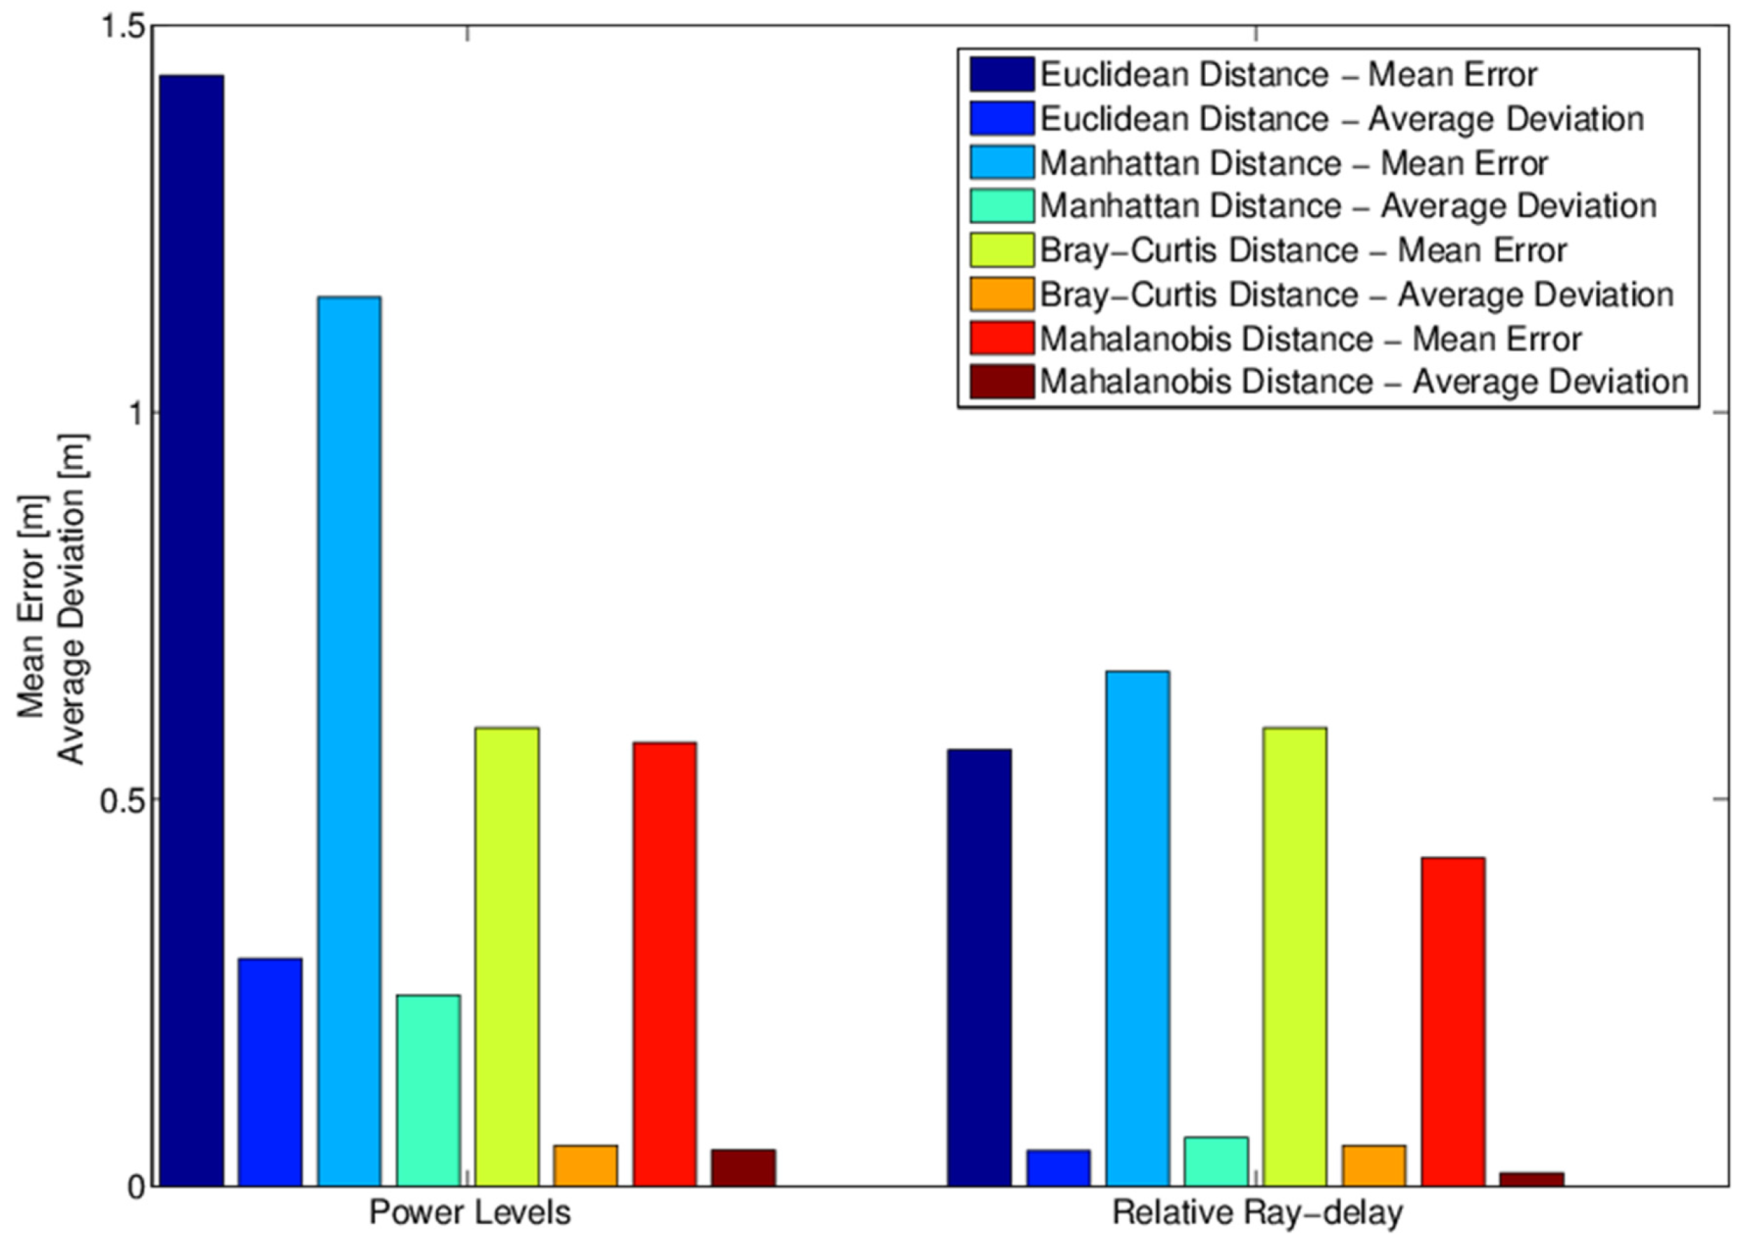
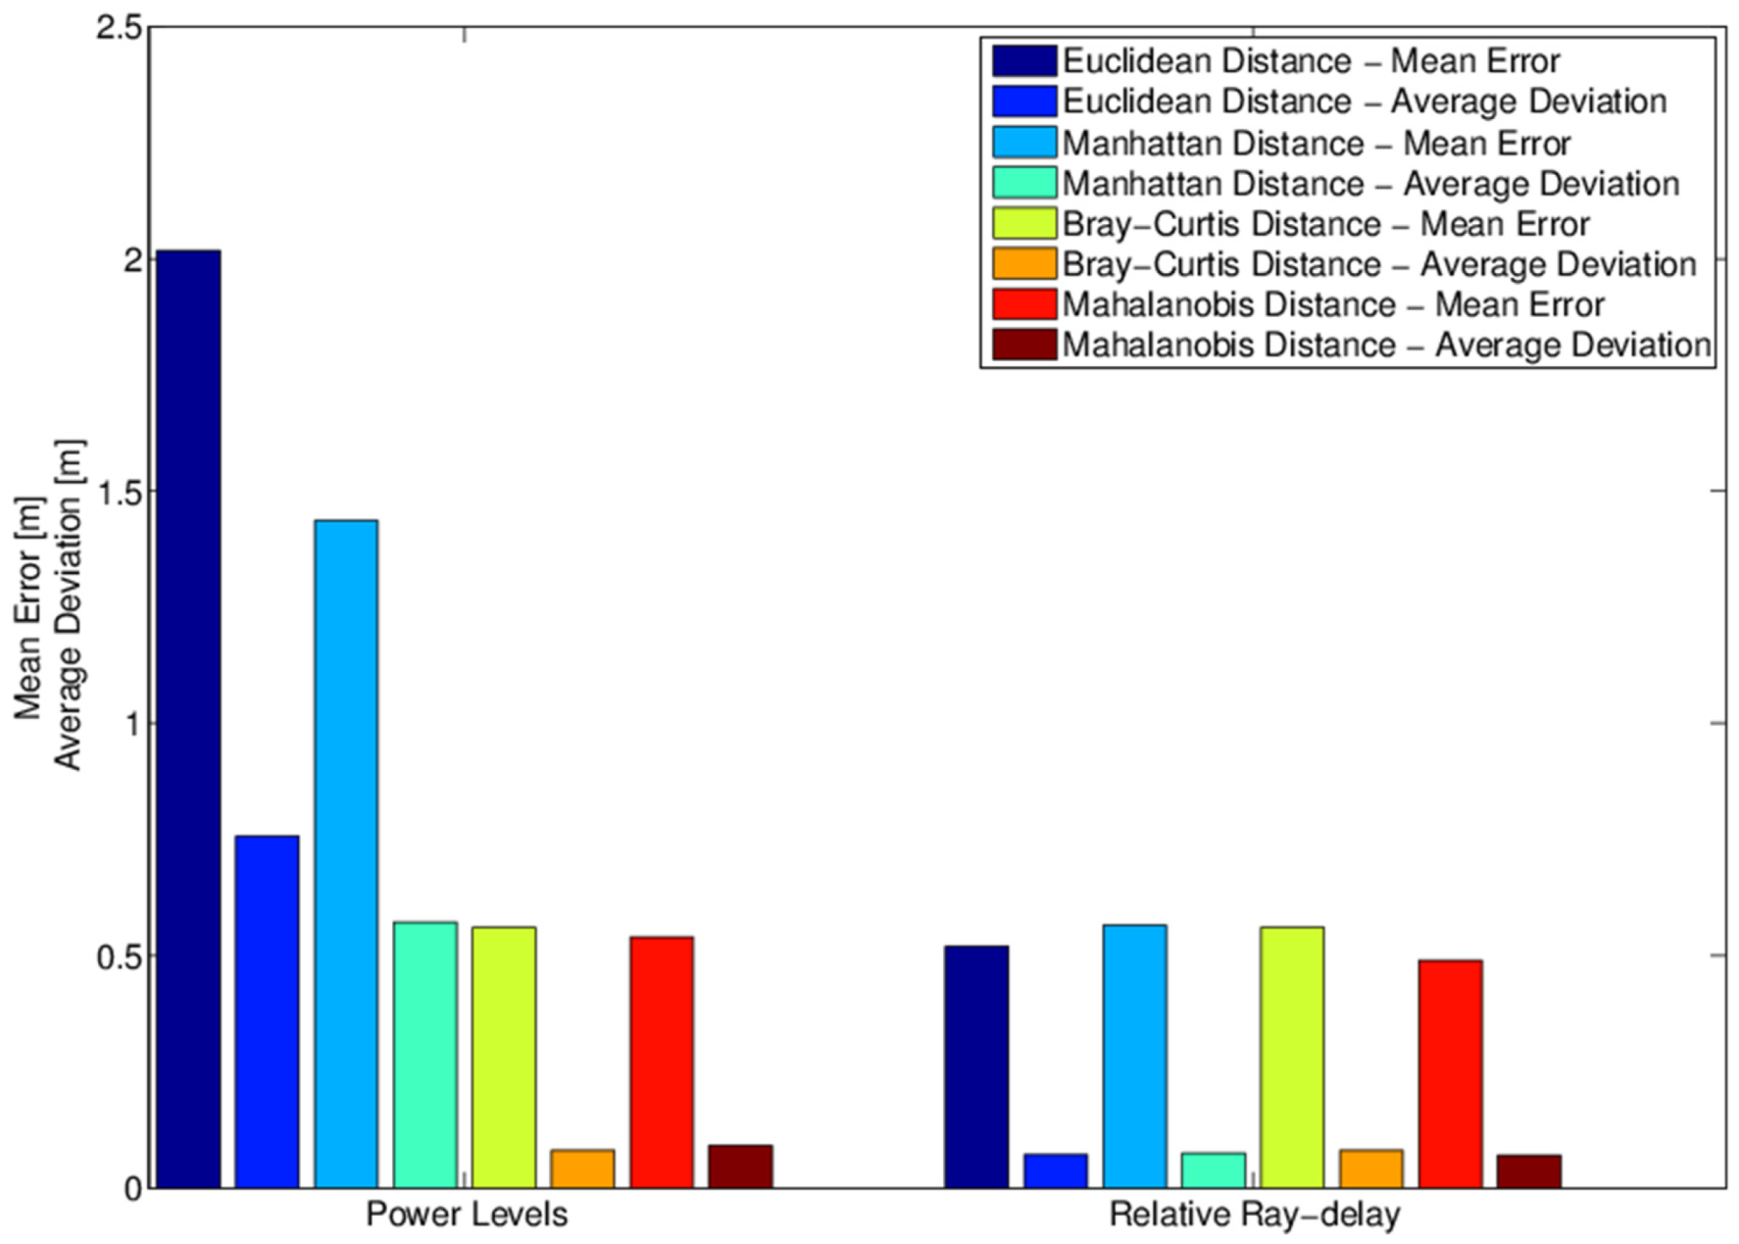
| Distance Metric | Grid Size | |||||
|---|---|---|---|---|---|---|
| 12 × 145 (m) | 80 × 80 (m) | 200 × 120 (m) | ||||
| Detection Method | ||||||
| Power | Rays | Power | Rays | Power | Rays | |
| Mean Error (m) | ||||||
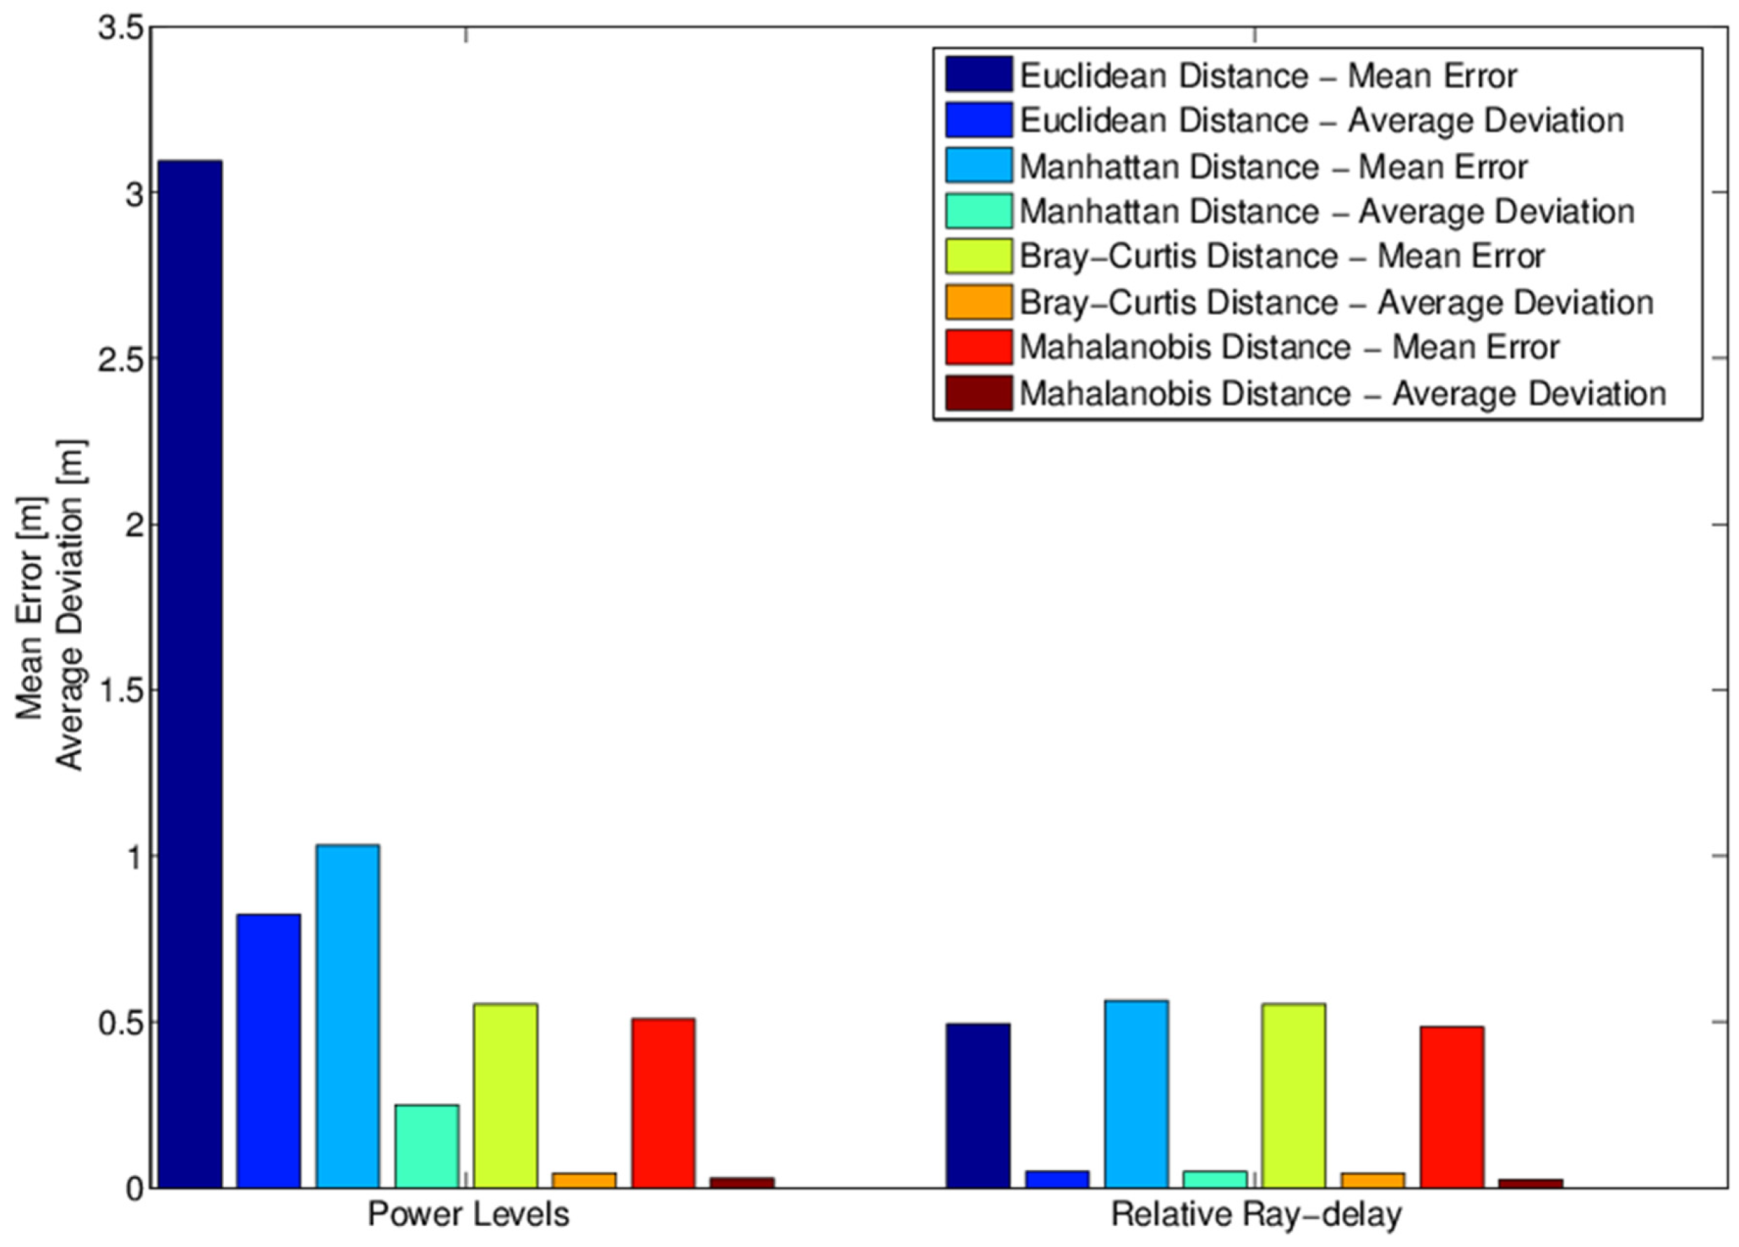
| Euclidean | 3.10 | 0.49 | 1.43 | 0.56 | 2.02 | 0.52 |
| Manhattan | 1.03 | 0.56 | 1.14 | 0.66 | 1.44 | 0.56 |
| Bray-Curtis | 0.55 | 0.55 | 0.59 | 0.59 | 0.56 | 0.56 |
| Mahalanobis | 0.50 | 0.48 | 0.57 | 0.42 | 0.80 | 0.49 |
© 2019 by the authors. Licensee MDPI, Basel, Switzerland. This article is an open access article distributed under the terms and conditions of the Creative Commons Attribution (CC BY) license (http://creativecommons.org/licenses/by/4.0/).
Share and Cite
Del Corte-Valiente, A.; Gómez-Pulido, J.M.; Gutiérrez-Blanco, O.; Castillo-Sequera, J.L. Localization Approach Based on Ray-Tracing Simulations and Fingerprinting Techniques for Indoor–Outdoor Scenarios. Energies 2019, 12, 2943. https://doi.org/10.3390/en12152943
Del Corte-Valiente A, Gómez-Pulido JM, Gutiérrez-Blanco O, Castillo-Sequera JL. Localization Approach Based on Ray-Tracing Simulations and Fingerprinting Techniques for Indoor–Outdoor Scenarios. Energies. 2019; 12(15):2943. https://doi.org/10.3390/en12152943
Chicago/Turabian StyleDel Corte-Valiente, Antonio, José Manuel Gómez-Pulido, Oscar Gutiérrez-Blanco, and José Luis Castillo-Sequera. 2019. "Localization Approach Based on Ray-Tracing Simulations and Fingerprinting Techniques for Indoor–Outdoor Scenarios" Energies 12, no. 15: 2943. https://doi.org/10.3390/en12152943