Electrical Properties of Polyethylene/Polypropylene Compounds for High-Voltage Insulation
by
 ,
,
Sameh Ziad Ahmed Dabbak
1, 
Hazlee Azil Illias
1,*,
Bee Chin Ang
2,
Nurul Ain Abdul Latiff
1 and
Mohamad Zul Hilmey Makmud
1,3,*
1
Department of Electrical Engineering, Faculty of Engineering, University of Malaya, Kuala Lumpur 50603, Malaysia
2
Department of Chemical Engineering, Faculty of Engineering, University of Malaya, Kuala Lumpur 50603, Malaysia
3
Complex of Science and Technology, Faculty of Science and Natural Resources, University Malaysia Sabah, Kota Kinabalu 88400, Malaysia
*
Authors to whom correspondence should be addressed.
Energies 2018, 11(6), 1448; https://doi.org/10.3390/en11061448
Submission received: 12 April 2018
/
Revised: 29 May 2018
/
Accepted: 30 May 2018
/
Published: 4 June 2018
Abstract
:In high-voltage insulation systems, the most commonly used material is polymeric material because of its high dielectric strength, high resistivity, and low dielectric loss in addition to good chemical and mechanical properties. In this work, various polymer compounds were prepared, consisting of low-density polyethylene (LDPE), high-density polyethylene (HDPE), polypropylene (PP), HDPE/PP, and LDPE/PP polymer blends. The relative permittivity and breakdown strength of each sample types were evaluated. In order to determine the physical properties of the prepared samples, the samples were also characterized using differential scanning calorimetry (DSC). The results showed that the dielectric constant of PP increased with the increase of HDPE and LDPE content. The breakdown measurement data for all samples were analyzed using the cumulative probability plot of Weibull distribution. From the acquired results, it was found that the dielectric strengths of LDPE and HDPE were higher than that of PP. Consequently, the addition of LDPE and HDPE to PP increased the breakdown strength of PP, but a variation in the weight ratio (30%, 50% and 70%) did not change significantly the breakdown strength. The DSC measurements showed two exothermic crystallization peaks representing two crystalline phases. In addition, the DSC results showed that the blended samples were physically bonded, and no co-crystallization occurred in the produced blends.
1. Introduction
Thermoplastic polymers, such as polyethylene (PE), polypropylene (PP), polyvinyl chloride (PVC), and polystyrene (PS) are the main products of industrial engineering, which are employed in several electrical application fields. In high-voltage equipment, polymers are commonly used in the insulation systems because of their exceptional mechanical, electrical, chemical, and thermal properties and their low production cost. In insulation materials, which are produced by mixing different polymers at different weight ratios, polymers are used to modify the physical and mechanical properties of the final products, maintaining a lower production cost.
High-density polyethylene (HDPE), low-density polyethylene (LDPE), and PP are the most widely used polymers in the world market, employed for electrical equipment, automotive engineering material, and packaging. The most useful properties of PE and PP are oil resistance, rigidity, good stiffness, and thermal stability [1]. Conversely, the utilization of PP and PE is restricted in certain areas owing to some weak properties such as melt viscosity. The weak properties of LDPE include a lack of mechanical and thermal resistance. Hence, numerous researchers are working on improving the properties of LDPE by mixing it with other polymers that have high temperature resistance [2,3]. In addition, the poor impact strength of PP and its weak Young’s modulus restrict its applications. These poor properties may be enhanced by mixing PP with PE [4,5,6,7]. In these blends, the impact and tensile strength are improved [8,9]. The polymer blends also compromise significant processing benefits in the melting polymer fraction [10].
The breakdown strength attracted major interest in early polymer studies. In 1955, the dielectric strength of insulation materials and its relation with the electric field strength between high voltage and ground electrodes were studied. It was found that by increasing the internal ionization through an increase of the electric field strength, an electron avalanche would form, leading to insulation breakdown if the electric field reached a very high value. The insulation breakdown is also caused by the expansion of electrical treeing in polymers, particularly in LDPE, which affects the material, wrecking its formation. Essentially, the electrical trees are instigated when the material is exposed to excessive electrical field stress over long periods of time. Defects occur, which are triggered by electrical trees, that further deteriorate the material dielectric strength, upsurge the electrical stress, and speed up the partial discharge (PD) process [11]. The tracking resistance was studied for linear low-density polyethylene and natural rubber LLDPE/NR blends with different weight ratios by measuring carbon track development and leakage current. It was found that the mixture of 80:20 LLDPE/NR was a better blend because of its lowest degradation [12]. The breakdown strength and stress tracking measurements were carried out for blends containing different ratios of recycled HDPE in resins with HDPE. It was revealed that the dielectric strength was not good for the recycled blends in comparison to the pure material because of the existence of conductive impurity [13]. These studies focused on the factors engaged in a breakdown mechanism. These factors include the dielectric properties, physical structure and deformity, additives and pollution, and space charge injection. The mechanism that leads to breakdown is still unclear, despite it is well known that breakdown is a result of conducting channels crossing the insulation material. A low electrical conductivity in an insulation material is required to avoid the possibility of breakdown. It depends on the amount and the concentration of charge carriers, the charge of the charge carriers, and their mobility. The direct current (DC) conductivity of polymer blends containing HDPE and LDPE was measured. It was found that the blend of LDPE with 5% HDPE had a reduced conductivity [14].
Although many studies on dielectric strength of pure polymer materials with micro- or nanoparticles have been carried out, the electrical properties, especially for high-voltage applications of polymer blends, are limited. Most of the polymer blends studies were performed on the blends mechanical and physical properties. However, it is also essential to assess the breakdown strength of blended materials in order to investigate their capability to be used in high-voltage insulation systems. Therefore, in this work, the breakdown strength of different blends of HDPE/PP and LDPE/PP was investigated. Weibull distribution was plotted to determine the probability occurrence and to analyze alternating current (AC) breakdown strength. The data were used to evaluate the dielectric strength of the blended compounds compared to the pure samples. In addition, the dielectric responses of polymer blends as a function of frequency were compared. Differential scanning calorimetry (DSC) was used on all prepared blended samples to characterize their thermal properties, such as the amount of crystallinity and the melting temperature.
2. Samples and Experimental Process
2.1. Sample Preparation
The materials used in this work, high-density polyethylene (HDPE), low-density polyethylene (LDPE), and polypropylene (PP), were obtained from Sigma Aldrich (St. Louis, MO, USA) with product numbers of 428019, 428043 and 427888, respectively. From the product specification sheets, the melt flow index of HDPE, LDPE, and PP are 42, 25, and 12 g/10 min respectively, and the density is 0.947, 0.92 and 0.9 g/cm3, respectively. The average molecular weight of PP is about 250,000. The required samples of pure polymers, in addition to the HDPE/PP and LDPE/PP blends with weight ratios of 3:7, 5:5, and 7:3, were produced for each mixture. The mixed specimens were marked as HP1, HP2, HP3, and LP1, LP2, LP3 for HDPE/PP and LDPE/PP, respectively. The selection on the mixing ratio of HDPE/PP and LDPE/PP blends was based on past works [2,4,8,15,16,17,18]. The materials were mixed mechanically using a twin screw extruder, with a 150 rpm screw rotating speed for 5 min. The barrel extruder temperature was set from 140 to 180 °C from the hopper to the die. Thin samples with 150–250 µm thickness were prepared using an adjustable temperature hydraulic press. The temperature of the stainless steel mold, which was covered by aluminum foil, was kept from 170 to 180 °C with a pressure of 35 bar for 10 min to grant complete melting. Slow cooling was carried out by turning off the heater and waiting for the sample to reach the room temperature. Then, the sample was removed from the mold.
2.2. Breakdown Experiment
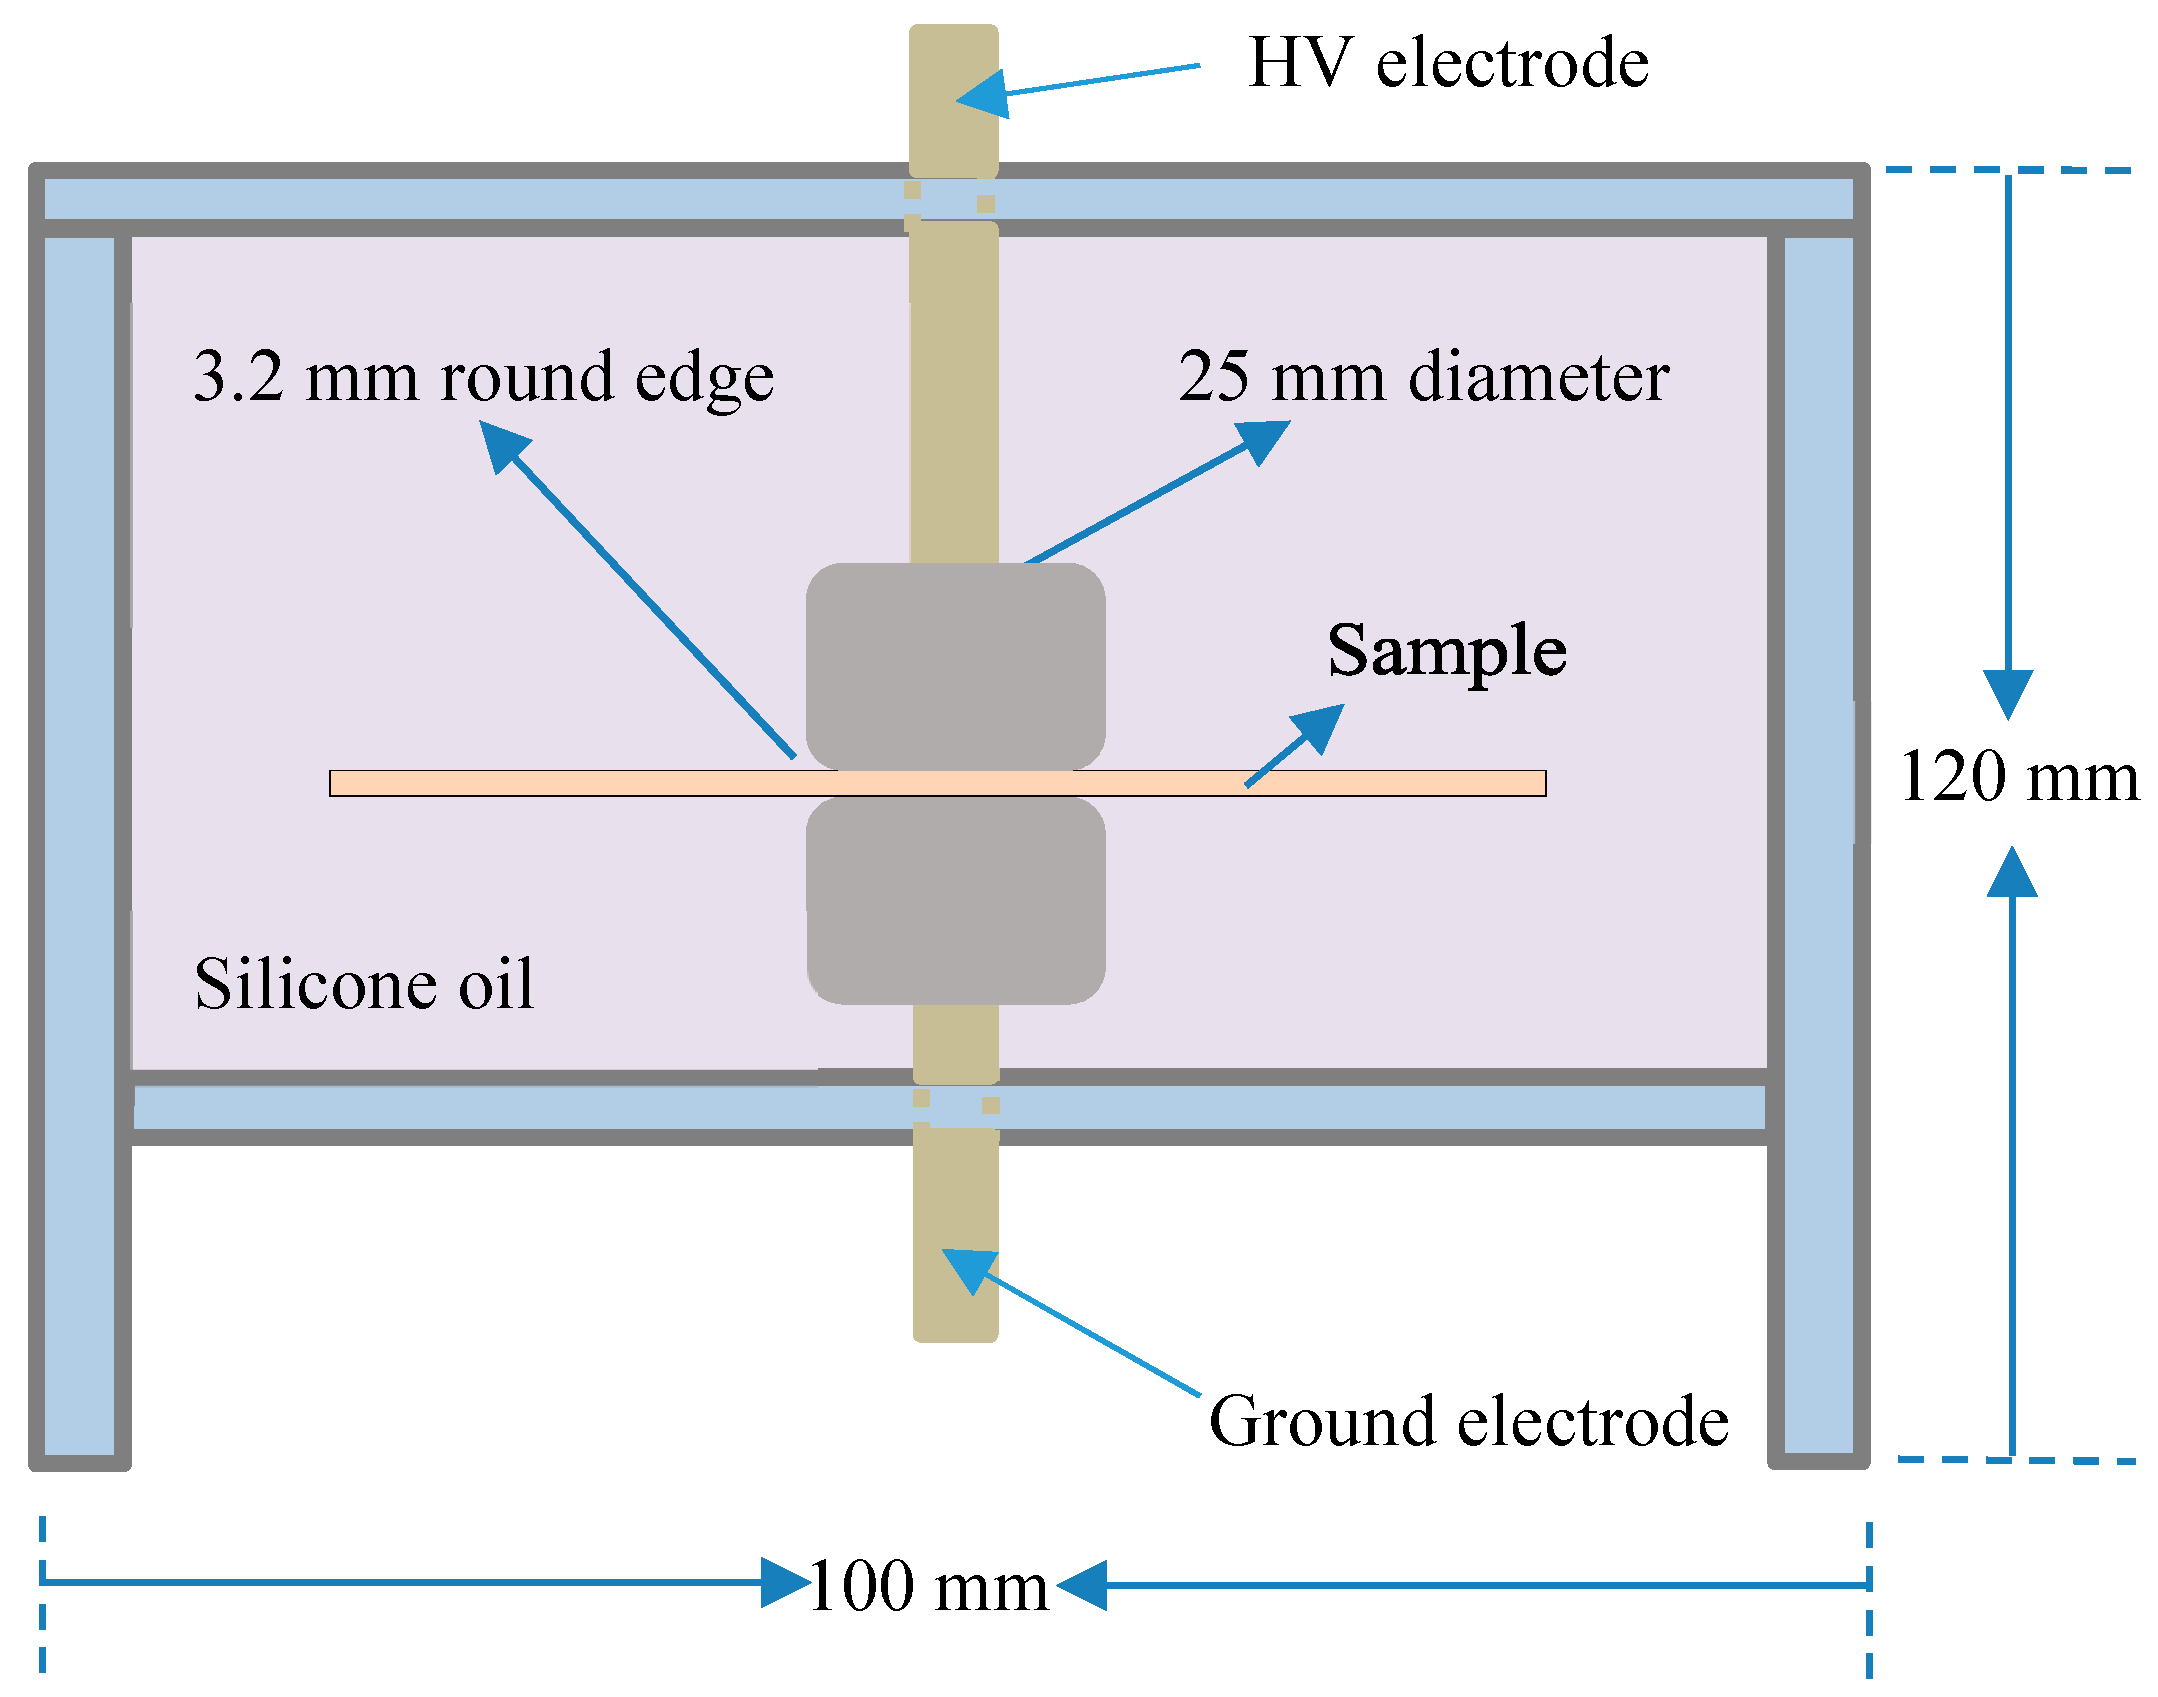
The schematic diagram of the breakdown experiment setup is shown in Figure 1. The breakdown test and electrode systems were designed following ASTM D-149-97a standards. The test chamber consisted of two cylindrical stainless-steel electrodes of 25 mm diameter. The specimen was located between the two electrodes. The upper electrode was connected to a high-voltage supply, while the bottom electrode was connected to the ground. The electrodes and specimen were fully immersed in silicone oil to avoid discharges and flashover on the sample surfaces during voltage application, prior to material breakdown. To remove the unwanted bubbles which might affect the test results, the test chamber was placed inside a vacuum oven at room temperature for 20 min each time the oil was changed.
The applied voltage across the test electrodes was increased from zero until breakdown of the sample occurred. The voltage rate increment was 500 V/s. When a breakdown happened, the voltage source was disrupted accordingly. The test was repeated for nine times on new samples of each material type. In order to obtain accurate breakdown voltage results, the thickness of the samples on the breakdown spot was measured using a micrometer. This was because the specimen thickness could not be fully uniform. The insulating oil was replaced after each material was tested to reduce the influence of changes of the oil quality on the test results due to contaminants, which were generated after each sample was tested.
The breakdown strength was measured by dividing the recorded breakdown voltage by the sample thickness, using:
where VB is the breakdown voltage, and d is the sample thickness at the point in which the breakdown occurs.
EB = VB/d
The Weibull probability distribution was used to describe statistically the breakdown strength distribution data. Equation (2) was used to calculate and plot the Weibull probability parameters and curves, which symbolize the breakdown strength probabilities at any random value x, defined as:
where β is the shape parameter correlated to the scattering of the data and shows the degree of failure rate. The EB curve distribution is narrower when β is higher. The shape parameter increases when the dielectric behavior reliability is increased. The scale parameter α represents the voltage value at which a 63.2% probability of breakdown occurs [19,20]. It was used to compare the breakdown strength between different insulation types. Weibull distributions with a shape parameter less than 1 have a failure rate that decrease with the variable x, while Weibull distributions with a shape parameter greater than 1 have a failure rate that increases with x.
2.3. Physical Characterization Using Differential Scanning Calorimetry (DSC)
The crystallinity evaluations of the HDPE/PP and LDPE/PP samples were carried out using Mettler DSC 820 (Mettler Toledo, Columbus, OH, USA). DSC is considered the best technique for examining the thermal properties of polymers, the amount of crystallinity, the melting temperature, and the glass transition temperature of a polymer. Because of the effect of the degree of crystallinity on the dielectric properties of polymers, DSC measurements were performed [21]. Measuring the differences in the heat flow between the reference and the sample to maintain the same increment of temperature among them is the basic principle of DSC. Around 10 mg of sample was used for each test. For all DSC inspections, a temperature range of 30 °C to 190 °C was selected, with a linear increment–decrement rate of 5 °C/min at ambient atmosphere. The samples were first heated from 30 °C to 190 °C and then cooled down to 30 °C. After that, the samples were reheated again to 190 °C.
2.4. Impedance Measurement
Electrochemical impedance spectroscopy (EIS) was used for the impedance measurements. EIS was operated at 1 Vpp test voltage with a frequency range of 100 kHz to 40 Hz. The purpose of the dielectric measurements is to compare the dielectric response between different material types, which can be shown clearly within this frequency range at a low voltage level. The impedance measurements were performed at room temperature and atmospheric pressure. Two stainless-steel electrodes of equal size were designed, with 10 mm thickness and 35 mm diameter. The two electrodes were placed on the top and bottom of the sample, where the top and bottom electrodes were set as working and ground electrodes, respectively. The test sample was located between the working electrode and the ground electrode. In order to eliminate the stray current, a ring guard electrode was placed on the surface of the sample around the working electrode.
The real component Z′ and the imaginary component Z″ were recorded by EIS at different applied frequencies. The Z impedance expression is given by:
The permittivity is defined as:
where is the real part of the permittivity, and is the imaginary part of the permittivity . The permittivity components are estimated by:
where f is the frequency of the electric field, while the free space capacitance between the electrodes is represented by . The energy from an external electric field amassed within a material is defined by the real permittivity value, and how dissipative the material is against an external electric field is described by the imaginary permittivity [22,23,24].
3. Results and Discussion
In this section, the outcomes from the measurements of the breakdown strength of the HDPE/PP and LDPE/PP compounds are presented. In addition, pure HDPE, LDPE, and PP samples were examined, and the results were compared with those obtained from the compound samples. The cumulative probability plot of Weibull distribution and the average breakdown were used to analyze the breakdown measurement data.
3.1. Breakdown Strength
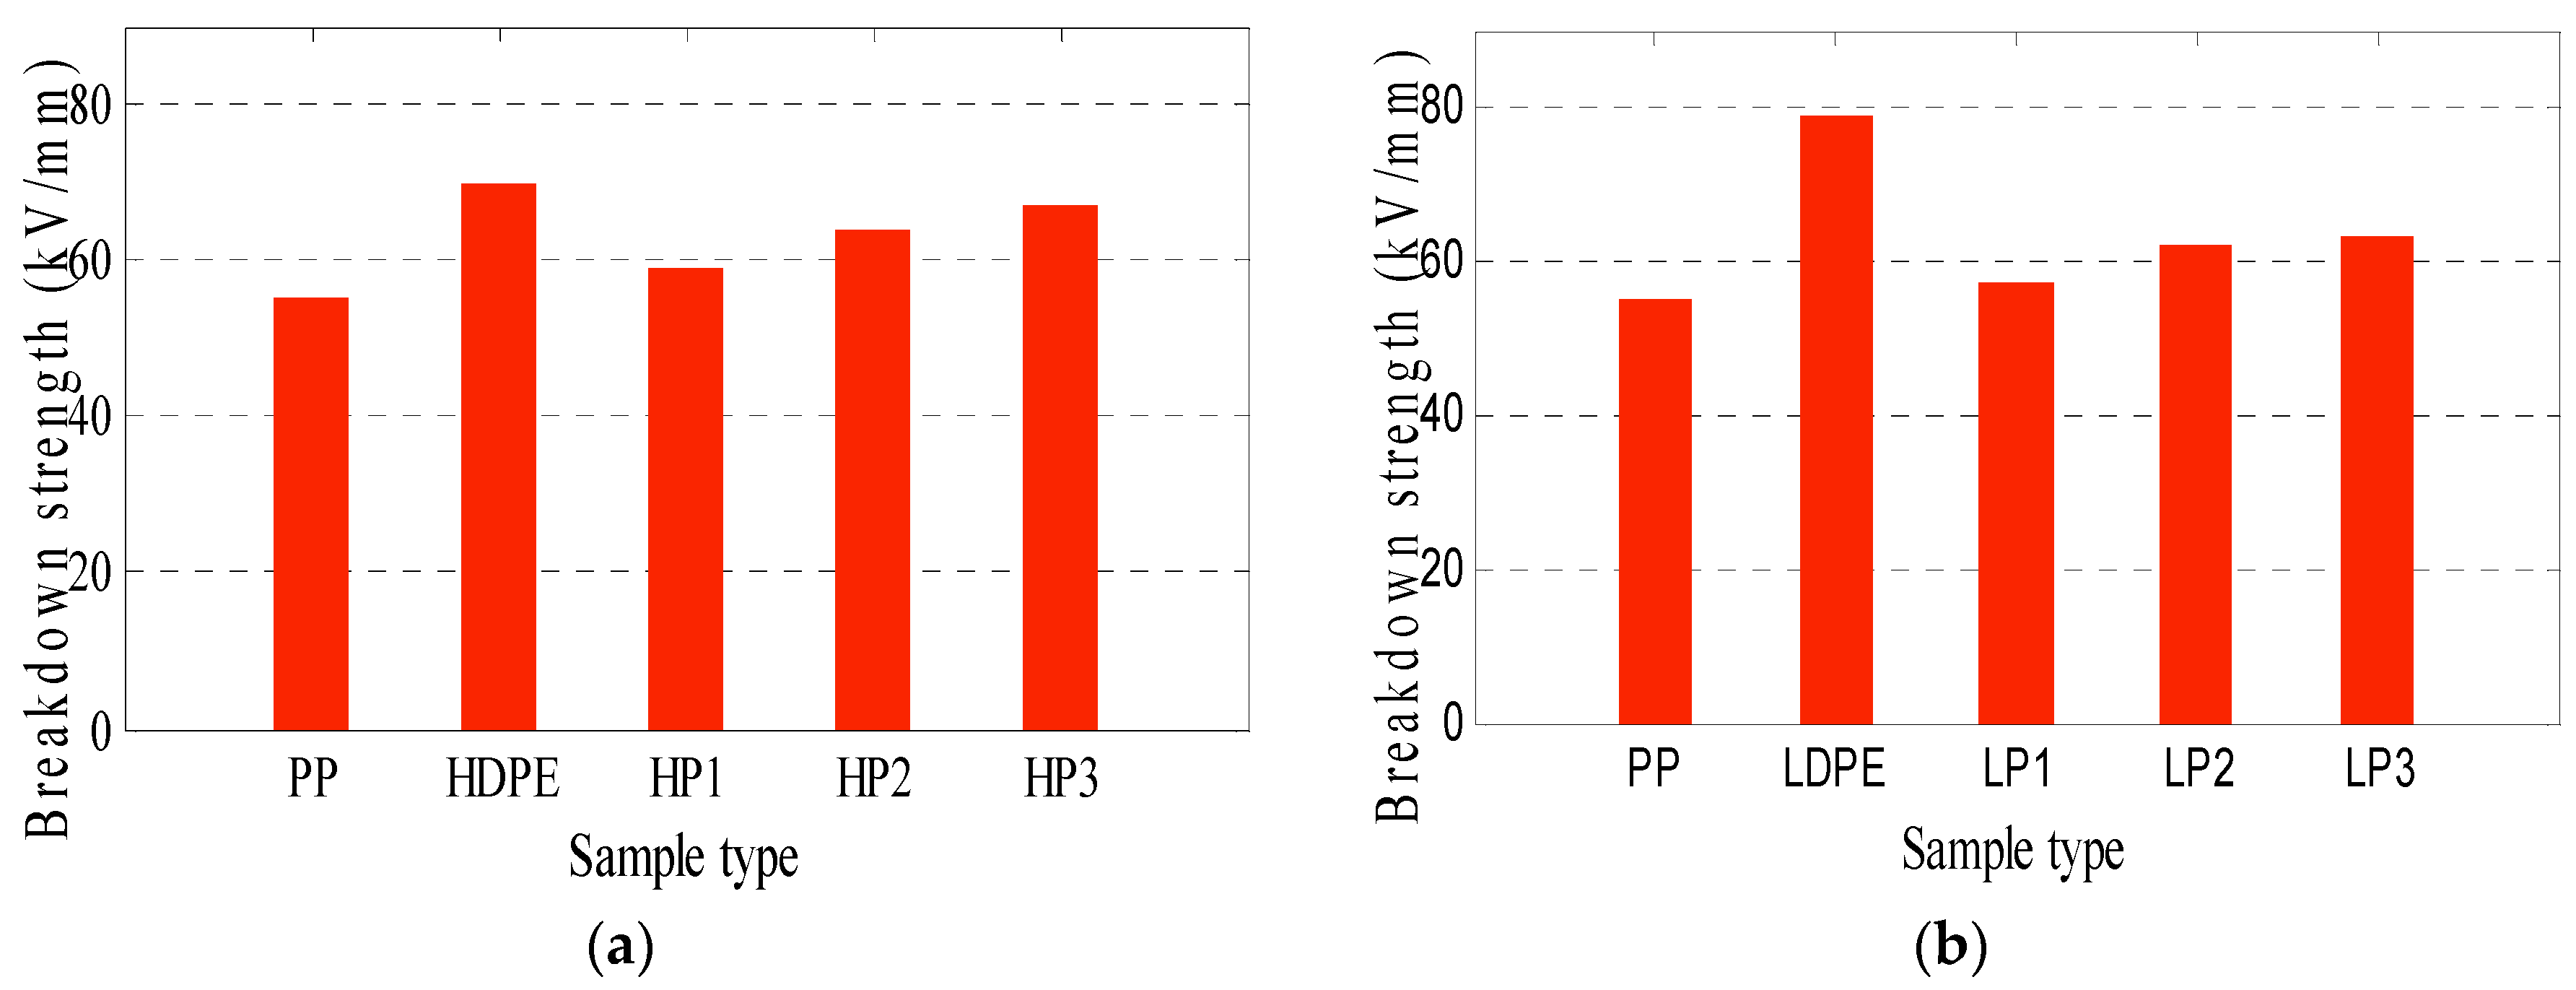
Figure 2a,b show the average breakdown strength calculated from the experimental results data of the HDPE/PP and LDPE/PP samples, respectively. It is clear that the polyethylene samples had a higher dielectric strength than the polypropylene samples. The average breakdown of HDPE, LDPE, and PP, as shown in these figures, were 70, 79, and 55 kV/mm, respectively. It can be noticed that there was an increment in the breakdown strength of PP when it was compounded with LDPE. The breakdown strength of LP1, LP2, and LP3 were 57, 62, and 63 kV/mm, respectively. In addition, the average breakdown strength of the PP samples was also improved when they were mixed with HDPE, resulting in 59, 64, and 67 kV/mm for HP1, HP2, and HP3 respectively. The mixture of PP containing HDPE or LDPE showed enhanced breakdown of PP. However, despite the improvements, the breakdown strengths were still lower than those of pure HDPE and LDPE.
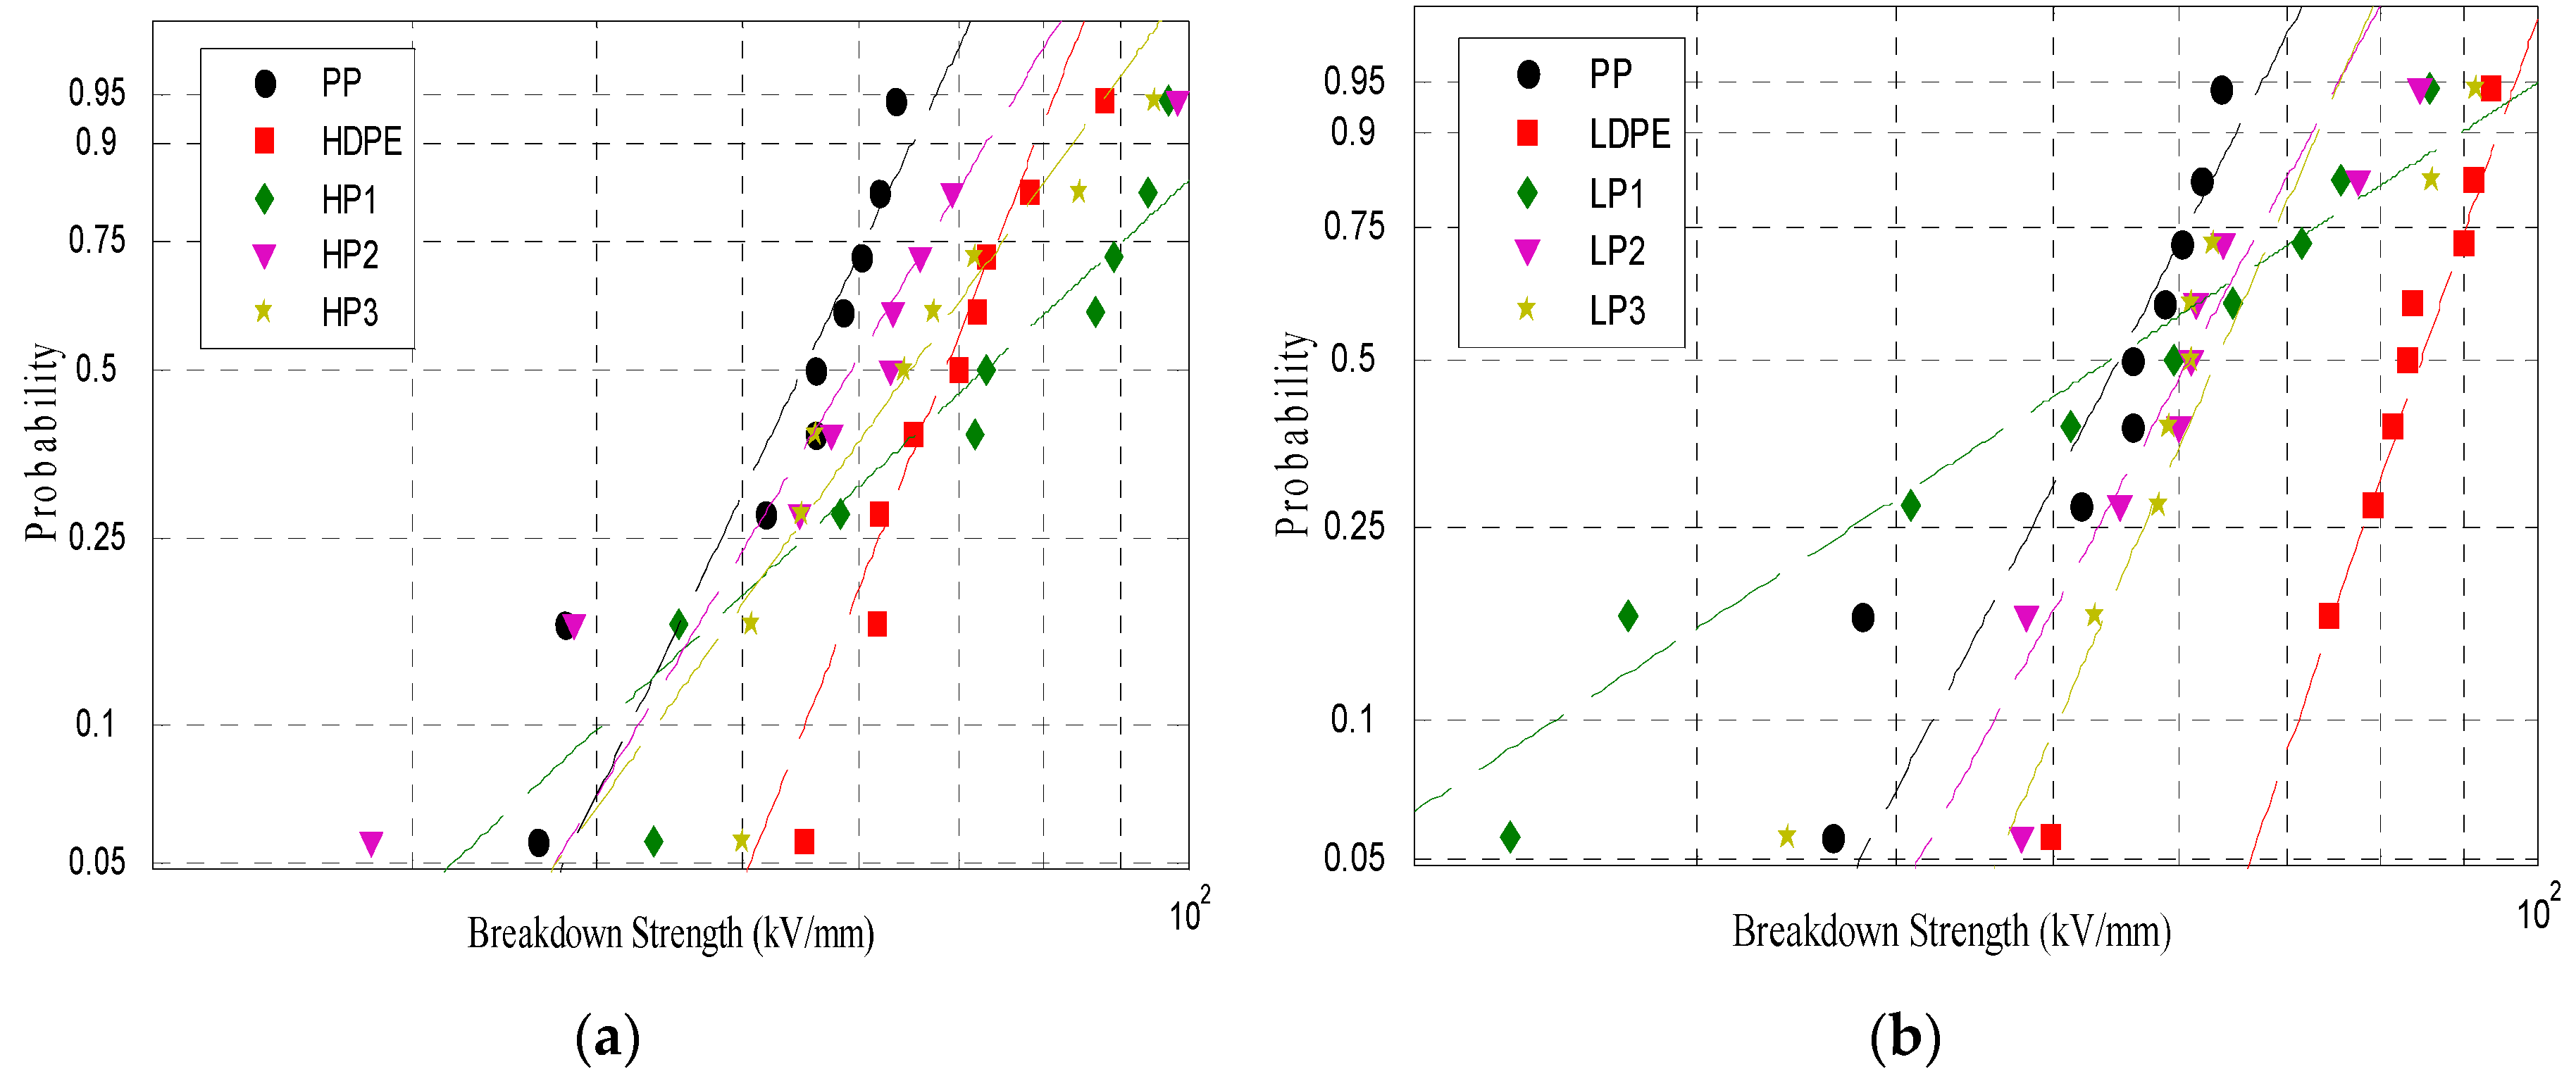
The occurrence probability plots versus voltage of the measured breakdown strength values for the HDPE blend containing PP and for the LDPE blend containing PP are shown in Figure 3a,b, while Table 1 and Table 2 show the scale and shape parameters found for all tested samples. It can be seen that the breakdown strength spreads over a wide range of values for the same insulation material. The shape parameter β for all results shows values higher than 1 due to the fact that the probability of breakdown occurrence increases with the applied voltage.
For the HDPE/PP samples, the range of breakdown strength was 57 to 80 kV. From the shape parameter results, it was observed that HP2 exhibited the minimum β value, which was 3.5, followed by HP2 and HP3, with values of 4 and 4.6, respectively. For the LDPE/PP samples, the range of breakdown strength was 57 kV to 85 kV. From the shape parameter results, it was observed that LP3 displayed the minimum β value, which was 3, followed by LP2 and LP1, with values of 4 and 5, respectively. Comparing the breakdown strength of pure and mixed polymer samples, for the blended samples of HDPE/PP, the breakdown strength of PP was the lowest. The value was from 10 to 20 kV lower than that of HDPE and of the blended specimens. It can be noticed that the breakdown strength of PP was enhanced with the addition of HDPE, which means that the breakdown strength of HDPE is lower. In addition, the comparison between blended samples did not show significant changes among them when the blended samples were compared to the pure samples.
For the breakdown strength of the LDPE/PP blends and of the corresponding pure materials, the blended samples displayed values that were between those of PP and those of LDPE. This shows that adding LDPE to PP increased the breakdown strength of PP, but increasing the amount of PP decreased the breakdown strength of LDPE. The breakdown strength in the blended materials was proportional to the ratio of the mixture. On the contrary, for the pure polymer samples, there was a considerable difference in the breakdown strength, e.g., the breakdown strength of PP was 30 kV lower than that of HDPE.
To interpret these results, it is useful to study the elements that affect the breakdown process of dielectric materials. The breakdown strength of dielectric materials is influenced by the degree of crystallinity and the formation of crystalline materials. This may be due to the electron scattering increment that correlates with the amount of crystalline volume. By increasing the degree of crystallinity, the breakdown strength of the polymers will decrease. The degree of crystallinity of LDPE is lower than that of HDPE, which may explain the higher breakdown strength of LDPE. However, the degree of crystallinity of PP is higher than those of HDPE and LDPE, resulting in the lowest value of breakdown strength for the PP samples [25]. In polymer insulation materials, the permeation of charge carriers (ionic or polar molecules), holes, and excess electrons depends on their crystallinity. Mixing two different polymers with different ratios results in changes in the charge mobility behavior, which has a significant effect on the material conductivity [26]. At room temperature, polymers consist of both crystalline and amorphous phases. The hole activation energy of the amorphous structure is lower than that of the crystalline region, but the electron activation energy of the amorphous structure is higher than that of the crystalline structure. This means that the amorphous phase has a strong influence on the electron and hole activation and, hence, on the breakdown phenomena of polymers [14].
LDPE, HDPE, and PP have different molecular weights and distribution ranges. At room temperature, the molecule weight of HDPE is higher than that of LDPE, while the molecule weight distribution of LDPE is wider than that of HDPE. This can be an additional reason of the higher breakdown strength of LDPE compared to PP and HDPE because the breakdown strength is dependent on the molecule size. The breakdown strength increases with the increment of the molecular size of polymers at room temperature [27,28]. However, impurity particles will be integrated into insulation materials during sample fabrication and manufacturing process. This affects the dielectric breakdown strength. These impurities modify the dielectric properties of the materials. Changing the permittivity and conductivity of polymers will influence their dielectric performance. In addition, the non-uniform conductivity leads to charge trapping development. The initiation of breakdown may be caused by the enhancement of the electric field due to this charge. Another possible justification for the reduction of the dielectric strength and the shape parameter of blended samples is the field improvement induced by the higher permittivity values of the processed dielectric samples. An additional reason is the existence of defects and impurities that cause weaknesses inside the blended material. The results of the breakdown strength experiments for the prepared samples have been discussed in this work on the basis of some aspects that have impact on the dielectric strength of insulation materials. The explanation of the dielectric breakdown of polymers needs a comprehensive understanding of the polymers essence, including their structure and physical and chemical properties. Also, there are numbers of electrical breakdown processes that can cause the failure of polymers. These processes could work simultaneously, which makes it quite difficult to illustrate the development of the breakdown phenomenon. Because of this, many mechanisms are normally considered to interpret the measurement data.
For insulation materials, their insulating characteristics will be modified when the temperature is varied because their natural properties, such as the dielectric properties, the loss factor, and the crystallinity, are influenced by the temperature. Moreover, a continuous increment of the insulation temperature will occur if the produced amount of heat losses is greater than the dissipated amount, resulting in decreased breakdown strength. In addition, the moisture content will affect the breakdown strength measurements by increasing the dielectric losses and surface conductivity. The humidity also influences the breakdown voltage of the materials by increasing the absorbed moisture on the surface. Hence, increasing chemical effects result in increasing the probability of flashover and surface discharge. Furthermore, by increasing the voltage rate increment, to the breakdown strength will increase. This is because the material temperature increment is time-dependent and will influence the thermal breakdown mechanism [29].
3.2. Differential Scanning Calorimetry (DSC) Results
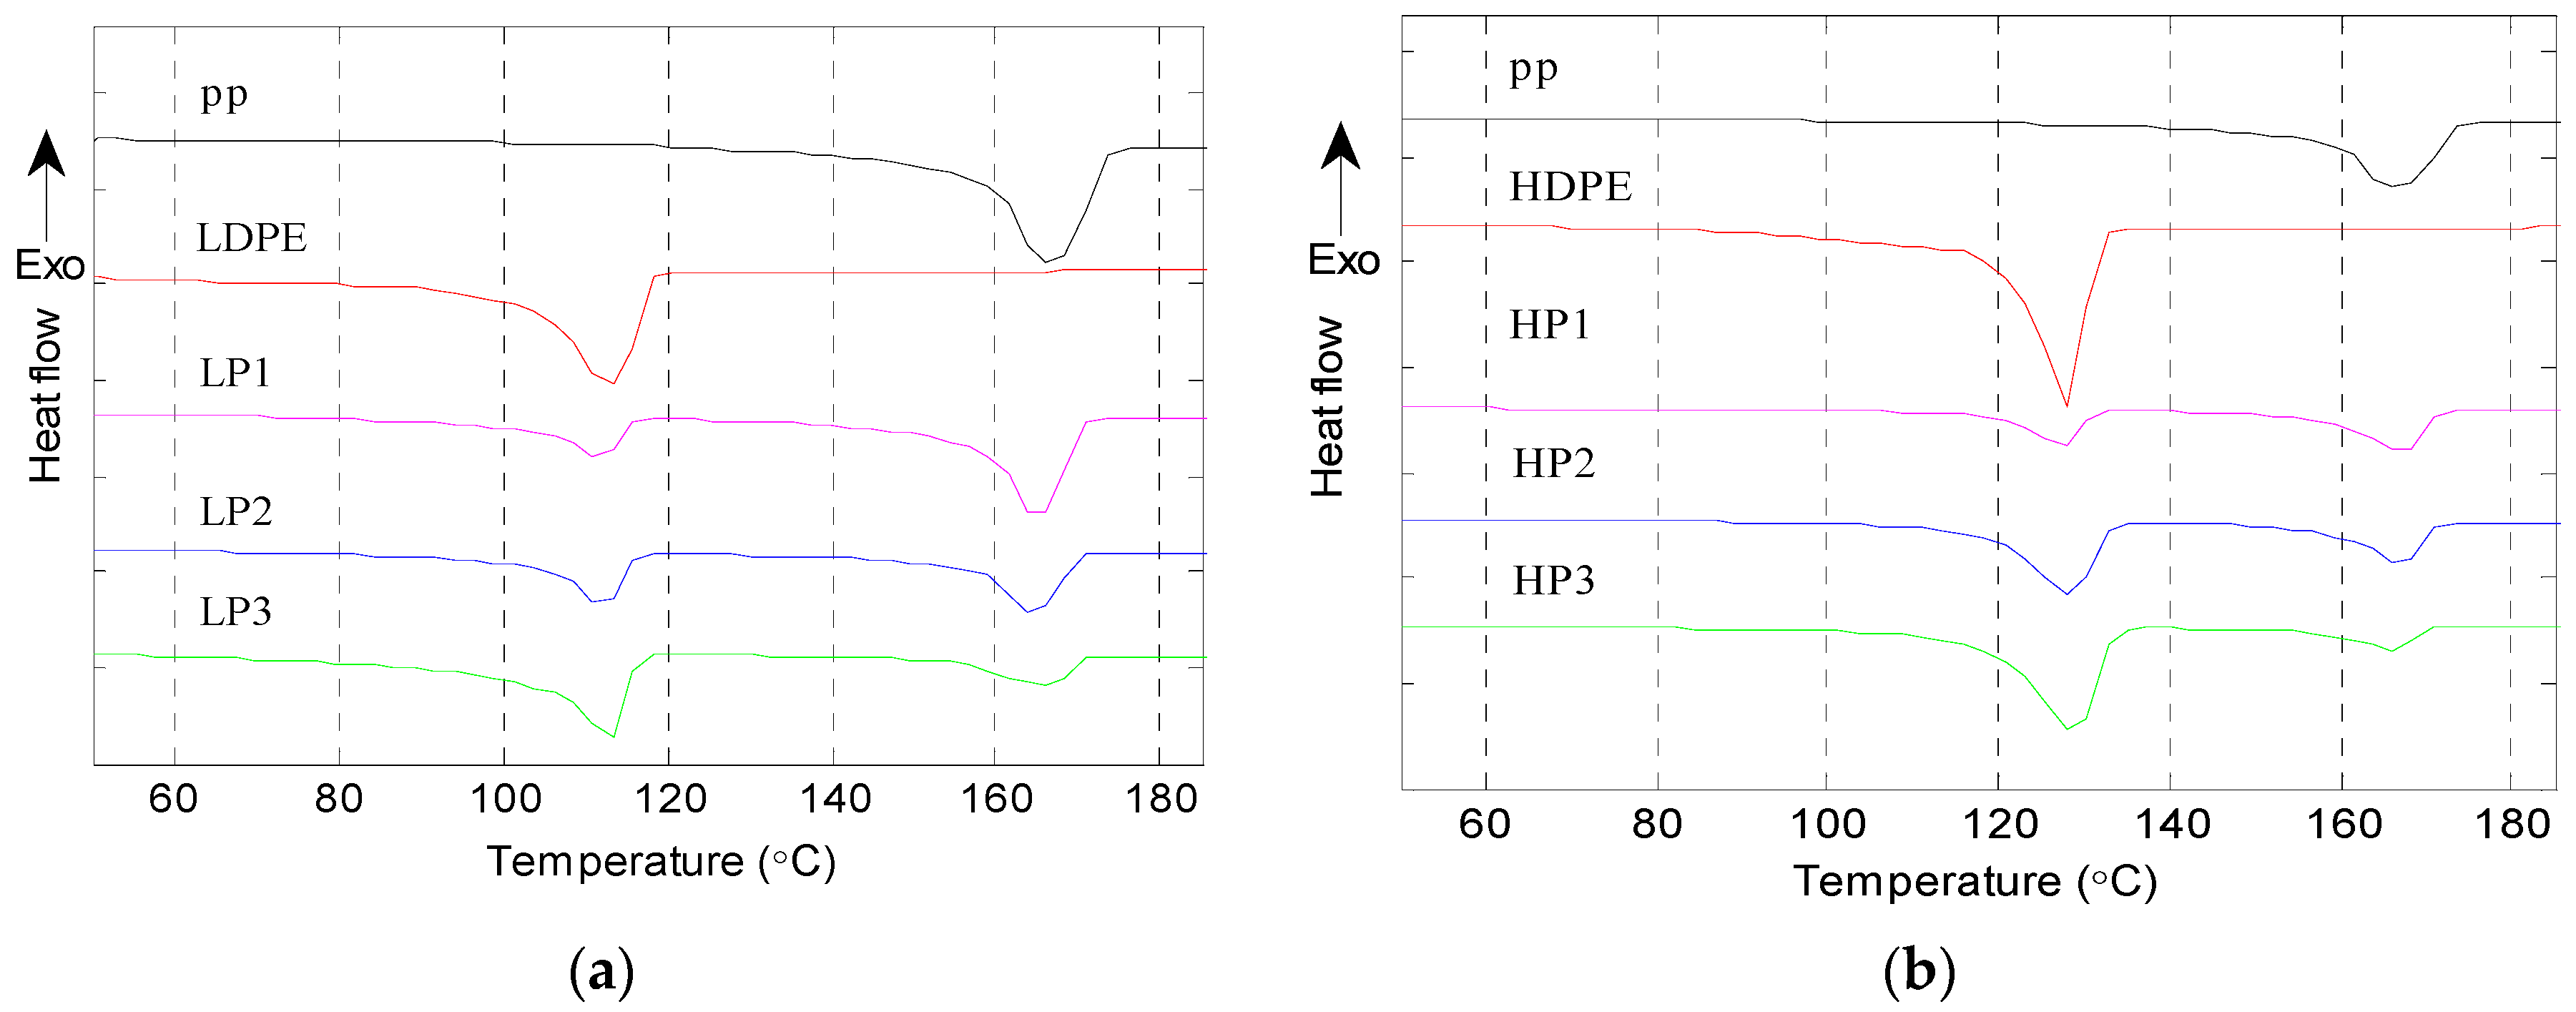
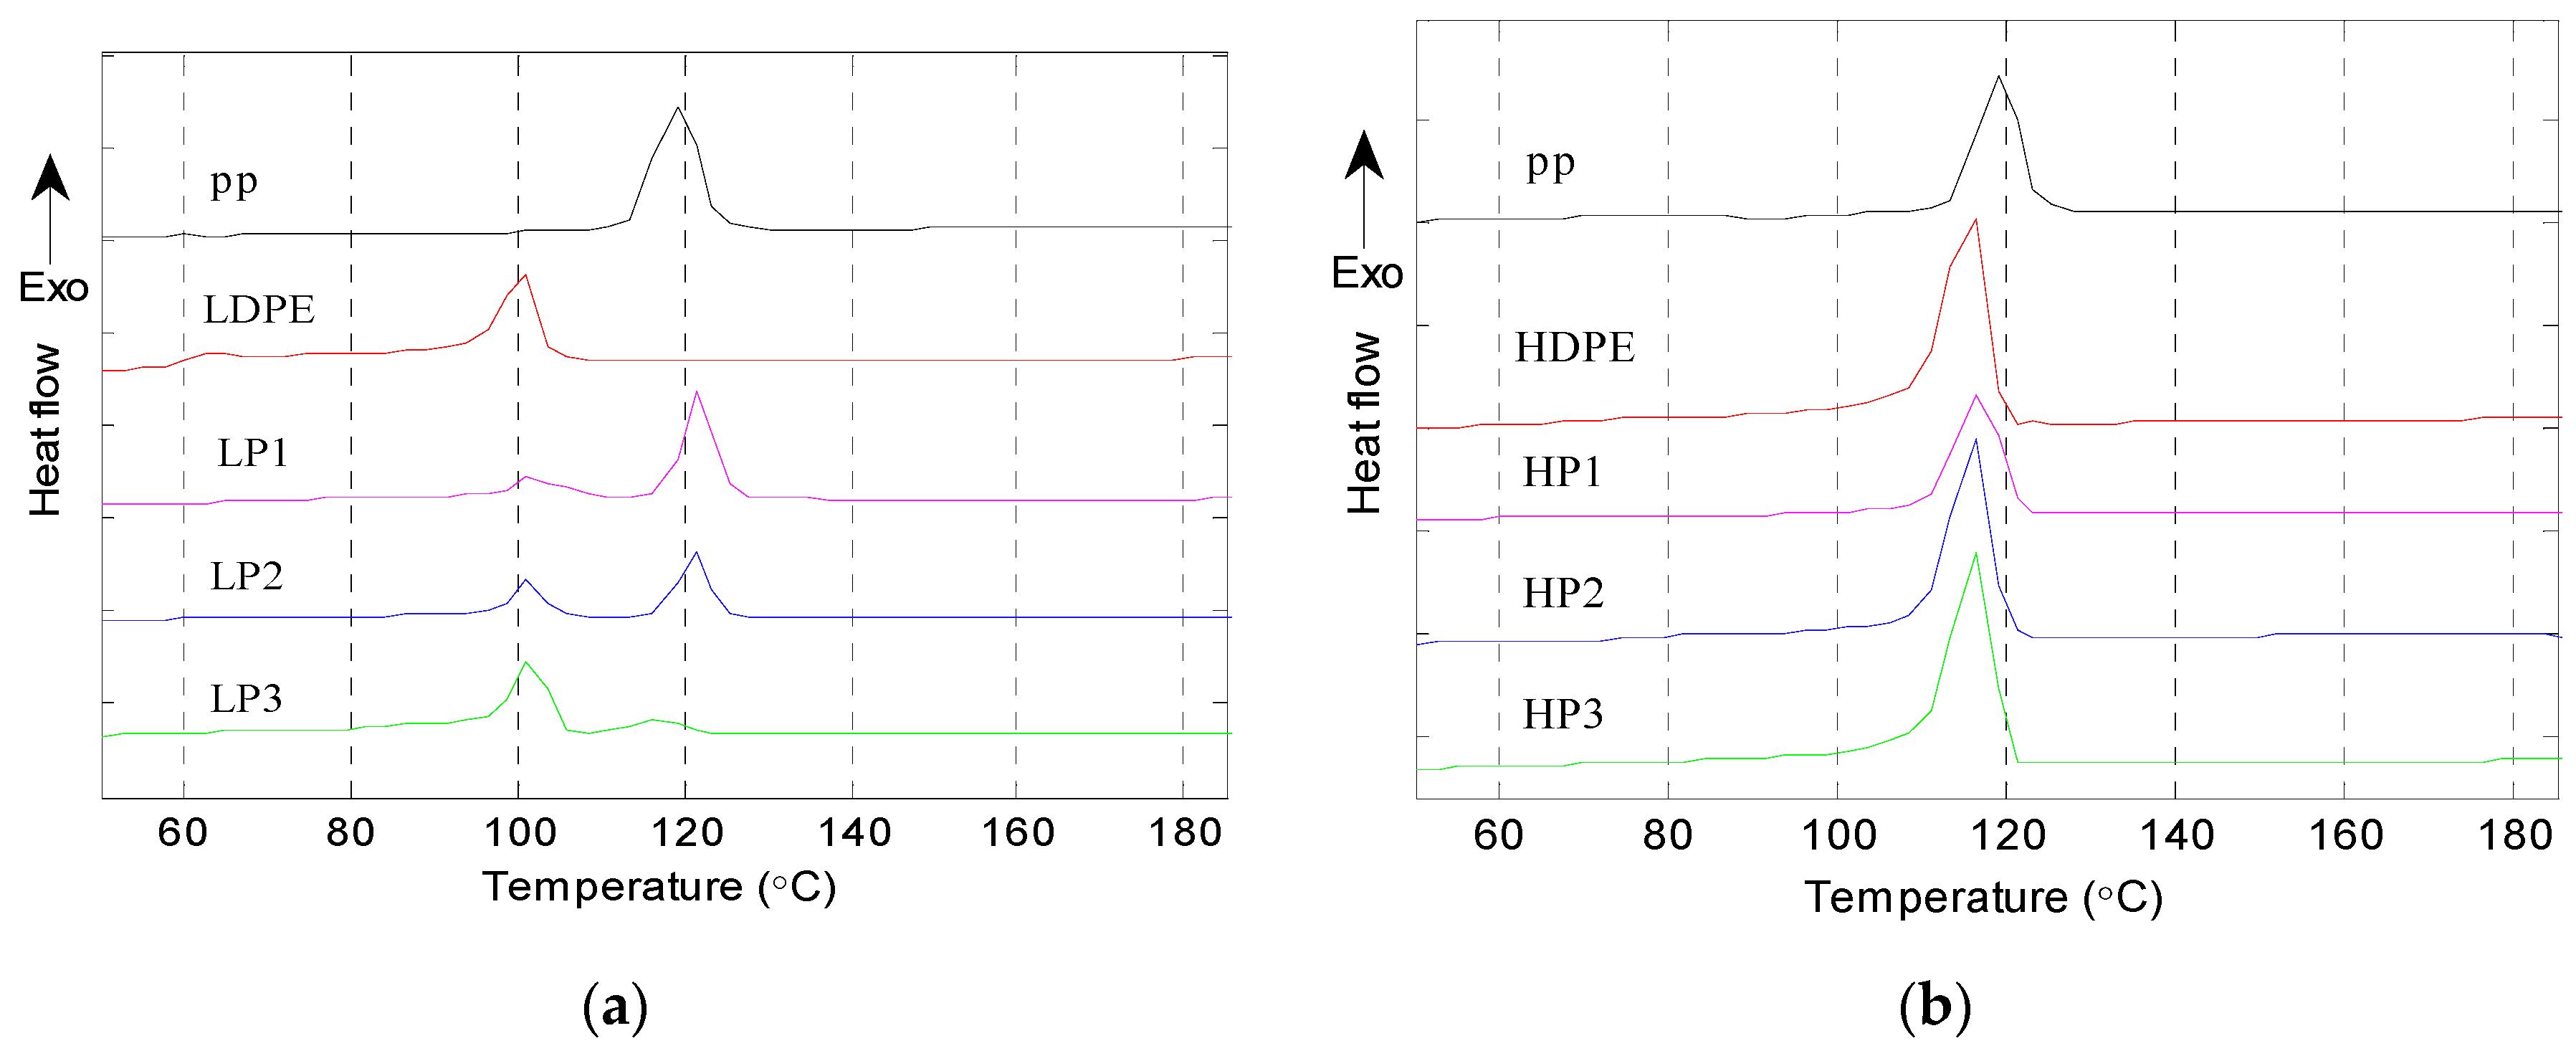
The DSC heating and cooling results of the LDPE/PP and the HDPE/PP blends are presented in Figure 4 and Figure 5, respectively. Melting is an endothermic mechanism, in which the polymer crystals absorb heat to melt, as can be clearly seen in Figure 4. Crystallization is an exothermic mechanism, in which the heat is given off from the polymers when they crystalize, as shown in Figure 5. The melting and crystallization temperatures of the PP, LDPE, HDPE, LDPE/PP, and HDPE/PP blends are shown in Table 3. From the DSC heating curves, the polymer melting temperature Tm is the peak temperature. The measured PP endothermic melting peak was at 170 °C, whereas those of LDPE and HDPE were around 113 °C and 129 °C, respectively. The LDPE/PP and the HDPE/PP compounds showed two dips symmetrical to the melting peaks points of the pure polymers. The measured crystallization peak temperature of PP, LDPE, and HDPE was 119 °C, 101 °C, and 107 °C, respectively.
In Table 3, all results are displayed with two values for Tm and TC. The highest values corresponded to the PP phase, followed by HDPE and finally LDPE. All of them were near the values of the pure materials. This means that the blends in which PP was added to HDPE and LDPE were subject to three melt solidification mechanisms. The first one corresponded to the crystallization of PP, and the others to the crystallization of LDPE and HDPE. The results of LDPE and HDPE in the blended samples showed a small reduction in Tm, which was around 2 °C, indicating a lessening in crystallite amount and possible co-crystallization [30]. For the HDPE/PP blend, only a single crystallization peak was noticed. This might be due to the overlapping of the peaks. This result indicates that HDPE and PP crystallized around the same temperature zone. The percent of crystallinity was calculated by dividing the heat of fusion normalized by the weight with the enthalpy of 100% crystalline polymer material. The measured heat of fusion of PE and PP was 293.6 J/g and 207.1 J/g, respectively. The degrees of crystallinity of HDPE, LDPE, and PP in the pure samples were 65%, 33%, and 47%, respectively. It is further noticed that the enthalpies of fusion of HDPE, LDPE, and PP were reduced in the blended samples compared to the pure samples, indicating a lower crystallinity development for each component. In order to show the nucleation effect of the blended materials on their crystallization, the crystallization onset temperature during cooling was determined for PP, LDPE, and HDPE. The onset temperature of pure PP was 123 °C, and for the samples containing LDPE was 124 °C, 125 °C, and 125.3 °C, thus slightly higher than those of pure PP. In the case of HDPE/PP, the crystallization onset temperature was between 118 °C and 119 °C, which confirms that HDPE has a greater effect on PP crystallization than LDPE [26,31,32].
It is important to note that the dielectric strength of polymers can be affected by the degree of crystallinity [25]. Our results indicate that the combination of LDPE and HDPE in PP resulted in a small change of their degree of crystallinity. Accordingly, this small modification may not be sufficient to influence the dielectric properties. In addition, all pure and blended samples displayed an identical melting curve with a similar dip of the crystallization temperature, indicating a structure with similar size lamellae. The existence of wider lamellae has a significant impact on polymers conductivities. Moreover, the microstructure of the polymer matrix affects the mobility of charge carriers such as electrons, holes, and polar species. Also, the mixing of polymers in small amounts will not change the total crystallinity of the material but lead to distinct changes in the nanostructure. This will result in charge trapping and then reduce the mobility of charge carriers [10].
3.3. Dielectric Properties Results
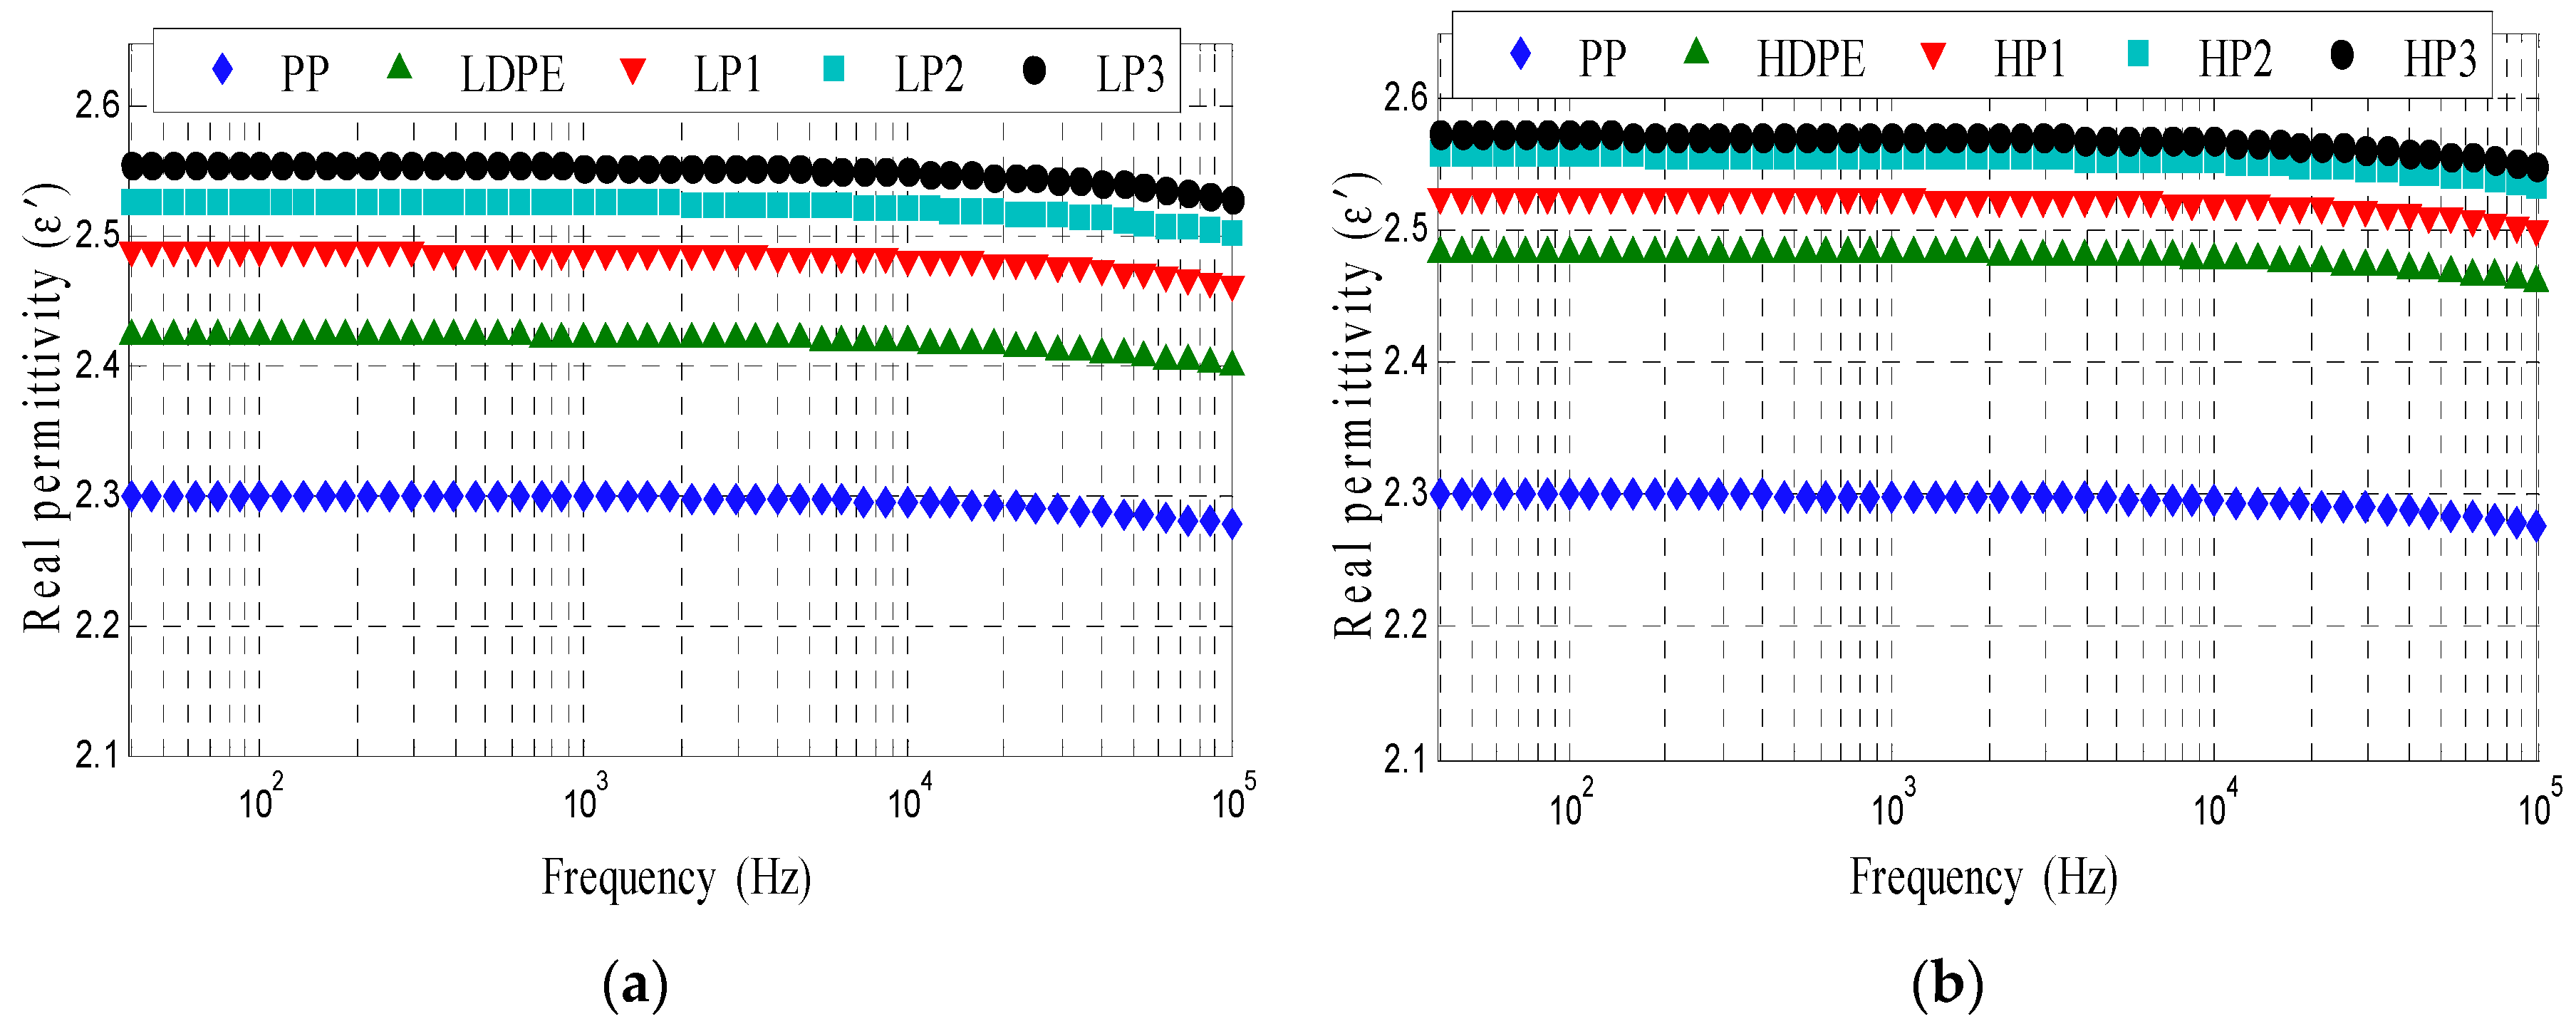
Figure 6a,b show the calculated real values of relative permittivity as frequency-dependent for the HDPE/PP and LDPE/PP samples. Referring to these figures, for each compound, the permittivity of each sample did not show a discrepancy in relation to frequency, and of each material showed similar characteristic with different values. At a lower frequency, the permittivity value was slightly higher. However, increasing the applied frequency reduced the permittivity. The permittivity was high at lower frequencies as a result of Maxwell–Wagner polarization, which is also understood as a build-up of charges [33,34]. The polarization distinguishes the insulation materials and their permittivity values. The space charge polarization decreases the value of permittivity. Dipolar groups become stronger with the increase of the applied field frequency in order to regulate themselves. Thus, this lessens the impact of dipolar groups on the permittivity [35]. Furthermore, the obtained results indicated that of the compound samples was greater than that of the pure materials. This was due to the fact that the mobility of charged groups was easier in the blended materials because of the impurities included during sample fabrication which worked as conductive particles. The comparison between the HDPE/PP blends and the LDPE/PP blends indicated that the HDPE/PP blends had higher permittivity influenced by the degree of crystallinity of HDPE, which was higher than that of LDPE [36].
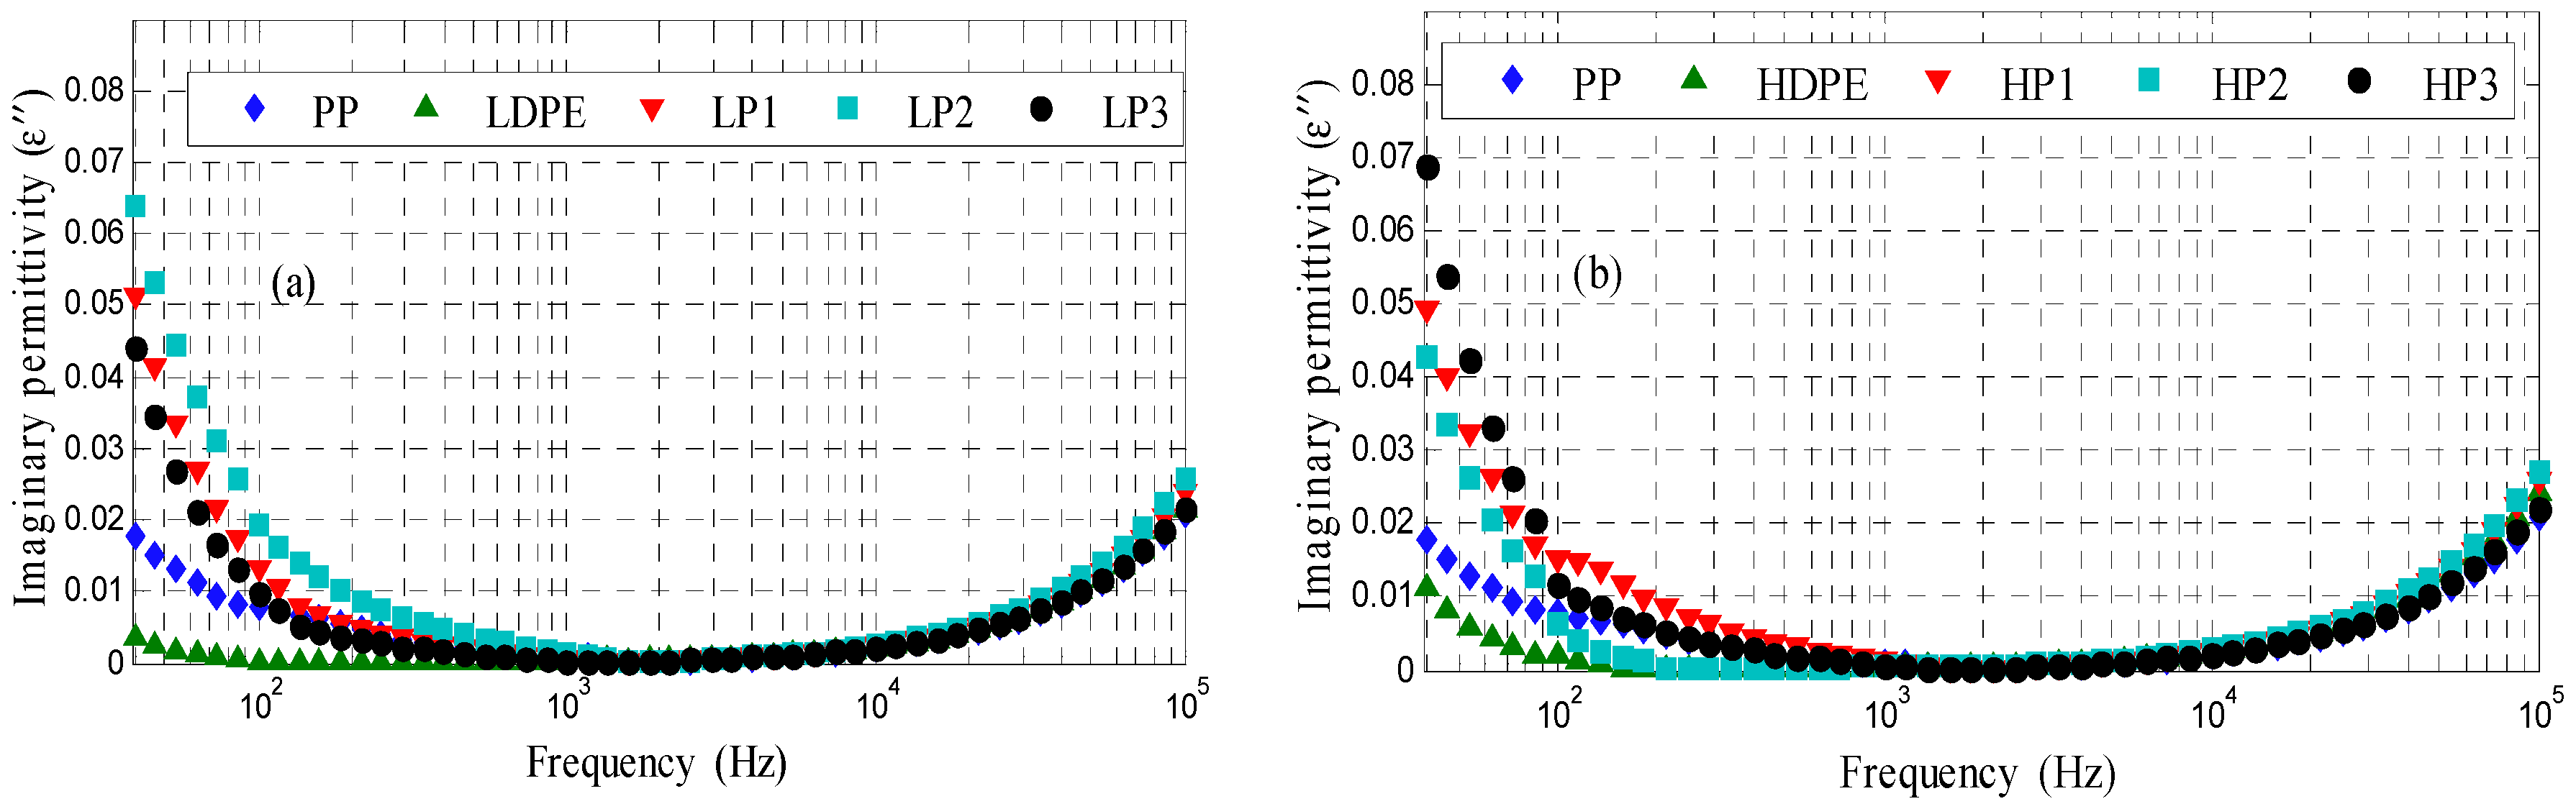
The measurement of the imaginary part of the relative permittivity, , is presented in Figure 7a,b, as a frequency-dependent parameter for the HDPE/PP and LDPE/PP compounds. The results showed that the values of increased at frequencies higher than 3 kHz for all samples. This was attributable to the increased in relaxation loss of the dielectric materials when they were exposed to high-frequency field. Furthermore, ionic polarization may possibly occur in a higher-frequency range, leading to additional increments of the values. This may induce the charge carriers to immediately cross the surface of the polymer compound at higher frequencies [37]. Between 1 kHz and 3 kHz, the value of was low because of slower polarization mechanisms [38]. ENREF_35. From 40 to 1 kHz, value declined, which was also due to slower polarization mechanism. This was due to the fact that long carbon chains attached to the main chain were stretching and twisting. From the observation of these results, the values of pure LDPE and HDPE samples were lower than that of the PP sample. However, the values of the blended samples were decreased compared to those of the pure samples at a low frequency. These results may explain the lower dielectric strength of polymer compounds in comparison with LDPE and HDPE samples. This is due to a higher possibility of creating conduction paths and subsequently to a reduction of the breakdown voltage.
4. Conclusions
In this work, breakdown strength measurements of polymer compounds were successfully performed to investigate the impact of synthesis polymers on their dielectric properties. Impedance measurements as a function of frequency and the average degree of crystallinity taken from differential scanning calorimetry (DSC) measurements were successfully determined to characterize the LDPE/PP and HDPE/PP compounds. It was observed that the dielectric strength of the LDPE/PP and HDPE/PP compounds were lower than those of the pure LDPE and HDPE samples. However, these values revealed an enhancement of the dielectric strength for PP when HDPE and LDPE were added in different ratios. The dielectric constants of the blended materials exhibited an increasing trend compared to the pure samples, as observed for the dielectric losses at low frequency, which had higher values than for the pure samples. The DSC results displayed two exothermic crystallization peaks, representing two crystalline phases. In addition, the DSC results showed that the blended samples were physically bonded, and no occurrence of co-crystallization was detected in the polymer compounds.
Author Contributions
S.Z.A.D., H.A.I., and B.C.A. conceived and designed the research methodologies; S.Z.A.D. and M.Z.H.M. performed the experiments and analyzed the data; S.Z.A.D., N.A.A.L., H.A.I., and B.C.A. wrote the paper.
Funding
The authors thank the University of Malaya, Malaysia and Ministry of Higher Education, Malaysia for supporting this work through HIR research grant (grant number: HIR H-16001-D00048), Postgraduate Research Funds (grant number: PPP PG028-2016A) and Fundamental Research Grant Scheme (grant number: FRG0413-SG-1/2015).
Conflicts of Interest
The authors declare no conflict of interest.
References
- Dabbak, S.; Illias, H.; Bee Chin, A.; Tunio, M.A. Surface discharge characteristics on HDPE, LDPE and PP. In Applied Mechanics and Materials; Trans Tech Publ: Malacca, Malaysia, 2015; pp. 383–387. [Google Scholar]
- Wan, C.; Sun, G.; Gao, F.; Liu, T.; Esseghir, M.; Zhao, L.; Yuan, W. Effect of phase compatibility on the foaming behavior of LDPE/HDPE and LDPE/PP blends with subcritical CO2 as the blowing agent. J. Supercrit. Fluids 2017, 120 Pt 2, 421–431. [Google Scholar] [CrossRef]
- Wang, B.; Wang, M.; Xing, Z.; Zeng, H.; Wu, G. Preparation of radiation crosslinked foams from low-density polyethylene/ethylene-vinyl acetate (LDPE/EVA) copolymer blend with a supercritical carbon dioxide approach. J. Appl. Polym. Sci. 2013, 127, 912–918. [Google Scholar] [CrossRef]
- Dikobe, D.; Luyt, A. Comparative study of the morphology and properties of PP/LLDPE/wood powder and MAPP/LLDPE/wood powder polymer blend composites. Express Polym. Lett. 2010, 4, 729–741. [Google Scholar] [CrossRef]
- Wang, Y.; Zou, H.; Fu, Q.; Zhang, G.; Shen, K.; Thomann, R. Shear-induced morphological change in PP/LLDPE blend. Macromol. Rapid Commun. 2002, 23, 749–752. [Google Scholar] [CrossRef]
- Huerta-Martínez, B.; Ramírez-Vargas, E.; Medellín-Rodríguez, F.; García, R.C. Compatibility mechanisms between EVA and complex impact heterophasic PP–EPx copolymers as a function of ep content. Eur. Polym. J. 2005, 41, 519–525. [Google Scholar] [CrossRef]
- Gonzalez, J.; Albano, C.; Ichazo, M.; Dı́az, B. Effects of coupling agents on mechanical and morphological behavior of the PP/HDPE blend with two different CaCo3. Eur. Polym. J. 2002, 38, 2465–2475. [Google Scholar] [CrossRef]
- Souza, A.; Demarquette, N. Influence of coalescence and interfacial tension on the morphology of pp/hdpe compatibilized blends. Polymer 2002, 43, 3959–3967. [Google Scholar] [CrossRef]
- Chiu, F.-C.; Yen, H.-Z.; Lee, C.-E. Characterization of pp/hdpe blend-based nanocomposites using different maleated polyolefins as compatibilizers. Polym. Test. 2010, 29, 397–406. [Google Scholar] [CrossRef]
- Andersson, M.G.; Hynynen, J.; Andersson, M.R.; Englund, V.; Hagstrand, P.-O.; Gkourmpis, T.; Müller, C. Highly insulating polyethylene blends for high-voltage direct-current power cables. ACS Macro Lett. 2017, 6, 78–82. [Google Scholar] [CrossRef]
- Pallon, L.K.; Nilsson, F.; Yu, S.; Liu, D.; Diaz, A.; Holler, M.; Chen, X.R.; Gubanski, S.; Hedenqvist, M.S.; Olsson, R.T. Three-dimensional nanometer features of direct current electrical trees in low-density polyethylene. Nano Lett. 2017, 17, 1402–1408. [Google Scholar] [CrossRef] [PubMed]
- Piah, M.A.M.; Darus, A.; Hassan, A. Electrical tracking performance of lldpe-natural rubber blends by employing combination of leakage current level and rate of carbon track propagation. IEEE Trans. Dielectr. Electr. Insul. 2005, 12, 1259–1265. [Google Scholar] [CrossRef]
- Cruz, S.; Zanin, M. Assessment of dielectric behavior of recycled/virgin high density polyethylene blends. IEEE Trans. Dielectr. Electr. Insul. 2004, 11, 855–860. [Google Scholar] [CrossRef]
- Moyassari, A.; Unge, M.; Hedenqvist, M.S.; Gedde, U.W.; Nilsson, F. First-principle simulations of electronic structure in semicrystalline polyethylene. J. Chem. Phys. 2017, 146, 204901. [Google Scholar] [CrossRef] [PubMed] [Green Version]
- Achilias, D.; Roupakias, C.; Megalokonomos, P.; Lappas, A.; Antonakou, Ε. Chemical recycling of plastic wastes made from polyethylene (LDPE and HDPE) and polypropylene (PP). J. Hazard. Mater. 2007, 149, 536–542. [Google Scholar] [CrossRef] [PubMed]
- Chiu, F.-C.; Yen, H.-Z.; Chen, C.-C. Phase morphology and physical properties of PP/HDPE/organoclay (nano) composites with and without a maleated EPDM as a compatibilizer. Polym. Test. 2010, 29, 706–716. [Google Scholar] [CrossRef]
- Dhoble, A.; Kulshreshtha, B.; Ramaswami, S.; Zumbrunnen, D. Mechanical properties of PP-LDPE blends with novel morphologies produced with a continuous chaotic advection blender. Polymer 2005, 46, 2244–2256. [Google Scholar] [CrossRef]
- Bertin, S.; Robin, J.-J. Study and characterization of virgin and recycled LDPE/PP blends. Eur. Polym. J. 2002, 38, 2255–2264. [Google Scholar] [CrossRef]
- IEEE Guide for the Statistical Analysis of Electrical Insulation Breakdown Data; IEEE Std 930-2004 (Revision of IEEE Std 930-1987); IEEE: Piscataway, NJ, USA, 2005.
- Makmud, M.; Illias, H.; Chee, C.; Sarjadi, M. Influence of conductive and semi-conductive nanoparticles on the dielectric response of natural ester-based nanofluid insulation. Energies 2018, 11, 333. [Google Scholar] [CrossRef]
- Dongling, M.; Treese, A.H.; Richard, W.S.; Anna, C.; Eva, M.; Carina, Ö.; Linda, S.S. Influence of nanoparticle surface modification on the electrical behaviour of polyethylene nanocomposites. Nanotechnology 2005, 16, 724. [Google Scholar]
- Bashir, N.; Ahmad, H.; Suddin, M.S. Ageing studies on transmission line glass insulators using dielectric dissipation factor test. In Proceedings of the 2010 Conference Proceedings IPEC, Singapore, 27–29 October 2010; pp. 1062–1066. [Google Scholar]
- Paraskevas, C.D.; Vassiliou, P.; Dervos, C.T. Temperature dependent dielectric spectroscopy in frequency domain of high-voltage transformer oils compared to physicochemical results. IEEE Trans. Dielectr. Electr. Insul. 2006, 13, 539–546. [Google Scholar] [CrossRef]
- Dabbak, S.; Illias, H.; Ang, B. Effect of surface discharges on different polymer dielectric materials under high field stress. IEEE Trans. Dielectr. Electr. Insul. 2017, 24, 3758–3765. [Google Scholar] [CrossRef]
- Ieda, M. Dielectric breakdown process of polymers. IEEE Trans. Electr. Insul. 1980, EI-15, 206–224. [Google Scholar] [CrossRef]
- Pourrahimi, A.M.; Olsson, R.T.; Hedenqvist, M.S. The role of interfaces in polyethylene/metal-oxide nanocomposites for ultrahigh-voltage insulating materials. Adv. Mater. 2018, 30, 1703624. [Google Scholar] [CrossRef] [PubMed]
- Fischer, P.H.; Nissen, K.W. The short-time electric breakdown behavior of polyethylene. IEEE Trans. Electr. Insul. 1976, 37–40. [Google Scholar] [CrossRef]
- Hosier, I.; Vaughan, A.; Swingler, S. Structure–property relationships in polyethylene blends: The effect of morphology on electrical breakdown strength. J. Mater. Sci. 1997, 32, 4523–4531. [Google Scholar] [CrossRef]
- ASTM D149 Standard Test Method for Dielectric Breakdown Voltage and Dielectric Strength of Solid Electrical Insulating Materials at Commercial Power Frequencies; Annual Book of ASTM Standards; ASTM: West Conshohocken, PA, USA, 1992.
- Munaro, M.; Akcelrud, L. Correlations between composition and crystallinity of LDPE/HDPE blends. J. Polym. Res. 2008, 15, 83–88. [Google Scholar] [CrossRef]
- Pourrahimi, A.M.; Hoang, T.A.; Liu, D.; Pallon, L.K.; Gubanski, S.; Olsson, R.T.; Gedde, U.W.; Hedenqvist, M.S. Highly efficient interfaces in nanocomposites based on polyethylene and zno nano/hierarchical particles: A novel approach toward ultralow electrical conductivity insulations. Adv. Mater. 2016, 28, 8651–8657. [Google Scholar] [CrossRef] [PubMed]
- Pourrahimi, A.M.; Liu, D.; Andersson, R.L.; Ström, V.; Gedde, U.W.; Olsson, R.T. Aqueous synthesis of (2) oxygen-terminated defect-free hierarchical zno particles and their heat treatment for enhanced reactivity. Langmuir 2016, 32, 11002–11013. [Google Scholar] [CrossRef] [PubMed]
- Benguigui, L.; Yacubowicz, J.; Narkis, M. On the percolative behavior of carbon black cross-linked polyethylene systems. J. Polym. Sci. Part B Polym. Phys. 1987, 25, 127–135. [Google Scholar] [CrossRef]
- Zhang, X.; Wen, H.; Chen, X.; Wu, Y.; Xiao, S. Study on the thermal and dielectric properties of srtio3/epoxy nanocomposites. Energies 2017, 10, 692. [Google Scholar] [CrossRef]
- Iyer, G.; Gorur, R.; Richert, R.; Krivda, A.; Schmidt, L. Dielectric properties of epoxy based nanocomposites for high voltage insulation. IEEE Trans. Dielectr. Electr. Insul. 2011, 18. [Google Scholar] [CrossRef]
- Mohamed, M.G.; Abd-El-Messieh, S.L.; El-Sabbagh, S.; Younan, A.F. Electrical and mechanical properties of polyethylene–rubber blends. J. Appl. Polym. Sci. 1998, 69, 775–783. [Google Scholar] [CrossRef]
- Singha, S.; Thomas, M.J. Permittivity and tan delta characteristics of epoxy nanocomposites in the frequency range of 1 MHz–1 GHz. IEEE Trans. Dielectr. Electr. Insul. 2008, 15, 2–11. [Google Scholar] [CrossRef]
- Liu, J.; Zheng, H.; Zhang, Y.; Wei, H.; Liao, R. Grey relational analysis for insulation condition assessment of power transformers based upon conventional dielectric response measurement. Energies 2017, 10, 1526. [Google Scholar] [CrossRef]
Figure 1.
Breakdown measurement chamber.

Figure 2.
Average breakdown strength of (a) High-density polyethylene (HDPE)/polypropylene (PP) blends; (b) Low-density polyethylene (LDPE)/polypropylene (PP) blends.
Figure 2.
Average breakdown strength of (a) High-density polyethylene (HDPE)/polypropylene (PP) blends; (b) Low-density polyethylene (LDPE)/polypropylene (PP) blends.

Figure 3.
Weibull probability curves of breakdown strength of (a) HDPE/PP blends; (b) LDPE/PP blends.
Figure 3.
Weibull probability curves of breakdown strength of (a) HDPE/PP blends; (b) LDPE/PP blends.

Figure 4.
Differential scanning calorimetry (DSC) heating thermograms showing the melting temperature of (a) LDPE/PP blends; (b) HDPE/PP blends.
Figure 4.
Differential scanning calorimetry (DSC) heating thermograms showing the melting temperature of (a) LDPE/PP blends; (b) HDPE/PP blends.

Figure 5.
DSC cooling thermograms showing the crystallization temperature of (a) LDPE/PP blends; (b) HDPE/PP blends.
Figure 5.
DSC cooling thermograms showing the crystallization temperature of (a) LDPE/PP blends; (b) HDPE/PP blends.

Figure 6.
Permittivity real component (ε′) of (a) LDPE/PP blends; (b) HDPE/PP blends.

Figure 7.
Permittivity imaginary component (ε″) of (a) LDPE/PP blends; (b) HDPE/PP blends.


Table 1.
Values of the scale and shape parameters for the Low-density polyethylene (LDPE)/polypropylene (PP) blends.
Table 1.
Values of the scale and shape parameters for the Low-density polyethylene (LDPE)/polypropylene (PP) blends.
| Sample | Number of Tests | Scale Parameter, α | Shape Parameter, β |
|---|---|---|---|
| PP | 9 | 57 | 8 |
| LDPE | 9 | 85 | 9 |
| LP1 | 9 | 67 | 5 |
| LP2 | 9 | 69 | 4 |
| LP3 | 9 | 62 | 3 |
Table 2.
Values of the scale and shape parameters for the High-density polyethylene (HDPE)/polypropylene (PP) blends.
Table 2.
Values of the scale and shape parameters for the High-density polyethylene (HDPE)/polypropylene (PP) blends.
| Sample | Number of Tests | Scale Parameter, α | Shape Parameter, β |
|---|---|---|---|
| PP | 9 | 57 | 8 |
| HDPE | 9 | 73.6 | 7.7 |
| HP1 | 9 | 80.5 | 4.6 |
| HP2 | 9 | 66.5 | 3.5 |
| HP3 | 9 | 72 | 4.6 |
Table 3.
Crystallization temperatures of the LDPE/PP and HDPE/PP blends.
| Sample | Tm1 (°C) | Tm2 (°C) | TC1 (°C) | TC2 (°C) | Melting Enthalpy (J/g) | Degree of Crystallinity (%) | ||||
|---|---|---|---|---|---|---|---|---|---|---|
| HDPE | LDPE | PP | HDPE | LDPE | PP | |||||
| HDPE | 129 | - | 117.1 | - | 190 | - | - | 65 | - | - |
| LDPE | 114 | - | 101.7 | - | - | 101 | - | - | 34 | - |
| PP | 171 | - | 119.4 | - | - | - | 99 | - | - | 47 |
| LP1 | 113 | 169 | 101.9 | 121.9 | - | 95 | 93 | - | 32 | 45 |
| LP2 | 113.2 | 169.7 | 101.6 | 120.7 | - | 97 | 96 | - | 33 | 46 |
| LP3 | 114.8 | 167.2 | 102.4 | 116.2 | - | 95 | 85.6 | - | 32 | 41 |
| HP1 | 127.2 | 168.3 | 117.9 | - | 169.2 | - | 86.2 | 57 | - | 41 |
| HP2 | 127.9 | 167.6 | 117.6 | - | 163.64 | - | 84 | 55 | - | 40 |
| HP3 | 127 | 168 | 117.7 | - | 152.78 | - | 79 | 52 | - | 38 |
© 2018 by the authors. Licensee MDPI, Basel, Switzerland. This article is an open access article distributed under the terms and conditions of the Creative Commons Attribution (CC BY) license (http://creativecommons.org/licenses/by/4.0/).
Share and Cite
MDPI and ACS Style
Ahmed Dabbak, S.Z.; Illias, H.A.; Ang, B.C.; Abdul Latiff, N.A.; Makmud, M.Z.H. Electrical Properties of Polyethylene/Polypropylene Compounds for High-Voltage Insulation. Energies 2018, 11, 1448. https://doi.org/10.3390/en11061448
AMA Style
Ahmed Dabbak SZ, Illias HA, Ang BC, Abdul Latiff NA, Makmud MZH. Electrical Properties of Polyethylene/Polypropylene Compounds for High-Voltage Insulation. Energies. 2018; 11(6):1448. https://doi.org/10.3390/en11061448
Chicago/Turabian StyleAhmed Dabbak, Sameh Ziad, Hazlee Azil Illias, Bee Chin Ang, Nurul Ain Abdul Latiff, and Mohamad Zul Hilmey Makmud. 2018. "Electrical Properties of Polyethylene/Polypropylene Compounds for High-Voltage Insulation" Energies 11, no. 6: 1448. https://doi.org/10.3390/en11061448
Note that from the first issue of 2016, this journal uses article numbers instead of page numbers. See further details here.