A Novel Hybrid IDS Based on Modified NSGAII-ANN and Random Forest


1
Department of Information Security and Communication Technology, NTNU Norwegian University of Science and Technology, 2815 Gjøvik, Norway
2
Department of Computer Engineering Zanjan Branch, Islamic Azad University Zanjan, Zanjan 45156-58145, Iran
*
Author to whom correspondence should be addressed.
Electronics 2020, 9(4), 577; https://doi.org/10.3390/electronics9040577
Submission received: 27 February 2020
/
Revised: 17 March 2020
/
Accepted: 21 March 2020
/
Published: 29 March 2020
(This article belongs to the Section Artificial Intelligence)
Abstract
:Machine-learning techniques have received popularity in the intrusion-detection systems in recent years. Moreover, the quality of datasets plays a crucial role in the development of a proper machine-learning approach. Therefore, an appropriate feature-selection method could be considered to be an influential factor in improving the quality of datasets, which leads to high-performance intrusion-detection systems. In this paper, a hybrid multi-objective approach is proposed to detect attacks in a network efficiently. Initially, a multi-objective genetic method (NSGAII), as well as an artificial neural network (ANN), are run simultaneously to extract feature subsets. We modified the NSGAII approach maintaining the diversity control in this evolutionary algorithm. Next, a Random Forest approach, as an ensemble method, is used to evaluate the efficiency of the feature subsets. Results of the experiments show that using the proposed framework leads to better outcomes, which could be considered to be promising results compared to the solutions found in the literature.
1. Introduction
Presently, the internet can be considered to be an undeniable part of people’s daily lives, and the total number of internet users has grown, exponentially. As a result, these users are eager to transmit a higher volume of critical data through the wires. Therefore, the infrastructure built for data transmission should consider security issues to create a reliable, accurate, and configurable security system. To protect the security and integrity of user data, various tools, such as firewalls, antivirus, encryption, and authentication applications are in place. However, the mentioned tools have not been efficient enough to safeguard the systems against various types of threats [1]. Moreover, when it comes to capability of detecting attacks, these tools face difficulty in separating Dos attacks from normal traffic [2]. To improve the security of the networks, it is suggested to combine the firewalls with intrusion-detection systems [3]. Ashfaq et al. [4] have described the intrusion-detection process as a series of steps which enables us to monitor, detect, and analyze activities violating network security policies [5]. Denning [6] et al. proposed a framework for detecting the network attacks, which is called an intrusion-detection system. This framework is based on the assumption that security violation can be identified by monitoring system audit records for abnormal patterns of system usage [4]. In other words, the attacker’s behavior can be considered to be a basis for anomaly-based detection systems [7]. These systems define malicious behavior as an activity which demonstrates a deviation from the regular operation. The most significant benefit that these systems can provide for the users is the influential detection rate of both known and unknown attacks [8]. A proper tuned IDS guarantees deeper insight into networks by providing visibility and control measures to minimize the threats and attacks. Machine-learning algorithms can bring a lot of advantages for the daily monitoring of the network systems, but these techniques should be adopted in order to increase the attack detection rate, and to decline the system complexity. As the data collected from networks are high-dimensional data, processing this data in the format as they are collected, make the system inefficient. The irrelevant features should be removed using proper feature selection in order to decline the computation time, increase prediction performance, and recognize the pattern involved in the proposal methods [9]. The main objective of this paper is to propose an intrusion-detection framework which performs well due to using a feature-selection algorithm that reduces the number of features effectively and the performance of the intrusion-detection framework is improved on different datasets, namely two in this study. In intrusion-detection systems, several feature-selection methods have been applied to reduce the dimensionality of the datasets. However, feature-selection methods come with their challenges. That is, the feature-selection problem consists of two conflicting objectives which are the minimization of the number of features and classification error. The single objective feature-selection approaches applied in intrusion-detection systems are not able to confront both objectives simultaneously. Consequently, we have the following two research questions:
- Can multi-objective-based feature-selection frameworks be used to address this problem?
- Since the redundancy in feature subsets is defined as a deficiency [10], how can we address the redundant feature subsets issue?
Hence, the motivation of this paper is to fill this gap by using multi-objective techniques. We have addressed the first research question by applying the conjunction of NSGAII, as a multi-objective genetic method, and an artificial neural network to solve the aforementioned issue. The research done in [10] mentions the availability of redundant feature subsets in traditional NSGAII as one of the main disadvantages of this approach for feature-selection purposes. To address the second research question, we have modified the NSGAII method to remove the redundant feature subsets to be replaced with new individuals. The most significant contributions of this paper can be stated as follows:
- We proposed a novel hybrid intrusion-detection framework. The correlation between the multi-objective genetic algorithm (NSGAII) and the neural network builds the basis of the feature-selection approach. Afterwards, we have applied Random Forest to evaluate the efficiency of the method.
- The NSGAII approach used in this framework is modified to improve the diversity of solutions through the redundant solution removal.
The rest of this paper is organized as follows. An overview of related works is presented in Section 2. Section 3 describes the datasets employed to evaluate the efficiency of the presented methodology and their advantages versus those found in the literature. Section 4 describes the proposed method including the pre-processing stage applied on the datasets, the details of the proposed feature-selection method, and the classification technique used in conjunction with the NSGAII method, and the ensemble method used to examine the selected feature subsets. Section 5 lists and explains the common performance metrics applied in the literature and the results are discussed in Section 6. Finally, Section 7 concludes the paper.
2. Related Work
In this section, we have conducted a narrative literature review of the latest feature-selection approaches used in intrusion-detection systems. We have focused our searching process to discover the answer to the research questions mentioned previously in Section 1.
Selvakumar et al. [11] have proposed a novel feature-selection method based on the firefly algorithm. Next, they have applied the C4.5 and Bayesian network at the intermediate stage to evaluate the feature-selection approach. The number of features has been fixed at a predefined value. If the amount of the proposed features is higher than this value the mutual information (MI) would be used to select the best features; otherwise, the MI would be used to add more features from unselected ones.
The work conducted in [12] is based on the combination of the evolutionary algorithm and support vector machine as a hybrid method. This technique consists of two main stages. In the first step, the genetic algorithm is applied to create the new feature sets. Then, the support vector machine (SVM) classification performance is used to optimize the feature-selection process. 10 out of 45 attributes are selected in this proposed hybrid method. Javaid et al. [13] have applied a deep learning approach for intrusion detection. The self-taught algorithm is selected in this work, and three metrics such as sum of square-error, weight decay, and sparsity penalty have been employed in the cost function.
Kang et al. [14] have employed a local search algorithm for the task of feature selection. The cost function used in this research is based on a clustering method, the K-means. This technique has been used to divide the samples into two distinct categories, labelled, normal cluster and Dos attack cluster. To evaluate the functionality of this method, Multi-layer Perceptron( MLP) has been applied on the NSL-KDD [15] dataset.
Khammassi et al. [3] have proposed a wrapper feature-selection method to decrease the feature subset size. In this work, they have searched the feature space by genetic algorithm initially. Next, the proposed feature subset has been evaluated by logistic regression(LR). The decision tree used to evaluate the effectiveness of this method is built based on the combination of three different classifiers C4.5, Random Forest, and Naive Bayes, respectively.
In [8], a combination of the filter and wrapper approaches have been employed to select the ideal feature subsets from the main dataset. The authors have used the feature grouping concept, which leads to lower variance and greater feature-selection stability. This technique applies the feature grouping linear correlation coefficient (FGLCC) as the feature ranking method in the first step. Afterwards, the cuttlefish (CFA) has been applied to the feature subsets to improve the final efficiency of the proposed method. The most significant benefit mentioned for this method is the combination of filter and wrapper methods, which enables the system to get the positive points of both approaches.
Aghdam et al. [16] have proposed a feature-selection method based on a nature-inspired meta-heuristic approach. The ant colony optimization approach has been used to address the dimensionality issue in the intrusion-detection problem. They have applied the proposed framework on NSL-KDD [15], and KDDCup99 [17] datasets. The outputs of the proposed method show a notable decline in the memory size and the CPU time required for intrusion detection by reducing the number of the features. As a result, it can be considered to be a reliable approach.
The work reported in [18] is based on the application of various machine-learning algorithms, such as Bayes Net, J48, Random Forest, and Random Tree on KDDCup99 dataset. The Random Forest and Random Tree methods have resulted in the highest optimized accuracy in this system. The feature-selection approach used on the dataset is the correlation-based feature selection with a Best First search method.
A feature-selection technique which improved the classifier performance has been introduced in [19]. The method used in this work is based on intelligent water drops (IWD). This method can be considered to be a nature-inspired optimization process. The support vector machine is responsible for evaluating the performance of the released dataset. The data set used in this work is KDDCUP99, and the samples are divided into normal and attack categories.
Aljawarneh et al. [20] have developed a feature-selection method which minimizes significantly the computational and time complexity. In the provided framework, initially, the feature subset size is decreased from 41 to 8 features involved in this dataset using the information gain feature-selection approach. First, the features with information gain upper than 0.4 were selected and next an ensemble classifier is applied to examine the performance of the classifier. The results of this approach enhanced the detection accuracy and lowered the false positive rate.
The research done in [21] has proposed an intelligent intrusion-detection system. The feature-selection step applied to this system is based on two ranking methods called the information gain and correlation methods. Then, a novel feature-selection approach is introduced to select useful features from the ranked features. Finally, the Artificial neural network is applied to evaluate the proposed feature subsets.
Bostan et al. [22] have presented a hybrid feature-selection method based on binary gravitational search algorithm (BGSA) and mutual information (MI). This technique can be considered to be a combination of both hybrid and wrapper feature-selection approaches. Moreover, a multi-objective function has been defined to maximize the detection rate and minimize the false-positive rate simultaneously by employing the binary gravitational search algorithm. The proposed feature-selection method is tested by support vector machine (SVM) on NSL-KDD [15] dataset.
An incremental feature-selection algorithm is proposed in [23], which merges the cuttlefish and extended chi-square method. Then, an intelligent classification method is used in the classification stage. This classification method is named a multi-class support vector machine. The clustering, intelligent agent, and decision tree are applied to this method to get improved results for classification accuracy. Potluri et al. [24] refer to the parallel computing abilities of the neural network as an essential factor to enhance the efficiency of the intrusion-detection systems. They have applied the deep learning neural network on the NSL-KDD dataset to fulfil the aforementioned benefit of this method. The differential evolution is considered to be a powerful tool in continuous optimization problems. However, the work reported in [25] established its capabilities in discrete optimization problems as well. They have proposed an intrusion-detection system which applies the discretized differential evolution (DDE) and C4.5 in the feature-selection step. The NSL-KDD dataset is used in this work to show the performance of the technique.
The research done in [26] applied the NSGAII approach for feature-selection purpose in intrusion-detection systems. This multi-objective feature selection is used to reduce the complexity of Growing Hierarchical Self-Organizing Maps (GHSOMs) as an unsupervised clustering procedure. However, the issue regarding the redundant feature subset presence in NSGAII has not been discussed in this paper. To the best of our knowledge, none of the current research available in the field of intrusion-detection systems has recognized, and resolved this issue for feature-selection purposes. As a result, we have decided to modify our NSGAII-ANN approach to resolve the redundancy issue in this framework.
3. DataSet Description
The KDDCUP99 dataset [17] is a publicly available dataset which has been widely applied in the research area of the intrusion-detection systems. It contains 5 million training and more than 2 million testing samples. In this work, we have applied a refined version of this dataset, which is called NSL-KDD [15]. The improvements of the novel dataset compared to the previous version could be mentioned as follows:
- The redundant records of the KDDCUP99 has been removed in the newer version. These records were leading the classifiers to illustrate biased results in favor of frequent records.
- The logical number of records which exist in the dataset enables the experiment to be executed on the full dataset instead of randomly choosing a small segment of the dataset.
- The volume of the selected records has an inversely proportional relationship with the percentage of records in KDDCUP99 dataset.
The second dataset which has been applied in this research to illustrate the efficiency of the proposed method is called the UNSW-NB15 [27]. It was developed in 2015 to solve some of the issues regarding NSL-KDD dataset. This dataset offers the novel categories of cyber-attacks as well as normal samples [28]. Moreover, it involves nine various attack categories, as follows: ‘Fuzzers’, ‘Dos’, ‘Analysis’, ‘Reconnaissance’, ‘Exploits’, ‘ShellCode’, ‘Worm’, ‘Backdoor’, and ‘Generic’ [29].
4. Proposed Framework
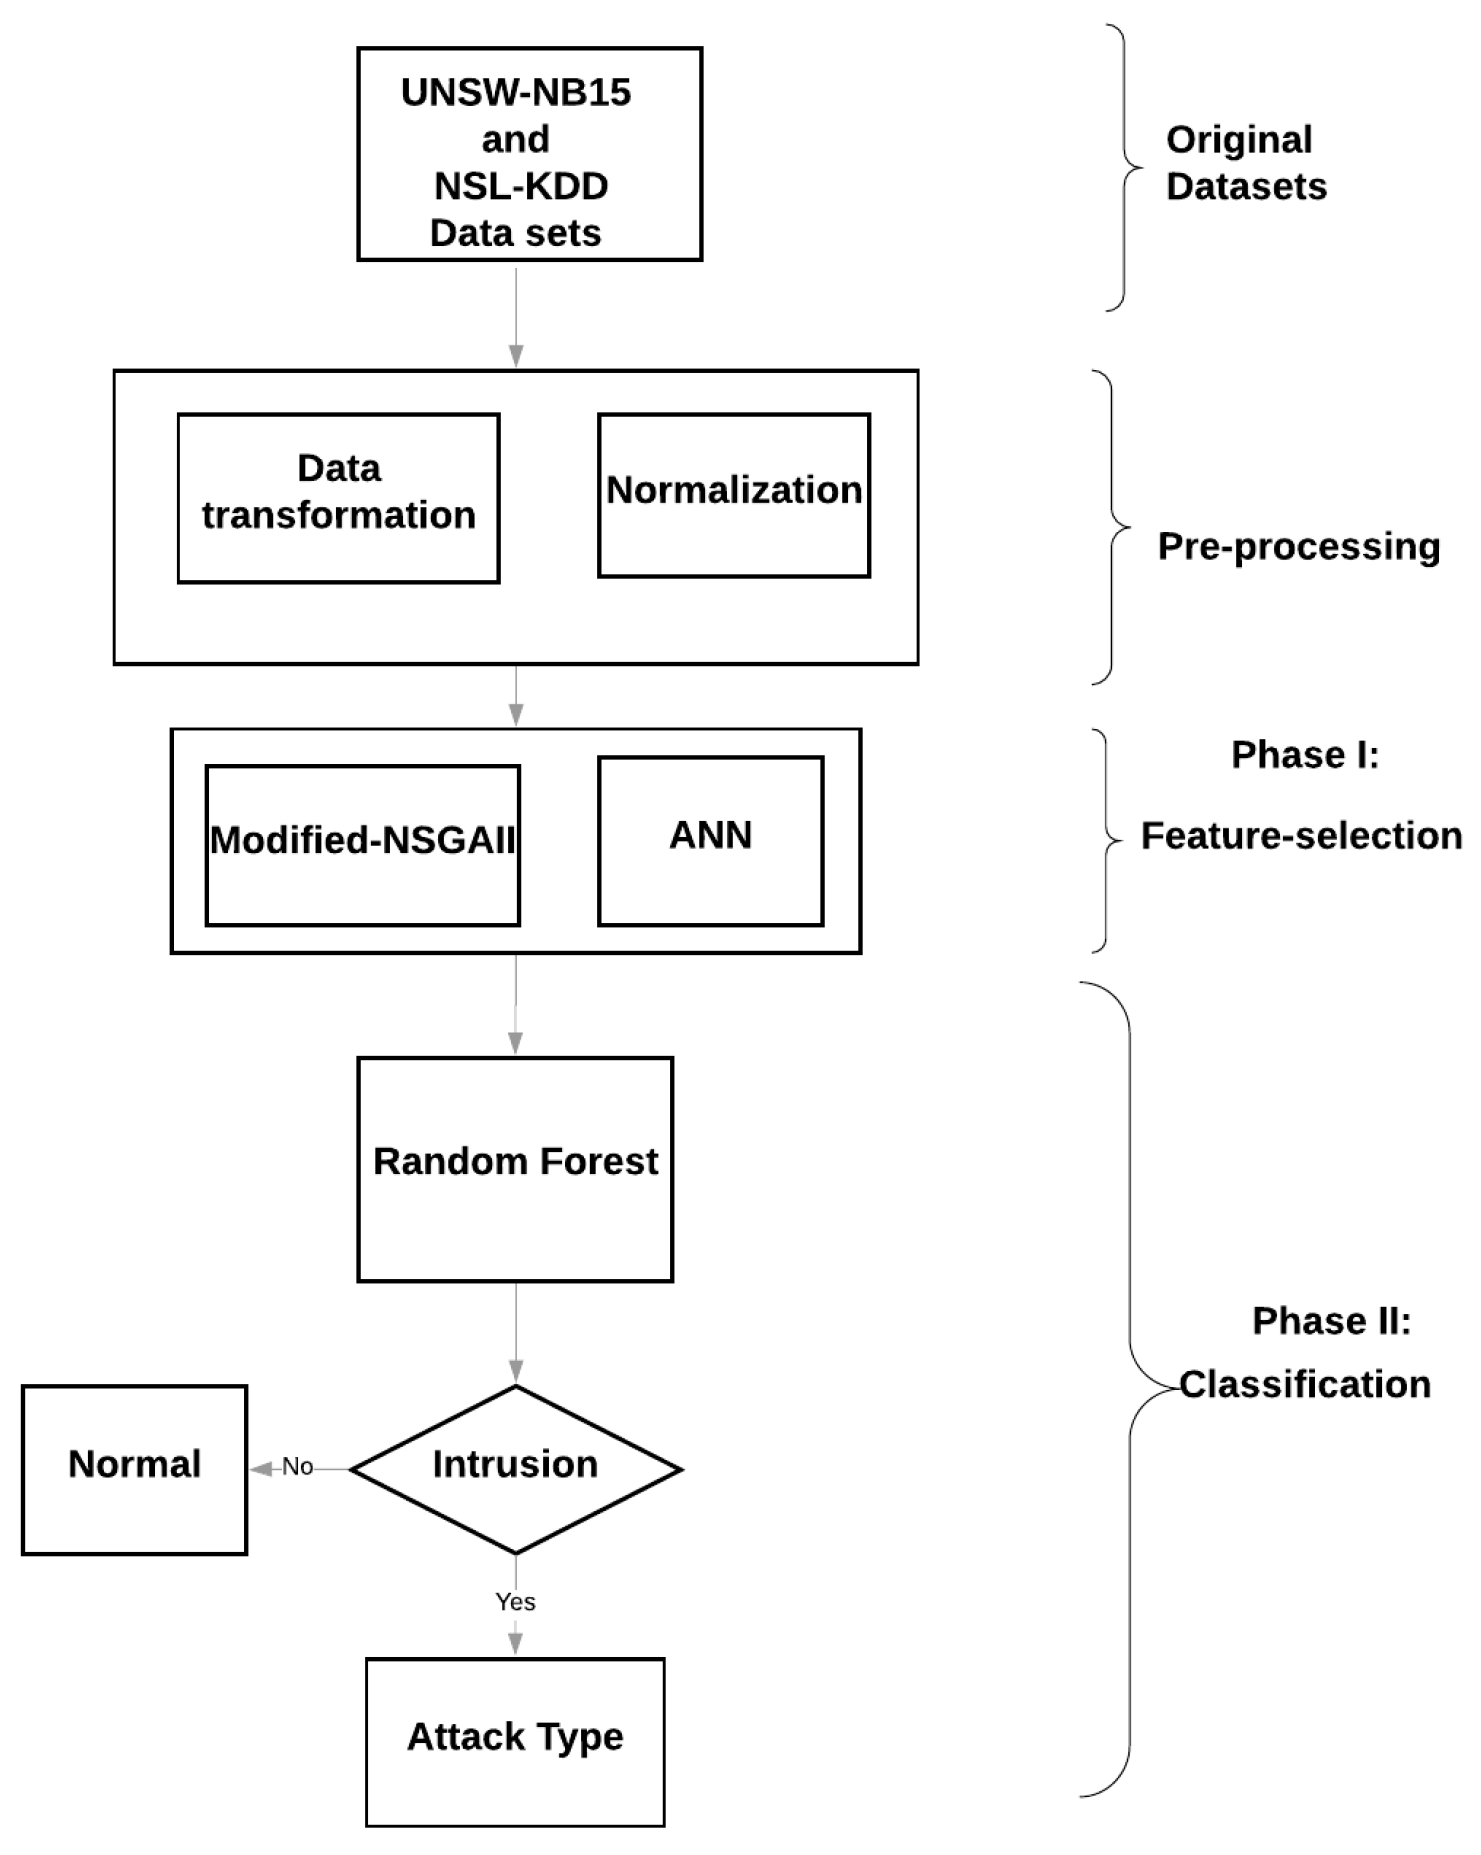
In the proposed framework (Figure 1), the original datasets are fed into the prepossessing stage, initially. In other words, the nominal values of the selected datasets are transformed into integer numbers, and all the features are normalized changing them to a standard scale, without distorting differences in the ranges of values. In phase I, the interaction between the modified NSGAII, and the artificial neural network (ANN) has built the basis of the feature-selection approach. The proposed feature-selection method would suggest potential feature subsets which could offer the optimized performance. We have modified the NSGAII approach, which is used in this phase. The modification removes the redundant feature subset solutions and improves the diversity of the offered feature subsets. In phase II, the best solution among the suggested feature subsets is chosen. Next, the samples are classified using the Random Forest method. The aforementioned classifier would ascertain whether the specific traffic could be recognized as an intrusion or normal traffic. The details about the steps involved in this framework can be found in the following sections.
4.1. The Pre-Processing Stage
The dataset used in the context of intrusion detection contains different data types, such as continuous, discrete, and symbolic with different resolution, and ranges. Most of the existing classification algorithms are inadequate to deal with these heterogeneous datasets. Therefore, it is necessary to pre-process data and to transform those features in a way to be handled by the classification algorithms. The pre-processing steps applied in this research, consists of two main steps. In data transformation, all nominal features are mapped to integer values ranging from 0 to where S is the number of symbols.
4.2. Phase I: Feature Selection Using NSGAII-ANN
In the first phase, a modified version of the NSGAII algorithm is applied to establish a feature-selection method. We have defined the feature-selection method to optimize the multi-objective problem of classification error, and the feature subset size minimization, which can be described as follows:
where refers to the first objective function, which is equal to the classification error. denotes the second objective function, namely features subset size. The feasible solution (feature subset) is depicted by S. The Artificial neural network is employed as the classifier to calculate (classification error). Afterwards, the modified NSGAII algorithm is applied to optimize the multi-objective feature-selection problem expressed in Equation (2).
4.2.1. Traditional NSGAII Algorithm
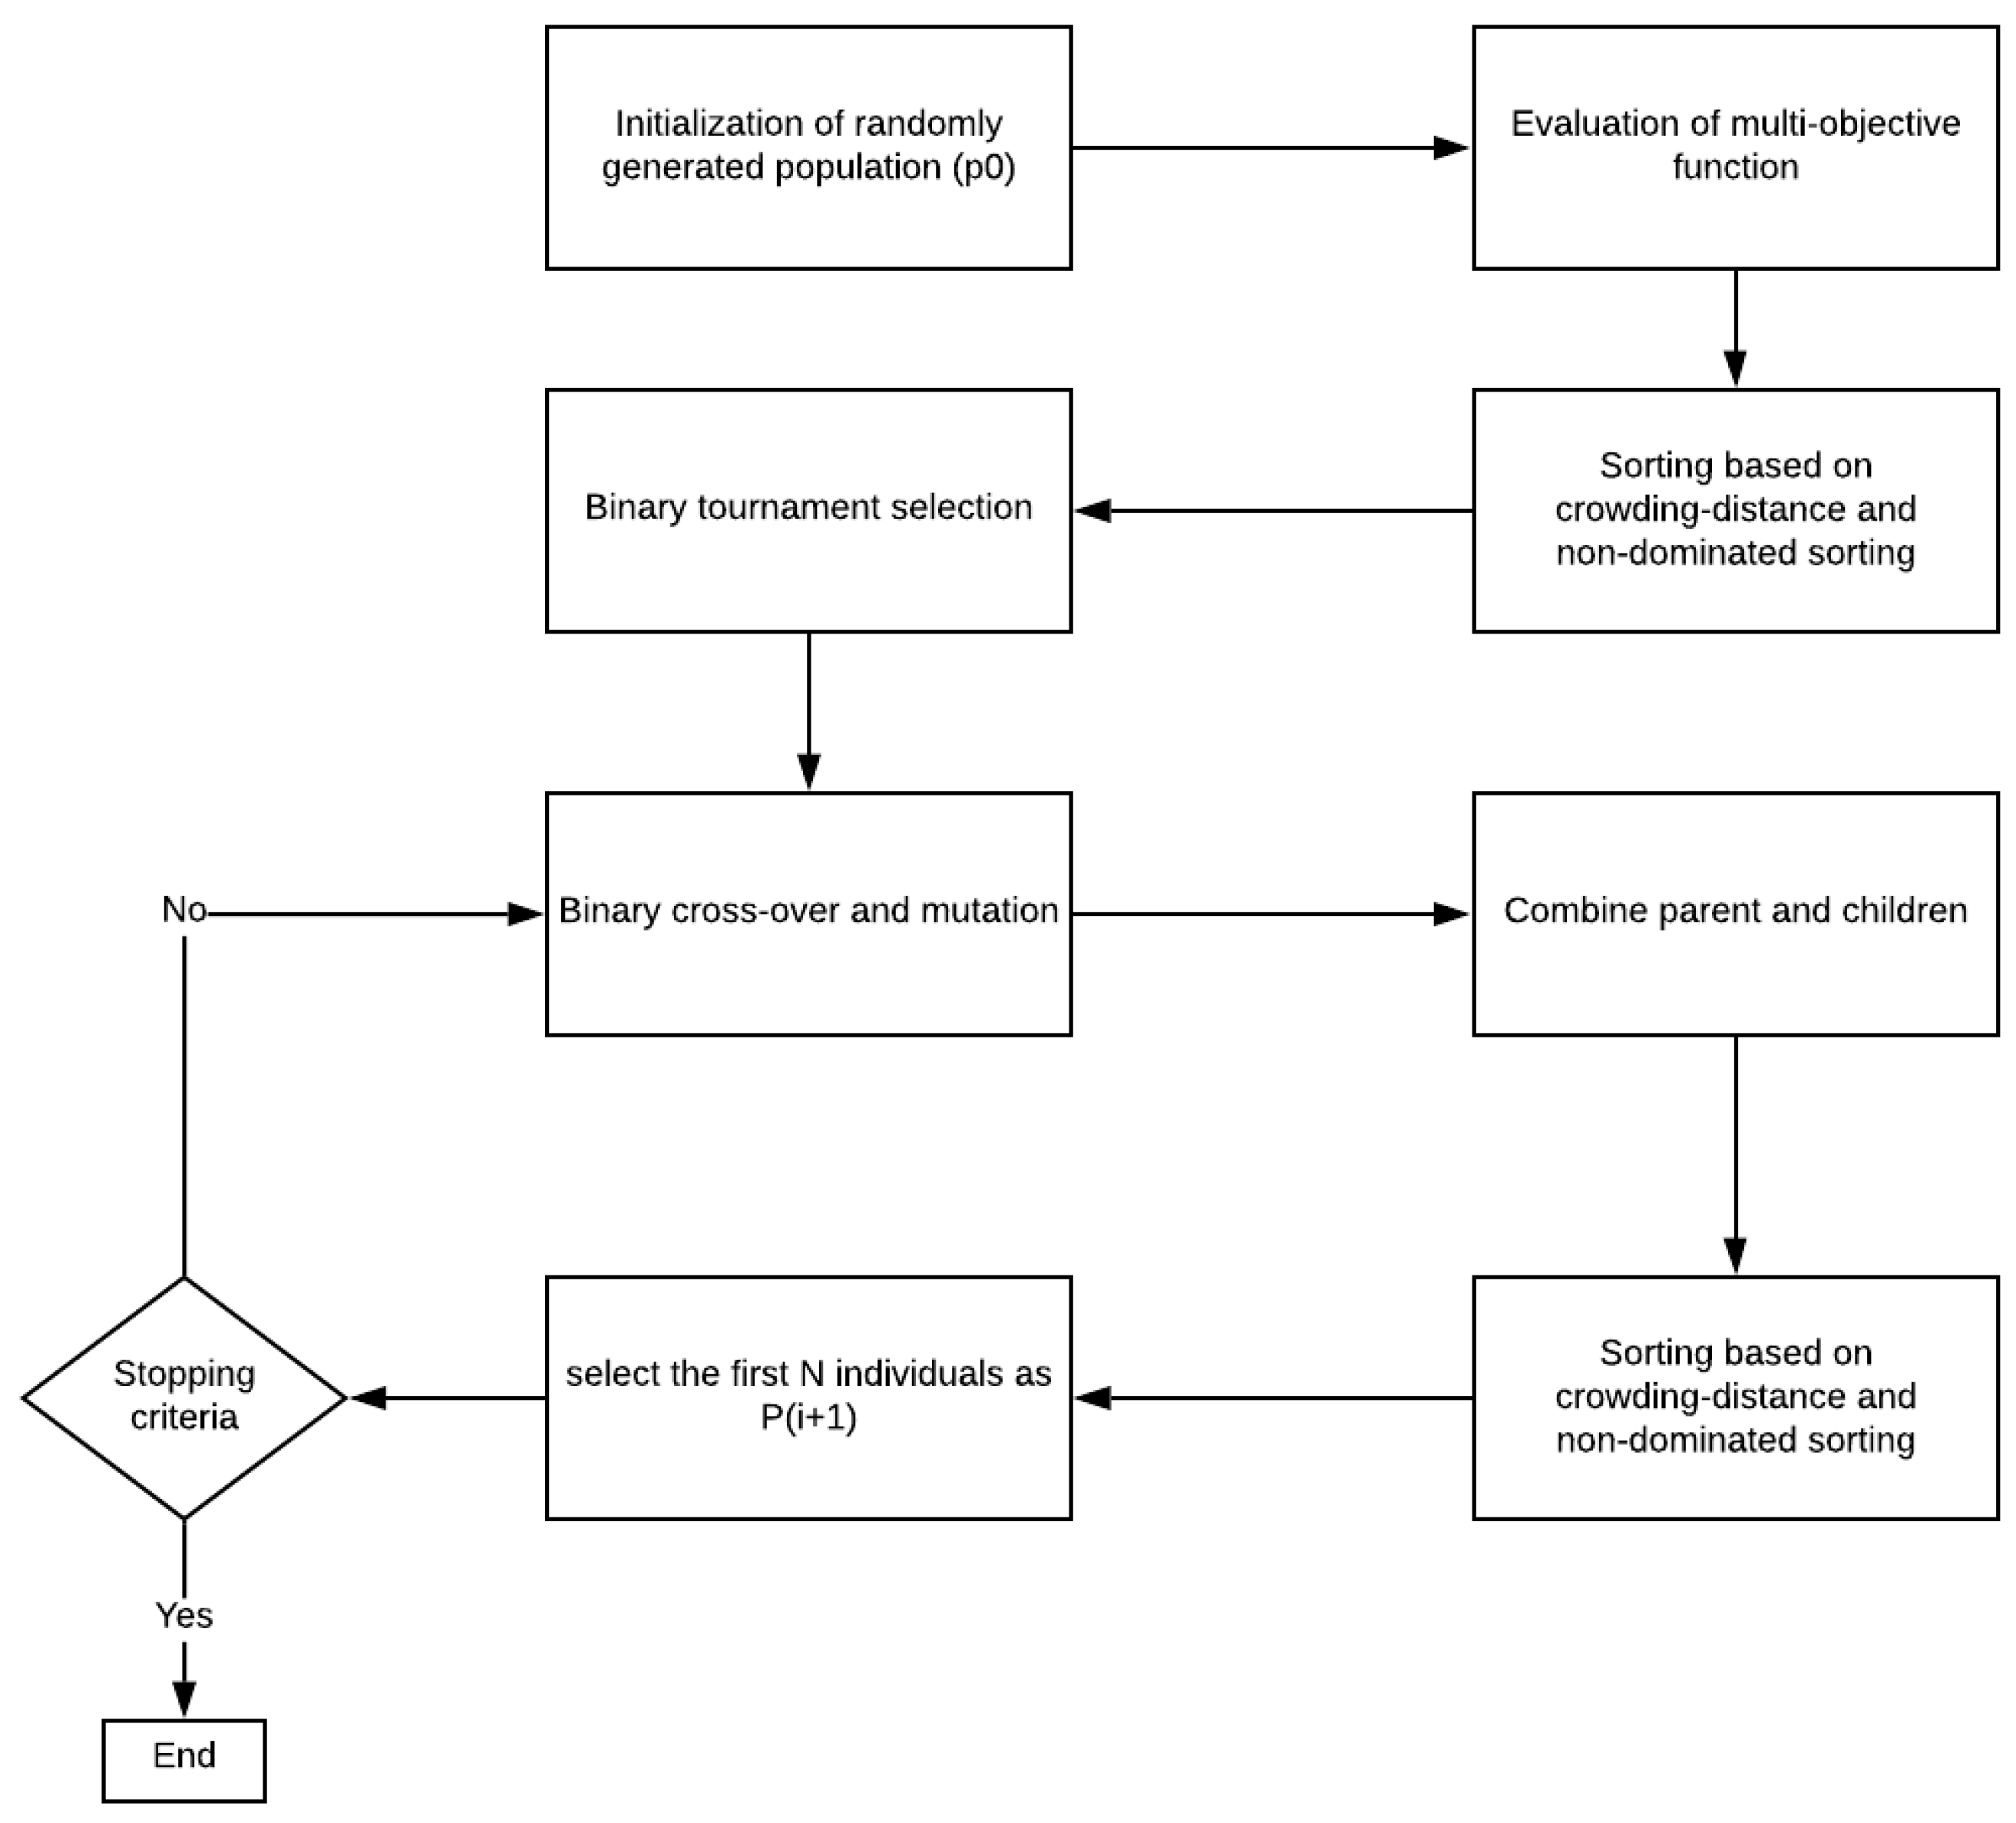
Figure 2 demonstrates the steps involved in the optimization process of the traditional multi-objective genetic algorithm which is called NSGAII.
Initially, the parents in the first iteration of the algorithm are generated through a random population called (i = 0). The multi-objective function mentioned in Equation (2) will be computed, and the population will be sorted based on non-dominated sorting and crowding distance. We have defined the crowding distance and crowded-comparison operator in Section 4.2.2 where the best solution can be selected among those ones with lower domination rank. More information about this sorting process can be found in [30]. The sorted parent population in this phase will be served into the main loop of the algorithm. The binary tournament selection, binary cross-over, and mutation are applied to gain the off-springs (). In this paper, A roulette-wheel selection is employed to do the cross-over. This approach is the combination of single-point, double-point, and uniform crossovers with the probability of 0.1, 0.2, and 0.7, respectively.
Imagine and are the two individuals. The following steps are employed on these individuals to apply single-point cross-over. A random point called X is chosen between 1 and n-1 and the created novel individuals are like:
and . The double-point cross-over method is based on two cross-over points, Y and Z, which are randomly generated between 1 and n-1 as follows. and .
In the uniform cross-over, a fixed mixing ratio is applied to the parents. This type of cross-over provides an opportunity to the chromosomes of parents to work on the gene level compared to the segment level used in single and double-point crossovers.
The two children are generated according to the following equation:
The mutation operator in this formula is built by bitwise mutation. Each individual bit is filliped with the probability of (mutation probability) which is the conversion of 1 to 0, and vice versa. Then, the combined population is formed from the parents () and the off-springs () population. We will call the current population . The multi-objective function defined in Equation (2) will be computed in this step. Now, the total number of individuals in is more than the required population size which is equal to N. Consequently, we will need to sort the population based on non-dominated sorting and crowding distance to obtain the best set of solutions with size N. The process of sorting the R(i) based on the aforementioned factors is explained in [30].
First, the non-dominated sorting is applied to sort the population . Now, the solutions belonging to the best non-dominated set, , are considered to be the best solution in the combined population and should be emphasized more than any other solution. All the members of the first Pareto front () will be chosen if the size of is smaller than N for the population. The Subsequent non-dominated fronts will fill the remaining members of the population . As a result, the solution followed by until will fill the gaps. The i will be increased in each step as long as the population does not have enough space to accept the last front sorted by non-dominated sorting completely. Let us call this front as . In this case, crowding distance will be the factor which assists us in choosing the most important solutions in this Pareto front. We will apply the crowding distance in descending order, and we will select the best solutions required to fill all population slots.
4.2.2. Crowding Distance
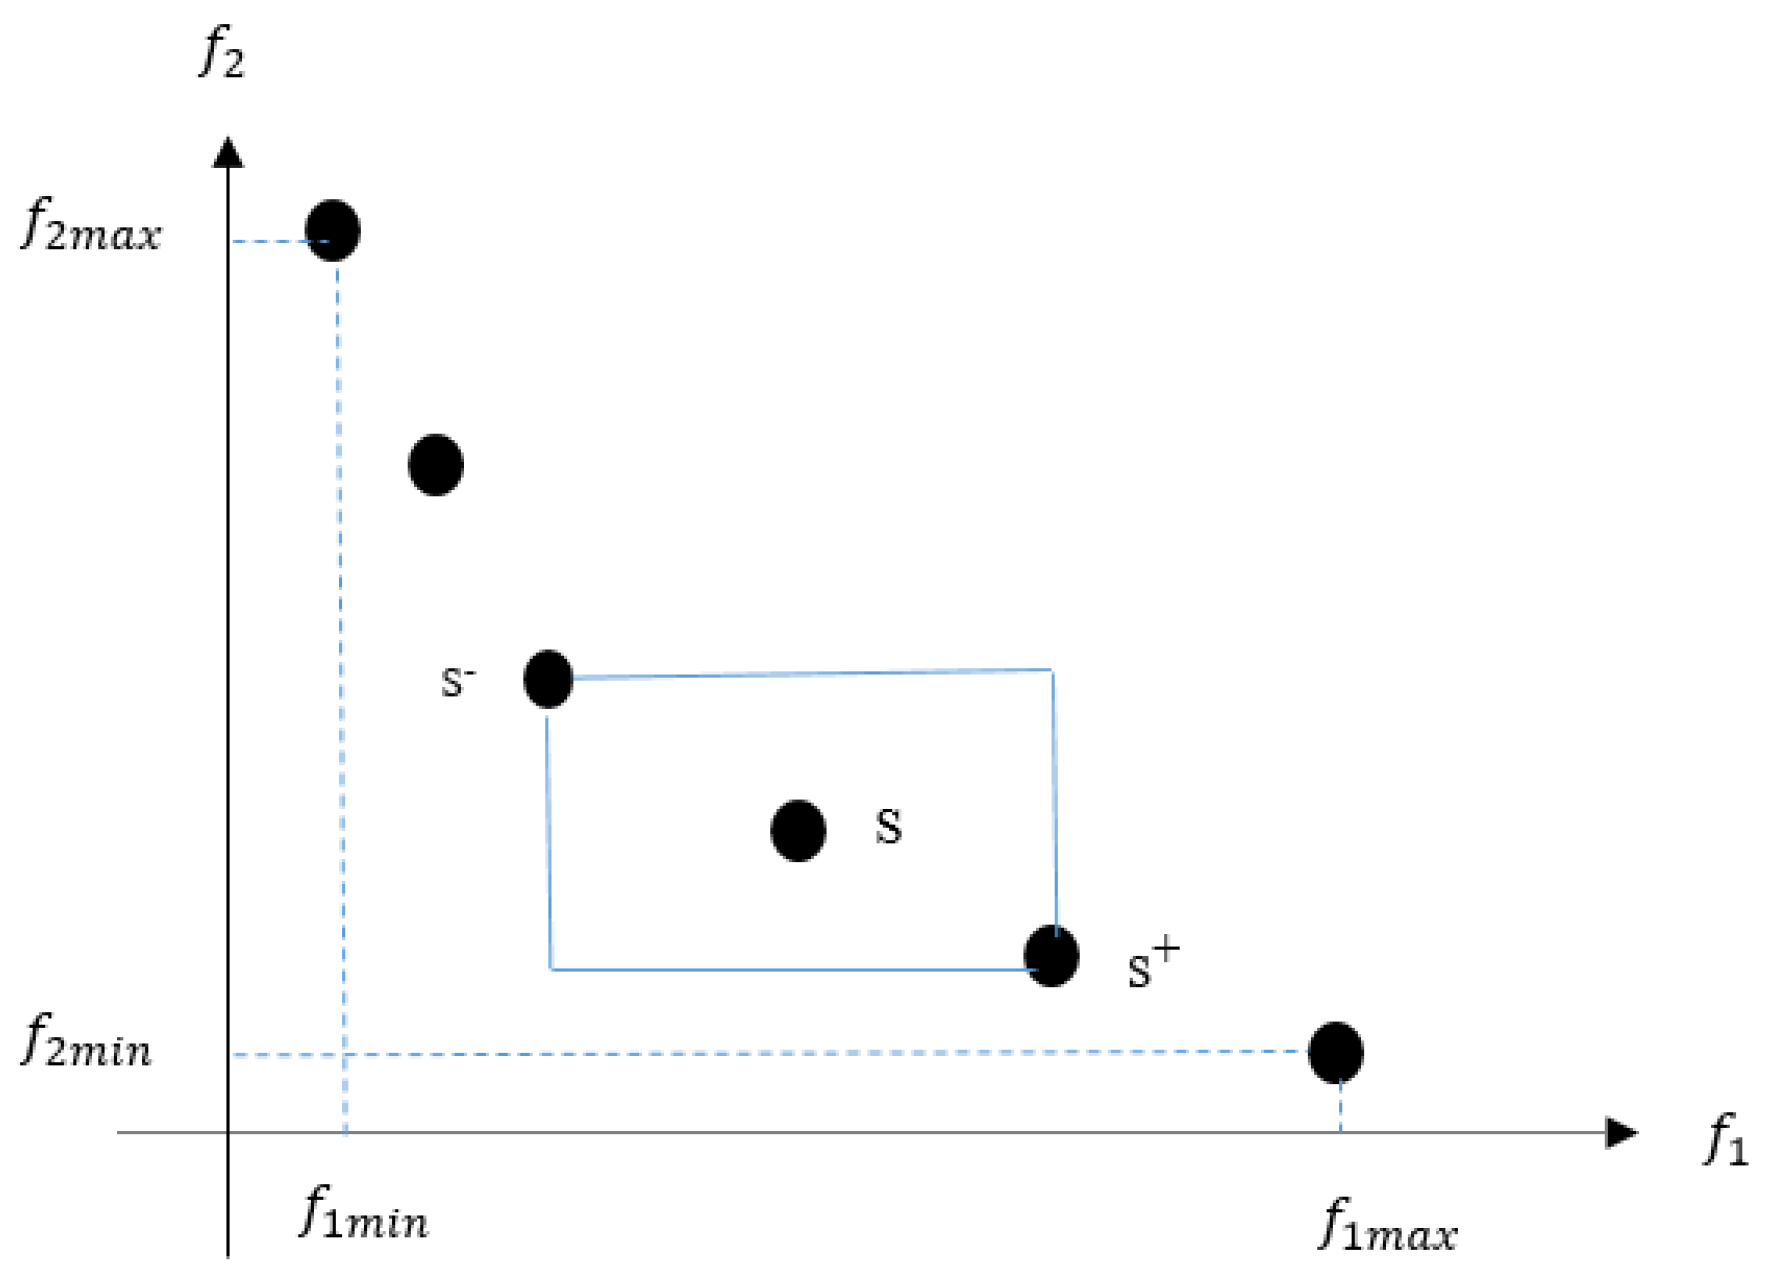
The NSGAII algorithm exploits the crowding-distance assignment to estimate the density of solutions. The crowding-distance for each solution S in the population should be estimated by the cuboid-perimeter measurement. The closest results of each individual in the same non-dominated front are involved in the measurement of this perimeter. Figure 3 depicts the cuboid illustration where and refer to the two objective functions, and filled circles indicate the similar non-dominated front solutions. The two closest solutions, and , are shown by filled circles, and the solution S is surrounded by a box which refers to the crowding-distance, estimated by Equation (5). The maximum and minimum values of in a special non-dominated front are mentioned by and .
Algorithm 1 illustrates the crowded-comparison operator process where ‘S’ as a better solution is shown with s > . In this algorithm, the favored solution is the case with the lower non-domination rank, and if both of the solutions are part of the same non-dominated front, the solution with the larger crowding distance will be selected.
| Algorithm 1: Crowded-comparison operator |
| Input: Solution s and ; |
| OutPut: s < or s > ; |
| ifrank(s) < rank() |
| or |
| [rank(s) = rank() and crowd(s) > crowd ()] then |
| return s > ; |
| else return s < ; |
4.2.3. Modified NSGAII Method
The modification that we have applied in our framework is based on the the redundant feature subsets availability issue which has been previously discussed in Section 1. As mentioned previously, the research in [10] refers to the presence of inefficient and redundant feature subsets as the most significant issue regarding NSGAII application in feature-selection solutions. As a result, we have applied an additional condition to the traditional non-dominated sorting method used in NSGAII to ensure that all the redundant solutions are omitted. The steps involved in this modification can be found in Algorithm 2.
| Algorithm 2:Modified fast non-dominated sorting |
 |
4.3. ANN Algorithm
In a neural network, one of the most significant methods used to compute weight adoption can be mentioned as the Levenberg-Marquardt (LM) approach. The gradient descent rule, as well as the Gauss–Newton method, construct the basis of the LM method. The gradient descent algorithm is applied with large values in the first step, where a parameter specifies the step size. Other small values are employed in the following steps, which are equal to the Gauss–Newton method. The most important advantage of the Levenberg-Marquardt method is that it takes the benefits of both techniques while evading their consequences.
In the LM method, the change in the weights (w) is obtained by the following equation
where E is the mean-squared network error and can be calculated as follows:
where N is the number of examples; is the network output corresponding to the example , and is the desired output for the cited example. The elements of the matrix are given by:
where is the number of the network outputs.
Starting from initial random weights, both and are evaluated, and by solving (6), a correction for the values of the weights is obtained ().
This is known as an LM learning process in which each iteration reduces the error until the desired goal is achieved or a minimum is found. In Equation (8), is a parameter which is adjusted at each iteration, according to the error evolution. If it is very small, the matrix will become an approximation to the Hessian method.
4.4. Phase II: Best Solution Selection and Random Forest Classification for Evaluation
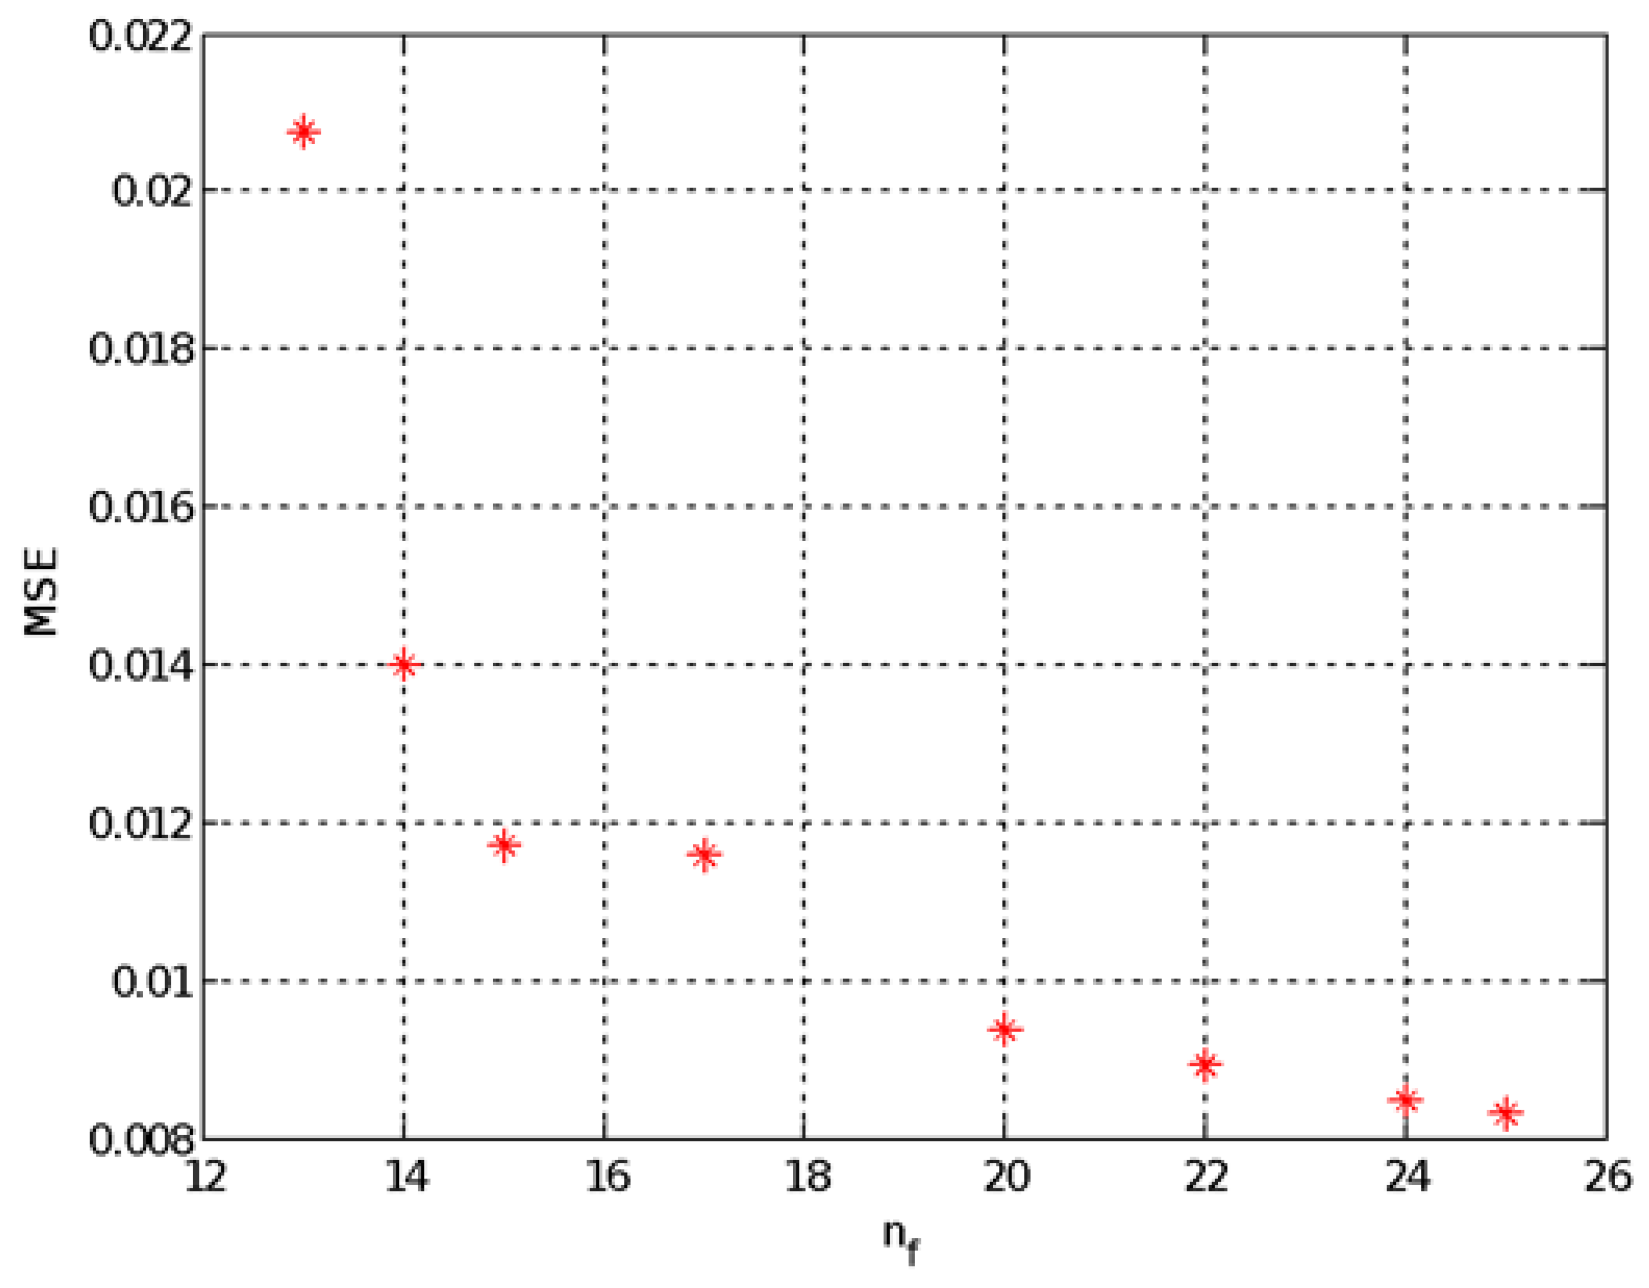
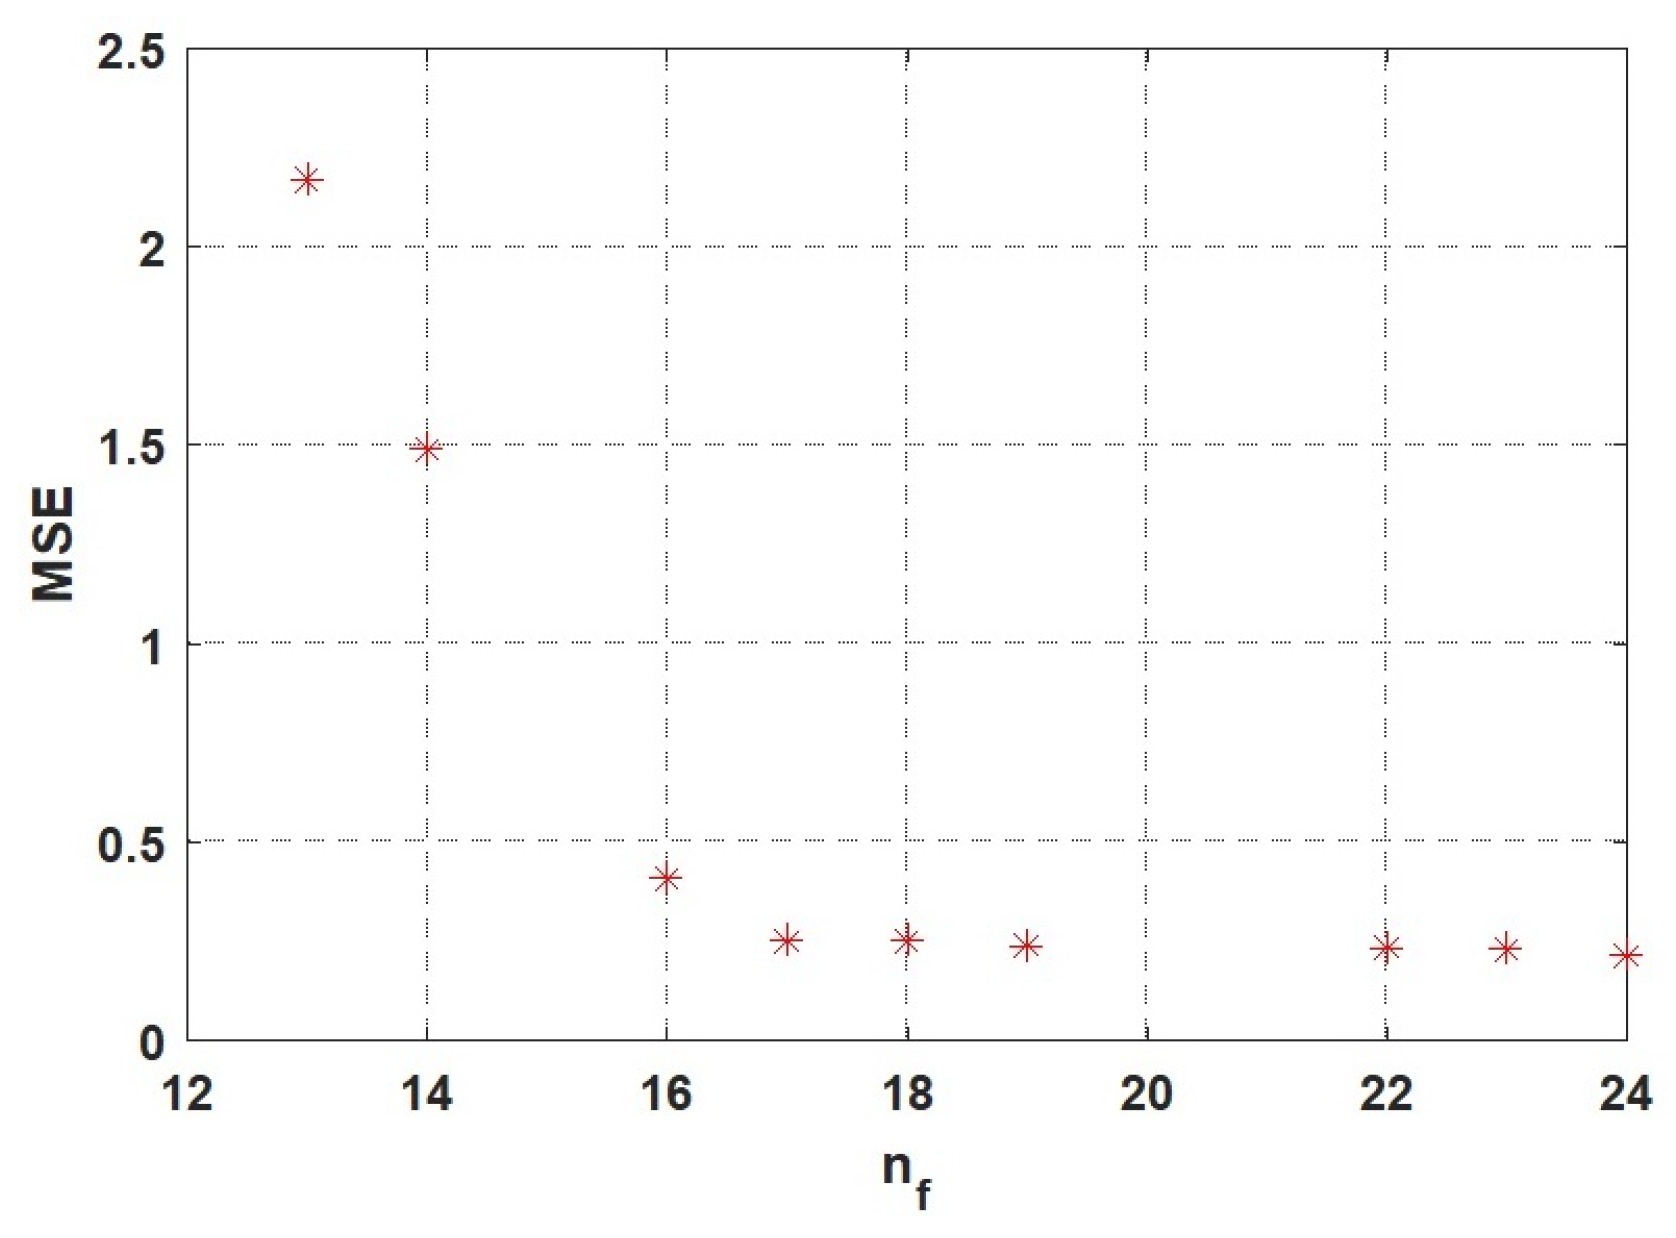
Figure 4 and Figure 5 depict the feature subsets released in phase I for NSL-KDD, and UNSW-NB15 datasets, respectively. Each potential feature subset is depicted by star symbols in these figures, and the curve derived from these stars is known as the Pareto front.
Further information about each of the proposed feature sets for NSL-KDD, and UNSW-NB15 datasets can be found in Table 3 and Table 4, respectively. In these tables, Num, nf, selected features, and MSE represent the solution identification number on the Pareto front, the number assigned to the chosen features, and MSE (Mean-square-error) of the first phase classifier, respectively. To select the best feature subset; we have attempted to make a balance between the number of features and the mean-square error.
In our experiment on the NSL-KDD dataset, we have chosen the 7th member on Table 3 as the solution (selected feature subset) for the evaluation process. This individual represents the second solution with the least error rate. Twenty-four out of 41 features presented on the NSL-KDD data set is suggested to be selected from the NSL-KDD to be used in the classification phase, which corresponds to 60% of the entire features. The selected features are listed in the third column of Table 3, These numbers represent the order of selected features on the NSL-KDD dataset. In the second experiment on the UNSW-NB15 dataset, the 6th feature subset available in Table 4 has been selected due to a low MSE and also a low number of features, which reduce the complexity of the dataset and the overall computing power of the classifiers. Therefore, we have selected only 19 features out of the total number of features available on UNSW-NB15 dataset.
The dimension of the both datasets have been reduced according to the recommended feature subsets. Afterwards, we have applied the Random Forest classification technique to evaluate the efficiency of the proposed approach. Ensemble classifiers are being selected to be used in the classification process, as in similar studies they have shown effectiveness in intrusion-detection systems [3]. These types of classifiers integrate several weak classifiers to improve classification performance. Moreover, Boosting and bagging could be categorized as the most well-known approaches in ensemble methods. The boosting approach is based on applying extra weights to incorrect predictions, and the final result is taken through the weighted vote of the predictions. On the other hand, the majority vote on the bootstrap sample of the dataset builds the basis of the bagging method. Random Forest could be considered to be a bagging approach which has received an extra layer of randomness. The structure of the classification and regression trees in Random Forest follows a different pattern compared to standard trees. First, the subset of the predictors are randomly generated. Next, the most efficient of the aforementioned factors are used to split the nodes. This approach has shown better performance in compassion with all the other methods such as: Support vector machine (SVM). It is also robust against over-fitting. As a result, the Random Forest, as an ensemble method, has been applied to the dataset to evaluate the performance of the proposed method.
5. Evaluation Metrics for IDS
We have applied the evaluation metrics used in the majority of the current state-of-art. Khan et al. [31] introduced accuracy, precision, recall, F-measure, and false-positive rate(FPR) as the most common metrics used in intrusion-detection systems. These metrics can be defined as follows:
where TP, TN, FP, and FN can be defined as follows:
- True Positive (TP): the number of correct classification attack packets as attacks.
- True Negative (TN): the number of correct classifications of normal packets as normal.
- False Negative (FN): this value expresses that an incorrectly classification process occurs where the attack packet classified as the normal packet, a large value of FN leads to a serious problem for confidentiality and availability of network resources because of the attackers succeed to pass through intrusion-detection system.
- False-Positive (FP): this value illustrates incorrect classification decision where the normal packet classified as an attack, The increment of FP value increases the computation time; however, on the other hand, it is considered a less harmful increase in comparing the FN value.
6. Experimental Results
The proposed feature-selection solution was implemented using MATLAB R2019a. Next, the reduced size dataset was fed into the Random Forest algorithm available in Waikato Environment for Knowledge Analysis (Weka 3.8) and was executed on a PC with intel Core i7 processor, 2.1 GHz speed and 8 GB RAM. The 10-fold classification approach has been chosen where each dataset is split into ten folds. The test dataset is selected from one of these portions, and the remaining are used to train the classification method. The aforementioned procedure will be repeated over ten iterations, and the final estimation is calculated through the average of previous steps. The main benefit of this method is regarding the employment of all samples in training and testing.
The total number of features in the original NSL-KDD dataset is equal to 41 features. These features have been reduced to 24 features by the NSGAII-ANN approach. Afterwards, they have been classified into normal and abnormal states using the Random Forest classifier. The accuracy of this stage, according to the 10-fold cross-validation test is 99.408. The confusion matrix related to this experiment is presented in Table 5. Moreover, the accuracy obtained in multi-class states is equal to 99.3%, and its confusion matrix can be found in Table 6.
Table 7 and Table 8 show the evaluation of the proposed method on the NSL-KDD dataset based on precision, recall, F-measure, false-positive rate, and accuracy. The reported results could be considered to be promising outcomes for both normal–abnormal and Multi-Class states using 24 out of 41 features.
To demonstrate the effectiveness of the proposed method, the experiment has been applied on UNSW-NB15 dataset as well. The accuracy obtained by this method is 94.802 for the two-state categorization of the labels where the class labels are divided into normal, and abnormal. Table 9 shows the confusion matrix regarding this experiment. The proposed method illustrate improved results regarding other factors such as: precision, recall, F-measure with a small low-average value of false-positive rate (0.06). The evaluation results are available on Table 10.
In the multi-state classification, 211,306 out of 257,673 samples were correctly classified, which is slightly equal to 82% of instances. Table 11 demonstrates the confusion matrix of the proposed method on UNSW-NB15, and further evaluations can be found in Table 12. The highest F-measure value has been reported for the normal, and generic classes with the values higher than 92%, and the lowest F-measure value is regarding the Worms, and Back classes which have approximately the lowest number of the instances. As a result, the imbalanced UNSW-NB15 dataset could be considered to be one of the potential factors in this difference between various classes performance.
To show the effectiveness of the proposed method, we have compared the results to the state-of-art. The reported accuracy for the NSL-KDD and UNSW-NB15 are equal to 99.4%, and 94.8%, respectively. In addition, the 6% false-positive rate is obtained for the experiment on both datasets. Table 13 depicts the comparison of the proposed method compared to state of the art conducted on the same datasets. The evaluations are divided into two categories where the first, and second sections are related to the NSl-Kdd, and UNSW-NB15 datasets, respectively. Several factors such as the number of features which are employed, the classifier in use, the accuracy, and the false-positive rate have been used in this comparison. The reported results illustrate the superiority of the proposed method compared with the previous works done in this field. The experiments on NSL-KDD dataset demonstrate surpassing outcomes compared to UNSW-NB15 dataset. There are a couple of points which may have engendered the obvious difference between the outcomes. First, the UNSW-NB15 dataset include novel attack and normal classes. Moreover, the UNSW-NB15 dataset involve nine classes of attacks. However, the NSL-KDD dataset is limited to four classes of various attack types. Furthermore, the complexity of UNSW-NB15 features are higher due to the similarities of normal and attack behavior in this dataset.
7. Conclusions
In this paper, a feature-selection approach has been proposed for intrusion-detection systems. The main objective of this function is to create the optimal feature subsets that could classify the NSL-KDD, and UNSW-NB15 datasets instances. The proposed approach is based on a two-phase framework. A feature-selection step, followed by a classification stage constitutes the main phases of this framework. In phase I, the NSGAII-ANN constructs the basis for the feature-selection stage. The NSGAII method, as a feature search approach, interacts with the artificial neural network (ANN), as the learning algorithm, in this phase. We define the feature selection as a problem, including two competing objectives, and we attempt to discover a set of optimal solutions instead of a single optimal solution. The competing objectives are the minimization of features numbers as well as the classification error employing the ANN classifier. The multi-objective method, called NSGAII provides the opportunity to fulfil both of the aforementioned objectives. To improve the proposed framework, we have modified the traditional NSGAII method. During this process, the redundant solutions are emitted to enhance the diversity of the solutions.
In phase II, the best-chosen feature subset, which is derived from phase I is classified using Random Forest. This method evaluates the selected subsets. A comparison with recent approaches cited in the literature showed an improvement in the accuracy and FP rate for all attack profiles. In the future, we would like to test our proposed solution on other real datasets covering a broader range of attacks, and we would like to apply other classifiers, rather than Random Forest. Moreover, we would like to assess the impact of dataset balancing in the overall accuracy of the minority classes.
Author Contributions
Conceptualization and methodology were conceived by A.G. and A.M.G. The implementation of the project was achieved by A.G. and A.M.G. Validation, writing, reviewing, and editing were done by S.Y.Y., A.G., and O.E. All authors have read and agreed to the published version of the manuscript.
Funding
This research received no external funding.
Acknowledgments
The authors would like to extend their sincere thanks to Javed Ahmed for his constructive review on the paper.
Conflicts of Interest
The authors declare no conflict of interest.
References
- Chung, Y.Y.; Wahid, N. A hybrid network intrusion detection system using simplified swarm optimization (SSO). Appl. Soft Comput. 2012, 12, 3014–3022. [Google Scholar] [CrossRef]
- Bul’ajoul, W.; James, A.; Pannu, M. Improving network intrusion detection system performance through quality of service configuration and parallel technology. J. Comput. Syst. Sci. 2015, 81, 981–999. [Google Scholar] [CrossRef]
- Khammassi, C.; Krichen, S. A GA-LR wrapper approach for feature selection in network intrusion detection. Comput. Secur. 2017, 70, 255–277. [Google Scholar] [CrossRef]
- Ashfaq, R.A.; Wang, X.Z.; Huang, J.Z.; Abbas, H.; He, Y.L. Fuzziness based semi-supervised learning approach for intrusion detection system. Inf. Sci. 2017, 378, 484–497. [Google Scholar] [CrossRef]
- Blum, A.; Mitchell, T. Combining labeled and unlabeled data with co-training. In Proceedings of the Eleventh Annual Conference on Computational Learning Theory, Madison, WI, USA, 24–26 July 1998; pp. 92–100. [Google Scholar]
- Denning, D.E. An intrusion-detection model. IEEE Trans. Softw. Eng. 1987, 2, 222–232. [Google Scholar] [CrossRef]
- Karimipour, H.; Dinavahi, V. Robust massively parallel dynamic state estimation of power systems against cyber-attack. IEEE Access 2018, 6, 2984–2995. [Google Scholar] [CrossRef]
- Mohammadi, S.; Mirvaziri, H.; Ghazizadeh-Ahsaee, M.; Karimipour, H. Cyber intrusion detection by combined feature selection algorithm. J. Inf. Secur. Appl. 2019, 44, 80–88. [Google Scholar] [CrossRef]
- Chandrashekar, G.; Sahin, F. A survey on feature selection methods. Comput. Electr. Eng. 2014, 40, 16–28. [Google Scholar] [CrossRef]
- Huang, B.; Buckley, B.; Kechadi, T.M. Multi-objective feature selection by using NSGA-II for customer churn prediction in telecommunications. Expert Syst. Appl. 2010, 37, 3638–3646. [Google Scholar] [CrossRef]
- Selvakumar, B.; Muneeswaran, K. Firefly algorithm based feature selection for network intrusion detection. Comput. Secur. 2019, 81, 148–155. [Google Scholar]
- Aslahi-Shahri, B.M.; Rahmani, R.; Chizari, M.; Maralani, A.; Eslami, M.; Golkar, M.J.; Ebrahimi, A. A hybrid method consisting of GA and SVM for intrusion detection system. Neural Comput. Appl. 2016, 27, 1669–1676. [Google Scholar] [CrossRef]
- Javaid, A.; Niyaz, Q.; Sun, W.; Alam, M. A deep learning approach for network intrusion detection system. In Proceedings of the 9th EAI International Conference on Bio-Inspired Information and Communications Technologies (Formerly BIONETICS); ICST: Brussels, Belgium, 2016; pp. 21–26. [Google Scholar]
- Kang, S.H.; Kim, K.J. A feature selection approach to find optimal feature subsets for the network intrusion detection system. Clust. Comput. 2016, 19, 325–333. [Google Scholar] [CrossRef]
- Tavallaee, M.; Bagheri, E.; Lu, W.; Ghorbani, A.A. A detailed analysis of the KDD CUP 99 data set. In Proceedings of the 2009 IEEE Symposium on Computational Intelligence for Security and Defense Applications, Ottawa, ON, Canada, 8–10 July 2009; pp. 1–6. [Google Scholar]
- Aghdam, M.H.; Kabiri, P. Feature Selection for Intrusion Detection System Using Ant Colony Optimization. IJ Netw. Secur. 2016, 18, 420–432. [Google Scholar]
- KDD Cup 1999. 2008. Available online: http://kdd.ics.uci.edu/databases/kddcup99/kddcup99.html (accessed on 26 October 2019).
- Ugochukwu, C.J.; Bennett, E.O. An Intrusion Detection System Using Machine Learning Algorithm. Int. J. Comput. Sci. Math. Theory 2018, 4, 2545–5699. [Google Scholar]
- Acharya, N.; Singh, S. An IWD-based feature selection method for intrusion detection system. Soft Comput. 2018, 22, 4407–4416. [Google Scholar] [CrossRef]
- Aljawarneh, S.; Aldwairi, M.; Yassein, M.B. Anomaly-based intrusion detection system through feature selection analysis and building hybrid efficient model. J. Comput. Sci. 2018, 25, 152–160. [Google Scholar] [CrossRef]
- Manzoor, I.; Kumar, N. A feature reduced intrusion detection system using ANN classifier. Expert Syst. Appl. 2017, 88, 249–257. [Google Scholar]
- Bostani, H.; Sheikhan, M. Hybrid of binary gravitational search algorithm and mutual information for feature selection in intrusion detection systems. Soft Comput. 2017, 21, 2307–2324. [Google Scholar] [CrossRef]
- Kambattan, K.R.; Manimegalai, R.; Ganapathy, S. An Increment Feature Selection Approach for Intrusion Detection System in MANET. Int. J. Res. Appl. Sci. Eng. Technol. (IJRASET) 2017, 5, 325–329. [Google Scholar]
- Potluri, S.; Diedrich, C. Accelerated deep neural networks for enhanced intrusion detection system. In Proceedings of the 2016 IEEE 21st International Conference on Emerging Technologies and Factory Automation (ETFA), Berlin, Germany, 6–9 September 2016; pp. 1–8. [Google Scholar]
- Popoola, E.; Adewumi, A.O. Efficient Feature Selection Technique for Network Intrusion Detection System Using Discrete Differential Evolution and Decision. IJ Netw. Secur. 2017, 19, 660–669. [Google Scholar]
- De la Hoz, E.; De La Hoz, E.; Ortiz, A.; Ortega, J.; Martínez-Álvarez, A. Feature selection by multi-objective optimisation: Application to network anomaly detection by hierarchical self-organising maps. Knowl.-Based Syst. 2014, 71, 322–338. [Google Scholar] [CrossRef]
- Moustafa, N.; Slay, J. UNSW-NB15: A comprehensive data set for network intrusion detection systems (UNSW-NB15 network data set). In Proceedings of the 2015 Military Communications and Information Systems Conference (MilCIS), Canberra, ACT, Australia, 10–12 November 2015; Volume 47, pp. 1–6. [Google Scholar]
- Moustafa, N.; Slay, J. The evaluation of Network Anomaly Detection Systems: Statistical analysis of the UNSW-NB15 data set and the comparison with the KDD99 data set. Inf. Secur. J. A Glob. Perspect. 2016, 25, 18–31. [Google Scholar] [CrossRef]
- Gao, J.; Chai, S.; Zhang, B.; Xia, Y. Research on Network Intrusion Detection Based on Incremental Extreme Learning Machine and Adaptive Principal Component Analysis. Energies 2019, 12, 1223. [Google Scholar] [CrossRef] [Green Version]
- Deb, K.; Pratap, A.; Agarwal, S.; Meyarivan, T.A. A fast and elitist multiobjective genetic algorithm: NSGA-II. IEEE Trans. Evol. Comput. 2002, 6, 182–197. [Google Scholar] [CrossRef] [Green Version]
- Khan, F.A.; Gumaei, A.; Derhab, A.; Hussain, A. A Novel Two-Stage Deep Learning Model for Efficient Network Intrusion Detection. IEEE Access 2019, 7, 30373–30385. [Google Scholar] [CrossRef]
- Belouch, M.; El Hadaj, S.; Idhammad, M. A two-stage classifier approach using reptree algorithm for network intrusion detection. Int. J. Adv. Comput. Sci. Appl. 2017, 8, 389–394. [Google Scholar] [CrossRef] [Green Version]
- Nawir, M.; Amir, A.; Yaakob, N.; Lynn, O.B. Multi-classification of UNSW-NB15 dataset for network anomaly detection system. J. Theor. Appl. Inf. Technol. 2018, 96, 5094–5104. [Google Scholar]
Figure 1.
Proposed Framework.

Figure 2.
Traditional NSGAII process.

Figure 3.
Crowding-distance.

Figure 4.
Pareto front derived from NSL-KDD.

Figure 5.
Pareto front derived from UNSW-NB15.


Table 1.
The UNSW-NB15 datasset distribution.
| Category | Training Set | Testing Set |
|---|---|---|
| Normal | 56,000 | 37,000 |
| Analysis | 2000 | 677 |
| Backdoor | 1746 | 583 |
| Dos | 12,264 | 4089 |
| Exploits | 33,393 | 11,132 |
| Fuzzers | 18,184 | 6062 |
| Generic | 40,000 | 18,871 |
| Reconnaissance | 10,491 | 3496 |
| Shellcode | 1133 | 378 |
| worms | 130 | 44 |
| Total | 175,341 | 82,332 |
Table 2.
The NSL-kdd dataset distribution.
| Category | Training Set | Testing Set |
|---|---|---|
| Dos | 45,927 | 7453 |
| U2R | 52 | 67 |
| R2L | 995 | 2887 |
| Probe | 11,656 | 2422 |
| Normal | 67,343 | 9710 |
| Total | 125,973 | 22,544 |
Table 3.
Pareto Front Details in NSL-KDD Dataset.
| Num | NF | Selected Features | MSE |
|---|---|---|---|
| 1 | 13 | 4,7,9,12,13,15,19, 23,24,27,31,35,39 | 0.0207 |
| 2 | 14 | 2,3,6,8,12,13,14,18,19,28,30,33,35, 36 | 0.01399 |
| 3 | 15 | 2,3,7,11,14,19,21,22, 25, 27,32,34, 36,37,40 | 0.01172 |
| 4 | 17 | 2,3,4,14,15,16,21,23,27, 30,31, 32, 34,35,37, 38,39 | 0.01159 |
| 5 | 20 | 3,5,6,7,8,10,11,12,17,19,20,22,26, 28,30,33,34 ,38,39,40 | 0.009392 |
| 6 | 22 | 2,3,4,5,7,8,9,10,12,15,16,21,23, 24,27,29,30 ,31,33,34,36,40 | 0.008905 |
| 7 | 24 | 3,4,6,7,8,10,11,12,13,16,18,19,23, 24,25,28,30,31,32,34,35,36,37, 39 | 0.008475 |
| 8 | 25 | 1,3,4,5,7,9,10,11,12,13,15,18,19,20 ,21,22,24,29,30,33,34,35,36,37, 38 | 0.00831 |
Table 4.
Pareto Front Details in UNSW-NB15 Dataset.
| Num | NF | Selected Features | MSE |
|---|---|---|---|
| 1 | 13 | 9,15,16,19,20,24,27,29,32,33,36,37,38 | 2.1686 |
| 2 | 14 | 10,14,16,17,19,20,22,24,30,32,33,37,38,43 | 1.4900 |
| 3 | 16 | 2,9,10,14,15,19,21,25,26,27,28,29,33,36,38,43 | 0.4083 |
| 4 | 17 | 1,2,3,5,6,10,11,15,19,25,27,28,32,33,35,36,41 | 0.2516 |
| 5 | 18 | 1,2,3,6,8,9,10,13,16,21,23,27,34,36,37,38,39,42 | 0.2507 |
| 6 | 19 | 2,3,8,9,10,13,14,16,18,21,27,28,29,36,37,38,39,40,42 | 0.2383 |
| 7 | 22 | 3,5,7,10,11,14,16,19,20,21,22,24,26,28,29,30,31,32,37,39,41,42 | 0.2329 |
| 8 | 23 | 3,6,7,10,14,21,22,23,24,25,26,27,28,29,30,32,35,36,38,39,40,41,43 | 0.2301 |
| 9 | 24 | 2,3,6,7,10,14,21,22,23,24,25,26,27,28,29,30,32,35,36,38,39,40,41,43 | 0.2138 |
Table 5.
The confusion matrix of two state evaluation in NSL-KDD.
| Normal | Abnormal | Total | |
|---|---|---|---|
| Normal | 76,687 | 367 | 77,054 |
| Abnormal | 512 | 70,951 | 71,463 |
| total | 77,199 | 71,318 | 148,517 |
Table 6.
Normal and various attacks Confusion Matrix for the NSL-KDD dataset using Random Forest classification.
Table 6.
Normal and various attacks Confusion Matrix for the NSL-KDD dataset using Random Forest classification.
| DOS | Normal | Prob | R2L | U2R | |
|---|---|---|---|---|---|
| DOS | 53,319 | 58 | 8 | 0 | 0 |
| Normal | 71 | 76,652 | 74 | 249 | 8 |
| Prob | 5 | 141 | 13,929 | 2 | 0 |
| R2L | 2 | 328 | 2 | 3408 | 9 |
| U2R | 0 | 58 | 1 | 16 | 177 |
Table 7.
Evaluation measures of normal and other types of attacks classification for NSL-KDD dataset.
Table 7.
Evaluation measures of normal and other types of attacks classification for NSL-KDD dataset.
| P | R | F-Measure | FPR | ACC | |
|---|---|---|---|---|---|
| Dos | 0.999 | 0.999 | 0.999 | 0.001 | |
| Normal | 0.992 | 0.995 | 0.994 | 0.008 | |
| Probe | 0.994 | 0.989 | 0.992 | 0.001 | 99.3 |
| R2L | 0.927 | 0.909 | 0.918 | 0.002 | |
| U2R | 0.912 | 0.702 | 0.794 | 0 |
Table 8.
Evaluation measures of normal and attacks classification for NSL-KDD dataset.
| P | R | F-Measure | FPR | ACC | |
|---|---|---|---|---|---|
| Normal. | 99.3 | 99.5 | 99.4 | 0.007 | |
| Abnormal | 99.5 | 99.3 | 99.4 | 0.005 | 99.408 |
| Total | 99.4 | 99.4 | 99.4 | 0.006 |
Table 9.
The confusion matrix for normal and attacks on Unsw-NB15.
| Normal | Abnormal | Total | |
|---|---|---|---|
| Normal | 86,522 | 6477 | 92,999 |
| Abnormal | 6915 | 157,758 | 164,673 |
| total | 93,437 | 164,235 | 257,672 |
Table 10.
Evaluation measures of normal and attacks classification for UNSW-Nb15 dataset.
| P | R | F-Measure | FPR | ACC | |
|---|---|---|---|---|---|
| Normal. | 92.6 | 93.0 | 92.8 | 0.04 | |
| Abnormal | 96.1 | 95.8 | 95.9 | 0.07 | 94.802 |
| Total | 94.8 | 94.8 | 94.8 | 0.006 |
Table 11.
Normal and various attacks Confusion Matrix for the UNSW-NB15 dataset classification.
| Nor. | Fuzz. | Anal. | Back. | Dos | Gene. | Exp. | Reco. | Shell. | Worms. | |
|---|---|---|---|---|---|---|---|---|---|---|
| Nor. | 87,314 | 4767 | 16 | 0 | 53 | 16 | 668 | 87 | 75 | 4 |
| Fuzz. | 6495 | 14,587 | 5 | 5 | 518 | 32 | 2442 | 45 | 115 | 2 |
| Anal. | 277 | 221 | 307 | 1 | 453 | 0 | 1417 | 1 | 0 | 0 |
| Back. | 9 | 249 | 0 | 197 | 449 | 2 | 1388 | 19 | 15 | 2 |
| Dos. | 181 | 357 | 10 | 4 | 3299 | 42 | 12,200 | 121 | 133 | 6 |
| Gene. | 42 | 70 | 0 | 7 | 187 | 57,698 | 829 | 4 | 30 | 4 |
| Exp. | 808 | 1219 | 11 | 17 | 4900 | 109 | 36,479 | 791 | 159 | 31 |
| Reco. | 90 | 49 | 1 | 9 | 620 | 4 | 2593 | 10,590 | 31 | 0 |
| Shell. | 134 | 158 | 0 | 3 | 64 | 36 | 222 | 91 | 802 | 1 |
| Worms. | 4 | 7 | 0 | 0 | 7 | 4 | 118 | 0 | 1 | 33 |
Table 12.
Evaluation measures of normal and other types of attacks classification for UNSW-NB15 dataset.
Table 12.
Evaluation measures of normal and other types of attacks classification for UNSW-NB15 dataset.
| P | R | F-Measure | FPR | ACC | |
|---|---|---|---|---|---|
| Nor. | 0.916 | 0.939 | 0.927 | 0.049 | |
| Fuzz. | 0.673 | 0.602 | 0.635 | 0.03 | |
| Anal. | 0.877 | 0.115 | 0.203 | 0.000 | |
| Back. | 0.811 | 0.085 | 0.153 | 0.000 | |
| Dos. | 0.313 | 0.202 | 0.245 | 0.03 | 82.0055 |
| Gene. | 0.996 | 0.980 | 0.988 | 0.001 | |
| Exp. | 0.625 | 0.819 | 0.709 | 0.103 | |
| Reco. | 0.901 | 0.757 | 0.823 | 0.005 | |
| Shell. | 0.589 | 0.531 | 0.558 | 0.002 | |
| Worms. | 0.398 | 0.190 | 0.257 | 0.000 |
Table 13.
The comparison of proposed model with the state-of-art on the NSL-KDD and UNSW-NB15 datasets.
Table 13.
The comparison of proposed model with the state-of-art on the NSL-KDD and UNSW-NB15 datasets.
| Study | Data Set | No.F | Classifier | ACC (%) | FPR (%) |
|---|---|---|---|---|---|
| Gao et al. [29] | - | Incremental extreme learning machine (I-ELM) and Adaptive principal component (A-PCA) | 81.22 | 30.03 | |
| Belouch et al. [32] | NSL-KDD | 27 | RepTree | 89.85 | - |
| Proposed Method | 24 | Random Forest | 99.4 | 6 | |
| Khammassi et al. [3] | 20 | Decision Tree | 81.42 | 6.39 | |
| Nawir et al. [33] | UNSW-NB15 | - | Average One Dependence Estimator (AODE) | 83.47 | 6.57 |
| Khan et al. [31] | - | Deep Learning | 89.134 | 0.7495 | |
| Gao et al. [29] | - | Incremental extreme learning machine (I-ELM) and Adaptive principal component (A-PCA) | 70.51 | 35.09 | |
| Moustafa et al. [28] | 42 | Decision Tree | 85.56 | 15.78 | |
| Proposed Method | 19 | Random Forest | 94.8 | 6.00 |
© 2020 by the authors. Licensee MDPI, Basel, Switzerland. This article is an open access article distributed under the terms and conditions of the Creative Commons Attribution (CC BY) license (http://creativecommons.org/licenses/by/4.0/).
Share and Cite
MDPI and ACS Style
Golrang, A.; Golrang, A.M.; Yildirim Yayilgan, S.; Elezaj, O. A Novel Hybrid IDS Based on Modified NSGAII-ANN and Random Forest. Electronics 2020, 9, 577. https://doi.org/10.3390/electronics9040577
AMA Style
Golrang A, Golrang AM, Yildirim Yayilgan S, Elezaj O. A Novel Hybrid IDS Based on Modified NSGAII-ANN and Random Forest. Electronics. 2020; 9(4):577. https://doi.org/10.3390/electronics9040577
Chicago/Turabian StyleGolrang, Anahita, Alale Mohammadi Golrang, Sule Yildirim Yayilgan, and Ogerta Elezaj. 2020. "A Novel Hybrid IDS Based on Modified NSGAII-ANN and Random Forest" Electronics 9, no. 4: 577. https://doi.org/10.3390/electronics9040577
Note that from the first issue of 2016, this journal uses article numbers instead of page numbers. See further details here.