Article

An Efficient and Unique TF/IDF Algorithmic Model-Based Data Analysis for Handling Applications with Big Data Streaming

by
Celestine Iwendi
1,
Suresh Ponnan
2,
Revathi Munirathinam
3,
Kathiravan Srinivasan
4 and
Chuan-Yu Chang
5,*
1
Department of Electronics, Bangor College of Central South University of Forestry and Technology, Changsha, 410004 China
2
Department of ECE, Vel Tech Rangarajan Dr. Sagunthala R & D Institute of Science and Technology, Avadi 600062, India
3
Engineering Division, Scientific Society, Tiruvannamalai 606805, India
4
School of Information Technology and Engineering, Vellore Institute of Technology, Vellore 632 014, India
5
Department of Computer Science and Information Engineering, National Yunlin University of Science and Technology, Yunlin 64002, Taiwan
*
Author to whom correspondence should be addressed.
Electronics 2019, 8(11), 1331; https://doi.org/10.3390/electronics8111331
Submission received: 20 October 2019 / Revised: 6 November 2019 / Accepted: 8 November 2019 / Published: 11 November 2019

Abstract

:
As the field of data science grows, document analytics has become a more challenging task for rough classification, response analysis, and text summarization. These tasks are used for the analysis of text data from various intelligent sensing systems. The conventional approach for data analytics and text processing is not useful for big data coming from intelligent systems. This work proposes a novel TF/IDF algorithm with the temporal Louvain approach to solve the above problem. Such an approach is supposed to help the categorization of documents into hierarchical structures showing the relationship between variables, which is a boon to analysts making essential decisions. This paper used public corpora, such as Reuters-21578 and 20 Newsgroups for massive-data analytic experimentation. The result shows the efficacy of the proposed algorithm in terms of accuracy and execution time across six datasets. The proposed approach is validated to bring value to big text data analysis. Big data handling with map-reduce has led to tremendous growth and support for tasks like categorization, sentiment analysis, and higher-quality accuracy from the input data. Outperforming the state-of-the-art approach in terms of accuracy and execution time for six datasets ensures proper validation.

1. Introduction

Document gathering is a process to achieve the gathering of data from big data [1,2,3]. The partition-based algorithms, such as K-means, EM, and sGEM and the rule mining-based algorithms such as Apriori, FPGrowth, and FP-Bonsai are useful methods for document gathering. Additionally, partition-based and rule mining-based algorithms are used to group the relevant data into the same cluster. However, these algorithms have some drawbacks in document gathering. To rectify these drawbacks, this research paper discusses the techniques for the data group using the custom-made TF/IDF algorithm on the Reuters-21578 and 20 Newsgroups dataset [4]. In addition to the categorization and clustering used for appropriate document gathering [5,6], the categorization decides which set of predefined categories a text belongs to. In predefined categories, the unknown text set is included according to a known categorization when it is suitable. Finally, these categories are sorted based on well-known concepts and category-based document structure [7,8,9,10]. The concepts and category-based document structure organization are discussed under the process of partition-based clustering and frequent item-set based clustering [11,12]. Moreover, this structure organization reduces the average distance between the relevant clusters. Frequent item-set is a process of clustering that studies the set of frequent items, which includes more conceptual and contextual meanings than an individual word that co-occurs in transactions more than a given threshold value, which is called the minimum support. Document clusters and evaluation of document categorization resulted from the frequent item-set application according to big data analytics and document gathering [7]. The authors in [8,9,13] use experimentation and observation to discuss big data analytics, which produces a high-quality document gathering performance and a suitable choice of the grouping of similar documents. The performance results are discussed based on the Reuters-21578 and 20 Newsgroups dataset using K-means; K-means and particle swarm optimization (PSO) also compare with the proposed system. The proposed temporal Louvain approach allows the analyst to represent the complex structure of streaming data to implement knowledge about the simple structure of big data handling. Secondly, the experimental results of the proposed algorithm significantly perform better for all six datasets in terms of accuracy and execution time. In addition to that, the accuracy and execution time was useful in the custom-made TF/IDF algorithm using the temporal Louvain approach.
The rest of the paper is organized as follows: Section 2 is the literature review with a detailed explanation of the existing work; Section 3 describes the overview of the proposed summarization approaches; Section 4 contains the details of the experimental results; Section 5 examines the performance evaluation of the proposed system in comparison to other approaches. Finally, the overall achievements are summarized and concluded in the paper.

2. Literature Review

This section describes various Map-Reduce-based document clustering with various techniques and methodologies. All of these systems focus on Map-Reduce-based document clustering with a considerable amount of data that is most likely to be big data [5,14,15,16]. Dawen et al. proposed a new Map-Reduce-based Nearest Neighbor Approach called optimization classifier, which is used for traffic flow prediction on big data datasets [14]. They use the Hadoop platform model for traffic flow prediction concerning offline distributed training (ODT) and online parallel prediction (OPP). Their proposed system is useful for improving data observation and classification. Finally, the prediction approach called the leave-one-out cross-validation method is used to improve the accuracy of the particular dataset concerning the Map-Reduce-Based Nearest Neighbor Approach. In addition to this, an improvement in OPP and ODT helps analyze our research for the prediction of the concerned text-based prediction. Andriy et al. (2016) ran into issues, such as scarce storage, capturing replays, classifying and formatting, inadequate tooling for processing, scalable analysis, and storing logs files, and so they proposed “Challenges and Solutions Behind the Big Data Systems Analysis” [15] to solve the outlined issues. Their survey went on to discuss improvements in security and time analysis, as well as velocity, volume, variety, veracity, and value, which works against the log files. Finally, they store and efficiently process the logs. These criteria facilitate us in improving the maintenance and handling of streaming data in an efficient way.
A prominent researcher, Ge Song, with his group members, analyzed “Big Data on Map Reduce.” They worked on the implementation of five published algorithms using experimental settings to control the large volume and dimensions of data [17] because as the volume and dimensions increase, it will be costly and time consuming to perform. They overcome the drawbacks in existing Map-Reduce programming by comparing k-nearest neighbor (kNN) on Map-Reduce for analyzing time, space complexity, and accuracy. Additionally, kNN is used to evaluate the classification performance of ten different datasets. Raw data were applied to three generic steps: (a) prepositioning, partitioning, and computation with inputs in terms of load balancing, the accuracy of results, and overall complexity: (a) pivots and projections, (b) distance-based and size-based, and (c) Round Map-Reduce. Finally, in large volume of data, they proved that kNN with Map-Reduce handled the problem in three different steps, such as preprocessing, partitioning, and actual computation with the kNN approach. Hao Wang et al. introduced the Map-Reduce Checkpoint with the BeTL for handling the massive amount of data concerning the following contribution, such as Map Task Checkpointing, Combiner Cache, Enhanced Speculation, Resilient Checkpoint Creation, and Comprehensive Evaluation [18].
The above contribution enables the authors to create the Map-Reduce framework with the BeTL functions. Finally, the relevant and redundant large number of features is reduced from the large dataset for handling various viewpoints such as no failures, diverse density of failures, heterogeneous environments. Wasi et al. discussed the Map-Reduce and its study. They focus on YARN Map-Reduce for the high-performance cluster as well as works with multiple concurrent jobs [12]. Finally, they performed detailed optimization with the clusters. They used priority-based dynamic detection for investigating the applicability of similar design to big data processing. In 2016 Kun Gao, proposed a continuous function for remembering and forgetting and deep data stream analysis model based on remembering [19]. They simulated human thinking with various data stream analysis algorithms, such as WIN, Streaming Ensemble Algorithm, AWE, and ACE. Depending on the classification accuracy, data stream analysis, efficiency, and prediction stability criteria their proposed DDSA algorithm is well organized. Iwendi et al. provided a basis for key management techniques that use ant colony optimization for sensor data collection. Their path planning model for wireless sensor network nodes can be used to improve and safeguard the data collected from the base station to the nodes in an intelligent sensor system [20].
Meanwhile, the authors in [21] used intelligent data analysis to solve the problems of eHealth systems. Their research framework explored the influence of socio-technical factors that are affecting the user’s adoption of eHealth functionalities to improve the public health system. An intelligent system for the data collection used shows accurate prediction experimental results for improving eHealth systems for Chinese and Ukraine users based on raw data collected from both countries.
Judith discussed the distributed storage and analysis data [1]. They proposed document clustering analysis, namely optimal centroids for K-Means clustering based on Particle Swarm Optimization (PSO). It is used to cluster documents with accuracy by using Hadoop and the Map-Reduce framework. Their proposed methods are applied to the Reuter’s and RCV1 document dataset; the final result shows that the accuracy and execution time are maintained efficiently. Leonidas explains query processing via big data streams. They process large-scale queries through incremental data analysis [22]. The distributed stream processing engine (DSPE) is used to query evaluation lifetime concerning the novel incremental evaluation technique. Their proposed technique might be able to handle the massive number of queries, even sophisticated collections. They implemented the query processing description on MRQL Streaming in Spark for effective query processing.

3. Implementation for Proposed Research Methodology

The proposed research methodology mainly focuses on the document gathering process and extensive data analysis [10,22,23]. The document gathering process composed of three main techniques, such as the frequent item-set-based method, FP-growth, and FP-Bonsai. All these processes are applied to massive data. After applying these three techniques to massive data, the adjacency matrix for each input document is formed. Each input document has a connection to all other documents by a particular repeated word; if the input document is a single line, the adjacency matrix was void for that case [24,25,26]. Here the document similarity was calculated based on the document correlation. Document correlation is measured by using input relay streaming data. The relay streaming data uses sources, such as 20 Newsgroups (20K News information, 20NG), citation network (6M users articles, ISI database), LinkedIn social network (21M user ids, LinkedIn), mobile phone networks (4M station, 100M customer), Reuters-21578 (21578 data, Reuters), Twitter social network (2.4M communities 38M user ids, Twitter). All these data are handled by the Louvain method. It is used for finding communities in large networks. In our case, the Louvain method is an efficient way of identifying documents that result in the massive data set. Regarding the test case, the result of the streaming data is calculated based on the Louvain community detection method. In our test case, Reuters-21578, the detection method is performed for detecting particular words and the most relevant solutions from the data set [3,27].

3.1. Temporal Louvain Method in Proposed Summarization

When we apply the Louvain method to Reuters-21578 information corpus, it will manage the individual words by detecting and extracting from a large amount of data [28].
The reasons behind the Louvain method are:
  • Generally, all detections and extractions are taken into the relation of similarity weights.
  • Accurate input streaming data count should be accessed with mathematical computation.
  • Computation might not be as per the approximate number of results.
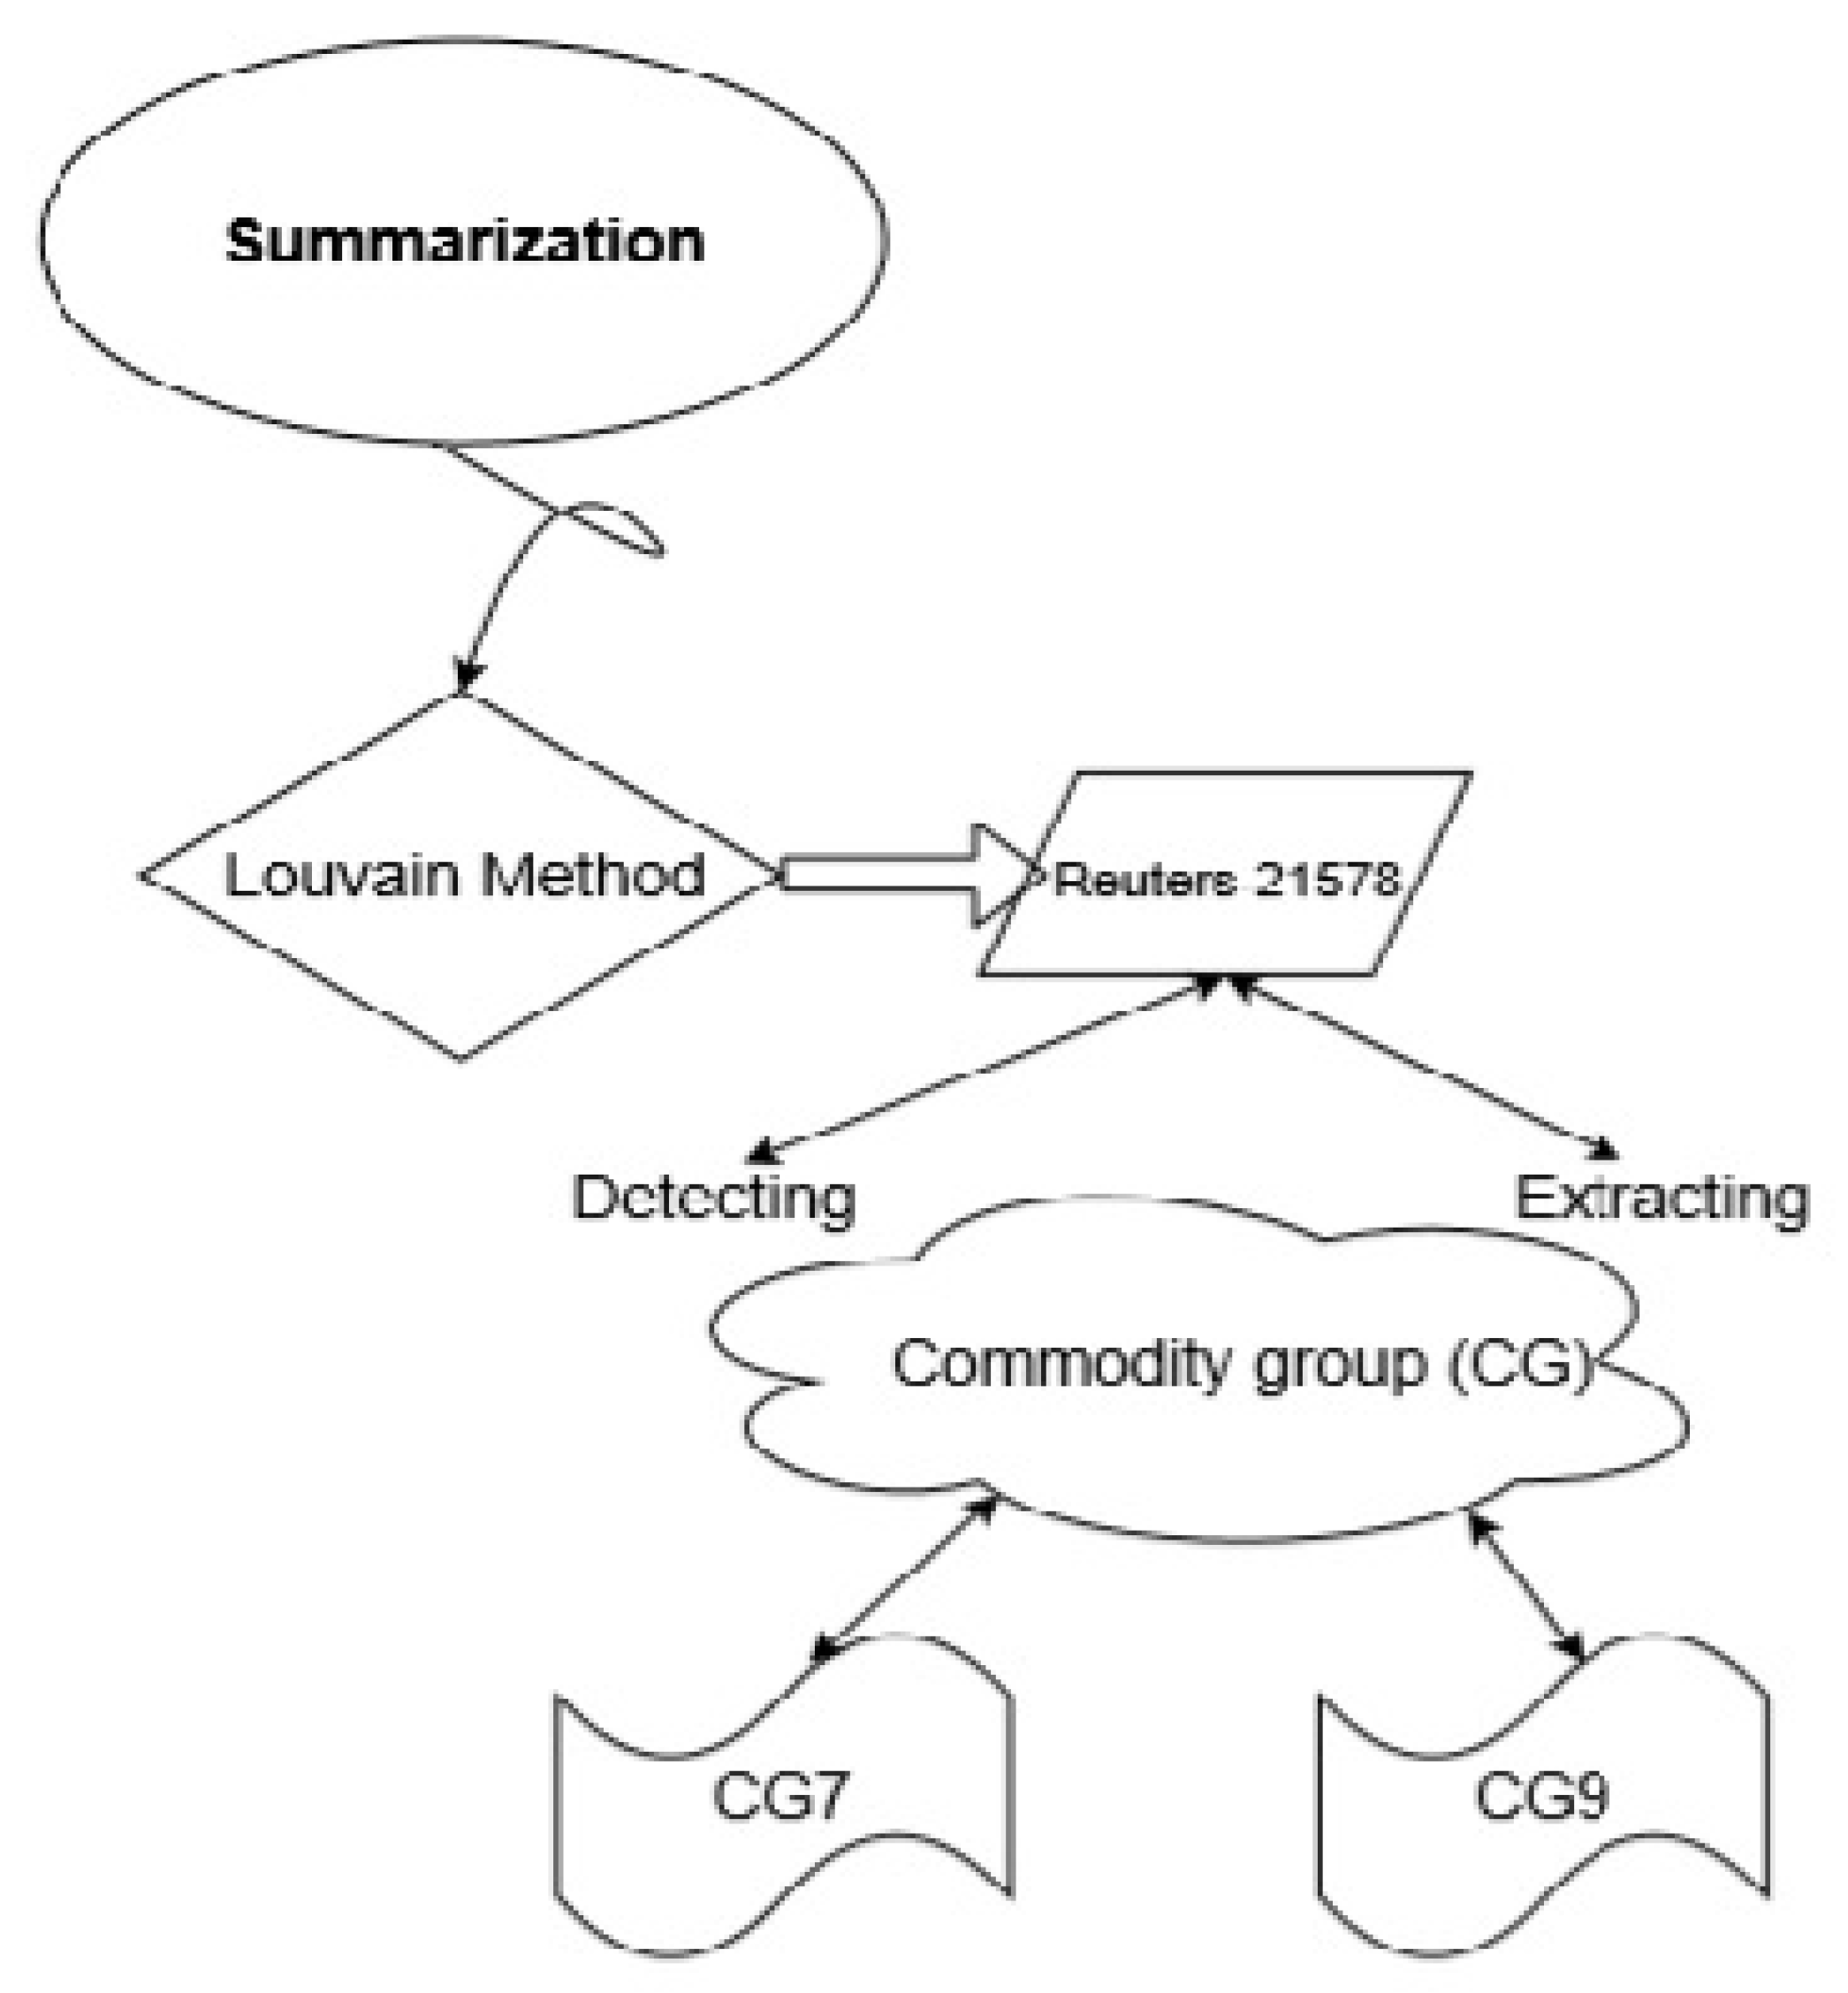
  • To resolve the troubles in processing schemes as well as validate the Louvain method by using the application verification process i.e., first, the methods are applied to the predefined dataset corpus. Later, live streaming data is to be processed, as shown in Figure 1.
This research investigation investigates Reuters-21578. The results of our word detection are mapped [18,29] in Table 1.
Where the data set community group illustrates, in Reuters-21578, the total number of finalized documents are scheduled into the community group (CG). Each community group’s forms are based on similar streaming data [30,31]. Whereas the word occurrence ratio is found based on three criteria such as:
Words   Occurance   Ratio = Total   no .   of   Doc   Analyzed   per   mins     Total   Community   Group Total   no .   of   Doc   id   Per   Mins     Total   no .   of   Doc   Analyzed   per   mins
Perhaps the result of the words occurrence ratio is directed to calculate the words detection ratio for the streaming data review.
The words detection ratio is calculated based on an algorithm that correctly sorted the word detection ratio from all the community groups (CG) in the time interval between the approximate time interval per analysis (duration of processing) and the approximate time interval per analysis (duration of detection) [19].
Words   Detection   Ratio   =   Duration   of   Processing [ Words   Occurance   Ratio ] duration   of   detection
It also takes into consideration the approximation of the final result concerning the duration of processing and duration of detection. In this stage, the result automatically manages the realignment concerning the words detection ratio, shown in Table 2.

3.2. Community Group Classification

Interestingly, considering the community groups (CG) 7 and 9, there are 352 and 937 documents analyzed, respectively [1,2,32]. In this case:
  • Community group (CG)-7: there are fewer amounts of data to be tested for grouping concerning the user comment. In that case, there are 1000 comments applied to the word detection ratio test. Seemingly it gets 26.2% with the 80 document identification.
  • Community group (CG)-9: there are more data to be tested for the grouping concerning the user comment. In that case, there are 9000 comments applied to the word detection ratio test. Seemingly, it gets 1.1% with the 85-document identification.
In both cases, the word detection ratio is slightly varied for each word detection ratio. The reason behind this process is the duration of processing (word occurrence ratio) and duration of detection. Finally, the community group (CG) is reshuffled concerning the word detection ratio. After that, the comments are rearranged by the user comments. This scheme is illustrated in the Table 3 and Table 4.

3.3. Temporal Similarity and Comparison Method

Concerning the community group (CG) illustration, the actual process returns the following comparison result. From Table 4, our research defines access, update schema, structure, integrity, and speed as the state following the dataset and its possible standards such as occurrence and detection.
For this consideration, Table 4 shows the six datasets; each dataset was analyzed concerning access medium, update schema, structure, integrity, and speed.
  • Each time similarity has been checked with the streaming data (LinkedIn, Twitter).
  • In another case, the comparison has been checked (20 Newsgroups, Reuters-21578) by the source dataset.
  • The similarity and comparison are both verified by the (mobile phone network) input data.
Concerning the above three steps of verification, comparison gives a higher value in terms of the input streaming data as well as the fixed data set. Depending on this higher similarity and lower streaming data input, the occurrence and detection should be encountered by each dataset if the dataset is reshuffled concerning the occurrence in the streaming data. Moreover, the rate occurrence and the amount of data to be analyzed are calculated with the help of Table 3 and Table 4.
In the same manner, this research analyzes the data to obtain another source (streaming data or fixed data).

4. Experimental Results

4.1. Datasets and Setup

Reuters-21578 has a collection of 21,578 real-world news stories and news-agency headlines in the English language under 135 different categories. Reuters-21578 has 22 files, each moderately consisting of 1000 documents. The citation and detail about all entries are available for each document, which includes date, topics, author, title, content part of this Reuters-21578 is www.daviddlewis.com/resources/testcollections/reuters21578/readme.txt.

4.2. News Group

The 20 Newsgroups is an accessible data set; it has approximately 20,000 documents partitioned with different topics. Originally collected and assembled data for each category. Although 20-Newsgroup is less popular than Reuters-21578, it is still used by many researchers (Baker and McCallum, 1998; McCallum and Nigam, 1998). The articles in this data set are posted to some newsgroups, unlike Reuters-21578, which are taken from the newswire. Another big difference between 20-newsgroup and Reuters-21578 is that the category set has a hierarchical structure.
The citation network dataset is collected for getting the global analysis of research. Moreover, all the process is collected from the DBLP, ACM sources as shown in Table 5. There are nine versions available with the 16,725,563 paper. Furthermore, those papers have 16,725,563 citations. The citation contains the title, authors, year, abstract, and venue. This data set is used to make the cluster and mapped for relevant data as well as arranged concerning the network and side information [14,31,33]. This modeling analysis cluster and the mapped process is useful to discover significant title, authors, year, abstract, and venue of papers [34,35].

4.3. LinkedIn Network

LinkedIn network dataset is the social-scientific research-related data for visualizing and analyzing usage methods and usage of end-user. The user can verify and shortlist by using their activities and interaction with others. It winds up works based on the visualization and network metrics that connect to sociological research. Here the user interaction might be connected to the server concerning the interpretation.

5. Performance Evaluation and Discussion

The essential concerns in cluster analysis [14,17,36] on big data is the evaluation of the clustering and its dataset handling consequences [5]. Evaluating the colossal amount of data is the analysis of the output to understand how well it reproduces the original structure of the data. However, the estimation of clustering results in big data is the most complicated task within the whole workflow. Furthermore, to evaluate the performance of the proposed model, three performance metrics, such as analysis of clustering accuracy, analysis of execution time, and comparison of quality with the existing method.

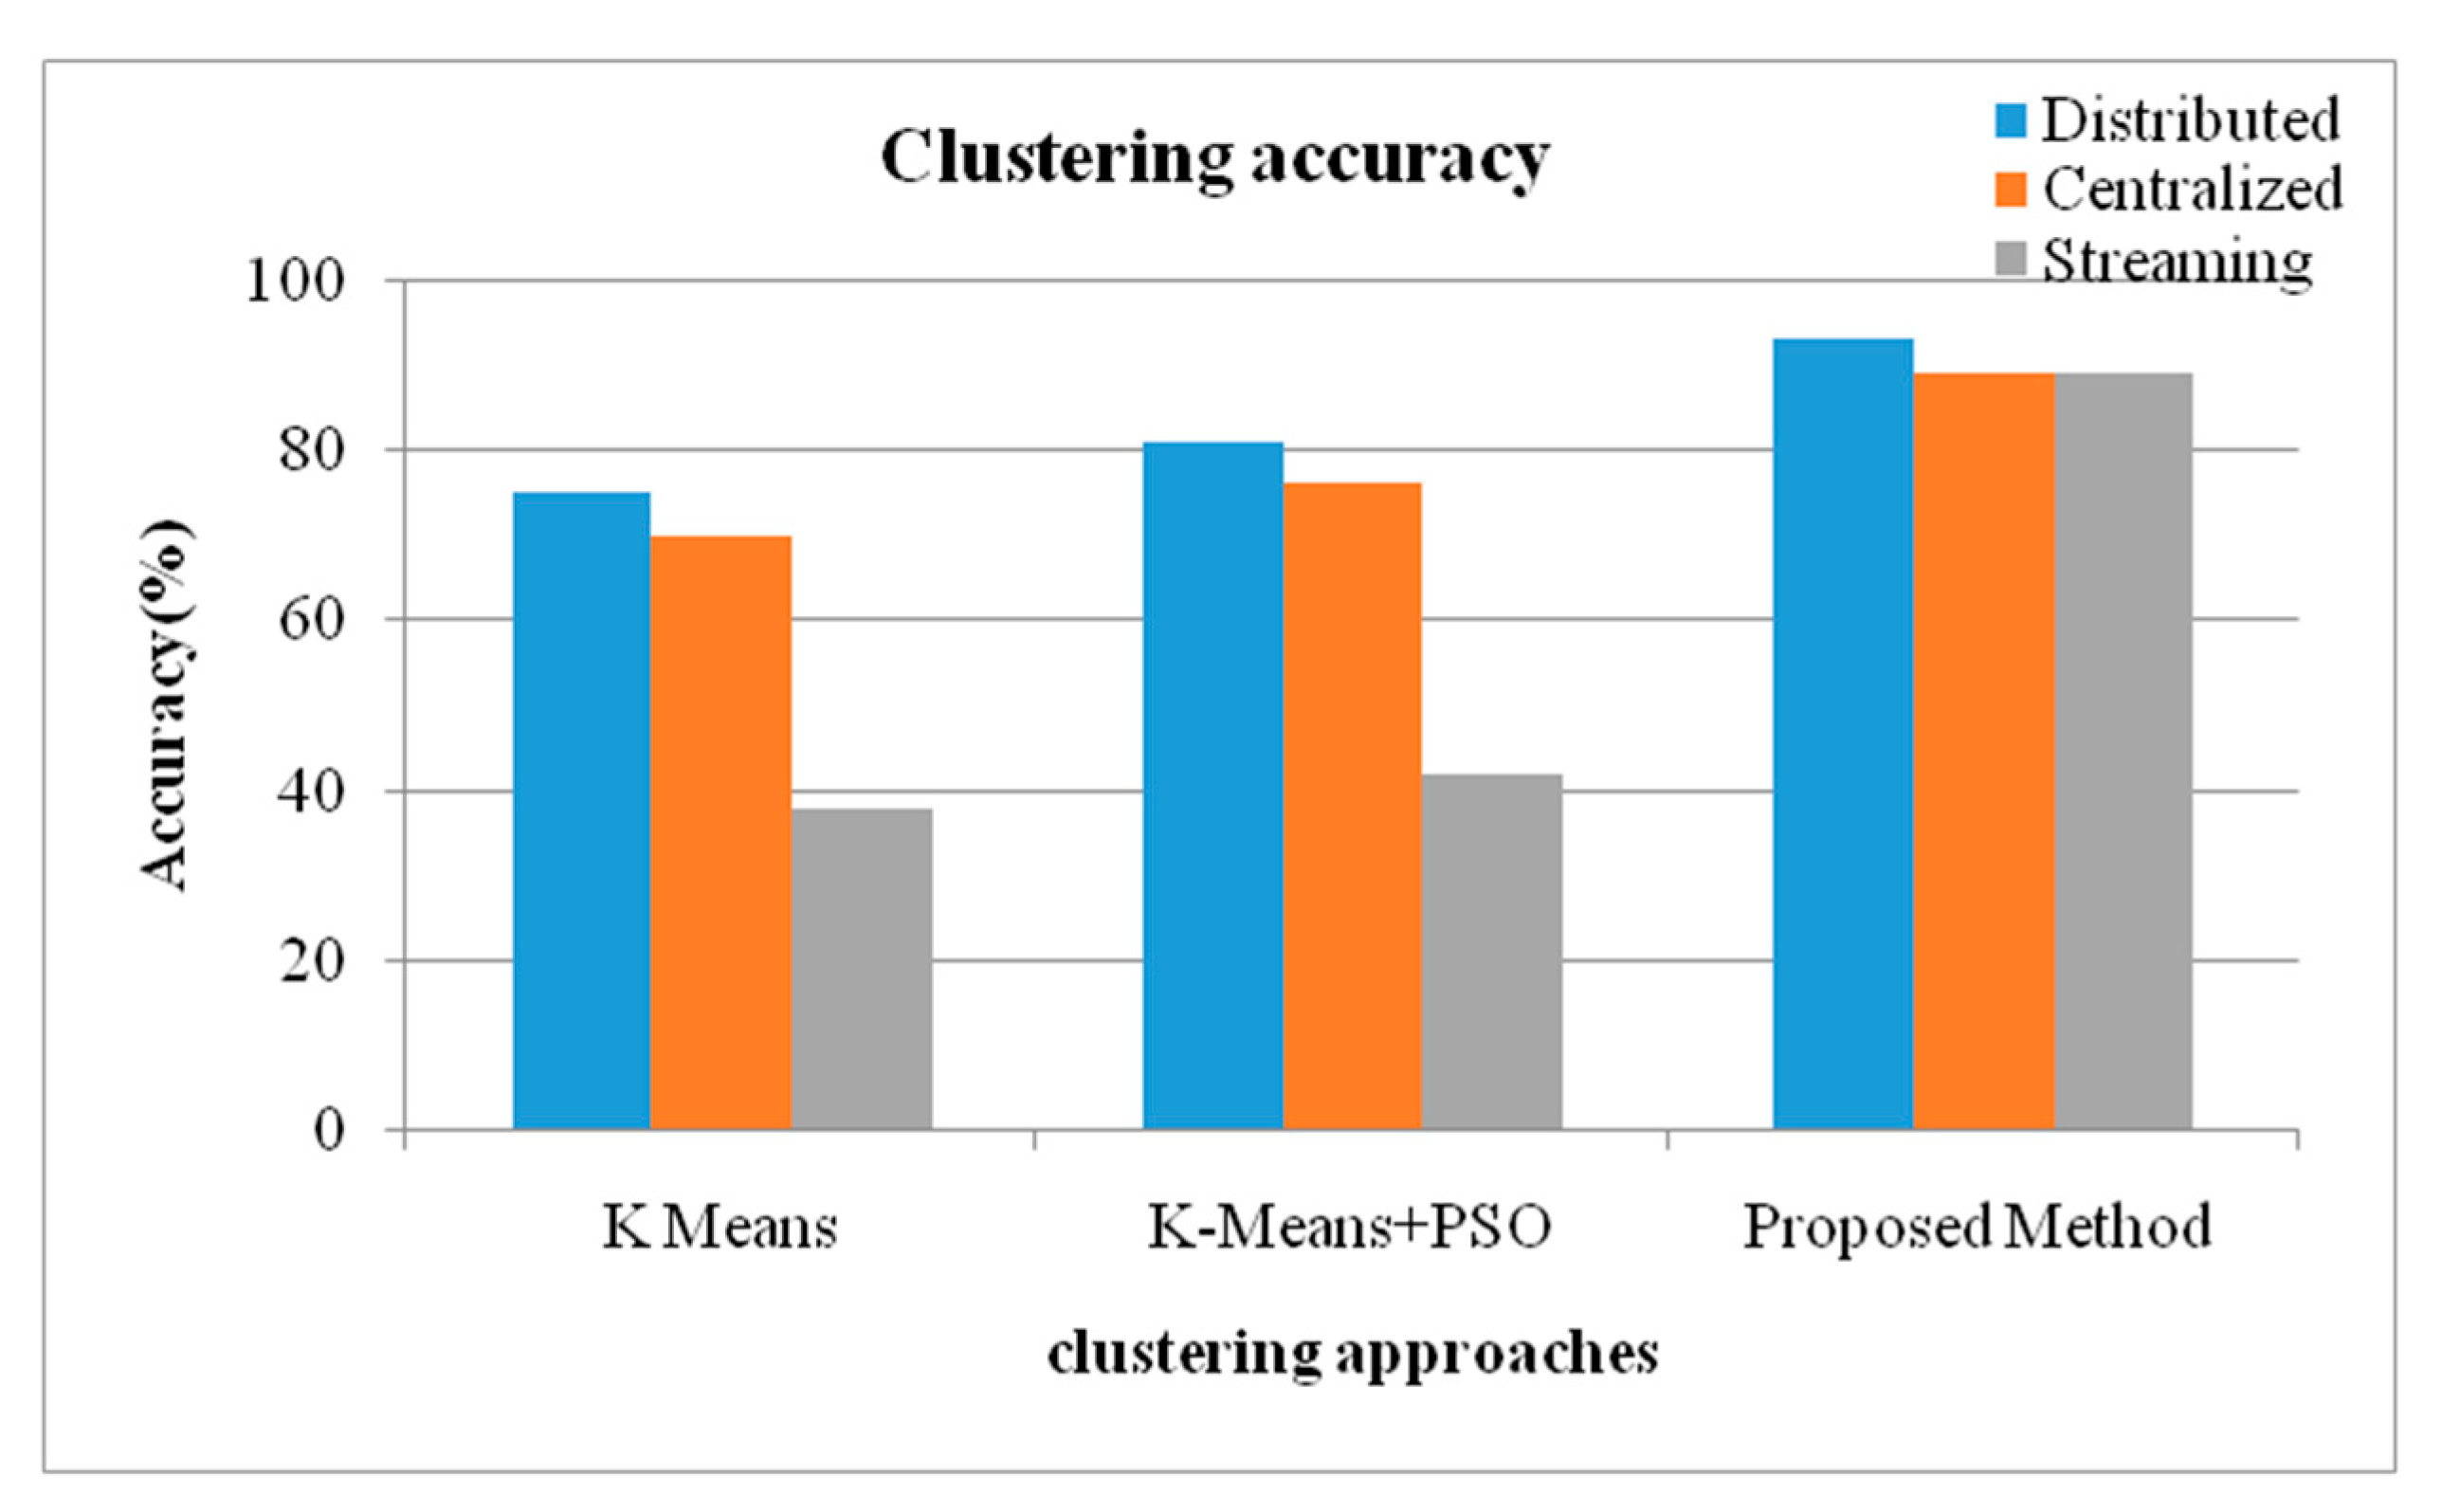
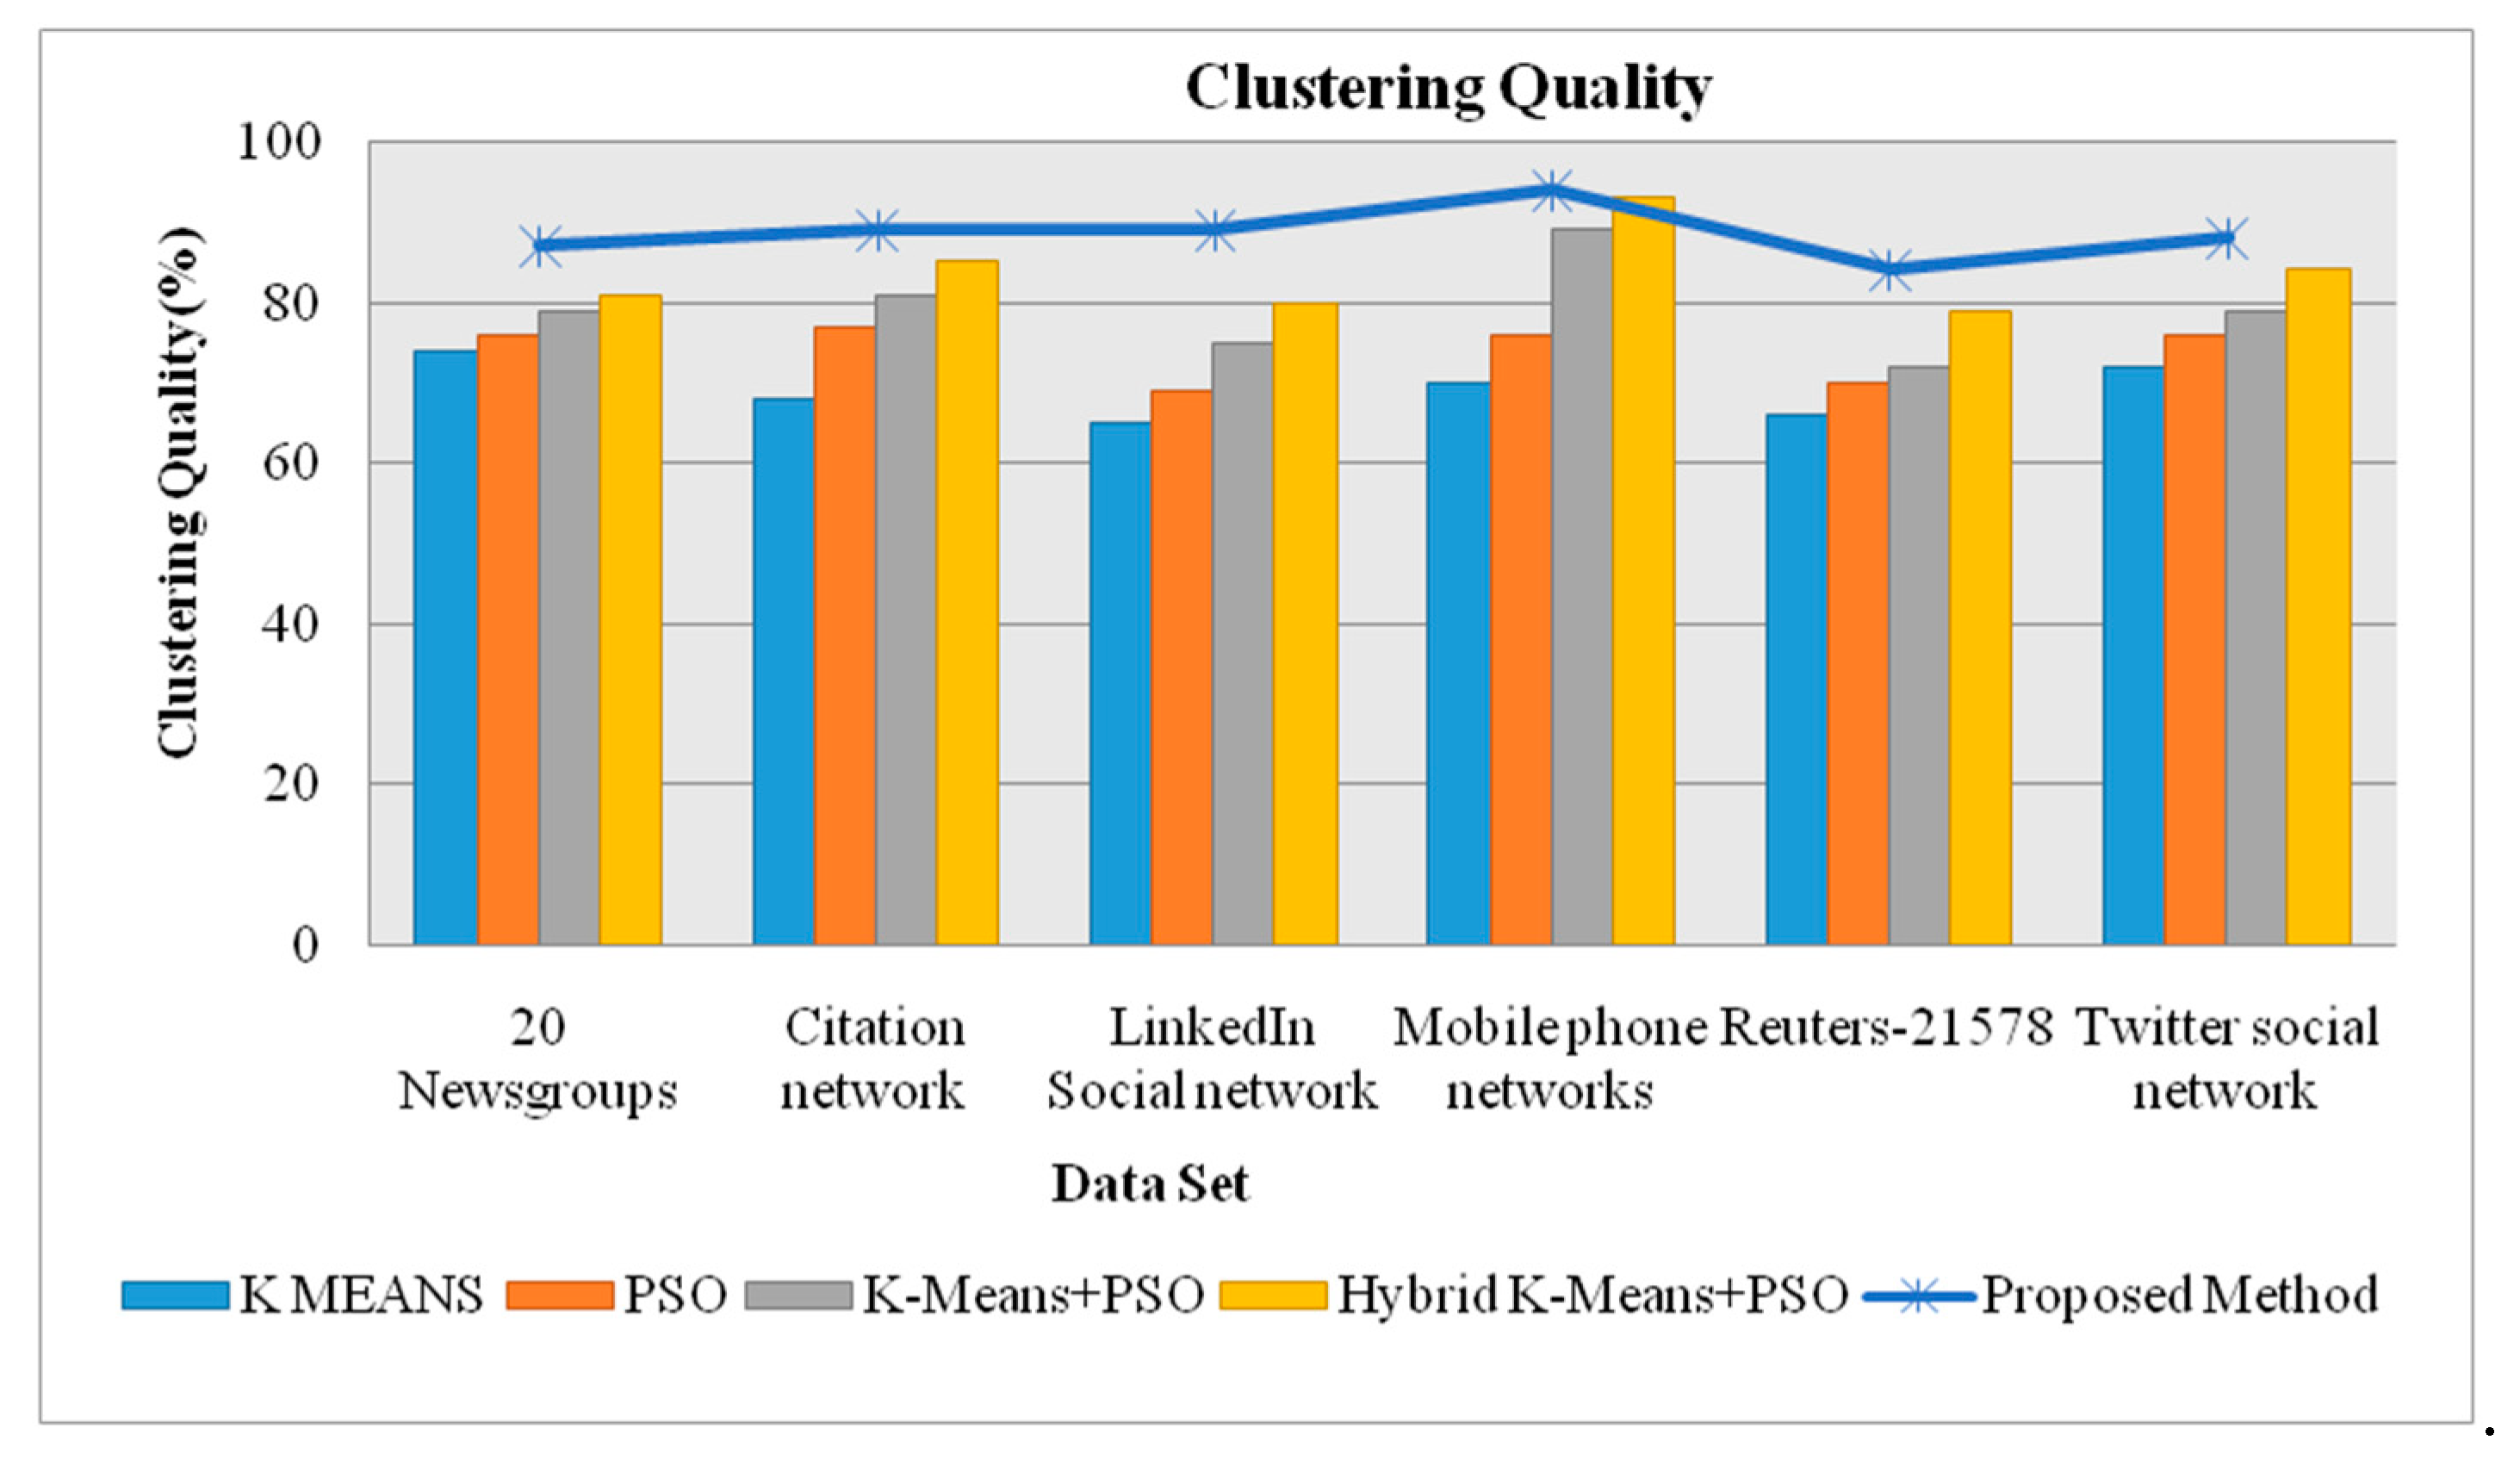
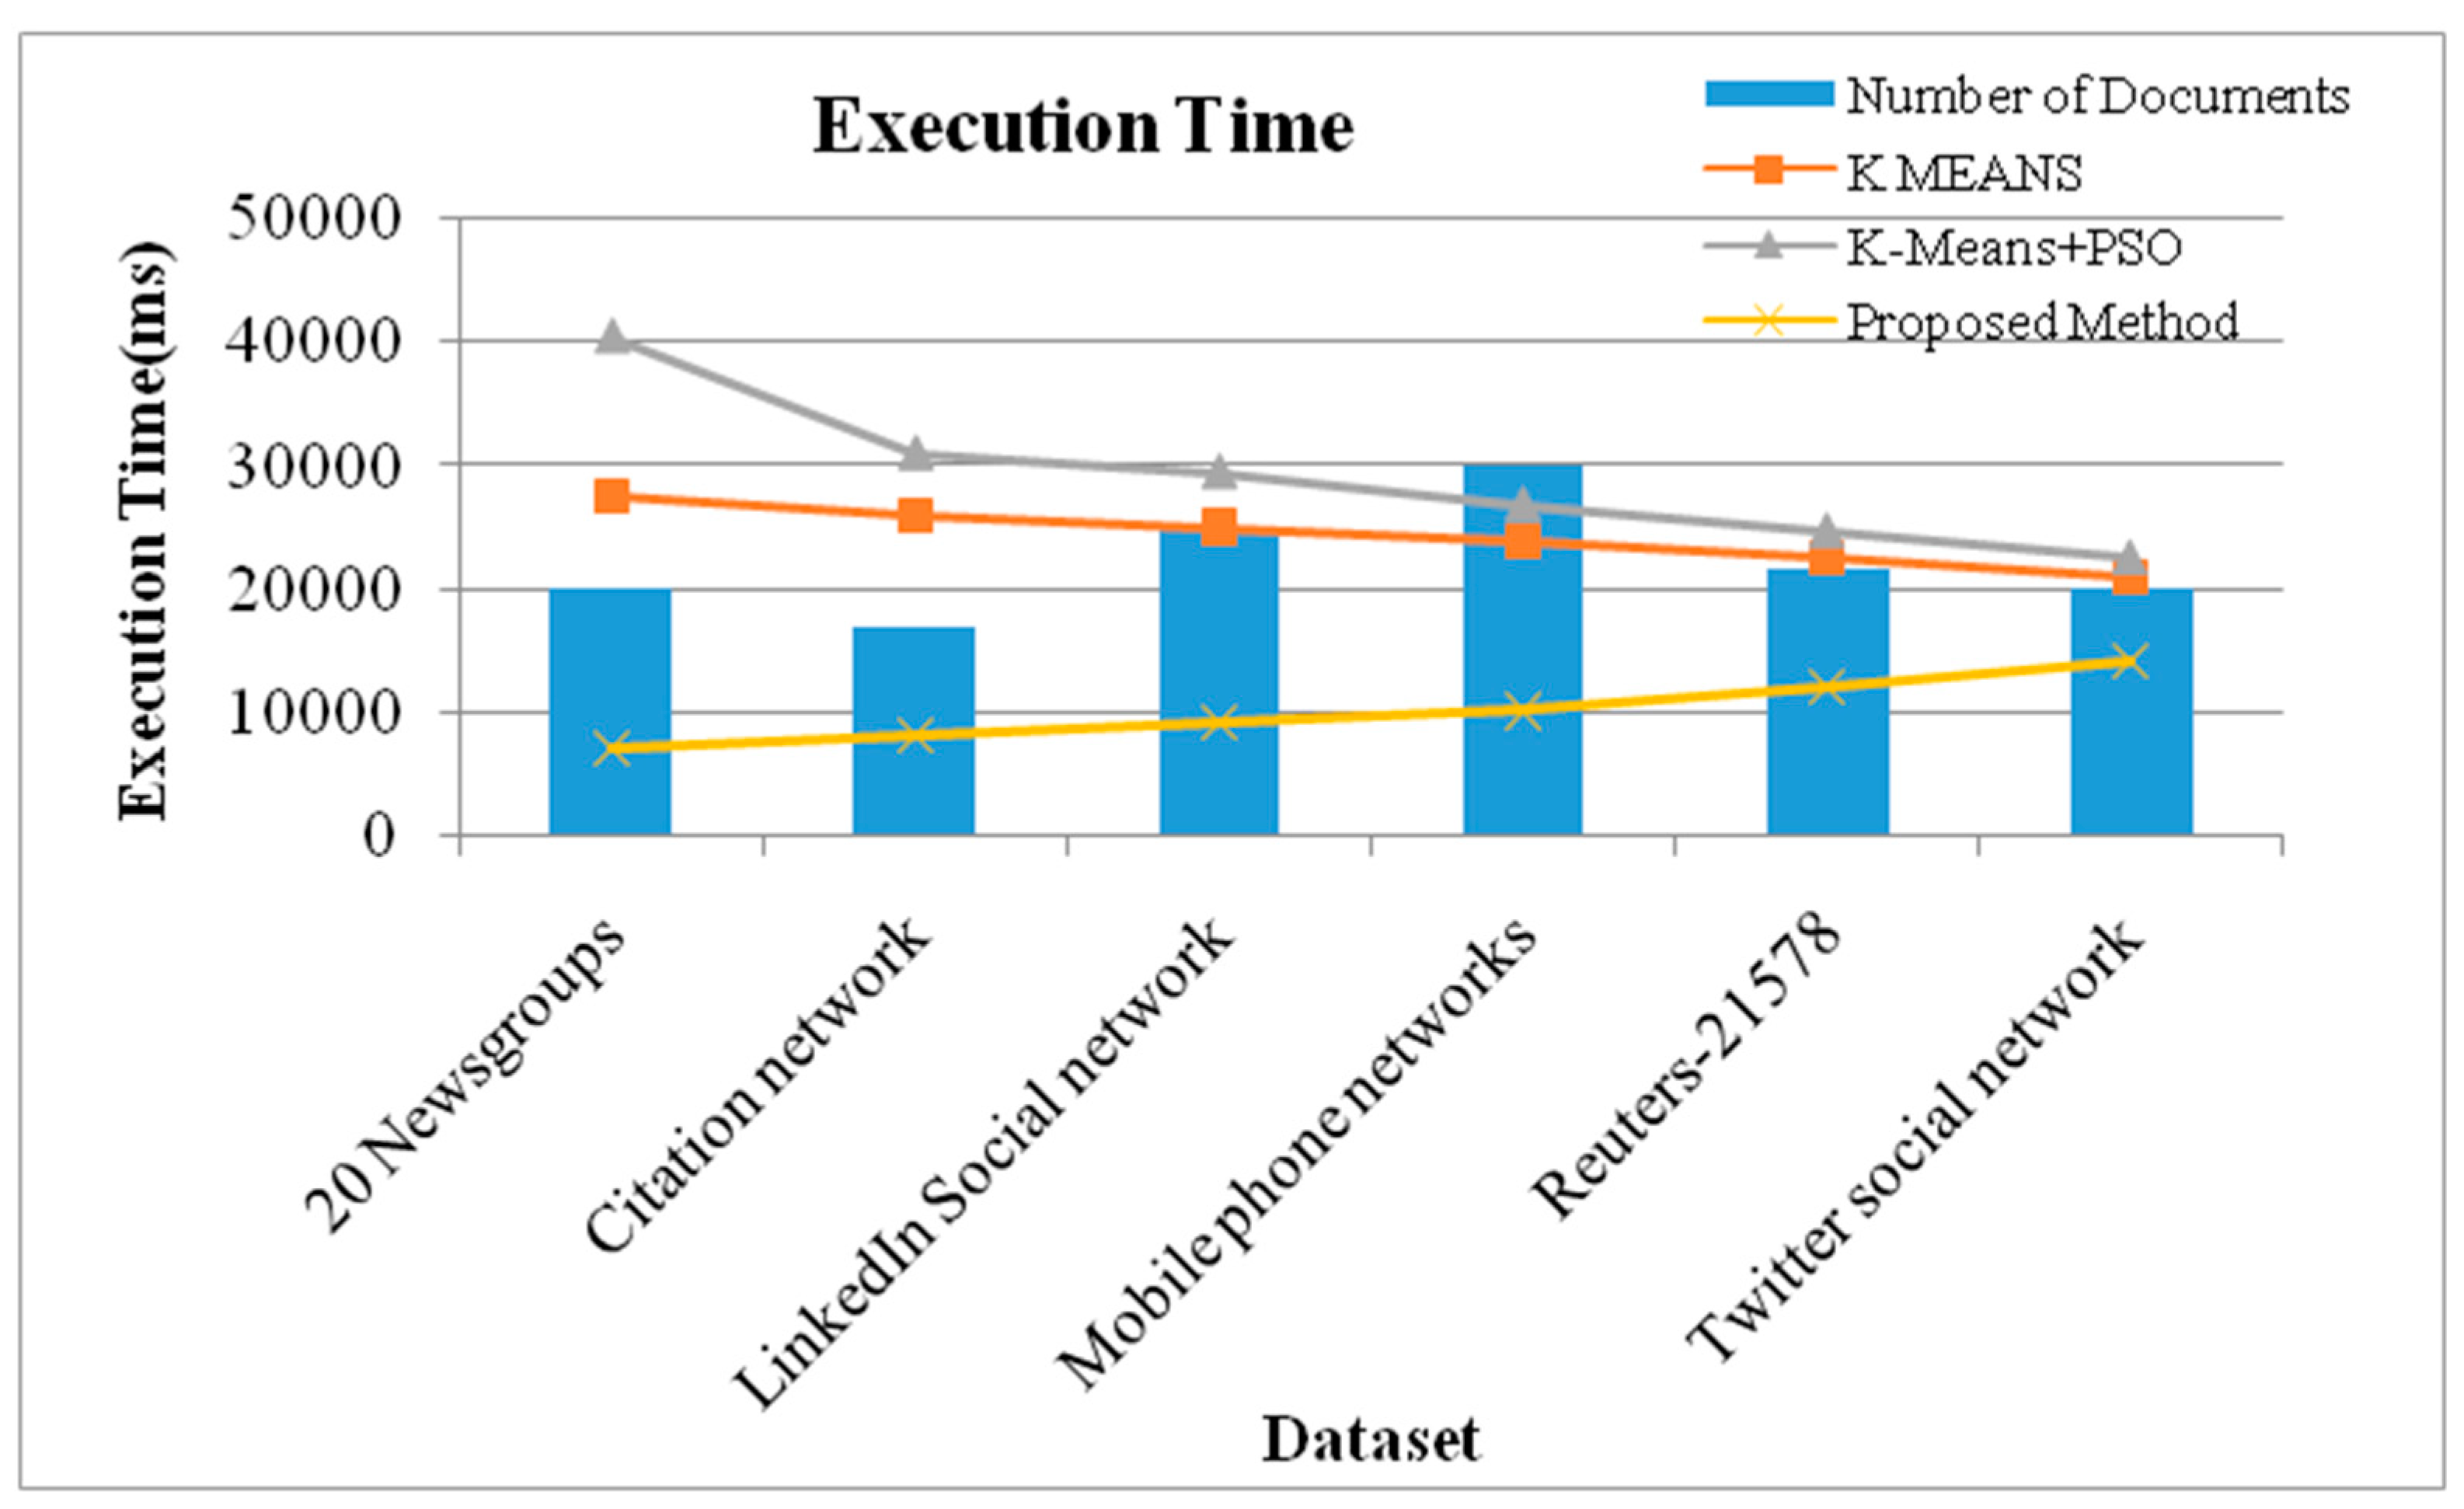
Investigation of Accuracy and Execution Time

Let “En(c)” denote the number of elements lying in a selected data set (DSn) and let “En(i)” be the number of elements of class (im) in the selected data set (DSn). Then, the purity investigated accuracy (Sn) of the selected data set (DSn) is defined as follows:
A c c u r a c y ( S n ) = 1 E n ( c ) max E n ( i )
Accordingly, the overall accuracy, namely the clustering quality of the selected data set, is defined as follows.
Clustering   Quality ( S n ) = S = 1 N E n ( i ) + E n ( c ) n ( i ) + n ( c ) · A c c ( S n )
From Equations (1) and (2), the investigation of accuracy gives higher accuracy. Then it is compared with the traditional k-means, K-Means + PSO, on the distributed data input, centralized data input, and streaming data input. When we compare the traditional methods with the proposed method in terms of accuracy, our proposed system gives a higher accuracy rate on big data analysis.
Table 6 shows that different technique for clustering and analyzing. Our proposed system produces higher accuracy than traditional k-means and PSO.
From Figure 2, it is observed that a streaming-based system should provide higher accuracy based on the proposed method with the different data sets. Figure 2 shows that the proposed algorithm provides 27.24% higher accuracy when compared to traditional k-means and PSO on the different data set.
Table 7 shows the different techniques for clustering and analyzing. Our proposed system produces higher accuracy than traditional k-means and PSO.
The comparative results on three different techniques, namely k-means, k-means, PSO, and the proposed system shows accuracy as shown in Figure 3, which was comparatively high in streaming-based schemes.
From Figure 4, the observed method provides 76.24% faster execution time when compared to k-means, k-Means + PSO, on all datasets, such as the 20 Newsgroups, citation network, LinkedIn social network, mobile phone networks, Reuters-21578, and Twitter social network dataset. Figure 4 also shows the faster execution time when compared to the traditional algorithm. The result of performance metrics like the execution time is efficient (69.68%) on the Reuters-21578 dataset with the proposed scheme.

6. Conclusions

The most excellent development level of research motivates the field of big data handling using Map-Reduce to have abrupt growth so that simple conventional methods can be utilized and have been a demanding task for categorization, sentiment analysis, and map reducing for the scope of devolving higher-quality accuracy from input data. Map reducing with big data analysis area mostly concentrated on the development of efficient big data management which contributed to the furtherance of the Louvain method. The proposed temporal Louvain approach allows the analyst to represent the complex structure of streaming data to implement knowledge about the simple structure of big data handling. Finally, the experimental results of the proposed algorithm significantly perform better for all six datasets in terms of accuracy and execution time. In addition to that, the accuracy and execution time was significantly useful in the custom-made TF/IDF algorithm with the temporal Louvain approach. The various stages and various data set models can be parallelized to improve their accuracy as well as efficient execution time [37,38,39]. Further combinations of various approaches and datasets can be probed and combined for better big data handling.

Author Contributions

This research specifies below the individual contributions. Conceptualization, C.I. and S.P; data curation, K.S., and C.-Y.C.; formal analysis, R.M., C.-Y.C.; funding acquisition, C.-Y.C; investigation, S.P., C.-Y.C; methodology, C.I. and C.-Y.C; project administration, C.-Y.C and K.S.; resources, C.-Y.C; software, R.M, C.-Y.C; supervision, K.S. and C.I.; validation, C.-Y.C and K.S.; visualization, C.I. and S.P; writing—review and editing, C.I. and K.S.

Acknowledgments

Part of this work was financially supported by the “Intelligent Recognition Industry Service Research Center” from The Featured Areas Research Center Program within the framework of the Higher Education Sprout Project by the Ministry of Education (MOE) in Taiwan.

Conflicts of Interest

The authors declare no conflict of interest.

References

  1. Judith, J.E.; Jayakumari, J. Distributed document clustering analysis based on a hybrid method. China Commun. 2017, 14, 131–142. [Google Scholar] [CrossRef]
  2. Xu, H.; Lau, W.C. Optimization for speculative execution in big data processing clusters. IEEE Trans. Paral. Dist. Syst. 2016, 28, 530–545. [Google Scholar] [CrossRef]
  3. Kumar, D.; Bezdek, J.C.; Palaniswami, M.; Rajasegarar, S.; Leckie, C.; Havens, T.C. A hybrid approach to clustering in big data. IEEE Trans. Cybern. 2016, 46, 2372–2385. [Google Scholar] [CrossRef] [PubMed]
  4. Xi, X.; Jiang, D.; Wu, Y.; He, L.; Song, H.; Lv, Z. Empirical analysis and modeling of the activity dilemmas in big social networks. IEEE Access 2016, 5, 967–974. [Google Scholar]
  5. Wei, S.; Salim, F.D.; Song, A.; Bouguettaya, A. Clustering big spatiotemporal-interval data. IEEE Trans. Big Data 2016, 2, 190–203. [Google Scholar]
  6. Berberidis, D.; Kekatos, V.; Giannakis, G.B. Online censoring for large-scale regressions with application to streaming big data. IEEE Trans. Signal Process. 2015, 64, 3854–3867. [Google Scholar] [CrossRef] [PubMed]
  7. Rahmani, M.; Atia, G.K. Randomized robust subspace recovery and outlier detection for high dimensional data matrices. IEEE Trans. Signal Process. 2016, 65, 1580–1594. [Google Scholar] [CrossRef]
  8. Shi, W.; Zhu, Y.; Philip, S.Y.; Huang, T.; Wang, C.; Mao, Y.; Chen, Y. Temporal dynamic matrix factorization for missing data prediction in large scale coevolving time series. IEEE Access 2016, 4, 6719–6732. [Google Scholar] [CrossRef]
  9. Godfrey, P.; Gryz, J.; Lasek, P. Interactive visualization of large data sets. IEEE Trans. Knowl. Data Eng. 2016, 28, 2142–2157. [Google Scholar] [CrossRef]
  10. Hideyuki, S.; Shirahata, K.; Drozd, A.; Sato, H.; Matsuoka, S. GPU-accelerated large-scale distributed sorting coping with device memory capacity. IEEE Trans. Big Data 2016, 2, 57–69. [Google Scholar]
  11. Huan, K.; Li, P.; Guo, S.; Guo, M. On traffic-aware partition and aggregation in map reduce for big data applications. IEEE Trans. Parallel Distrib. Syst. 2016, 27, 818–828. [Google Scholar]
  12. Wasi-ur-Rahman, M.D.; Islam, N.; Lu, X.; Panda, D. A comprehensive study of MapReduce over lustre for intermediate data placement and shuffle strategies on HPC clusters. IEEE Trans. Parallel Distrib. Syst. 2016, 28, 633–646. [Google Scholar] [CrossRef]
  13. Fegaras, L. Incremental query processing on big data streams. IEEE Trans. Knowl. Data Eng. 2016, 28, 2998–3012. [Google Scholar] [CrossRef]
  14. Xia, D.; Li, H.; Wang, B.; Li, Y.; Zhang, Z. A map reduce-based nearest neighbor approach for big-data-driven traffic flow prediction. IEEE Access 2016, 4, 2920–2934. [Google Scholar] [CrossRef]
  15. Andriy, M.; Hamou-Lhadj, A.; Cialini, E.; Larsson, A. Operational-log analysis for big data systems: challenges and solutions. IEEE Softw. 2016, 33, 52–59. [Google Scholar]
  16. Jun, Z.; Zhuang, E.; Fu, J.; Baranowski, J.; Ford, A.; Shen, J. A framework-based approach to utility big data analytics. IEEE Trans. Power Syst. 2016, 31, 2455–2462. [Google Scholar]
  17. Ge, S.; Rochas, J.; El Beze, L.; Huet, F.; Magoules, F. K nearest neighbour joins for big data on MapReduce: A theoretical and experimental analysis. IEEE Trans. Knowl. Data Eng. 2016, 28, 2376–2392. [Google Scholar]
  18. Hao, W.; Chen, H.; Du, Z.; Hu, F. BeTL: MapReduce checkpoint tactics beneath the task level. IEEE Trans. Serv. Comput. 2015, 9, 84–95. [Google Scholar]
  19. Gao, K.; Zhu, Y. Deep data stream analysis model and algorithm with memory mechanism. IEEE Access 2016, 5, 84–93. [Google Scholar] [CrossRef]
  20. Iwendi, C.; Zhang, Z.; Du, X. ACO based key management routing mechanism for WSN security and data collection. In Proceedings of the 2018 IEEE International Conference on Industrial Technology (ICIT), Lyon, France, 19–22 February 2018; pp. 1935–1939. [Google Scholar] [CrossRef]
  21. Kutia, S.; Chauhdary, S.H.; Iwendi, C.; Liu, L.; Yong, W.; Bashir, A.K. Socio-technological factors affecting user’s adoption of ehealth functionalities: A case study of China and Ukraine eHealth Systems. IEEE Access 2019, 7, 90777–90788. [Google Scholar] [CrossRef]
  22. Lo’ai, A.; Rashid Mehmood, T.; Benkhlifa, E.; Song, H. Mobile cloud computing model and big data analysis for healthcare applications. IEEE Access 2016, 4, 6171–6180. [Google Scholar]
  23. Ranjan, R. Streaming big data processing in datacenter clouds. IEEE Cloud Comput. 2014, 1, 78–83. [Google Scholar] [CrossRef]
  24. Adrian, B.; She, Y.; Ding, L.; Gramajo, G. Feature selection with annealing for computer vision and big data learning. IEEE Trans. Pattern Anal. Mach. Intell. 2017, 39, 272–286. [Google Scholar]
  25. Xia, X.G. Small data, mid data, and big data versus algebra, analysis, and topology. IEEE Signal Process. Mag. 2017, 34, 48–51, perspectives. [Google Scholar] [CrossRef]
  26. Zhang, Y.; Ren, J.; Liu, J.; Xu, C.; Guo, H.; Liu, Y. A survey on emerging computing paradigms for big data. Chin. J. Electron. 2017, 26, 1–12. [Google Scholar] [CrossRef]
  27. Rysavy, S.J.; Bromley, D.; Daggett, V. DIVE: A graph-based visual-analytics framework for big data. IEEE Comput. Graph. Appl. 2014, 34, 26–37. [Google Scholar] [CrossRef] [PubMed]
  28. Wei, T.; Blake, M.B.; Saleh, I.; Dustdar, S. Social-network-sourced big data analytics. IEEE Internet Comput. 2013, 17, 62–69. [Google Scholar]
  29. Zhang, X.; Yang, L.T.; Liu, C.; Chen, J. A scalable two-phase top-down specialization approach for data anonymization using mapreduce on cloud. IEEE Trans. Parallel Distrib. Syst. 2014, 25, 363–373. [Google Scholar] [CrossRef]
  30. Peng, S.; Wang, G.; Xie, D. Social influence analysis in social networking big data: Opportunities and challenges. IEEE Netw. 2016, 31, 11–17. [Google Scholar] [CrossRef]
  31. Qiao, Y.; Cheng, Y.; Yang, J.; Liu, J.; Kato, N. A mobility analytical framework for big mobile data in densely populated area. IEEE Trans. Veh. Technol. 2016, 66, 1443–1455. [Google Scholar] [CrossRef]
  32. Sakr, S. Big data processing stacks. IT Prof. 2017, 19, 34–41. [Google Scholar] [CrossRef]
  33. Lena, M.; Movahed Nejad, M.; Grosu, D.; Zhang, Q.; Shi, W. Energy-aware scheduling of mapreduce jobs for big data applications. IEEE Trans. Parallel Distrib. Syst. 2015, 26, 2720–2733. [Google Scholar]
  34. Leskovec, J.; Kleinberg, J.; Faloutsos, C. Graphs over time: Densification laws, shrinking diameters and possible explanations. In Proceedings of the ACM SIGKDD International Conference on Knowledge Discovery and Data Mining (KDD), Chicago, IL, USA, 21–24 August 2005. [Google Scholar]
  35. Hall, B.H.; Jaffe, A.B.; Trajtenberg, M. The NBER Patent Citation Data File: Lessons, Insights and Methodological Tools; NBER Working Paper 8498; NBER: Cambridge, MA, USA, 2001. [Google Scholar]
  36. Depeng, D.; Liu, Y.; Zhang, X.; Huang, S. A crowdsourcing worker quality evaluation algorithm on MapReduce for big data applications. IEEE Trans. Parallel Distrib. Syst. 2016, 27, 1879–1888. [Google Scholar]
  37. Srinivasan, K.; Chang, C.-Y.; Huang, C.-H.; Chang, M.-H.; Sharma, A.; Ankur, A. An efficient implementation of mobile raspberry Pi hadoop clusters for robust and augmented computing performance. J. Inf. Process. Syst. 2018, 14, 989–1009. [Google Scholar]
  38. Hua, K.; Dai, B.; Srinivasan, K.; Hsu, Y.-H.; Sharma, V. A hybrid NSCT domain image watermarking scheme. J. Image Video Process. 2017, 2017, 10. [Google Scholar] [CrossRef]
  39. Chang, C.Y.; Chang, C.W.; Kathiravan, S.; Lin, C.; Chen, S.T. DAG-SVM based infant cry classification system using sequential forward floating feature selection. Multidimens. Syst. Signal Process. 2017, 28, 961–976. [Google Scholar] [CrossRef]
Figure 1. The workflow of the Louvain Method.
Electronics 08 01331 g001
Figure 2. Clustering and analyzing accuracy comparison.
Electronics 08 01331 g002
Figure 3. Clustering and analyzing quality comparison.
Electronics 08 01331 g003
Figure 4. Clustering and analyzing execution time comparison.
Electronics 08 01331 g004
Table 1. Word detection and mapping various data community group.
Data Set Community GroupTotal Number of Documents To Be Analyzed per minutesTotal Number of Documents To Be Identified per minutesWord Occurrence RatioApproximate Time Interval per Analysis (Duration of Processing)Word Detection RatioApproximate Time Interval per Analysis (Duration of Detection)Approximation of Final Result
(Duration of Processing)≈(Duration of Detection)
Total Comments Per File
CG11866700.95881785754000
CG 23400750.9841.2857710,000
CG 3260700.94861.496952000
CG 4335690.91821497881000
CG 5593750.77701.598935000
CG 6146640.749016.290851000
CG 7354700.679526.275701000
CG 8546551901.8570705000
CG 9937601851.190869000
CG 10714890.85851896891000
CG 11235780.76751.788872000
CG 12312650.7702.773682000
CG 13549700.75804.493852000
CG 14455650.86513.540354000
CG 15335700.889012.972652000
CG 16615550.66751.286802000
CG 173610600.74601.4969010,000
CG 18356770.697515.172702000
CG 19712800.8953.642351000
CG 20482730.82871685754000
CG 213321730.88831.4897910,000
CG 22255670.92851.398983000
CG 23315670.98013.596861000
CG 24875750.608502.790808000
Total21,578167219.5381925189.852002186192,000
Table 2. Community group classification (Reuters-21578).
Data Set Community GroupTotal Comments per FileTotal Number of Documents To Be Analyzed Per MinutesTotal Number of Documents To Be Identified Per MinutesWords Occurrence RatioApproximate Time Interval Per Analysis (Duration of Processing)Approximate Time Interval Per Analysis (Duration of Detection)Word Detection RatioApproximation of Final Result
CG 71000354800.760957526.270
CG 1010007141940.76085961889
CG140001866700.95188851775
CG 61000146640.581909016.285
CG 204000482730.82587851675
CG 182000356770.767757215.170
CG 41000335690.77082971488
CG 144000455650.829654013.535
CG 231000315670.762809613.586
CG 152000335700.768907212.965
CG 132000549700.84880934.485
CG 191000712800.86995423.635
CG 122000312650.76470732.768
CG 248000875750.89650902.780
CG 85000546440.88590701.8570
CG 1120002351250.58675881.787
CG 55000593750.85270981.593
CG 32000260700.71586961.495
CG 1710,00036101190.96260961.490
CG 2110,0003321730.97183891.479
CG 223000255670.71785981.398
CG 210,0003400120.98984851.277
CG 162000615550.88275861.280
CG 99000937850.89385901.186
Total92,00021,5781672
Table 3. Sample dataset (20NG) with community data group.
URL.Time Deltan_tokens_titlen_tokens_contentabs_title_subjectivityabs_title_sentiment_polarityShares
http://mashable.com/2013/01/07/amazon-instant-video-browser/7311221900593
http://mashable.com/2013/01/07/ap-samsung-sponsored-tweets/731925510711
http://mashable.com/2013/01/07/apple-40-billion-app-downloads/7319211101500
http://mashable.com/2014/12/27/son-pays-off-mortgage/810442001900
http://mashable.com/2014/12/27/ukraine-blasts/86682101100
Table 4. Occurrence and detection rate for each dataset mapping.
ProcedureCriterionDatasetAccessUpdateSchema StructureIntegritySpeed
OccurrenceData Size20 NewsgroupsConstant dataDepends on versionStatic schemaHighMB/Sec
Citation networkPartial Streaming data depends on databaseDynamic schemaLowGB/sec
LinkedIn Social networkStreaming dataDepends on user inputDynamic schemaHighGB/sec
Mobile phone networksAd-hoc datadepends on databaseDynamic schemaLowGB/sec
Reuters-21578Constant dataDepends on versionStatic schemaHighMB/Sec
Twitter social networkStreaming dataDepends on user inputDynamic schemaLowGB/sec
DetectionMapping20 Newsgroups43.3MB(.srt)StandardYes-Fast
Citation network250 GBFixedNo-Moderate
LinkedIn Social network≈1 TBStreamingNo-Slow down
Mobile phone
networks
≈500 GBFixed- StreamingNo-Moderate
Reuters-2157826.6(.sgm)StandardYes-Fast
Twitter social network≈1 TBStreamingNo-Slow down
Table 5. Various citation-network version of 20 NG.
Various Citation-Network VersionTotal Number of PapersCitation Relationship
Citation-network V1, V2, DBLP-Citation-network V3, V4, V5, V6, V7, V8, and ACM-Citation-network V816,725,56333,069,449
Table 6. Clustering and analyzing accuracy of different source format of input.
MethodsDistributed CentralizedStreaming
K Means757038
K-Means + PSO817642
Proposed Method938989
Table 7. Clustering and analyzing comparison.
DatasetK MeansPSOK-Means + PSOHybrid K-Means + PSOProposed Method
20 Newsgroups7476798187
Citation network6877818589
LinkedIn Social network6569758089
Mobile phone networks7076899394
Reuters-215786670727984
Twitter social network7276798488

